Embed Size (px)
Citation preview
1
Assessment of Crude by Rail (CBR) Safety Issues in Commonwealth of Pennsylvania
Final Report Prepared for
Commonwealth of Pennsylvania
Prepared by Dr. Allan M Zarembski PE, FASME, Hon. Mbr. AREMA
Research Professor Director of the Railroad Engineering and Safety Program
Department of Civil and Environmental Engineering University of Delaware
Newark DE
August 13, 2015

2
Contents Executive Summary ........................................................................................................................ 4
Recommendations ....................................................................................................................... 5
Primary Recommendations ..................................................................................................... 5
Secondary Recommendations ................................................................................................. 7
Overview ......................................................................................................................................... 9
Derailment Risk ............................................................................................................................ 13
Accident and Derailment Data .................................................................................................. 13
Derailment Risk Reduction Options ......................................................................................... 36
Rail Defects/Failure .............................................................................................................. 36
Track Geometry Defects ....................................................................................................... 39
Wheel Failure ........................................................................................................................ 43
Axle and Bearing Failure ...................................................................................................... 47
Frog and Switch Defects ....................................................................................................... 48
Train Handling ...................................................................................................................... 49
Speed ..................................................................................................................................... 50
Truck (Bogie) Condition ....................................................................................................... 51
Bridges .................................................................................................................................. 52
Yards and Sidings ................................................................................................................. 52
Tank Car Breach ........................................................................................................................... 54
Speed Effect .............................................................................................................................. 58
ECP Brakes ............................................................................................................................... 60
Tank Car Thermal Jackets ........................................................................................................ 62
Volatility ....................................................................................................................................... 63
Routing .......................................................................................................................................... 65
State Regulatory Oversight ........................................................................................................... 67
Emergency Management .............................................................................................................. 72
Recent Improvements in Practice ................................................................................................. 74
Recommendations ......................................................................................................................... 77
Primary Recommendations ....................................................................................................... 77
Railroad ................................................................................................................................. 77
Commonwealth of Pennsylvania .......................................................................................... 78
Secondary Recommendations ................................................................................................... 79
Railroad ................................................................................................................................. 79

3
Commonwealth of Pennsylvania .......................................................................................... 79
References ..................................................................................................................................... 81
Glossary ........................................................................................................................................ 83

4
Executive Summary As the volume of Crude By Rail (CBR) shipments have increased over the past several years, the Commonwealth of Pennsylvania has become increasingly concerned about the risks of a CBR incident occurring on a rail line that goes through populated areas within the state. This is particularly important for the Commonwealth since large volumes of CBR are shipped through the state by two major Class 1 railroads, Norfolk Southern (NS) and CSX Transportation (CSX). While the recent actions taken by the railroad industry and the Department of Transportation have been of great value, there is still concern about the level of risk present on these rail lines. Because of the concern about the level of risk present on these rail lines, the Commonwealth of Pennsylvania asked the University of Delaware to look at the current level of risk and advise as to how to reduce the risk of a CBR incident in the Commonwealth. This report presents the results of this assessment. This assessment addresses three major areas of CBR safety in the Commonwealth:
• Derailment Risk • Tank Car Breach/Rupture Risk • Regulatory Oversight
This assessment also addresses the effect of proposed new Department of Transportation and industry standards for tank car design and train operations and operating systems to include speed reduction, use of Electronically Controlled Pneumatic (ECP) Brakes and Positive Train Control (PTC). For a catastrophic CBR event to take place, several elements are necessary:
• First a derailment must occur, usually unrelated to the CBR equipment itself • Second a breach or rupture of the tank car shell must occur and a release of the crude take
place. • Third, conditions must be present and the volatility of the commodity must be such as to
ignite or explode after the rupture of the tank car. In the area of Derailment Risk, this assessment looked at the distribution of derailments by major categories (Track, Operations/Human Factors, Equipment, Signals, etc.) and subcategories (e.g. broken rail, wide gauge, etc.) both in the state of Pennsylvania and Nationwide. For those derailment categories that are high risk, i.e. with a significant number of annual occurrences or significant potential for occurrence of major tank car failure, the University of Delaware team identified opportunities for improvement in inspection and/or maintenance practices, based on state of the art industry practice as well as specific practices of railroads operating CBR trains in the State of Pennsylvania. In the area of Tank Car Breach/Rupture Risk, the assessment examined the proposed improvements to the tank car such as:
• Improved head shields • Increased tank shell thickness/external jacket • Valve Protection (top and bottom valves) • Reduction in train speed
5
In the area of Regulatory Oversight, the assessment reviewed the current safety oversight capabilities and resources of the Pennsylvania Public Utilities Commission as well as those of other neighboring states and identified opportunities for improvement of safety and Emergence Response. The report noted that the U.S. Department of Transportation, Federal Railroad Administration (FRA) has primary responsibility for rail safety and inspection under a 1970 federal law which preempted rail safety regulation.
Recommendations A total of 27 recommendations are presented in this report; divided into primary (18) and secondary (9) categories. Primary categories are those expected to have direct safety results and which can be implemented by the railroads directly working with the Commonwealth of Pennsylvania or by the Commonwealth itself. Secondary categories include activities which are more difficult to implement or which may require action by a party other than the railroad or Commonwealth of Pennsylvania.
Primary Recommendations Railroad
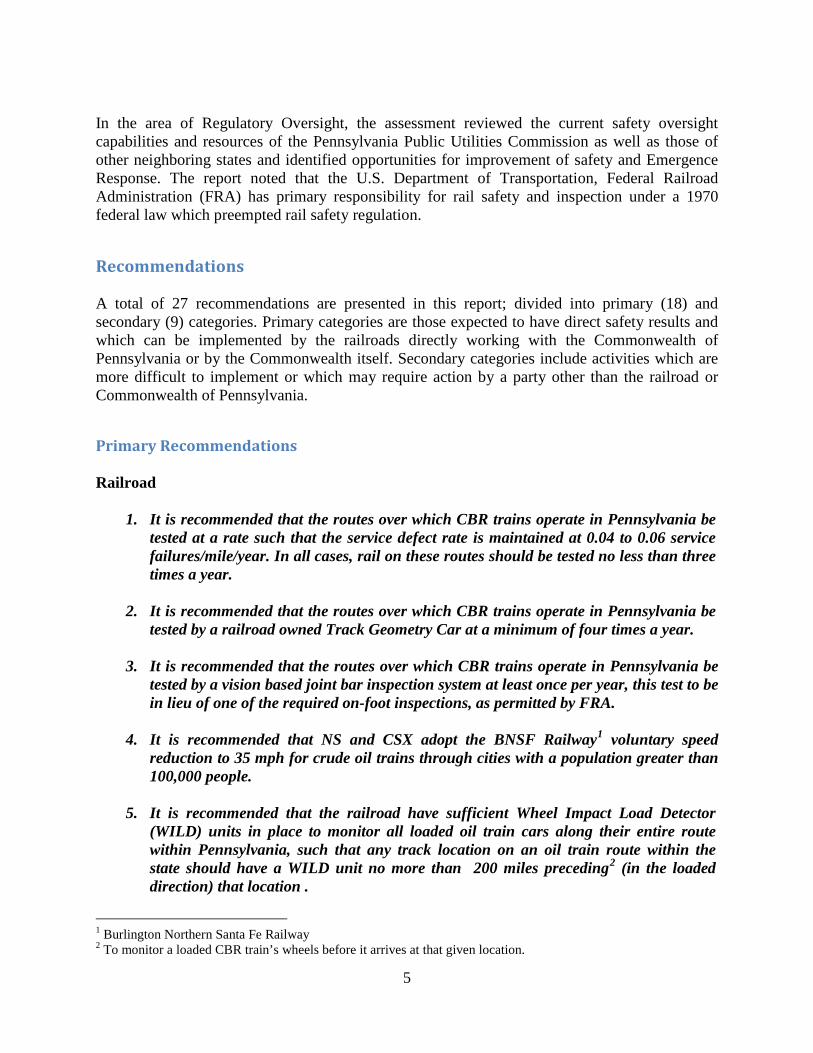
1. It is recommended that the routes over which CBR trains operate in Pennsylvania be tested at a rate such that the service defect rate is maintained at 0.04 to 0.06 service failures/mile/year. In all cases, rail on these routes should be tested no less than three times a year.
2. It is recommended that the routes over which CBR trains operate in Pennsylvania be
tested by a railroad owned Track Geometry Car at a minimum of four times a year.
3. It is recommended that the routes over which CBR trains operate in Pennsylvania be tested by a vision based joint bar inspection system at least once per year, this test to be in lieu of one of the required on-foot inspections, as permitted by FRA.
4. It is recommended that NS and CSX adopt the BNSF Railway1 voluntary speed
reduction to 35 mph for crude oil trains through cities with a population greater than 100,000 people.
5. It is recommended that the railroad have sufficient Wheel Impact Load Detector
(WILD) units in place to monitor all loaded oil train cars along their entire route within Pennsylvania, such that any track location on an oil train route within the state should have a WILD unit no more than 200 miles preceding2 (in the loaded direction) that location .
1 Burlington Northern Santa Fe Railway 2 To monitor a loaded CBR train’s wheels before it arrives at that given location.
6
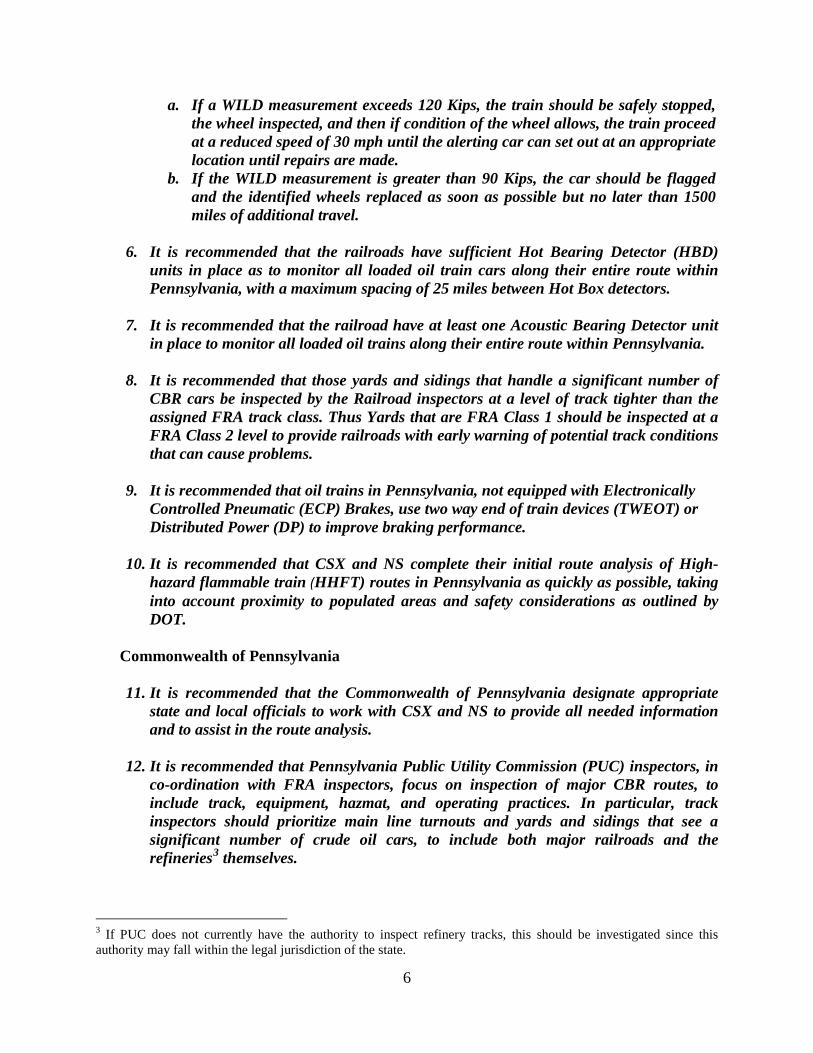
a. If a WILD measurement exceeds 120 Kips, the train should be safely stopped, the wheel inspected, and then if condition of the wheel allows, the train proceed at a reduced speed of 30 mph until the alerting car can set out at an appropriate location until repairs are made.
b. If the WILD measurement is greater than 90 Kips, the car should be flagged and the identified wheels replaced as soon as possible but no later than 1500 miles of additional travel.
6. It is recommended that the railroads have sufficient Hot Bearing Detector (HBD)
units in place as to monitor all loaded oil train cars along their entire route within Pennsylvania, with a maximum spacing of 25 miles between Hot Box detectors.
7. It is recommended that the railroad have at least one Acoustic Bearing Detector unit
in place to monitor all loaded oil trains along their entire route within Pennsylvania.
8. It is recommended that those yards and sidings that handle a significant number of CBR cars be inspected by the Railroad inspectors at a level of track tighter than the assigned FRA track class. Thus Yards that are FRA Class 1 should be inspected at a FRA Class 2 level to provide railroads with early warning of potential track conditions that can cause problems.
9. It is recommended that oil trains in Pennsylvania, not equipped with Electronically
Controlled Pneumatic (ECP) Brakes, use two way end of train devices (TWEOT) or Distributed Power (DP) to improve braking performance.
10. It is recommended that CSX and NS complete their initial route analysis of High-
hazard flammable train (HHFT) routes in Pennsylvania as quickly as possible, taking into account proximity to populated areas and safety considerations as outlined by DOT.
Commonwealth of Pennsylvania
11. It is recommended that the Commonwealth of Pennsylvania designate appropriate
state and local officials to work with CSX and NS to provide all needed information and to assist in the route analysis.
12. It is recommended that Pennsylvania Public Utility Commission (PUC) inspectors, in
co-ordination with FRA inspectors, focus on inspection of major CBR routes, to include track, equipment, hazmat, and operating practices. In particular, track inspectors should prioritize main line turnouts and yards and sidings that see a significant number of crude oil cars, to include both major railroads and the refineries3 themselves.
3 If PUC does not currently have the authority to inspect refinery tracks, this should be investigated since this authority may fall within the legal jurisdiction of the state.
7
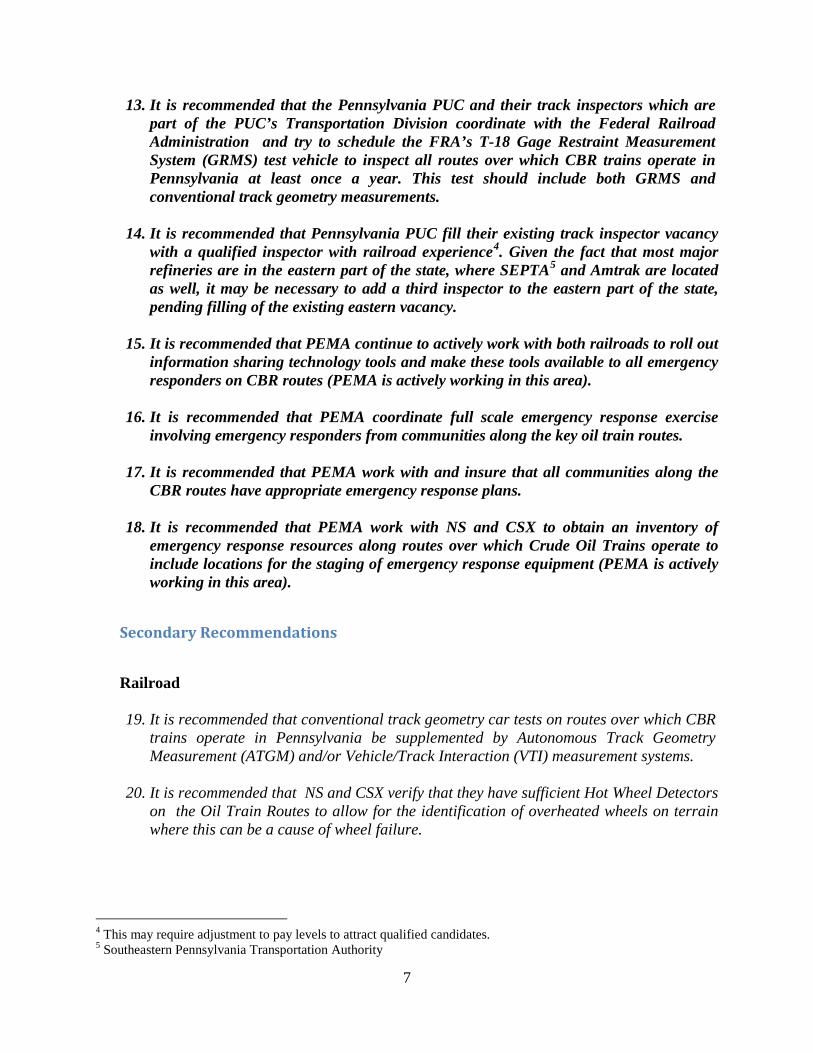
13. It is recommended that the Pennsylvania PUC and their track inspectors which are part of the PUC’s Transportation Division coordinate with the Federal Railroad Administration and try to schedule the FRA’s T-18 Gage Restraint Measurement System (GRMS) test vehicle to inspect all routes over which CBR trains operate in Pennsylvania at least once a year. This test should include both GRMS and conventional track geometry measurements.
14. It is recommended that Pennsylvania PUC fill their existing track inspector vacancy
with a qualified inspector with railroad experience4. Given the fact that most major refineries are in the eastern part of the state, where SEPTA5 and Amtrak are located as well, it may be necessary to add a third inspector to the eastern part of the state, pending filling of the existing eastern vacancy.
15. It is recommended that PEMA continue to actively work with both railroads to roll out
information sharing technology tools and make these tools available to all emergency responders on CBR routes (PEMA is actively working in this area).
16. It is recommended that PEMA coordinate full scale emergency response exercise
involving emergency responders from communities along the key oil train routes.
17. It is recommended that PEMA work with and insure that all communities along the CBR routes have appropriate emergency response plans.
18. It is recommended that PEMA work with NS and CSX to obtain an inventory of
emergency response resources along routes over which Crude Oil Trains operate to include locations for the staging of emergency response equipment (PEMA is actively working in this area).
Secondary Recommendations
Railroad
19. It is recommended that conventional track geometry car tests on routes over which CBR
trains operate in Pennsylvania be supplemented by Autonomous Track Geometry Measurement (ATGM) and/or Vehicle/Track Interaction (VTI) measurement systems.
20. It is recommended that NS and CSX verify that they have sufficient Hot Wheel Detectors on the Oil Train Routes to allow for the identification of overheated wheels on terrain where this can be a cause of wheel failure.
4 This may require adjustment to pay levels to attract qualified candidates. 5 Southeastern Pennsylvania Transportation Authority
8
21. It is recommended that the railroad have at least one Truck Defect Detector or equivalent6 in place to monitor all loaded oil train cars along their entire route within Pennsylvania.
Commonwealth of Pennsylvania
22. It is recommended that the Commonwealth of Pennsylvania encourage both NS and CSX to implement Positive Train Control (PTC) on Oil Train routes in the Commonwealth as expeditiously as possible, in accordance with government mandated schedules.
23. It is recommended that State of Pennsylvania Track inspectors focus attention on the
condition of turnouts on major CBR routes in the state.
24. It is recommended that Pennsylvania state inspectors include yards and sidings that handle a significant number of CBR cars as part of their inspection program. All such inspections to be coordinated with the FRA inspection program.
25. It is recommended that the Commonwealth of Pennsylvania lend its support to a set of
national Minimum Characteristic Standards for all Crude by Rail (CBR) with defined target characteristics.
26. It is recommended that Pennsylvania PUC coordinate with FRA and NS and CSX
Bridge Departments to insure that the railroads are maintaining a Bridge Safety Management Program in accordance with 49 CFR7 237.
27. It is recommended that the Commonwealth of Pennsylvania lend its support to
increasing the tank car thermal protection standard to 800 minutes for a pool fire.
6 Such as a lateral Load measurement system 7 Code of Federal Regulations (CFR)

9
Overview
As the volume of Crude by Rail shipments have increased over the past several years, the Commonwealth of Pennsylvania has become increasingly concerned about the risks of a CBR incident occurring on a rail line that goes through populated areas within the state. This is particularly important for the Commonwealth since large volumes of CBR are shipped through the state by two major Class 1 railroads, Norfolk Southern and CSX. While the recent actions taken by the railroad industry and the Department of Transportation have been of great value, there is still concern about the level of risk present on these rail lines. Figure 1 illustrates the rapid growth of CBR shipments in the United States.
(Source: US Energy Information Administration) As can be seen in Figure 2, a large proportion of the CBR movements are from the Bakken fields of North Dakota to refineries in Southeastern Pennsylvania, with routing through the Commonwealth of Pennsylvania. Thus for example, Norfolk Southern moves approximately 14 to 25 trains a week across Pennsylvania8, with its primary route through the southern portion of the Commonwealth as shown in Figures 3A and 3B. CSX9 also moves a significant number of CBR trains into the Philadelphia area, primarily through New Jersey.
8 Testimony of Rudy Husband, Resident Vice President Norfolk Southern to the Joint Hearing of the Pennsylvania Senate Transportation and Environmental Resources and Energy Committees on June 9, 2015. 9 CSX has indicated in their letter of June 19, 2015 that they maintain 304 miles of mainline track in Pennsylvania defined as Hazardous Material Routes.

10
Figure 2: CBR Movements in 2014 (Source: US Energy Information Administration)
Figure 3A: Overview map of route from Bakken oil fields to Pennsylvania area on both CSX and NS
11
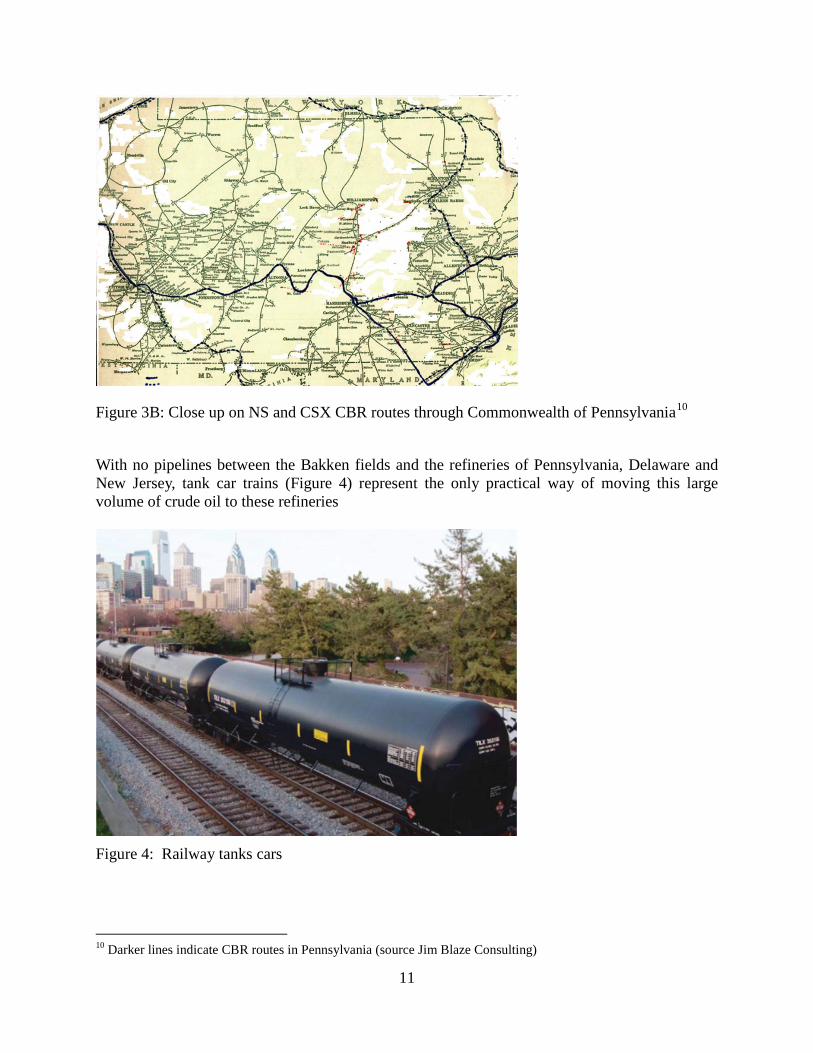
Figure 3B: Close up on NS and CSX CBR routes through Commonwealth of Pennsylvania10
With no pipelines between the Bakken fields and the refineries of Pennsylvania, Delaware and New Jersey, tank car trains (Figure 4) represent the only practical way of moving this large volume of crude oil to these refineries
Figure 4: Railway tanks cars
10 Darker lines indicate CBR routes in Pennsylvania (source Jim Blaze Consulting)

12
This movement usually occurs in trains which the US Department of Transportation categorizes as either a High-hazard flammable train (HHFT) referring to a single train transporting 20 or more loaded tank cars of a Class 3 flammable liquid in a continuous block or a single train carrying 35 or more loaded tank cars of a Class 3 flammable liquid throughout the train consist or a High-hazard flammable unit train (HHFUT) referring to a single train transporting 70 or more loaded tank cars containing Class 3 flammable liquid. It should also be noted that the Federal Railroad Administration defines a hazardous material route in the new 213.237 rule (March 2014) as a track over which a minimum of 10,000 carloads or intermodal portable tank car loads of hazardous materials as defined in 49CFR 171.8 travel over a period of one calendar year or track over which 4,000 carloads or intermodal portable tank car loads of the hazardous materials specified in 49CFR 172.820 travel, in a period of one calendar year.

13
Derailment Risk As noted above, this assessment looked at the distribution of train accidents11 and derailments by major categories (Track, Operations/Human Factors, Equipment, Signals, etc.) and subcategories (e.g. broken rail, wide gauge, etc.) both in the state of Pennsylvania and Nationwide. This included the distribution of derailments by major and subcategories separately for the two major CBR carriers in the State, NS and CSX. This data was taken from the U. S. Department of Transportation, Federal Railroad Administration (FRA) track safety data base12 which includes detailed information about accidents13 and derailments both nationwide and in the Commonwealth of Pennsylvania. It is important to note that the number of derailments within Pennsylvania and particularly the number of main line derailments, such as where a major CBR incident could occur, is very small. This is due to the fact that Pennsylvania has approximately 5,15014 miles of freight route miles ( 8800 track miles) which represents approximately 3.7% of the US total of 138,500 freight route miles (approximately 200,000 track miles)15. Thus, in order to properly assess risk, the distribution of accidents and derailments, both within Pennsylvania and nationwide, was assessed in order to better identify categories of high risk of an accident or derailment (and associated approaches to reduce that risk). Accident and Derailment Data The FRA’s track safety data base, divides all accidents and derailments into five major categories:
• Equipment (E) • Human Factors (H) • Track (T) • Signal (S) • Miscellaneous (M)
Table 1A presents 10 years (2005-2014) of accident data, by major category, for the US and Table 1B presents the same 10 years of data for the Commonwealth of Pennsylvania. Note, the 2014 US data set represents 1,755 accidents, of which 1,241 incidents were derailments, 145 incidents were collisions, and 369 were “other” non-grade crossing accidents. The 2014 Pennsylvania data set represents 87 accidents or 4.9%16 of the US national total. Figure 5 compares the two data sets on a percentage distribution basis.
11 To include train collisions and derailments. Grade crossing accidents are not included in these statistics. 12 www.dot.fra.gov 13 All railroads are required to report, in writing, accidents or derailments above a specified threshold of damage which for 2015 is approximately $10,000 in combined track and equipment damage. This information is then entered into the FRA safety data base. 14 Association of American Railroads (AAR) website https://www.aar.org/data-center/railroads-states 15 Based on traffic density Pennsylvania represents between 3 and 4% of total US traffic ( source AAR website) 16 For main track derailments Pennsylvania represents 3.9% of US national total (see Tables 2A and 2B).

14
Table 1A: 10 year Distribution of Accidents and Derailments in US by Major Category
Table 1B: 10 year Distribution of Accidents and Derailments in Pennsylvania by Major Category
Figure 5: 10 Year Average Distribution of Accidents/Derailments by Major Category (US and PA)
Year2014 225 12.82% 678 38.63% 295 16.81% 511 29.12% 46 2.62%2013 229 12.57% 690 37.87% 284 15.59% 565 31.01% 54 2.96%2012 208 11.82% 661 37.56% 255 14.49% 588 33.41% 48 2.73%2011 237 11.72% 746 36.89% 314 15.53% 692 34.22% 33 1.63%2010 250 13.14% 650 34.17% 261 13.72% 674 35.44% 67 3.52%2009 268 14.02% 656 34.31% 265 13.86% 671 35.09% 52 2.72%2008 321 12.94% 910 36.68% 340 13.70% 858 34.58% 52 2.10%2007 326 12.11% 1047 38.88% 339 12.59% 932 34.61% 49 1.82%2006 351 11.71% 1068 35.62% 454 15.14% 1075 35.86% 50 1.67%2005 369 11.30% 1270 38.89% 481 14.73% 1082 33.13% 64 1.96%
Total 2784 12.31% 8376 37.04% 3288 14.54% 7648 33.82% 515 2.28%
USAEquipments Human Miscellaneous Track Signal
Year2014 6 6.90% 39 44.83% 16 18.39% 25 28.74% 1 1.15%2013 11 17.46% 18 28.57% 15 23.81% 16 25.40% 3 4.76%2012 5 9.26% 21 38.89% 8 14.81% 18 33.33% 2 3.70%2011 9 15.79% 22 38.60% 9 15.79% 17 29.82% 0 0.00%2010 15 21.74% 18 26.09% 15 21.74% 19 27.54% 2 2.90%2009 22 27.85% 24 30.38% 7 8.86% 24 30.38% 2 2.53%2008 13 17.33% 23 30.67% 8 10.67% 31 41.33% 0 0.00%2007 12 14.46% 24 28.92% 11 13.25% 31 37.35% 5 6.02%2006 11 10.78% 28 27.45% 18 17.65% 43 42.16% 2 1.96%2005 9 8.33% 30 27.78% 22 20.37% 44 40.74% 3 2.78%
Total 113 14.54% 247 31.79% 129 16.60% 268 34.49% 20 2.57%
PennsylvaniaEquipments Human Miscellaneous Track Signal
15
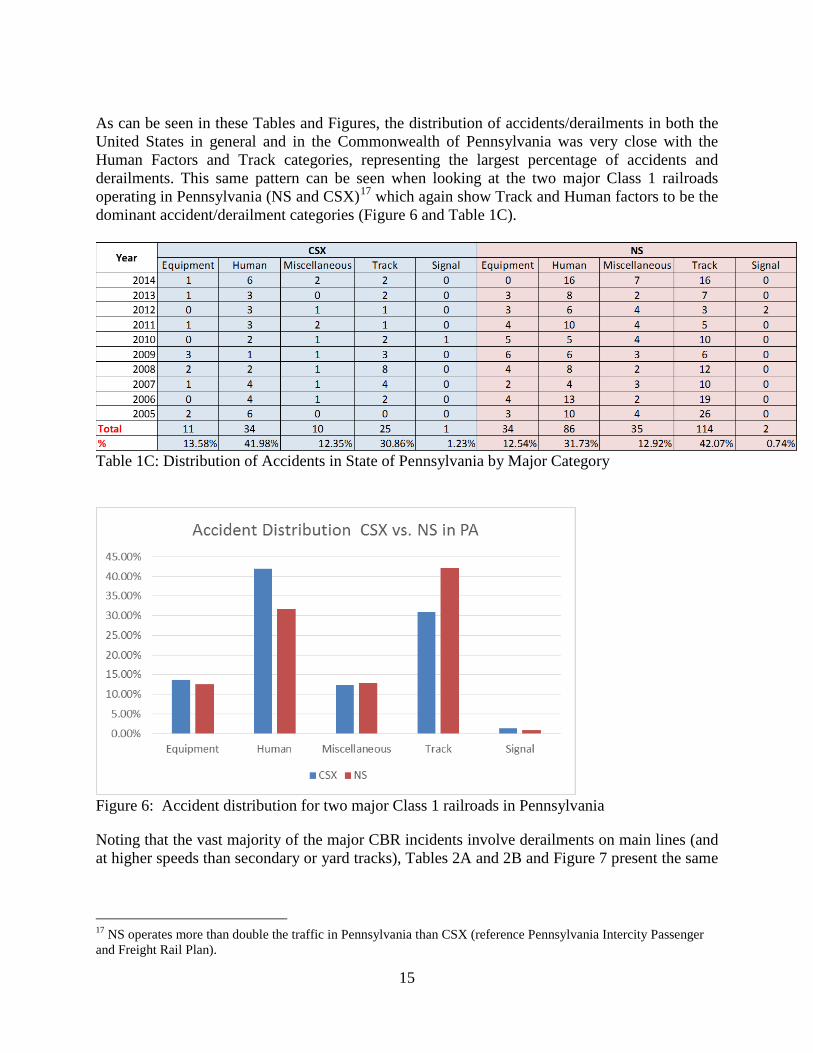
As can be seen in these Tables and Figures, the distribution of accidents/derailments in both the United States in general and in the Commonwealth of Pennsylvania was very close with the Human Factors and Track categories, representing the largest percentage of accidents and derailments. This same pattern can be seen when looking at the two major Class 1 railroads operating in Pennsylvania (NS and CSX)17 which again show Track and Human factors to be the dominant accident/derailment categories (Figure 6 and Table 1C).
Table 1C: Distribution of Accidents in State of Pennsylvania by Major Category
Figure 6: Accident distribution for two major Class 1 railroads in Pennsylvania
Noting that the vast majority of the major CBR incidents involve derailments on main lines (and at higher speeds than secondary or yard tracks), Tables 2A and 2B and Figure 7 present the same
17 NS operates more than double the traffic in Pennsylvania than CSX (reference Pennsylvania Intercity Passenger and Freight Rail Plan).
16
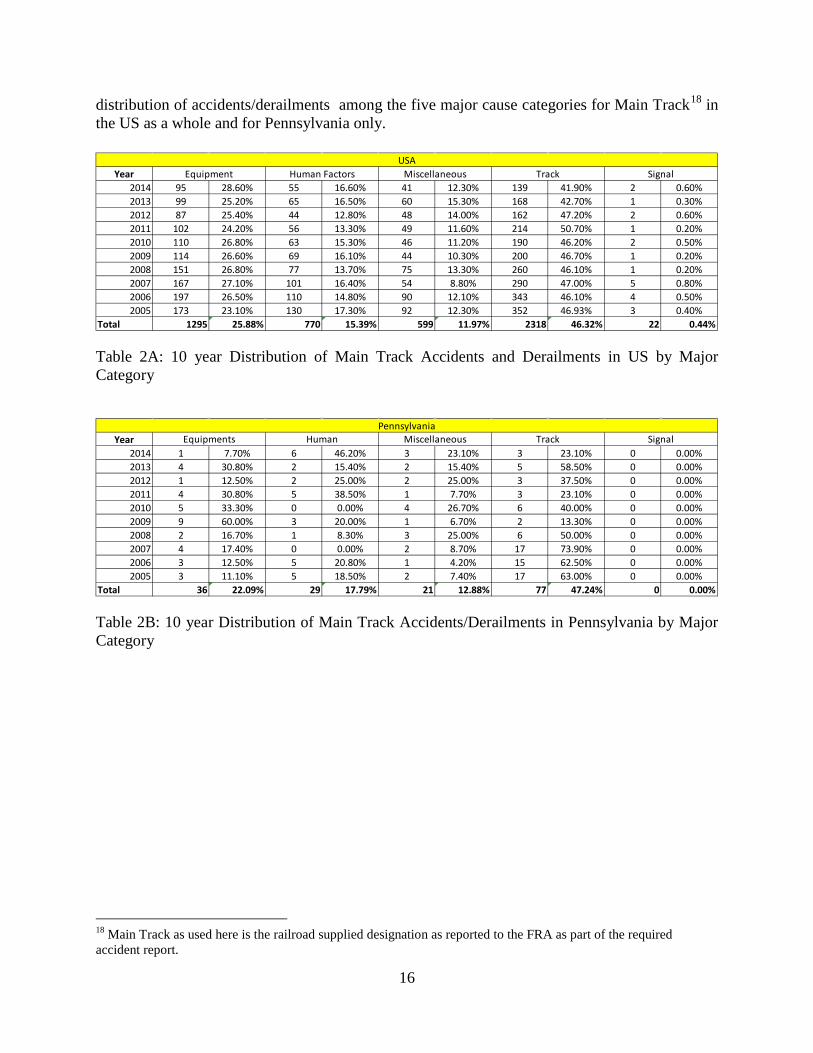
distribution of accidents/derailments among the five major cause categories for Main Track18 in the US as a whole and for Pennsylvania only.
Table 2A: 10 year Distribution of Main Track Accidents and Derailments in US by Major Category
Table 2B: 10 year Distribution of Main Track Accidents/Derailments in Pennsylvania by Major Category
18 Main Track as used here is the railroad supplied designation as reported to the FRA as part of the required accident report.
Year2014 95 28.60% 55 16.60% 41 12.30% 139 41.90% 2 0.60%2013 99 25.20% 65 16.50% 60 15.30% 168 42.70% 1 0.30%2012 87 25.40% 44 12.80% 48 14.00% 162 47.20% 2 0.60%2011 102 24.20% 56 13.30% 49 11.60% 214 50.70% 1 0.20%2010 110 26.80% 63 15.30% 46 11.20% 190 46.20% 2 0.50%2009 114 26.60% 69 16.10% 44 10.30% 200 46.70% 1 0.20%2008 151 26.80% 77 13.70% 75 13.30% 260 46.10% 1 0.20%2007 167 27.10% 101 16.40% 54 8.80% 290 47.00% 5 0.80%2006 197 26.50% 110 14.80% 90 12.10% 343 46.10% 4 0.50%2005 173 23.10% 130 17.30% 92 12.30% 352 46.93% 3 0.40%
Total 1295 25.88% 770 15.39% 599 11.97% 2318 46.32% 22 0.44%
USAEquipment Human Factors Miscellaneous Track Signal
Year2014 1 7.70% 6 46.20% 3 23.10% 3 23.10% 0 0.00%2013 4 30.80% 2 15.40% 2 15.40% 5 58.50% 0 0.00%2012 1 12.50% 2 25.00% 2 25.00% 3 37.50% 0 0.00%2011 4 30.80% 5 38.50% 1 7.70% 3 23.10% 0 0.00%2010 5 33.30% 0 0.00% 4 26.70% 6 40.00% 0 0.00%2009 9 60.00% 3 20.00% 1 6.70% 2 13.30% 0 0.00%2008 2 16.70% 1 8.30% 3 25.00% 6 50.00% 0 0.00%2007 4 17.40% 0 0.00% 2 8.70% 17 73.90% 0 0.00%2006 3 12.50% 5 20.80% 1 4.20% 15 62.50% 0 0.00%2005 3 11.10% 5 18.50% 2 7.40% 17 63.00% 0 0.00%
Total 36 22.09% 29 17.79% 21 12.88% 77 47.24% 0 0.00%
PennsylvaniaEquipments Human Miscellaneous Track Signal
17
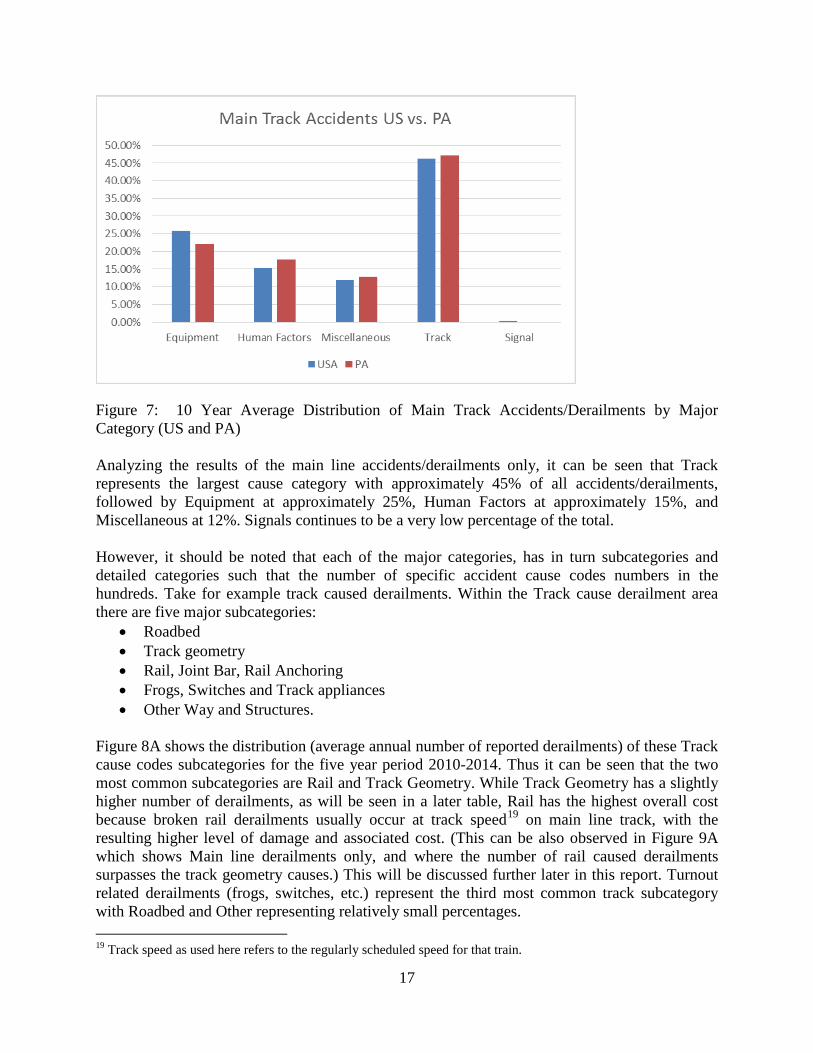
Figure 7: 10 Year Average Distribution of Main Track Accidents/Derailments by Major Category (US and PA) Analyzing the results of the main line accidents/derailments only, it can be seen that Track represents the largest cause category with approximately 45% of all accidents/derailments, followed by Equipment at approximately 25%, Human Factors at approximately 15%, and Miscellaneous at 12%. Signals continues to be a very low percentage of the total. However, it should be noted that each of the major categories, has in turn subcategories and detailed categories such that the number of specific accident cause codes numbers in the hundreds. Take for example track caused derailments. Within the Track cause derailment area there are five major subcategories:
• Roadbed • Track geometry • Rail, Joint Bar, Rail Anchoring • Frogs, Switches and Track appliances • Other Way and Structures.
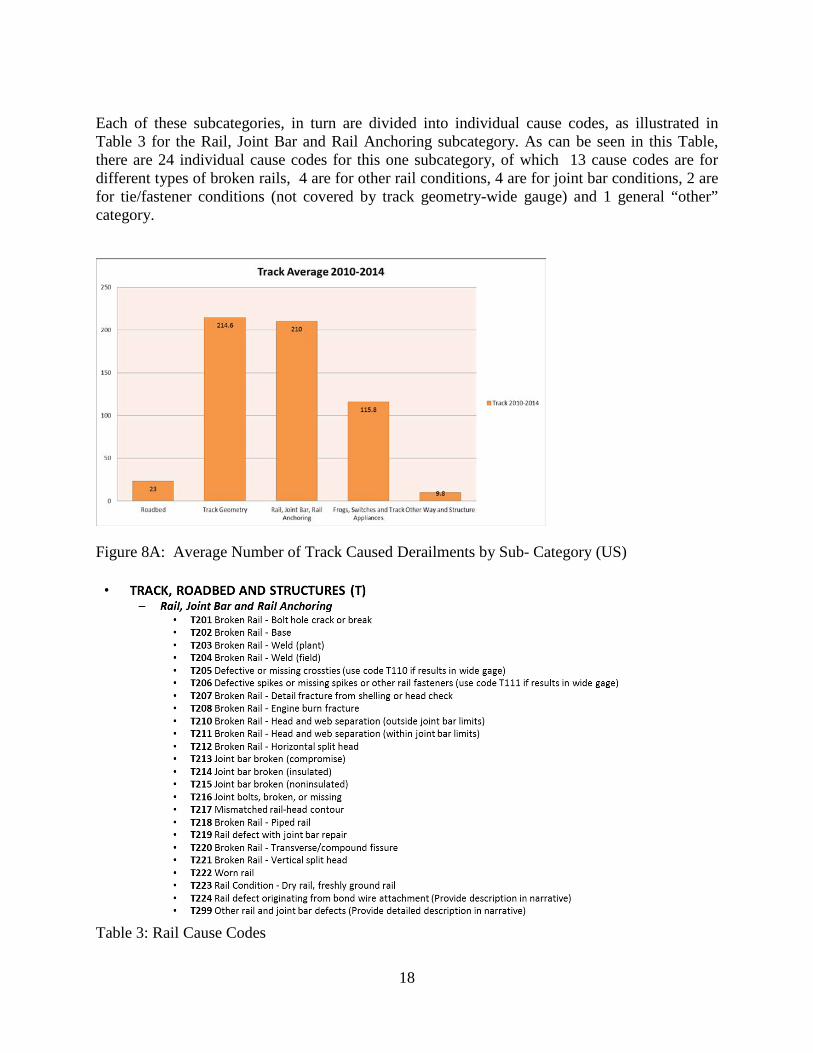
Figure 8A shows the distribution (average annual number of reported derailments) of these Track cause codes subcategories for the five year period 2010-2014. Thus it can be seen that the two most common subcategories are Rail and Track Geometry. While Track Geometry has a slightly higher number of derailments, as will be seen in a later table, Rail has the highest overall cost because broken rail derailments usually occur at track speed19 on main line track, with the resulting higher level of damage and associated cost. (This can be also observed in Figure 9A which shows Main line derailments only, and where the number of rail caused derailments surpasses the track geometry causes.) This will be discussed further later in this report. Turnout related derailments (frogs, switches, etc.) represent the third most common track subcategory with Roadbed and Other representing relatively small percentages. 19 Track speed as used here refers to the regularly scheduled speed for that train.
18
Each of these subcategories, in turn are divided into individual cause codes, as illustrated in Table 3 for the Rail, Joint Bar and Rail Anchoring subcategory. As can be seen in this Table, there are 24 individual cause codes for this one subcategory, of which 13 cause codes are for different types of broken rails, 4 are for other rail conditions, 4 are for joint bar conditions, 2 are for tie/fastener conditions (not covered by track geometry-wide gauge) and 1 general “other” category.
Figure 8A: Average Number of Track Caused Derailments by Sub- Category (US)
Table 3: Rail Cause Codes
19
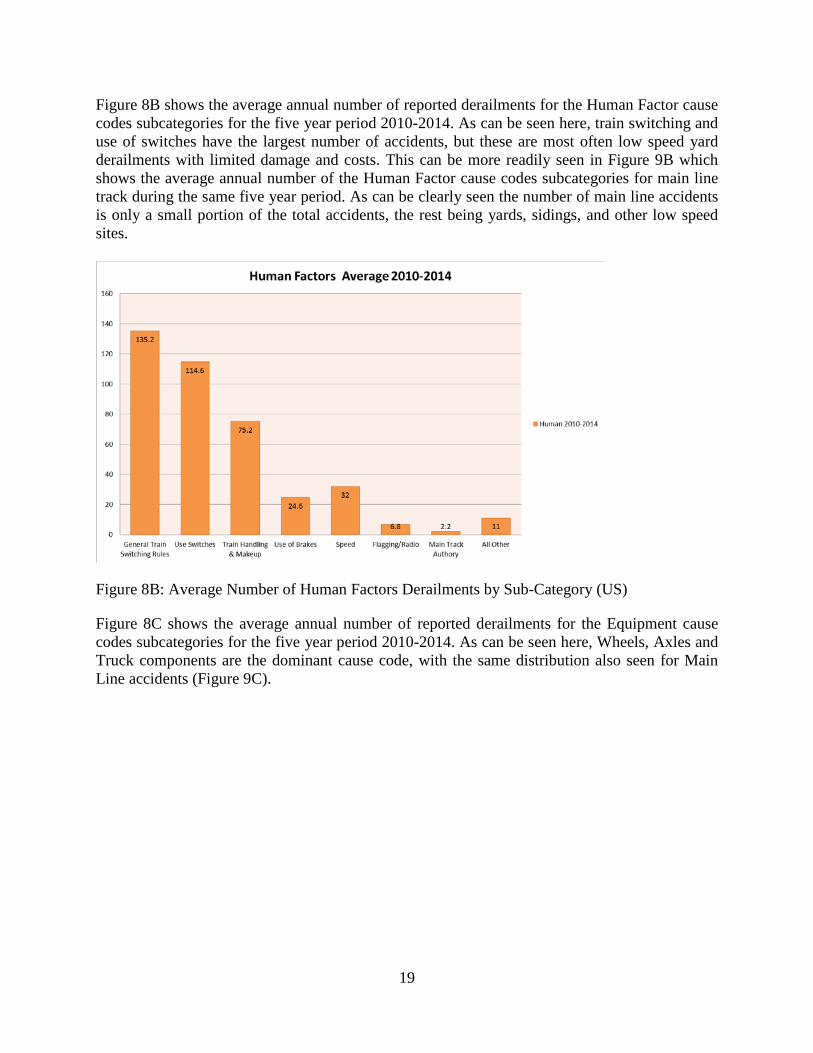
Figure 8B shows the average annual number of reported derailments for the Human Factor cause codes subcategories for the five year period 2010-2014. As can be seen here, train switching and use of switches have the largest number of accidents, but these are most often low speed yard derailments with limited damage and costs. This can be more readily seen in Figure 9B which shows the average annual number of the Human Factor cause codes subcategories for main line track during the same five year period. As can be clearly seen the number of main line accidents is only a small portion of the total accidents, the rest being yards, sidings, and other low speed sites.
Figure 8B: Average Number of Human Factors Derailments by Sub-Category (US)
Figure 8C shows the average annual number of reported derailments for the Equipment cause codes subcategories for the five year period 2010-2014. As can be seen here, Wheels, Axles and Truck components are the dominant cause code, with the same distribution also seen for Main Line accidents (Figure 9C).

20
Figure 8C. Average Number of Equipment Caused Derailments by Sub- Category-(US)
Figure 9A: Average Number of Track Caused Derailments by Sub- Category –US Mainline
14.2
69.2 72.6
15.2 3.4
Roadbed Track Geometry Rail, Joint Bar,Rail Anchoring
Frogs, Switchesand Track
Appliances
Other Way andStructure
Track 5 Years Average - Main Line Track 5 Years Average - Main Line

21
Figure 9B: Average Number of Human Factor Caused Derailments by Sub- Category –US Mainline
Figure 9C: Average Number of Equipment Caused Derailments by Sub- Category –US Mainline
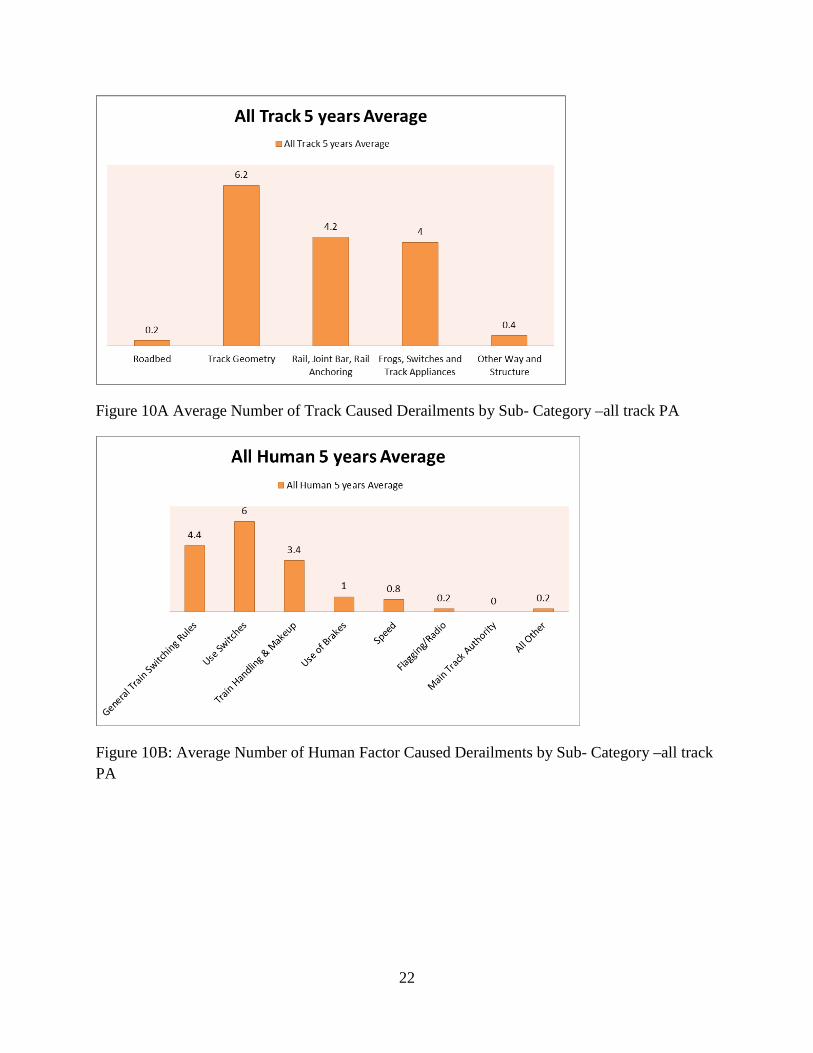
Looking at the distribution of accidents/derailments within the Commonwealth of Pennsylvania for All Track (Figures 10A, 10B and 10C) and Main Track Only (Figures 11A, 11B and 11C), and noting the relatively small numbers, it can be seen that here again the Pennsylvania data follows the general US data distribution. For Track caused derailments, all track, it should be noted that Turnout related derailments are approximately the same level as Rail, but for the Main Tracks, it again falls to third place. For Human Factor and Equipment accidents on Main Tracks, the relatively small numbers make it difficult to pick out clear trends; however, this will be discussed further later when looking at the major derailments in Pennsylvania.
5.4
11
23
4.2 4.8 2.6 1.2
4.4
Human Factor 5 Years Average - Main Line Human 5 Years Average - Main Line
27 15.4
29.6
7.2 9.6 5.6 2.2 1 1
Equipments 5 Years Average - Main Line
Equipments 5 Years Average - Main Line
22
Figure 10A Average Number of Track Caused Derailments by Sub- Category –all track PA
Figure 10B: Average Number of Human Factor Caused Derailments by Sub- Category –all track PA

23
Figure 10C: Average Number of Equipment Caused Derailments by Sub- Category –all track PA
Figure 11A: Average Number of Track Caused Derailments by Sub- Category –Main Line PA

24
Figure 11B: Average Number of Human Factors Derailments by Sub-Category- Main Line PA
Figure 11C: Average Number of Equipment Caused Derailments by Sub- Category- Main Line PA

25
As noted earlier, the number of accidents/derailments may not always be the best indicator of the severity of a cause category since some causes most often occur on main track when the train is traveling at track speed, while others most often occur in yards and sidings where both the speed and the severity of the accident is low. Thus, it is often worthwhile to look at the severity of the accident as measured by the railroad reported cost, which is specifically the cost of the damage to track and equipment (rolling stock) only. These reported costs do not include damage to lading, cost of train delay or rerouting, cost of environmental clean-up, etc. Studies by the Association of American Railroads suggest that the actual cost of a derailment is approximately double the reported cost. However, in the case of Hazmat or CBR related derailments, this cost multiplier can be many times higher. Table 4 presents a listing of the top derailment cause subcategories, by total cost20, number of derailments, and cost per derailment for the five years between 2010 and 2014. Table 5 presents the same summary list for Pennsylvania.
Table 4: Major Accident/Derailment Categories by Cost and Number (US) 2010-2014
20 FRA reported costs only.
Rail defects/failure $ 288,094,362.00 1,060 $ 271,787.13 212
Track geometry defects $ 173,480,951.00 1,081 $ 160,481.92 216.2
Wheel failure $ 78,269,174.00 223 $ 350,982.84 44.6Axle and Bearing Failure $ 59,885,825.00 144 $ 415,873.78 28.8
Frogs, Switches, Track Appliances $ 50,179,776.00 601 $ 83,493.80 120.2
Train Handling and Makeup $ 38,537,362.00 421 $ 91,537.68 84.2
General Switching Rules and Switching Operations
$ 62,804,707.00 1,306 $ 48,089.36 261.2
Improper Use of Switch $ 40,793,543.00 671 $ 60,795.15 134.2
Road Bed Effects $ 45,320,728.00 123 $ 368,461.20 24.6
Speed $ 47,238,739.00 327 $ 144,460.98 65.4
Derailments/year Total Cost Number of Derailments Cost/derailment
26
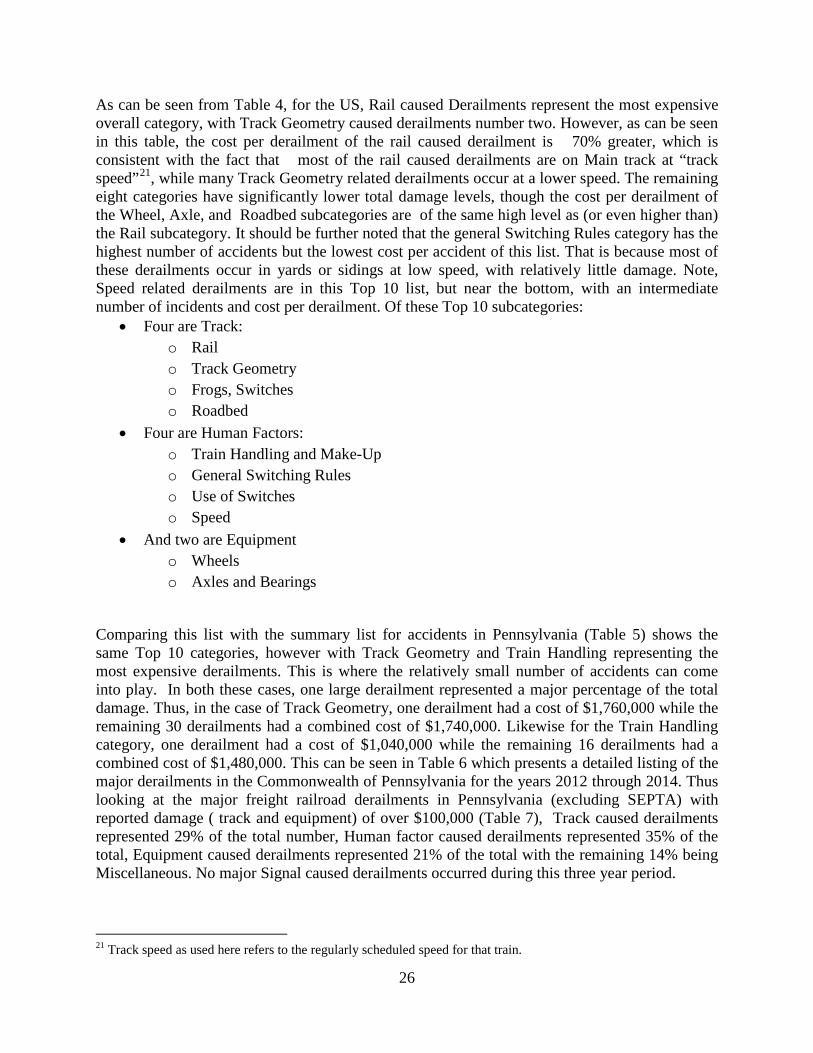
As can be seen from Table 4, for the US, Rail caused Derailments represent the most expensive overall category, with Track Geometry caused derailments number two. However, as can be seen in this table, the cost per derailment of the rail caused derailment is 70% greater, which is consistent with the fact that most of the rail caused derailments are on Main track at “track speed”21, while many Track Geometry related derailments occur at a lower speed. The remaining eight categories have significantly lower total damage levels, though the cost per derailment of the Wheel, Axle, and Roadbed subcategories are of the same high level as (or even higher than) the Rail subcategory. It should be further noted that the general Switching Rules category has the highest number of accidents but the lowest cost per accident of this list. That is because most of these derailments occur in yards or sidings at low speed, with relatively little damage. Note, Speed related derailments are in this Top 10 list, but near the bottom, with an intermediate number of incidents and cost per derailment. Of these Top 10 subcategories:
• Four are Track: o Rail o Track Geometry o Frogs, Switches o Roadbed
• Four are Human Factors: o Train Handling and Make-Up o General Switching Rules o Use of Switches o Speed
• And two are Equipment o Wheels o Axles and Bearings
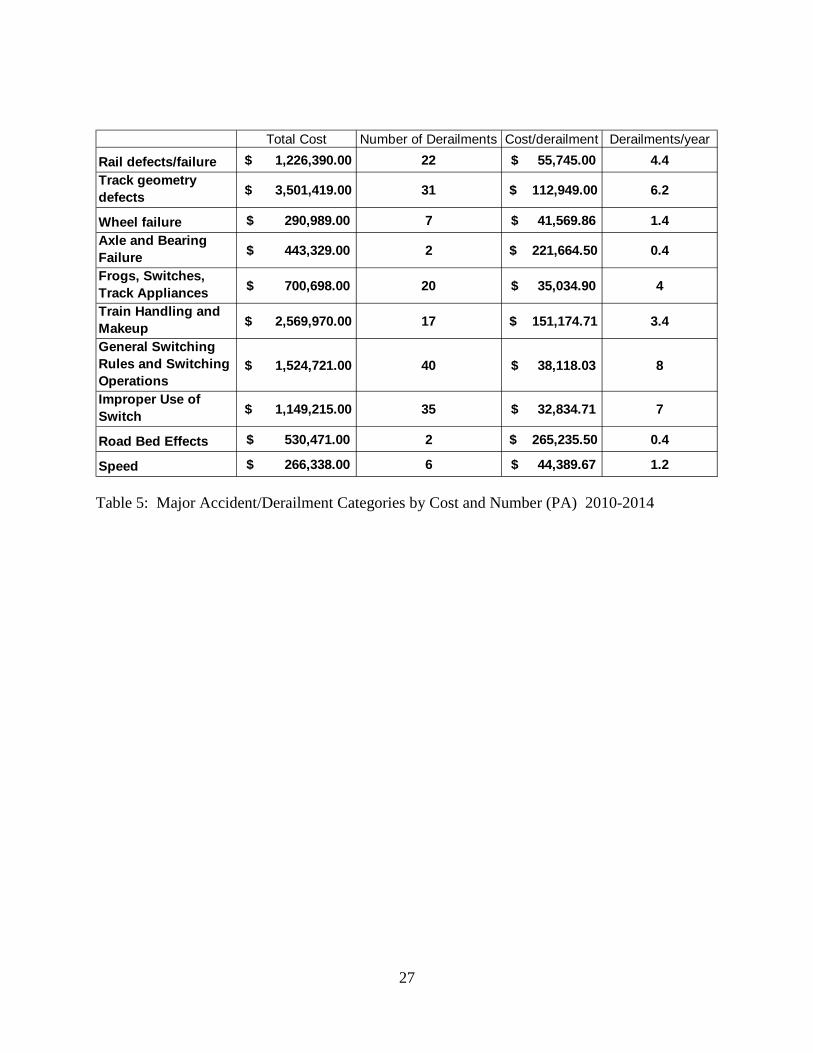
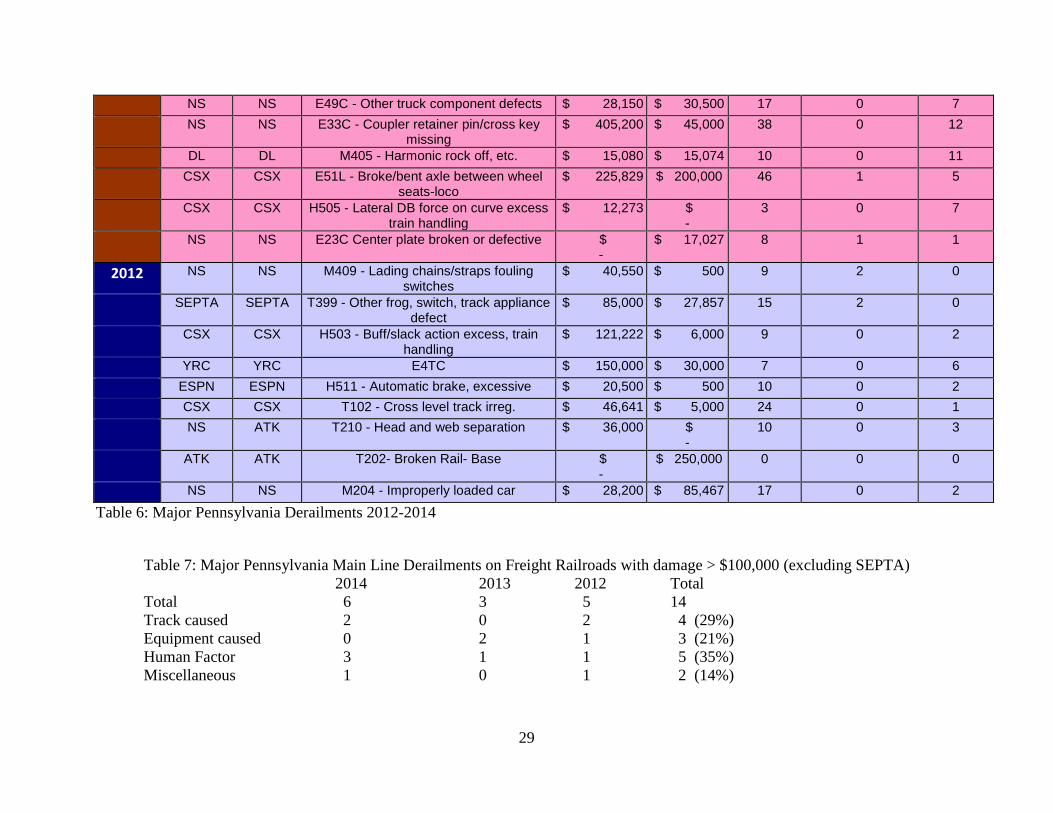
Comparing this list with the summary list for accidents in Pennsylvania (Table 5) shows the same Top 10 categories, however with Track Geometry and Train Handling representing the most expensive derailments. This is where the relatively small number of accidents can come into play. In both these cases, one large derailment represented a major percentage of the total damage. Thus, in the case of Track Geometry, one derailment had a cost of $1,760,000 while the remaining 30 derailments had a combined cost of $1,740,000. Likewise for the Train Handling category, one derailment had a cost of $1,040,000 while the remaining 16 derailments had a combined cost of $1,480,000. This can be seen in Table 6 which presents a detailed listing of the major derailments in the Commonwealth of Pennsylvania for the years 2012 through 2014. Thus looking at the major freight railroad derailments in Pennsylvania (excluding SEPTA) with reported damage ( track and equipment) of over $100,000 (Table 7), Track caused derailments represented 29% of the total number, Human factor caused derailments represented 35% of the total, Equipment caused derailments represented 21% of the total with the remaining 14% being Miscellaneous. No major Signal caused derailments occurred during this three year period. 21 Track speed as used here refers to the regularly scheduled speed for that train.
27
Table 5: Major Accident/Derailment Categories by Cost and Number (PA) 2010-2014
Total Cost Number of Derailments Cost/derailment Derailments/year
Rail defects/failure $ 1,226,390.00 22 $ 55,745.00 4.4Track geometry defects $ 3,501,419.00 31 $ 112,949.00 6.2
Wheel failure $ 290,989.00 7 $ 41,569.86 1.4Axle and Bearing Failure $ 443,329.00 2 $ 221,664.50 0.4
Frogs, Switches, Track Appliances $ 700,698.00 20 $ 35,034.90 4
Train Handling and Makeup $ 2,569,970.00 17 $ 151,174.71 3.4
General Switching Rules and Switching Operations
$ 1,524,721.00 40 $ 38,118.03 8
Improper Use of Switch $ 1,149,215.00 35 $ 32,834.71 7
Road Bed Effects $ 530,471.00 2 $ 265,235.50 0.4
Speed $ 266,338.00 6 $ 44,389.67 1.2

28
Pennsylvania Main Line Derailments 2012-2014
RR Company
Track Maint
Cause Equip. Damage
Track Damage
Speed (mph)
Locomotives derailed
Cars Derailed
2014 CSX CSX H993 - Human factors - track $ 124,855 $ 49,000 6 0 7
NS NS T111 - Wide gauge (spikes/other rail fasteners)
$ 1,760,384 $ 270,000 31 0 21
SEPA SEPA H025 - Fail to control car speed using hand brake-railroad employee
$ 37,781 $ 8,500 2 1 0
NS NS T207 - Detail fracture - shelling/head check
$ 205,965 $ 15,000 16 2 6
CSX CSX M202 - Load fell from car $ 78,867 $ 5,000 10 0 12
NS NS H519 - Dynamic brake, too rapid adjustment
$ 74,400 $ 150,000 23 0 31
CSX CSX E24C - Center plate disengaged from truck
$ 8,517 $ 2,500 9 0 5
NS NS M599 - Other miscellaneous causes $ 58,000 $ 131,000 29 0 12
DL DL M502 - Vandalism of on-track equipment $ 80,000 $ 14,369 40 0 1
NS NS H506 - Lateral DB force on curve excess, make-up
$ 7,650 $ 5,585 11 0 1
CSX CSX T220 - Transverse/compound fissure $ 10,821 $ 100 15 0 4
NS NS H503 - Buff/slack action excess, train handling
$ 1,041,350 $ 505,616 25 0 17
NS NS H503 - Buff/slack action excess, train handling
$ 56,000 $ 12,140 4 0 18
2013 CRSH CRSH T110 - Wide gauge (defective/missing crossties)
$ 11,296 $ 800 3 0 3
WNYP WNYP T110 - Wide gauge (defective/missing crossties)
$ 14,600 $ 31,000 24 0 5
NS NS T002 - Washout/rain/slide/etc. $ 6,385 $ 24,086 26 1 0
NS NS H607 - Failure to comply with restricted speed
$ 66,804 $ 90,390 7 1 0
NS NS M204 - Improperly loaded car $ 3,300 $ 19,811 20 0 1
URR URR T105 - Insufficient ballast section $ 3,500 $ 30,000 9 0 1
AVR AVR T110 - Wide gauge (defective/missing crossties)
$ 800 $ 75,000 5 0 4
29
NS NS E49C - Other truck component defects $ 28,150 $ 30,500 17 0 7
NS NS E33C - Coupler retainer pin/cross key missing
$ 405,200 $ 45,000 38 0 12
DL DL M405 - Harmonic rock off, etc. $ 15,080 $ 15,074 10 0 11
CSX CSX E51L - Broke/bent axle between wheel seats-loco
$ 225,829 $ 200,000 46 1 5
CSX CSX H505 - Lateral DB force on curve excess train handling
$ 12,273 $ -
3 0 7
NS NS E23C Center plate broken or defective $ -
$ 17,027 8 1 1
2012 NS NS M409 - Lading chains/straps fouling switches
$ 40,550 $ 500 9 2 0
SEPTA SEPTA T399 - Other frog, switch, track appliance defect
$ 85,000 $ 27,857 15 2 0
CSX CSX H503 - Buff/slack action excess, train handling
$ 121,222 $ 6,000 9 0 2
YRC YRC E4TC $ 150,000 $ 30,000 7 0 6
ESPN ESPN H511 - Automatic brake, excessive $ 20,500 $ 500 10 0 2
CSX CSX T102 - Cross level track irreg. $ 46,641 $ 5,000 24 0 1
NS ATK T210 - Head and web separation $ 36,000 $ -
10 0 3
ATK ATK T202- Broken Rail- Base $ -
$ 250,000 0 0 0
NS NS M204 - Improperly loaded car $ 28,200 $ 85,467 17 0 2
Table 6: Major Pennsylvania Derailments 2012-2014
Table 7: Major Pennsylvania Main Line Derailments on Freight Railroads with damage > $100,000 (excluding SEPTA) 2014 2013 2012 Total Total 6 3 5 14
Track caused 2 0 2 4 (29%) Equipment caused 0 2 1 3 (21%) Human Factor 3 1 1 5 (35%) Miscellaneous 1 0 1 2 (14%)
30
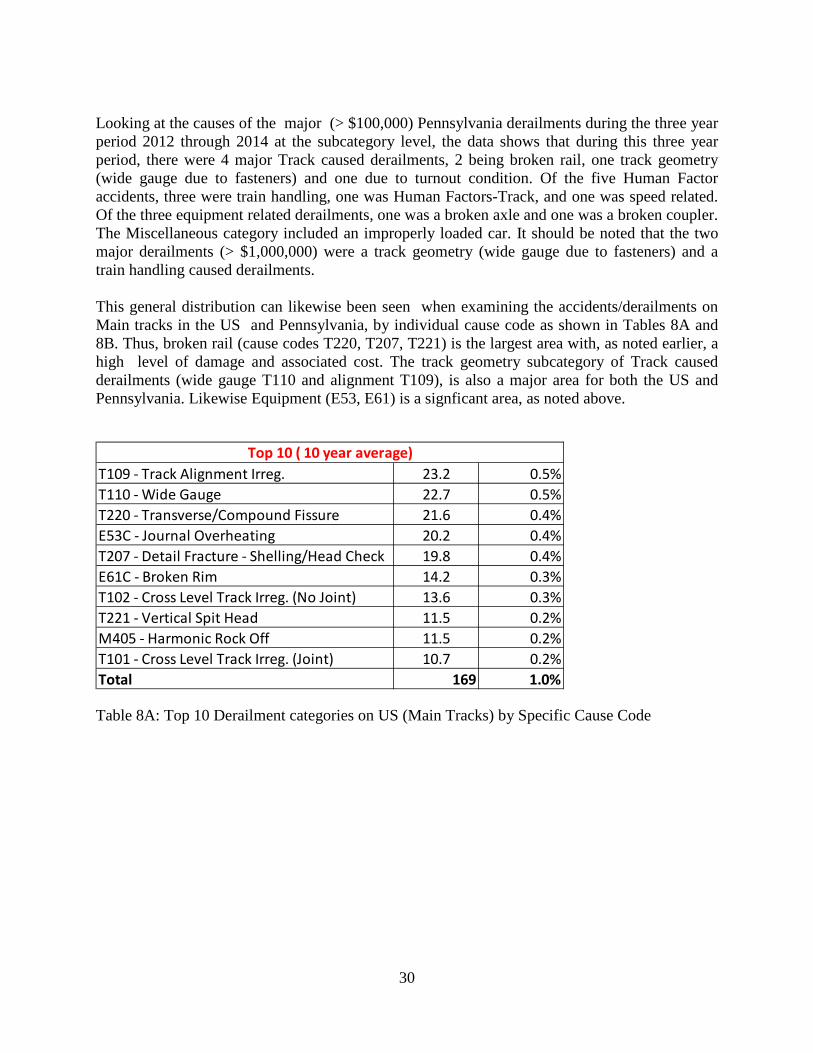
Looking at the causes of the major (> $100,000) Pennsylvania derailments during the three year period 2012 through 2014 at the subcategory level, the data shows that during this three year period, there were 4 major Track caused derailments, 2 being broken rail, one track geometry (wide gauge due to fasteners) and one due to turnout condition. Of the five Human Factor accidents, three were train handling, one was Human Factors-Track, and one was speed related. Of the three equipment related derailments, one was a broken axle and one was a broken coupler. The Miscellaneous category included an improperly loaded car. It should be noted that the two major derailments (> $1,000,000) were a track geometry (wide gauge due to fasteners) and a train handling caused derailments. This general distribution can likewise been seen when examining the accidents/derailments on Main tracks in the US and Pennsylvania, by individual cause code as shown in Tables 8A and 8B. Thus, broken rail (cause codes T220, T207, T221) is the largest area with, as noted earlier, a high level of damage and associated cost. The track geometry subcategory of Track caused derailments (wide gauge T110 and alignment T109), is also a major area for both the US and Pennsylvania. Likewise Equipment (E53, E61) is a signficant area, as noted above.
Table 8A: Top 10 Derailment categories on US (Main Tracks) by Specific Cause Code
T109 - Track Alignment Irreg. 23.2 0.5%T110 - Wide Gauge 22.7 0.5%T220 - Transverse/Compound Fissure 21.6 0.4%E53C - Journal Overheating 20.2 0.4%T207 - Detail Fracture - Shelling/Head Check 19.8 0.4%E61C - Broken Rim 14.2 0.3%T102 - Cross Level Track Irreg. (No Joint) 13.6 0.3%T221 - Vertical Spit Head 11.5 0.2%M405 - Harmonic Rock Off 11.5 0.2%T101 - Cross Level Track Irreg. (Joint) 10.7 0.2%Total 169 1.0%
Top 10 ( 10 year average)

31
Table 8B: Top 10 Derailment categories in Pennsylvania (Main Track) by Specific Cause Code
Finally, noting the focus of this study is on potential for CBR derailments, Table 9 presents a list of major CBR derailments in the US during the period 2013-2015 and Table 10 presents a list of major Canadian CBR derailments. It should be noted that the causes shown here for the US derailments are those reported by the railroad to the Federal Railroad Administration as posted on the FRA safety data base. The causes shown here for the Canadian derailments were those defined by the Transportation Safety Board of Canada. Those under investigation are so noted.
T110 - Wide Gauge 2 1.2%T220 - Transverse/Compound Fissure 1.1 0.7%T221 - Vertical Spit Head 0.9 0.6%T102 - Cross Level Track Irreg. (Joint) 0.5 0.3%E53C - Journal Overheating 0.5 0.3%E61C - Broken Rim 0.4 0.3%M204- Imporperly Loaded Car 0.4 0.3%T101 - Cross Level Track Irreg. (No Joint) 0.4 0.3%H503 - Buff/Slack Action Excess, Trn Handling 0.4 0.3%All Others - -Total 6.6 4.1%
PennsylvaniaTop 10 (10 year average)

32
Table 9: Major US CBR Derailments As can be seen in Table 9, of the 10 derailments listed, the distribution by cause is as follows:
• Track: 6 (60%) or 7 ( 70% if unknown is counted22) o Rail 4 (40%) o Geometry
Gauge-Fasteners 1 Alignment 1
• Equipment: 3 (20%) o Broken Wheel 2 o Broken Axle 1*
• Unknown: 1 (10%) But suspected to be track
* Casselton ND was actually a collision between a derailed train and the CBR train where the cause of the initial derailment was a broken axle
22 Track is suspected as the cause in the Aliceville, AL accident but not officially listed as the cause, which is shown as “could not be determined”.
Year Date Location RR Train type Cause Equip damage Track damage Speed (mph) Loco derailed Cars derailed Tank car derailed Cars breached Car type Gallons released Fire Deaths injuries2015 5/6/2015 Heimdal, ND BNSF CBR Broken Rim (wheel) 476,670$ 2,000,000$ 24 0 6 6 5 CPC 1232 65,000 Yes 0 02015 3/5/2015 Galena, IL BNSF CBR Broken Rim (wheel) 1,963,369$ 1,626,334$ 23 21 21 10 CPC 1232 110,000 Yes 0 02015 2/16/2015 Mt Carbon, WV CSX CBR Vertical Split Head (rail) 2,871,245$ 199,832$ 33 0 27 26 18 CPC 1232 379,000 Yes 0 22014 5/9/2014 La Salle, CO UP CBR Track aligment irregular 134,825$ 40,630$ 9 0 6 5 1 5,000 No 0 02014 4/30/2014 Lynchburg, VA CSX CBR Detail fracture from shell (rail) 1,047,491$ 176,500$ 23 0 17 17 1 CPC-1232 30,000 Yes 0 22014 2/13/2014 Vandergrift, PA NS CBR Wide Gauge-fasteners T-111 1,760,384$ 270,000$ 21 0 21 21 4 10,000 No2013 12/30/2013 Casselton, ND BNSF CBR Broken axle 5,789,769$ 510,941$ 42 2 34 20 18 476,000 Yes 0 22013 11/7/2013 Aliceville, AL AGR CBR d not be determined-track suspe 2,076,254$ 622,793$ 39 1 27 27 26 630,000 Yes 0 02013 10/21/2013 Smithboro BNSF CBR Bolt crack or break (rail) 1,163,950$ 36,500$ 40 0 18 6 1 - No 0 02013 3/27/2013 Parkers Prairie, MN CP CBR Transverse/compoud fissure (rail) 1,340,378$ 188,000$ 40 0 14 14 3 15,000 No 0 0
33
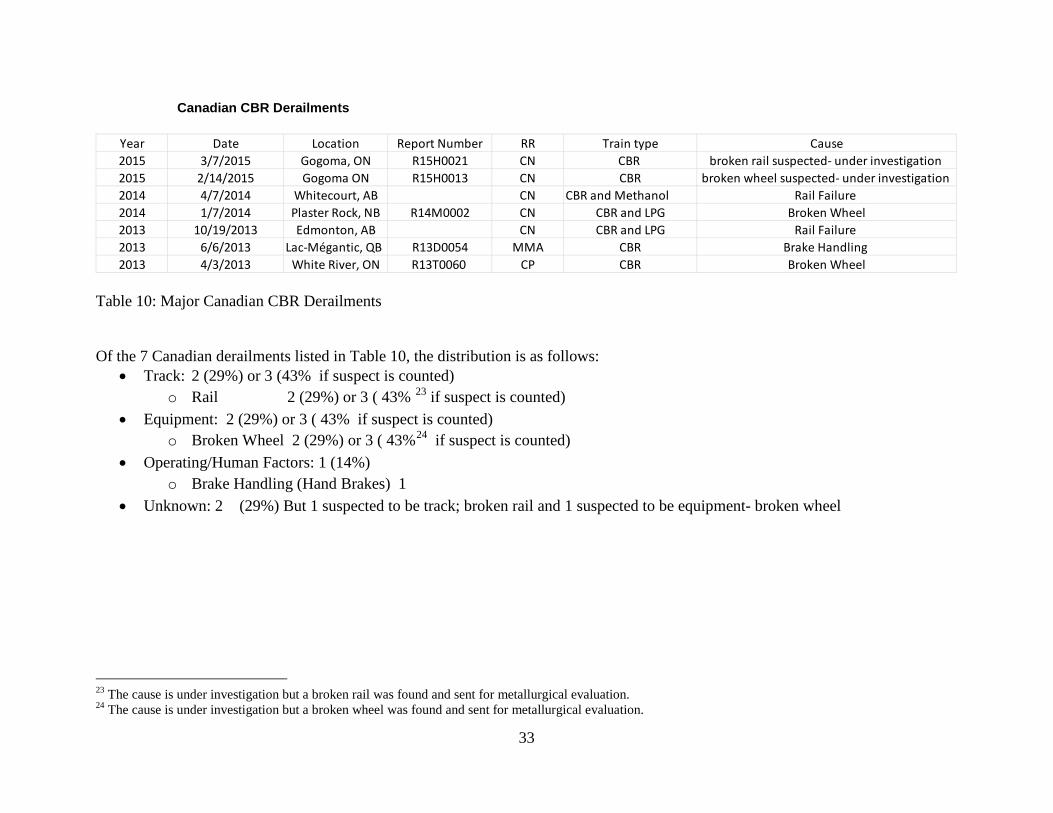
Canadian CBR Derailments
Table 10: Major Canadian CBR Derailments Of the 7 Canadian derailments listed in Table 10, the distribution is as follows:
• Track: 2 (29%) or 3 (43% if suspect is counted) o Rail 2 (29%) or 3 ( 43% 23 if suspect is counted)
• Equipment: 2 (29%) or 3 ( 43% if suspect is counted) o Broken Wheel 2 (29%) or 3 ( 43%24 if suspect is counted)
• Operating/Human Factors: 1 (14%) o Brake Handling (Hand Brakes) 1
• Unknown: 2 (29%) But 1 suspected to be track; broken rail and 1 suspected to be equipment- broken wheel
23 The cause is under investigation but a broken rail was found and sent for metallurgical evaluation. 24 The cause is under investigation but a broken wheel was found and sent for metallurgical evaluation.
Year Date Location Report Number RR Train type Cause2015 3/7/2015 Gogoma, ON R15H0021 CN CBR broken rail suspected- under investigation 2015 2/14/2015 Gogoma ON R15H0013 CN CBR broken wheel suspected- under investigation 2014 4/7/2014 Whitecourt, AB CN CBR and Methanol Rail Failure 2014 1/7/2014 Plaster Rock, NB R14M0002 CN CBR and LPG Broken Wheel2013 10/19/2013 Edmonton, AB CN CBR and LPG Rail Failure 2013 6/6/2013 Lac-Mégantic, QB R13D0054 MMA CBR Brake Handling 2013 4/3/2013 White River, ON R13T0060 CP CBR Broken Wheel

34
Looking at the combined US and Canadian CBR Derailments
Of the 17 derailments listed: • Track: 8 (47%) or 10 (59% if both unknowns are counted)
o Rail 6 (35%) or 7 (41% if unknown is counted) o Geometry 2 (12%)
Gauge-Fasteners 1 Alignment 1
• Equipment: 5 (29%) or 6 (35% if unknown is counted) o Broken Wheel 3 (18%) or 4 (24% if unknown is counted) o Broken Axle 1*
• Operating/Human Factors: 1 (6%) o Brake Handling (Hand Brakes) 1 o Collision *
• Unknown: 3 (18%) But 2 suspected to be Track and 1 Equipment (wheel)
* Casselton ND was actually a collision between a derailed train and the CBR train where the cause of the initial derailment was a broken axle This review of US and Canadian major CBR derailments shows that rail failure was the single largest cause category representing 35 to 41% of the total and wheel failure the second largest category with 18 to 24% of the total. Other failure categories included track geometry (2)25, broken axle (1) and improper setting of hand brakes26 (Human factor 1). Looking at Pennsylvania for a similar 3 year period (Table 7), there were 4 major Track caused derailments, 2 being broken rail, one track geometry (wide gauge due to fasteners) and one due to turnout condition. Of the five Human Factor accidents, three were train handling, one was Human Factors-Track, and one was speed related. Of the three equipment related derailments, one was a broken axle and one was a broken coupler. It should be further noted, that the wide gauge due to fastener derailment at Vandergrift PA (2/2014) was a CBR train that had a release but no associated fire or explosion.
25 One wide gauge due to fasteners and one track alignment 26 Lac Megantic, Quebec

35
Thus, examination of the derailment statistics to include the United States in general, Pennsylvania in particular and CBR derailments in particular show that there is a range of derailment causes, which must be addressed by different approaches, as will be discussed in the next section. Based on this data the following appears to be a listing of the major categories in order of frequency of major derailments and corresponding potential for CBR related accidents. This listing includes those main line derailment categories that can occur at track speed, with an associated risk of a tank car breach.
• Rail defects/failure • Track geometry defects
o Wide gauge due to tie and/or fastener condition o Vehicle-Track Interaction o Road bed effects
• Wheel failure • Axle and Bearing Failure • Frogs and Switches • Train Handling • Speed
Note such frequently found derailment categories as General Switching Rules and Switching Operations and Improper Use of Switch are not included because these tend to be lower speed yard derailments where the risk of a tank car breach is significantly reduced. Note the specific subject of tank car breach and associated speed, often referred to as “Conditional Probability of Release” or CPR of the crude oil, will be discussed later in this report. The next section will discuss those technologies currently used to address these different classes of derailments and potential for reduction of risk of derailment.
36
Derailment Risk Reduction Options
For a catastrophic CBR event to take place, several elements are necessary, as noted previously. • First, a derailment must occur, usually unrelated to the CBR equipment itself. • Second, a breach or rupture of the tank car shell must occur and a release of the crude
take place. • Third, conditions must be present and the volatility of the commodity must be such as to
ignite or explode after the rupture of the tank car. This section will address techniques available to reduce the risk of a derailment, since if derailments are prevented, particularly those that can result in a tank car breach, then catastrophic events can be avoided. As noted in the previous section, the most common derailment causes that appear to be associated with catastrophic tank car events include:
• Rail defects/failure • Track geometry defects • Wheel failure • Axle and Bearing Failure • Frogs and Switches • Train Handling • Speed
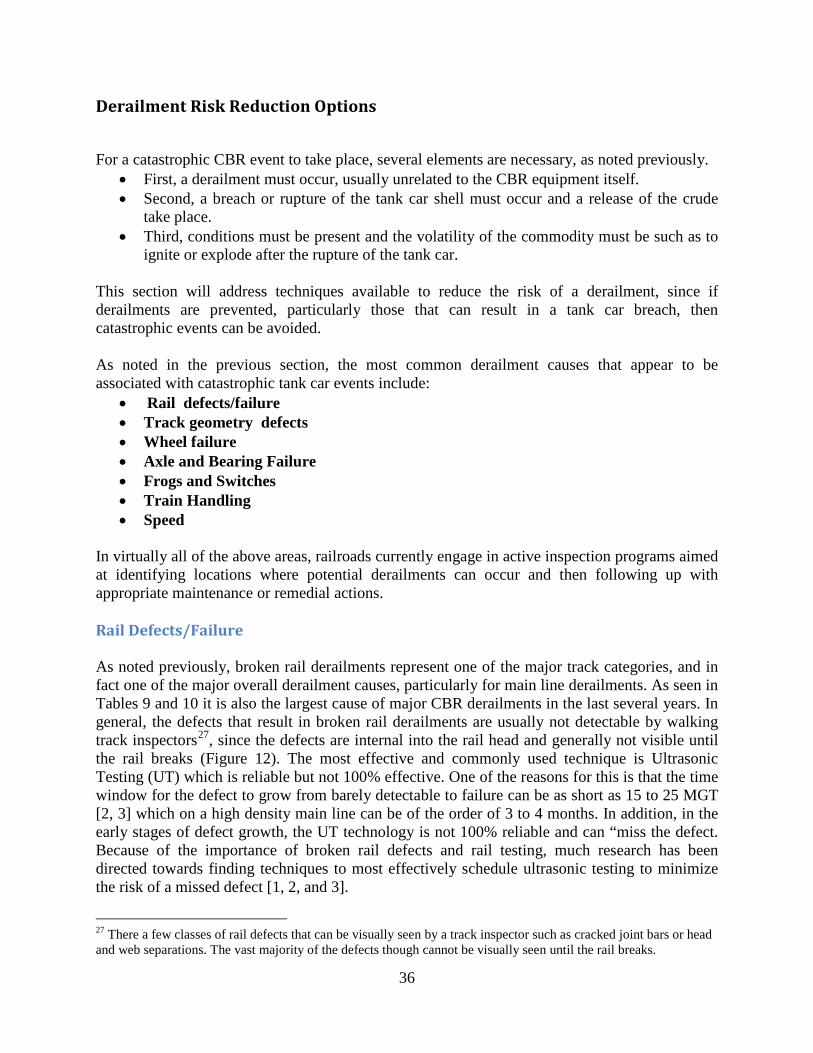
In virtually all of the above areas, railroads currently engage in active inspection programs aimed at identifying locations where potential derailments can occur and then following up with appropriate maintenance or remedial actions. Rail Defects/Failure As noted previously, broken rail derailments represent one of the major track categories, and in fact one of the major overall derailment causes, particularly for main line derailments. As seen in Tables 9 and 10 it is also the largest cause of major CBR derailments in the last several years. In general, the defects that result in broken rail derailments are usually not detectable by walking track inspectors27, since the defects are internal into the rail head and generally not visible until the rail breaks (Figure 12). The most effective and commonly used technique is Ultrasonic Testing (UT) which is reliable but not 100% effective. One of the reasons for this is that the time window for the defect to grow from barely detectable to failure can be as short as 15 to 25 MGT [2, 3] which on a high density main line can be of the order of 3 to 4 months. In addition, in the early stages of defect growth, the UT technology is not 100% reliable and can “miss the defect. Because of the importance of broken rail defects and rail testing, much research has been directed towards finding techniques to most effectively schedule ultrasonic testing to minimize the risk of a missed defect [1, 2, and 3].
27 There a few classes of rail defects that can be visually seen by a track inspector such as cracked joint bars or head and web separations. The vast majority of the defects though cannot be visually seen until the rail breaks.
37
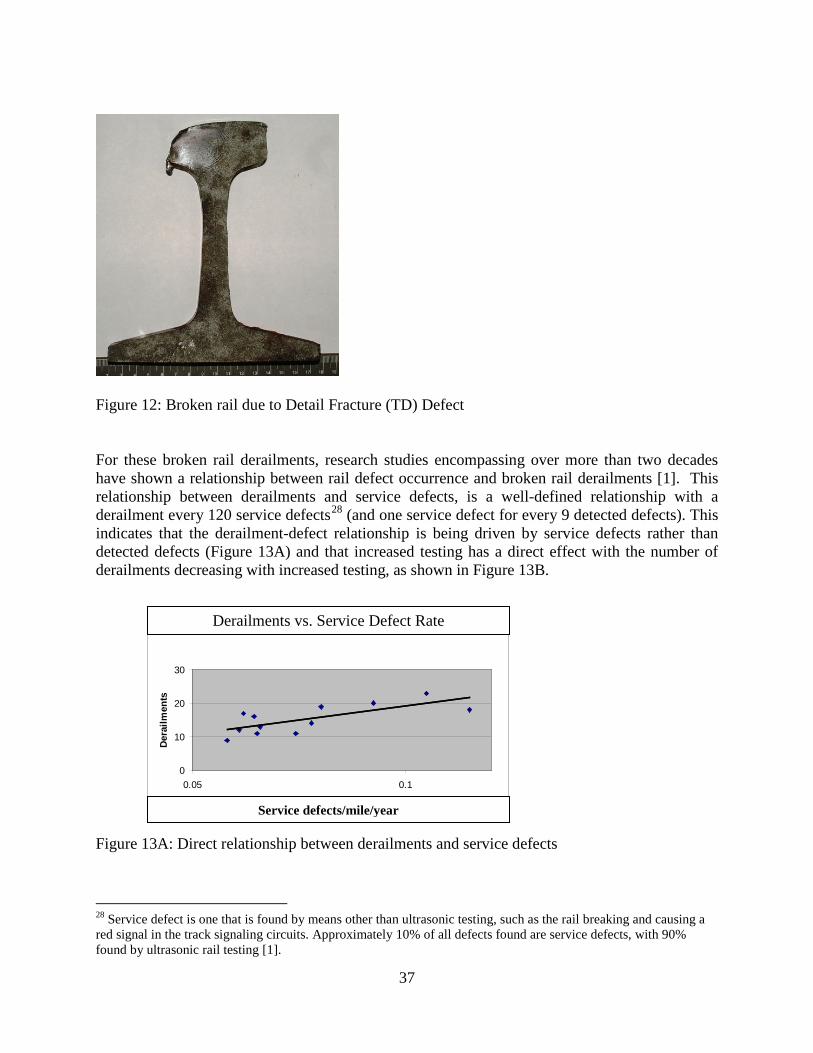
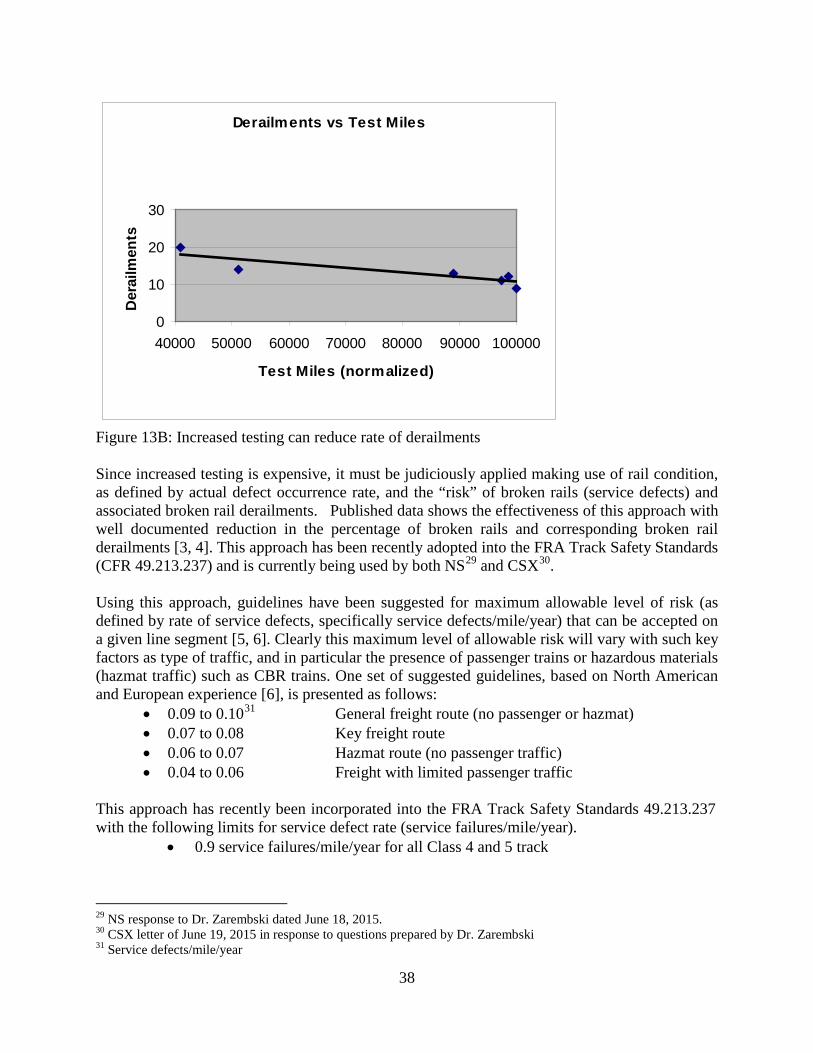
Figure 12: Broken rail due to Detail Fracture (TD) Defect For these broken rail derailments, research studies encompassing over more than two decades have shown a relationship between rail defect occurrence and broken rail derailments [1]. This relationship between derailments and service defects, is a well-defined relationship with a derailment every 120 service defects28 (and one service defect for every 9 detected defects). This indicates that the derailment-defect relationship is being driven by service defects rather than detected defects (Figure 13A) and that increased testing has a direct effect with the number of derailments decreasing with increased testing, as shown in Figure 13B.
Figure 13A: Direct relationship between derailments and service defects
28 Service defect is one that is found by means other than ultrasonic testing, such as the rail breaking and causing a red signal in the track signaling circuits. Approximately 10% of all defects found are service defects, with 90% found by ultrasonic rail testing [1].
0
10
20
30
0.05 0.1
Dera
ilmen
ts
Derailments vs. Service Defect Rate
Service defects/mile/year
38
Figure 13B: Increased testing can reduce rate of derailments Since increased testing is expensive, it must be judiciously applied making use of rail condition, as defined by actual defect occurrence rate, and the “risk” of broken rails (service defects) and associated broken rail derailments. Published data shows the effectiveness of this approach with well documented reduction in the percentage of broken rails and corresponding broken rail derailments [3, 4]. This approach has been recently adopted into the FRA Track Safety Standards (CFR 49.213.237) and is currently being used by both NS29 and CSX30. Using this approach, guidelines have been suggested for maximum allowable level of risk (as defined by rate of service defects, specifically service defects/mile/year) that can be accepted on a given line segment [5, 6]. Clearly this maximum level of allowable risk will vary with such key factors as type of traffic, and in particular the presence of passenger trains or hazardous materials (hazmat traffic) such as CBR trains. One set of suggested guidelines, based on North American and European experience [6], is presented as follows:
• 0.09 to 0.1031 General freight route (no passenger or hazmat) • 0.07 to 0.08 Key freight route • 0.06 to 0.07 Hazmat route (no passenger traffic) • 0.04 to 0.06 Freight with limited passenger traffic
This approach has recently been incorporated into the FRA Track Safety Standards 49.213.237 with the following limits for service defect rate (service failures/mile/year).
• 0.9 service failures/mile/year for all Class 4 and 5 track
29 NS response to Dr. Zarembski dated June 18, 2015. 30 CSX letter of June 19, 2015 in response to questions prepared by Dr. Zarembski 31 Service defects/mile/year
Derailments vs Test Miles
0
10
20
30
40000 50000 60000 70000 80000 90000 100000
Test Miles (normalized)
Der
ailm
ents
39
• 0.09 for all Class 3,4 and 5 track carrying regularly scheduled passenger trains or is a hazardous material route
• 0.08 for all Class 3,4 and 5 track carrying regularly scheduled passenger trains and is a hazardous material route
It should be noted that FRA Track Safety Standards are “minimum safety requirements32” and that railroads usually employ tighter standards than called for by FRA in order to provide a margin of safety as well as time for maintenance to be performed.
Given the significant number of rail caused derailments, particularly CBR derailments, it is recommended that the routes over which CBR trains operate in Pennsylvania be tested at a rate such that the service defect rate is maintained at 0.04 to 0.06 service failures/mile/year. In all cases, rail on these routes should be tested no less than three times a year33. It should also be noted that FRA Track Safety Standards currently require annual visual or machine vision inspection of joint bars on Continuously Welded Rail (CWR) track with the number of annual inspections varying as a function of Class of Track, annual traffic tonnage (MGT) and presence of passenger traffic (213.119). Since virtually all of the CBR routes in Pennsylvania are on CWR track, these routes are inspected between 2 and 4 times a year. FRA permits the use of machine vision joint bar inspection systems for these inspections. Vision based inspection systems are also available that use an operator to review an image of the joint bars taken from an inspection vehicle. It is recommended that the routes over which CBR trains operate in Pennsylvania be tested by a vision based joint bar inspection system at least once per year; this test should be in lieu of one of the required on-foot inspections, as permitted by FRA. Track Geometry Defects Track geometry defects represent another major cause of derailments on main line track, to include CBR derailments. It should be noted that the 2/13/2014 Vandergrift, PA derailment was a track geometry defect, due to wide gauge caused by fasteners. Track geometry defect limits are defined by FRA Track Safety Standards and in turn are defined by the Class of track selected by the railroad based on operating speed on a given segment of route. The tolerances of each parameter vary by the track class of the track being measured. In the United States, geometry cars generally classify each defect as either "Class II" or "Class I" (though the exact name may vary by the railroad). A class II defect is known as a maintenance level defect, meaning that the track doesn't meet a particular railroad's own standards. Each railroad has their own standard for a maintenance level defect, which is almost always tighter
32 Track Safety Standards Title 49 Part 213.1 33 All recommendations are shown in Italics. Recommendations in Bold Face Italics are Primary recommendations as defined in the Recommendations section of this report. References not in bold face (but in italics) are secondary recommendations as defined in the Recommendations section of this report.
40
than the FRA Track Safety Standards. A class I defect is a defect in violation of the Federal Railroad Administration's (FRA) track safety standards. Railroads must fix these defects within a certain period of time after their discovery. The key track geometry parameters are:
• Alignment: Alignment is the projection of the track geometry of each rail or the track centerline onto the horizontal plane. Also known as the "straightness" of the tracks. On tangent track, alignment is measured as the deviation from zero curvature or straight track. In a curve, the alignment is measured as the deviation from “uniform” curvature. Alignment is the variation in curvature of each rail of the track measured at the mid-point of a 62 or 31-foot chord.
• Profile (Vertical alignment or surface): Profile is the surface uniformity in the vertical plane of each rail measured at the mid-point of a 62-foot chord.
• Cross level: The difference in elevation between the top surfaces of the two rails at any point of railroad track.
• Curvature: The amount by which the rail deviates from being straight or tangent. The degree of curvature is defined as the central angle subtended by a chord of 100 feet.
• Track Gage or Gauge: The distance between the rails measured between the heads of the rails at right angles to the rails in a plane five-eighths of an inch below the top of the rail head. Standard gauge in North America is 4 feet, 8.5 inches.
• Run-Off: Elevation (ramp) difference of a line along the top of the rail is used for the projection.
• Super elevation: A constant elevation of the outside rail over the inner rail maintained on curves, as well as a uniform rate of change on spirals, and measured in the same manner as cross level.
• Twist: The difference in cross level between two points of a fixed distance. • Warp: The difference in cross level between any two points within the specified chord
length (generally sixty-two feet). The warp parameter in the track geometry is used to specify the maximum cross level difference of the track in any segment (tangents, curves and spirals).
41
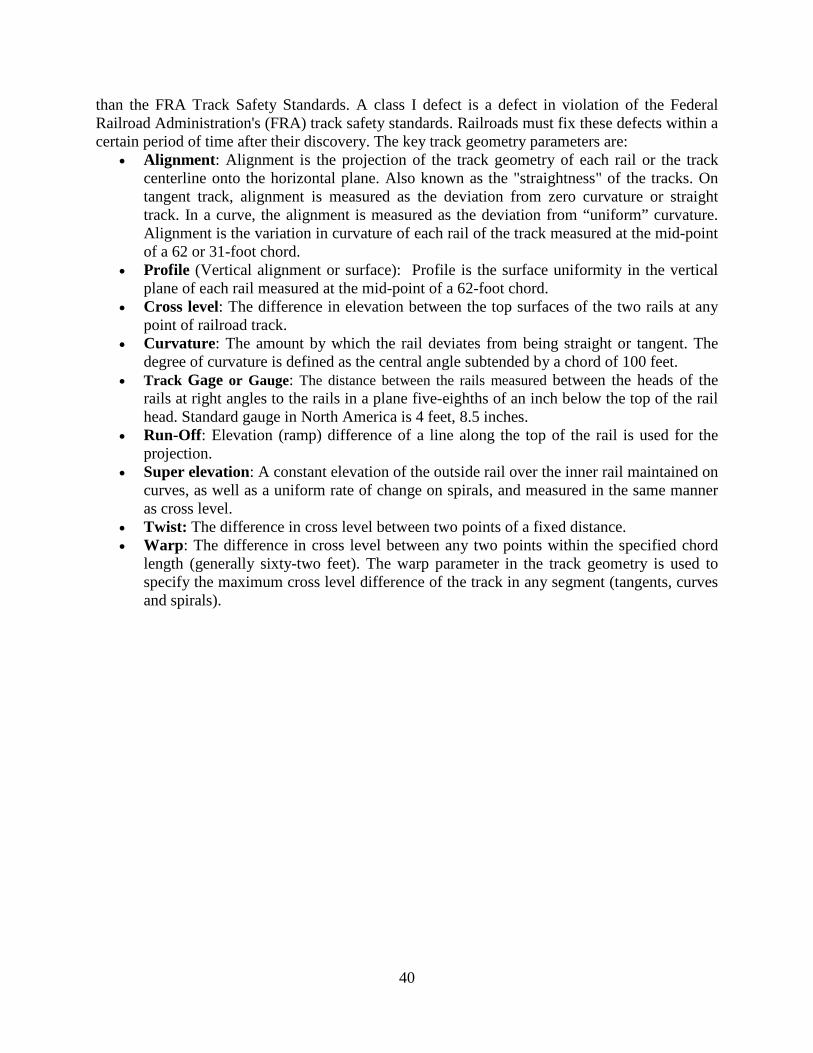
Figure 14: Track geometry defects
Track geometry can be measured by a track inspector using specific hand tools such as a string line or chord for alignment and surface and a track gage for gage and cross-level. Current FRA standards require track inspectors to conduct regular visual inspection of mainline Class 4 and 5 tracks twice weekly. CSX performs these inspections at least three times a week on crude oil routes34. The more accurate method of measuring track geometry is through the use of a track geometry car (also known as a track recording car). The track geometry car is an automated track inspection vehicle used to test multiple geometric parameters of the track at high speed without obstructing normal railroad operations. Most track geometry cars measure all of the geometry parameters noted above as well as additional parameters such as rail profile and wear. The cars use a variety of sensors, measuring systems, and data management systems to measure the track being inspected. Track geometry cars are more accurate than a track inspector using hand tools and also measure the track under load, which is a requirement of the FRA track safety standards and which more accurately represents the track as seen by a loaded rail vehicles. Some, but not
34 Testimony of Quintin Kendall, Vice President CSX to the Joint Hearing of the Pennsylvania Senate Transportation and Environmental Resources and Energy Committees on June 9, 2015.

42
all, track geometry cars, are weighted to simulate a fully loaded rail vehicle35, so as to simulate the maximum loading of the track caused by a fully loaded freight car. Both NS and CSX own their own track geometry cars which test mainline track between one and four times a year. NS has stated36 that it will be testing crude oil routes in Pennsylvania four times a year. CSX37 has stated that they test 3 to 4 times a year on mainline Hazardous Material Routes in Pennsylvania. In addition, the Federal Railroad Administration operates its own track geometry cars, usually testing major routes on a two to four year cycle. It is recommended that the routes over which CBR trains operate in Pennsylvania be tested by a railroad owned Track Geometry Car at a minimum of four times a year. However, it should be noted that certain classes of wide gauge defects, such as the wide gauge due to fastener condition that occurred at Vandergrift, PA in February 2014 may not always be reliably detected by track geometry cars or by conventional walking inspections. While geometry cars weighted to simulate a fully loaded freight car can usually pick up these conditions, they may not always be able to do so. One technology that was developed specifically to identify this type of track condition is the Gage Restraint Measurement System (GRMS) which measures the ability of the track to maintain gauge under controlled lateral and vertical loads. To do so, a specially designed track geometry or track strength inspection car measures the unloaded track gauge and the change in gauge which occurs under applied vertical and lateral loads. The FRA Track Safety standards specifically incorporates GRMS standards (213.110) but they are not mandatory. As such neither NS nor CSX currently employ GRMS inspection vehicles. However, the FRA does employ the T-18, its FRA Gage Restraint Measurement System (GRMS) vehicle which measures all of the key track geometry parameters and also employs a GRMS systems. The GRMS system consists of a 5th split axle which applies laterally load to the head of both adjacent rails of railroad track in order to measure rail motion under a combined vertical and later load for the detection of weak ties and fasteners. It likewise measures unloaded track gage (UTG) at a point no less than 10-feet from any lateral or vertical load application and loaded track gage (LTG) measured at a point no more than 12 inches from the lateral load application point. Using these measurements it calculates the parameters defined in the FRA Track Safety Standards to include Delta Gage (difference LTG-UTG), Projected Loaded Gage 24 (PLG 24), and Gage Widening Projection (GWP). It is recommended that the Pennsylvania Public Utility Commission (PUC) and their track inspectors which are part of the PUC’s Transportation Division coordinate with the Federal Railroad Administration and try to schedule the FRA’s T-18 GRMS test vehicle to inspect all routes over which CBR trains operate in Pennsylvania at least once a year. This test should include both GRMS and conventional track geometry measurements.
35 NS’s geometry car is weighted to represent a fully loaded freight car. 36 In their response of June 18, 2005 to Dr. Zarembski/s questions 37 CSX letter of June 19, 2015 in response to questions prepared by Dr. Zarembski

43
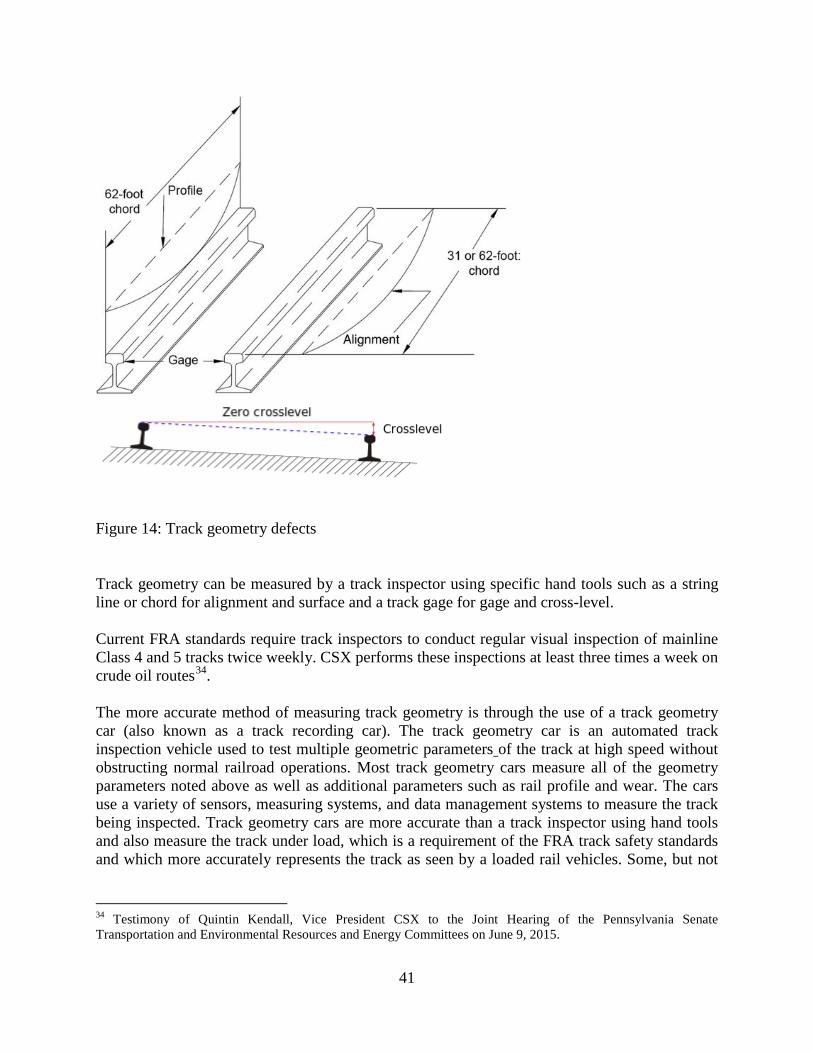
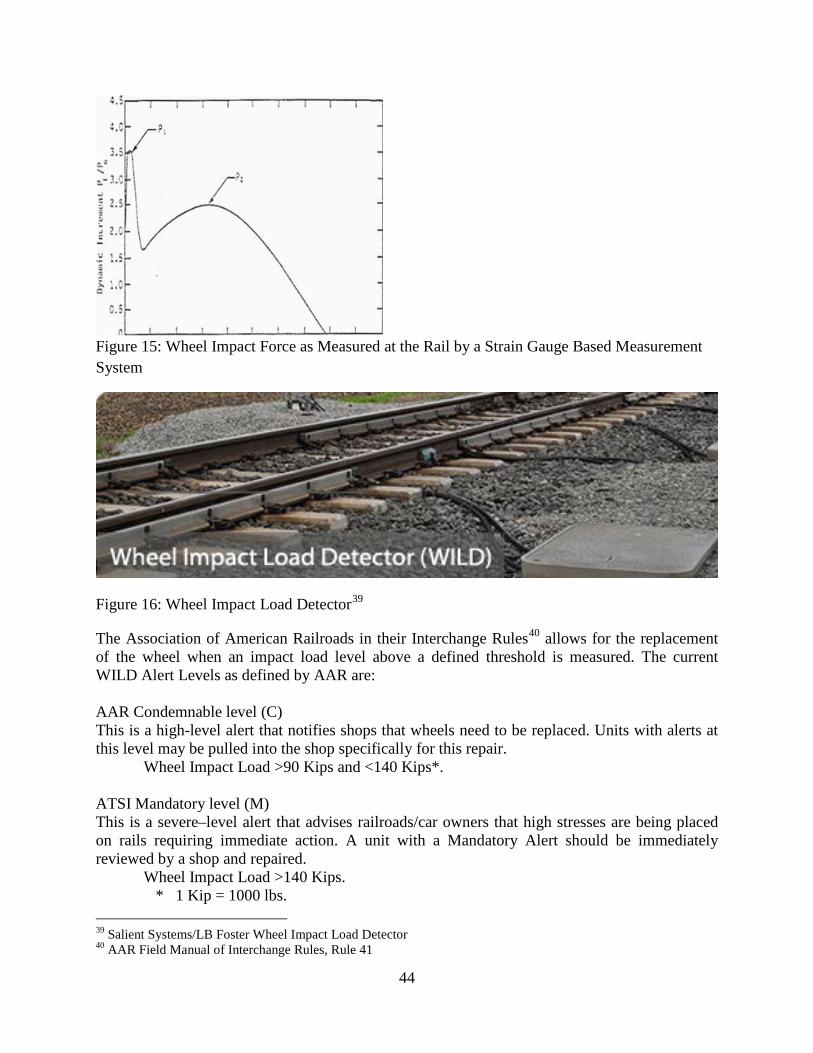
Finally it should be noted that traditional track geometry inspection vehicle technology can be supplemented by such new technologies as Autonomous Track Geometry Measurement (ATGM) System and Vehicle/Track Interaction (VTI) monitoring systems. The ATGM Systems are autonomous, train mounted track geometry measurement systems that provide reports on geometry conditions—including those pertaining to gage, cross-level, alignment, surface/profile and limiting speeds in curves—in a manner similar to traditional track geometry measurement systems without the need for an onboard crew. Thus they can be allowed to run in this unattended mode for extended periods of time with the ability to monitor track geometry conditions at a high rate of inspection frequency. The Vehicle/Track Interaction (VTI) monitoring system is likewise an autonomous, locomotive or car mounted inspection system that measure accelerations and forces and is designed to detect track conditions that can lead to poor vehicle performance or potential derailment conditions. Real time VTI alerts can be transmitted to appropriate field personnel thus allowing for immediate inspection and follow up action. Because VTI systems look at the dynamic response of the vehicle, they can also address conditions of multiple track geometry defects, where any one defect is within FRA safety standards but where multiple defects can result in unsafe dynamic conditions. Such conditions are generally not covered in the current FRA track safety standards [17]. It is recommended that conventional track geometry car tests on routes over which CBR trains operate in Pennsylvania be supplemented by ATGM and/or VTI measurement systems. Wheel Failure Wheel failure, to include broken wheels, represents one of the major equipment caused derailment categories and has been identified as the cause in several of the recent major CBR derailments. Wheel failures include fatigue failure from high levels of stress generated by severe impact loads, usually associated with a surface defect or flat on the wheel. Wheel failure also encompasses overheating of wheels, particularly in heavy braking territory such as found in mountainous terrain. High impact loading is a major contributor to wheel failure and one of the modern techniques used to identify wheels that generate high impact loads is the Wheel Impact Load Detector (WILD). WILDs are wayside devices that measure impact load of a wheel on rail as illustrated in Figure 15. WILDs use a strain gauge based system38, with gauges that are physically mounted on the web of rail and which measures the force applied by each wheel to the rail (Figure 16). The WILD measures impact forces caused by damaged wheels which in turn can cause damage (and potential failure) to both the railway vehicle that contains the damaged wheel and the track structure over which the vehicle runs. It is thus used to identify wheels that have a condition that generates excessively high impact forces that can lead to failure of the wheel or damage to the track.
38 Strain gauge based WILD systems are the most commonly used WILD systems in North America; however other designs are also used in North America and worldwide.
44
Figure 15: Wheel Impact Force as Measured at the Rail by a Strain Gauge Based Measurement System
Figure 16: Wheel Impact Load Detector39
The Association of American Railroads in their Interchange Rules40 allows for the replacement of the wheel when an impact load level above a defined threshold is measured. The current WILD Alert Levels as defined by AAR are: AAR Condemnable level (C) This is a high-level alert that notifies shops that wheels need to be replaced. Units with alerts at this level may be pulled into the shop specifically for this repair.
Wheel Impact Load >90 Kips and <140 Kips*. ATSI Mandatory level (M) This is a severe–level alert that advises railroads/car owners that high stresses are being placed on rails requiring immediate action. A unit with a Mandatory Alert should be immediately reviewed by a shop and repaired.
Wheel Impact Load >140 Kips. * 1 Kip = 1000 lbs.
39 Salient Systems/LB Foster Wheel Impact Load Detector 40 AAR Field Manual of Interchange Rules, Rule 41
45
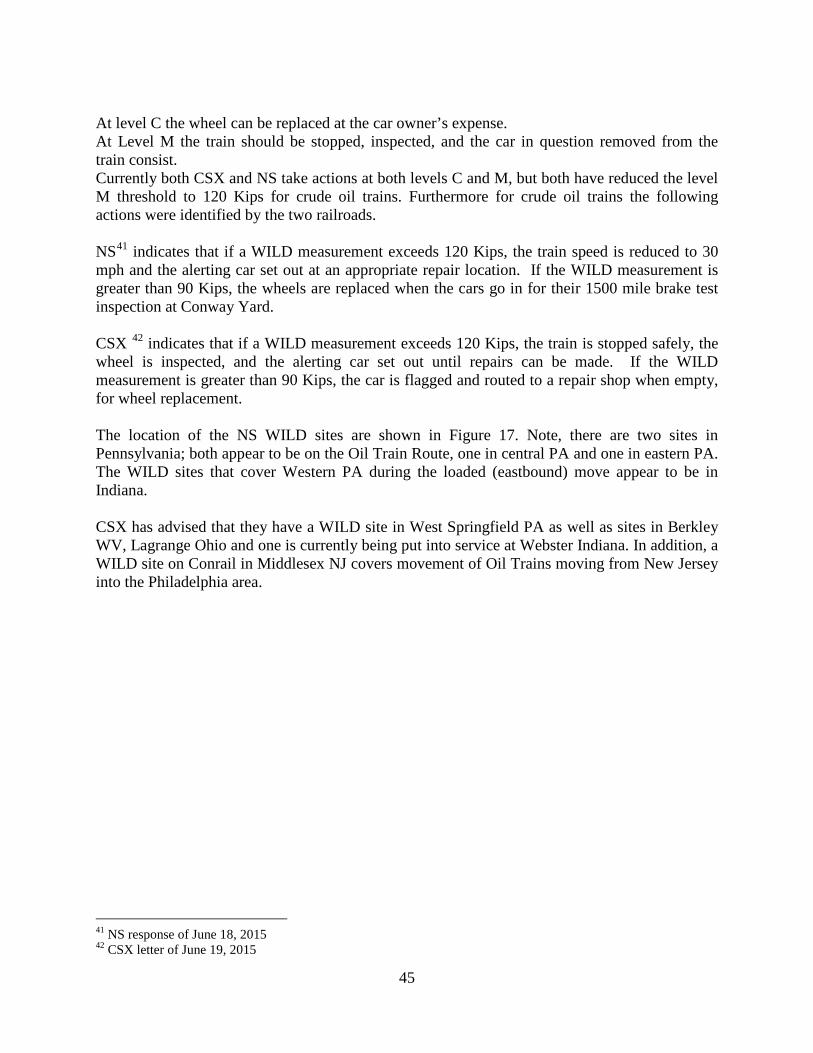
At level C the wheel can be replaced at the car owner’s expense. At Level M the train should be stopped, inspected, and the car in question removed from the train consist. Currently both CSX and NS take actions at both levels C and M, but both have reduced the level M threshold to 120 Kips for crude oil trains. Furthermore for crude oil trains the following actions were identified by the two railroads. NS41 indicates that if a WILD measurement exceeds 120 Kips, the train speed is reduced to 30 mph and the alerting car set out at an appropriate repair location. If the WILD measurement is greater than 90 Kips, the wheels are replaced when the cars go in for their 1500 mile brake test inspection at Conway Yard. CSX 42 indicates that if a WILD measurement exceeds 120 Kips, the train is stopped safely, the wheel is inspected, and the alerting car set out until repairs can be made. If the WILD measurement is greater than 90 Kips, the car is flagged and routed to a repair shop when empty, for wheel replacement. The location of the NS WILD sites are shown in Figure 17. Note, there are two sites in Pennsylvania; both appear to be on the Oil Train Route, one in central PA and one in eastern PA. The WILD sites that cover Western PA during the loaded (eastbound) move appear to be in Indiana. CSX has advised that they have a WILD site in West Springfield PA as well as sites in Berkley WV, Lagrange Ohio and one is currently being put into service at Webster Indiana. In addition, a WILD site on Conrail in Middlesex NJ covers movement of Oil Trains moving from New Jersey into the Philadelphia area.
41 NS response of June 18, 2015 42 CSX letter of June 19, 2015
46
Figure 17. WILD Sites on NS
It is recommended that the railroad have sufficient WILD units in place to monitor all loaded oil train cars along their entire route within Pennsylvania, such that any track location on an oil train route within the state should have a WILD unit no more than 200 miles43 preceding44 (in the loaded direction) that location . It is recommended that if a WILD measurement exceeds 120 Kips, the train should be safely stopped, the wheel inspected, and then if condition of the wheel allows, the train proceed at a reduced speed of 30 mph until the alerting car can set out at an appropriate location until repairs are made. If the WILD measurement is greater than 90 Kips, the car should be flagged and the identified wheels replaced as soon as possible but no later than 1500 miles of additional travel. Overheated wheels are not detected by WILD units but rather require Hot Wheel Detectors to identify wheels that are overheated or repeatedly overheated and thus subject to thermal fatigue. This is particularly important for mountainous terrain where trains will apply tread brakes for extended periods of time, thus causing the wheels to overheat. Hot Wheel Detectors measure the temperature of the wheels, such as through the infrared temperature measurement techniques. This allows the assessment of the degree of overheating and determination of an alert level, with any alerts sent to the dispatcher and/or train crew. NS has indicated that they have 23 hot wheel detectors in Pennsylvania. CSX does not appear to have any Hot Wheel detectors in Pennsylvania but since most of the CSX oil train routes are on relatively flat terrain, there may not be any need for Hot Wheel detectors on these routes. 43 Based on 100,000 cycles of loading and a 36 inch wheel diameter. 44 To monitor a loaded CBR train’s wheels before it arrives at that given location.
47
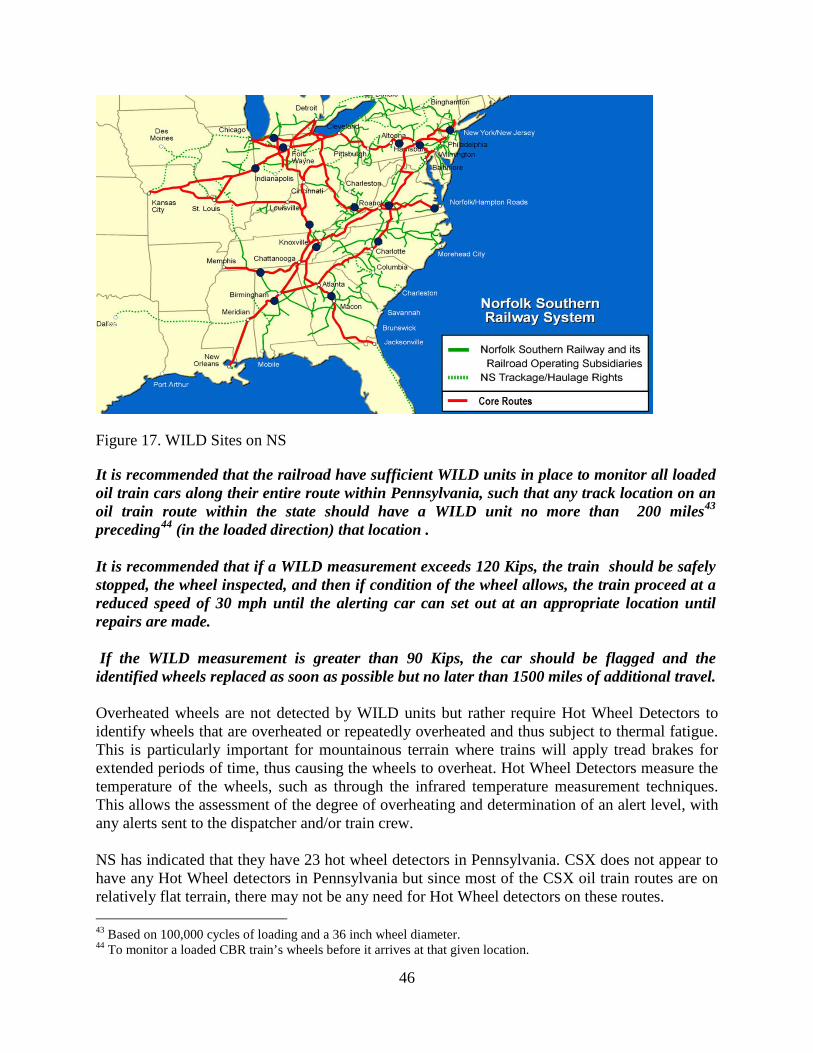
It is recommended that NS and CSX verify that they have sufficient Hot Wheel Detectors on the Oil Train Routes to allow for the identification of overheated wheels on terrain where this can be a cause of wheel failure. Axle and Bearing Failure Axle and bearing failures represent another category of equipment caused derailments that has been associated with CBR train related derailments. Axle failure can occur either due to structural fatigue, usually associated with high wheel/rail impact loading or through bearing overheating and burning off of the axle end. The former condition is directly associated with the impact loads detected by the WILD systems discussed previously. The later condition is associated with overheated bearing which can rapidly increase in temperature to a level where they can burn through the axle. This can happen as quickly as 20 to 30 miles of travel. The most commonly used approach to detecting overheated bearings and preventing that class of derailments is through the use of Hot Bearing Detectors often referred to as “Hot Box” Detectors. Hot Box Detectors (HBD) are measuring devices installed along the track and designed to monitor axle bearing temperatures indicating any overheating which could lead to bearing failures. The HBD System consists of detection units located on the track and a processing unit located at the trackside which collects the values measured by the detectors and transmits this data to either or both the dispatcher and the train crew . Hot Box Detectors are based on a system which measures the temperature by infrared radiation, in a manner similar to that for a hot wheel detector and illustrated in Figure 18.
Figure 18: Combined Hot Bearing and Hot Wheel Detector
48
Both CSX and NS use Hot Box Detectors on their oil train routes in Pennsylvania, with CSX having an average spacing of 15 to 20 miles in Pennsylvania and NS having an average spacing of 12 miles and a maximum spacing of 23 miles in Pennsylvania. It is recommended that the railroads have sufficient HBD units in place as to monitor all loaded oil train cars along their entire route within Pennsylvania, with a maximum spacing of 25 miles between Hot Box detectors. Because Hot Box detectors have to wait for the bearing or axles to overheat before they can register an alarm, the railroad industry has been developing a supplement Acoustic Bearing Detector technology which measures the frequency spectrum of the sound generated by each bearing and uses this frequency signature to identify defects in the bearing that can cause failure, before overheating begins. Thus the range of the Acoustic Bearing is significantly greater than that of the HBD. Like the HBD, the Acoustic Bearing Detector is designed to monitor roller bearings from a ground (wayside) location and identify bearings with internal defects prior to overheating and failure. CSX has indicated that they currently have eight ABD detector locations system-wide with one such system located in Pennsylvania. NS likewise has multiple ABD sites, though none in Pennsylvania (but one in Ohio on what appears to be its CBR route to Pennsylvania) It is recommended that the railroad have at least one Acoustic Bearing Detector unit in place to monitor all loaded oil trains along their entire route within Pennsylvania. Frog and Switch Defects As noted previously, turnout related derailments, to include switch and frog defect related derailments, are a significant category, though in the majority of cases they occur at lower speeds, such as in yards and sidings. However, as can be seen in Table 4, while the average per derailment cost is much lower than the top causes, it is still significant, suggesting the potential for a derailment of sufficient intensity as to possibly result in a tank car puncture. This would certainly be the case for switch derailments on main tracks. Currently US railroads follow FRA Track Safety Standards which requires a visual inspection of the turnouts monthly. However, there is significant room for judgement in switch point conditions as defined in FRA 213.135 [7]. This is an area where State of Pennsylvania track inspectors may be able to supplement railroad and FRA inspectors. In addition, this is an area where there is currently some newly developed technologies and approaches that might assist the railroads in improving inspection in turnouts. One such area is in the development of specialized gauges to help measure the condition of switch points to reduce the risk of wheel climb type derailments45 [7]. The project, which included a study team from several US railroads and the AAR, identified several potential wheel climb mechanisms that are of particular concern to US railways. They included: 45 National Academy of Sciences IDEA program has sponsored a study in this area which has active railroad industry participation.
49
• Chipped or damaged switch points. • Poor wheel/rail contact through the point for new or moderately worn wheel profile • Excessive gauge face wear of the switch point • Severely worn wheel-related climb. A series of prototype hand held gauges were developed and are currently in the process of being evaluated in the field. These gauges can make the inspection of switches more effective. A second technology area that is currently being developed is the use of laser rail profile technology to ensure turnout condition to include both the switch and frog areas of the turnout46 [8]. The analysis software takes the profile technology and calculates key safety parameters which are then compared to railroad and/or FRA standards. Note this technology is still in the early stages of development and implementation. While it is premature to recommend actual use of these tools at this time, these technologies should be followed to see if it can contribute directly to improved safety in this area It is recommended that State of Pennsylvania Track inspectors focus attention on the condition of turnouts on major CBR routes in the state. Train Handling Among the major main line derailment categories shown in Table 4, train handling represents the most severe of the Human factor class of derailments. In a manner similar to the turnout derailments discussed above, the average per derailment cost for train handling is much lower than the top causes; however, it is still significant, suggesting the potential for a derailment of sufficient intensity as to possibly result in a tank car puncture. This is clearly seen in the 2014 train handling derailment on NS in Pennsylvania that generated over $1.5 Million of reported damage to track and equipment (see Table 6). This derailment was a train handling derailment which occurred near Altoona, PA on September 20, 2014. While no HAZMAT cars were on that train, the excessive draft train forces caused 17 cars to derail with over $1.5 Million in damage. There are several new technologies that are becoming available to help with this class of derailments. Studies sponsored by the FRA suggest that the introduction of ECP (Electronic Controlled Pneumatic) brake systems can improve train handling by providing for better braking control of the cars in the rear of the train, thus reducing the potential for run-in type situations such as in the 2014 Altoona derailment [9,10]. That is because ECP braking systems simultaneously send a braking command to all cars in the train, reducing the time before a car’s pneumatic brakes are engaged compared to conventional brakes, thus virtually eliminating the time lag in brake signal propagation that can cause excessive train forces. This will be discussed in further detail under Tank Car Breach since ECP brakes are part of the new DoT Order “Enhanced Tank Car Standards and Operational Controls for High-Hazard Flammable Trains” [9,10].
46 An example of this is Harsco Rail’s Automated Switch Inspection Vehicle (ASIV)
50
In addition, there is a new class of wayside mounted force detectors which measure Lateral wheel/rail forces, and when used in conjunction with WILD technology (which measures Vertical wheel/rail force) can provide information about train and car truck performance. These measurement systems are generally listed under the heading of Truck Defect Detectors (TDDs) and include Truck Hunting Detectors (THDs) and Truck Performance Detectors (TPDs). While the primary objective of TPD Systems are to detect and remove poorly performing cars, based on both curving and tangent performance, these detectors also offer the potential for detecting certain types of train performance problems, specifically those that generate high Lateral forces or lateral/vertical (L/V) ratios. This will be discussed in greater detail under Truck Performance. Speed As can be seen in Table 4, Speed is one of the “top 10” derailment causes, and in fact impacts the risk of a CBR derailment and/or puncture in several ways. The relationship between speed and the risk of a tank car puncture will be discussed in the next Chapter “Tank Car Breach”. Speed is also a direct cause of several classes of derailments, to include over speed on curves (such as in the recent May 2015 Amtrak derailment in Philadelphia). However, this type of over speed derailment is less likely for long heavy unit trains, which generally operate at a maximum speed of 40 or 50 mph, and so the potential for a large over speed on curves is very small. Similarly, truck hunting derailments, which are speed related, are usually associated with empty cars, rather than loaded cars, and likewise in a speed range greater than the 40 to 50 mph seen in CBR trains. In fact DoT rules [10] and AAR’s voluntary agreement impose a 50-mph maximum speed for any “key train,” including any train with 20 car loads of “any combination of hazardous material” and a 40-mph speed limit for HHFT and HHFUT trains carrying crude oil within the limits of any High-Threat Urban Area (HTUA), as defined by TSA regulations [11]47. However, as can be seen in Table 4, there are sufficient instances of speed related derailments to be of concern. The technology that is most effective in dealing with over-speed derailments is Positive Train Control (PTC) which is designed to automatically stop a train before certain types of accidents occur. PTC addresses a range of different types of accidents and derailments, to include train-to-train collisions; derailments caused by excessive speed; unauthorized incursions by trains onto sections of track where maintenance activities are taking place; and movement of a train through a track switch left in the wrong position. PTC will not prevent accidents caused as a result of track or equipment failure; improper vehicular movement through a grade crossing; trespassing on railroad tracks; and some types of train operator error. It should be noted that the vast majority of recent CBR derailments would not have been prevented by PTC. PTC technology must account for a number of factors to measure the appropriate train stopping distance, including train information (weight, length); track composition (curvature, terrain); train speed; and train authority (authorization to move across a stretch of track). There are three main elements of a PTC system, which are integrated by a wireless communications system:
• Onboard or Locomotive System that monitors the train’s position and speed and activates braking as necessary to enforce speed restrictions and unauthorized train movement into new sections of track.
47 The HTUA locations in Pennsylvania are Philadelphia and Pittsburgh.
51
• Wayside System that monitors railroad track signals switches and track circuits to communicate authorization for movement to the locomotive.
• Back Office Server that stores information related to the rail network and trains operating across it — speed limits, track composition, speed of individual locomotives, train composition, etc. — and transmits the authorization for individual trains to move into new segments of track.
PTC has been mandated by Congress in the Rail Safety Improvement Act of 2008 with a December 2015 statutory PTC implementation deadline. This mandate is for approximately 60,000 miles of railroad. Congress is currently debating an extension of this deadline since most freight railroads will not be able to implement a full PTC system by end of 2015. Freight railroads support an extension. Amtrak has already indicated that it plans to meet the December 31, 2015 deadline and have full system PTC implementation at that time. The FRA Acting Administrator has gone on record as saying FRA will start imposing fines on railroads who do not meet the congressionally mandated PTC implementation schedule. Thus, if no extension is passed by Congress, that would be January 1, 2016. The AAR and the major freight railroads have indicated that they have encountered various technical and non-technical challenges that have prevented full deployment of PTC by December 2015. In its most recent PTC progress report to the Federal Railroad Administration, AAR said the following would be completed by the end of 2015:
• More than 11,000 railroad route-miles equipped with PTC. • About 9,000 locomotives will be PTC ready (about 39% of all locomotives) • 76% of the 34,000 required wayside units will be installed. • 67% of base station radios will be in place. • 32,446 of 95,971 railroad employees will be PTC trained.
Both NS and CSX have indicated that they expect to have PTC fully operational between 2018 and 2020. It is recommended that the Commonwealth of Pennsylvania encourage both NS and CSX to implement PTC on Oil train routes in the Commonwealth as expeditiously as possible, in accordance with government mandated schedules. Truck (Bogie) Condition While not one of the “Top 10” derailment categories, derailments associated with defects in the freight car truck (bogie) can be detected through the use of wayside Truck Defect Detectors (TDDs). This class of detectors include Truck Hunting Detectors (THDs), which identify cars that “hunt” or display significant lateral oscillations on tangent (straight) track and Truck Performance Detectors (TPDs) which identify cars that generate high levels of Lateral load ( or high L/V ratio) on curves. While the primary objective of TPD Systems is to detect and remove poorly tracking cars, based on both curving and tangent performance, TPD systems identify railcar truck suspension systems that do not perform optimally in curves. Poor performance results in derailments due to wheel climb, gauge spreading, rail roll over and panel shift.
52
In fact, AAR interchange rules currently include alert levels for Truck Hunting Detectors (THD) with a condemnable level (C) at which levels the freight car may be sent home to the car owner for repair. The specific Truck Hunting Index (THI) 48 levels are:
• 1 reading at THI ≥ 0.5 • 2 readings at 0.5 > THI ≥ .35 in twelve months
CSX has indicated that at its WILD sites in West Springfield, PA, Berkeley, WV, and Lagrange, OH, they have lateral strain gages incorporated to produce lateral force measurements and the Hunting Index. It is recommended that the railroad have at least one Truck Defect Detector or equivalent49 in place to monitor all loaded oil train cars along their entire route within Pennsylvania. Bridges There is ongoing public concern about the condition of bridges and the potential for bridge failure resulting in an accident or derailment. Investigation of 10 years of derailment data found no bridge failure caused accident or derailment50 reported for the Commonwealth of Pennsylvania in the FRA data base. In addition no major CBR accident has been related to a bridge problem. In fact for the entire US, during the five year period from January 2010 to March 2015 only 9 bridge related accidents were reported with a total reported damage value of $2.9 Million. Under 49 CFR 237 railroads must maintain a Bridge Safety Management Program (237.31) and must actively inspect railroad bridges on an ongoing basis. Written inspection records must be maintained by each railroad and periodic internal audits performed. It is recommended that Pennsylvania PUC coordinate with FRA and NS and CSX Bridge Departments to insure that the railroads are maintaining a Bridge Safety Management Program in accordance with 49 CFR 237. Yards and Sidings As noted previously, yards and sidings represent the majority of accidents, with over 57% of all reported accidents (2014). However, yards and siding accidents are low speed accidents, usually with a limited amount of damage and speeds below the level where puncture of a tank can be expected. Yard accidents include a significant number of human factor causes to include switching and use of switch derailments. Likewise it includes a significant number of track causes to include switches, frogs, and crossings, to include those areas where FRA track safety standards have significant room for judgement, i.e. switch point conditions. As such there
48 Truck Hunting Index (THI) is a function of the ratio of Lateral Force (L) to Vertical Force (V), usually referred to as the L/V ratio. 49 Such as a lateral Load measurement system 50 FRA accident cause code T401 bridge misalignment or failure.

53
remains a potential for an accident in yards and sidings if a proper level of inspection and maintenance is not maintained. CSX designates upgraded yard landing tracks where crude oil trains are staged and inspects these tracks twice per month51. It is recommended that those yards and sidings that handle a significant number of CBR cars be inspected by the Railroad inspectors at a level of track tighter than the assigned FRA track class. Thus Yards that are FRA Class 1 should be inspected at a FRA Class 2 level to provide railroads with early warning of potential track conditions that can cause problems. It is recommended that Pennsylvania state inspectors include yards and sidings that handle a significant number of CBR cars as part of their inspection program. All such inspections to be coordinated with the FRA inspection program.
51 Testimony of Quintin Kendall, VP State Government and Community Affairs, CSX Transportation before the Pennsylvania Transportation and Environmental Resources Committees on June 9, 2015.
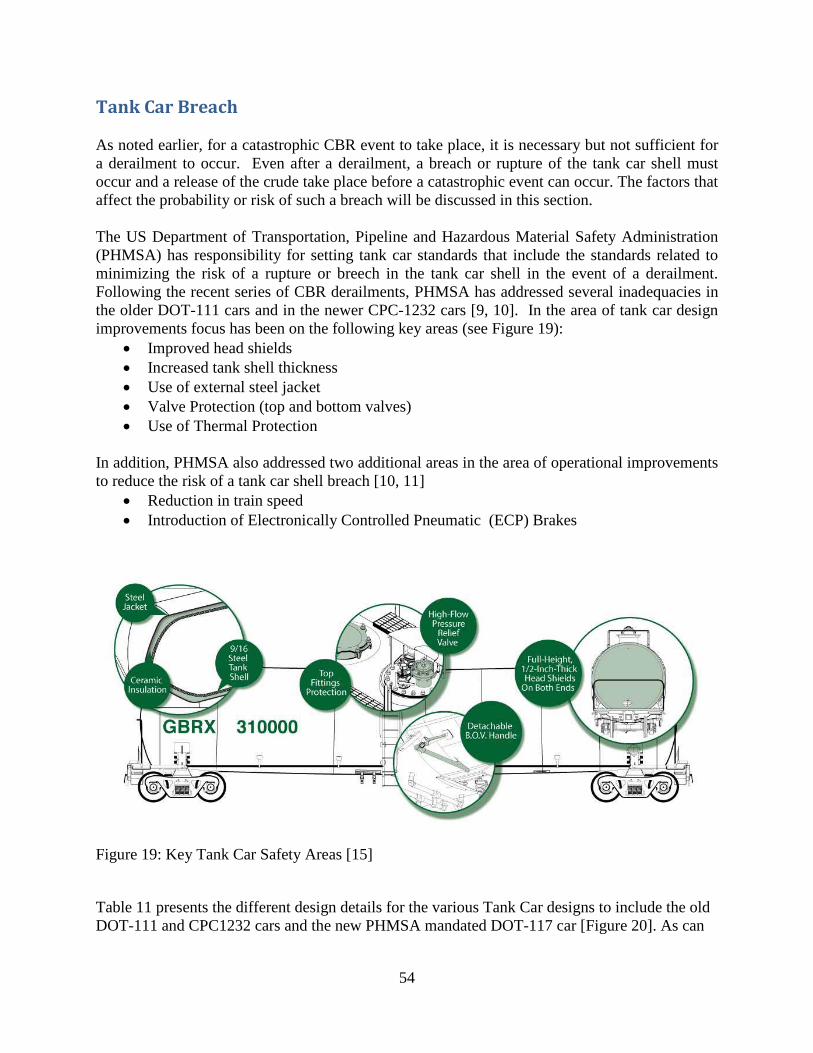
54
Tank Car Breach As noted earlier, for a catastrophic CBR event to take place, it is necessary but not sufficient for a derailment to occur. Even after a derailment, a breach or rupture of the tank car shell must occur and a release of the crude take place before a catastrophic event can occur. The factors that affect the probability or risk of such a breach will be discussed in this section. The US Department of Transportation, Pipeline and Hazardous Material Safety Administration (PHMSA) has responsibility for setting tank car standards that include the standards related to minimizing the risk of a rupture or breech in the tank car shell in the event of a derailment. Following the recent series of CBR derailments, PHMSA has addressed several inadequacies in the older DOT-111 cars and in the newer CPC-1232 cars [9, 10]. In the area of tank car design improvements focus has been on the following key areas (see Figure 19):
• Improved head shields • Increased tank shell thickness • Use of external steel jacket • Valve Protection (top and bottom valves) • Use of Thermal Protection
In addition, PHMSA also addressed two additional areas in the area of operational improvements to reduce the risk of a tank car shell breach [10, 11]
• Reduction in train speed • Introduction of Electronically Controlled Pneumatic (ECP) Brakes
Figure 19: Key Tank Car Safety Areas [15]
Table 11 presents the different design details for the various Tank Car designs to include the old DOT-111 and CPC1232 cars and the new PHMSA mandated DOT-117 car [Figure 20]. As can
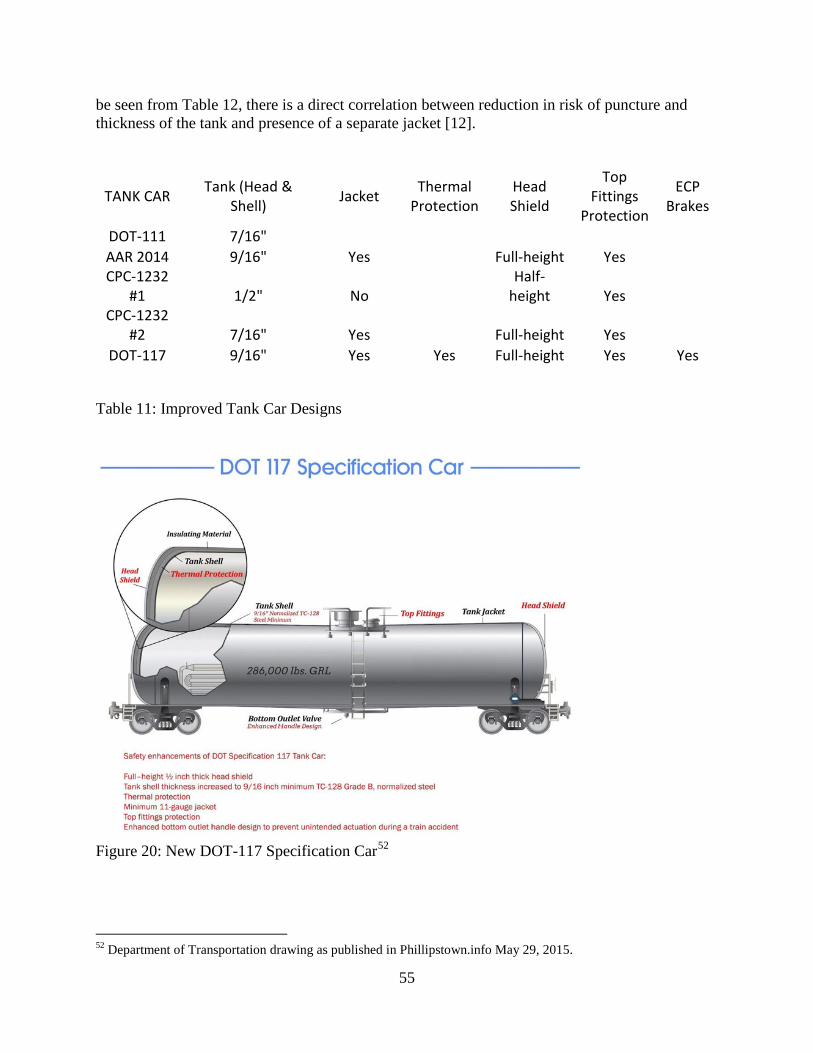
55
be seen from Table 12, there is a direct correlation between reduction in risk of puncture and thickness of the tank and presence of a separate jacket [12].
TANK CAR Tank (Head & Shell) Jacket Thermal
Protection Head Shield
Top Fittings
Protection
ECP Brakes
DOT-111 7/16" AAR 2014 9/16" Yes
Full-height Yes
CPC-1232 #1 1/2" No
Half-height Yes
CPC-1232 #2 7/16" Yes
Full-height Yes
DOT-117 9/16" Yes Yes Full-height Yes Yes
Table 11: Improved Tank Car Designs
Figure 20: New DOT-117 Specification Car52
52 Department of Transportation drawing as published in Phillipstown.info May 29, 2015.

56
Most Likely
Number Of Punctured Cars
% Improvement Compared to Base
Case
Tank Type
30 mph
40 mph
30 mph
40 mph
Base Case
7/16" A516-70 No Jacket
7.7
10.9 - -
Alternate 1
1/2" TC128B No Jacket (CPC-1232)
6.0
8.7
23%
20%
Alternate 2
7/16" TC1288 11 Gage Jacket (CPC-1232 w/ Jacket)
5.7
8.3
27%
24%
Alternate 3
9/16" TC128B 11 Gage Jacket
4.3
6.6
45%
40%
Table 12: Effect of Shell and Jacket Design Modifications [12] Another commonly used measure to evaluate the risk of a breach or puncture in the tank car and a corresponding release of crude oil is the Conditional Probability of Release (CPR), which is defined as the probability that release of hazardous material from a railroad tank car will occur given that an accident (e.g., a train derailment or a car-to-car collision) has already occurred. [13, 14]. Table 13 presents the relationship between shell thickness and CPR (which is given as two sets of values, CPR corresponding to any release of oil and CPR with a release greater than 100 gallons). As can be seen in this table, there is again a correlation between increased shell thickness and reduced risk of tank car release of contents (CPR). SHELL THICKNESS CPR CPR>100 gal.
7/16 inch 0.064 0.046 ½ inch 0.052 0.037 9/16 inch 0.042 0.029
Table 13: CPR as a function of shell thickness [15]
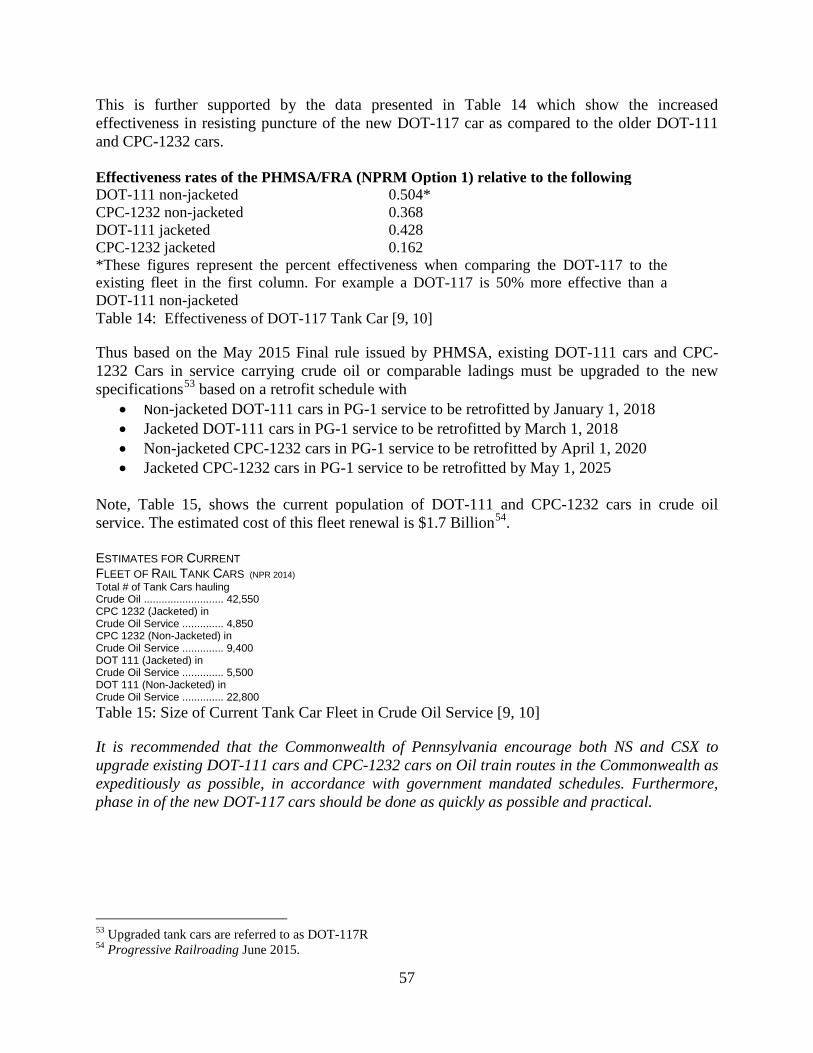
57
This is further supported by the data presented in Table 14 which show the increased effectiveness in resisting puncture of the new DOT-117 car as compared to the older DOT-111 and CPC-1232 cars. Effectiveness rates of the PHMSA/FRA (NPRM Option 1) relative to the following DOT-111 non-jacketed 0.504* CPC-1232 non-jacketed 0.368 DOT-111 jacketed 0.428 CPC-1232 jacketed 0.162 *These figures represent the percent effectiveness when comparing the DOT-117 to the existing fleet in the first column. For example a DOT-117 is 50% more effective than a DOT-111 non-jacketed Table 14: Effectiveness of DOT-117 Tank Car [9, 10]
Thus based on the May 2015 Final rule issued by PHMSA, existing DOT-111 cars and CPC-1232 Cars in service carrying crude oil or comparable ladings must be upgraded to the new specifications53 based on a retrofit schedule with
• Non-jacketed DOT-111 cars in PG-1 service to be retrofitted by January 1, 2018 • Jacketed DOT-111 cars in PG-1 service to be retrofitted by March 1, 2018 • Non-jacketed CPC-1232 cars in PG-1 service to be retrofitted by April 1, 2020 • Jacketed CPC-1232 cars in PG-1 service to be retrofitted by May 1, 2025
Note, Table 15, shows the current population of DOT-111 and CPC-1232 cars in crude oil service. The estimated cost of this fleet renewal is $1.7 Billion54. ESTIMATES FOR CURRENT FLEET OF RAIL TANK CARS (NPR 2014) Total # of Tank Cars hauling Crude Oil ........................... 42,550 CPC 1232 (Jacketed) in Crude Oil Service .............. 4,850 CPC 1232 (Non-Jacketed) in Crude Oil Service .............. 9,400 DOT 111 (Jacketed) in Crude Oil Service .............. 5,500 DOT 111 (Non-Jacketed) in Crude Oil Service .............. 22,800 Table 15: Size of Current Tank Car Fleet in Crude Oil Service [9, 10]
It is recommended that the Commonwealth of Pennsylvania encourage both NS and CSX to upgrade existing DOT-111 cars and CPC-1232 cars on Oil train routes in the Commonwealth as expeditiously as possible, in accordance with government mandated schedules. Furthermore, phase in of the new DOT-117 cars should be done as quickly as possible and practical.
53 Upgraded tank cars are referred to as DOT-117R 54 Progressive Railroading June 2015.
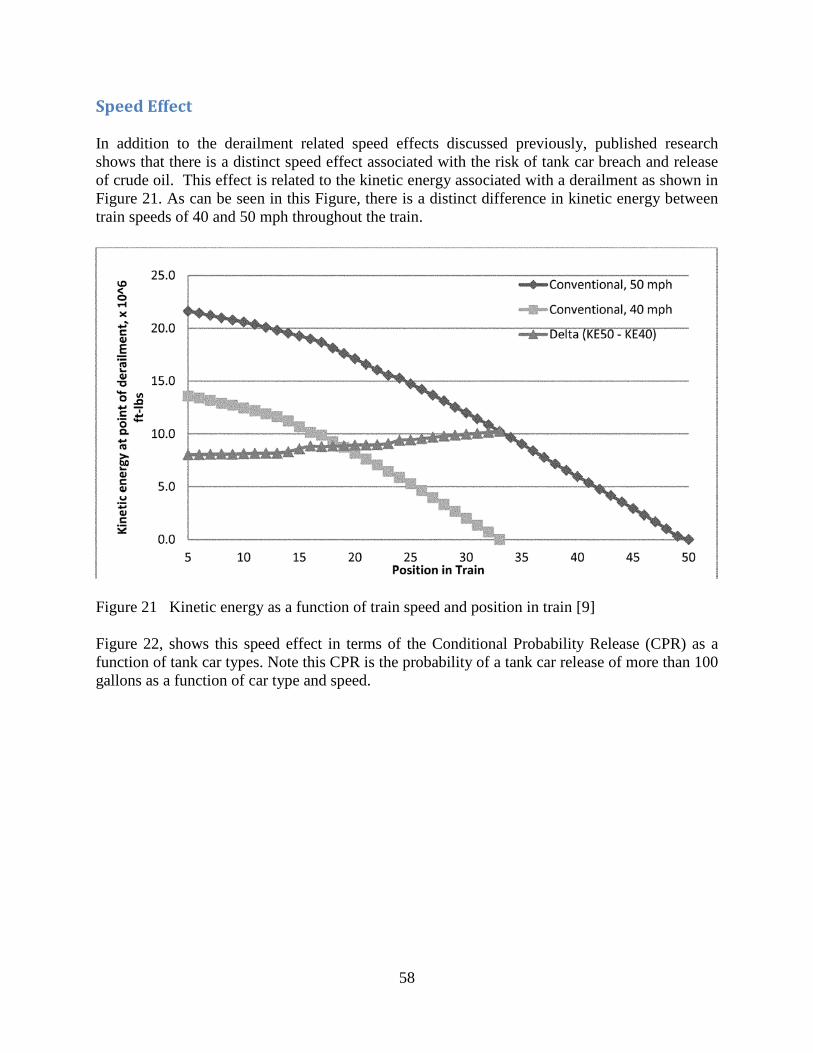
58
Speed Effect In addition to the derailment related speed effects discussed previously, published research shows that there is a distinct speed effect associated with the risk of tank car breach and release of crude oil. This effect is related to the kinetic energy associated with a derailment as shown in Figure 21. As can be seen in this Figure, there is a distinct difference in kinetic energy between train speeds of 40 and 50 mph throughout the train.
Figure 21 Kinetic energy as a function of train speed and position in train [9] Figure 22, shows this speed effect in terms of the Conditional Probability Release (CPR) as a function of tank car types. Note this CPR is the probability of a tank car release of more than 100 gallons as a function of car type and speed.
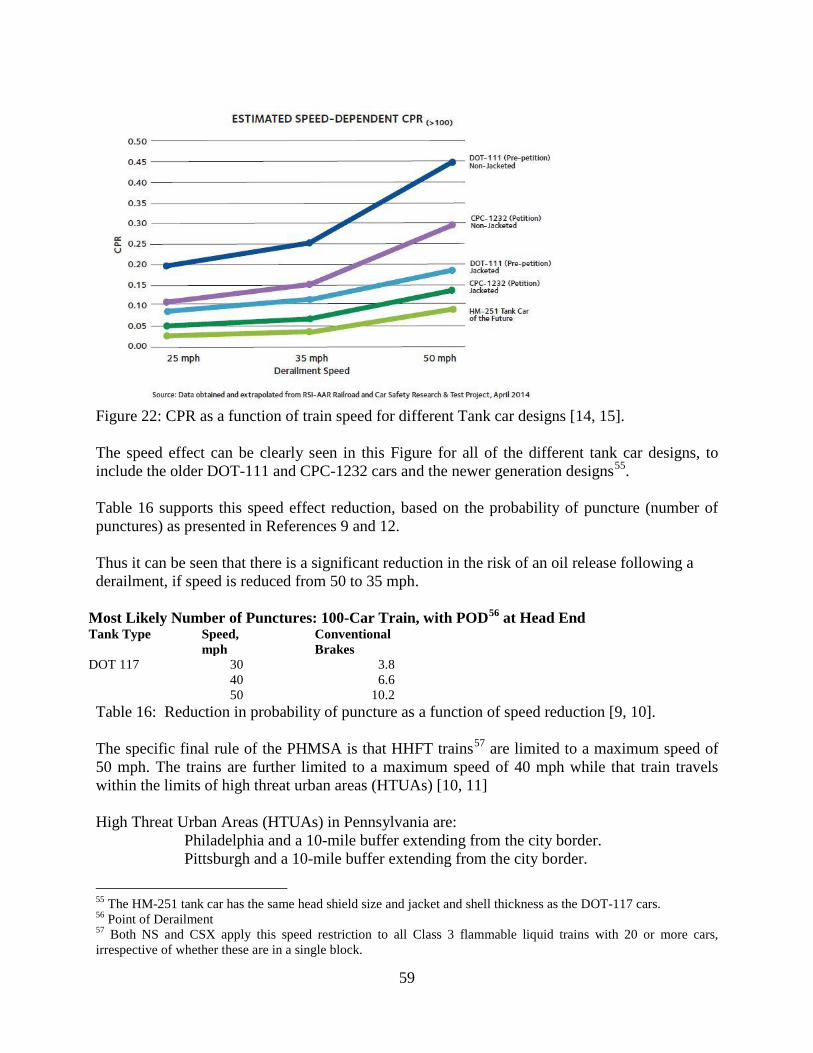
59
Figure 22: CPR as a function of train speed for different Tank car designs [14, 15]. The speed effect can be clearly seen in this Figure for all of the different tank car designs, to include the older DOT-111 and CPC-1232 cars and the newer generation designs55. Table 16 supports this speed effect reduction, based on the probability of puncture (number of punctures) as presented in References 9 and 12. Thus it can be seen that there is a significant reduction in the risk of an oil release following a derailment, if speed is reduced from 50 to 35 mph.
Most Likely Number of Punctures: 100-Car Train, with POD56 at Head End Tank Type Speed,
mph Conventional Brakes
DOT 117 30 3.8 40 6.6 50 10.2 Table 16: Reduction in probability of puncture as a function of speed reduction [9, 10]. The specific final rule of the PHMSA is that HHFT trains57 are limited to a maximum speed of 50 mph. The trains are further limited to a maximum speed of 40 mph while that train travels within the limits of high threat urban areas (HTUAs) [10, 11] High Threat Urban Areas (HTUAs) in Pennsylvania are:
Philadelphia and a 10-mile buffer extending from the city border. Pittsburgh and a 10-mile buffer extending from the city border.
55 The HM-251 tank car has the same head shield size and jacket and shell thickness as the DOT-117 cars. 56 Point of Derailment 57 Both NS and CSX apply this speed restriction to all Class 3 flammable liquid trains with 20 or more cars, irrespective of whether these are in a single block.

60
However, one major Class 1 Railroad, BNSF, has voluntarily reduced the speed of these HHFT trains to 35 mph when passing through cities with a population greater than 100,000 people. It is recommended that NS and CSX adopt the BNSF voluntary speed reduction to 35 mph for crude oil trains through cities with a population greater than 100,000 people.
ECP Brakes The new PHMSA final rule also requires that new DOT-117 cars be equipped with Electronic Controlled Pneumatic (ECP) brake systems and that HHFUTs must be operated with ECP brakes by January 1, 2021. HHFTs must operate with two way end-of-train (EOT) devices or distributed power (DP) braking system. ECP brake systems use an electrical train line which sends a braking command to all cars in the trains electronically58, reducing the time before a car’s pneumatic brakes are engaged compared to conventional brakes. The system also permits the train crew to monitor the effectiveness of the brakes on each individual car in the train and provides real-time information on the performance of the entire braking system of the train. All cars in a train must be equipped with ECP before a train can operate in ECP brake mode. DP (Distributed Power) is a system that provides control of a number of locomotives dispersed throughout a train from a controlling locomotive located in the lead position. The system provides control of the rearward locomotives by command signals originating at the lead locomotive and transmitted to the remote (rearward) locomotives. The two-way EOT device initiates an emergency brake application command from the front unit located in the controlling locomotive, which then activates the emergency air valve at the rear of the train within one second. A two way EOT device (TWEOT) is more effective than conventional brakes because the rear cars receive the brake command more quickly. Studies conducted by the FRA [9, 10, and 12] which looked at the energy dissipation associated with different braking systems and the associated risk of puncture during a derailment. Figure 2 shows the effect of energy dissipation while Table 17 and Figure 24 show the risk of puncture of the tank car as a function of braking systems. These figures based on an analysis by an FRA consultant [9, 10, 12] show that ECP braking reduces the number of punctures during a derailment. Is should be noted here that for ECP brakes to be used on any train, every car in that train must be equipped with ECP brakes. Thus, there are significant operational issues that must be addressed before implementation of ECP brakes on a large scale. Both the Association of American Railroads [AAR] and the American Petroleum Institute [API] disagree with this analysis as well as expressing serious concern about the operational and
58 As opposed to the conventional air or pneumatic brake systems currently in use.

61
economic impacts of the ECP brake portion of this PHMSA. There is a possibility that one or both of these organizations may challenge this portion of the PHMSA ruling.
Figure 23: Kinetic energy vs. position in train at 40 mph [9, 12]
Most Likely Number of Punctures: 100-Car Train, with POD at Head End Speed, mph
Conventional Brakes
ECP Brakes
30 3.8 2.6
40 6.6 4.3 50 10.2 7.6 Table 17: Risk of Puncture: Conventional vs. ECP Braking [9, 10]
Figure 24: Number of DOT-117 cars punctured based on location of first car derailed at 40 mph [10]
62
It is recommended that oil trains in Pennsylvania, not equipped with ECP Brakes, use two way end of train devices (TWEOT) or Distributed Power (DP) to improve braking performance.
Tank Car Thermal Jackets
As noted in Table 11, the new DOT-117 cars require thermal protection. Thermal protection systems for tank cars are intended to limit the heat flux to the containers when exposed to fire, particularly during pool fires, where there is a high risk of a thermal tear. In this situation, even though there was no rupture or leakage during the derailment, a pool fire can cause a rupture in the tank with corresponding leakage of fuel into the active pool fire. The requirement for thermal protection called for in the new PHMSA ruling calls for the tank car to have sufficient thermal resistance when subjected to a pool fire for 100 minutes or a torch fire for 30 minutes. Recent NTSB59 and Railway Supply Institute – AAR Tank Car Safety Research and Test Project (RSI-AAR Project), recommendations were that there be at least 800 minutes of protection to tank cars exposed to a pool fire [16]. This is supported by testimony form emergency responders, as in the case of the president of the Illinois Fire Chiefs Association and head of Bedford Park's department, who stated that "We've never seen a 100-minute fire in a tank car failure…You need to allow for more than 100 minutes." 60. Recent testimony by Pennsylvania Emergency Management Agency61 personnel likewise indicated that 800 minutes would be preferable to 100 minutes in an emergency situation involving a railroad tank car fire. It is recommended that the Commonwealth of Pennsylvania lend its support to increasing the tank car thermal protection standard to 800 minutes for a pool fire.
59 NTSB Safety Report of April 3, 2015 R-15-14. Note also concern about models used to evaluate pool fire behavior of tank car shells. 60 Wronski, Richard. “New rules for tank cars don’t offer enough fire protection, experts said”, Chicago Tribune, May 2015 61 Testimony at Pennsylvania Senate Transportation and Environmental Resources committees’ joint hearing of June 9, 2015 by Robert Full, Chief deputy Director Pennsylvania Emergency Management Agency and Randy Gockley, Director of Lancaster County’s emergency Management Agency during question and answer.
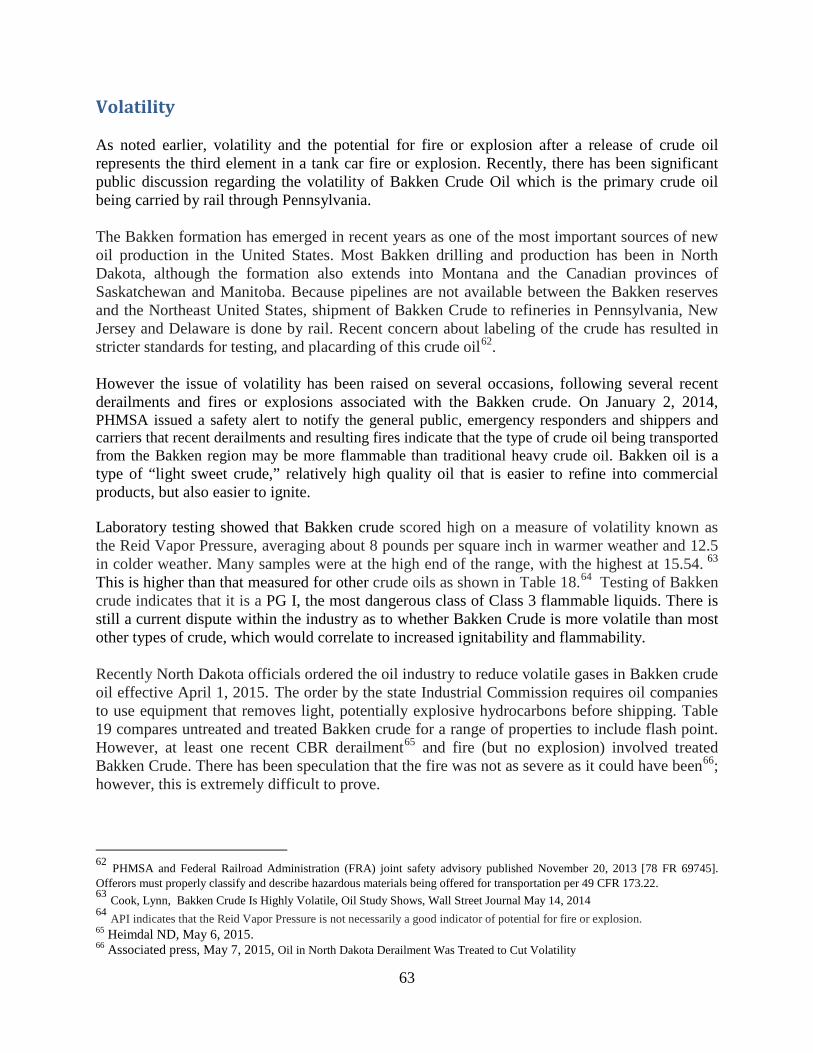
63
Volatility As noted earlier, volatility and the potential for fire or explosion after a release of crude oil represents the third element in a tank car fire or explosion. Recently, there has been significant public discussion regarding the volatility of Bakken Crude Oil which is the primary crude oil being carried by rail through Pennsylvania. The Bakken formation has emerged in recent years as one of the most important sources of new oil production in the United States. Most Bakken drilling and production has been in North Dakota, although the formation also extends into Montana and the Canadian provinces of Saskatchewan and Manitoba. Because pipelines are not available between the Bakken reserves and the Northeast United States, shipment of Bakken Crude to refineries in Pennsylvania, New Jersey and Delaware is done by rail. Recent concern about labeling of the crude has resulted in stricter standards for testing, and placarding of this crude oil62. However the issue of volatility has been raised on several occasions, following several recent derailments and fires or explosions associated with the Bakken crude. On January 2, 2014, PHMSA issued a safety alert to notify the general public, emergency responders and shippers and carriers that recent derailments and resulting fires indicate that the type of crude oil being transported from the Bakken region may be more flammable than traditional heavy crude oil. Bakken oil is a type of “light sweet crude,” relatively high quality oil that is easier to refine into commercial products, but also easier to ignite.
Laboratory testing showed that Bakken crude scored high on a measure of volatility known as the Reid Vapor Pressure, averaging about 8 pounds per square inch in warmer weather and 12.5 in colder weather. Many samples were at the high end of the range, with the highest at 15.54. 63 This is higher than that measured for other crude oils as shown in Table 18.64 Testing of Bakken crude indicates that it is a PG I, the most dangerous class of Class 3 flammable liquids. There is still a current dispute within the industry as to whether Bakken Crude is more volatile than most other types of crude, which would correlate to increased ignitability and flammability. Recently North Dakota officials ordered the oil industry to reduce volatile gases in Bakken crude oil effective April 1, 2015. The order by the state Industrial Commission requires oil companies to use equipment that removes light, potentially explosive hydrocarbons before shipping. Table 19 compares untreated and treated Bakken crude for a range of properties to include flash point. However, at least one recent CBR derailment65 and fire (but no explosion) involved treated Bakken Crude. There has been speculation that the fire was not as severe as it could have been66; however, this is extremely difficult to prove.
62 PHMSA and Federal Railroad Administration (FRA) joint safety advisory published November 20, 2013 [78 FR 69745]. Offerors must properly classify and describe hazardous materials being offered for transportation per 49 CFR 173.22. 63 Cook, Lynn, Bakken Crude Is Highly Volatile, Oil Study Shows, Wall Street Journal May 14, 2014 64 API indicates that the Reid Vapor Pressure is not necessarily a good indicator of potential for fire or explosion. 65 Heimdal ND, May 6, 2015. 66 Associated press, May 7, 2015, Oil in North Dakota Derailment Was Treated to Cut Volatility
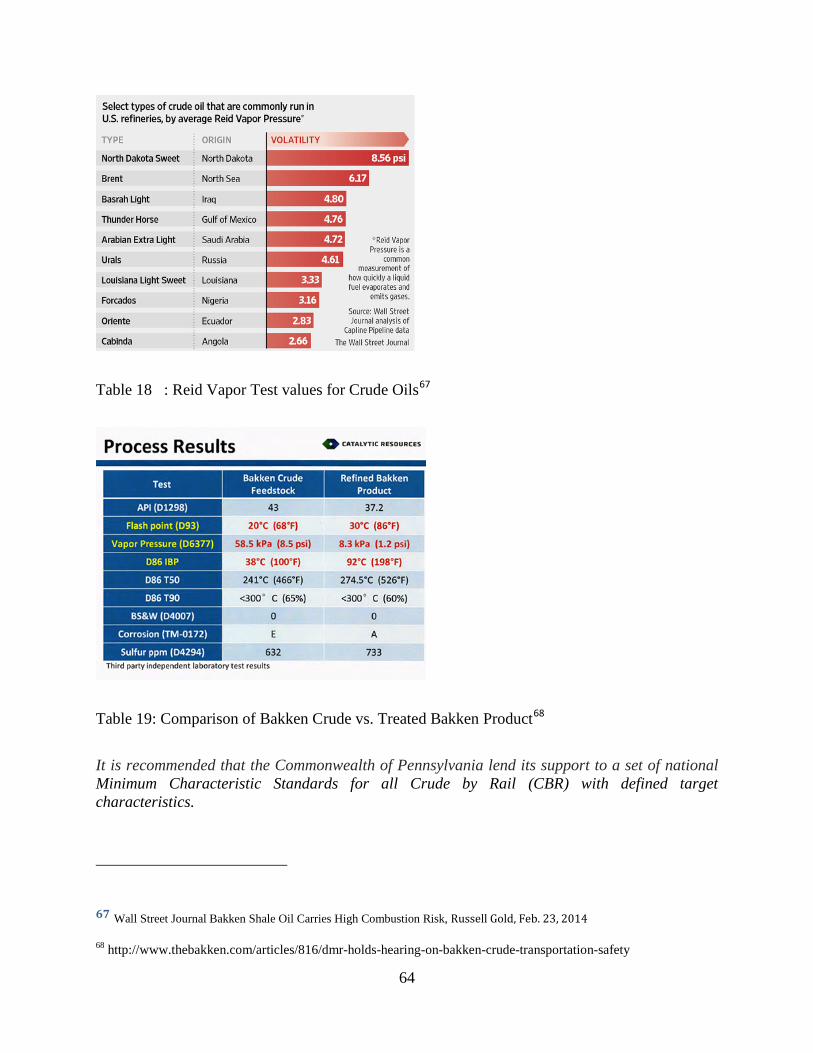
64
Table 18 : Reid Vapor Test values for Crude Oils67
Table 19: Comparison of Bakken Crude vs. Treated Bakken Product68
It is recommended that the Commonwealth of Pennsylvania lend its support to a set of national Minimum Characteristic Standards for all Crude by Rail (CBR) with defined target characteristics.
67 Wall Street Journal Bakken Shale Oil Carries High Combustion Risk, Russell Gold, Feb. 23, 2014 68 http://www.thebakken.com/articles/816/dmr-holds-hearing-on-bakken-crude-transportation-safety
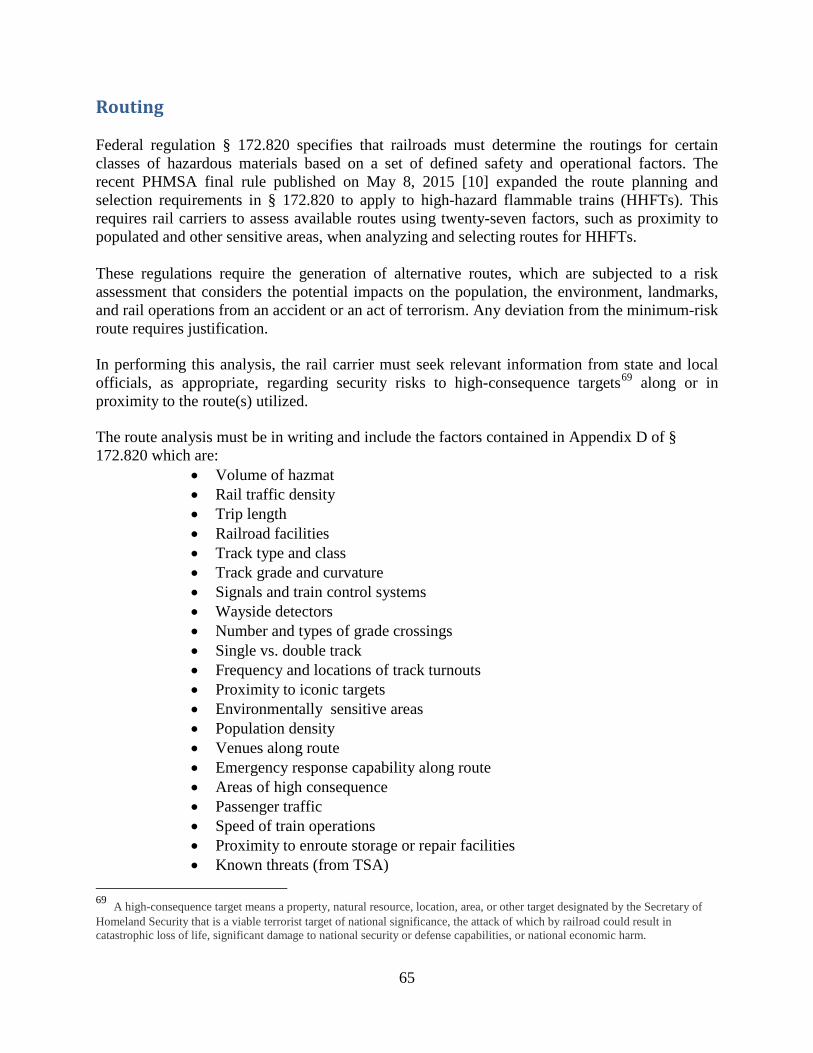
65
Routing Federal regulation § 172.820 specifies that railroads must determine the routings for certain classes of hazardous materials based on a set of defined safety and operational factors. The recent PHMSA final rule published on May 8, 2015 [10] expanded the route planning and selection requirements in § 172.820 to apply to high-hazard flammable trains (HHFTs). This requires rail carriers to assess available routes using twenty-seven factors, such as proximity to populated and other sensitive areas, when analyzing and selecting routes for HHFTs. These regulations require the generation of alternative routes, which are subjected to a risk assessment that considers the potential impacts on the population, the environment, landmarks, and rail operations from an accident or an act of terrorism. Any deviation from the minimum-risk route requires justification. In performing this analysis, the rail carrier must seek relevant information from state and local officials, as appropriate, regarding security risks to high-consequence targets69 along or in proximity to the route(s) utilized. The route analysis must be in writing and include the factors contained in Appendix D of § 172.820 which are:
• Volume of hazmat • Rail traffic density • Trip length • Railroad facilities • Track type and class • Track grade and curvature • Signals and train control systems • Wayside detectors • Number and types of grade crossings • Single vs. double track • Frequency and locations of track turnouts • Proximity to iconic targets • Environmentally sensitive areas • Population density • Venues along route • Emergency response capability along route • Areas of high consequence • Passenger traffic • Speed of train operations • Proximity to enroute storage or repair facilities • Known threats (from TSA)
69 A high-consequence target means a property, natural resource, location, area, or other target designated by the Secretary of Homeland Security that is a viable terrorist target of national significance, the attack of which by railroad could result in catastrophic loss of life, significant damage to national security or defense capabilities, or national economic harm.

66
• Measures in place to address safety and security risks • Availability of alternative routes • Past incidents • Overall time in transit • Training and skill level of crews • Impact on rail network traffic and operations
The rail carrier must complete the initial process by March 31, 2016 for HHFTs. The analysis can use data for the six month period from July 1, 2015 to December 31, 2015 or for all of 2015 calendar [10].
Based on the above it is recommended that CSX and NS complete their initial route analysis of HHFT routes in Pennsylvania as quickly as possible, taking into account proximity to populated areas and safety considerations as outlined above. It is further recommended that the Commonwealth of Pennsylvania designate appropriate state and local officials to work with CSX and NS to provide all needed information and to assist in the route analysis.

67
State Regulatory Oversight The U.S. Department of Transportation, Federal Railroad Administration (FRA), has primary responsibility for rail safety and inspection. The 1970 federal law preempted rail safety regulation by individual states because Congress concluded that rail safety would be best served by a set of nationally set standards, instead of subjecting railroads to a variety of standards in 50 states. Congress then delegated railroad safety to the FRA, and specifically provided that the FRA regulations preempt all conflicting state laws and regulations. 49 U.S.C. Section 20106. The FRA Office of Safety has responsibility for promoting and regulating safety throughout the railroad industry. It executes its regulatory and inspection responsibilities through a staff of railroad safety experts which includes 400 Federal safety inspectors who operate out of eight regional offices. Pennsylvania is located with Region Two which is headquartered in the Philadelphia metropolitan area (Crum Lynne, PA). Each regional administrator is supported by two deputy regional administrators, chief inspectors, supervisory specialists, grade crossing safety managers and safety inspectors for five of the safety disciplines focusing on compliance and enforcement in:
• Hazardous Materials • Motive Power and Equipment • Operating Practices • Signal and Train Control • Track
Other Office of Safety functions include:
• Railroad safety and customer training (including State safety inspectors) • Accident and employee fatality investigations and reporting • Partnerships between labor, management, and the agency that address systemic initiatives • Development and implementation of safety rules and standards
The Rail State Safety Participation Program is the program that allows states to employ safety inspectors in the five rail safety inspection disciplines noted above. These state inspectors work with and supplement FRA safety inspectors, though they do not have any direct enforcement authority. State inspectors must submit any defects or violations through the FRA for follow up and enforcement. 30 states participate in the Rail State Safety Participation Program with approximately 179 state inspectors nationwide, with an average of 6 per state. Thus participating states provide more than 30% of the total federal and state rail inspection staff resources. FRA provides training to the state inspectors in their assigned safety discipline. Pennsylvania is a current participant of this program with a staff of seven inspectors and one supervisor who manages the FRA program. Within the Commonwealth of Pennsylvania, rail safety and inspection falls under the Public Utility Commission’s Rail Safety Section which is part of the PUC Transportation Division, which in turn is part of the Bureau of Technical Utility Services.
The Rail Safety section has two distinct groups:
68
• Rail Safety Inspections consisting of one supervisor who manages the FRA Program and a staff of seven (7) inspectors.
• Rail Safety Engineering consisting of one supervisor who manages a staff of six (6) professional engineers. The Safety Engineering staff focuses on grade crossing safety and has exclusive jurisdiction over the construction, relocation, suspension and abolition of public highway-railroad crossings
PUC Rail Safety Inspectors specialize in one of the five specific railroad disciplines and are certified by the FRA. Current staff includes:
• Two motive power and equipment inspectors who focus on railway cars and locomotives
• One operating practices inspector (a second is in the process of being hired) who focuses on crew qualifications, operating practices and adherence to safety rules and practices.
• One hazardous materials inspector who focuses on hazardous material shipments, placarding, and safe handling practices, etc.
• One signal and train control inspector who focuses on signals and train control systems.
• Two track inspectors (the eastern position is currently vacant) who focus on track and infrastructure.
Under a state-FRA agreement (per the provision of the Federal Railroad Safety Act of 1970), the Rail Safety inspectors enforce regulations promulgated by the FRA. While the FRA had originally provided funding for that service, FRA funding has decreased over time to currently zero at the state level. Rail Safety inspectors spend 80% of their time performing railroad inspections within their specific disciplines. The remaining 20% of their time includes filing inspection reports, writing violations and scheduling. Inspection reports and violations are prepared and submitted securely by the inspector to the FRA utilizing FRA issued laptop computers and software. As noted above, the PA PUC has no enforcement authority regarding potential rail safety violations. That enforcement authority resides with the FRA and any potential violations observed by the PUC Inspectors are turned over to FRA for further review and potential enforcement actions. PUC Inspectors interface with FRA Inspectors in each of their disciplines. The working locations of each inspector are determined to ensure that areas of the state are not neglected. State inspectors and the FRA inspectors have territories that overlap to ensure maximum inspection coverage. The inspection of rail by either a PUC Rail Safety Inspector or an FRA Inspector requires the physical presence of appropriate railroad company personnel.
PUC assists FRA in investigations of derailments, track inspection record checks, drug and alcohol record checks, and hours of service records.
69
The PUC has reported that it has found it difficult to attract qualified candidates for inspector positions who have the required railroad experience. One obstacle is the pay level associated with these positions, which is one of the lowest in the country for this type of position. Several neighboring states have state inspector programs, with the largest national state programs being California, New York and Texas. New Jersey and Connecticut have active state programs with smaller programs in Maryland. Delaware does not have a state program. The State of New York has 13 inspectors covering 4,860 miles of track. Last year (2014), NY state agencies conducted a coordinated review of safety procedures and emergency response preparedness related to increased shipments of Bakken crude across nearly 1,000 route miles of New York State. The agencies issued a report in April 2014 containing 27 recommendations for state government, federal government and industry to take to reduce risks and increase public safety in the transport of crude oil. The specific state action items included multiple recommendations on emergency preparedness and response together with several rail safety measures including:
o Expand the railroad inspection program with five additional inspectors and use of automated flaw detection equipment.
o Improve rail incident reporting requirements and ensure compliance through stronger statutes, to include fines for failure to swiftly notify state officials after a derailment.
In addition, NY State and emergency response officials increased the number of emergency response training exercises. The Governor also increased the state’s Oil Spill Fund cap to $40 million from $25 million by increasing the state’s oil transport fees from 12 cents a barrel to 13.5 cents per barrel (regardless of the final destination of the oil) and allowing up to $2.1 million of the Fund annually to be used for prevention and preparedness measures. The NY 2015 state budget included up to $2.1 million to plan and prepare for potential crude oil incidents and provided funding for an additional eight employees at the state's Department of Environmental Conservation plus six more employees at the NY State Office of Fire Prevention and Control. The Governor also created a State Fire Foam resources budget to try and effectively make crude oil type firefighting equipment more available across the state. The state, in Coordination with the FRA conducted a round of safety blitz actions which focused on crude oil tank car and rail inspections. New Jersey has 18 freight railroads covering 983 miles across the state, ranking it 40th by mileage. There are more than five refineries/oil terminals in heavily populated sections of New Jersey that today receive Bakken crude or Alberta crude. New Jersey is a participant in the FRA-State Rail Program and has several state employees authorized to inspect railway tracks and railway cars for FRA related safety defects. The track inspectors can also inspect private railway terminal tracks (with small yards). It also has the following rail safety related activity areas:
• NJDOT administers a Placarded Rail Car Safety Inspection Program through its Bureau of Freight Services.

70
• NJDOT’s Emergency Response Groups facilitate planning for emergency actions for handling rail hazardous material emergencies.
• NJDOT’s Railroad Engineering and Safety Unit is responsible for all reviews and programs involving changes and improvements to all public rail / highway crossings in New Jersey.
The State of New Jersey charges private rail terminals a fee for the inspection of their rail track sites and this helps to fund the state’s inspection program. The State of Connecticut employs both track and rail equipment inspectors and also was among the first states to develop a railroad bride inspection program. There are no crude oil trains routed to or through Connecticut. Connecticut owns tracks that the private railroads operate upon; there are 8 freight railroad companies operating over tracks owned by ConnDOT. As such it has direct responsibility for track and bridges to include ConnDOT's Railroad Bridge Management Program which falls under 49 CFR Parts 213 & 237, Bridge Safety Standards. Because of this bridge responsibility ConnDOT developed an extensive 300 plus page program manual for railroad bridges. The State of California has the largest of the State Inspection Programs with California Public Utilities Commission (CPUC) being the State agency charged with ensuring the safety of freight railroads, inter-city and commuter railroads. CPUC performs these railroad safety responsibilities through the Railroad Operations and Safety Branch (ROSB) of the Safety and Enforcement Division. ROSB’s mission is to ensure that California communities and railroad employees are protected from unsafe practices on freight and passenger railroads by enforcing state and federal rail safety rules, regulations, and inspection efforts. ROSB personnel carry out inspections, investigate rail accidents and safety related complaints, and recommend safety improvements to the Commission, railroads, and the federal government as appropriate, all as part of the state-FRA program. ROSB has 45 certified Inspector positions with the following specialties.
Operating Practices – enforcing regulations for main, branch and yard train operations, including hours of service, operating rules, employee qualification guidelines, and carrier training and testing programs, accident and personal injury reporting requirements, etc. Track inspections enforcing regulations for track construction, maintenance and inspection activities. Signal & Train Control – enforce safety rules on signal system construction, maintenance and inspection activities. Motive Power & Equipment – enforce safety rules on locomotives, freight and passenger rail cars, air brakes, and other safety appliances maintenance and inspection activities. Hazardous Materials – enforcing regulations for rail movements of hazardous materials, such as petroleum and chemical products, Crude By Rail, and inspection of hazardous materials shippers. Railroad Bridge Evaluation Program (RBEP) – This is the second state-run railroad bridge safety program (Connecticut was the first).
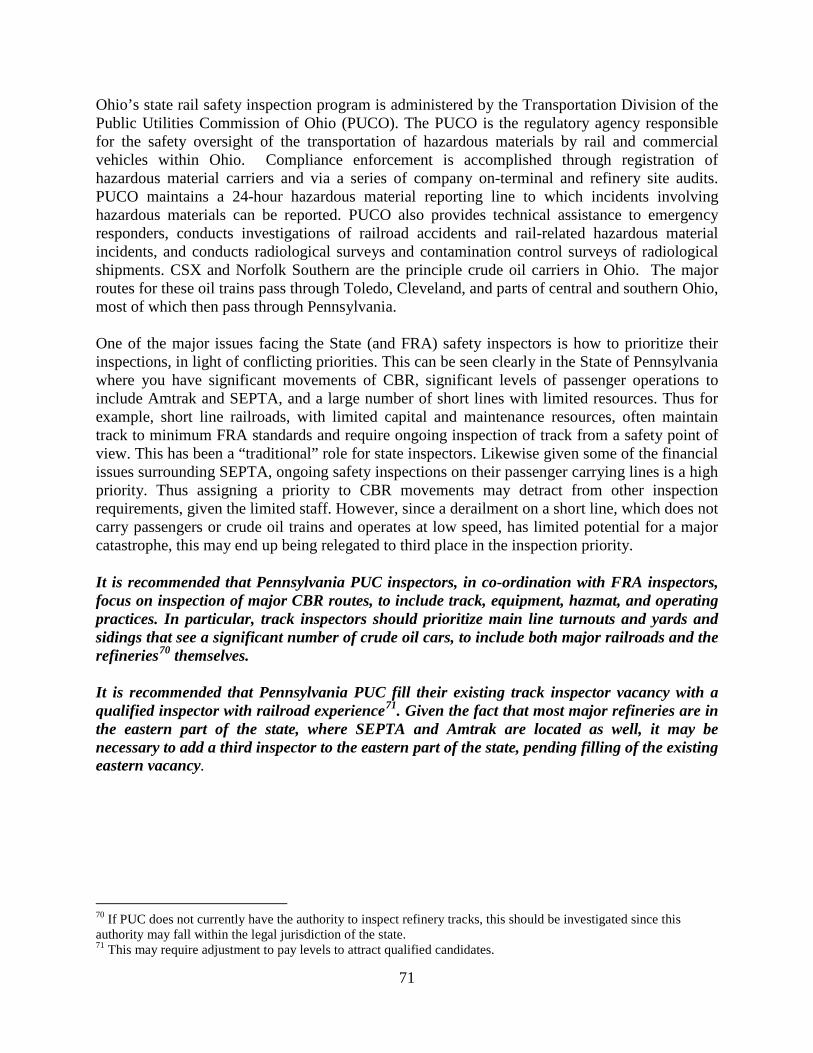
71
Ohio’s state rail safety inspection program is administered by the Transportation Division of the Public Utilities Commission of Ohio (PUCO). The PUCO is the regulatory agency responsible for the safety oversight of the transportation of hazardous materials by rail and commercial vehicles within Ohio. Compliance enforcement is accomplished through registration of hazardous material carriers and via a series of company on-terminal and refinery site audits. PUCO maintains a 24-hour hazardous material reporting line to which incidents involving hazardous materials can be reported. PUCO also provides technical assistance to emergency responders, conducts investigations of railroad accidents and rail-related hazardous material incidents, and conducts radiological surveys and contamination control surveys of radiological shipments. CSX and Norfolk Southern are the principle crude oil carriers in Ohio. The major routes for these oil trains pass through Toledo, Cleveland, and parts of central and southern Ohio, most of which then pass through Pennsylvania. One of the major issues facing the State (and FRA) safety inspectors is how to prioritize their inspections, in light of conflicting priorities. This can be seen clearly in the State of Pennsylvania where you have significant movements of CBR, significant levels of passenger operations to include Amtrak and SEPTA, and a large number of short lines with limited resources. Thus for example, short line railroads, with limited capital and maintenance resources, often maintain track to minimum FRA standards and require ongoing inspection of track from a safety point of view. This has been a “traditional” role for state inspectors. Likewise given some of the financial issues surrounding SEPTA, ongoing safety inspections on their passenger carrying lines is a high priority. Thus assigning a priority to CBR movements may detract from other inspection requirements, given the limited staff. However, since a derailment on a short line, which does not carry passengers or crude oil trains and operates at low speed, has limited potential for a major catastrophe, this may end up being relegated to third place in the inspection priority. It is recommended that Pennsylvania PUC inspectors, in co-ordination with FRA inspectors, focus on inspection of major CBR routes, to include track, equipment, hazmat, and operating practices. In particular, track inspectors should prioritize main line turnouts and yards and sidings that see a significant number of crude oil cars, to include both major railroads and the refineries70 themselves. It is recommended that Pennsylvania PUC fill their existing track inspector vacancy with a qualified inspector with railroad experience71. Given the fact that most major refineries are in the eastern part of the state, where SEPTA and Amtrak are located as well, it may be necessary to add a third inspector to the eastern part of the state, pending filling of the existing eastern vacancy.
70 If PUC does not currently have the authority to inspect refinery tracks, this should be investigated since this authority may fall within the legal jurisdiction of the state. 71 This may require adjustment to pay levels to attract qualified candidates.
72
Emergency Management The Pennsylvania Emergency Management Agency (PEMA) is responsible for emergency preparedness and response for movement of crude oil across the commonwealth. PEMA works with county and local emergency managers to insure a state of readiness to respond to these emergencies. PEMA has received funding from different sources to include State, DOT and railroad for hazardous material emergency response training and preparedness. It has coordinated training exercise for emergency responders. Key issues in Emergency Management and response to potential CBR derailments include: Information sharing to include routes and hazardous material cargo. Both CSX and NS are rolling out information sharing technology tools, in the form of mobile aps, for emergency responders. These tools are designed to minimize any delay in getting critical information to emergency responders, without the need for them to try to get into the locomotive where the train manifest is usually kept. PEMA is also part of the SecureNOW partnership for information transfer to include near real time tracking and identification of trains and commodities and is actively working with the railroads and Pennsylvania first responders to implement the railroad supplied tools “Secure Now” and “AskRail”. It is recommended that PEMA continue to actively work with both railroads to roll out information sharing technology tools and make these tools available to all emergency responders on CBR routes (PEMA is actively working in this area). PEMA also currently maintains a 24-hour hazardous material reporting line to which incidents involving hazardous materials can be reported. PEMA maintains 24 hour communications with the 67 county emergency management agencies and 9-1-1 centers across the state which coordinate the initial emergency response to an incident involving rail-based crude transport. PEMA maintains on-going communications with the county emergency managers and through them with the Local Emergency Planning Committees (LEPC) created under Act 1990-165 to identify resource needs as well as equipment staging areas with NS and CSX for resource coordination. Training is another key element in emergency management. PEMA personnel and local emergency managers have attended specialized training given by the railroads as well as by the AAR in Pueblo Colorado. Part of this training includes exercises, to include both table-top and full scale exercises. It is recommended that PEMA coordinate full scale emergency response exercise involving emergency responders from communities along the key oil train routes.
73
Emergency response plans are necessary at both the State and local (country, community) level. Some communities, such as Lancaster County72 have developed detailed emergency response plans. It is recommended that PEMA work with and insure that all communities along the CBR routes have appropriate emergency response plans. Equipment is another element of emergency response. PEMA should coordinate with railroads and DOT to determine optimum equipment requirements for communities. It should also coordinate with the railroads regarding the railroad’s bringing on site to emergency, specialized equipment, so that they can determine appropriate levels of response. This includes knowledge of the individual railroad’s inventory of emergency response resources along routes over which Crude Oil Trains operate for responding to the release of large amounts of petroleum crude oil in the event of an incident. This also include locations for the staging of emergency response equipment and, where appropriate, contacts for the notification of communities. As noted above, PEMA works with the county emergency managers and through them the Local Emergency Planning Committees (LEPC) created under Act 1990-165 to identify resource needs as well as equipment staging areas with NS and CSX for resource coordination. It is recommended that PEMA work with NS and CSX to obtain an inventory of emergency response resources along routes over which Crude Oil Trains operate to include locations for the staging of emergency response equipment (PEMA is actively working in this area).
72 Testimony of Lancaster County Commissioner and Director of the County’s Emergency management Agency to the Joint Hearing of the Pennsylvania Senate Transportation and Environmental Resources and Energy Committees on June 9, 2015.
74
Recent Improvements in Practice Attached is a partial list of recent improvements in practice relating to operations of CBR trains and inspection and maintenance of track, rolling stock, etc. FRA (For HHFTs)
o Maximum speed of 40 mph in HTUA o For trains with 20 or more flammable liquid cars in a single block, or 35 such
cars anywhere in the train, o Maximum of 50 mph elsewhere o All new tank cars to be built to DOT-117 standards
o Old tank cars to be updated to DOT-117R standards AAR For the movement of trains transporting 20 or more loaded railroad tank cars containing petroleum crude oil (Key Crude Oil Trains). • Railroad Subscribers commit to continue to adhere to a speed restriction of 50 mph for any Key Crude Oil Trains
• Railroad Subscribers will adhere to a speed restriction of 40 mph for any Key Crude Oil Train with at least one “DOT Specification 111” tank car loaded with crude oil or one non-DOT specification tank car loaded with crude oil while that train travels within the limits of any high-threat urban area
• Railroad Subscribers will equip all Key Crude Oil Trains operating on main track with either distributed power locomotives or an operative two-way telemetry end of train device. • Railroad Subscriber will perform at least one additional internal rail inspection than is required by 49 C.F.R. § 213.237 (c) each calendar year on main line routes it owns or has been assigned responsibility for maintaining over which Key Crude Oil Trains are operated. • Railroad Subscriber will conduct at least two track geometry inspections each calendar year on main line routes it owns or is responsible for maintaining over which Key Crude Oil Trains are operated. • Railroad Subscriber will install wayside defective bearing detectors at least every 40 miles along main line routes it owns or has been assigned responsibility for maintaining over which Key Crude Oil Trains are operated unless track configuration or other safety considerations dictate otherwise. • AAR and Railroad Subscribers will commence the development of an inventory of emergency response resources along routes over which Key Crude Oil Trains operate for responding to the release of large amounts of petroleum crude oil in the event of an incident.
• This inventory will include locations for the staging of emergency response equipment and, where appropriate, contacts for the notification of communities.
• Upon completion of the inventory, the Railroad Subscribers will provide DOT with access to information regarding the inventory and will make relevant information from the inventory available to appropriate emergency responders upon request.

75
BNSF • Lowering speeds to 35 miles per hour for all shale crude oil trains through municipalities
with populations of 100,000 or more • Increased rail detection testing frequencies along critical waterways, going to 2.5x
current FRA mandated frequencies • Increased Trackside Safety Technology as follows:
Increased Hot Box Detector (HBD) spacing of 10 miles on crude routes that Parallel critical waterways, as opposed to the current industry standard spacing of 40 miles
o Mandatory set out of all HBD indicated cars on Key Trains stopped by HBD. • Immediate set-out of all cars on Key Trains that exceed Level II Wheel Impact Load
Detector (WILD) defect (120 – 140 (Kips)) – to be handled as a LEVEL I defect. • Improved Emergency Response Training & Community Outreach as follows:
o Introduction of a formal community outreach initiative. o Introduction of a real-time Geographic Information System (GIS) tracking
application for state emergency-response agencies. NS
o Maximum speed of 40 mph in HTUA for any train with 20 or more flammable liquid cars, irrespective of whether those cars are in a single block.
o Rail defect testing as often as six times per year on some line segments in Pennsylvania, and a minimum of three times per year on line segments carrying Bakken Crude.
o Track geometry car testing on crude oil routes in Pennsylvania four times a year. o Hot box detector average spacing on crude oil routes in Pennsylvania of 12.2 miles,
and maximum interval of 23 miles. o WILD wheel i m p a c t alerts for all crude oil trains operating in Pennsylvania set to
120 Kips o Trains reduce speed to 30 mph and alerting car set out at an appropriate repair
location. o Wheel sets on crude oil trains with impacts greater than 90 Kips are replaced
when they go in for 1500-mile brake test inspections at Conway Yard facility. CSX
o Track inspectors conduct visual inspections at least three times a week on crude oil routes.
o Track geometry car testing on average times a year. o Designates upgraded yard landing tracks where loaded crude oil unit trains are staged and
inspects these tracks twice a month. o WILD wheel i mp a c t alerts for all HHFTs set to 120 Kips
o Train stopped safely, wheel is inspected and alerting car set out until repairs can be made.
o Cars in HHFTs with greater than 90 Kip alert are flagged and routed to repair shops when empty.

76
o Rail defect testing on crude oil routes of a minimum of three times per year on line segments carrying Bakken Crude.
o Hot box detector average spacing on crude oil routes in Pennsylvania of 12.2 miles, and maximum interval of 23 miles.
o Super sites with WILDS, hot bearing detectors, wheel profile detectors, optical geometry detectors, acoustic bearing detectors, and lateral strain gauges to provide lateral force measurements.
77
Recommendations Recommendations as presented in this report as divided into primary and secondary categories. Primary categories are those expected to have direct safety results and which can be implemented by the railroads directly working with the Commonwealth of Pennsylvania or by the Commonwealth itself. Secondary categories are more difficult to implement or may require action by a party other than the railroad or Commonwealth of Pennsylvania. Primary Recommendations
Railroad
1. It is recommended that the routes over which CBR trains operate in Pennsylvania be tested at a rate such that the service defect rate is maintained at 0.04 to 0.06 service failures/mile/year. In all cases, rail on these routes should be tested no less than three times a year.
2. It is recommended that the routes over which CBR trains operate in Pennsylvania be
tested by a railroad owned Track Geometry Car at a minimum of four times a year.
3. It is recommended that the routes over which CBR trains operate in Pennsylvania be tested by a vision based joint bar inspection system at least once per year, this test to be in lieu of one of the required on-foot inspections, as permitted by FRA.
4. It is recommended that NS and CSX adopt the BNSF voluntary speed reduction to 35
mph for crude oil trains through cities with a population greater than 100,000 people.
5. It is recommended that the railroad have sufficient WILD units in place to monitor all loaded oil train cars along their entire route within Pennsylvania, such that any track location on an oil train route within the state should have a WILD unit no more than 200 miles73 preceding74 (in the loaded direction) that location.
a. It is recommended that if a WILD measurement exceeds 120 Kips, the train should be safely stopped, the wheel inspected, and then if condition of the wheel allows, the train proceed at a reduced speed of 30 mph until the alerting car can set out at an appropriate location until repairs are made.
b. If the WILD measurement is greater than 90 Kips, the car should be flagged and the identified wheels replaced as soon as possible but no later than 1500 miles of additional travel.
6. It is recommended that the railroads have sufficient Hot Bearing Detector (HBD)
units in place as to monitor all loaded oil train cars along their entire route within Pennsylvania, with a maximum spacing of 25 miles between Hot Box detectors.
73 Based on 100,000 cycles of loading and a 36 inch wheel diameter. 74 To monitor a loaded CBR train’s wheels before it arrives at that given location.

78
7. It is recommended that the railroad have at least one Acoustic Bearing Detector unit
in place to monitor all loaded oil trains along their entire route within Pennsylvania.
8. It is recommended that those yards and sidings that handle a significant number of CBR cars be inspected by the Railroad inspectors at a level of track tighter than the assigned FRA track class. Thus Yards that are FRA Class 1 should be inspected at a FRA Class 2 level to provide railroads with early warning of potential track conditions that can cause problems.
9. It is recommended that oil trains in Pennsylvania, not equipped with ECP Brakes, use
two way end of train devices (TWEOT) or Distributed Power (DP) to improve braking performance.
10. It is recommended that CSX and NS complete their initial route analysis of HHFT
routes in Pennsylvania as quickly as possible, taking into account proximity to populated areas and safety considerations as outlined by DOT.
Commonwealth of Pennsylvania
11. It is recommended that the Commonwealth of Pennsylvania designate appropriate state and local officials to work with CSX and NS to provide all needed information and to assist in the route analysis.
12. It is recommended that Pennsylvania PUC inspectors, in co-ordination with FRA
inspectors, focus on inspection of major CBR routes, to include track, equipment, hazmat, and operating practices. In particular, track inspectors should prioritize main line turnouts and yards and sidings that see a significant number of crude oil cars, to include both major railroads and the refineries75 themselves.
13. It is recommended that the Pennsylvania Public Utility Commission (PUC) and their
track inspectors which are part of the PUC’s Transportation Division coordinate with the Federal Railroad Administration and try to schedule the FRA’s T-18 GRMS test vehicle to inspect all routes over which CBR trains operate in Pennsylvania at least once a year. This test should include both GRMS and conventional track geometry measurements.
14. It is recommended that Pennsylvania PUC fill their existing track inspector vacancy
with a qualified inspector with railroad experience76. Given the fact that most major refineries are in the eastern part of the state, where SEPTA and Amtrak are located as well, it may be necessary to add a third inspector to the eastern part of the state, pending filling of the existing eastern vacancy.
75 If PUC does not currently have the authority to inspect refinery tracks, this should be investigated since this authority may fall within the legal jurisdiction of the state. 76 This may require adjustment to pay levels to attract qualified candidates.

79
15. It is recommended that PEMA continue to actively work with both railroads to roll out
information sharing technology tools and make these tools available to all emergency responders on CBR routes (PEMA is actively working in this area).
16. It is recommended that PEMA coordinate full scale emergency response exercise
involving emergency responders from communities along the key oil train routes.
17. It is recommended that PEMA work with and insure that all communities along the CBR routes have appropriate emergency response plans.
18. It is recommended that PEMA work with NS and CSX to obtain an inventory of
emergency response resources along routes over which Crude Oil Trains operate to include locations for the staging of emergency response equipment (PEMA is actively working in this area).
Secondary Recommendations
Railroad
19. It is recommended that conventional track geometry car tests on routes over which CBR
trains operate in Pennsylvania be supplemented by ATGM and/or VTI measurement systems.
20. It is recommended that NS and CSX verify that they have sufficient Hot Wheel Detectors on the Oil Train Routes to allow for the identification of overheated wheels on terrain where this can be a cause of wheel failure.
21. It is recommended that the railroad have at least one Truck Defect Detector or
equivalent77 in place to monitor all loaded oil train cars along their entire route within Pennsylvania.
Commonwealth of Pennsylvania
22. It is recommended that the Commonwealth of Pennsylvania encourage both NS and CSX
to implement PTC on Oil train routes in the Commonwealth as expeditiously as possible, in accordance with government mandated schedules.
23. It is recommended that State of Pennsylvania Track inspectors focus attention on the
condition of turnouts on major CBR routes in the state.
24. It is recommended that Pennsylvania state inspectors include yards and sidings that handle a significant number of CBR cars as part of their inspection program. All such inspections to be coordinated with the FRA inspection program.
77 Such as a lateral Load measurement system
80
25. It is recommended that the Commonwealth of Pennsylvania lend its support to a set of
national Minimum Characteristic Standards for all Crude by Rail (CBR) with defined target characteristics.
26. It is recommended that Pennsylvania PUC coordinate with FRA and NS and CSX
Bridge Departments to insure that the railroads are maintaining a Bridge Safety Management Program in accordance with 49 CFR 237.
27. It is recommended that the Commonwealth of Pennsylvania lend its support to
increasing the tank car thermal protection standard to 800 minutes for a pool fire.
81
References 1. Zarembski, A.M., Palese, J.P., “Characterization of Broken Rail Risk for Freight and Passenger
Railway Operations”, 2005 AREMA Annual Conference, Chicago, IL, September 25-28, 2005 2. Orringer, O., “Control of Rail Integrity By Self-Adaptive Scheduling of Rail Tests”, US
Department of Transportation Federal Railroad Administration Report, DOT/FRA/ORD-90/) 05, June 1990.
3. Palese, Joseph W., Wright Thomas W., “Risk-Based Ultrasonic Rail Test Scheduling on Burlington Northern Santa Fe”, American Railway Engineering Maintenance Association Annual Technical Conference, 2000.
4. Zarembski, A.M., Palese, J.W., “Risk Based Ultrasonic Rail Test Scheduling: Practical Applications in Europe and North America, Conference Contact Mechanics and Wear of Rail/Wheel Systems (CM2003), Gothenburg, Sweden, June 2003.
5. Zarembski, A.M., “Development of Guidelines for Broken Rail Risk”, Railway Track & Structures, October 2009
6. Zarembski, A.M., “Management of Broken Risk for High Speed Passenger Rail”, ASME/IEEE/AREMA Joint Rail Conference 2010, Urbana, IL, April 2010.
7. Zarembski, A. M. and Kerchof, B., “Development of Hand Gauges for Inspection of Switch Points to Prevent Wheel Climb” Railway Track and Structures, July 2014.
8. Zarembski, A.M., Palese, J.W., Euston, T.L., Scheiring, W.R., “Development and Implementation of Automated Switch Inspection Vehicle”, 2011 AREMA Annual Conference, Minneapolis, MN, September 2011
9. Department of Transportation Pipeline and Hazardous Materials Safety Administration 49 CFR Parts 171, 172, 173, 174, and 179 [Hazardous Materials: Enhanced Tank Car Standards and Operational Controls for High-Hazard Flammable Trains AGENCY: Notice of proposed rulemaking, August 1, 2014
10. Department of Transportation Pipeline and Hazardous Materials Safety Administration 49 CFR Parts 171, 172, 173, 174, and 179 [Hazardous Materials: Enhanced Tank Car Standards and Operational Controls for High-Hazard Flammable Trains: Final Rule, May 8, 2015
11. Federal Railroad Administration Emergency Order 30 Notice 1, Emergency Order Establishing a Maximum Operating Speed of 40 mph in High-Threat Urban Areas for Certain trains Transporting large Quantities of Class 3 Flammable Liquids.
12. Sharma and Associates, Objective Evaluation of Risk Reduction from Tank Car Design and Operations Improvements, Letter Report to Federal Railroad Administration, July 2014.
13. Jeong, D. Y., “Probabilistic Approach to Conditional Probability of Release of Hazardous Materials From Railroad Tank Cars During Accidents”, Proceedings of 2009 ASME International Mechanical Engineering Congress and Exposition November 13-19, Lake Buena Vista, Florida, USA.
14. Aeppli, A, and Little, P. “Analysis of Tank Car Fleet Options and Retrofitting Capacity”, Cambridge Systematics Report to the White House Office of Management and Budget, March, 2015 [ CPR Data]
15. Comments of the Greenbrier Companies, Inc. to the Pipeline and Hazardous Materials Safety Administration 49 CFR Parts 171, 172, 173, 174, and 179 [Hazardous Materials: Enhanced Tank Car Standards and Operational Controls for High-Hazard Flammable Trains : Notice of Proposed Rulemaking, August 1, 2014.
82
16. National Transportation Safety Board, “Safety Recommendation R-15-14”, April 3, 2015 17. Alliance for Innovation and Infrastructure. “Back on Track: Bringing Rail Safety to the 21st
Century”, August 6, 2015.

83
Glossary Association of American Railroads (AAR) Industry Association of American Railroads Autonomous Track Geometry Measurement (ATGM) System is an unattended vehicle based track geometry inspection system, for inspection of track geometry from revenue service trains. Conditional Probability of Release (CPR) is defined as the probability that release of hazardous material from a railroad tank car will occur given that an accident (e.g., a train derailment or a car-to-car collision) has already occurred. Distributed Power is the physical distribution—at intermediate points throughout the length of a train—of separate locomotives or groups of locomotives that are remotely controlled from the leading locomotive at the head of the train. Federal Railroad Administration (FRA) is agency of the US Department of Transportation (DoT) with responsibility for railroad safety Frog, also known as the common crossing or V-Rail, refers to the crossing point of two rails, usually fabricated out of several appropriately cut and bent pieces of rail or made as a single casting (usually of manganese steel). Gage Restraint Measurement System (GRMS) is an inspection system that measures the ability of the track to maintain gauge under controlled lateral and vertical loads using a specially designed track loading system. Hazardous material route (per new 213.237 rule March 2014) is track over which a minimum of 10,000 carloads or intermodal portable tank car loads of hazardous materials as defined in 49CFR 171.8 travel over a period of one calendar year or track over which 4,000 carloads or intermodal portable tank car loads of the hazardous materials specified in 49CFR 172.820 travel, in a period of one calendar year. High-hazard flammable train (HHFT) is a single train transporting 20 or more loaded tank cars of a Class 3 flammable liquid in a continuous block or a single train carrying 35 or more loaded tank cars of a Class 3 flammable liquid throughout the train consist High-hazard flammable unit train (HHFUT) is a single train transporting 70 or more loaded tank cars containing Class 3 flammable liquid. Hot Box Detectors (HBD), also referred to as Hot Bearing Detectors, are measuring devices installed along the railroad right of way to monitor axle bearing axle temperatures to identify overheating bearings. Machine Vision Joint Bar Inspection System is a machine vision based inspection technology to inspect joint bars for cracks and other defects.
84
Main line or mainline of a railway is a main track that is used for through trains or is the principal artery of the system from which branch lines, yards, sidings and spurs are connected. Million Gross Tons (MGT) is a measure of traffic carried by a segment of track. Thus 100 trains, each weighing 10,000 tons, would generate 1 million gross tons of traffic or 1 MGT. Pipelines and Hazardous Material Safety Administration (PHMSA) is agency of US Department of Transportation responsible for safety of hazardous material transportation in US. Tank Car Jacket refers to an exterior metal jacket of the tank car that is separate from and outside of the tank car shell itself. Track Gage or Gauge is the distance between the rails measured between the heads of the rails at right angles to the rails in a plane five-eighths of an inch below the top of the rail head. Standard gauge in North America is 4 feet, 8.5 inches. Track Geometry is the three-dimensional geometry of track and associated measurements used in design, construction and maintenance of railroad tracks. Track Geometry Car (also known as a track recording car) is an automated track inspection vehicle used to test track geometry parameters without obstructing normal railroad operations. Track Speed as used in this report refers to the regularly scheduled speed for that train. It can also refer to the maximum train running speed limit as defined by the designated FRA Track Class. Train Consist are the coupled vehicles making up a train. Turnout (also referred to as a switch) is a track installation enabling railway trains to be guided from one track to another. Vehicle/Track Interaction (VTI) monitoring system is an autonomous, locomotive or car mounted inspection system that measure accelerations and forces and is designed to detect track conditions that can lead to poor vehicle performance or potential derailment conditions. Wheel Impact Load Detector (WILD) is a track mounted wheel inspection device that measure the impact load generated by each wheel of a passing train.