Embed Size (px)
Citation preview
! 1
922 Registered Hawaii Voters, Margin of Error, 3.2%(Including 614 Registered Oahu Voters, Margin of Error, 4.0%)70% Landlines, 30% CellphonesJanuary 26-29, 2016
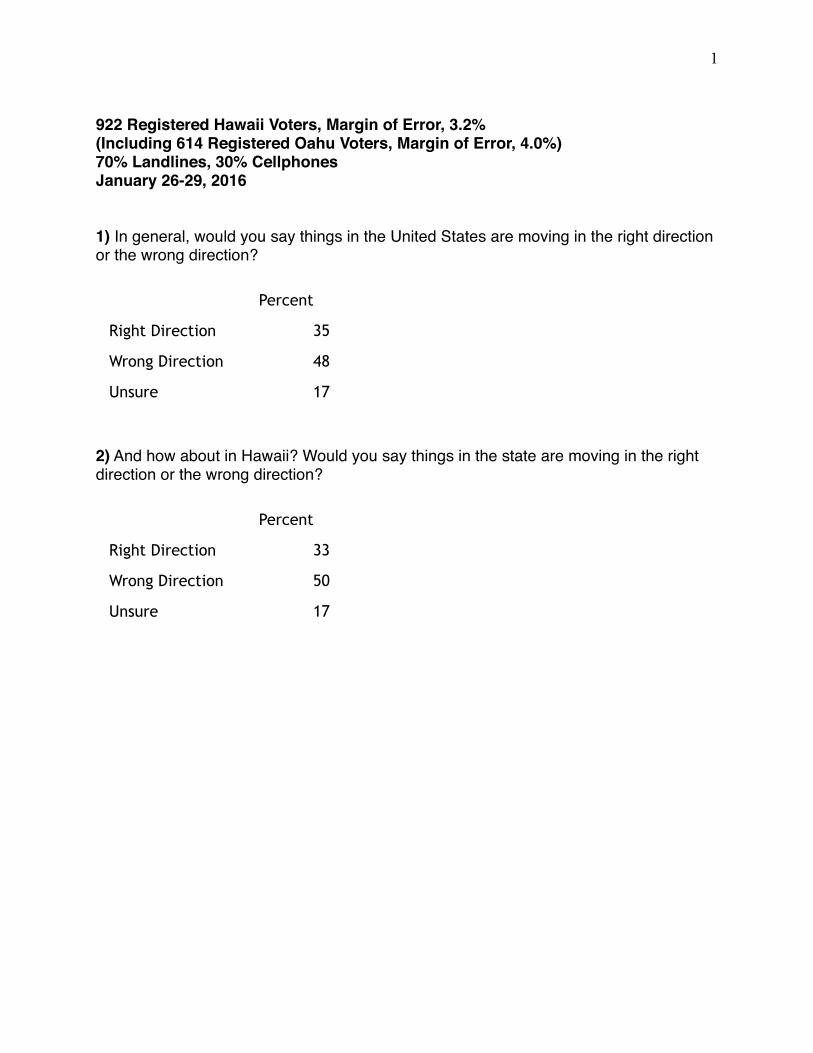
1) In general, would you say things in the United States are moving in the right direction or the wrong direction?
2) And how about in Hawaii? Would you say things in the state are moving in the right direction or the wrong direction?
Percent
Right Direction 35
Wrong Direction 48
Unsure 17
Percent
Right Direction 33
Wrong Direction 50
Unsure 17
! 2
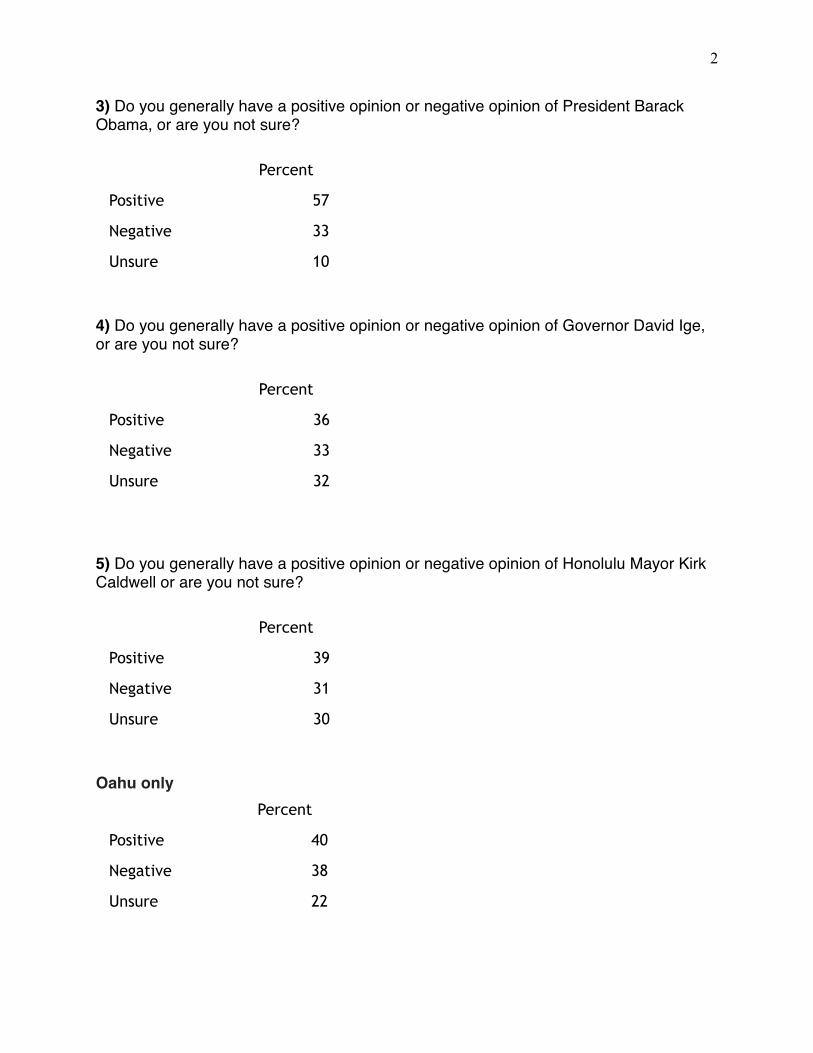
3) Do you generally have a positive opinion or negative opinion of President Barack Obama, or are you not sure?
4) Do you generally have a positive opinion or negative opinion of Governor David Ige, or are you not sure?
5) Do you generally have a positive opinion or negative opinion of Honolulu Mayor Kirk Caldwell or are you not sure?
Oahu only
Percent
Positive 57
Negative 33
Unsure 10
Percent
Positive 36
Negative 33
Unsure 32
Percent
Positive 39
Negative 31
Unsure 30
Percent
Positive 40
Negative 38
Unsure 22
! 3
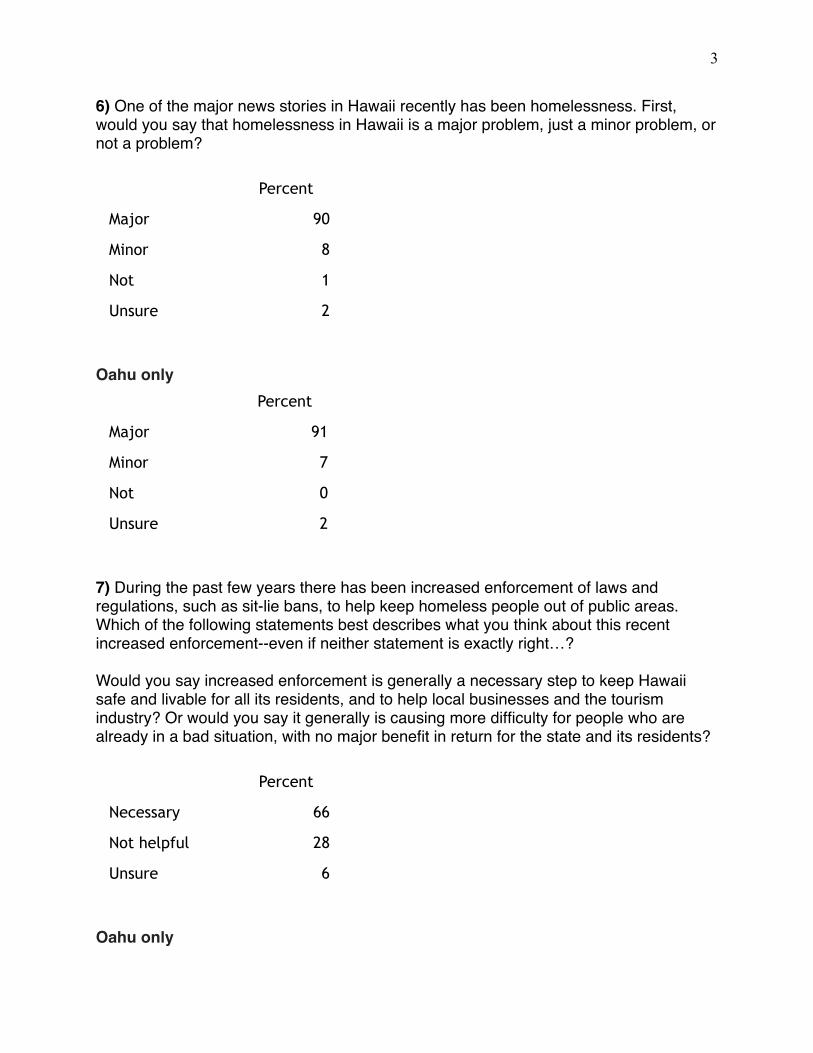
6) One of the major news stories in Hawaii recently has been homelessness. First, would you say that homelessness in Hawaii is a major problem, just a minor problem, or not a problem?
Oahu only
7) During the past few years there has been increased enforcement of laws and regulations, such as sit-lie bans, to help keep homeless people out of public areas. Which of the following statements best describes what you think about this recent increased enforcement--even if neither statement is exactly right…?
Would you say increased enforcement is generally a necessary step to keep Hawaii safe and livable for all its residents, and to help local businesses and the tourism industry? Or would you say it generally is causing more difficulty for people who are already in a bad situation, with no major benefit in return for the state and its residents?
Oahu only
Percent
Major 90
Minor 8
Not 1
Unsure 2
Percent
Major 91
Minor 7
Not 0
Unsure 2
Percent
Necessary 66
Not helpful 28
Unsure 6

! 4
Percent
Necessary 70
Not helpful 25
Unsure 6
! 5
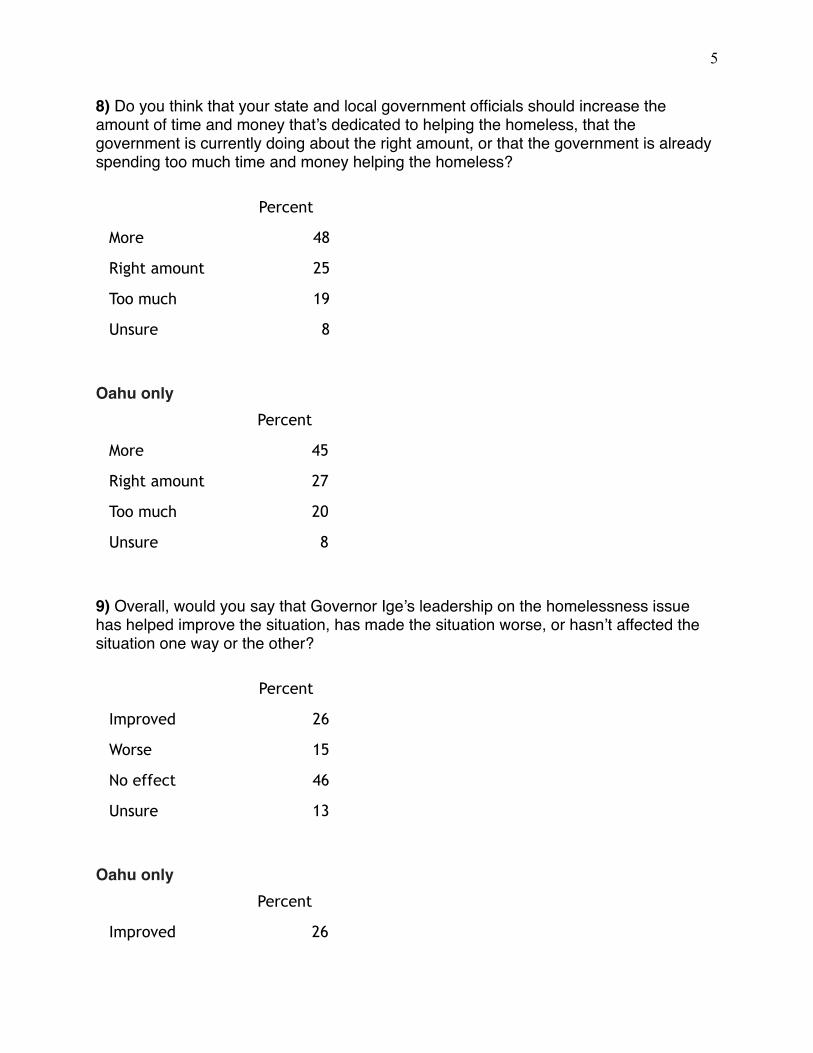
8) Do you think that your state and local government officials should increase the amount of time and money that’s dedicated to helping the homeless, that the government is currently doing about the right amount, or that the government is already spending too much time and money helping the homeless?
Oahu only
9) Overall, would you say that Governor Ige’s leadership on the homelessness issue has helped improve the situation, has made the situation worse, or hasn’t affected the situation one way or the other?
Oahu only
Percent
More 48
Right amount 25
Too much 19
Unsure 8
Percent
More 45
Right amount 27
Too much 20
Unsure 8
Percent
Improved 26
Worse 15
No effect 46
Unsure 13
Percent
Improved 26

! 6
Worse 15
No effect 49
Unsure 11
! 7
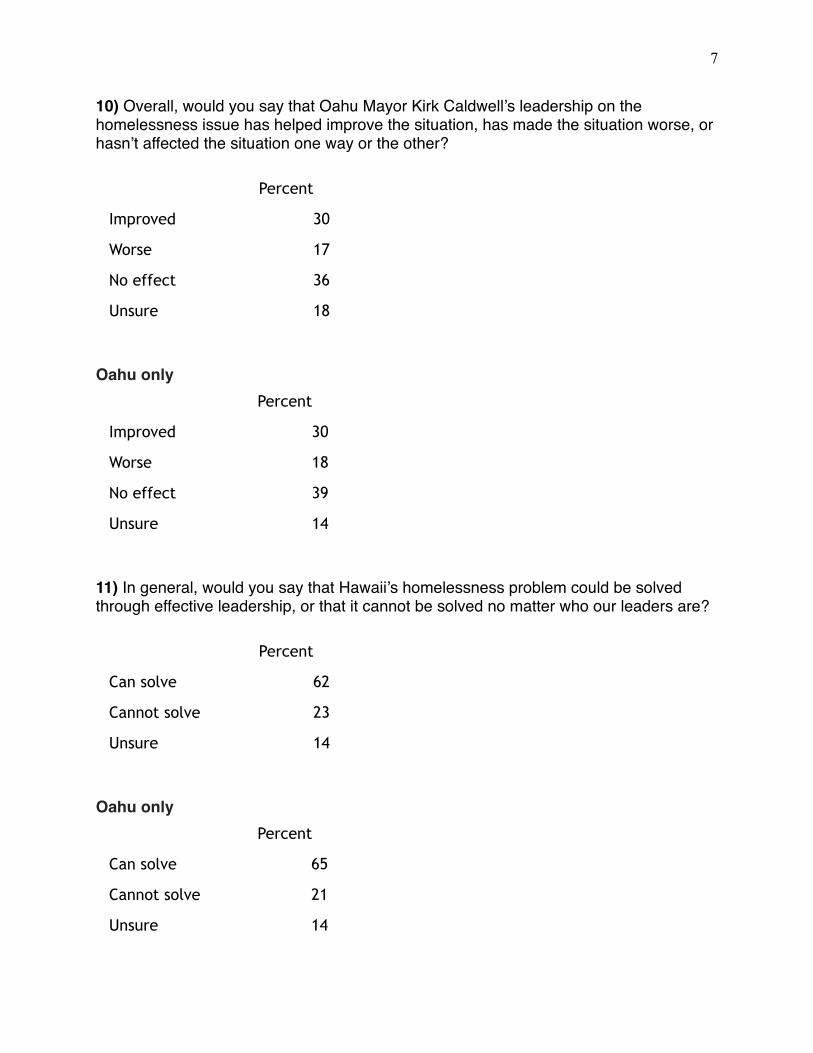
10) Overall, would you say that Oahu Mayor Kirk Caldwell’s leadership on the homelessness issue has helped improve the situation, has made the situation worse, or hasn’t affected the situation one way or the other?
Oahu only
11) In general, would you say that Hawaii’s homelessness problem could be solved through effective leadership, or that it cannot be solved no matter who our leaders are?
Oahu only
Percent
Improved 30
Worse 17
No effect 36
Unsure 18
Percent
Improved 30
Worse 18
No effect 39
Unsure 14
Percent
Can solve 62
Cannot solve 23
Unsure 14
Percent
Can solve 65
Cannot solve 21
Unsure 14

! 8
! 9
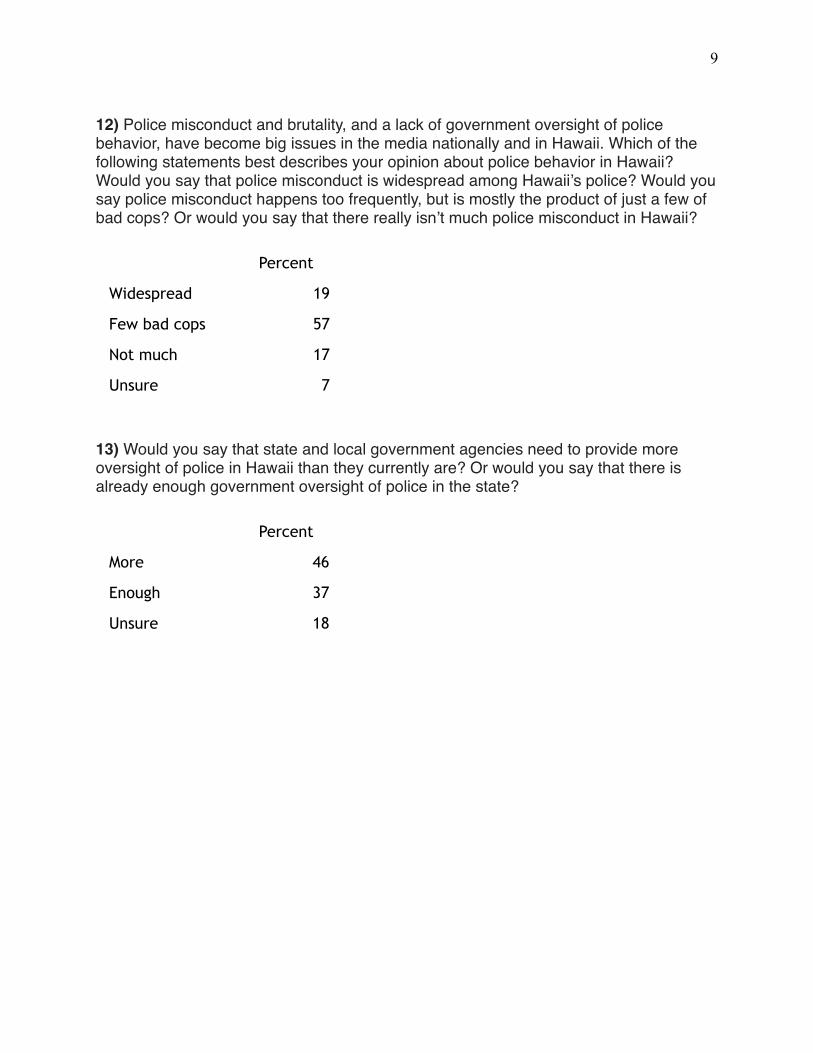
12) Police misconduct and brutality, and a lack of government oversight of police behavior, have become big issues in the media nationally and in Hawaii. Which of the following statements best describes your opinion about police behavior in Hawaii? Would you say that police misconduct is widespread among Hawaii’s police? Would you say police misconduct happens too frequently, but is mostly the product of just a few of bad cops? Or would you say that there really isn’t much police misconduct in Hawaii?
13) Would you say that state and local government agencies need to provide more oversight of police in Hawaii than they currently are? Or would you say that there is already enough government oversight of police in the state?
Percent
Widespread 19
Few bad cops 57
Not much 17
Unsure 7
Percent
More 46
Enough 37
Unsure 18
! 10
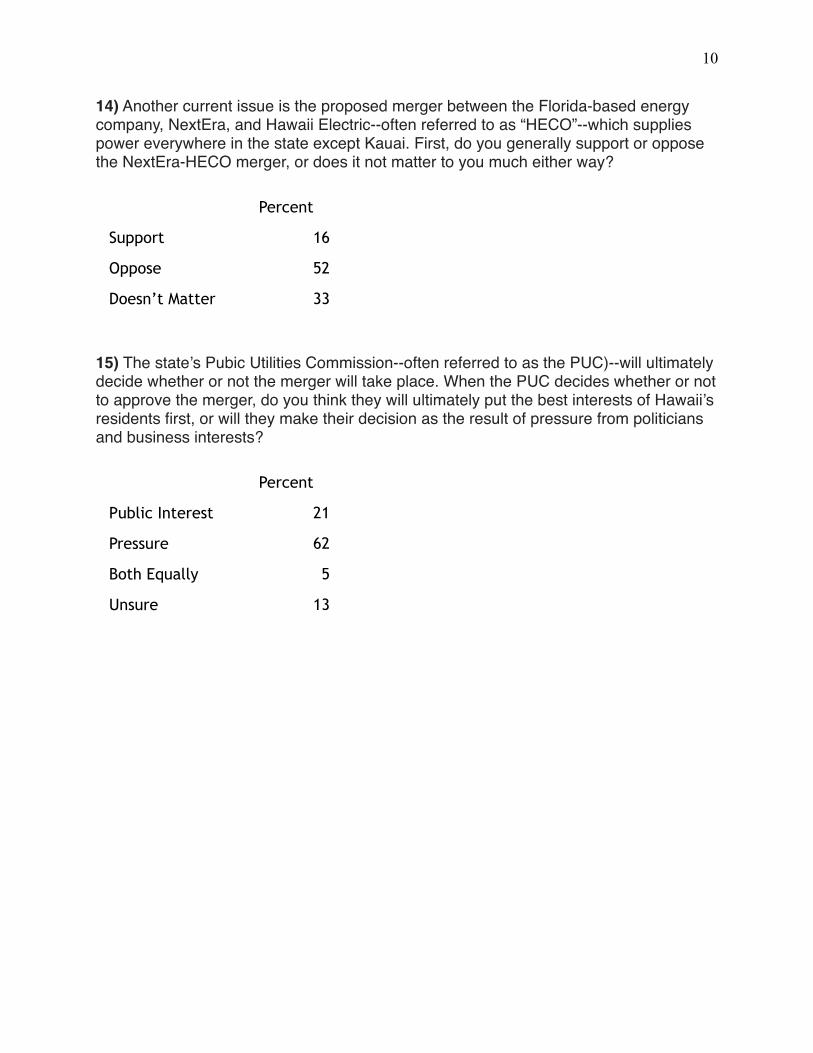
14) Another current issue is the proposed merger between the Florida-based energy company, NextEra, and Hawaii Electric--often referred to as “HECO”--which supplies power everywhere in the state except Kauai. First, do you generally support or oppose the NextEra-HECO merger, or does it not matter to you much either way?
15) The state’s Pubic Utilities Commission--often referred to as the PUC)--will ultimately decide whether or not the merger will take place. When the PUC decides whether or not to approve the merger, do you think they will ultimately put the best interests of Hawaii’s residents first, or will they make their decision as the result of pressure from politicians and business interests?
Percent
Support 16
Oppose 52
Doesn’t Matter 33
Percent
Public Interest 21
Pressure 62
Both Equally 5
Unsure 13
! 11
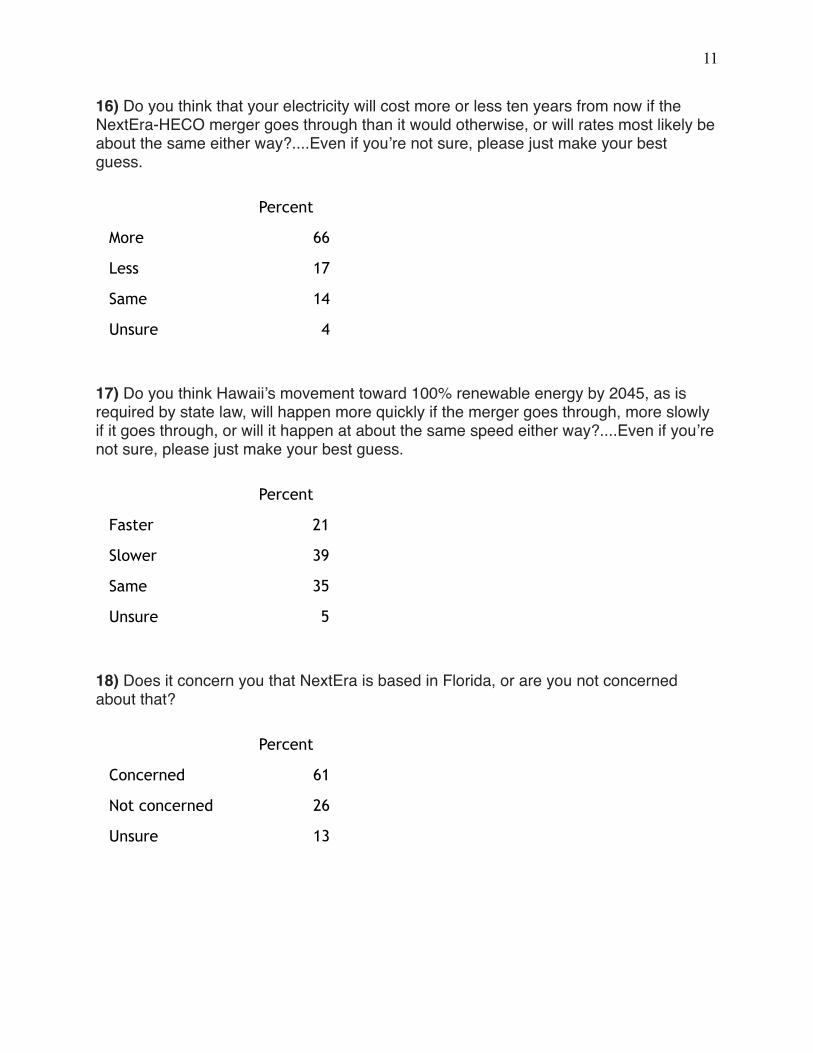
16) Do you think that your electricity will cost more or less ten years from now if the NextEra-HECO merger goes through than it would otherwise, or will rates most likely be about the same either way?....Even if you’re not sure, please just make your best guess.
17) Do you think Hawaii’s movement toward 100% renewable energy by 2045, as is required by state law, will happen more quickly if the merger goes through, more slowly if it goes through, or will it happen at about the same speed either way?....Even if you’re not sure, please just make your best guess.
18) Does it concern you that NextEra is based in Florida, or are you not concerned about that?
Percent
More 66
Less 17
Same 14
Unsure 4
Percent
Faster 21
Slower 39
Same 35
Unsure 5
Percent
Concerned 61
Not concerned 26
Unsure 13
! 12
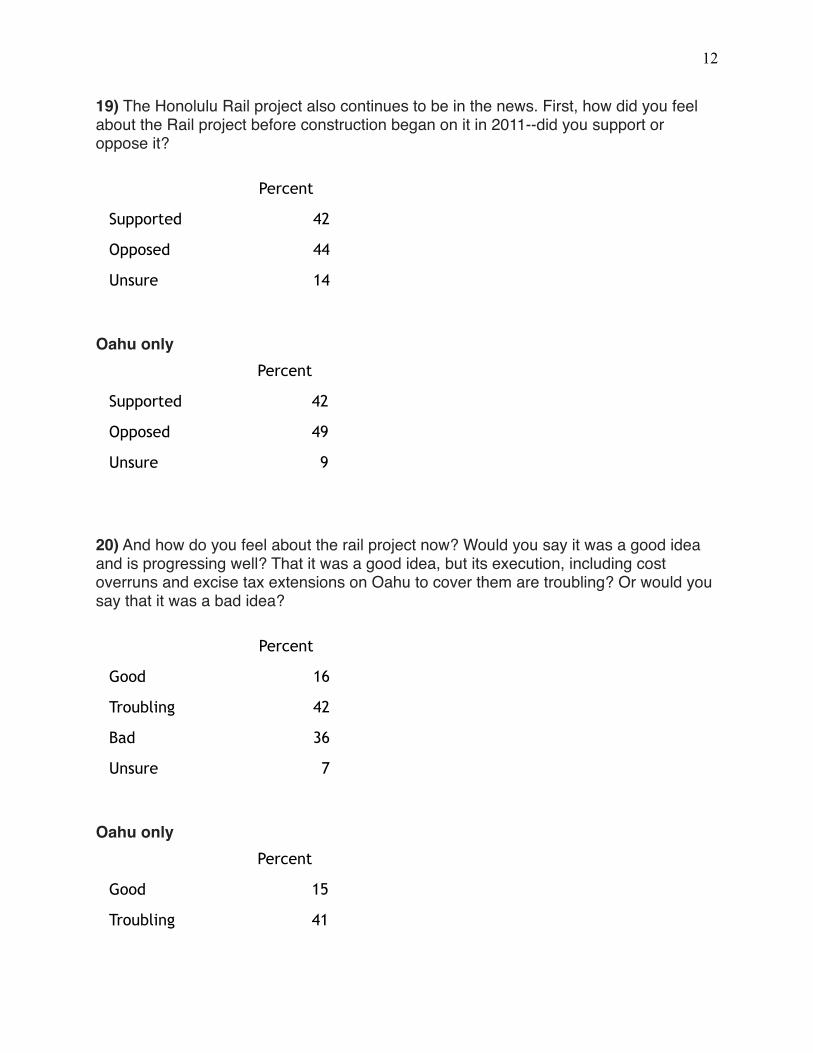
19) The Honolulu Rail project also continues to be in the news. First, how did you feel about the Rail project before construction began on it in 2011--did you support or oppose it?
Oahu only
20) And how do you feel about the rail project now? Would you say it was a good idea and is progressing well? That it was a good idea, but its execution, including cost overruns and excise tax extensions on Oahu to cover them are troubling? Or would you say that it was a bad idea?
Oahu only
Percent
Supported 42
Opposed 44
Unsure 14
Percent
Supported 42
Opposed 49
Unsure 9
Percent
Good 16
Troubling 42
Bad 36
Unsure 7
Percent
Good 15
Troubling 41

! 13
Bad 41
Unsure 3
! 14
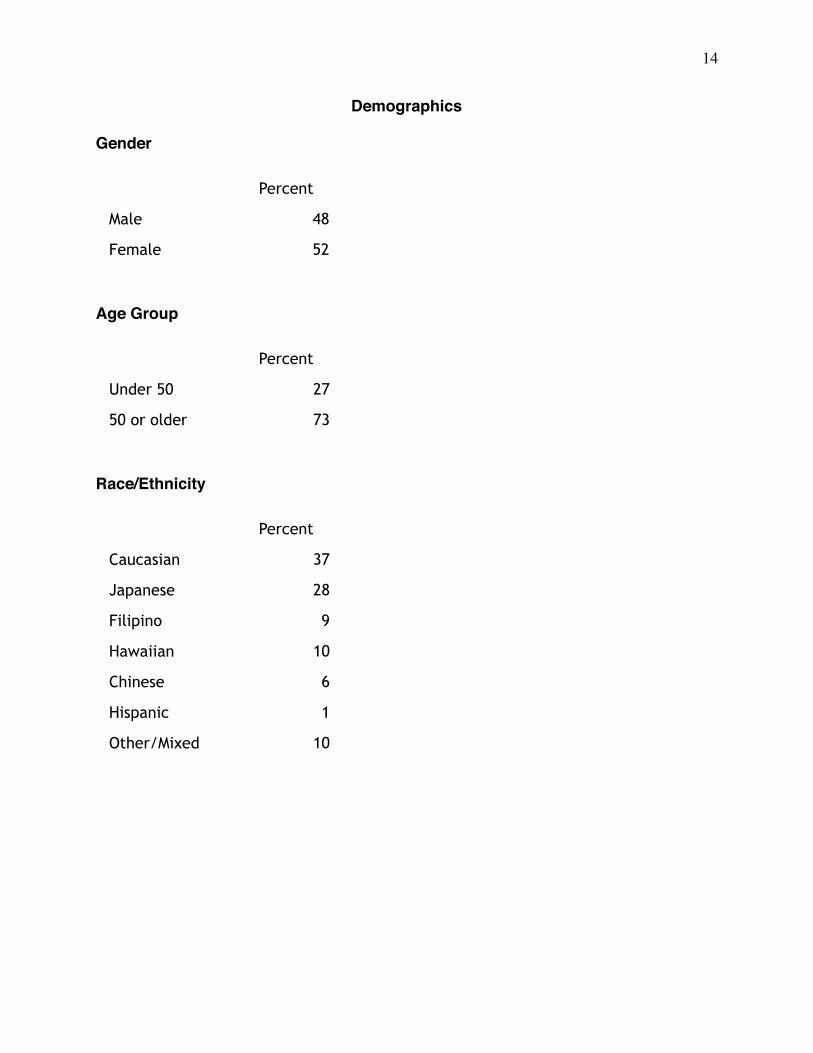
Demographics
Gender
Age Group
Race/Ethnicity
Percent
Male 48
Female 52
Percent
Under 50 27
50 or older 73
Percent
Caucasian 37
Japanese 28
Filipino 9
Hawaiian 10
Chinese 6
Hispanic 1
Other/Mixed 10
! 15
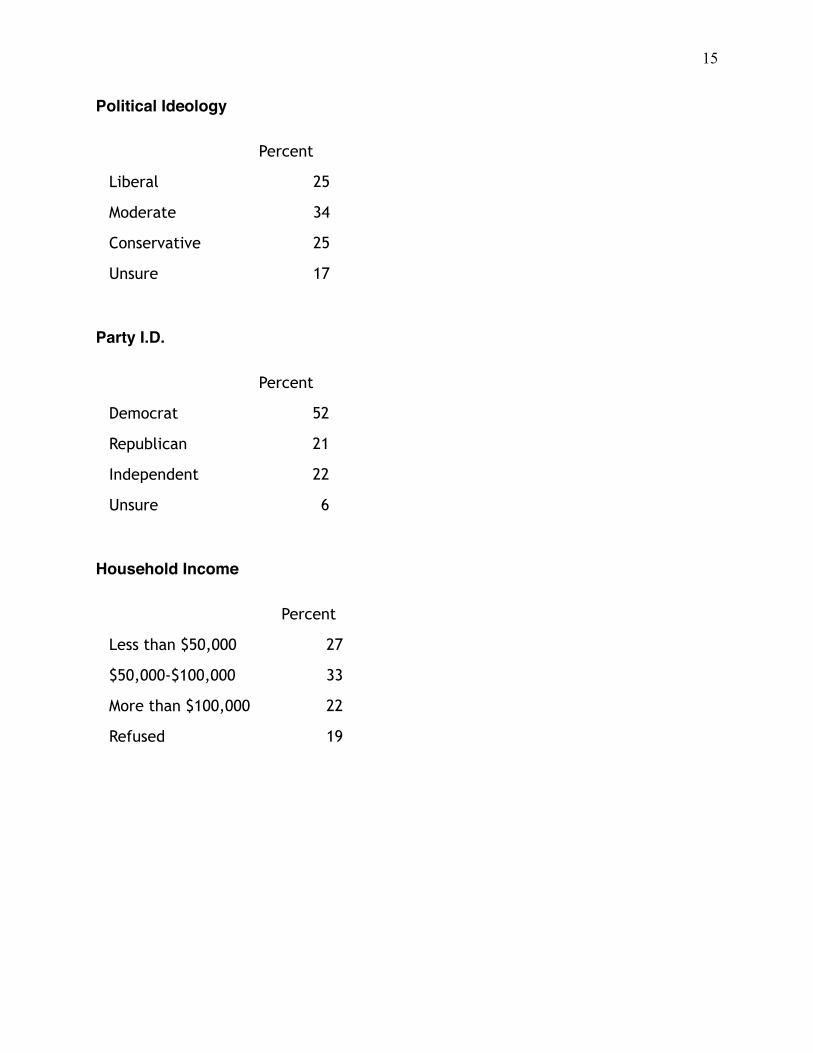
Political Ideology
Party I.D.
Household Income
Percent
Liberal 25
Moderate 34
Conservative 25
Unsure 17
Percent
Democrat 52
Republican 21
Independent 22
Unsure 6
Percent
Less than $50,000 27
$50,000-$100,000 33
More than $100,000 22
Refused 19
! 16
Crosstabs
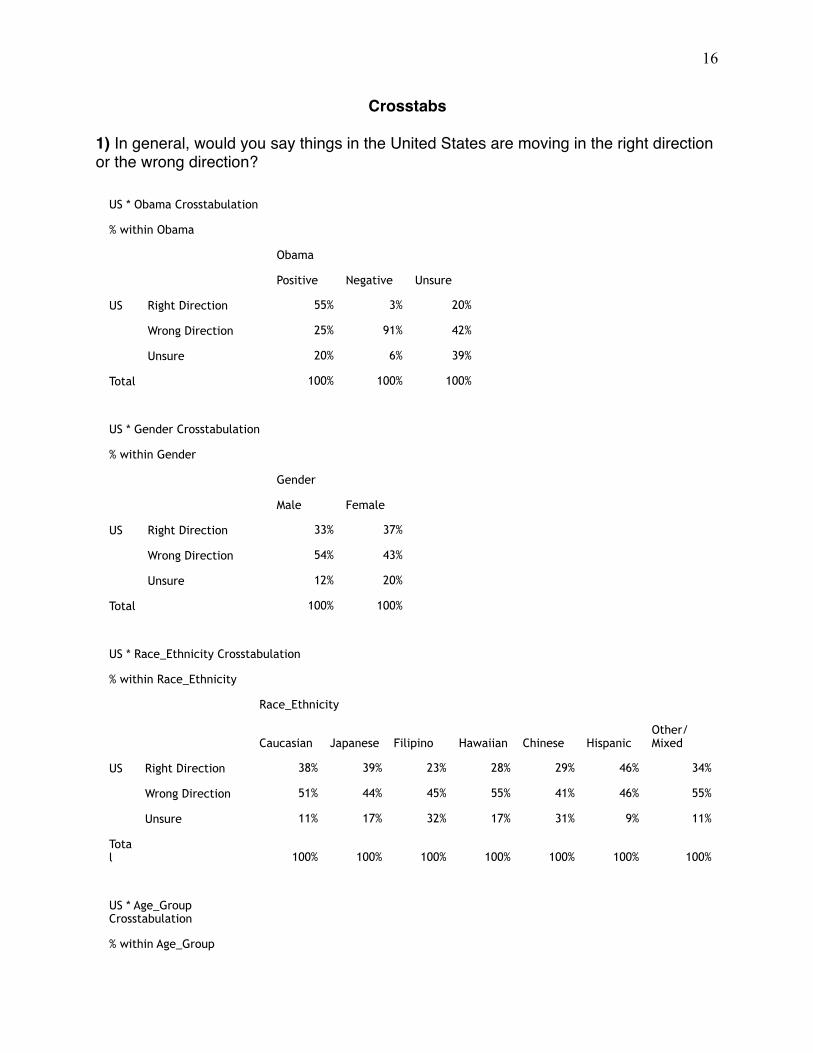
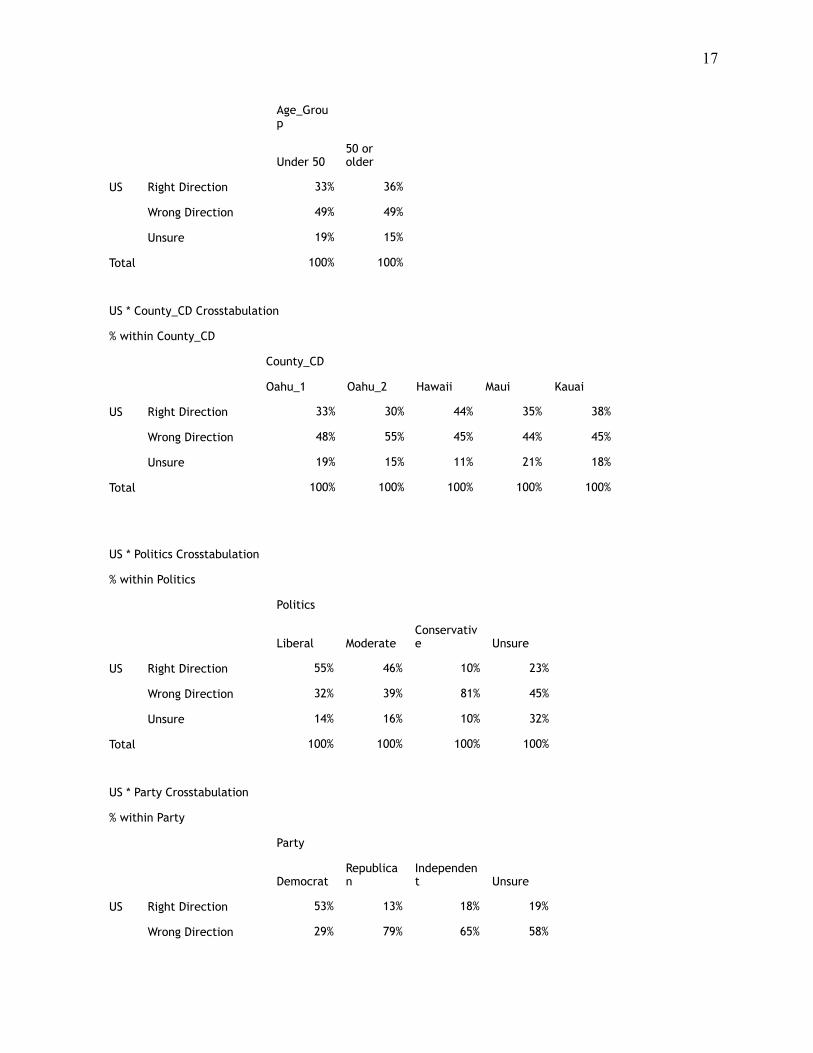
1) In general, would you say things in the United States are moving in the right direction or the wrong direction?
US * Obama Crosstabulation
% within Obama
Obama
Positive Negative Unsure
US Right Direction 55% 3% 20%
Wrong Direction 25% 91% 42%
Unsure 20% 6% 39%
Total 100% 100% 100%
US * Gender Crosstabulation
% within Gender
Gender
Male Female
US Right Direction 33% 37%
Wrong Direction 54% 43%
Unsure 12% 20%
Total 100% 100%
US * Race_Ethnicity Crosstabulation
% within Race_Ethnicity
Race_Ethnicity
Caucasian Japanese Filipino Hawaiian Chinese HispanicOther/Mixed
US Right Direction 38% 39% 23% 28% 29% 46% 34%
Wrong Direction 51% 44% 45% 55% 41% 46% 55%
Unsure 11% 17% 32% 17% 31% 9% 11%
Total 100% 100% 100% 100% 100% 100% 100%
US * Age_Group Crosstabulation
% within Age_Group
! 17
Age_Group
Under 5050 or older
US Right Direction 33% 36%
Wrong Direction 49% 49%
Unsure 19% 15%
Total 100% 100%
US * County_CD Crosstabulation
% within County_CD
County_CD
Oahu_1 Oahu_2 Hawaii Maui Kauai
US Right Direction 33% 30% 44% 35% 38%
Wrong Direction 48% 55% 45% 44% 45%
Unsure 19% 15% 11% 21% 18%
Total 100% 100% 100% 100% 100%
US * Politics Crosstabulation
% within Politics
Politics
Liberal ModerateConservative Unsure
US Right Direction 55% 46% 10% 23%
Wrong Direction 32% 39% 81% 45%
Unsure 14% 16% 10% 32%
Total 100% 100% 100% 100%
US * Party Crosstabulation
% within Party
Party
DemocratRepublican
Independent Unsure
US Right Direction 53% 13% 18% 19%
Wrong Direction 29% 79% 65% 58%
! 18
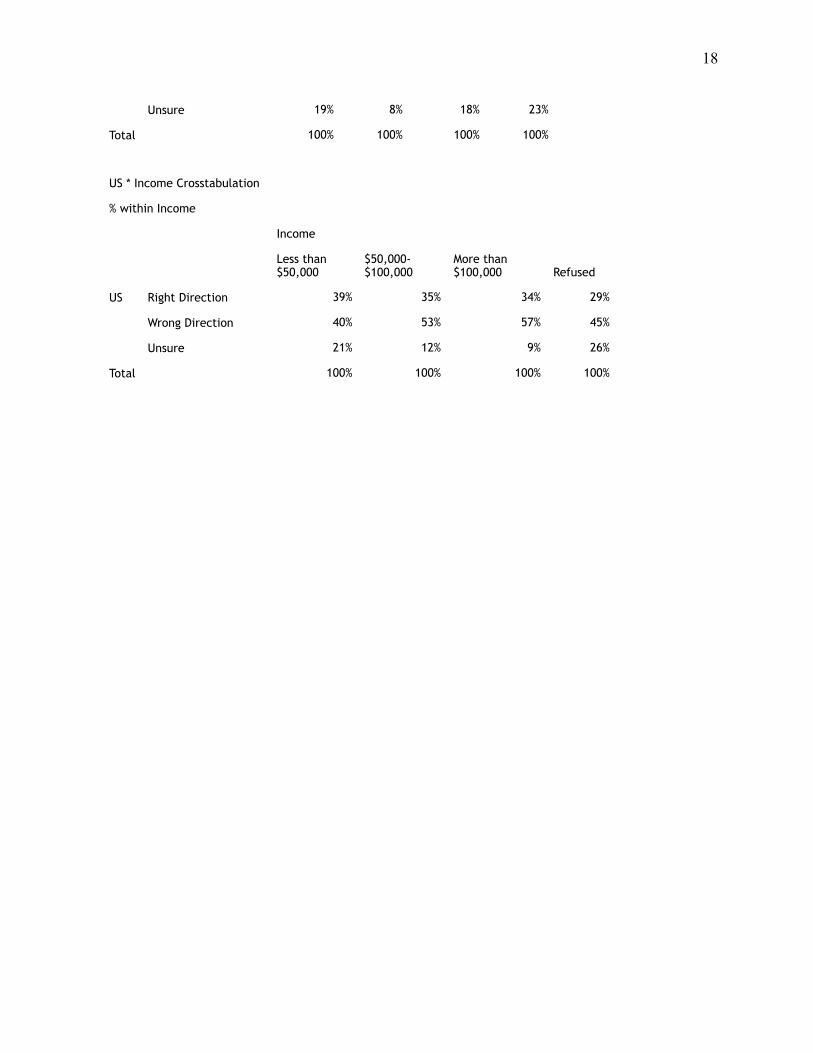
Unsure 19% 8% 18% 23%
Total 100% 100% 100% 100%
US * Income Crosstabulation
% within Income
Income
Less than $50,000
$50,000-$100,000
More than $100,000 Refused
US Right Direction 39% 35% 34% 29%
Wrong Direction 40% 53% 57% 45%
Unsure 21% 12% 9% 26%
Total 100% 100% 100% 100%
! 19
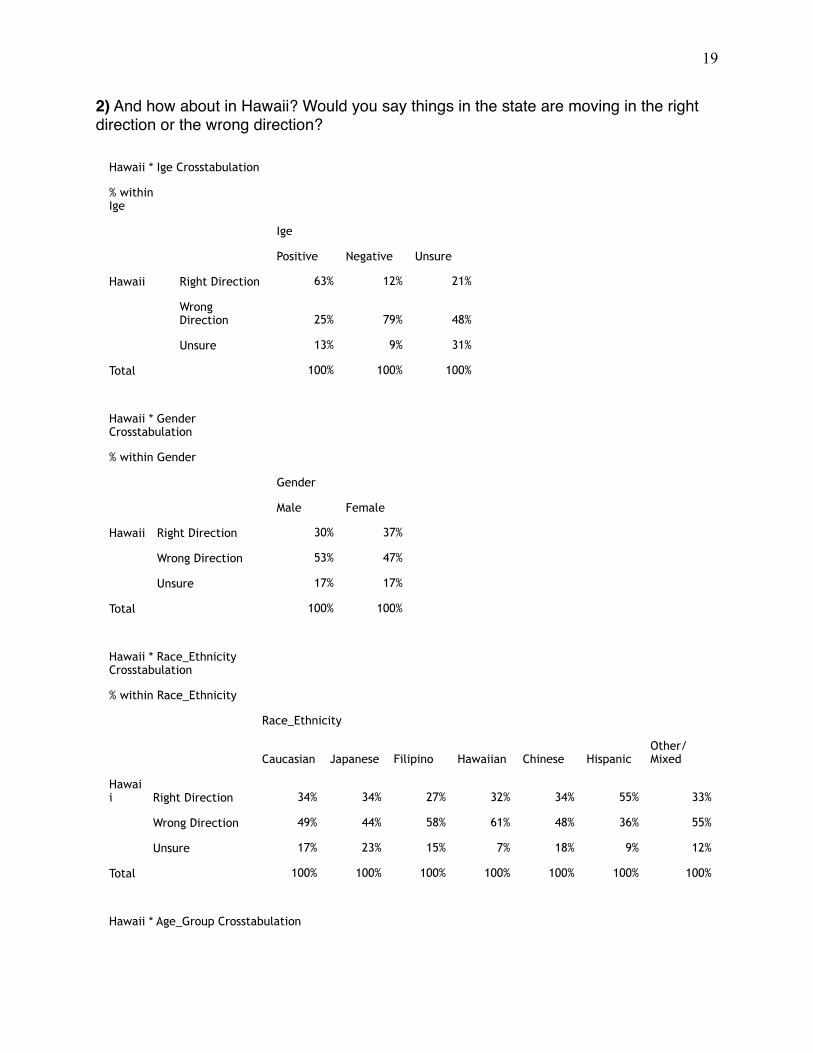
2) And how about in Hawaii? Would you say things in the state are moving in the right direction or the wrong direction?
Hawaii * Ige Crosstabulation
% within Ige
Ige
Positive Negative Unsure
Hawaii Right Direction 63% 12% 21%
Wrong Direction 25% 79% 48%
Unsure 13% 9% 31%
Total 100% 100% 100%
Hawaii * Gender Crosstabulation
% within Gender
Gender
Male Female
Hawaii Right Direction 30% 37%
Wrong Direction 53% 47%
Unsure 17% 17%
Total 100% 100%
Hawaii * Race_Ethnicity Crosstabulation
% within Race_Ethnicity
Race_Ethnicity
Caucasian Japanese Filipino Hawaiian Chinese HispanicOther/Mixed
Hawaii Right Direction 34% 34% 27% 32% 34% 55% 33%
Wrong Direction 49% 44% 58% 61% 48% 36% 55%
Unsure 17% 23% 15% 7% 18% 9% 12%
Total 100% 100% 100% 100% 100% 100% 100%
Hawaii * Age_Group Crosstabulation
! 20
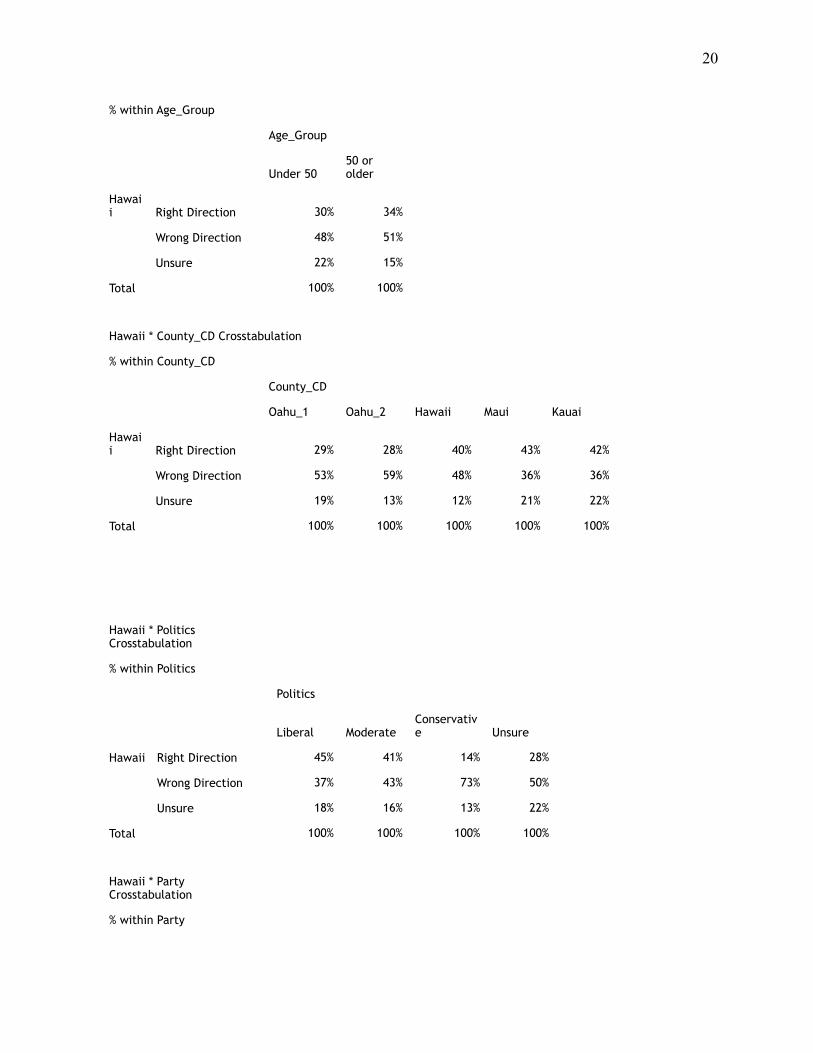
% within Age_Group
Age_Group
Under 5050 or older
Hawaii Right Direction 30% 34%
Wrong Direction 48% 51%
Unsure 22% 15%
Total 100% 100%
Hawaii * County_CD Crosstabulation
% within County_CD
County_CD
Oahu_1 Oahu_2 Hawaii Maui Kauai
Hawaii Right Direction 29% 28% 40% 43% 42%
Wrong Direction 53% 59% 48% 36% 36%
Unsure 19% 13% 12% 21% 22%
Total 100% 100% 100% 100% 100%
Hawaii * Politics Crosstabulation
% within Politics
Politics
Liberal ModerateConservative Unsure
Hawaii Right Direction 45% 41% 14% 28%
Wrong Direction 37% 43% 73% 50%
Unsure 18% 16% 13% 22%
Total 100% 100% 100% 100%
Hawaii * Party Crosstabulation
% within Party
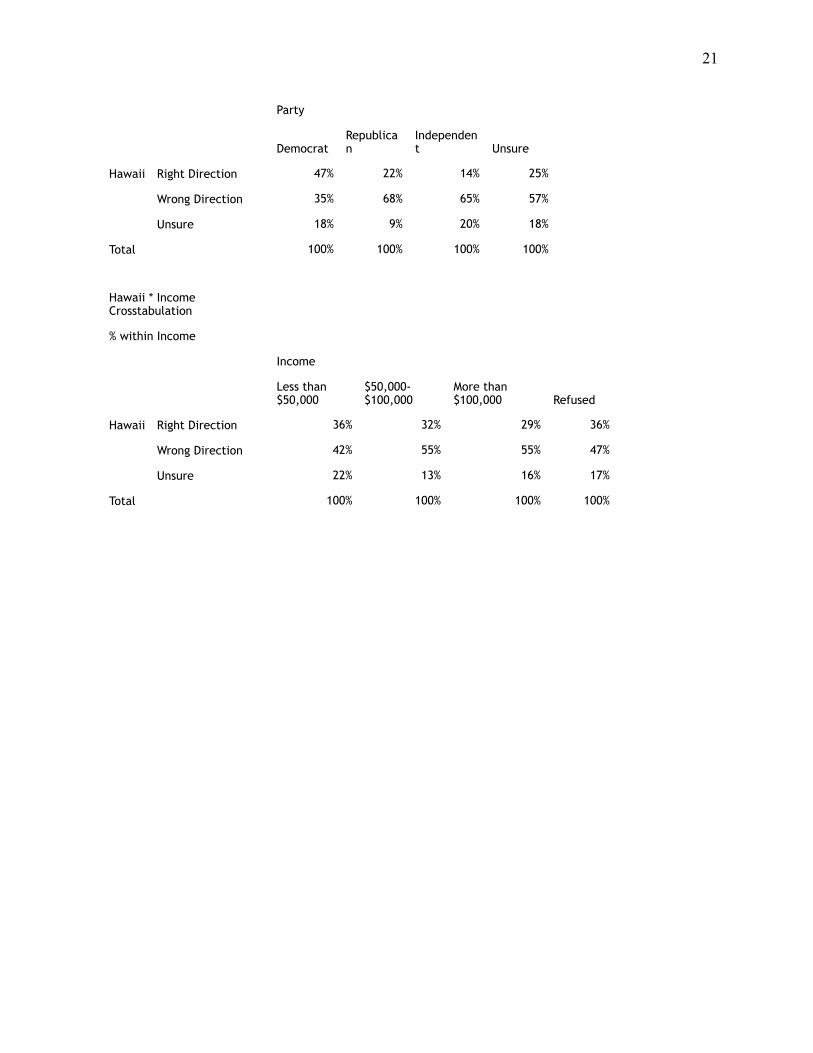
! 21
Party
DemocratRepublican
Independent Unsure
Hawaii Right Direction 47% 22% 14% 25%
Wrong Direction 35% 68% 65% 57%
Unsure 18% 9% 20% 18%
Total 100% 100% 100% 100%
Hawaii * Income Crosstabulation
% within Income
Income
Less than $50,000
$50,000-$100,000
More than $100,000 Refused
Hawaii Right Direction 36% 32% 29% 36%
Wrong Direction 42% 55% 55% 47%
Unsure 22% 13% 16% 17%
Total 100% 100% 100% 100%
! 22
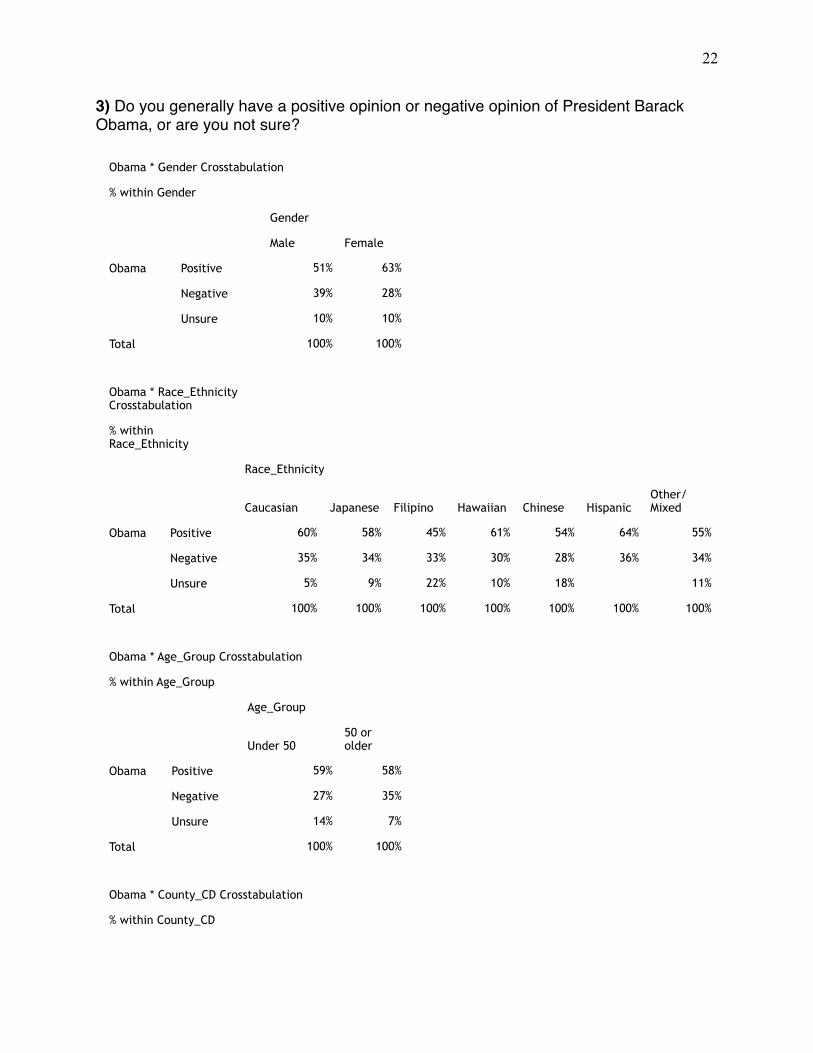
3) Do you generally have a positive opinion or negative opinion of President Barack Obama, or are you not sure?
Obama * Gender Crosstabulation
% within Gender
Gender
Male Female
Obama Positive 51% 63%
Negative 39% 28%
Unsure 10% 10%
Total 100% 100%
Obama * Race_Ethnicity Crosstabulation
% within Race_Ethnicity
Race_Ethnicity
Caucasian Japanese Filipino Hawaiian Chinese HispanicOther/Mixed
Obama Positive 60% 58% 45% 61% 54% 64% 55%
Negative 35% 34% 33% 30% 28% 36% 34%
Unsure 5% 9% 22% 10% 18% 11%
Total 100% 100% 100% 100% 100% 100% 100%
Obama * Age_Group Crosstabulation
% within Age_Group
Age_Group
Under 5050 or older
Obama Positive 59% 58%
Negative 27% 35%
Unsure 14% 7%
Total 100% 100%
Obama * County_CD Crosstabulation
% within County_CD
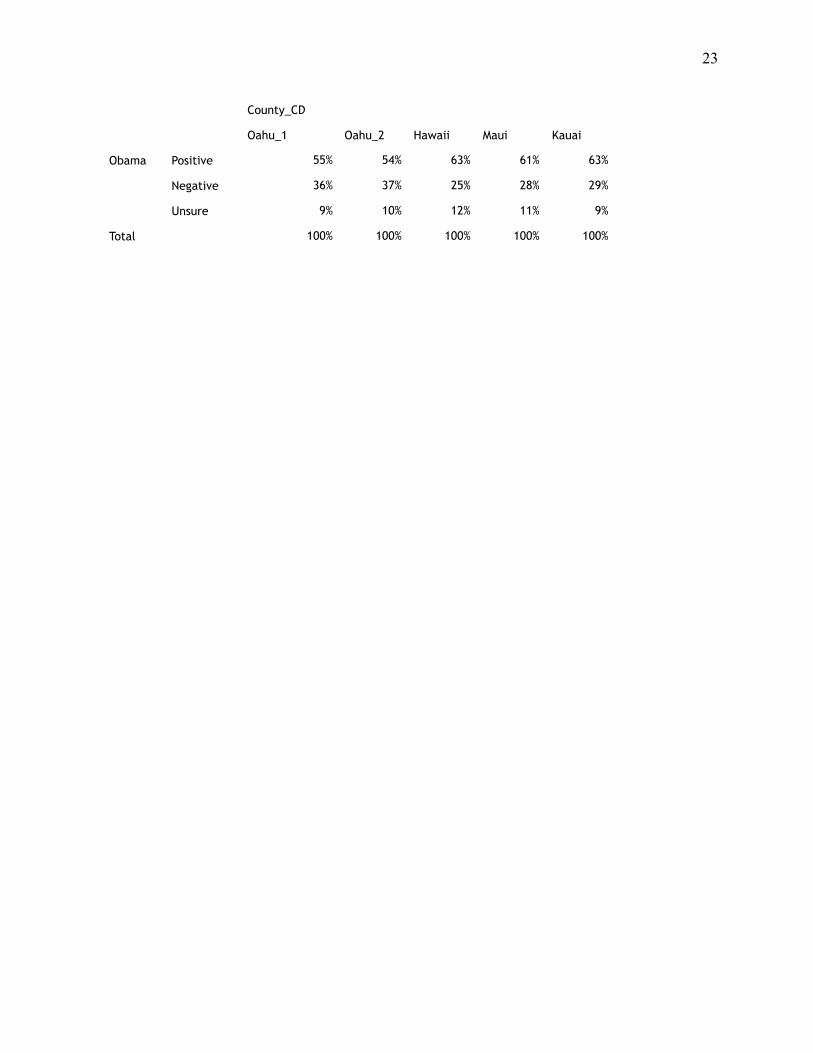
! 23
County_CD
Oahu_1 Oahu_2 Hawaii Maui Kauai
Obama Positive 55% 54% 63% 61% 63%
Negative 36% 37% 25% 28% 29%
Unsure 9% 10% 12% 11% 9%
Total 100% 100% 100% 100% 100%
! 24
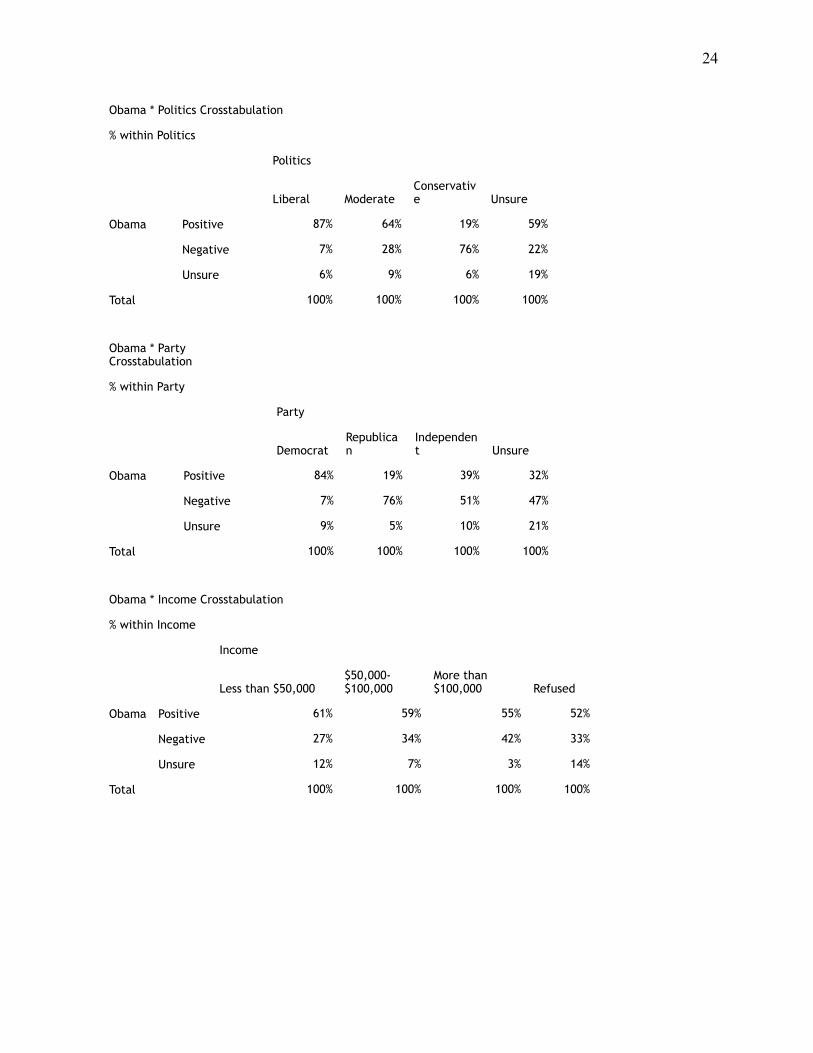
Obama * Politics Crosstabulation
% within Politics
Politics
Liberal ModerateConservative Unsure
Obama Positive 87% 64% 19% 59%
Negative 7% 28% 76% 22%
Unsure 6% 9% 6% 19%
Total 100% 100% 100% 100%
Obama * Party Crosstabulation
% within Party
Party
DemocratRepublican
Independent Unsure
Obama Positive 84% 19% 39% 32%
Negative 7% 76% 51% 47%
Unsure 9% 5% 10% 21%
Total 100% 100% 100% 100%
Obama * Income Crosstabulation
% within Income
Income
Less than $50,000$50,000-$100,000
More than $100,000 Refused
Obama Positive 61% 59% 55% 52%
Negative 27% 34% 42% 33%
Unsure 12% 7% 3% 14%
Total 100% 100% 100% 100%
! 25
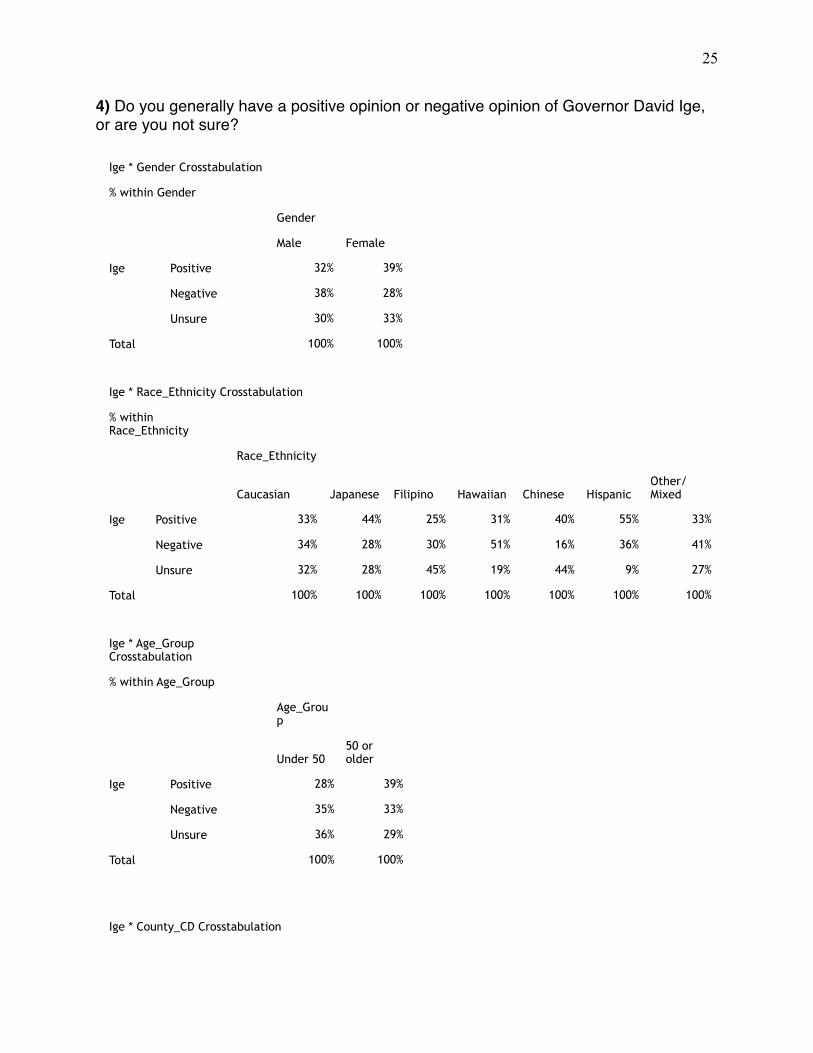
4) Do you generally have a positive opinion or negative opinion of Governor David Ige, or are you not sure?
Ige * Gender Crosstabulation
% within Gender
Gender
Male Female
Ige Positive 32% 39%
Negative 38% 28%
Unsure 30% 33%
Total 100% 100%
Ige * Race_Ethnicity Crosstabulation
% within Race_Ethnicity
Race_Ethnicity
Caucasian Japanese Filipino Hawaiian Chinese HispanicOther/Mixed
Ige Positive 33% 44% 25% 31% 40% 55% 33%
Negative 34% 28% 30% 51% 16% 36% 41%
Unsure 32% 28% 45% 19% 44% 9% 27%
Total 100% 100% 100% 100% 100% 100% 100%
Ige * Age_Group Crosstabulation
% within Age_Group
Age_Group
Under 5050 or older
Ige Positive 28% 39%
Negative 35% 33%
Unsure 36% 29%
Total 100% 100%
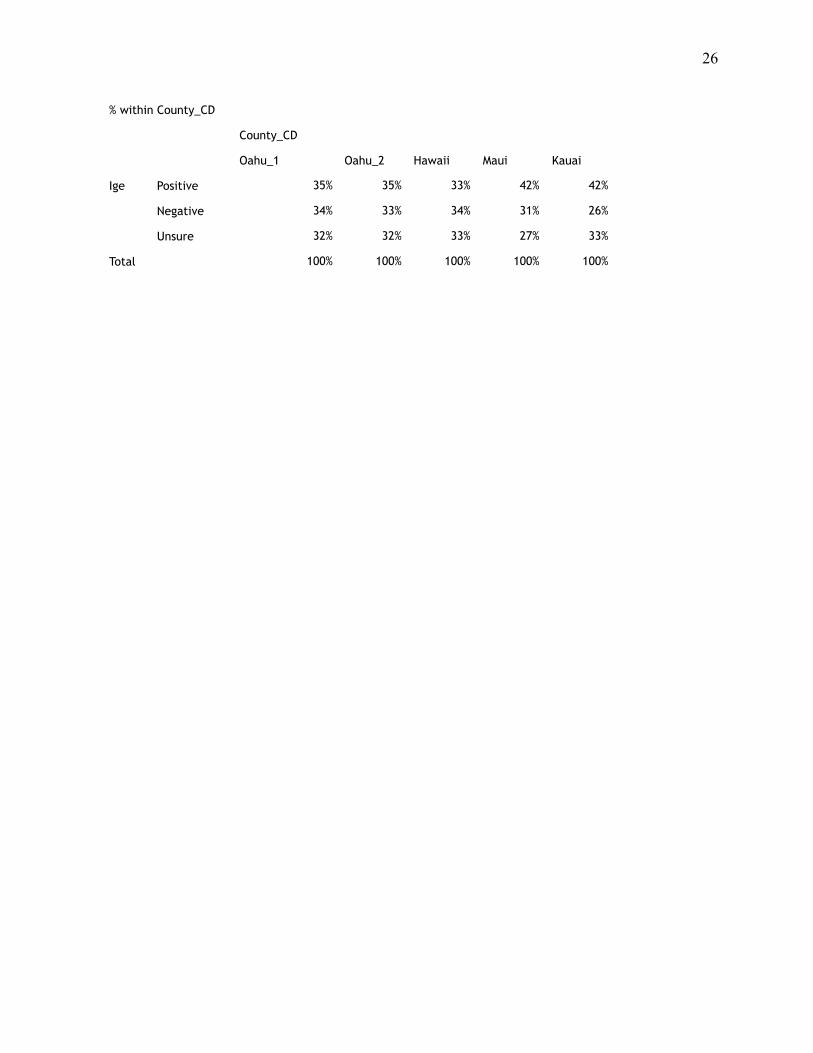
Ige * County_CD Crosstabulation
! 26
% within County_CD
County_CD
Oahu_1 Oahu_2 Hawaii Maui Kauai
Ige Positive 35% 35% 33% 42% 42%
Negative 34% 33% 34% 31% 26%
Unsure 32% 32% 33% 27% 33%
Total 100% 100% 100% 100% 100%
! 27
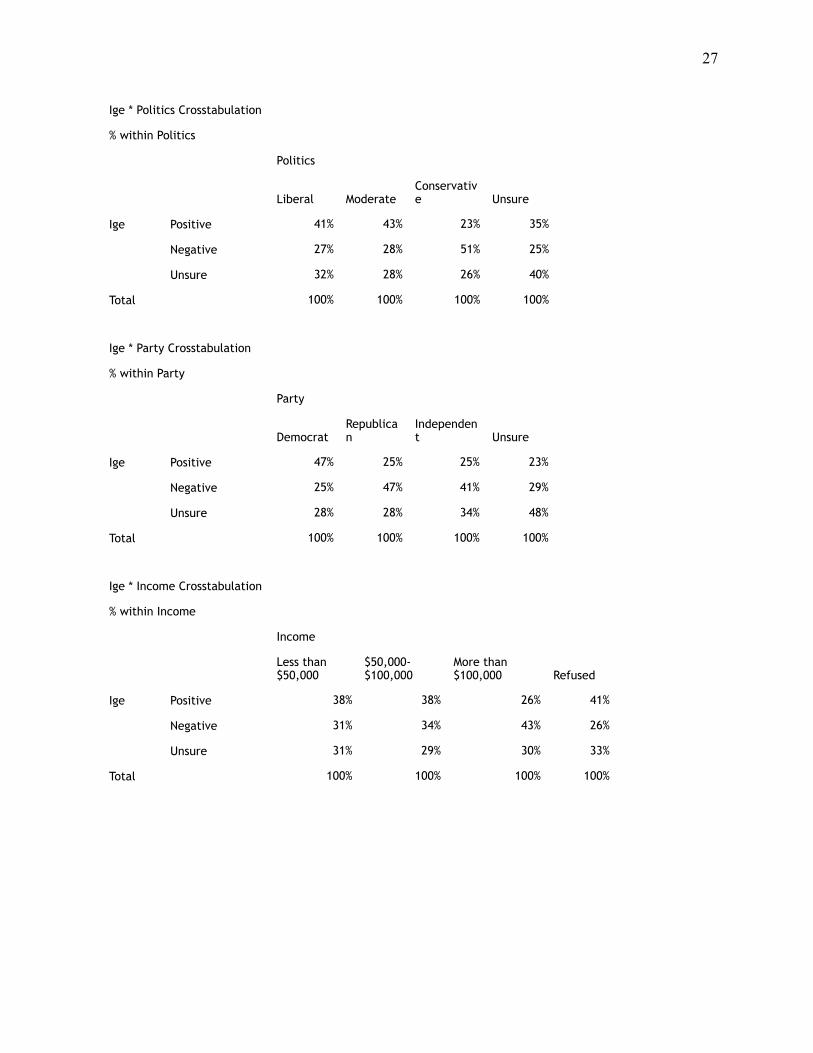
Ige * Politics Crosstabulation
% within Politics
Politics
Liberal ModerateConservative Unsure
Ige Positive 41% 43% 23% 35%
Negative 27% 28% 51% 25%
Unsure 32% 28% 26% 40%
Total 100% 100% 100% 100%
Ige * Party Crosstabulation
% within Party
Party
DemocratRepublican
Independent Unsure
Ige Positive 47% 25% 25% 23%
Negative 25% 47% 41% 29%
Unsure 28% 28% 34% 48%
Total 100% 100% 100% 100%
Ige * Income Crosstabulation
% within Income
Income
Less than $50,000
$50,000-$100,000
More than $100,000 Refused
Ige Positive 38% 38% 26% 41%
Negative 31% 34% 43% 26%
Unsure 31% 29% 30% 33%
Total 100% 100% 100% 100%
! 28
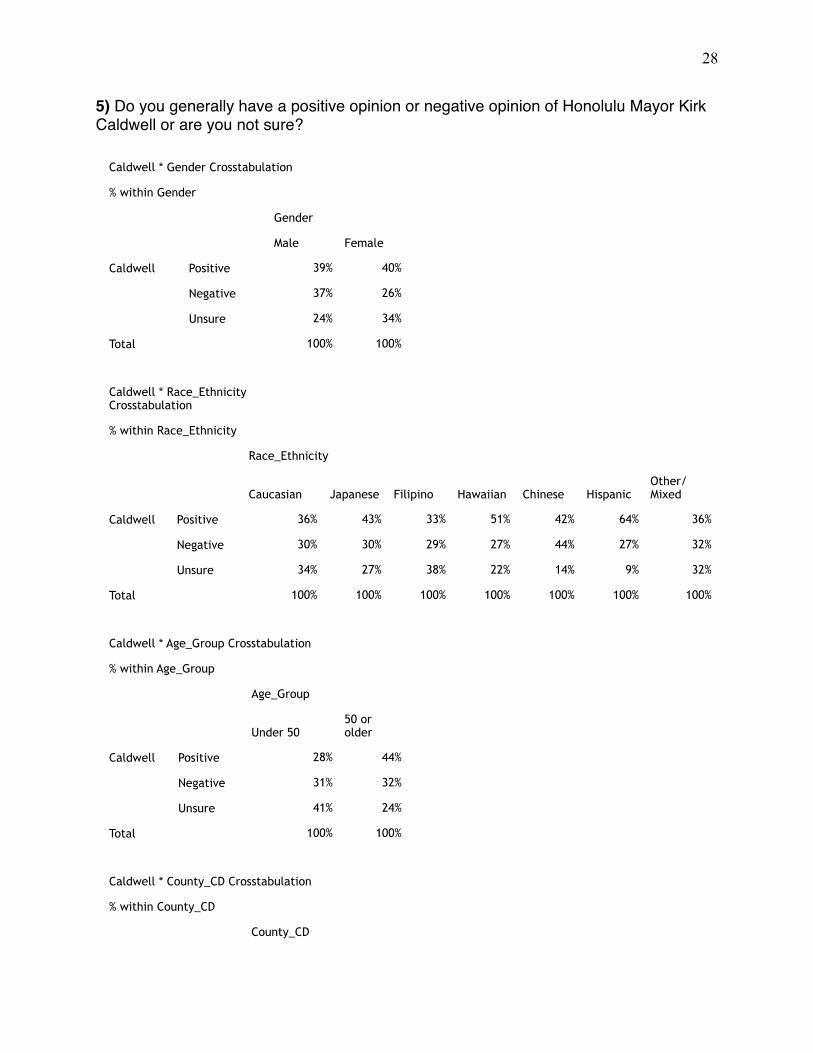
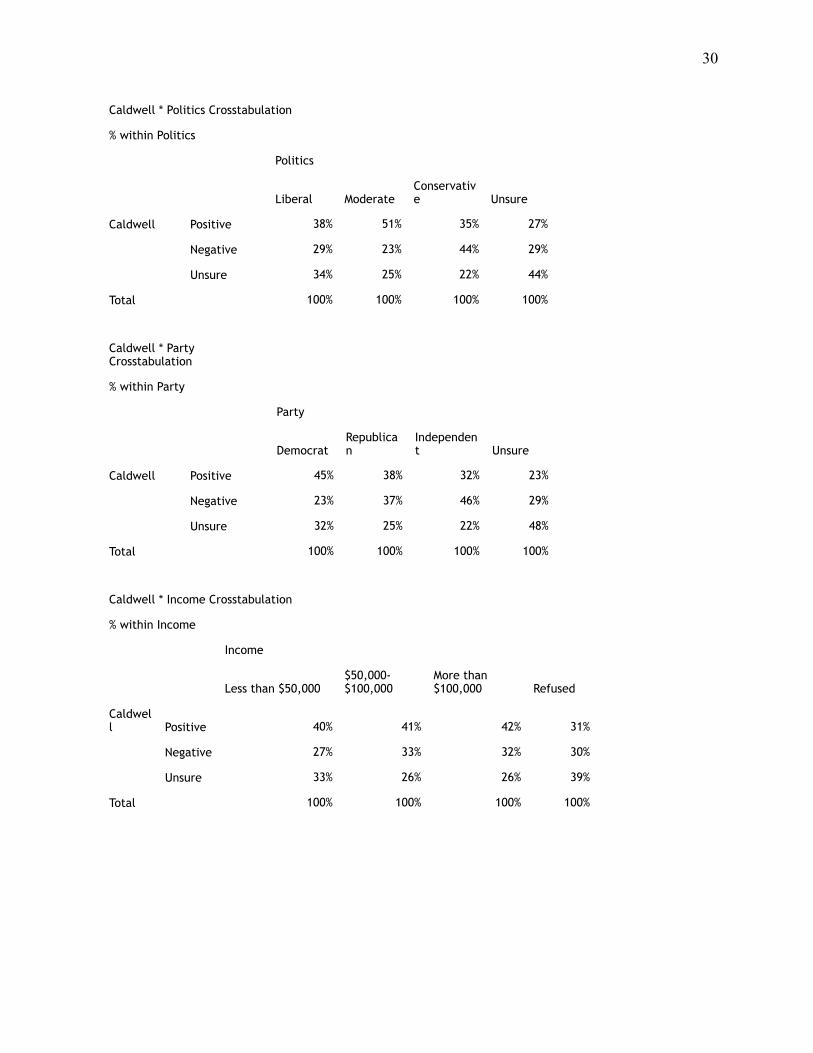
5) Do you generally have a positive opinion or negative opinion of Honolulu Mayor Kirk Caldwell or are you not sure?
Caldwell * Gender Crosstabulation
% within Gender
Gender
Male Female
Caldwell Positive 39% 40%
Negative 37% 26%
Unsure 24% 34%
Total 100% 100%
Caldwell * Race_Ethnicity Crosstabulation
% within Race_Ethnicity
Race_Ethnicity
Caucasian Japanese Filipino Hawaiian Chinese HispanicOther/Mixed
Caldwell Positive 36% 43% 33% 51% 42% 64% 36%
Negative 30% 30% 29% 27% 44% 27% 32%
Unsure 34% 27% 38% 22% 14% 9% 32%
Total 100% 100% 100% 100% 100% 100% 100%
Caldwell * Age_Group Crosstabulation
% within Age_Group
Age_Group
Under 5050 or older
Caldwell Positive 28% 44%
Negative 31% 32%
Unsure 41% 24%
Total 100% 100%
Caldwell * County_CD Crosstabulation
% within County_CD
County_CD

! 29
Oahu_1 Oahu_2 Hawaii Maui Kauai
Caldwell Positive 40% 42% 34% 42% 36%
Negative 38% 39% 14% 20% 18%
Unsure 22% 20% 52% 39% 46%
Total 100% 100% 100% 100% 100%
! 30
Caldwell * Politics Crosstabulation
% within Politics
Politics
Liberal ModerateConservative Unsure
Caldwell Positive 38% 51% 35% 27%
Negative 29% 23% 44% 29%
Unsure 34% 25% 22% 44%
Total 100% 100% 100% 100%
Caldwell * Party Crosstabulation
% within Party
Party
DemocratRepublican
Independent Unsure
Caldwell Positive 45% 38% 32% 23%
Negative 23% 37% 46% 29%
Unsure 32% 25% 22% 48%
Total 100% 100% 100% 100%
Caldwell * Income Crosstabulation
% within Income
Income
Less than $50,000$50,000-$100,000
More than $100,000 Refused
Caldwell Positive 40% 41% 42% 31%
Negative 27% 33% 32% 30%
Unsure 33% 26% 26% 39%
Total 100% 100% 100% 100%
! 31
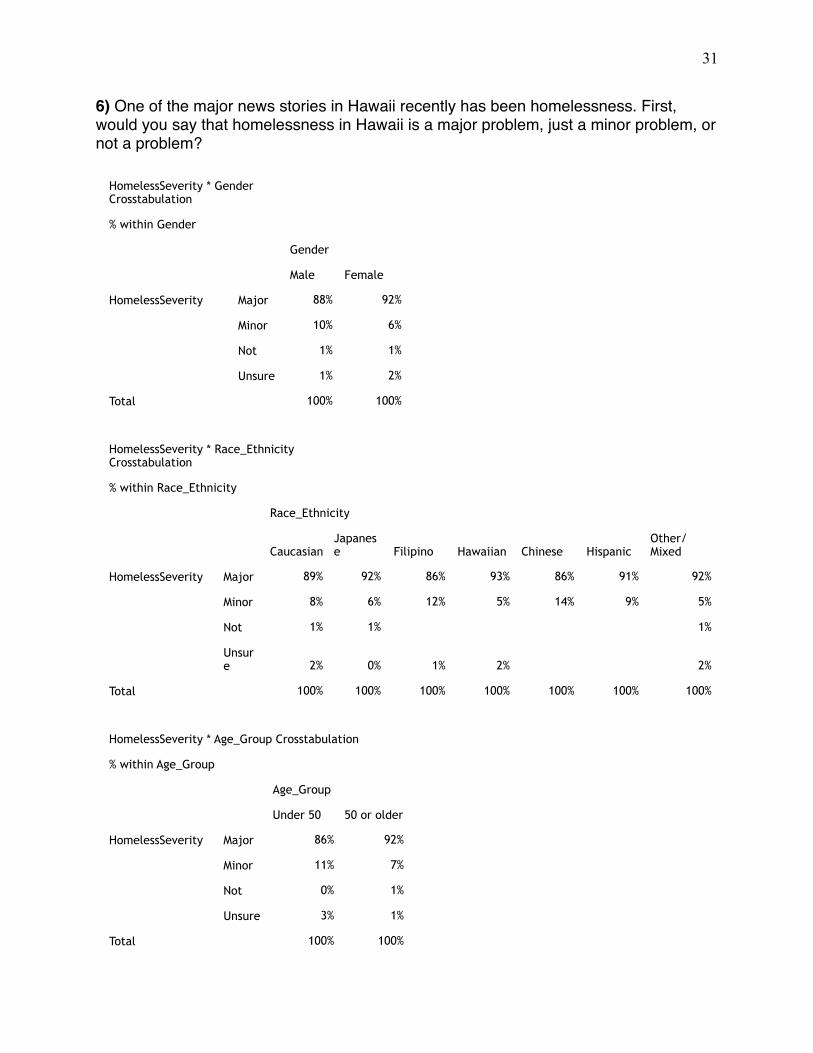
6) One of the major news stories in Hawaii recently has been homelessness. First, would you say that homelessness in Hawaii is a major problem, just a minor problem, or not a problem?
HomelessSeverity * Gender Crosstabulation
% within Gender
Gender
Male Female
HomelessSeverity Major 88% 92%
Minor 10% 6%
Not 1% 1%
Unsure 1% 2%
Total 100% 100%
HomelessSeverity * Race_Ethnicity Crosstabulation
% within Race_Ethnicity
Race_Ethnicity
CaucasianJapanese Filipino Hawaiian Chinese Hispanic
Other/Mixed
HomelessSeverity Major 89% 92% 86% 93% 86% 91% 92%
Minor 8% 6% 12% 5% 14% 9% 5%
Not 1% 1% 1%
Unsure 2% 0% 1% 2% 2%
Total 100% 100% 100% 100% 100% 100% 100%
HomelessSeverity * Age_Group Crosstabulation
% within Age_Group
Age_Group
Under 50 50 or older
HomelessSeverity Major 86% 92%
Minor 11% 7%
Not 0% 1%
Unsure 3% 1%
Total 100% 100%
! 32
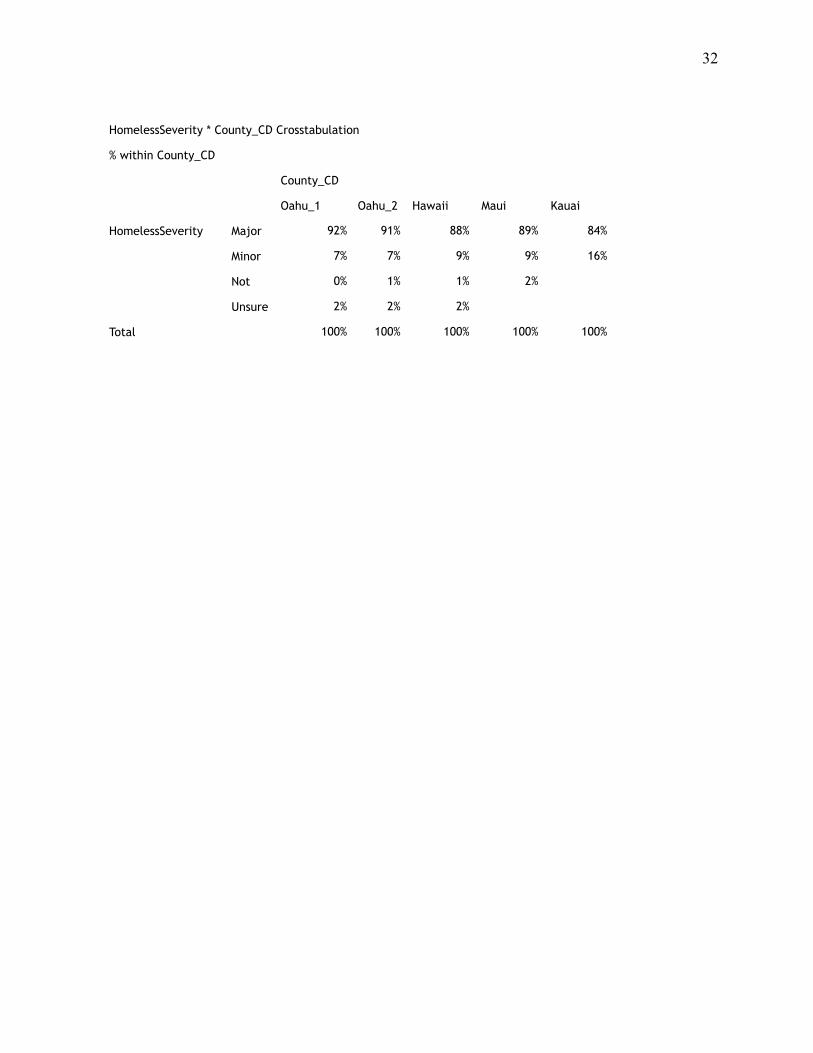
HomelessSeverity * County_CD Crosstabulation
% within County_CD
County_CD
Oahu_1 Oahu_2 Hawaii Maui Kauai
HomelessSeverity Major 92% 91% 88% 89% 84%
Minor 7% 7% 9% 9% 16%
Not 0% 1% 1% 2%
Unsure 2% 2% 2%
Total 100% 100% 100% 100% 100%
! 33
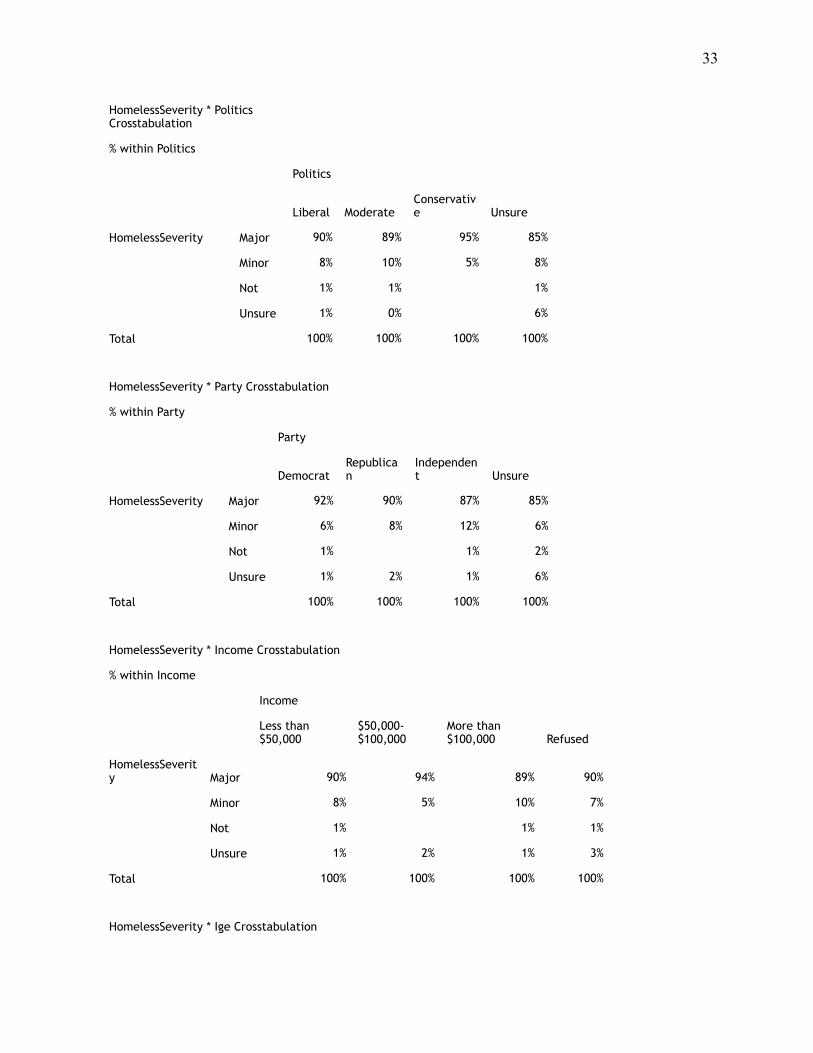
HomelessSeverity * Politics Crosstabulation
% within Politics
Politics
Liberal ModerateConservative Unsure
HomelessSeverity Major 90% 89% 95% 85%
Minor 8% 10% 5% 8%
Not 1% 1% 1%
Unsure 1% 0% 6%
Total 100% 100% 100% 100%
HomelessSeverity * Party Crosstabulation
% within Party
Party
DemocratRepublican
Independent Unsure
HomelessSeverity Major 92% 90% 87% 85%
Minor 6% 8% 12% 6%
Not 1% 1% 2%
Unsure 1% 2% 1% 6%
Total 100% 100% 100% 100%
HomelessSeverity * Income Crosstabulation
% within Income
Income
Less than $50,000
$50,000-$100,000
More than $100,000 Refused
HomelessSeverity Major 90% 94% 89% 90%
Minor 8% 5% 10% 7%
Not 1% 1% 1%
Unsure 1% 2% 1% 3%
Total 100% 100% 100% 100%
HomelessSeverity * Ige Crosstabulation
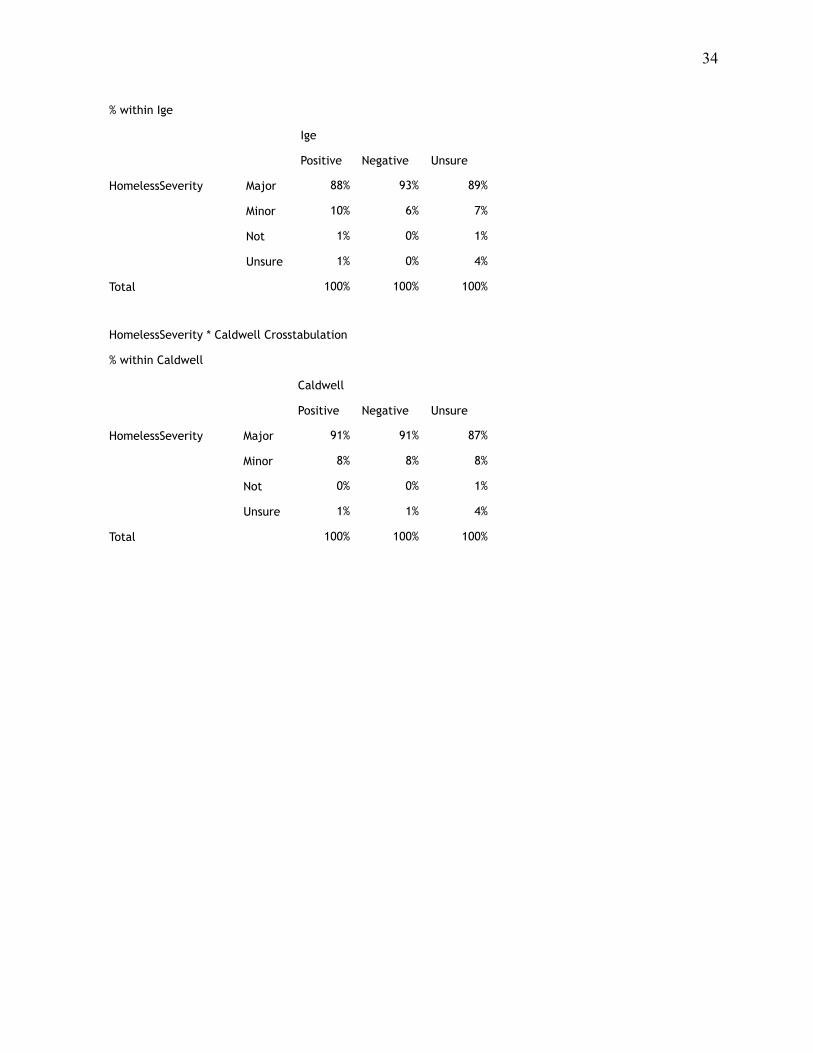
! 34
% within Ige
Ige
Positive Negative Unsure
HomelessSeverity Major 88% 93% 89%
Minor 10% 6% 7%
Not 1% 0% 1%
Unsure 1% 0% 4%
Total 100% 100% 100%
HomelessSeverity * Caldwell Crosstabulation
% within Caldwell
Caldwell
Positive Negative Unsure
HomelessSeverity Major 91% 91% 87%
Minor 8% 8% 8%
Not 0% 0% 1%
Unsure 1% 1% 4%
Total 100% 100% 100%
! 35
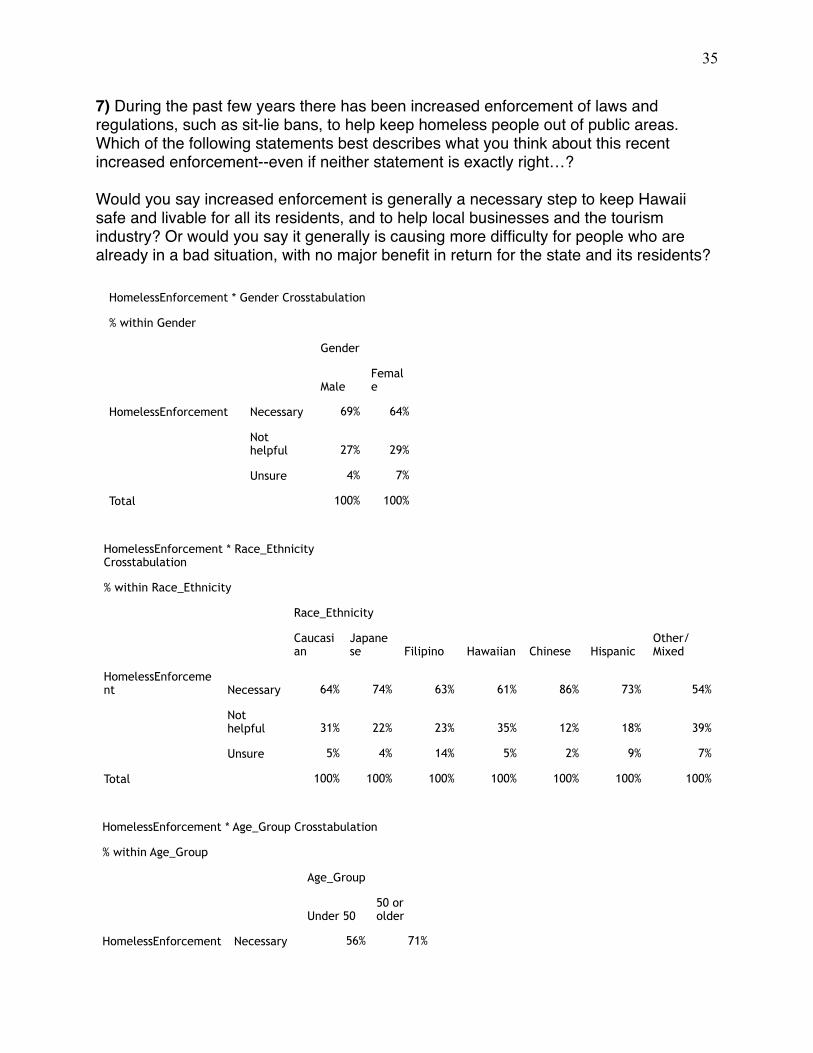
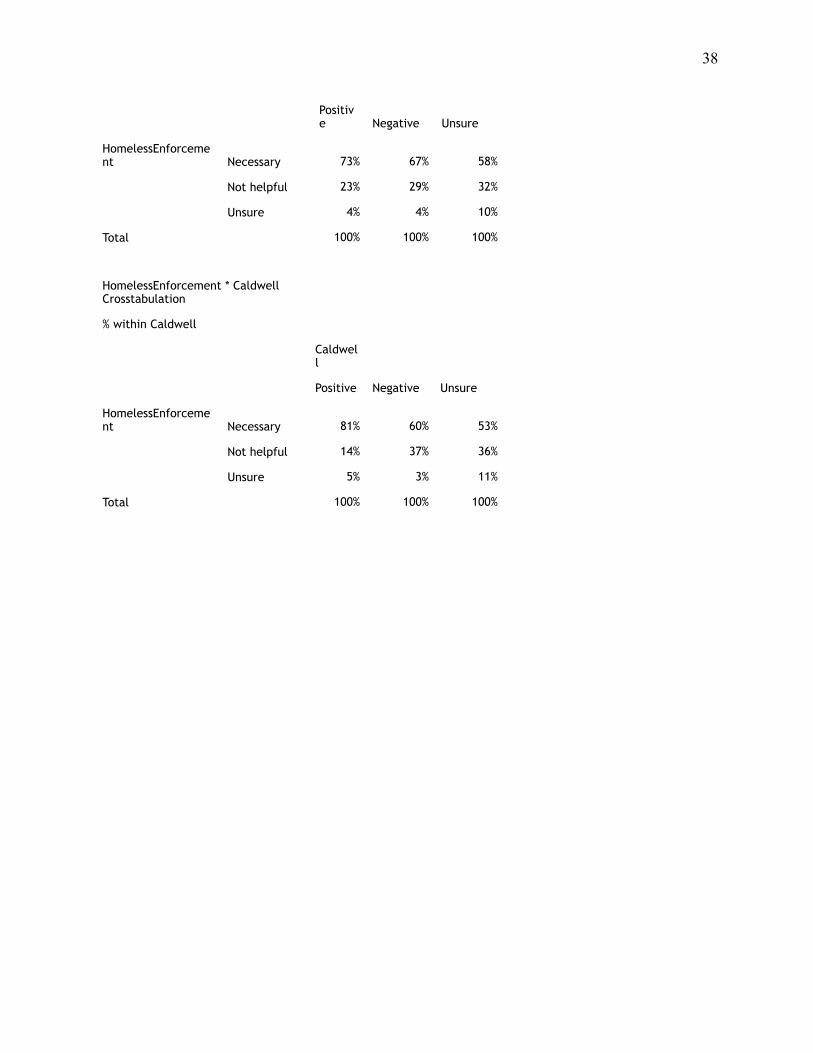
7) During the past few years there has been increased enforcement of laws and regulations, such as sit-lie bans, to help keep homeless people out of public areas. Which of the following statements best describes what you think about this recent increased enforcement--even if neither statement is exactly right…?
Would you say increased enforcement is generally a necessary step to keep Hawaii safe and livable for all its residents, and to help local businesses and the tourism industry? Or would you say it generally is causing more difficulty for people who are already in a bad situation, with no major benefit in return for the state and its residents?
HomelessEnforcement * Gender Crosstabulation
% within Gender
Gender
MaleFemale
HomelessEnforcement Necessary 69% 64%
Not helpful 27% 29%
Unsure 4% 7%
Total 100% 100%
HomelessEnforcement * Race_Ethnicity Crosstabulation
% within Race_Ethnicity
Race_Ethnicity
Caucasian
Japanese Filipino Hawaiian Chinese Hispanic
Other/Mixed
HomelessEnforcement Necessary 64% 74% 63% 61% 86% 73% 54%
Not helpful 31% 22% 23% 35% 12% 18% 39%
Unsure 5% 4% 14% 5% 2% 9% 7%
Total 100% 100% 100% 100% 100% 100% 100%
HomelessEnforcement * Age_Group Crosstabulation
% within Age_Group
Age_Group
Under 5050 or older
HomelessEnforcement Necessary 56% 71%
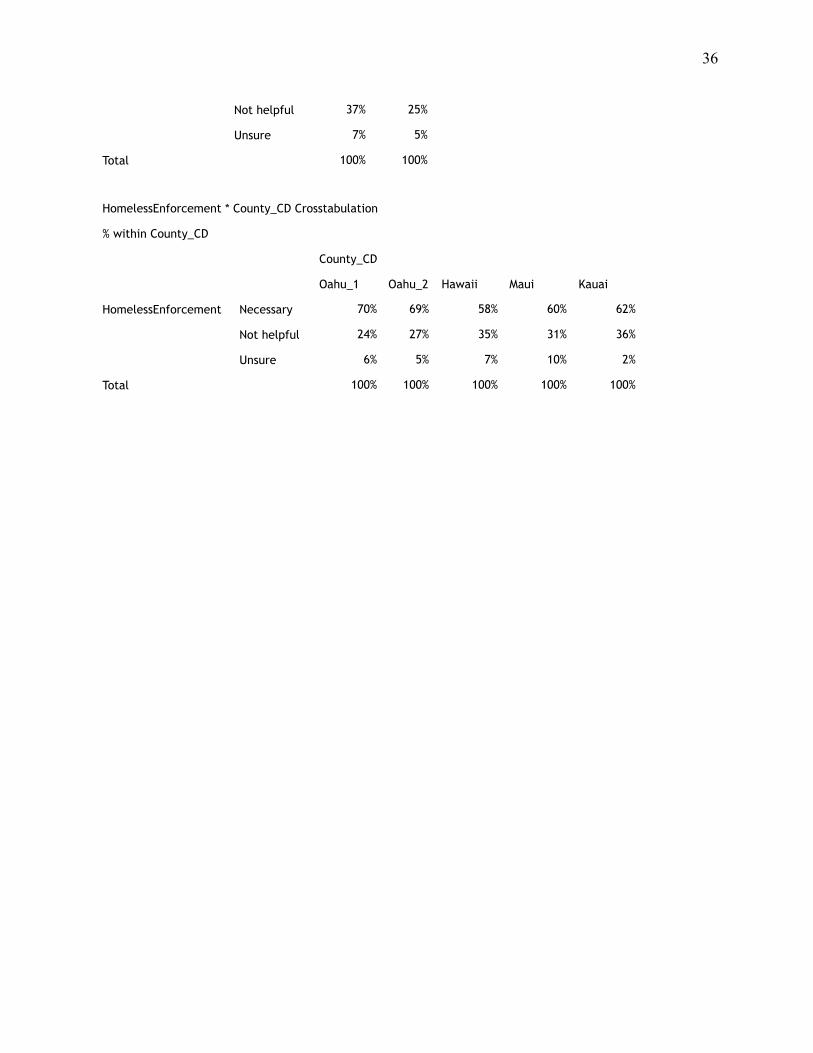
! 36
Not helpful 37% 25%
Unsure 7% 5%
Total 100% 100%
HomelessEnforcement * County_CD Crosstabulation
% within County_CD
County_CD
Oahu_1 Oahu_2 Hawaii Maui Kauai
HomelessEnforcement Necessary 70% 69% 58% 60% 62%
Not helpful 24% 27% 35% 31% 36%
Unsure 6% 5% 7% 10% 2%
Total 100% 100% 100% 100% 100%
! 37
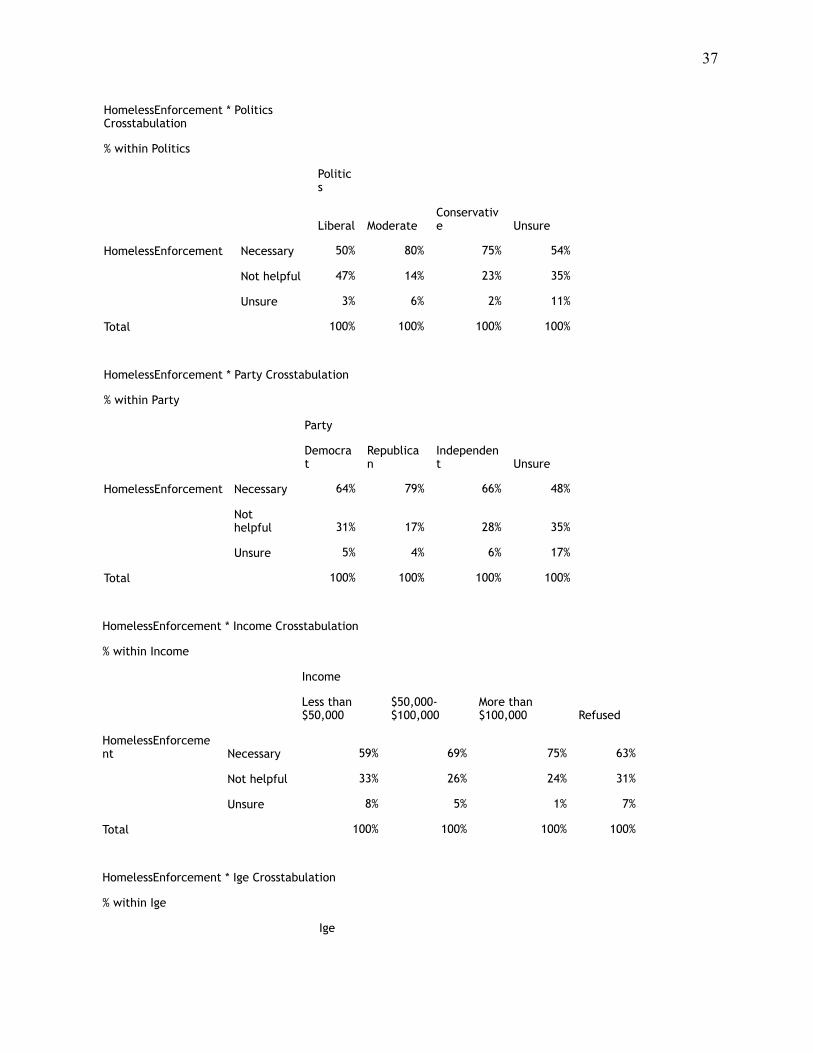
HomelessEnforcement * Politics Crosstabulation
% within Politics
Politics
Liberal ModerateConservative Unsure
HomelessEnforcement Necessary 50% 80% 75% 54%
Not helpful 47% 14% 23% 35%
Unsure 3% 6% 2% 11%
Total 100% 100% 100% 100%
HomelessEnforcement * Party Crosstabulation
% within Party
Party
Democrat
Republican
Independent Unsure
HomelessEnforcement Necessary 64% 79% 66% 48%
Not helpful 31% 17% 28% 35%
Unsure 5% 4% 6% 17%
Total 100% 100% 100% 100%
HomelessEnforcement * Income Crosstabulation
% within Income
Income
Less than $50,000
$50,000-$100,000
More than $100,000 Refused
HomelessEnforcement Necessary 59% 69% 75% 63%
Not helpful 33% 26% 24% 31%
Unsure 8% 5% 1% 7%
Total 100% 100% 100% 100%
HomelessEnforcement * Ige Crosstabulation
% within Ige
Ige
! 38
Positive Negative Unsure
HomelessEnforcement Necessary 73% 67% 58%
Not helpful 23% 29% 32%
Unsure 4% 4% 10%
Total 100% 100% 100%
HomelessEnforcement * Caldwell Crosstabulation
% within Caldwell
Caldwell
Positive Negative Unsure
HomelessEnforcement Necessary 81% 60% 53%
Not helpful 14% 37% 36%
Unsure 5% 3% 11%
Total 100% 100% 100%
! 39
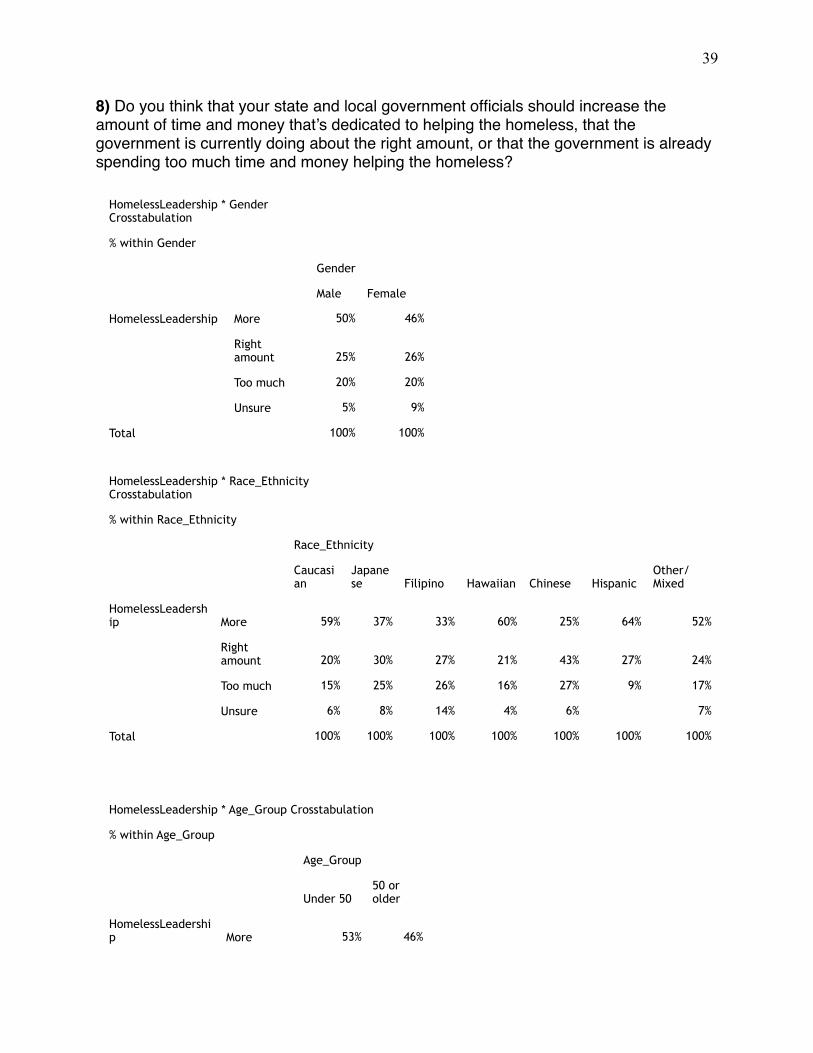
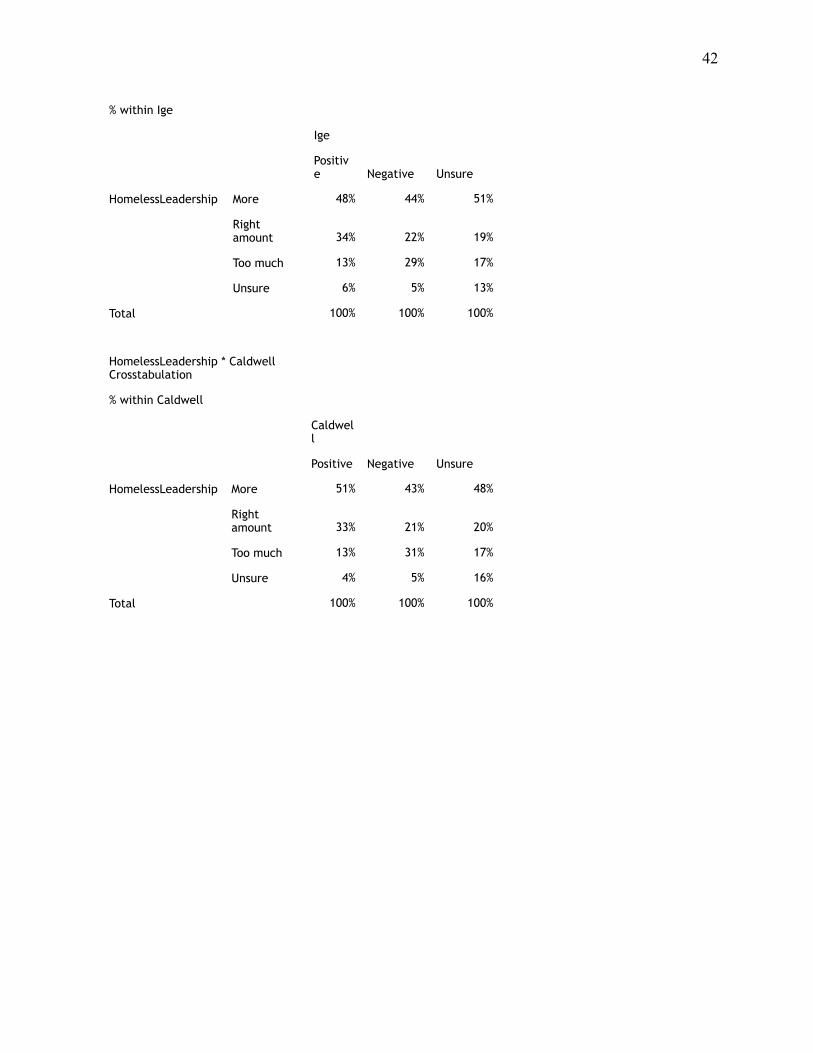
8) Do you think that your state and local government officials should increase the amount of time and money that’s dedicated to helping the homeless, that the government is currently doing about the right amount, or that the government is already spending too much time and money helping the homeless?
HomelessLeadership * Gender Crosstabulation
% within Gender
Gender
Male Female
HomelessLeadership More 50% 46%
Right amount 25% 26%
Too much 20% 20%
Unsure 5% 9%
Total 100% 100%
HomelessLeadership * Race_Ethnicity Crosstabulation
% within Race_Ethnicity
Race_Ethnicity
Caucasian
Japanese Filipino Hawaiian Chinese Hispanic
Other/Mixed
HomelessLeadership More 59% 37% 33% 60% 25% 64% 52%
Right amount 20% 30% 27% 21% 43% 27% 24%
Too much 15% 25% 26% 16% 27% 9% 17%
Unsure 6% 8% 14% 4% 6% 7%
Total 100% 100% 100% 100% 100% 100% 100%
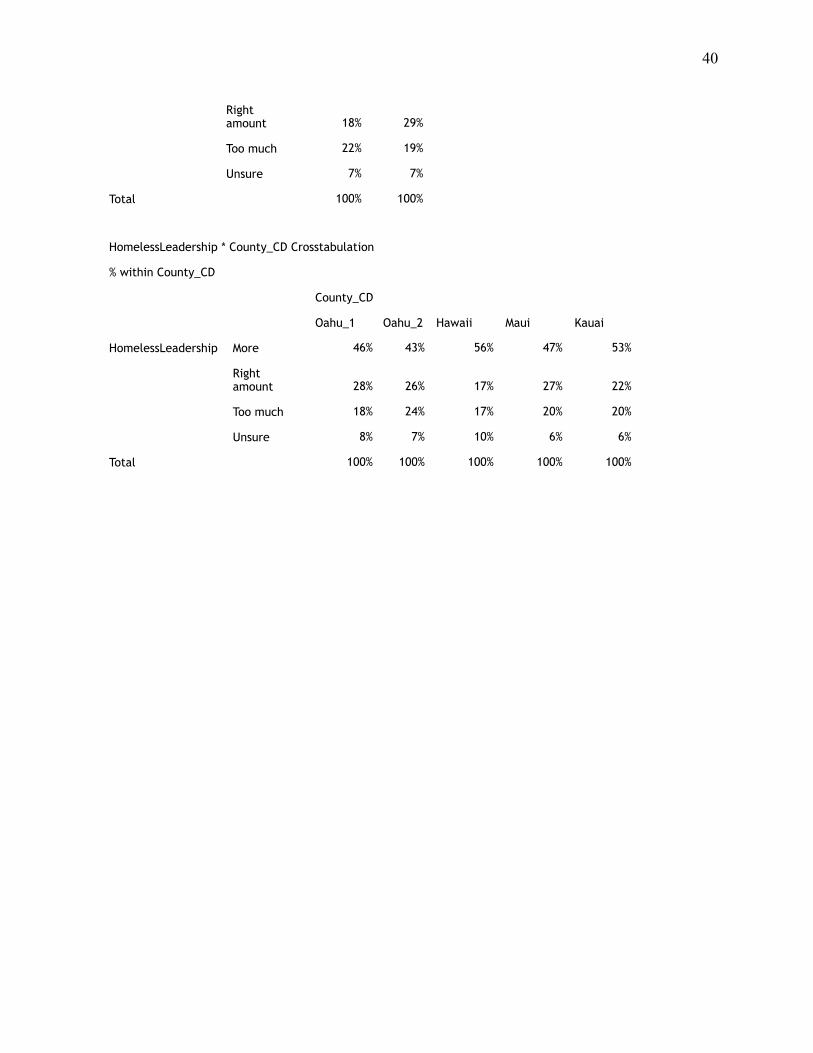
HomelessLeadership * Age_Group Crosstabulation
% within Age_Group
Age_Group
Under 5050 or older
HomelessLeadership More 53% 46%
! 40
Right amount 18% 29%
Too much 22% 19%
Unsure 7% 7%
Total 100% 100%
HomelessLeadership * County_CD Crosstabulation
% within County_CD
County_CD
Oahu_1 Oahu_2 Hawaii Maui Kauai
HomelessLeadership More 46% 43% 56% 47% 53%
Right amount 28% 26% 17% 27% 22%
Too much 18% 24% 17% 20% 20%
Unsure 8% 7% 10% 6% 6%
Total 100% 100% 100% 100% 100%
! 41
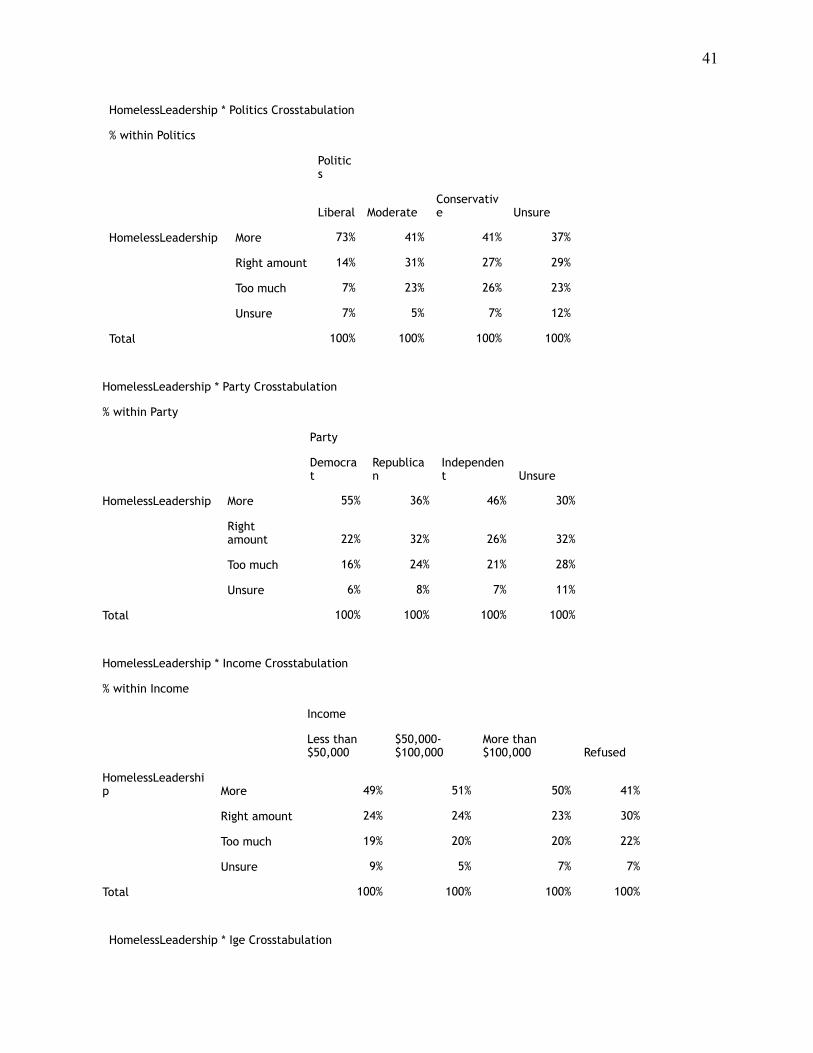
HomelessLeadership * Politics Crosstabulation
% within Politics
Politics
Liberal ModerateConservative Unsure
HomelessLeadership More 73% 41% 41% 37%
Right amount 14% 31% 27% 29%
Too much 7% 23% 26% 23%
Unsure 7% 5% 7% 12%
Total 100% 100% 100% 100%
HomelessLeadership * Party Crosstabulation
% within Party
Party
Democrat
Republican
Independent Unsure
HomelessLeadership More 55% 36% 46% 30%
Right amount 22% 32% 26% 32%
Too much 16% 24% 21% 28%
Unsure 6% 8% 7% 11%
Total 100% 100% 100% 100%
HomelessLeadership * Income Crosstabulation
% within Income
Income
Less than $50,000
$50,000-$100,000
More than $100,000 Refused
HomelessLeadership More 49% 51% 50% 41%
Right amount 24% 24% 23% 30%
Too much 19% 20% 20% 22%
Unsure 9% 5% 7% 7%
Total 100% 100% 100% 100%
HomelessLeadership * Ige Crosstabulation
! 42
% within Ige
Ige
Positive Negative Unsure
HomelessLeadership More 48% 44% 51%
Right amount 34% 22% 19%
Too much 13% 29% 17%
Unsure 6% 5% 13%
Total 100% 100% 100%
HomelessLeadership * Caldwell Crosstabulation
% within Caldwell
Caldwell
Positive Negative Unsure
HomelessLeadership More 51% 43% 48%
Right amount 33% 21% 20%
Too much 13% 31% 17%
Unsure 4% 5% 16%
Total 100% 100% 100%
! 43
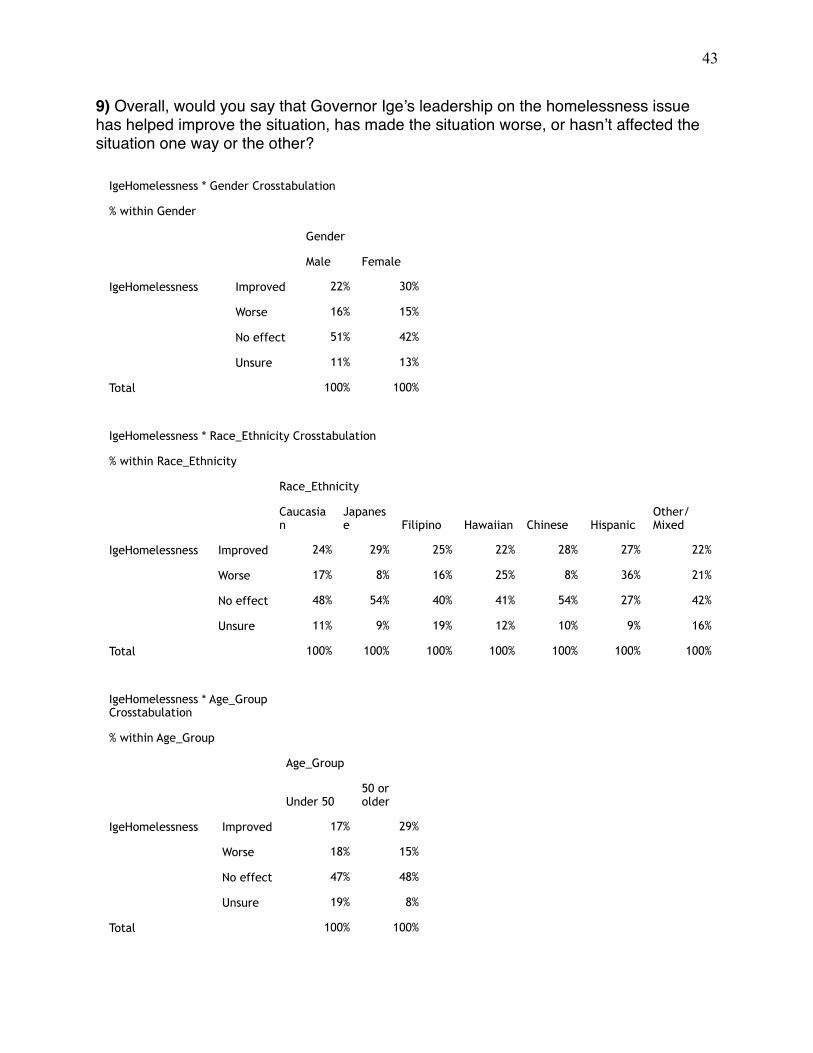
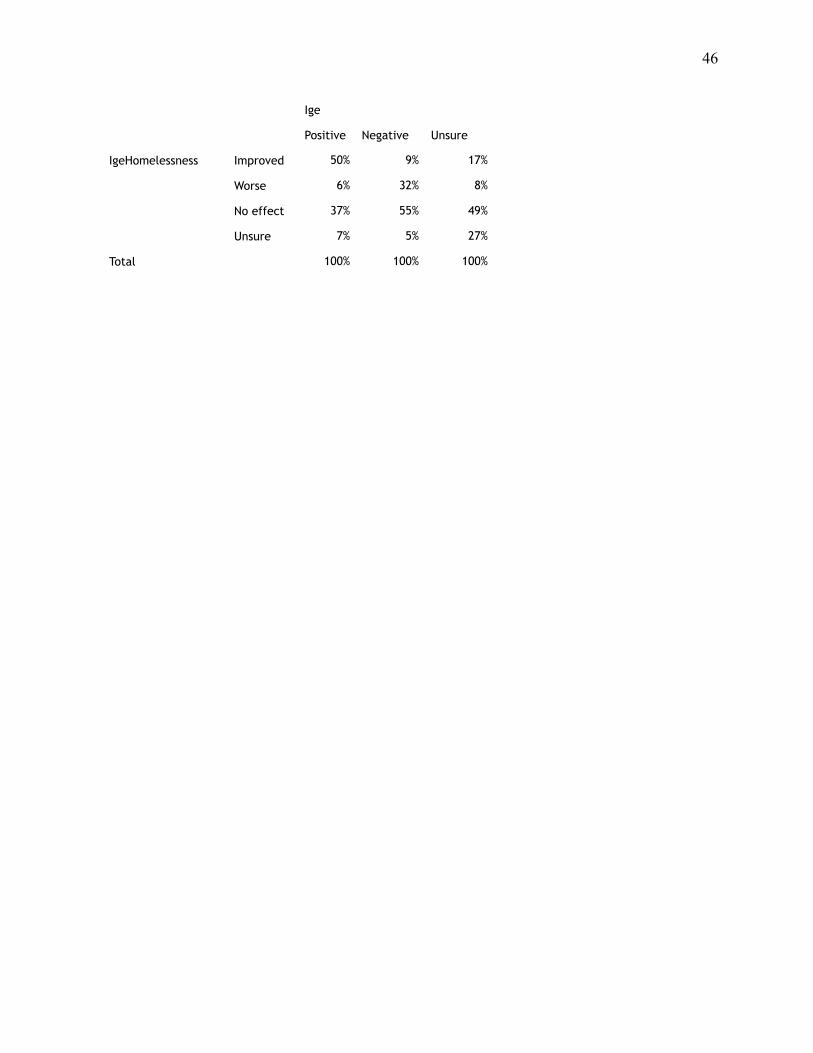
9) Overall, would you say that Governor Ige’s leadership on the homelessness issue has helped improve the situation, has made the situation worse, or hasn’t affected the situation one way or the other?
IgeHomelessness * Gender Crosstabulation
% within Gender
Gender
Male Female
IgeHomelessness Improved 22% 30%
Worse 16% 15%
No effect 51% 42%
Unsure 11% 13%
Total 100% 100%
IgeHomelessness * Race_Ethnicity Crosstabulation
% within Race_Ethnicity
Race_Ethnicity
Caucasian
Japanese Filipino Hawaiian Chinese Hispanic
Other/Mixed
IgeHomelessness Improved 24% 29% 25% 22% 28% 27% 22%
Worse 17% 8% 16% 25% 8% 36% 21%
No effect 48% 54% 40% 41% 54% 27% 42%
Unsure 11% 9% 19% 12% 10% 9% 16%
Total 100% 100% 100% 100% 100% 100% 100%
IgeHomelessness * Age_Group Crosstabulation
% within Age_Group
Age_Group
Under 5050 or older
IgeHomelessness Improved 17% 29%
Worse 18% 15%
No effect 47% 48%
Unsure 19% 8%
Total 100% 100%
! 44
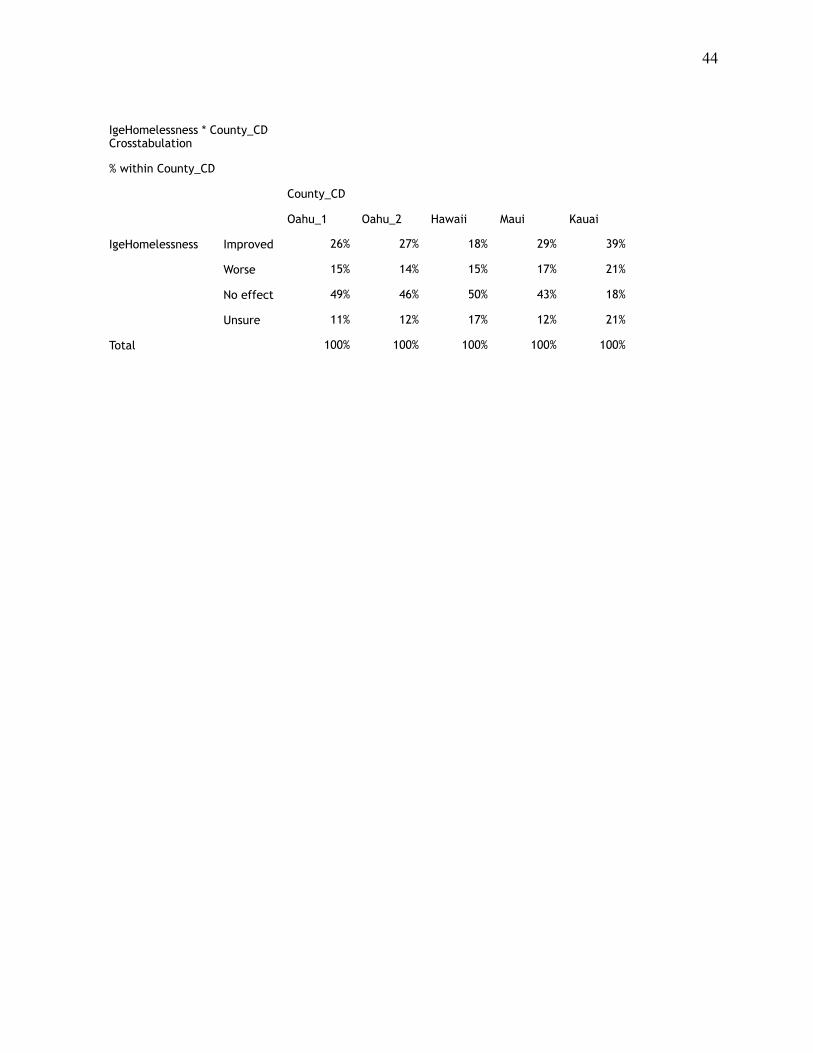
IgeHomelessness * County_CD Crosstabulation
% within County_CD
County_CD
Oahu_1 Oahu_2 Hawaii Maui Kauai
IgeHomelessness Improved 26% 27% 18% 29% 39%
Worse 15% 14% 15% 17% 21%
No effect 49% 46% 50% 43% 18%
Unsure 11% 12% 17% 12% 21%
Total 100% 100% 100% 100% 100%
! 45
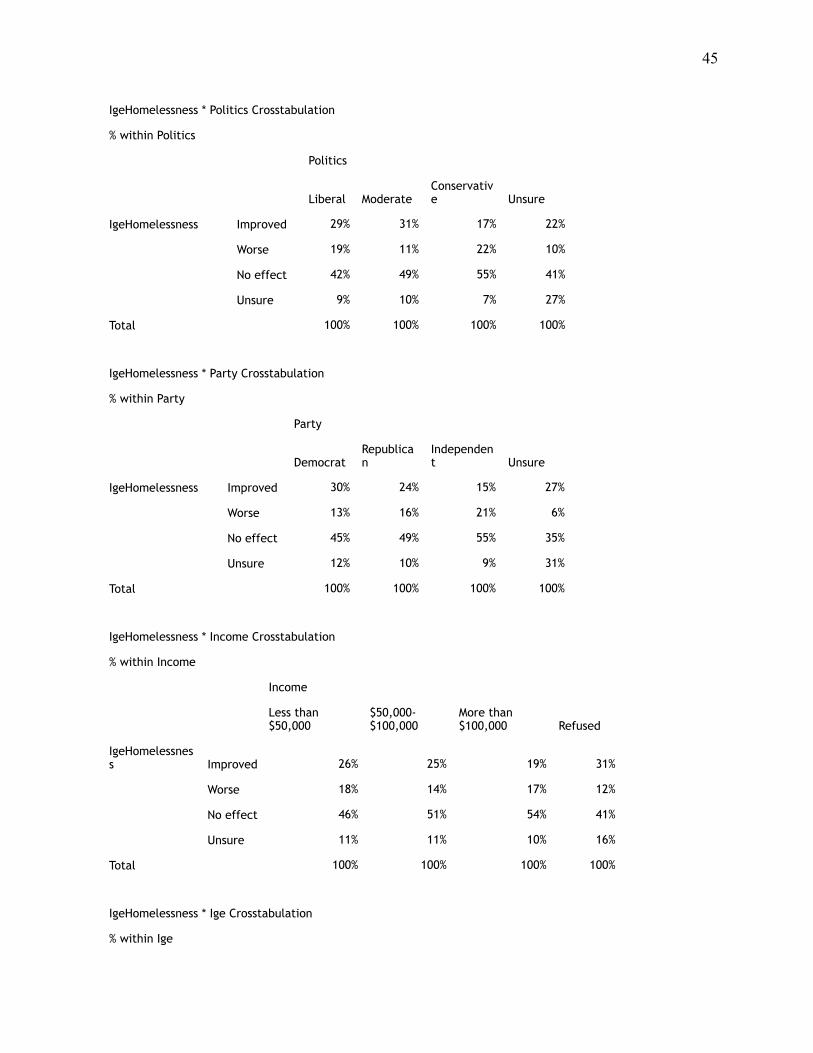
IgeHomelessness * Politics Crosstabulation
% within Politics
Politics
Liberal ModerateConservative Unsure
IgeHomelessness Improved 29% 31% 17% 22%
Worse 19% 11% 22% 10%
No effect 42% 49% 55% 41%
Unsure 9% 10% 7% 27%
Total 100% 100% 100% 100%
IgeHomelessness * Party Crosstabulation
% within Party
Party
DemocratRepublican
Independent Unsure
IgeHomelessness Improved 30% 24% 15% 27%
Worse 13% 16% 21% 6%
No effect 45% 49% 55% 35%
Unsure 12% 10% 9% 31%
Total 100% 100% 100% 100%
IgeHomelessness * Income Crosstabulation
% within Income
Income
Less than $50,000
$50,000-$100,000
More than $100,000 Refused
IgeHomelessness Improved 26% 25% 19% 31%
Worse 18% 14% 17% 12%
No effect 46% 51% 54% 41%
Unsure 11% 11% 10% 16%
Total 100% 100% 100% 100%
IgeHomelessness * Ige Crosstabulation
% within Ige
! 46
Ige
Positive Negative Unsure
IgeHomelessness Improved 50% 9% 17%
Worse 6% 32% 8%
No effect 37% 55% 49%
Unsure 7% 5% 27%
Total 100% 100% 100%
! 47
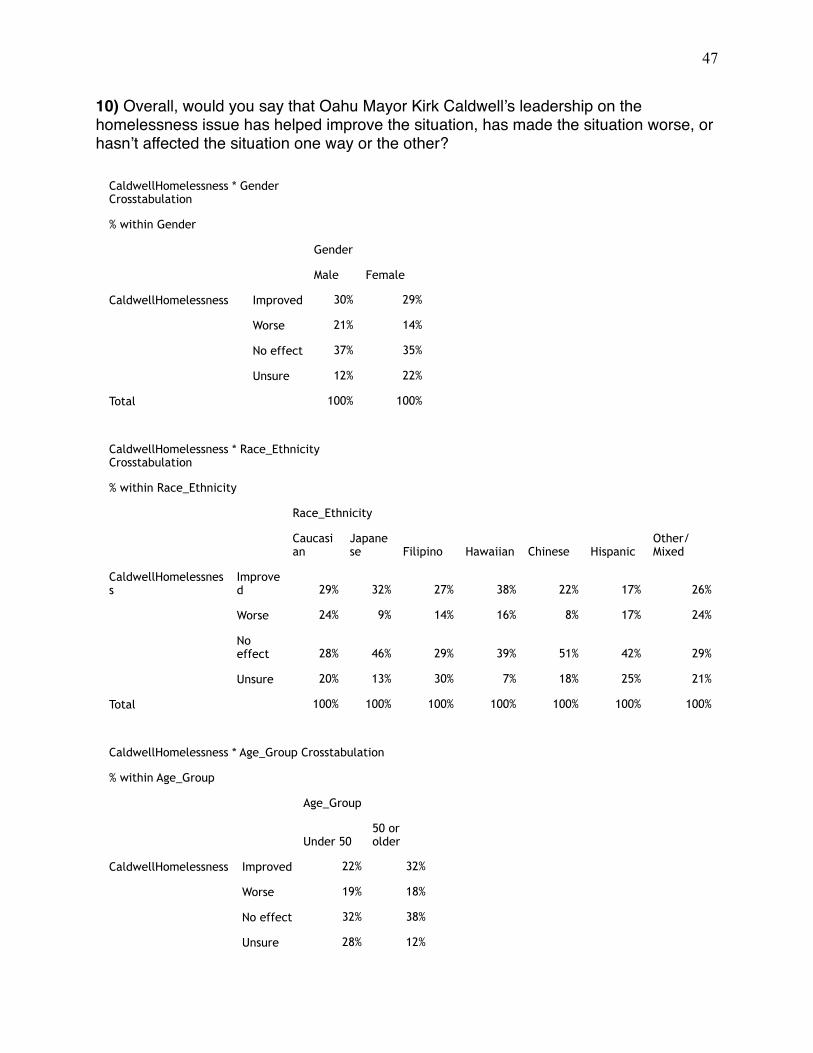
10) Overall, would you say that Oahu Mayor Kirk Caldwell’s leadership on the homelessness issue has helped improve the situation, has made the situation worse, or hasn’t affected the situation one way or the other?
CaldwellHomelessness * Gender Crosstabulation
% within Gender
Gender
Male Female
CaldwellHomelessness Improved 30% 29%
Worse 21% 14%
No effect 37% 35%
Unsure 12% 22%
Total 100% 100%
CaldwellHomelessness * Race_Ethnicity Crosstabulation
% within Race_Ethnicity
Race_Ethnicity
Caucasian
Japanese Filipino Hawaiian Chinese Hispanic
Other/Mixed
CaldwellHomelessness
Improved 29% 32% 27% 38% 22% 17% 26%
Worse 24% 9% 14% 16% 8% 17% 24%
No effect 28% 46% 29% 39% 51% 42% 29%
Unsure 20% 13% 30% 7% 18% 25% 21%
Total 100% 100% 100% 100% 100% 100% 100%
CaldwellHomelessness * Age_Group Crosstabulation
% within Age_Group
Age_Group
Under 5050 or older
CaldwellHomelessness Improved 22% 32%
Worse 19% 18%
No effect 32% 38%
Unsure 28% 12%
! 48
Total 100% 100%
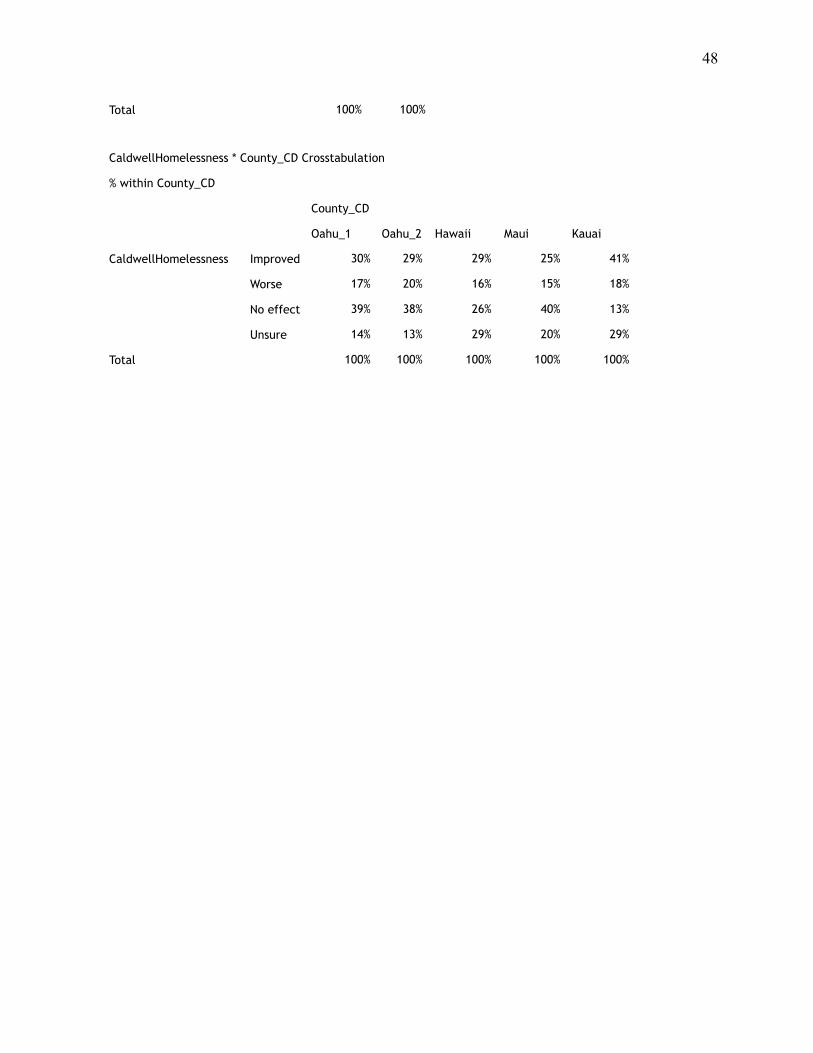
CaldwellHomelessness * County_CD Crosstabulation
% within County_CD
County_CD
Oahu_1 Oahu_2 Hawaii Maui Kauai
CaldwellHomelessness Improved 30% 29% 29% 25% 41%
Worse 17% 20% 16% 15% 18%
No effect 39% 38% 26% 40% 13%
Unsure 14% 13% 29% 20% 29%
Total 100% 100% 100% 100% 100%
! 49
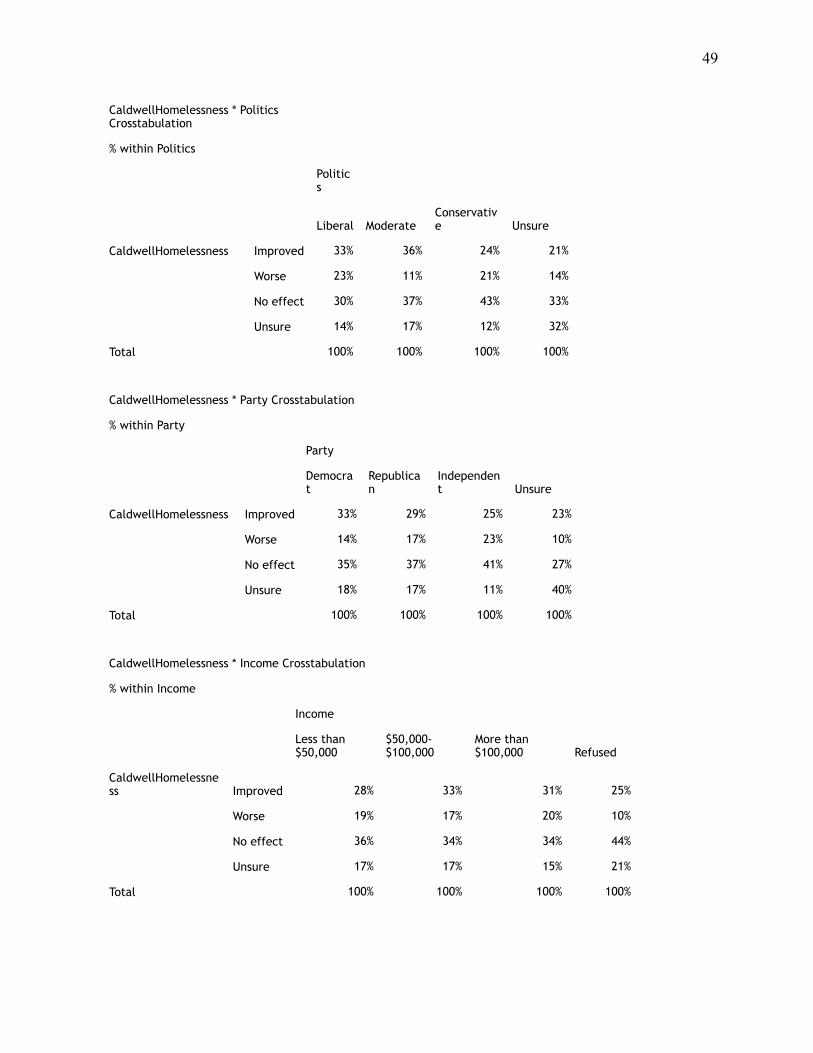
CaldwellHomelessness * Politics Crosstabulation
% within Politics
Politics
Liberal ModerateConservative Unsure
CaldwellHomelessness Improved 33% 36% 24% 21%
Worse 23% 11% 21% 14%
No effect 30% 37% 43% 33%
Unsure 14% 17% 12% 32%
Total 100% 100% 100% 100%
CaldwellHomelessness * Party Crosstabulation
% within Party
Party
Democrat
Republican
Independent Unsure
CaldwellHomelessness Improved 33% 29% 25% 23%
Worse 14% 17% 23% 10%
No effect 35% 37% 41% 27%
Unsure 18% 17% 11% 40%
Total 100% 100% 100% 100%
CaldwellHomelessness * Income Crosstabulation
% within Income
Income
Less than $50,000
$50,000-$100,000
More than $100,000 Refused
CaldwellHomelessness Improved 28% 33% 31% 25%
Worse 19% 17% 20% 10%
No effect 36% 34% 34% 44%
Unsure 17% 17% 15% 21%
Total 100% 100% 100% 100%
! 50
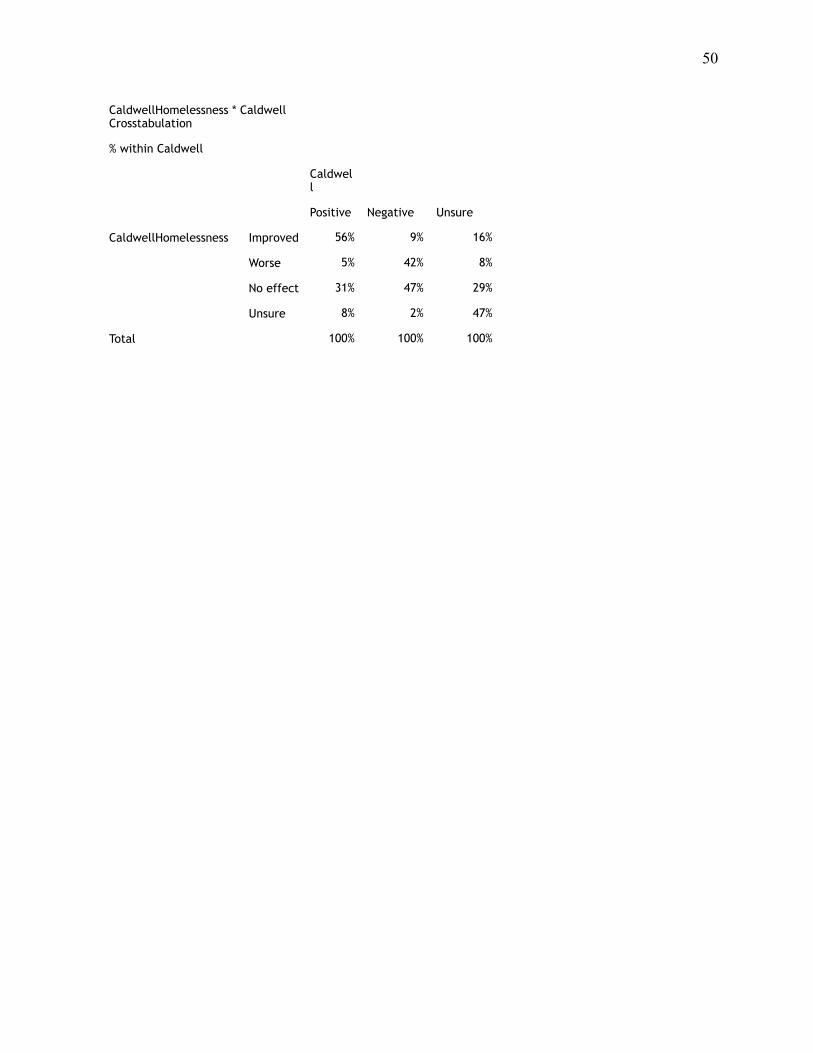
CaldwellHomelessness * Caldwell Crosstabulation
% within Caldwell
Caldwell
Positive Negative Unsure
CaldwellHomelessness Improved 56% 9% 16%
Worse 5% 42% 8%
No effect 31% 47% 29%
Unsure 8% 2% 47%
Total 100% 100% 100%
! 51
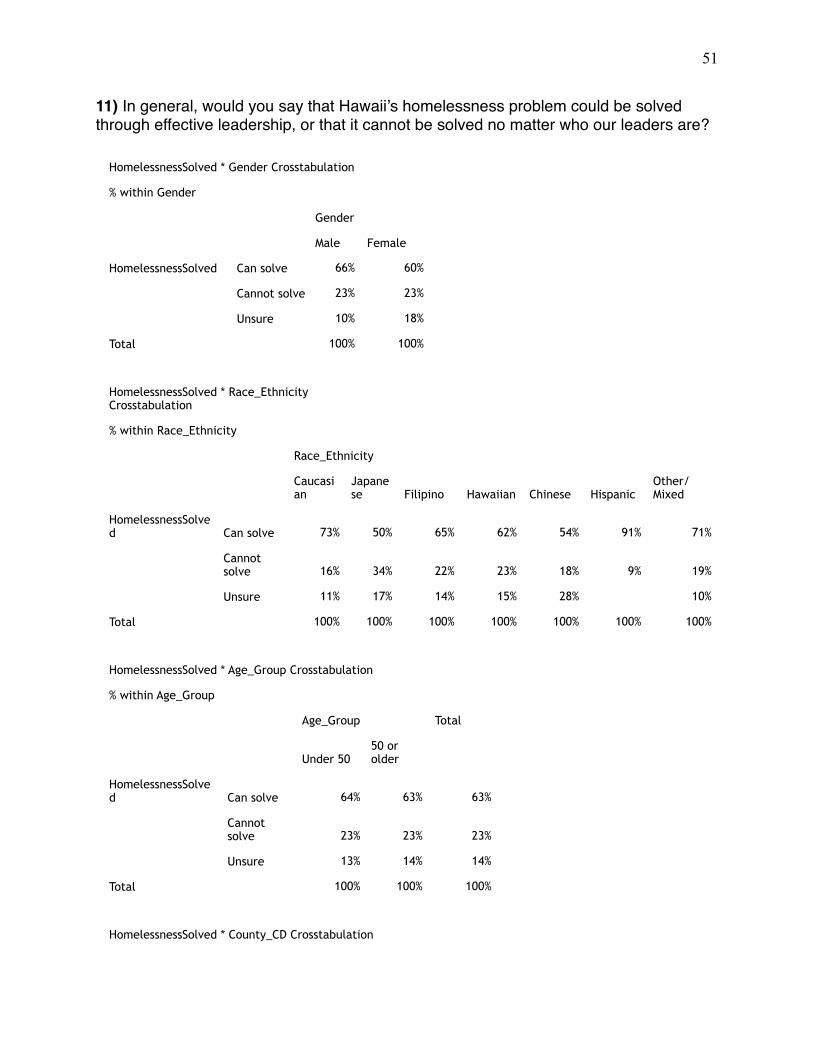
11) In general, would you say that Hawaii’s homelessness problem could be solved through effective leadership, or that it cannot be solved no matter who our leaders are?
HomelessnessSolved * Gender Crosstabulation
% within Gender
Gender
Male Female
HomelessnessSolved Can solve 66% 60%
Cannot solve 23% 23%
Unsure 10% 18%
Total 100% 100%
HomelessnessSolved * Race_Ethnicity Crosstabulation
% within Race_Ethnicity
Race_Ethnicity
Caucasian
Japanese Filipino Hawaiian Chinese Hispanic
Other/Mixed
HomelessnessSolved Can solve 73% 50% 65% 62% 54% 91% 71%
Cannot solve 16% 34% 22% 23% 18% 9% 19%
Unsure 11% 17% 14% 15% 28% 10%
Total 100% 100% 100% 100% 100% 100% 100%
HomelessnessSolved * Age_Group Crosstabulation
% within Age_Group
Age_Group Total
Under 5050 or older
HomelessnessSolved Can solve 64% 63% 63%
Cannot solve 23% 23% 23%
Unsure 13% 14% 14%
Total 100% 100% 100%
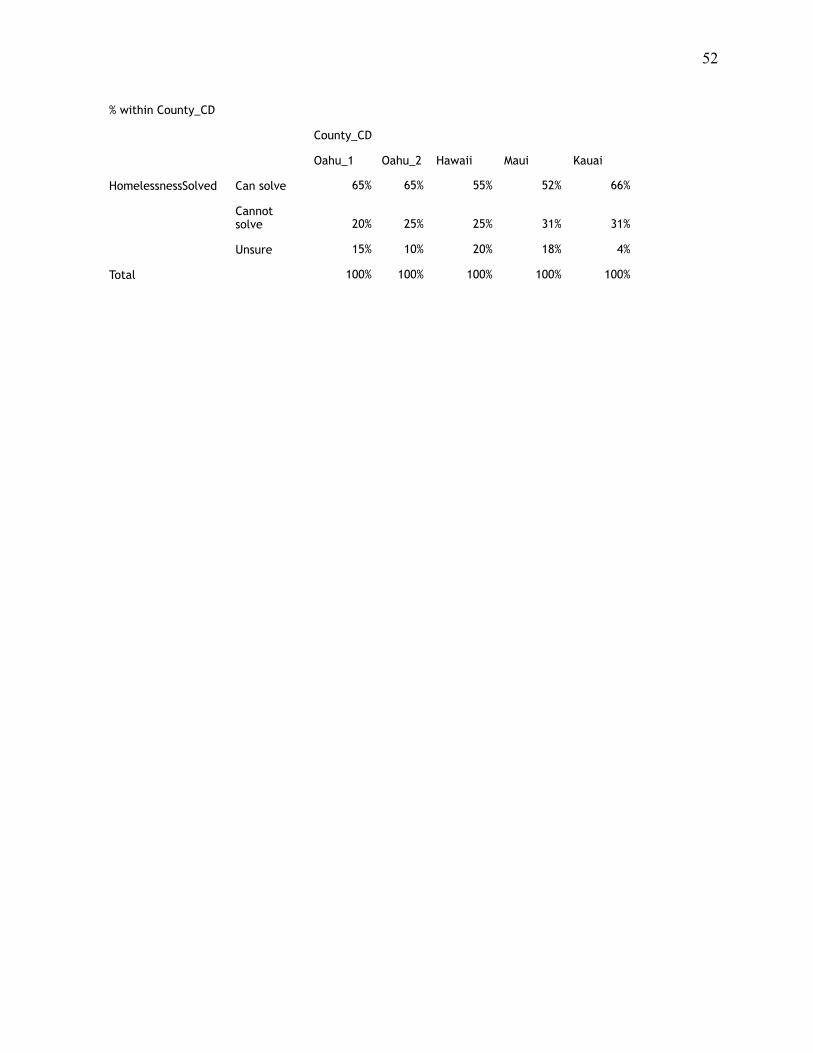
HomelessnessSolved * County_CD Crosstabulation
! 52
% within County_CD
County_CD
Oahu_1 Oahu_2 Hawaii Maui Kauai
HomelessnessSolved Can solve 65% 65% 55% 52% 66%
Cannot solve 20% 25% 25% 31% 31%
Unsure 15% 10% 20% 18% 4%
Total 100% 100% 100% 100% 100%
! 53
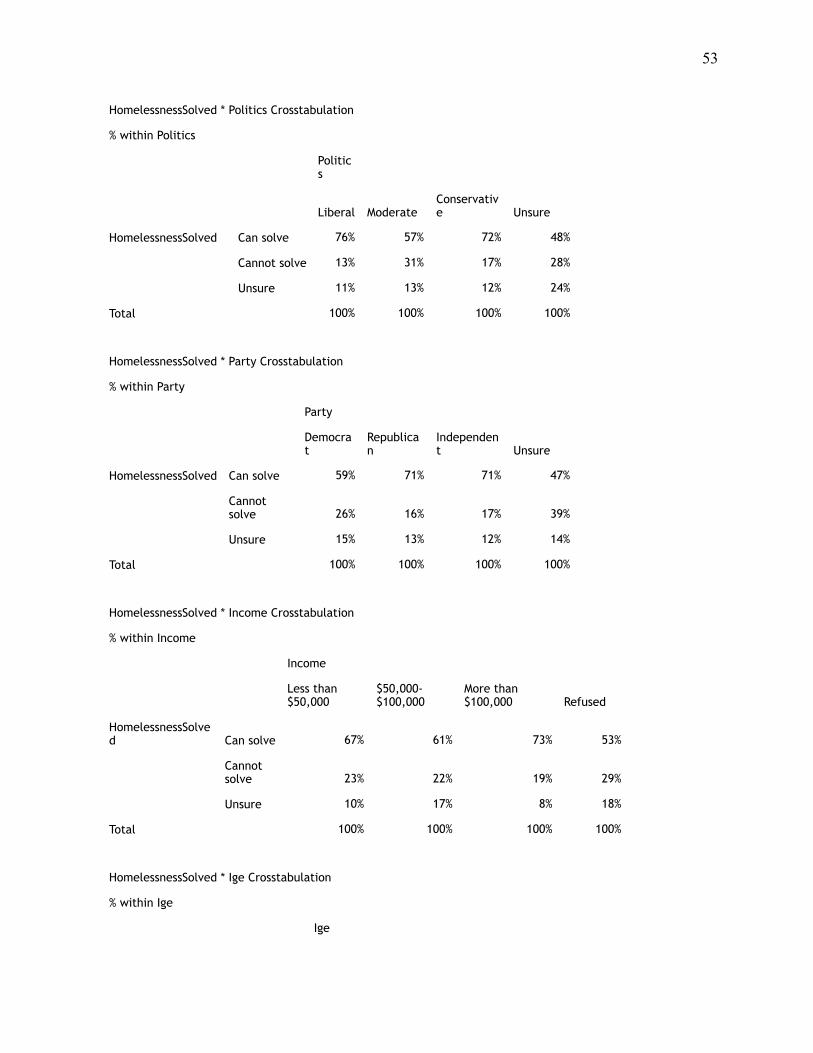
HomelessnessSolved * Politics Crosstabulation
% within Politics
Politics
Liberal ModerateConservative Unsure
HomelessnessSolved Can solve 76% 57% 72% 48%
Cannot solve 13% 31% 17% 28%
Unsure 11% 13% 12% 24%
Total 100% 100% 100% 100%
HomelessnessSolved * Party Crosstabulation
% within Party
Party
Democrat
Republican
Independent Unsure
HomelessnessSolved Can solve 59% 71% 71% 47%
Cannot solve 26% 16% 17% 39%
Unsure 15% 13% 12% 14%
Total 100% 100% 100% 100%
HomelessnessSolved * Income Crosstabulation
% within Income
Income
Less than $50,000
$50,000-$100,000
More than $100,000 Refused
HomelessnessSolved Can solve 67% 61% 73% 53%
Cannot solve 23% 22% 19% 29%
Unsure 10% 17% 8% 18%
Total 100% 100% 100% 100%
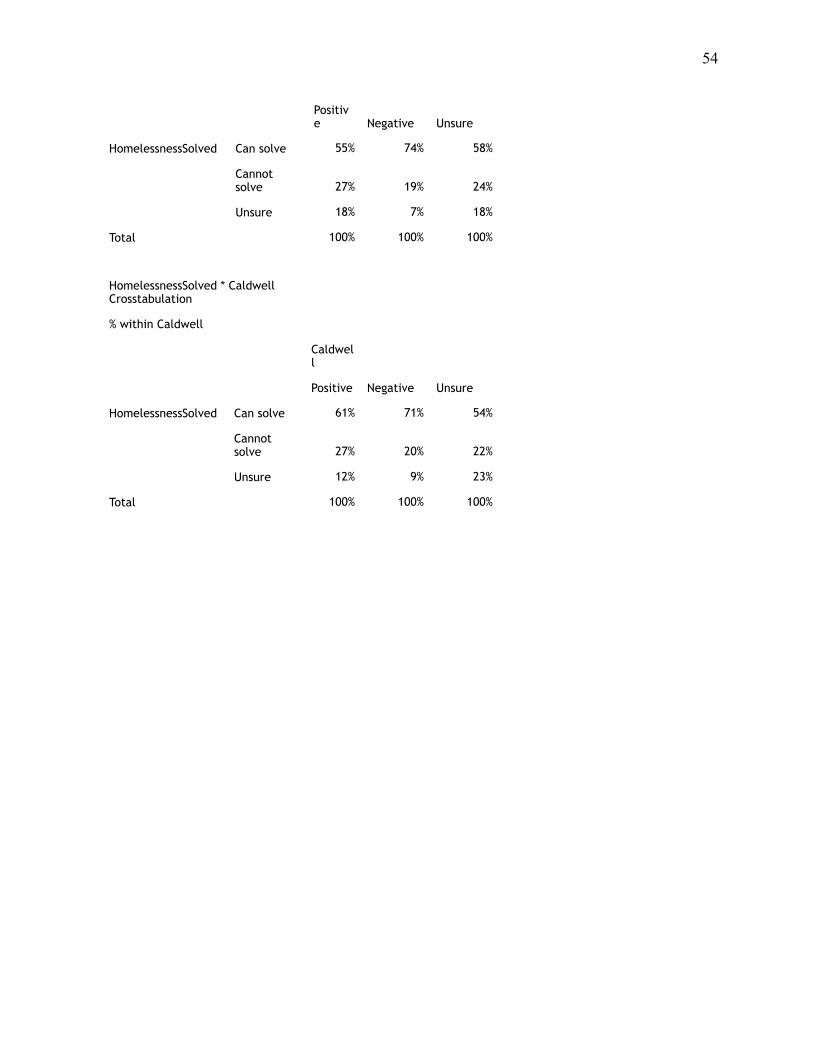
HomelessnessSolved * Ige Crosstabulation
% within Ige
Ige
! 54
Positive Negative Unsure
HomelessnessSolved Can solve 55% 74% 58%
Cannot solve 27% 19% 24%
Unsure 18% 7% 18%
Total 100% 100% 100%
HomelessnessSolved * Caldwell Crosstabulation
% within Caldwell
Caldwell
Positive Negative Unsure
HomelessnessSolved Can solve 61% 71% 54%
Cannot solve 27% 20% 22%
Unsure 12% 9% 23%
Total 100% 100% 100%
! 55
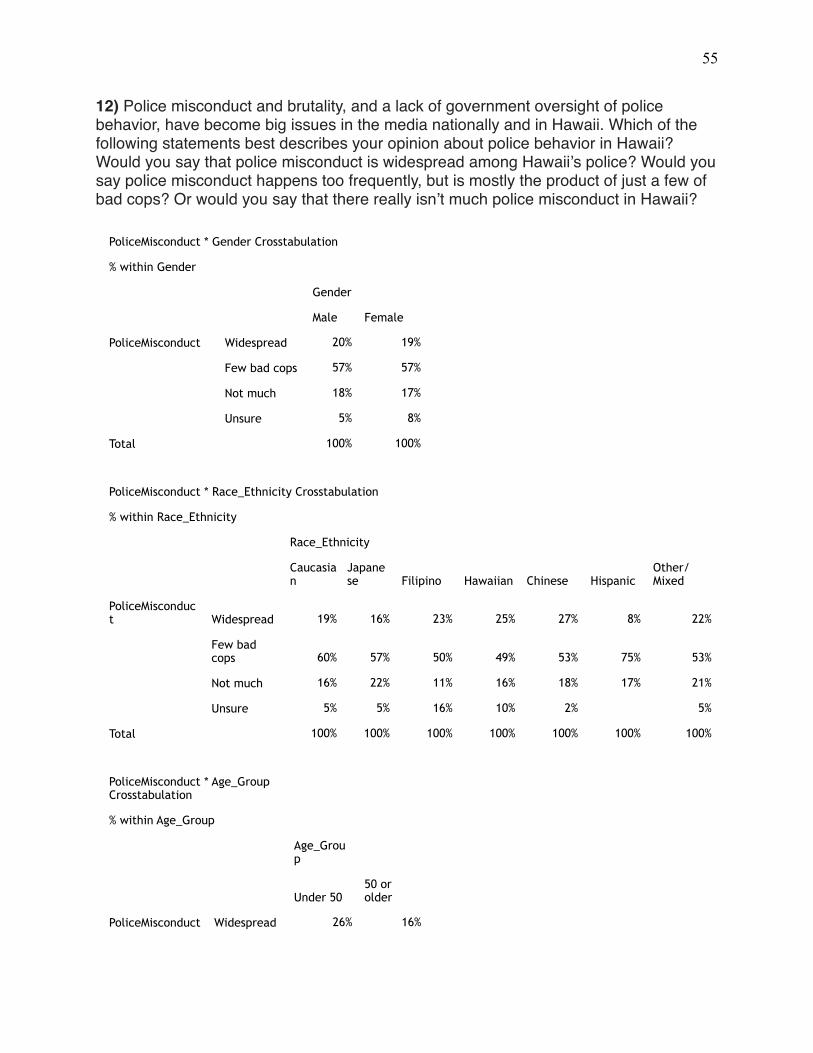
12) Police misconduct and brutality, and a lack of government oversight of police behavior, have become big issues in the media nationally and in Hawaii. Which of the following statements best describes your opinion about police behavior in Hawaii? Would you say that police misconduct is widespread among Hawaii’s police? Would you say police misconduct happens too frequently, but is mostly the product of just a few of bad cops? Or would you say that there really isn’t much police misconduct in Hawaii?
PoliceMisconduct * Gender Crosstabulation
% within Gender
Gender
Male Female
PoliceMisconduct Widespread 20% 19%
Few bad cops 57% 57%
Not much 18% 17%
Unsure 5% 8%
Total 100% 100%
PoliceMisconduct * Race_Ethnicity Crosstabulation
% within Race_Ethnicity
Race_Ethnicity
Caucasian
Japanese Filipino Hawaiian Chinese Hispanic
Other/Mixed
PoliceMisconduct Widespread 19% 16% 23% 25% 27% 8% 22%
Few bad cops 60% 57% 50% 49% 53% 75% 53%
Not much 16% 22% 11% 16% 18% 17% 21%
Unsure 5% 5% 16% 10% 2% 5%
Total 100% 100% 100% 100% 100% 100% 100%
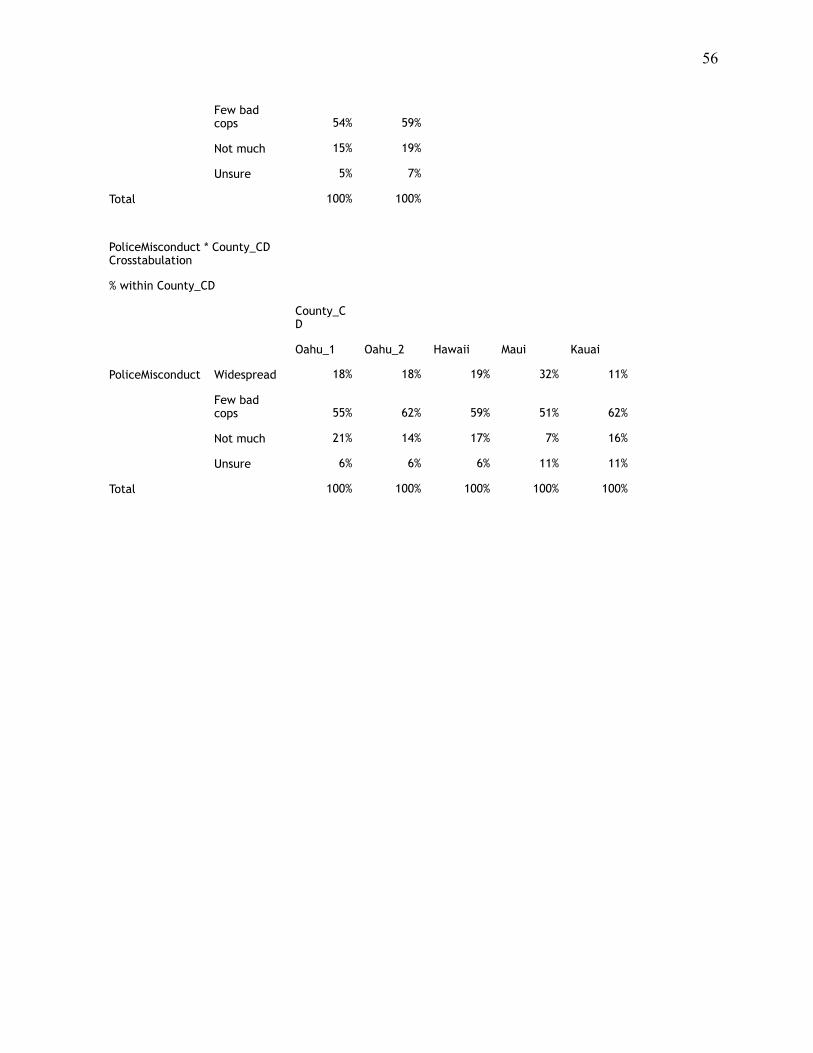
PoliceMisconduct * Age_Group Crosstabulation
% within Age_Group
Age_Group
Under 5050 or older
PoliceMisconduct Widespread 26% 16%
! 56
Few bad cops 54% 59%
Not much 15% 19%
Unsure 5% 7%
Total 100% 100%
PoliceMisconduct * County_CD Crosstabulation
% within County_CD
County_CD
Oahu_1 Oahu_2 Hawaii Maui Kauai
PoliceMisconduct Widespread 18% 18% 19% 32% 11%
Few bad cops 55% 62% 59% 51% 62%
Not much 21% 14% 17% 7% 16%
Unsure 6% 6% 6% 11% 11%
Total 100% 100% 100% 100% 100%
! 57
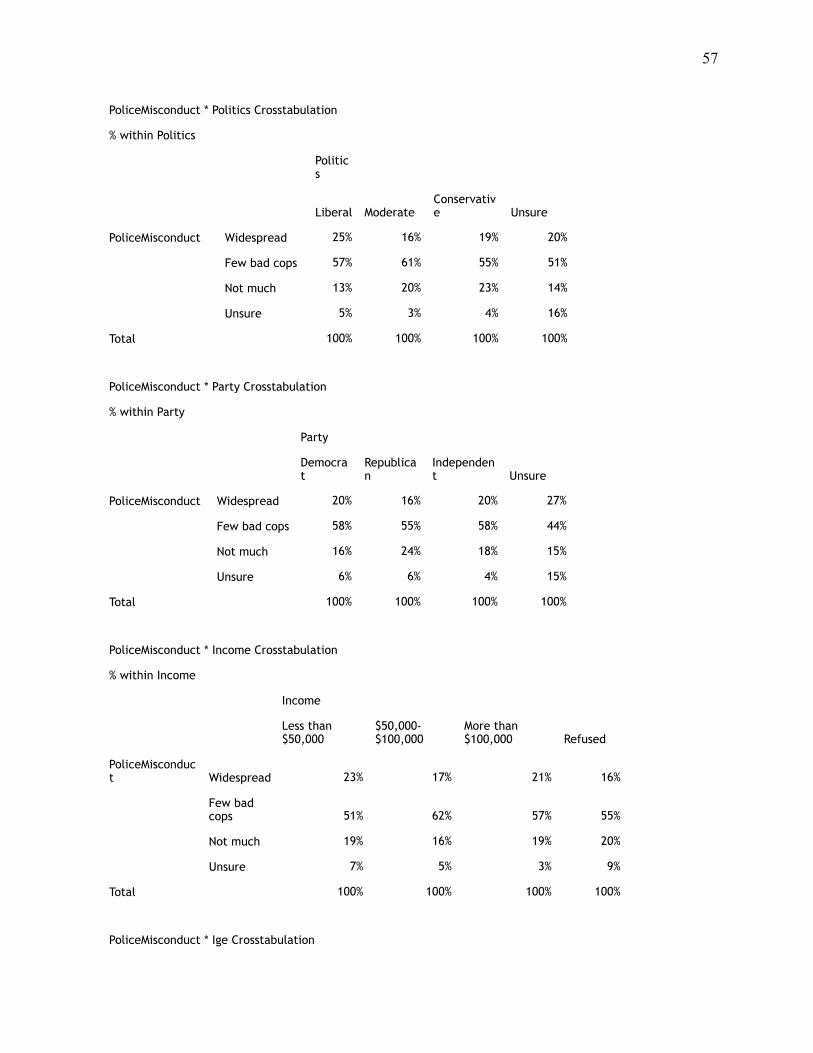
PoliceMisconduct * Politics Crosstabulation
% within Politics
Politics
Liberal ModerateConservative Unsure
PoliceMisconduct Widespread 25% 16% 19% 20%
Few bad cops 57% 61% 55% 51%
Not much 13% 20% 23% 14%
Unsure 5% 3% 4% 16%
Total 100% 100% 100% 100%
PoliceMisconduct * Party Crosstabulation
% within Party
Party
Democrat
Republican
Independent Unsure
PoliceMisconduct Widespread 20% 16% 20% 27%
Few bad cops 58% 55% 58% 44%
Not much 16% 24% 18% 15%
Unsure 6% 6% 4% 15%
Total 100% 100% 100% 100%
PoliceMisconduct * Income Crosstabulation
% within Income
Income
Less than $50,000
$50,000-$100,000
More than $100,000 Refused
PoliceMisconduct Widespread 23% 17% 21% 16%
Few bad cops 51% 62% 57% 55%
Not much 19% 16% 19% 20%
Unsure 7% 5% 3% 9%
Total 100% 100% 100% 100%
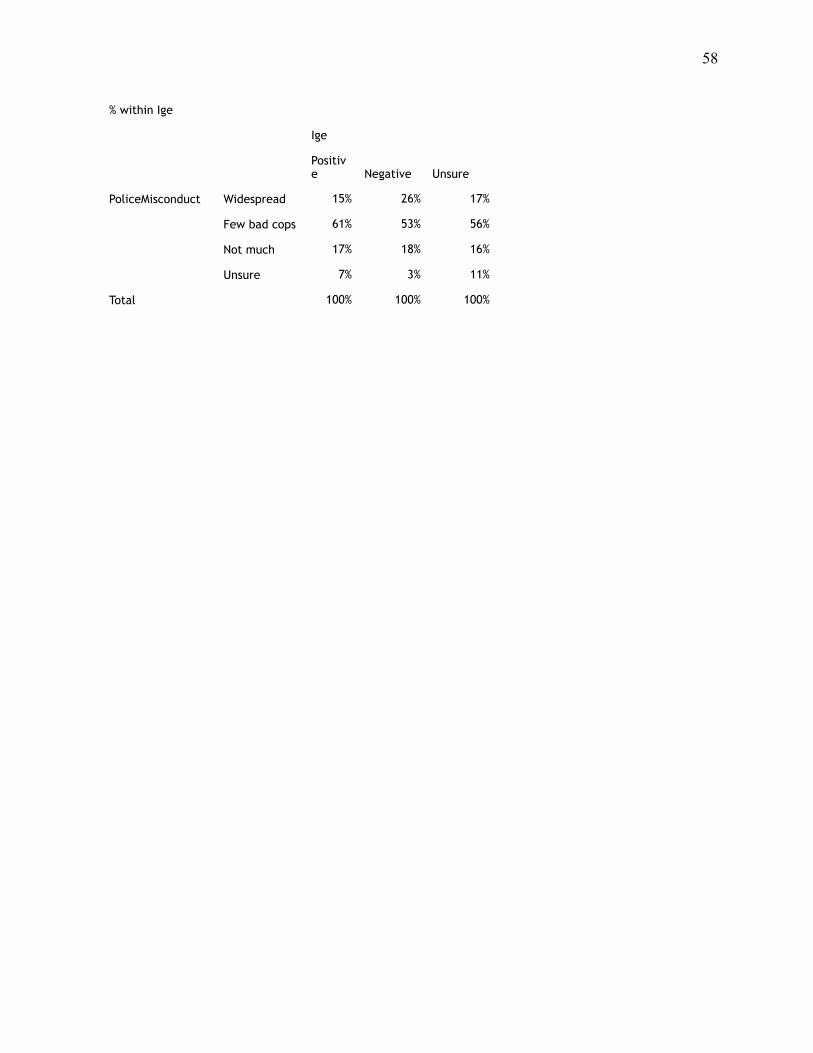
PoliceMisconduct * Ige Crosstabulation
! 58
% within Ige
Ige
Positive Negative Unsure
PoliceMisconduct Widespread 15% 26% 17%
Few bad cops 61% 53% 56%
Not much 17% 18% 16%
Unsure 7% 3% 11%
Total 100% 100% 100%
! 59
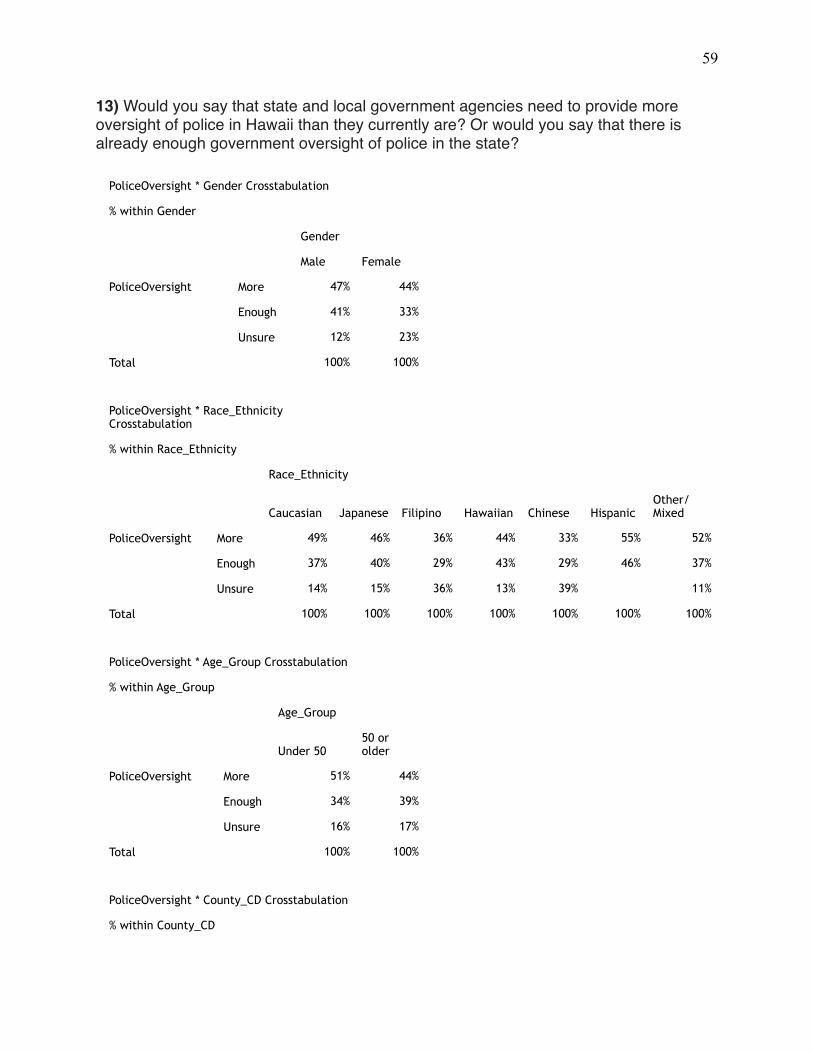
13) Would you say that state and local government agencies need to provide more oversight of police in Hawaii than they currently are? Or would you say that there is already enough government oversight of police in the state?
PoliceOversight * Gender Crosstabulation
% within Gender
Gender
Male Female
PoliceOversight More 47% 44%
Enough 41% 33%
Unsure 12% 23%
Total 100% 100%
PoliceOversight * Race_Ethnicity Crosstabulation
% within Race_Ethnicity
Race_Ethnicity
Caucasian Japanese Filipino Hawaiian Chinese HispanicOther/Mixed
PoliceOversight More 49% 46% 36% 44% 33% 55% 52%
Enough 37% 40% 29% 43% 29% 46% 37%
Unsure 14% 15% 36% 13% 39% 11%
Total 100% 100% 100% 100% 100% 100% 100%
PoliceOversight * Age_Group Crosstabulation
% within Age_Group
Age_Group
Under 5050 or older
PoliceOversight More 51% 44%
Enough 34% 39%
Unsure 16% 17%
Total 100% 100%
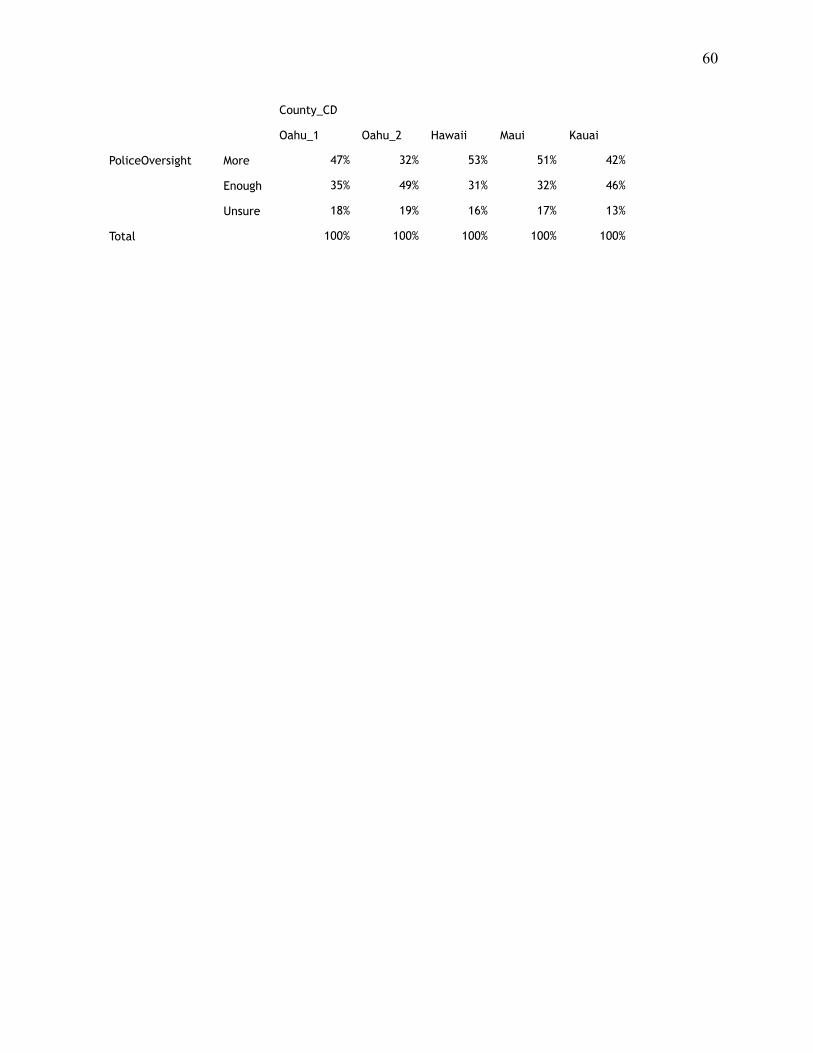
PoliceOversight * County_CD Crosstabulation
% within County_CD
! 60
County_CD
Oahu_1 Oahu_2 Hawaii Maui Kauai
PoliceOversight More 47% 32% 53% 51% 42%
Enough 35% 49% 31% 32% 46%
Unsure 18% 19% 16% 17% 13%
Total 100% 100% 100% 100% 100%
! 61
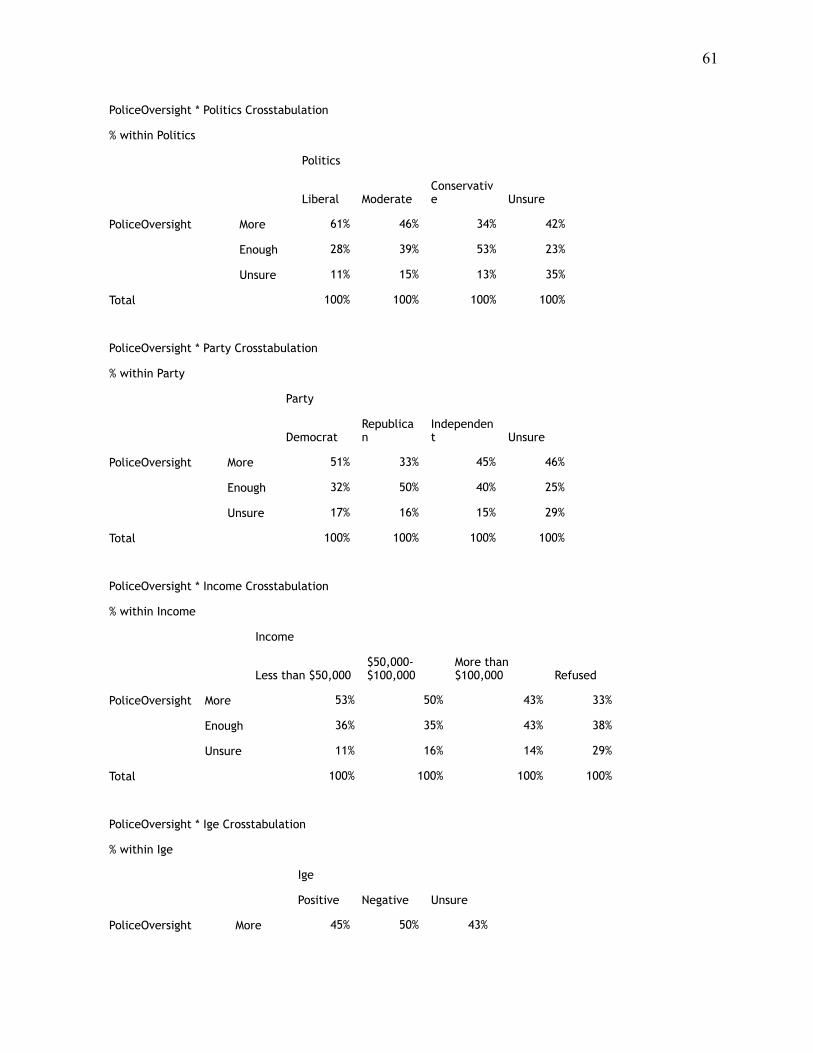
PoliceOversight * Politics Crosstabulation
% within Politics
Politics
Liberal ModerateConservative Unsure
PoliceOversight More 61% 46% 34% 42%
Enough 28% 39% 53% 23%
Unsure 11% 15% 13% 35%
Total 100% 100% 100% 100%
PoliceOversight * Party Crosstabulation
% within Party
Party
DemocratRepublican
Independent Unsure
PoliceOversight More 51% 33% 45% 46%
Enough 32% 50% 40% 25%
Unsure 17% 16% 15% 29%
Total 100% 100% 100% 100%
PoliceOversight * Income Crosstabulation
% within Income
Income
Less than $50,000$50,000-$100,000
More than $100,000 Refused
PoliceOversight More 53% 50% 43% 33%
Enough 36% 35% 43% 38%
Unsure 11% 16% 14% 29%
Total 100% 100% 100% 100%
PoliceOversight * Ige Crosstabulation
% within Ige
Ige
Positive Negative Unsure
PoliceOversight More 45% 50% 43%

! 62
Enough 38% 42% 30%
Unsure 17% 9% 27%
Total 100% 100% 100%
! 63
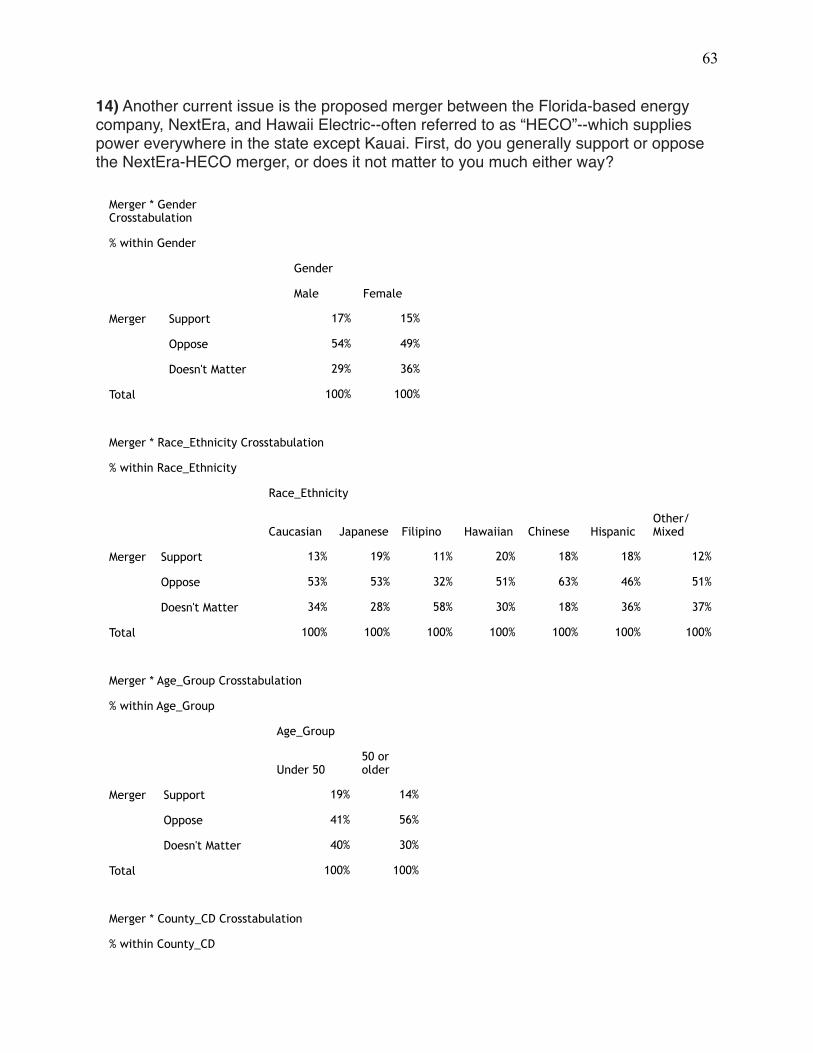
14) Another current issue is the proposed merger between the Florida-based energy company, NextEra, and Hawaii Electric--often referred to as “HECO”--which supplies power everywhere in the state except Kauai. First, do you generally support or oppose the NextEra-HECO merger, or does it not matter to you much either way?
Merger * Gender Crosstabulation
% within Gender
Gender
Male Female
Merger Support 17% 15%
Oppose 54% 49%
Doesn't Matter 29% 36%
Total 100% 100%
Merger * Race_Ethnicity Crosstabulation
% within Race_Ethnicity
Race_Ethnicity
Caucasian Japanese Filipino Hawaiian Chinese HispanicOther/Mixed
Merger Support 13% 19% 11% 20% 18% 18% 12%
Oppose 53% 53% 32% 51% 63% 46% 51%
Doesn't Matter 34% 28% 58% 30% 18% 36% 37%
Total 100% 100% 100% 100% 100% 100% 100%
Merger * Age_Group Crosstabulation
% within Age_Group
Age_Group
Under 5050 or older
Merger Support 19% 14%
Oppose 41% 56%
Doesn't Matter 40% 30%
Total 100% 100%
Merger * County_CD Crosstabulation
% within County_CD
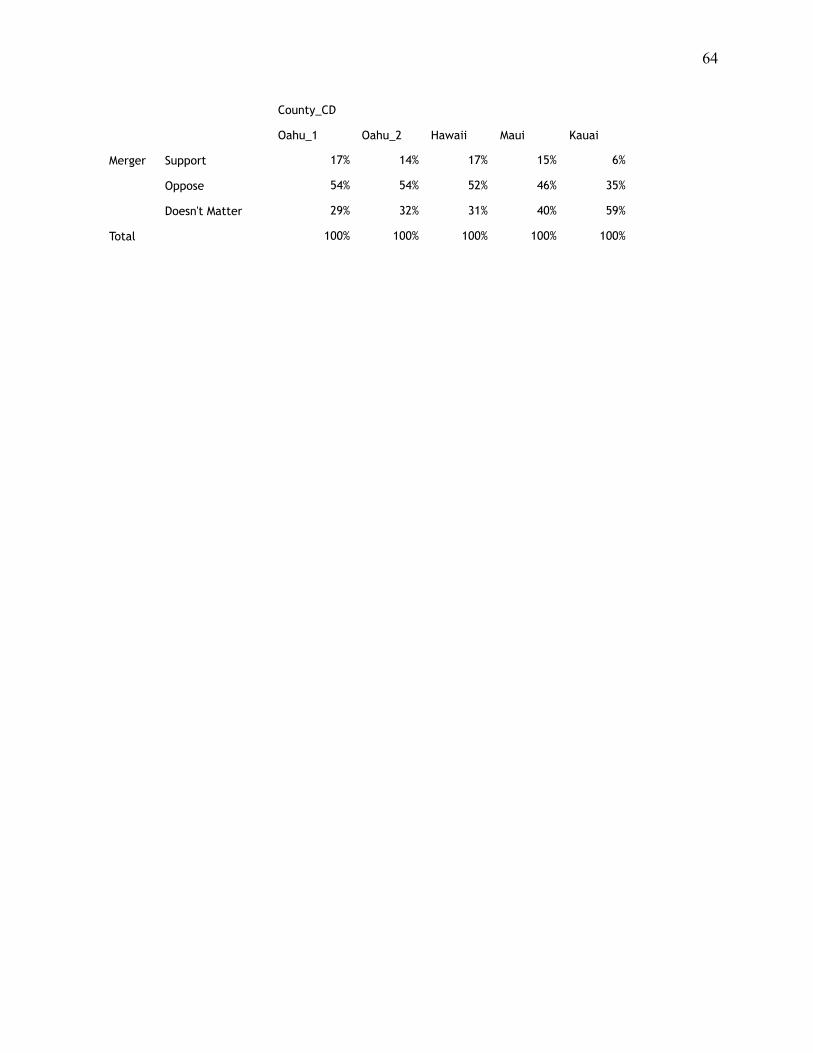
! 64
County_CD
Oahu_1 Oahu_2 Hawaii Maui Kauai
Merger Support 17% 14% 17% 15% 6%
Oppose 54% 54% 52% 46% 35%
Doesn't Matter 29% 32% 31% 40% 59%
Total 100% 100% 100% 100% 100%
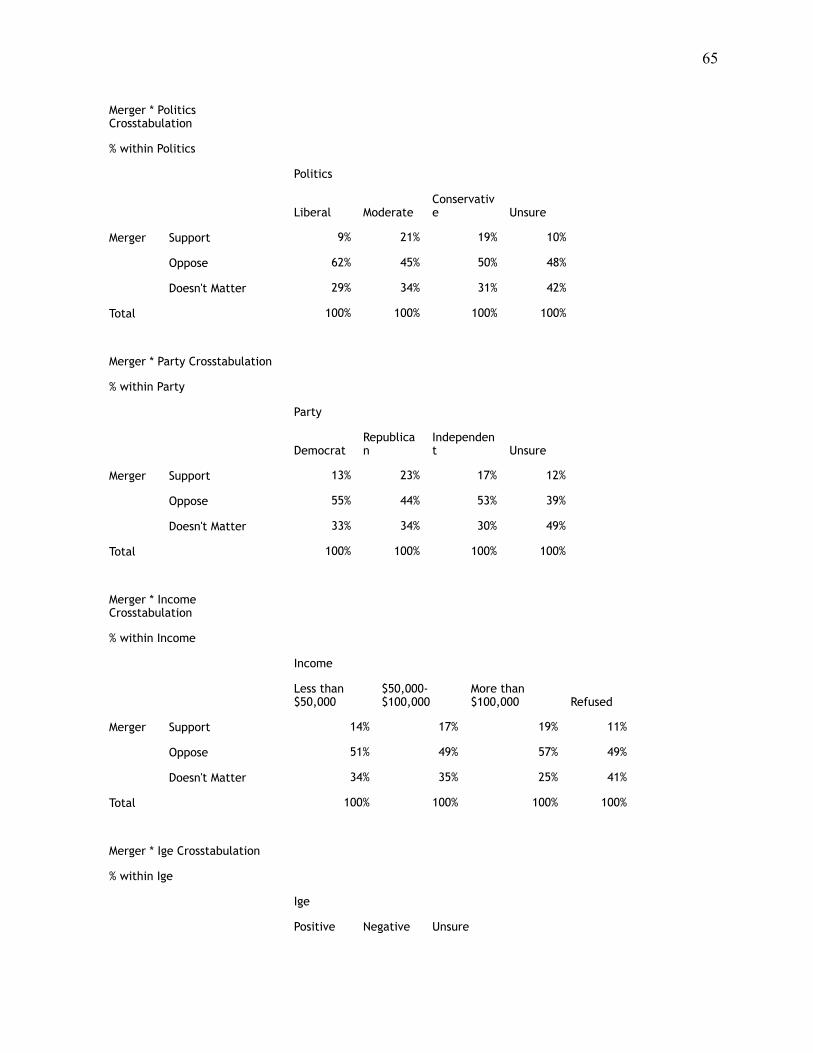
! 65
Merger * Politics Crosstabulation
% within Politics
Politics
Liberal ModerateConservative Unsure
Merger Support 9% 21% 19% 10%
Oppose 62% 45% 50% 48%
Doesn't Matter 29% 34% 31% 42%
Total 100% 100% 100% 100%
Merger * Party Crosstabulation
% within Party
Party
DemocratRepublican
Independent Unsure
Merger Support 13% 23% 17% 12%
Oppose 55% 44% 53% 39%
Doesn't Matter 33% 34% 30% 49%
Total 100% 100% 100% 100%
Merger * Income Crosstabulation
% within Income
Income
Less than $50,000
$50,000-$100,000
More than $100,000 Refused
Merger Support 14% 17% 19% 11%
Oppose 51% 49% 57% 49%
Doesn't Matter 34% 35% 25% 41%
Total 100% 100% 100% 100%
Merger * Ige Crosstabulation
% within Ige
Ige
Positive Negative Unsure

! 66
Merger Support 16% 15% 15%
Oppose 51% 59% 45%
Doesn't Matter 33% 26% 40%
Total 100% 100% 100%
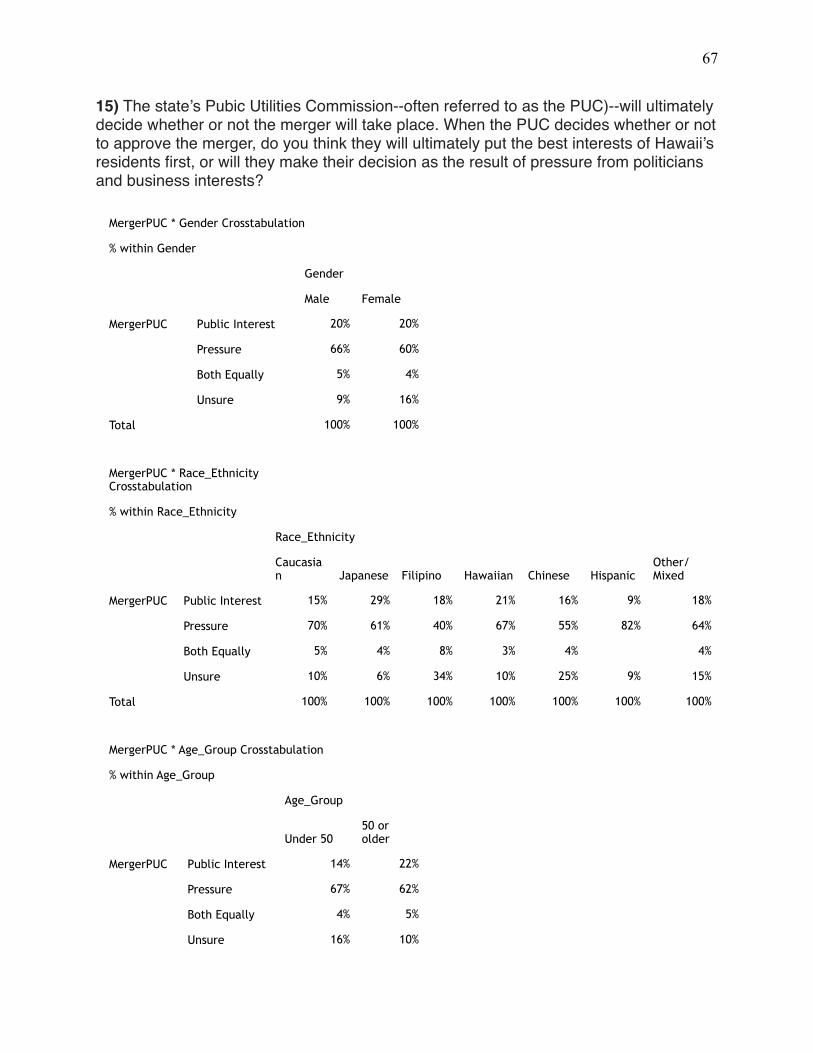
! 67
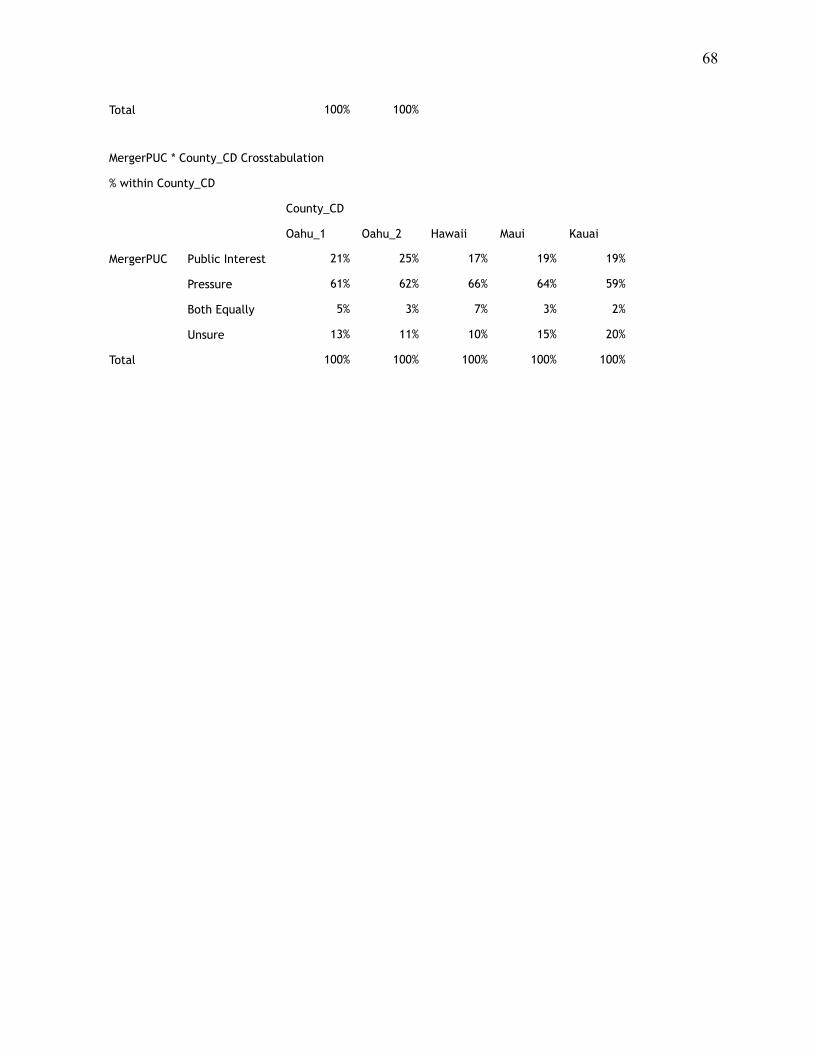
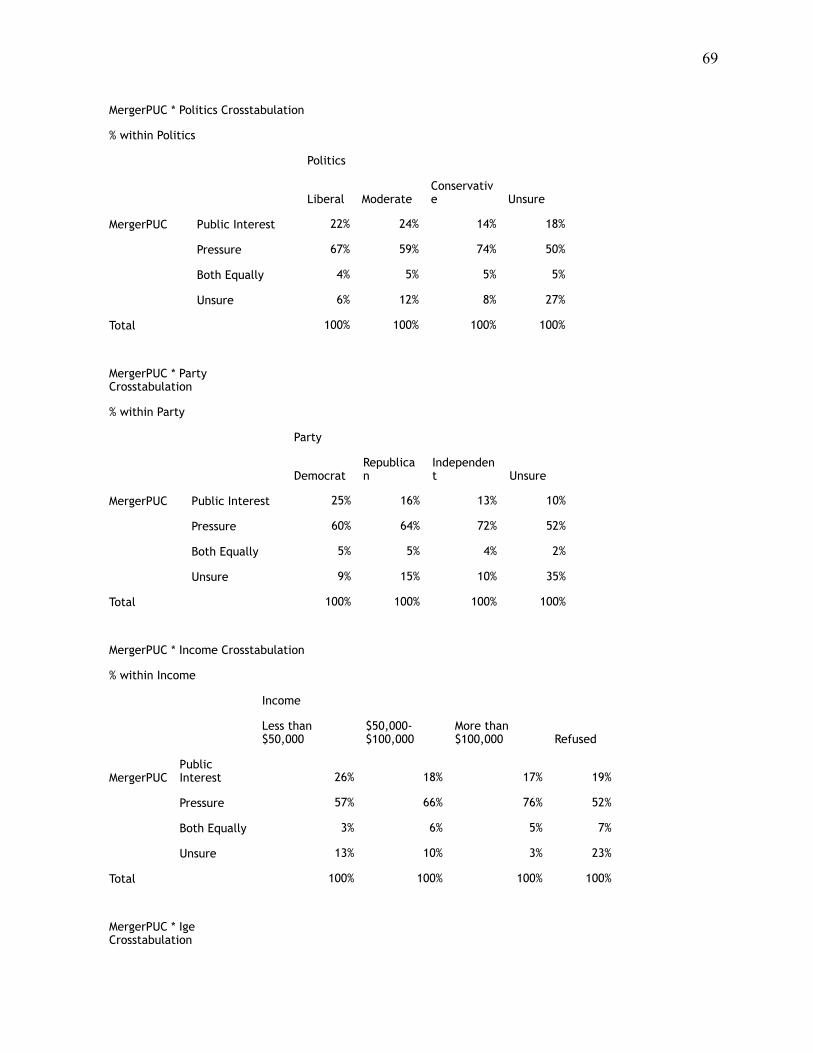
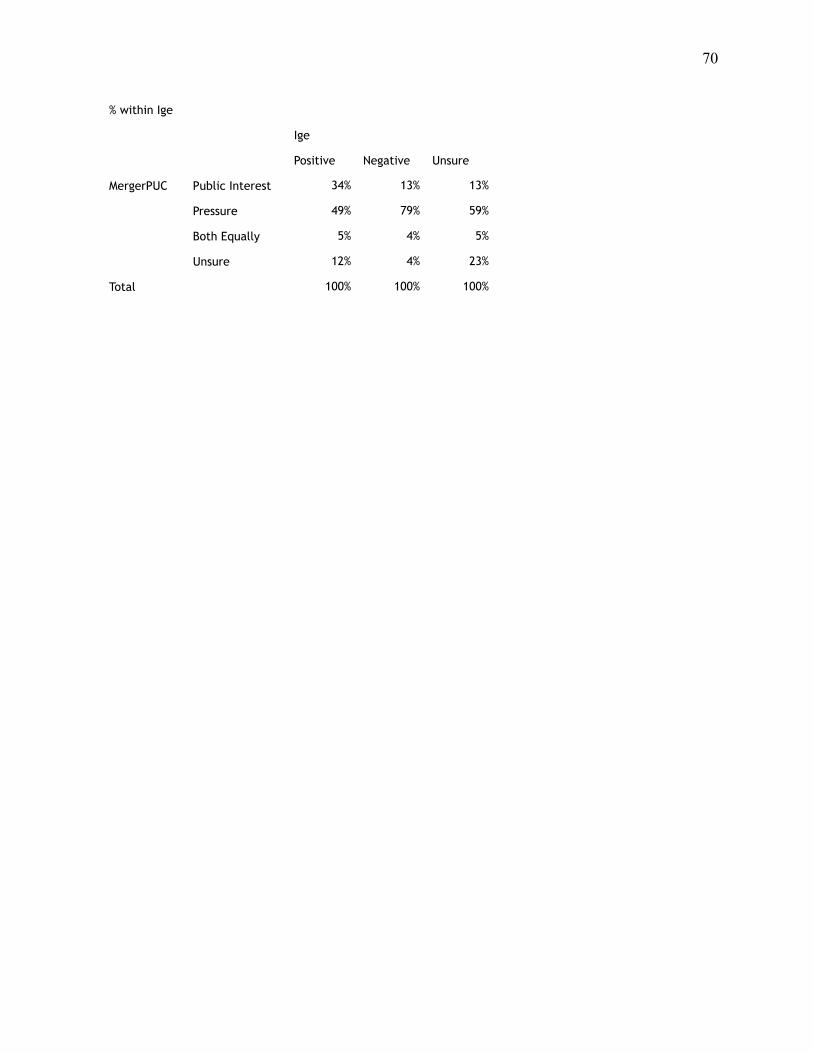
15) The state’s Pubic Utilities Commission--often referred to as the PUC)--will ultimately decide whether or not the merger will take place. When the PUC decides whether or not to approve the merger, do you think they will ultimately put the best interests of Hawaii’s residents first, or will they make their decision as the result of pressure from politicians and business interests?
MergerPUC * Gender Crosstabulation
% within Gender
Gender
Male Female
MergerPUC Public Interest 20% 20%
Pressure 66% 60%
Both Equally 5% 4%
Unsure 9% 16%
Total 100% 100%
MergerPUC * Race_Ethnicity Crosstabulation
% within Race_Ethnicity
Race_Ethnicity
Caucasian Japanese Filipino Hawaiian Chinese Hispanic
Other/Mixed
MergerPUC Public Interest 15% 29% 18% 21% 16% 9% 18%
Pressure 70% 61% 40% 67% 55% 82% 64%
Both Equally 5% 4% 8% 3% 4% 4%
Unsure 10% 6% 34% 10% 25% 9% 15%
Total 100% 100% 100% 100% 100% 100% 100%
MergerPUC * Age_Group Crosstabulation
% within Age_Group
Age_Group
Under 5050 or older
MergerPUC Public Interest 14% 22%
Pressure 67% 62%
Both Equally 4% 5%
Unsure 16% 10%
! 68
Total 100% 100%
MergerPUC * County_CD Crosstabulation
% within County_CD
County_CD
Oahu_1 Oahu_2 Hawaii Maui Kauai
MergerPUC Public Interest 21% 25% 17% 19% 19%
Pressure 61% 62% 66% 64% 59%
Both Equally 5% 3% 7% 3% 2%
Unsure 13% 11% 10% 15% 20%
Total 100% 100% 100% 100% 100%
! 69
MergerPUC * Politics Crosstabulation
% within Politics
Politics
Liberal ModerateConservative Unsure
MergerPUC Public Interest 22% 24% 14% 18%
Pressure 67% 59% 74% 50%
Both Equally 4% 5% 5% 5%
Unsure 6% 12% 8% 27%
Total 100% 100% 100% 100%
MergerPUC * Party Crosstabulation
% within Party
Party
DemocratRepublican
Independent Unsure
MergerPUC Public Interest 25% 16% 13% 10%
Pressure 60% 64% 72% 52%
Both Equally 5% 5% 4% 2%
Unsure 9% 15% 10% 35%
Total 100% 100% 100% 100%
MergerPUC * Income Crosstabulation
% within Income
Income
Less than $50,000
$50,000-$100,000
More than $100,000 Refused
MergerPUCPublic Interest 26% 18% 17% 19%
Pressure 57% 66% 76% 52%
Both Equally 3% 6% 5% 7%
Unsure 13% 10% 3% 23%
Total 100% 100% 100% 100%
MergerPUC * Ige Crosstabulation
! 70
% within Ige
Ige
Positive Negative Unsure
MergerPUC Public Interest 34% 13% 13%
Pressure 49% 79% 59%
Both Equally 5% 4% 5%
Unsure 12% 4% 23%
Total 100% 100% 100%
! 71
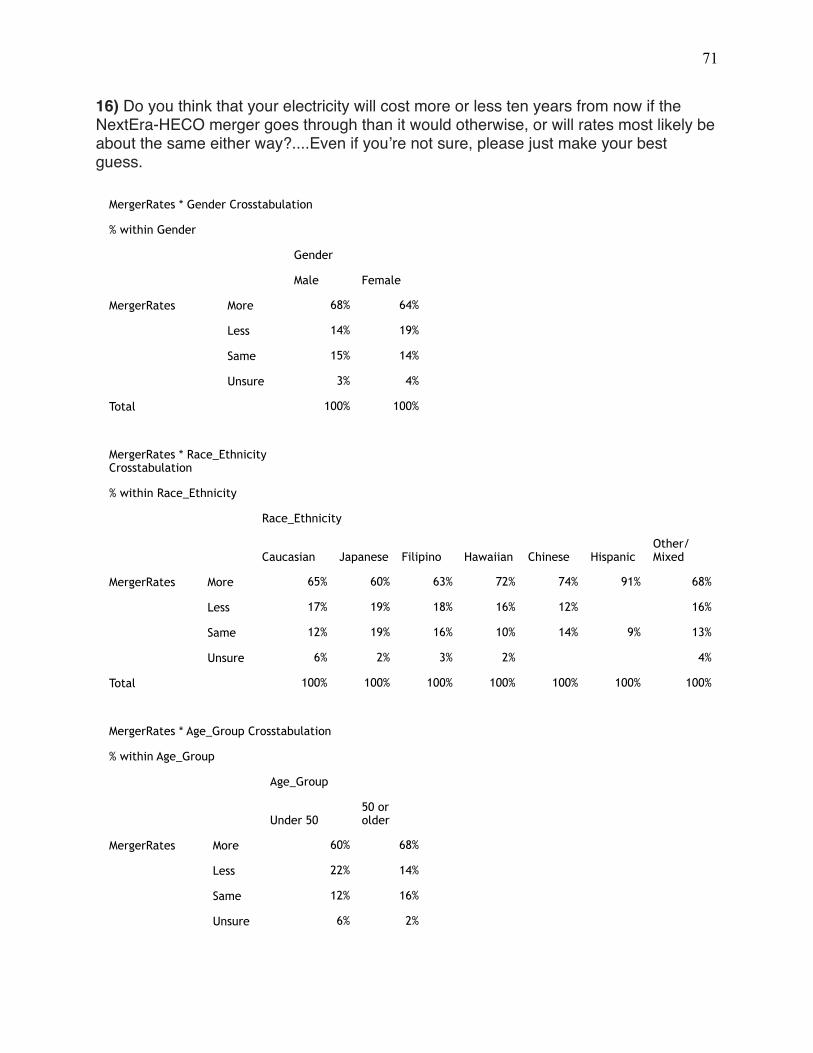
16) Do you think that your electricity will cost more or less ten years from now if the NextEra-HECO merger goes through than it would otherwise, or will rates most likely be about the same either way?....Even if you’re not sure, please just make your best guess.
MergerRates * Gender Crosstabulation
% within Gender
Gender
Male Female
MergerRates More 68% 64%
Less 14% 19%
Same 15% 14%
Unsure 3% 4%
Total 100% 100%
MergerRates * Race_Ethnicity Crosstabulation
% within Race_Ethnicity
Race_Ethnicity
Caucasian Japanese Filipino Hawaiian Chinese HispanicOther/Mixed
MergerRates More 65% 60% 63% 72% 74% 91% 68%
Less 17% 19% 18% 16% 12% 16%
Same 12% 19% 16% 10% 14% 9% 13%
Unsure 6% 2% 3% 2% 4%
Total 100% 100% 100% 100% 100% 100% 100%
MergerRates * Age_Group Crosstabulation
% within Age_Group
Age_Group
Under 5050 or older
MergerRates More 60% 68%
Less 22% 14%
Same 12% 16%
Unsure 6% 2%

! 72
Total 100% 100%
MergerRates * County_CD Crosstabulation
% within County_CD
County_CD
Oahu_1 Oahu_2 Hawaii Maui Kauai
MergerRates More 68% 67% 61% 61% 61%
Less 16% 19% 18% 16% 14%
Same 14% 11% 18% 15% 14%
Unsure 2% 3% 4% 8% 11%
Total 100% 100% 100% 100% 100%
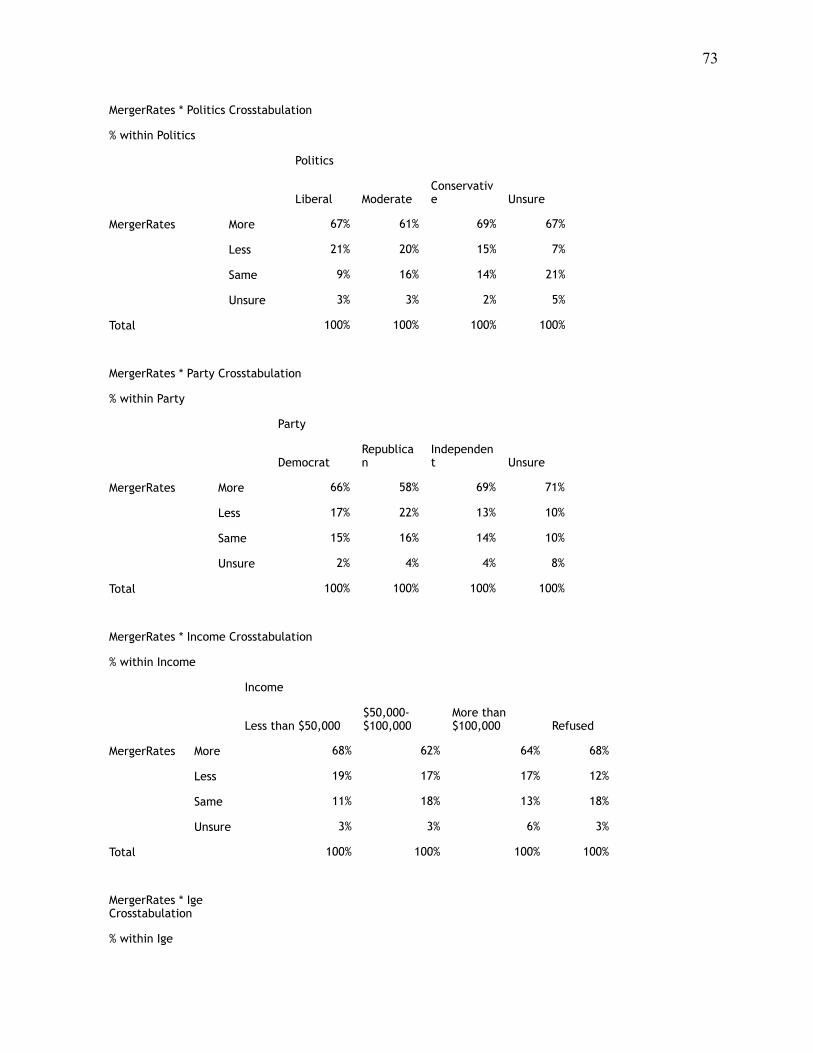
! 73
MergerRates * Politics Crosstabulation
% within Politics
Politics
Liberal ModerateConservative Unsure
MergerRates More 67% 61% 69% 67%
Less 21% 20% 15% 7%
Same 9% 16% 14% 21%
Unsure 3% 3% 2% 5%
Total 100% 100% 100% 100%
MergerRates * Party Crosstabulation
% within Party
Party
DemocratRepublican
Independent Unsure
MergerRates More 66% 58% 69% 71%
Less 17% 22% 13% 10%
Same 15% 16% 14% 10%
Unsure 2% 4% 4% 8%
Total 100% 100% 100% 100%
MergerRates * Income Crosstabulation
% within Income
Income
Less than $50,000$50,000-$100,000
More than $100,000 Refused
MergerRates More 68% 62% 64% 68%
Less 19% 17% 17% 12%
Same 11% 18% 13% 18%
Unsure 3% 3% 6% 3%
Total 100% 100% 100% 100%
MergerRates * Ige Crosstabulation
% within Ige
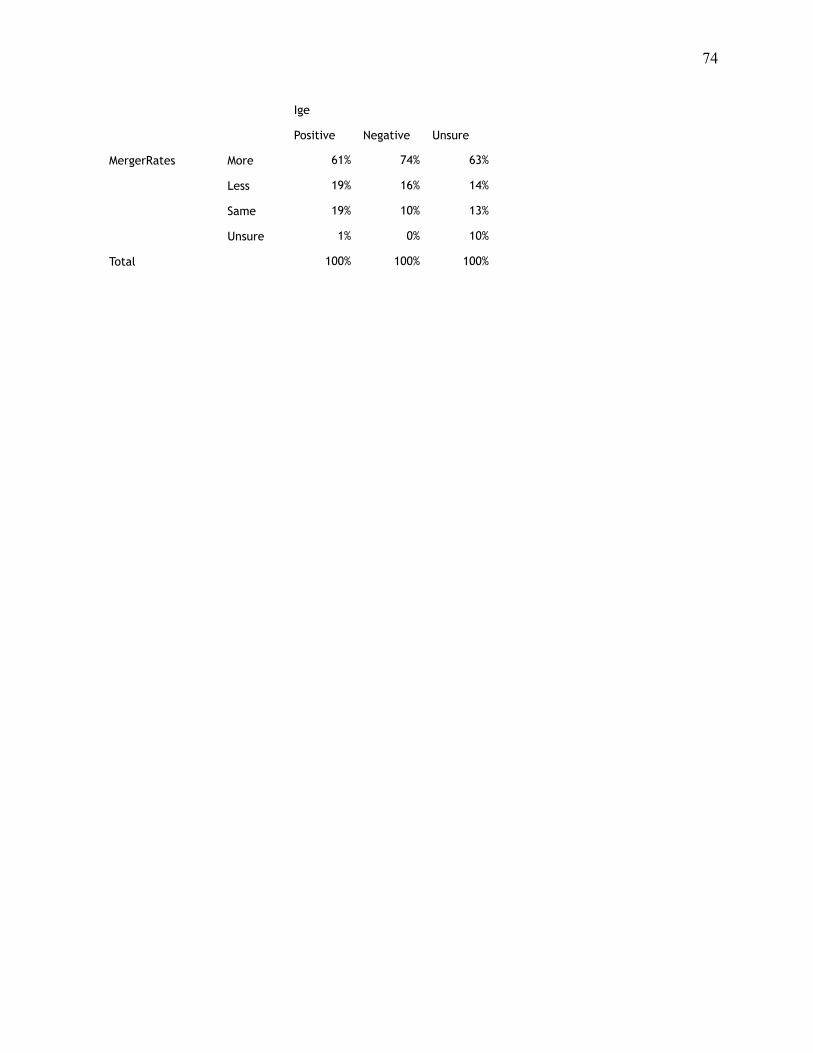
! 74
Ige
Positive Negative Unsure
MergerRates More 61% 74% 63%
Less 19% 16% 14%
Same 19% 10% 13%
Unsure 1% 0% 10%
Total 100% 100% 100%
! 75
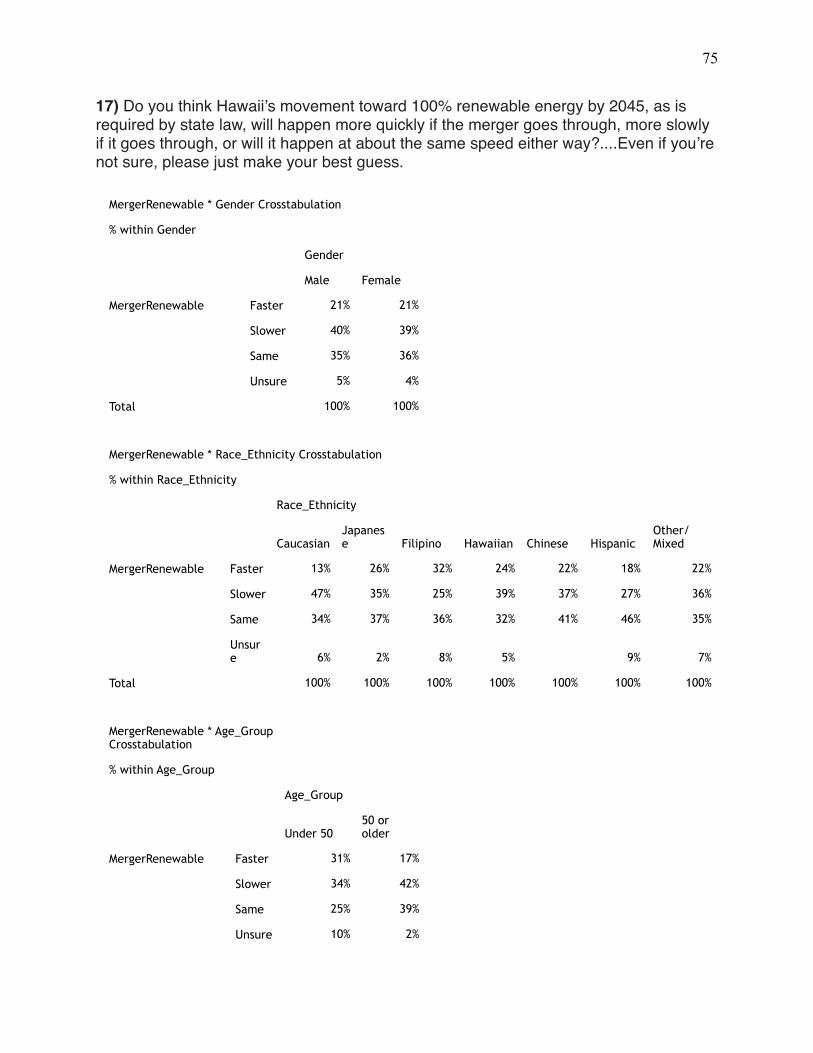
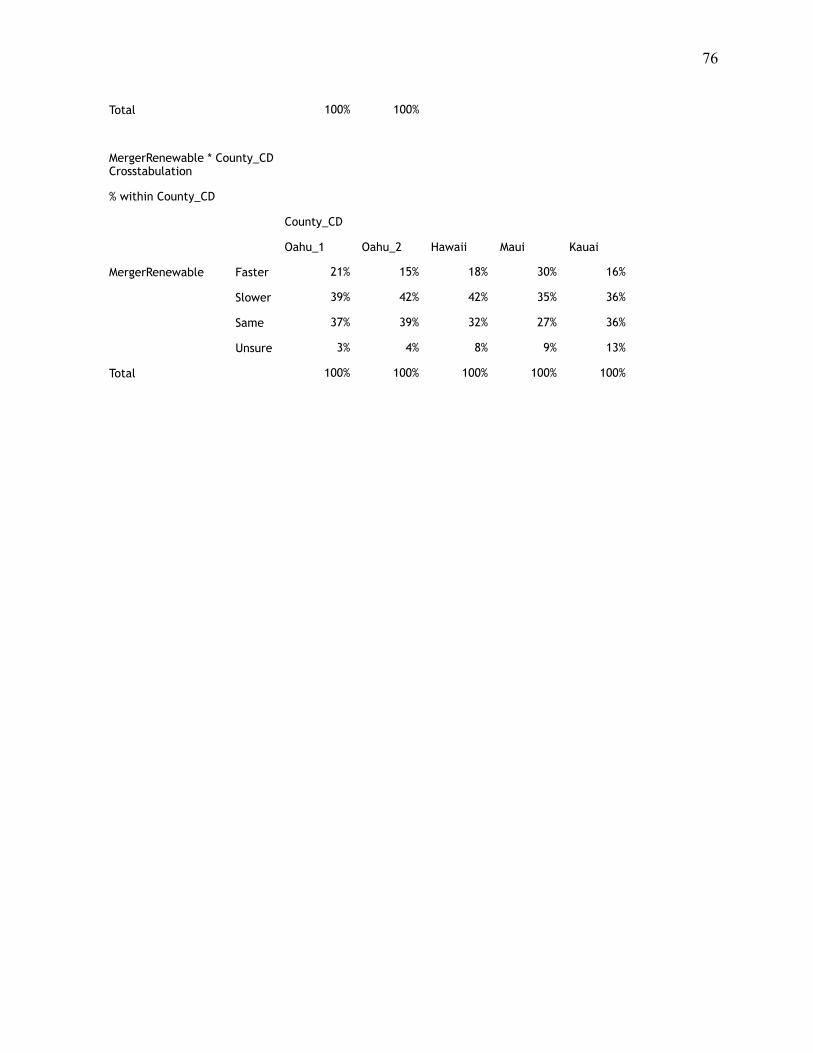
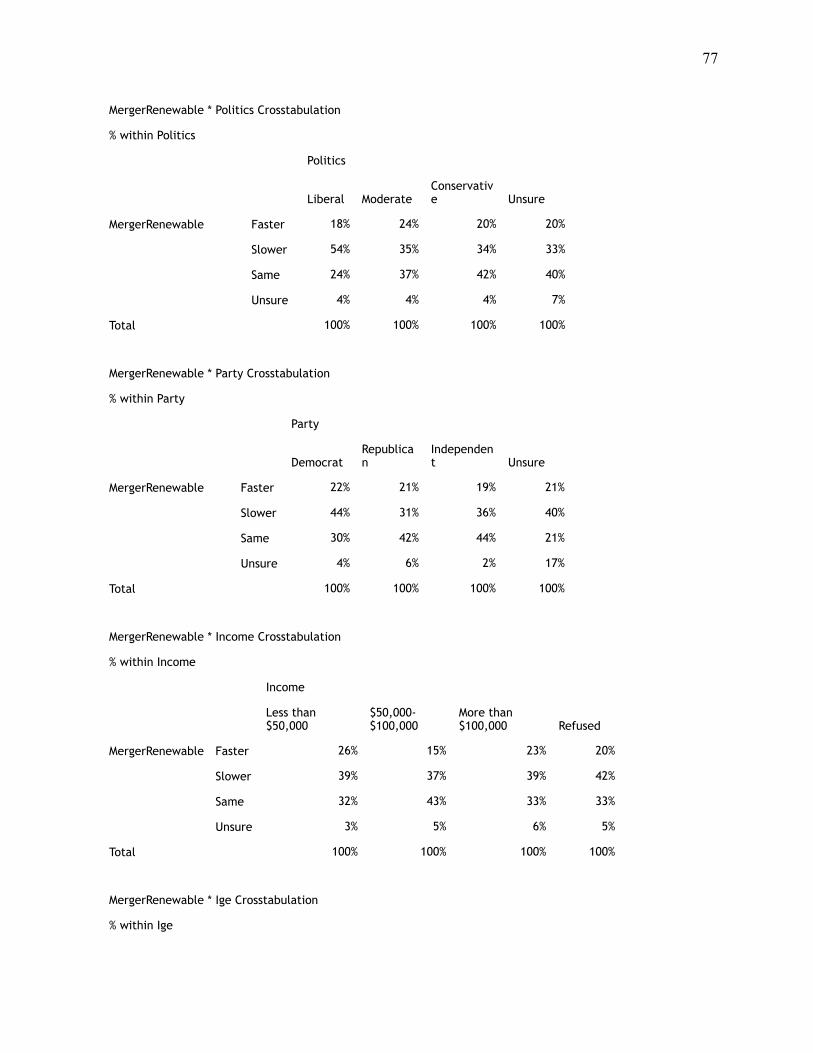
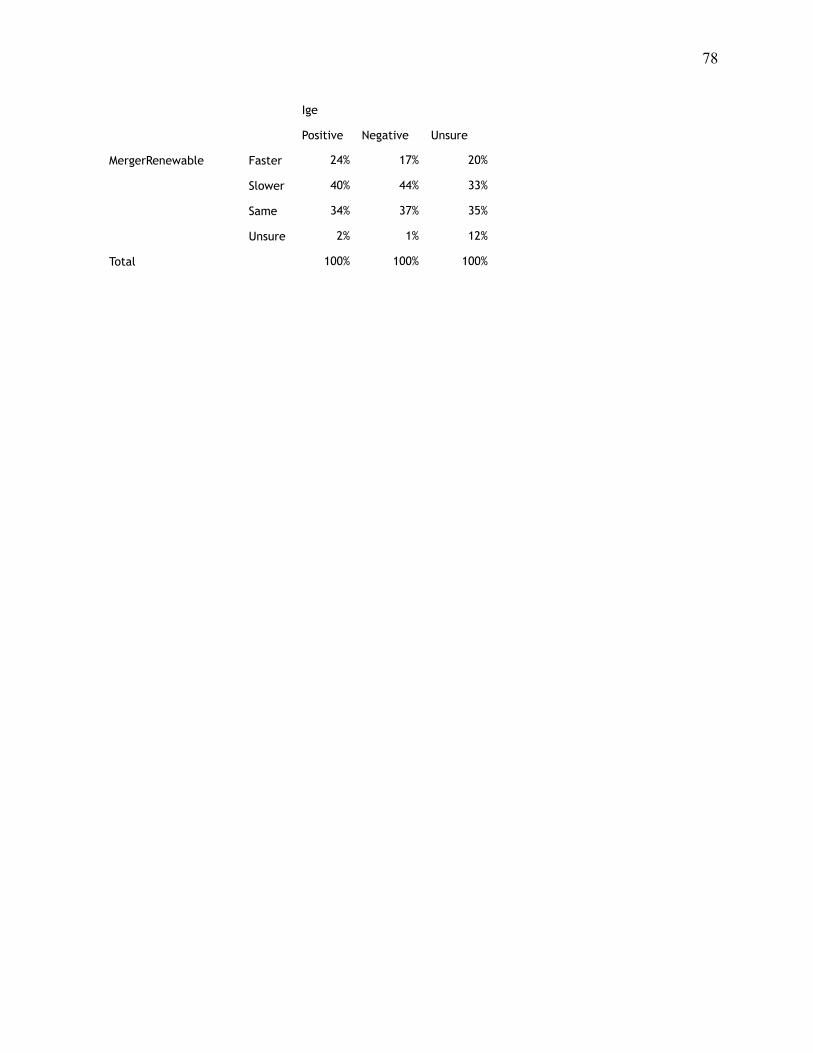
17) Do you think Hawaii’s movement toward 100% renewable energy by 2045, as is required by state law, will happen more quickly if the merger goes through, more slowly if it goes through, or will it happen at about the same speed either way?....Even if you’re not sure, please just make your best guess.
MergerRenewable * Gender Crosstabulation
% within Gender
Gender
Male Female
MergerRenewable Faster 21% 21%
Slower 40% 39%
Same 35% 36%
Unsure 5% 4%
Total 100% 100%
MergerRenewable * Race_Ethnicity Crosstabulation
% within Race_Ethnicity
Race_Ethnicity
CaucasianJapanese Filipino Hawaiian Chinese Hispanic
Other/Mixed
MergerRenewable Faster 13% 26% 32% 24% 22% 18% 22%
Slower 47% 35% 25% 39% 37% 27% 36%
Same 34% 37% 36% 32% 41% 46% 35%
Unsure 6% 2% 8% 5% 9% 7%
Total 100% 100% 100% 100% 100% 100% 100%
MergerRenewable * Age_Group Crosstabulation
% within Age_Group
Age_Group
Under 5050 or older
MergerRenewable Faster 31% 17%
Slower 34% 42%
Same 25% 39%
Unsure 10% 2%
! 76
Total 100% 100%
MergerRenewable * County_CD Crosstabulation
% within County_CD
County_CD
Oahu_1 Oahu_2 Hawaii Maui Kauai
MergerRenewable Faster 21% 15% 18% 30% 16%
Slower 39% 42% 42% 35% 36%
Same 37% 39% 32% 27% 36%
Unsure 3% 4% 8% 9% 13%
Total 100% 100% 100% 100% 100%
! 77
MergerRenewable * Politics Crosstabulation
% within Politics
Politics
Liberal ModerateConservative Unsure
MergerRenewable Faster 18% 24% 20% 20%
Slower 54% 35% 34% 33%
Same 24% 37% 42% 40%
Unsure 4% 4% 4% 7%
Total 100% 100% 100% 100%
MergerRenewable * Party Crosstabulation
% within Party
Party
DemocratRepublican
Independent Unsure
MergerRenewable Faster 22% 21% 19% 21%
Slower 44% 31% 36% 40%
Same 30% 42% 44% 21%
Unsure 4% 6% 2% 17%
Total 100% 100% 100% 100%
MergerRenewable * Income Crosstabulation
% within Income
Income
Less than $50,000
$50,000-$100,000
More than $100,000 Refused
MergerRenewable Faster 26% 15% 23% 20%
Slower 39% 37% 39% 42%
Same 32% 43% 33% 33%
Unsure 3% 5% 6% 5%
Total 100% 100% 100% 100%
MergerRenewable * Ige Crosstabulation
% within Ige
! 78
Ige
Positive Negative Unsure
MergerRenewable Faster 24% 17% 20%
Slower 40% 44% 33%
Same 34% 37% 35%
Unsure 2% 1% 12%
Total 100% 100% 100%
! 79
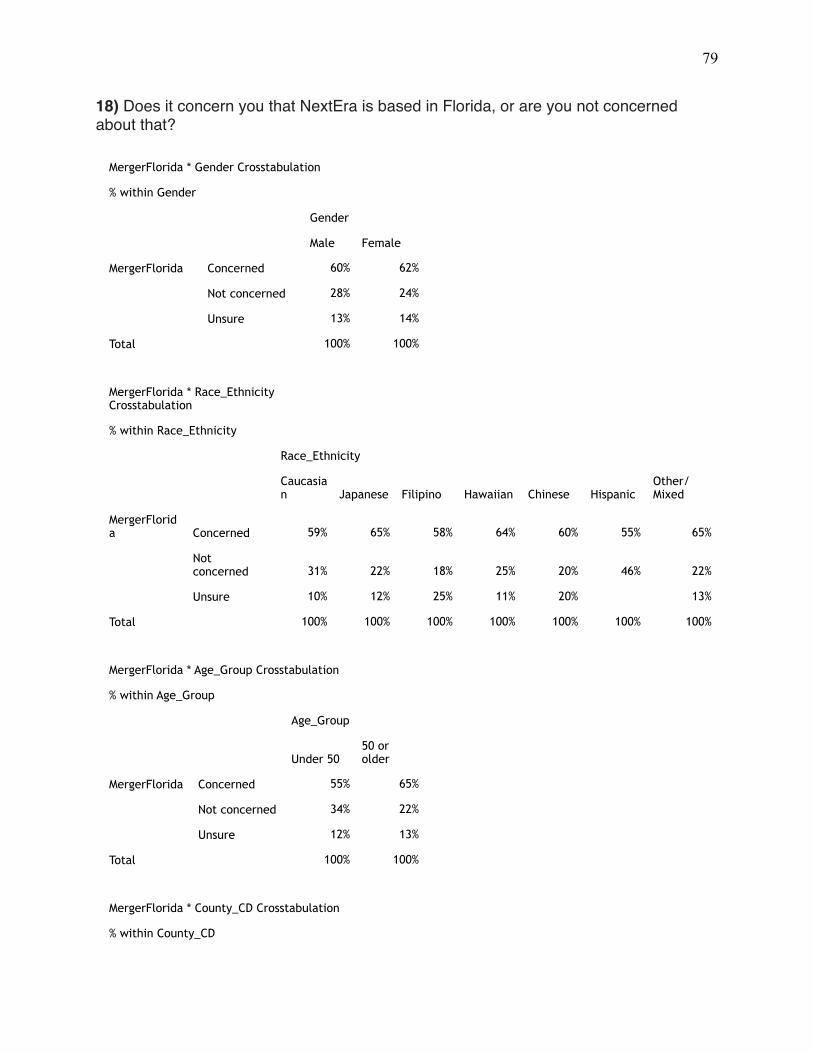
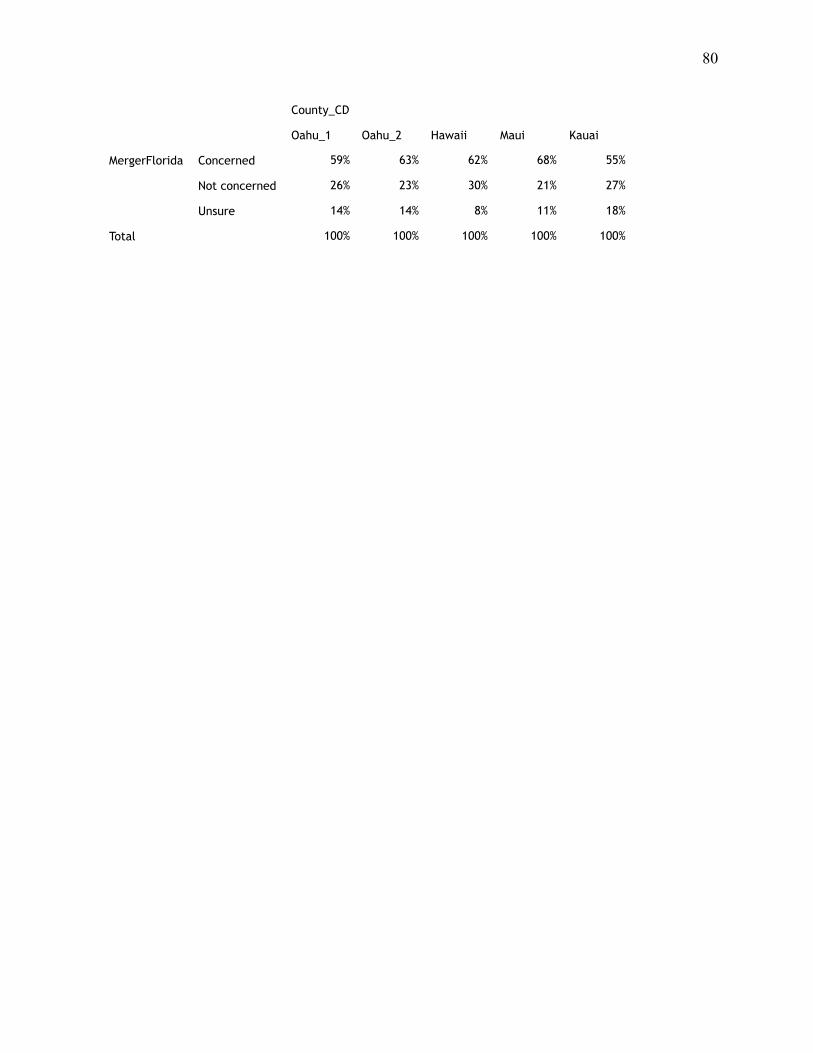
18) Does it concern you that NextEra is based in Florida, or are you not concerned about that?
MergerFlorida * Gender Crosstabulation
% within Gender
Gender
Male Female
MergerFlorida Concerned 60% 62%
Not concerned 28% 24%
Unsure 13% 14%
Total 100% 100%
MergerFlorida * Race_Ethnicity Crosstabulation
% within Race_Ethnicity
Race_Ethnicity
Caucasian Japanese Filipino Hawaiian Chinese Hispanic
Other/Mixed
MergerFlorida Concerned 59% 65% 58% 64% 60% 55% 65%
Not concerned 31% 22% 18% 25% 20% 46% 22%
Unsure 10% 12% 25% 11% 20% 13%
Total 100% 100% 100% 100% 100% 100% 100%
MergerFlorida * Age_Group Crosstabulation
% within Age_Group
Age_Group
Under 5050 or older
MergerFlorida Concerned 55% 65%
Not concerned 34% 22%
Unsure 12% 13%
Total 100% 100%
MergerFlorida * County_CD Crosstabulation
% within County_CD
! 80
County_CD
Oahu_1 Oahu_2 Hawaii Maui Kauai
MergerFlorida Concerned 59% 63% 62% 68% 55%
Not concerned 26% 23% 30% 21% 27%
Unsure 14% 14% 8% 11% 18%
Total 100% 100% 100% 100% 100%

! 81
MergerFlorida * Politics Crosstabulation
% within Politics
Politics
Liberal ModerateConservative Unsure
MergerFlorida Concerned 73% 60% 54% 59%
Not concerned 22% 28% 32% 17%
Unsure 4% 12% 14% 24%
Total 100% 100% 100% 100%
MergerFlorida * Party Crosstabulation
% within Party
Party
DemocratRepublican
Independent Unsure
MergerFlorida Concerned 68% 51% 56% 60%
Not concerned 22% 33% 32% 15%
Unsure 11% 16% 12% 25%
Total 100% 100% 100% 100%
MergerFlorida * Income Crosstabulation
% within Income
Income
Less than $50,000
$50,000-$100,000
More than $100,000 Refused
MergerFlorida Concerned 67% 62% 61% 54%
Not concerned 23% 26% 34% 20%
Unsure 11% 12% 6% 26%
Total 100% 100% 100% 100%
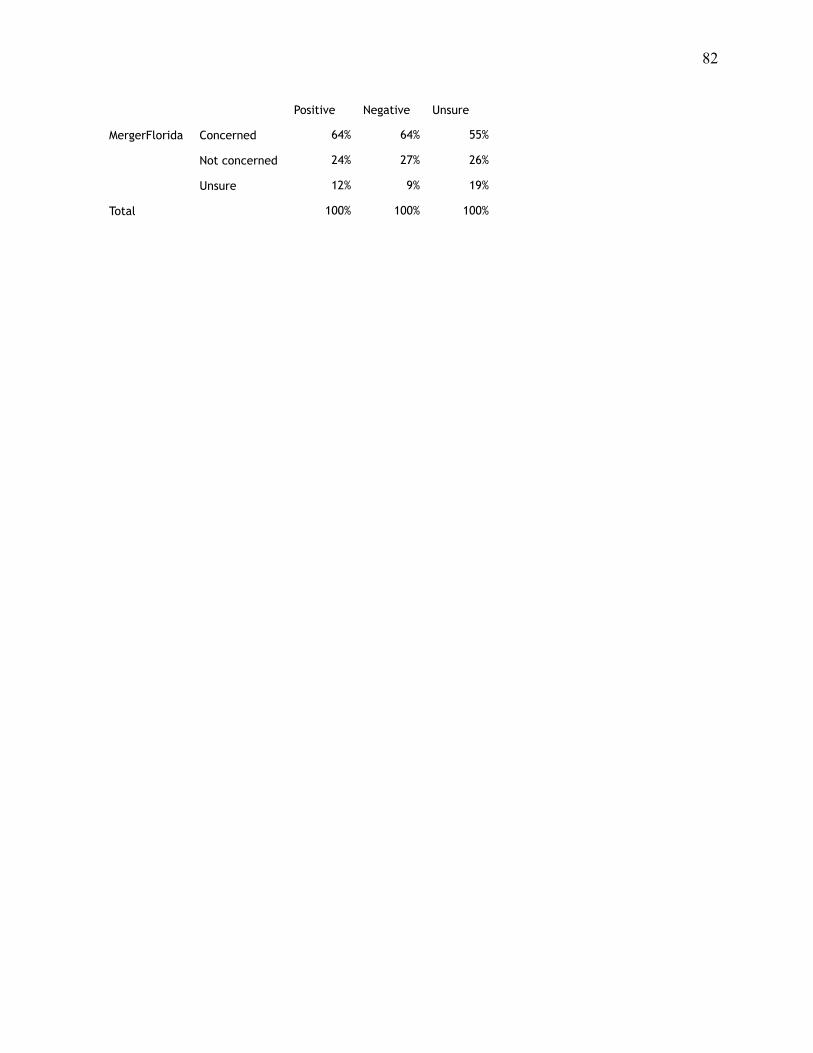
MergerFlorida * Ige Crosstabulation
% within Ige
Ige
! 82
Positive Negative Unsure
MergerFlorida Concerned 64% 64% 55%
Not concerned 24% 27% 26%
Unsure 12% 9% 19%
Total 100% 100% 100%
! 83
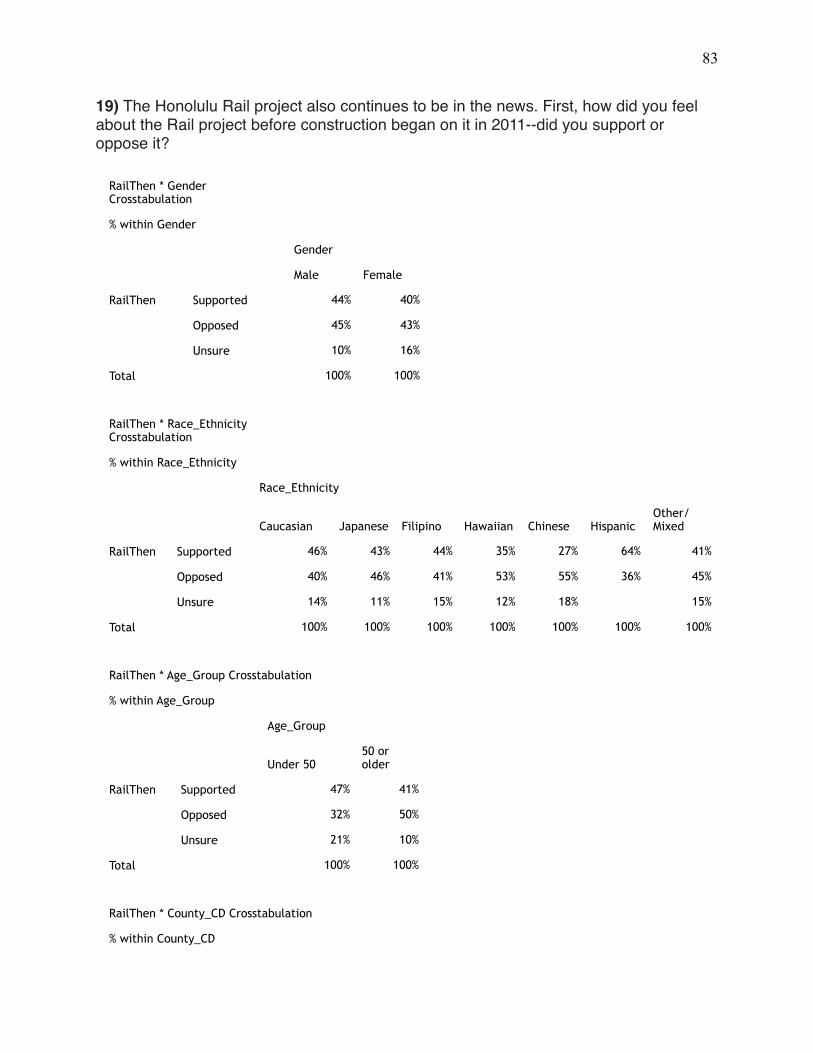
19) The Honolulu Rail project also continues to be in the news. First, how did you feel about the Rail project before construction began on it in 2011--did you support or oppose it?
RailThen * Gender Crosstabulation
% within Gender
Gender
Male Female
RailThen Supported 44% 40%
Opposed 45% 43%
Unsure 10% 16%
Total 100% 100%
RailThen * Race_Ethnicity Crosstabulation
% within Race_Ethnicity
Race_Ethnicity
Caucasian Japanese Filipino Hawaiian Chinese HispanicOther/Mixed
RailThen Supported 46% 43% 44% 35% 27% 64% 41%
Opposed 40% 46% 41% 53% 55% 36% 45%
Unsure 14% 11% 15% 12% 18% 15%
Total 100% 100% 100% 100% 100% 100% 100%
RailThen * Age_Group Crosstabulation
% within Age_Group
Age_Group
Under 5050 or older
RailThen Supported 47% 41%
Opposed 32% 50%
Unsure 21% 10%
Total 100% 100%
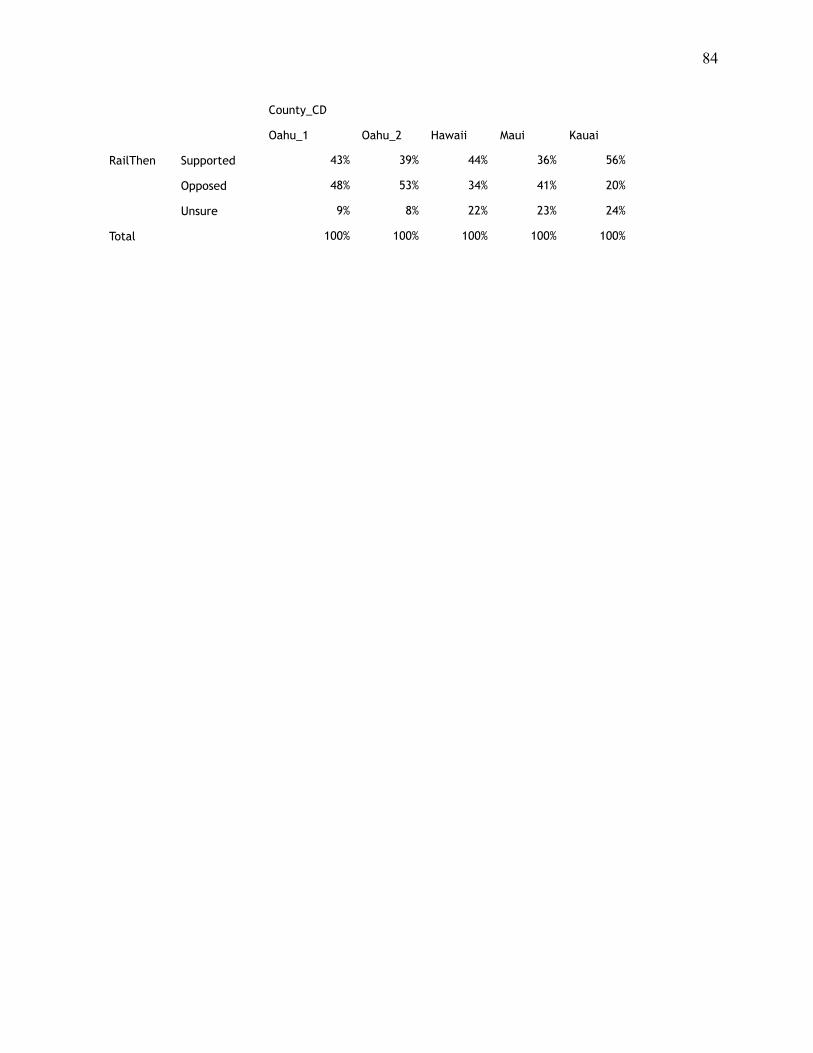
RailThen * County_CD Crosstabulation
% within County_CD
! 84
County_CD
Oahu_1 Oahu_2 Hawaii Maui Kauai
RailThen Supported 43% 39% 44% 36% 56%
Opposed 48% 53% 34% 41% 20%
Unsure 9% 8% 22% 23% 24%
Total 100% 100% 100% 100% 100%
! 85
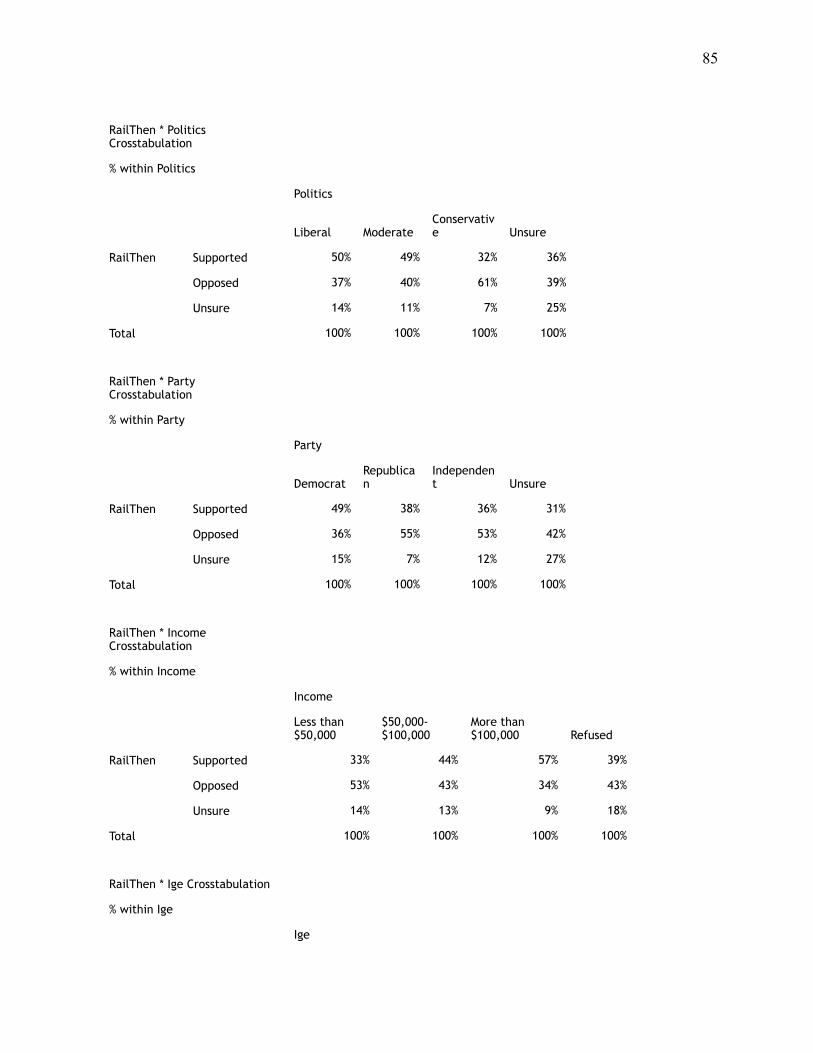
RailThen * Politics Crosstabulation
% within Politics
Politics
Liberal ModerateConservative Unsure
RailThen Supported 50% 49% 32% 36%
Opposed 37% 40% 61% 39%
Unsure 14% 11% 7% 25%
Total 100% 100% 100% 100%
RailThen * Party Crosstabulation
% within Party
Party
DemocratRepublican
Independent Unsure
RailThen Supported 49% 38% 36% 31%
Opposed 36% 55% 53% 42%
Unsure 15% 7% 12% 27%
Total 100% 100% 100% 100%
RailThen * Income Crosstabulation
% within Income
Income
Less than $50,000
$50,000-$100,000
More than $100,000 Refused
RailThen Supported 33% 44% 57% 39%
Opposed 53% 43% 34% 43%
Unsure 14% 13% 9% 18%
Total 100% 100% 100% 100%
RailThen * Ige Crosstabulation
% within Ige
Ige

! 86
Positive Negative Unsure
RailThen Supported 55% 35% 36%
Opposed 33% 60% 41%
Unsure 13% 5% 23%
Total 100% 100% 100%
RailThen * Caldwell Crosstabulation
% within Caldwell
Caldwell
Positive Negative Unsure
RailThen Supported 61% 23% 38%
Opposed 32% 71% 31%
Unsure 7% 5% 31%
Total 100% 100% 100%
! 87
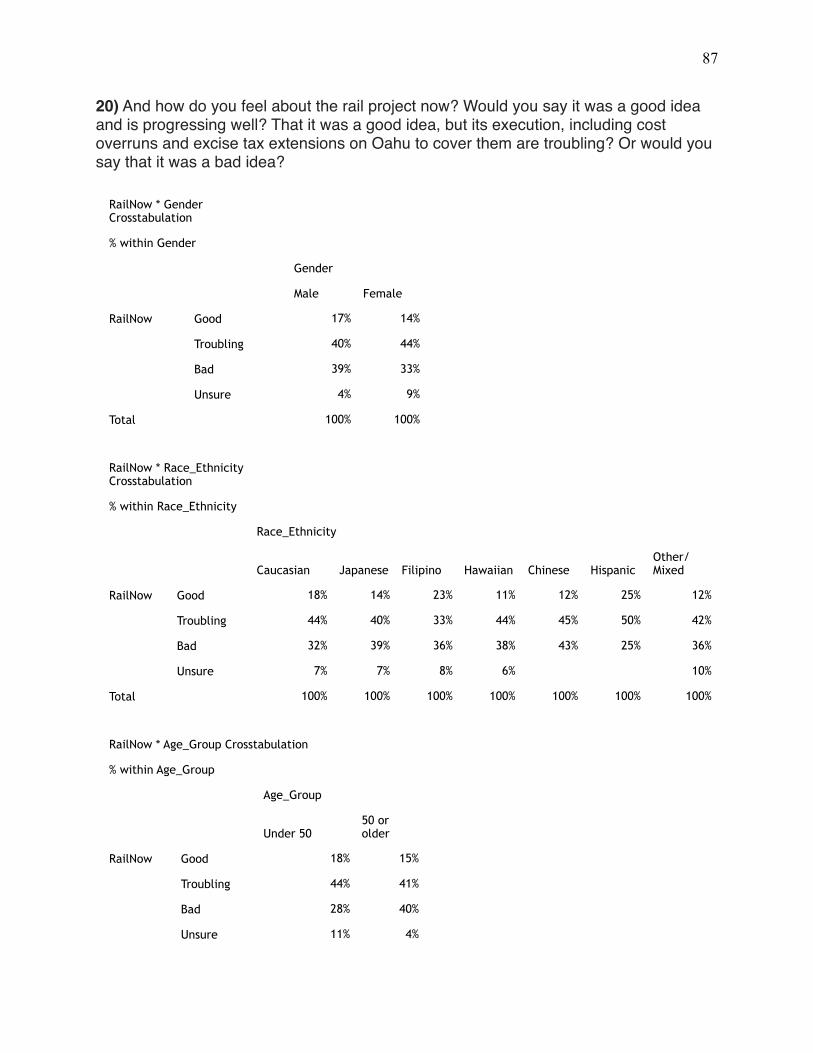
20) And how do you feel about the rail project now? Would you say it was a good idea and is progressing well? That it was a good idea, but its execution, including cost overruns and excise tax extensions on Oahu to cover them are troubling? Or would you say that it was a bad idea?
RailNow * Gender Crosstabulation
% within Gender
Gender
Male Female
RailNow Good 17% 14%
Troubling 40% 44%
Bad 39% 33%
Unsure 4% 9%
Total 100% 100%
RailNow * Race_Ethnicity Crosstabulation
% within Race_Ethnicity
Race_Ethnicity
Caucasian Japanese Filipino Hawaiian Chinese HispanicOther/Mixed
RailNow Good 18% 14% 23% 11% 12% 25% 12%
Troubling 44% 40% 33% 44% 45% 50% 42%
Bad 32% 39% 36% 38% 43% 25% 36%
Unsure 7% 7% 8% 6% 10%
Total 100% 100% 100% 100% 100% 100% 100%
RailNow * Age_Group Crosstabulation
% within Age_Group
Age_Group
Under 5050 or older
RailNow Good 18% 15%
Troubling 44% 41%
Bad 28% 40%
Unsure 11% 4%
! 88
Total 100% 100%
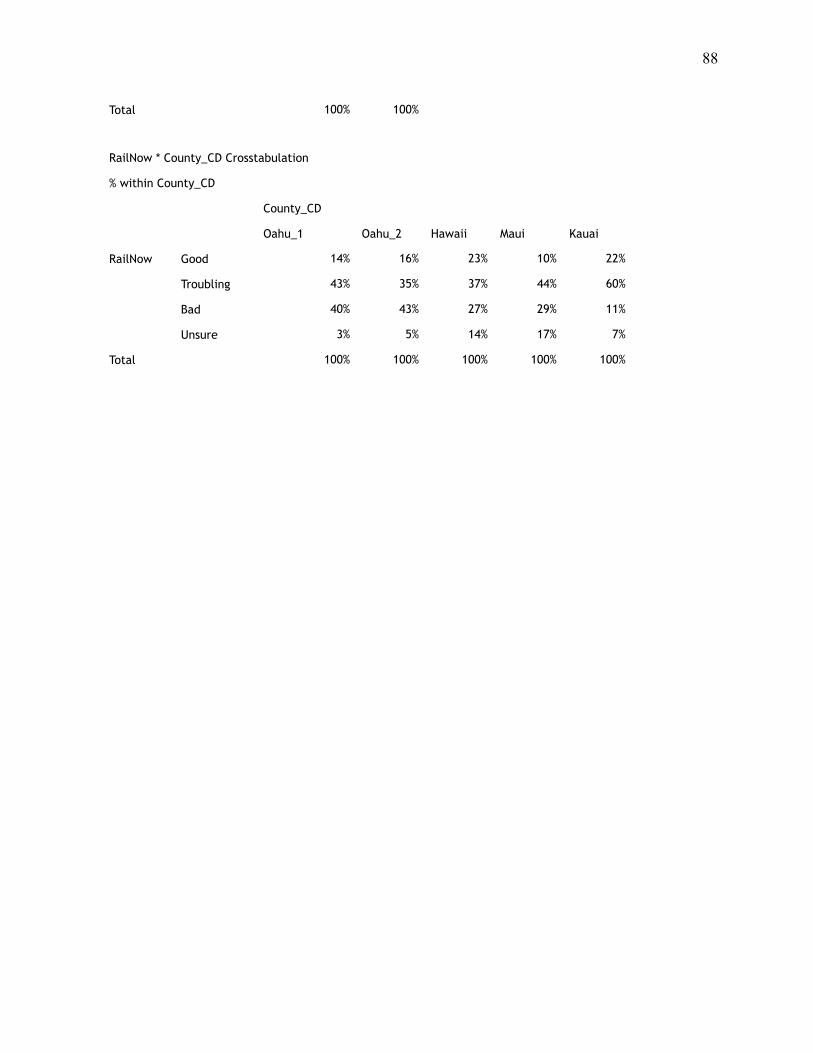
RailNow * County_CD Crosstabulation
% within County_CD
County_CD
Oahu_1 Oahu_2 Hawaii Maui Kauai
RailNow Good 14% 16% 23% 10% 22%
Troubling 43% 35% 37% 44% 60%
Bad 40% 43% 27% 29% 11%
Unsure 3% 5% 14% 17% 7%
Total 100% 100% 100% 100% 100%
! 89
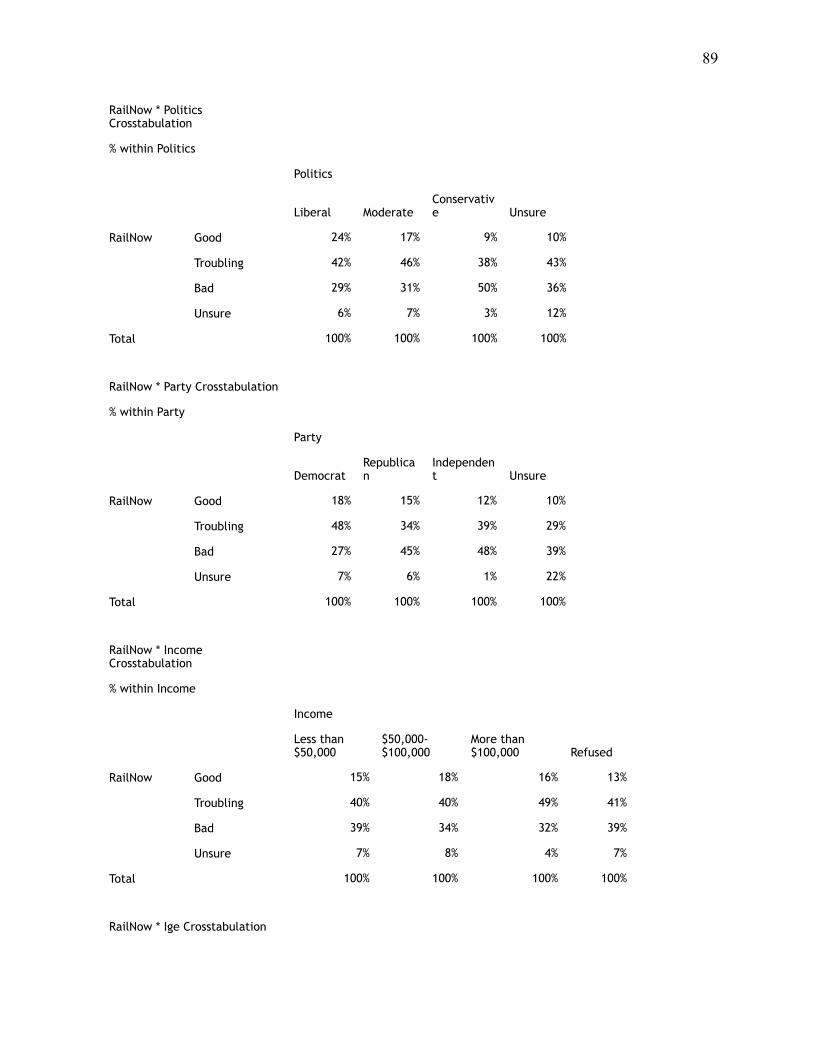
RailNow * Politics Crosstabulation
% within Politics
Politics
Liberal ModerateConservative Unsure
RailNow Good 24% 17% 9% 10%
Troubling 42% 46% 38% 43%
Bad 29% 31% 50% 36%
Unsure 6% 7% 3% 12%
Total 100% 100% 100% 100%
RailNow * Party Crosstabulation
% within Party
Party
DemocratRepublican
Independent Unsure
RailNow Good 18% 15% 12% 10%
Troubling 48% 34% 39% 29%
Bad 27% 45% 48% 39%
Unsure 7% 6% 1% 22%
Total 100% 100% 100% 100%
RailNow * Income Crosstabulation
% within Income
Income
Less than $50,000
$50,000-$100,000
More than $100,000 Refused
RailNow Good 15% 18% 16% 13%
Troubling 40% 40% 49% 41%
Bad 39% 34% 32% 39%
Unsure 7% 8% 4% 7%
Total 100% 100% 100% 100%
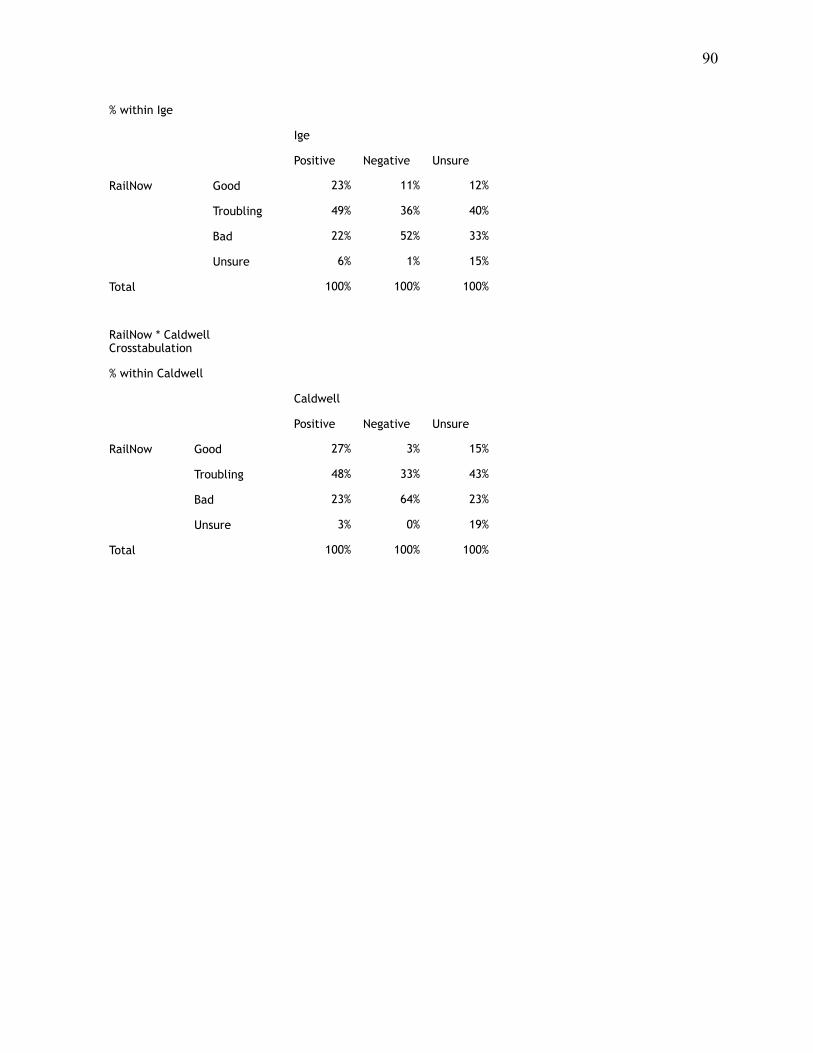
RailNow * Ige Crosstabulation
! 90
% within Ige
Ige
Positive Negative Unsure
RailNow Good 23% 11% 12%
Troubling 49% 36% 40%
Bad 22% 52% 33%
Unsure 6% 1% 15%
Total 100% 100% 100%
RailNow * Caldwell Crosstabulation
% within Caldwell
Caldwell
Positive Negative Unsure
RailNow Good 27% 3% 15%
Troubling 48% 33% 43%
Bad 23% 64% 23%
Unsure 3% 0% 19%
Total 100% 100% 100%
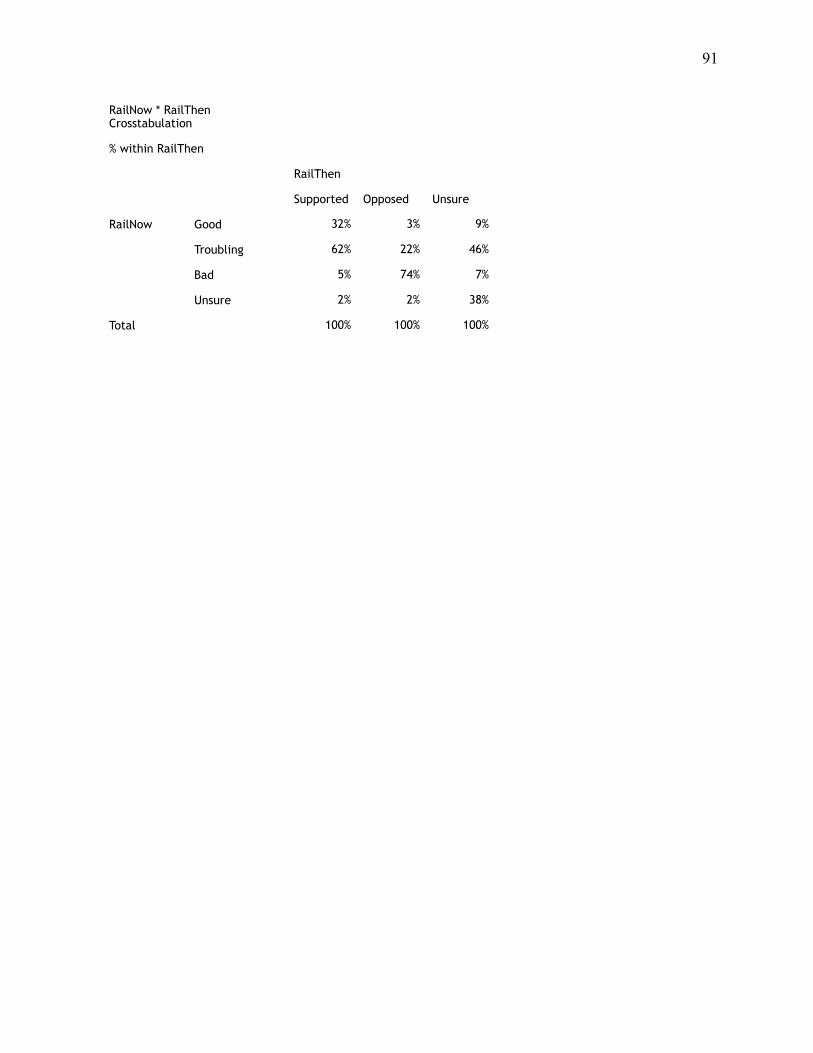
! 91
RailNow * RailThen Crosstabulation
% within RailThen
RailThen
Supported Opposed Unsure
RailNow Good 32% 3% 9%
Troubling 62% 22% 46%
Bad 5% 74% 7%
Unsure 2% 2% 38%
Total 100% 100% 100%