Embed Size (px)
Citation preview
LEVERAGING SOCIAL PLATFORMS ALONG THE ENTIRE CUSTOMER JOURNEY
BENCHMARKING DIGITAL PERFORMANCE
BENCHMARKING
EDUCATION
RESEARCH
MEMBERS
INTRODUCTION SOCIAL PLATFORMS 2017
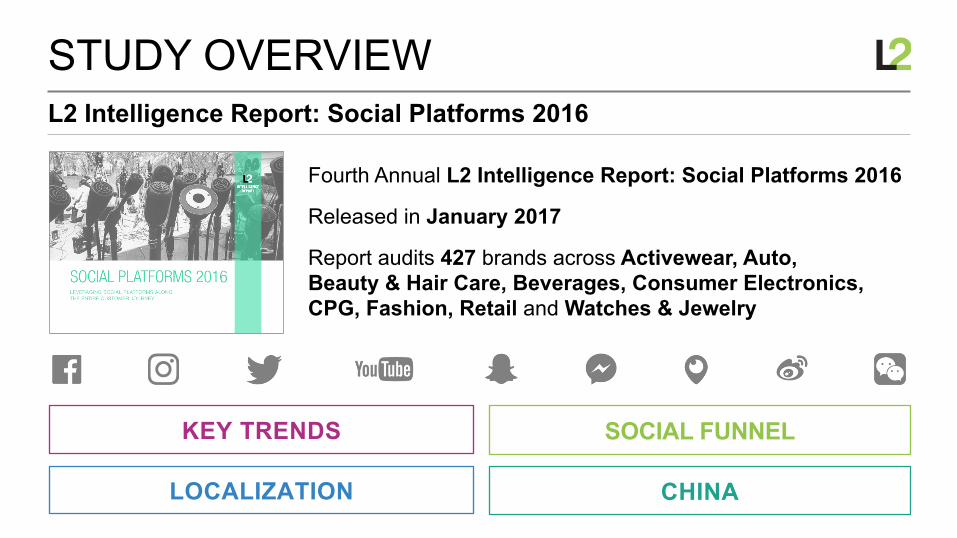
L2 Intelligence Report: Social Platforms 2016
STUDY OVERVIEW
Fourth Annual L2 Intelligence Report: Social Platforms 2016
Released in January 2017
Report audits 427 brands across Activewear, Auto, Beauty & Hair Care, Beverages, Consumer Electronics, CPG, Fashion, Retail and Watches & Jewelry
CHINA LOCALIZATION
KEY TRENDS SOCIAL FUNNEL
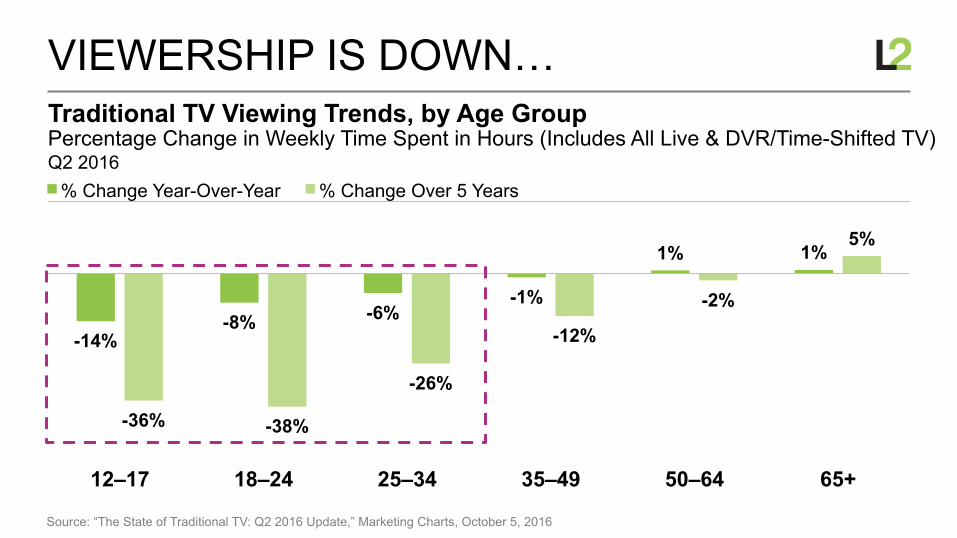
12–17 18–24 25–34 35–49 50–64 65+
-14% -8% -6%
-1%
1% 1%
-36% -38%
-26%
-12%
-2%
5%
% Change Year-Over-Year % Change Over 5 Years Q2 2016 Percentage Change in Weekly Time Spent in Hours (Includes All Live & DVR/Time-Shifted TV) Traditional TV Viewing Trends, by Age Group
VIEWERSHIP IS DOWN…
Source: “The State of Traditional TV: Q2 2016 Update,” Marketing Charts, October 5, 2016
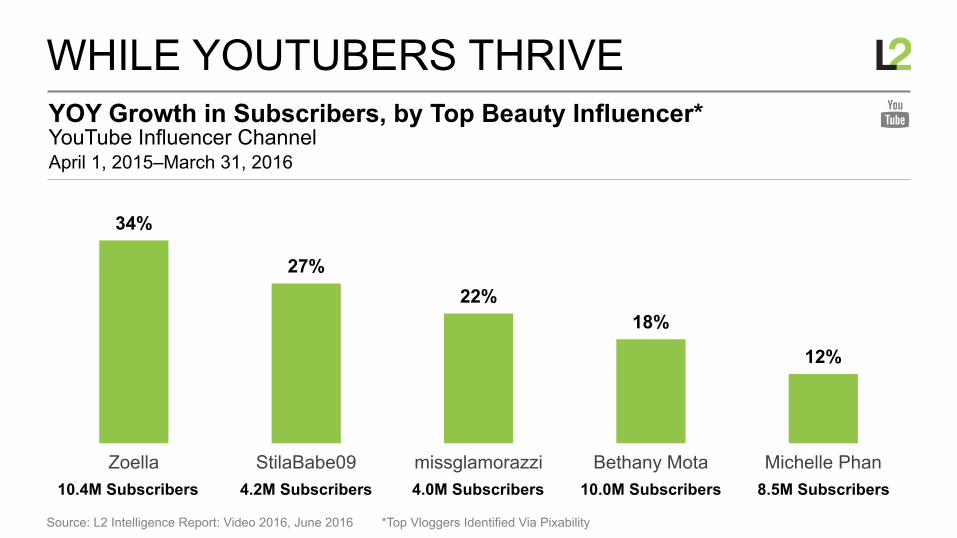
April 1, 2015–March 31, 2016 YouTube Influencer Channel YOY Growth in Subscribers, by Top Beauty Influencer*
WHILE YOUTUBERS THRIVE
Source: L2 Intelligence Report: Video 2016, June 2016 *Top Vloggers Identified Via Pixability
34%
27% 22%
18%
12%
Zoella StilaBabe09 missglamorazzi Bethany Mota Michelle Phan 10.4M Subscribers 4.2M Subscribers 4.0M Subscribers 10.0M Subscribers 8.5M Subscribers
0%
10%
20%
30%
40%
50%
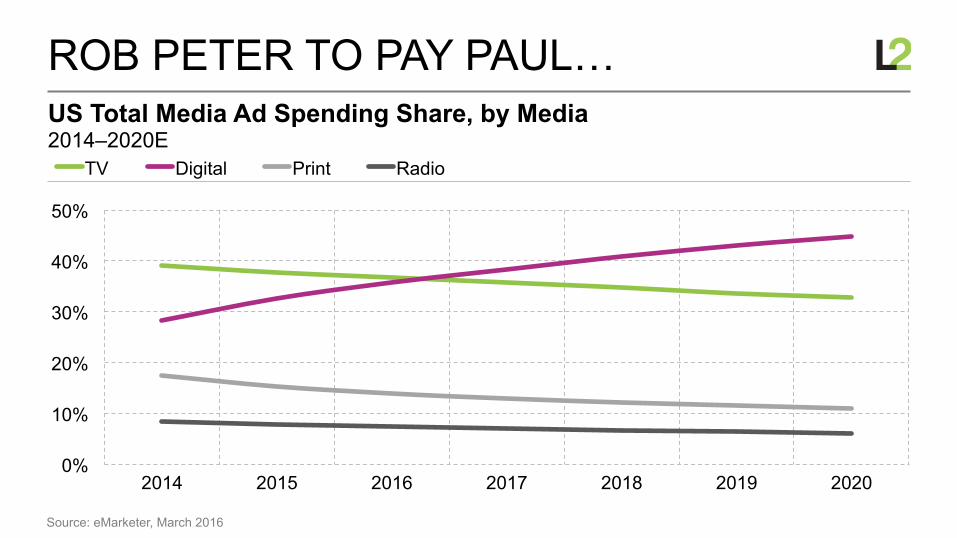
2014 2015 2016 2017 2018 2019 2020
TV Digital Print Radio 2014–2020E US Total Media Ad Spending Share, by Media
ROB PETER TO PAY PAUL…
Source: eMarketer, March 2016
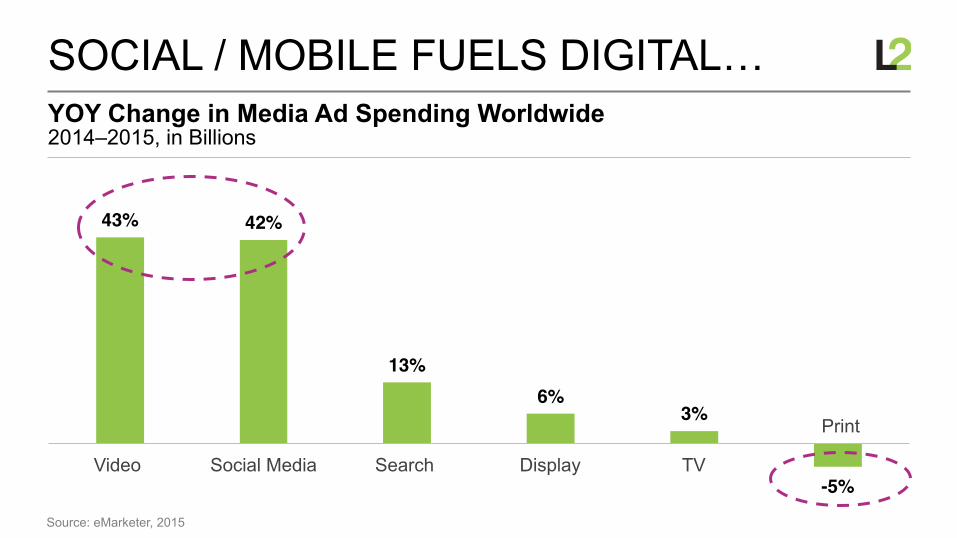
43% 42%
13%6%
3%
-5%Video Social Media Search Display TV
2014–2015, in Billions YOY Change in Media Ad Spending Worldwide
SOCIAL / MOBILE FUELS DIGITAL…
Source: eMarketer, 2015
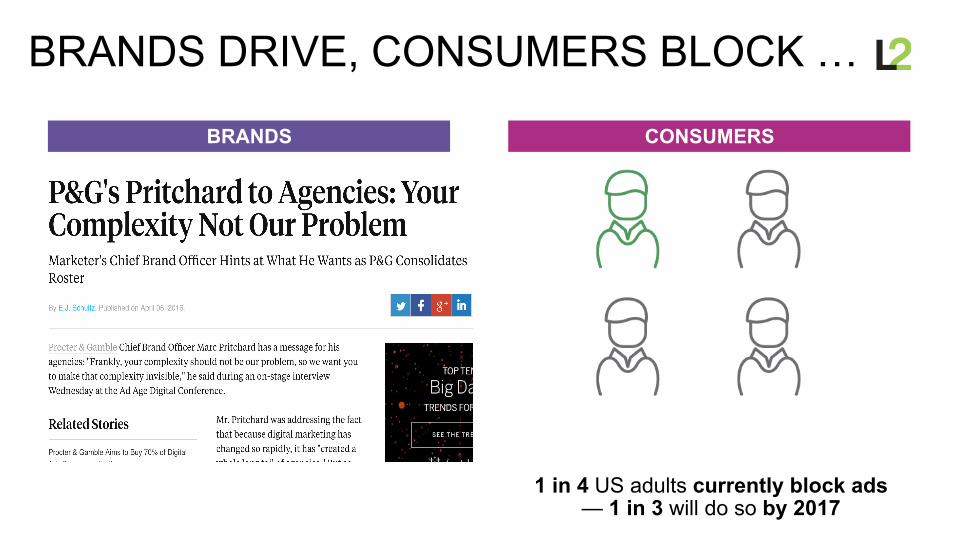
BRANDS DRIVE, CONSUMERS BLOCK …
BRANDS CONSUMERS
1 in 4 US adults currently block ads — 1 in 3 will do so by 2017
!
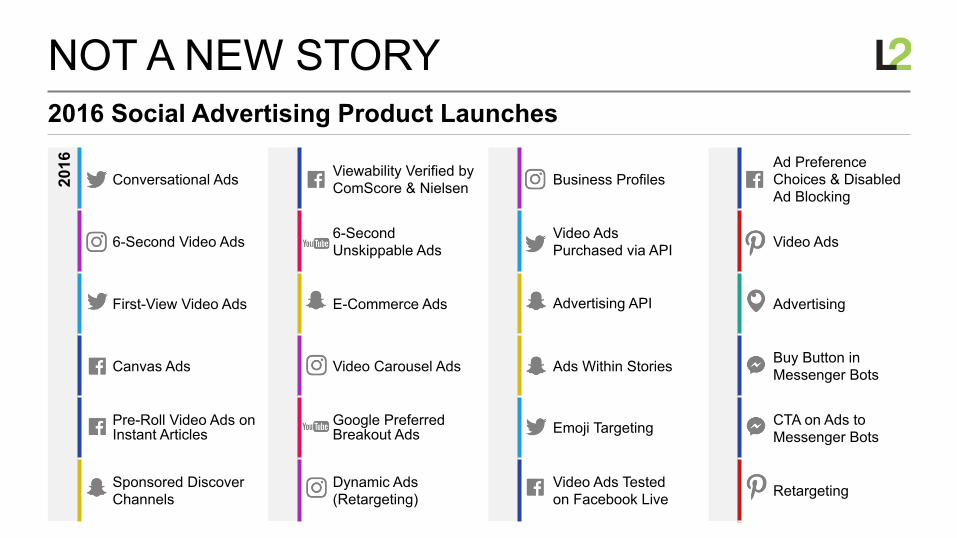
Viewability Verified by ComScore & Nielsen
6-Second Unskippable Ads
E-Commerce Ads
Video Carousel Ads
Google Preferred Breakout Ads
Dynamic Ads (Retargeting)
!!
Business Profiles
Video Ads Purchased via API
Advertising API
Ads Within Stories
Emoji Targeting
Video Ads Tested on Facebook Live
Ad Preference Choices & Disabled Ad Blocking
Video Ads
Advertising
Buy Button in Messenger Bots
CTA on Ads to Messenger Bots
Retargeting
2016 Social Advertising Product Launches
NOT A NEW STORY 20
16
Conversational Ads
6-Second Video Ads
First-View Video Ads
Canvas Ads
Pre-Roll Video Ads on Instant Articles
Sponsored Discover Channels
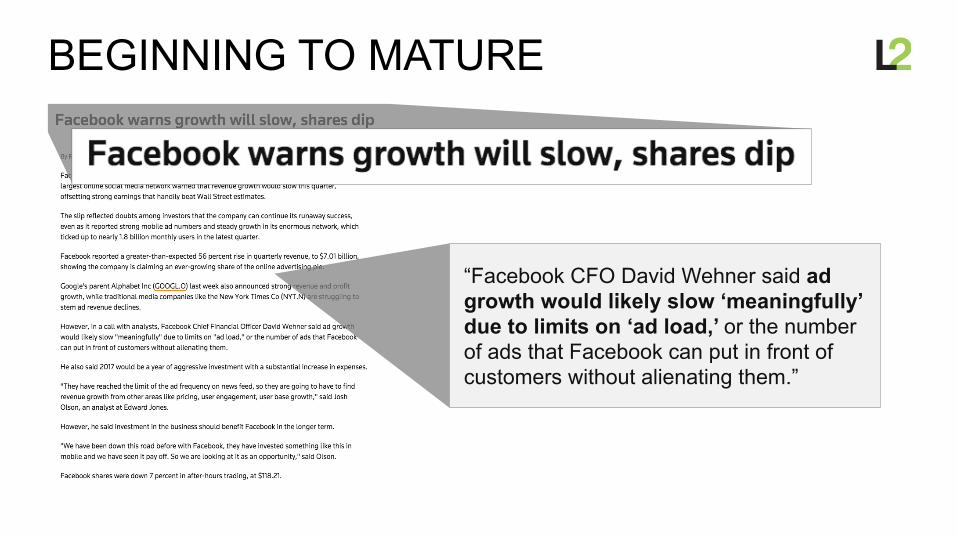
BEGINNING TO MATURE
“Facebook CFO David Wehner said ad growth would likely slow ‘meaningfully’ due to limits on ‘ad load,’ or the number of ads that Facebook can put in front of customers without alienating them.”
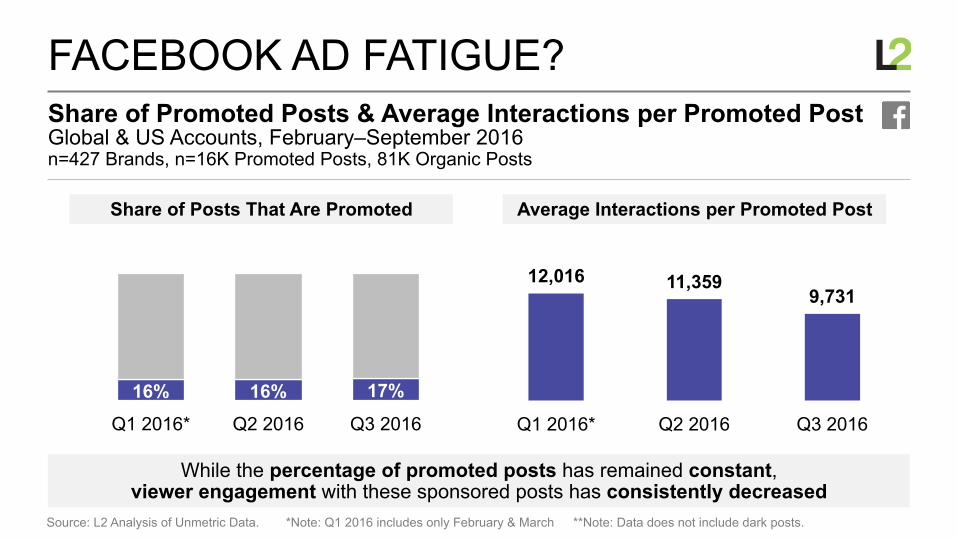
12,016 11,359 9,731
Q1 2016* Q2 2016 Q3 2016
n=427 Brands, n=16K Promoted Posts, 81K Organic Posts Global & US Accounts, February–September 2016 Share of Promoted Posts & Average Interactions per Promoted Post
FACEBOOK AD FATIGUE?
Source: L2 Analysis of Unmetric Data. *Note: Q1 2016 includes only February & March **Note: Data does not include dark posts.
16% 16% 17%
Q1 2016* Q2 2016 Q3 2016
Share of Posts That Are Promoted Average Interactions per Promoted Post
While the percentage of promoted posts has remained constant, viewer engagement with these sponsored posts has consistently decreased
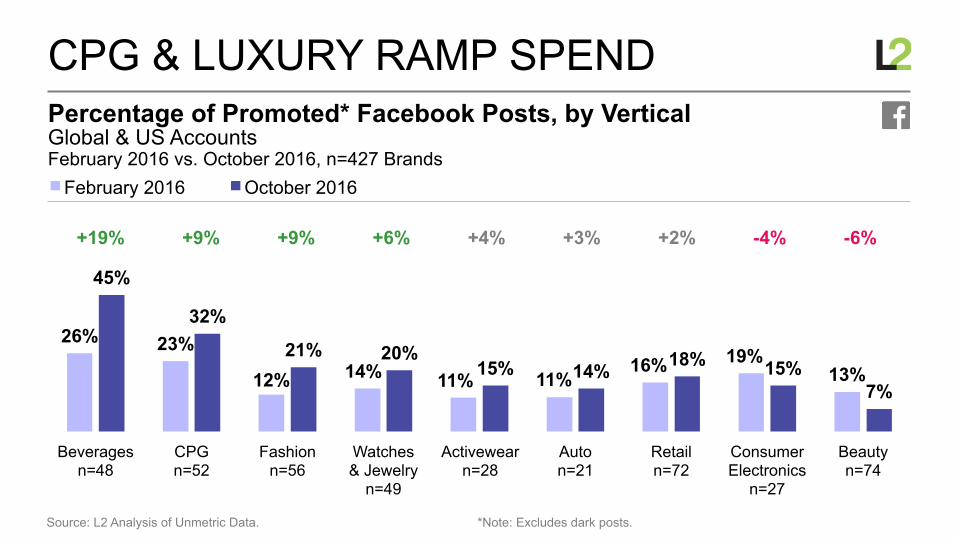
February 2016 vs. October 2016, n=427 Brands Global & US Accounts Percentage of Promoted* Facebook Posts, by Vertical
CPG & LUXURY RAMP SPEND
Source: L2 Analysis of Unmetric Data. *Note: Excludes dark posts.
26% 23%
12% 14% 11% 11% 16% 19%
13%
45%
32%
21% 20% 15% 14% 18% 15%
7%
Beverages n=48
CPG n=52
Fashion n=56
Watches & Jewelry
n=49
Activewear n=28
Auto n=21
Retail n=72
Consumer Electronics
n=27
Beauty n=74
February 2016 October 2016
+19% +9% +2% +6% -4% -6% +9% +4% +3%
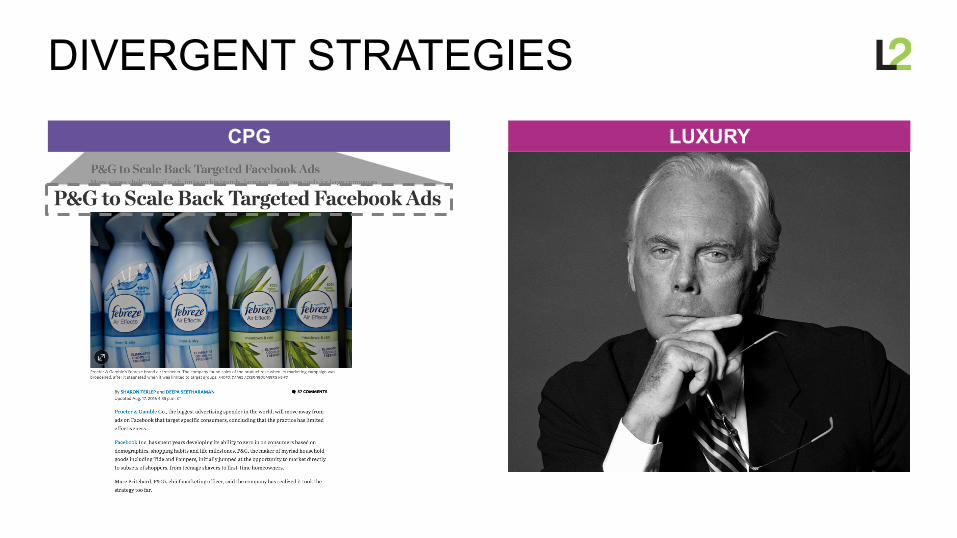
DIVERGENT STRATEGIES
CPG LUXURY
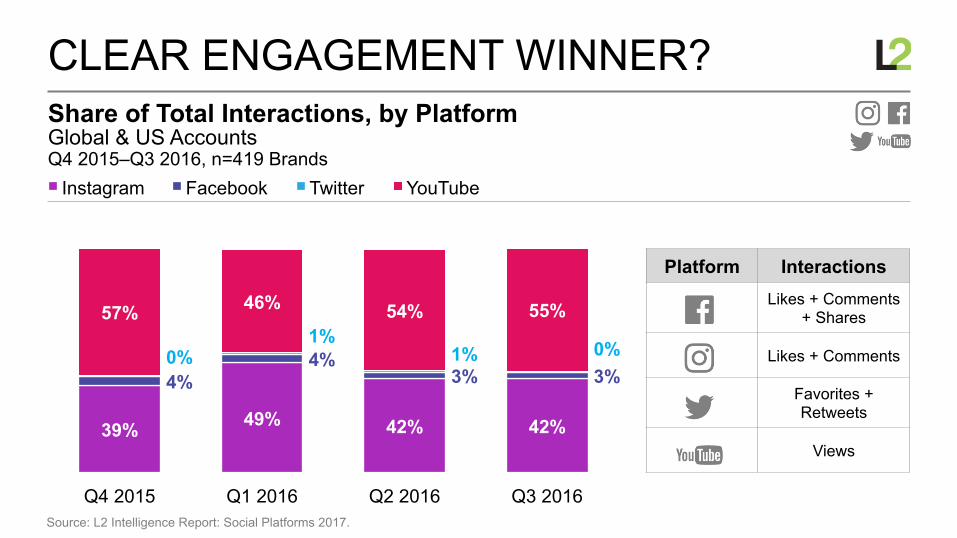
Q4 2015–Q3 2016, n=419 Brands Global & US Accounts Share of Total Interactions, by Platform
CLEAR ENGAGEMENT WINNER?
Source: L2 Intelligence Report: Social Platforms 2017.
39% 49% 42% 42%
4% 4%
3% 3% 0%
1% 1% 0%
57% 46% 54% 55%
Q4 2015 Q1 2016 Q2 2016 Q3 2016
Instagram Facebook Twitter YouTube
Platform Interactions Likes + Comments
+ Shares
Likes + Comments
Favorites + Retweets
Views
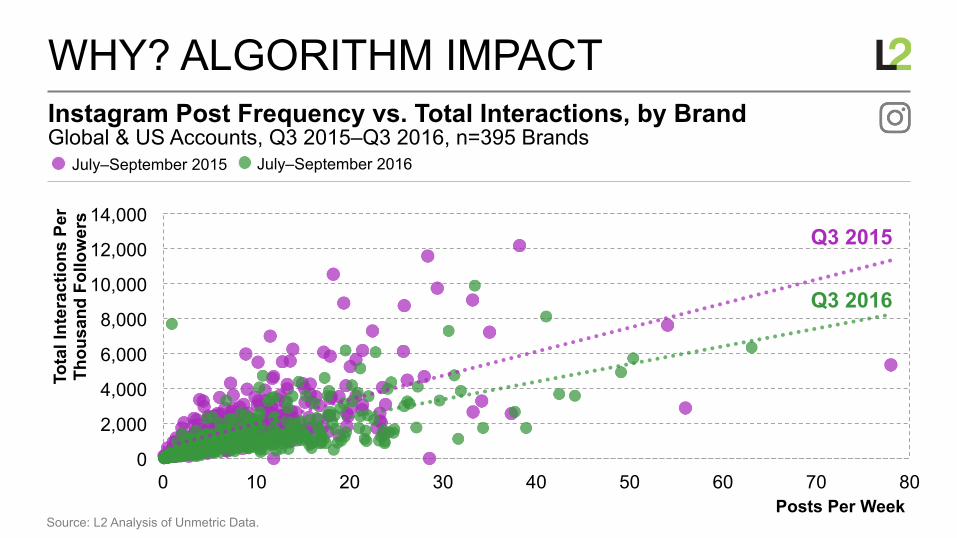
Global & US Accounts, Q3 2015–Q3 2016, n=395 Brands Instagram Post Frequency vs. Total Interactions, by Brand
WHY? ALGORITHM IMPACT
Source: L2 Analysis of Unmetric Data.
July–September 2015 July–September 2016
0
2,000
4,000
6,000
8,000
10,000
12,000
14,000
0 10 20 30 40 50 60 70 80
Tota
l Int
erac
tions
Per
Th
ousa
nd F
ollo
wer
s
Posts Per Week
Q3 2015
Q3 2016
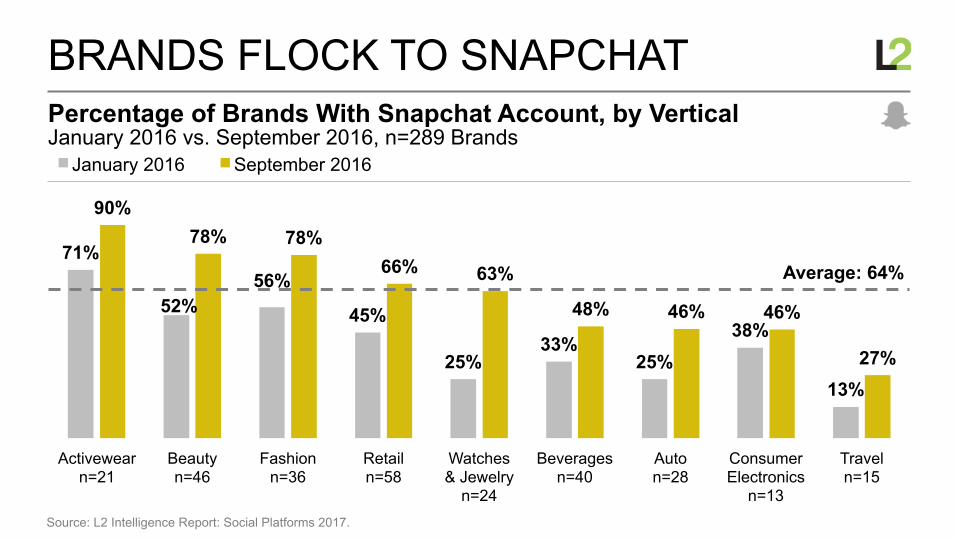
January 2016 vs. September 2016, n=289 Brands Percentage of Brands With Snapchat Account, by Vertical
BRANDS FLOCK TO SNAPCHAT
Source: L2 Intelligence Report: Social Platforms 2017.
71%
52% 56%
45%
25% 33%
25% 38%
13%
90% 78% 78%
66% 63%
48% 46% 46%
27%
Activewear n=21
Beauty n=46
Fashion n=36
Retail n=58
Watches & Jewelry
n=24
Beverages n=40
Auto n=28
Consumer Electronics
n=13
Travel n=15
January 2016 September 2016
Average: 64%
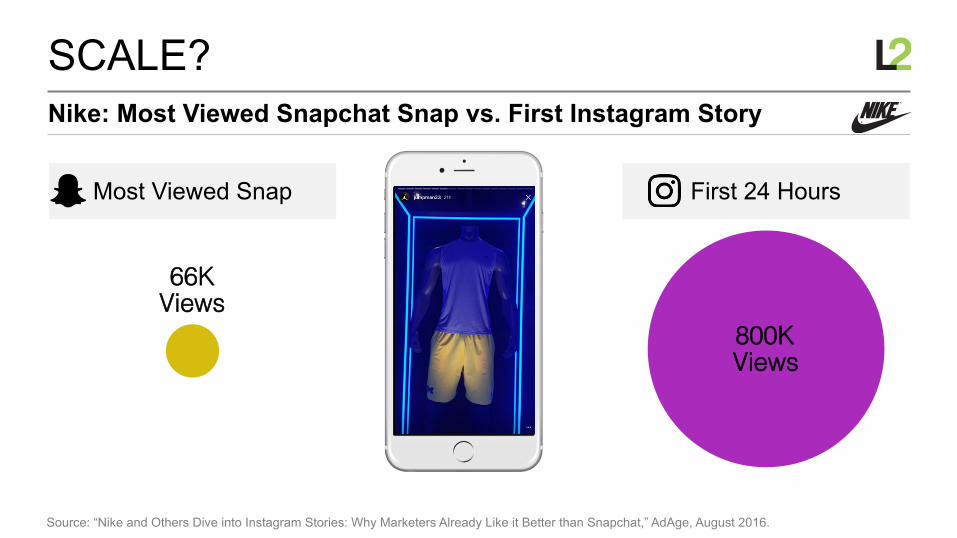
Nike: Most Viewed Snapchat Snap vs. First Instagram Story
SCALE?
Source: “Nike and Others Dive into Instagram Stories: Why Marketers Already Like it Better than Snapchat,” AdAge, August 2016.
Most Viewed Snap First 24 Hours
66K!Views!
800K!Views!
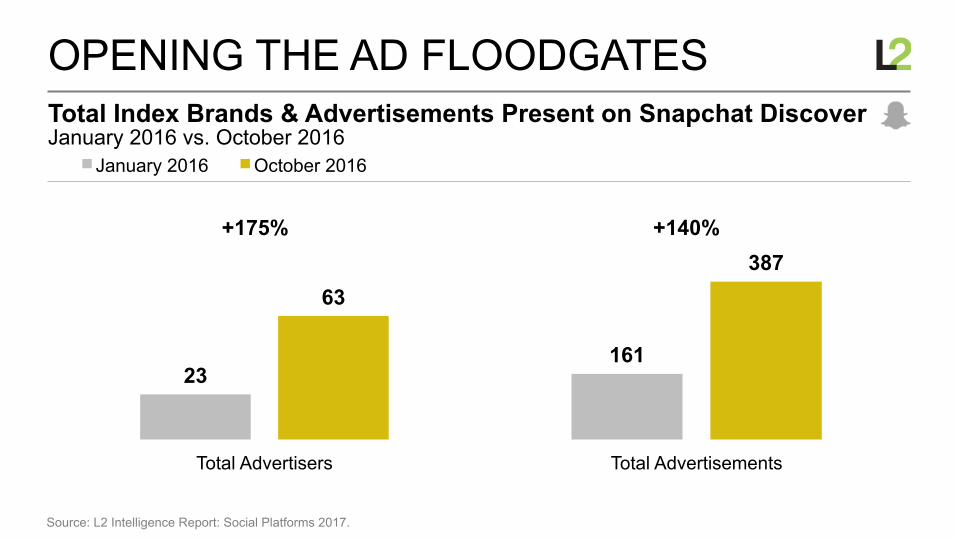
January 2016 vs. October 2016 Total Index Brands & Advertisements Present on Snapchat Discover
OPENING THE AD FLOODGATES
Source: L2 Intelligence Report: Social Platforms 2017.
161
387
Total Advertisements
23
63
Total Advertisers
January 2016 October 2016
+175% +140%
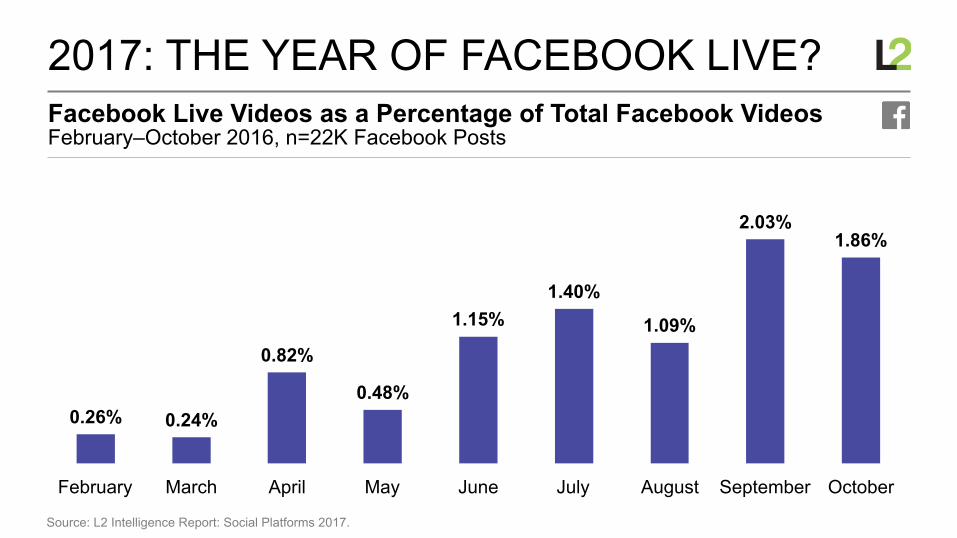
February–October 2016, n=22K Facebook Posts Facebook Live Videos as a Percentage of Total Facebook Videos
2017: THE YEAR OF FACEBOOK LIVE?
Source: L2 Intelligence Report: Social Platforms 2017.
0.26% 0.24%
0.82%
0.48%
1.15% 1.40%
1.09%
2.03% 1.86%
February March April May June July August September October
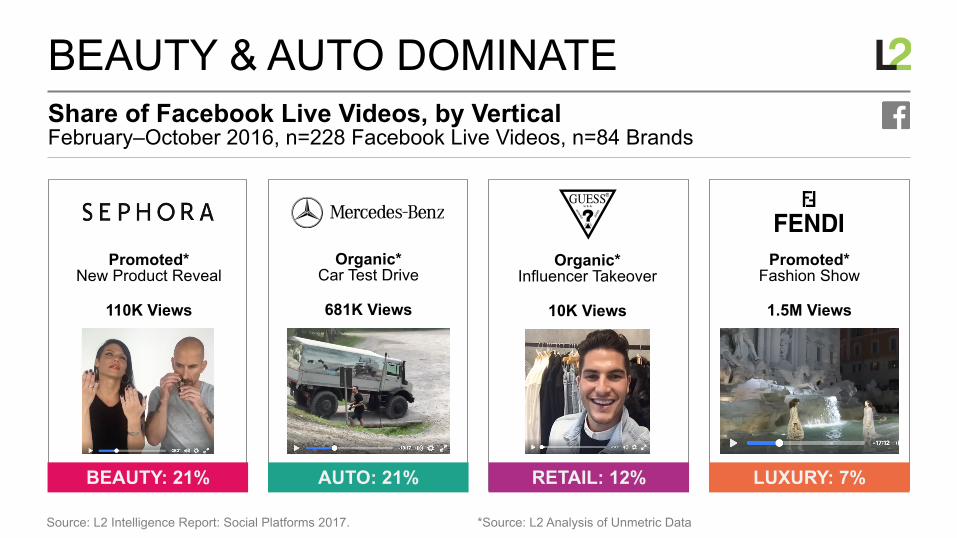
February–October 2016, n=228 Facebook Live Videos, n=84 Brands Share of Facebook Live Videos, by Vertical
BEAUTY & AUTO DOMINATE
Source: L2 Intelligence Report: Social Platforms 2017. *Source: L2 Analysis of Unmetric Data
Promoted* Fashion Show
1.5M Views
Organic* Car Test Drive
681K Views
Promoted* New Product Reveal
110K Views
Organic* Influencer Takeover
10K Views
BEAUTY: 21% AUTO: 21% RETAIL: 12% LUXURY: 7%
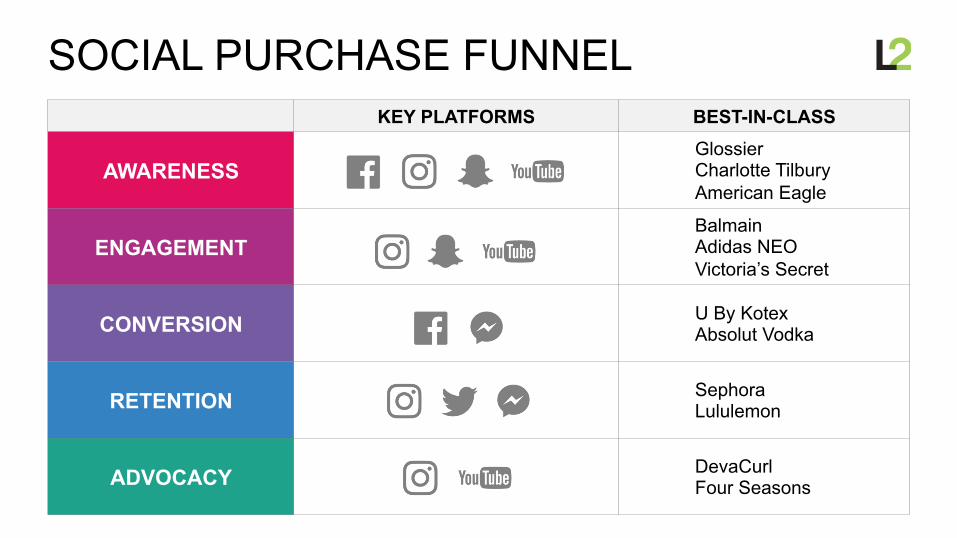
SOCIAL PURCHASE FUNNEL KEY PLATFORMS BEST-IN-CLASS
AWARENESS Glossier Charlotte Tilbury American Eagle
ENGAGEMENT Balmain Adidas NEO Victoria’s Secret
CONVERSION U By Kotex Absolut Vodka
RETENTION Sephora Lululemon
ADVOCACY DevaCurl Four Seasons
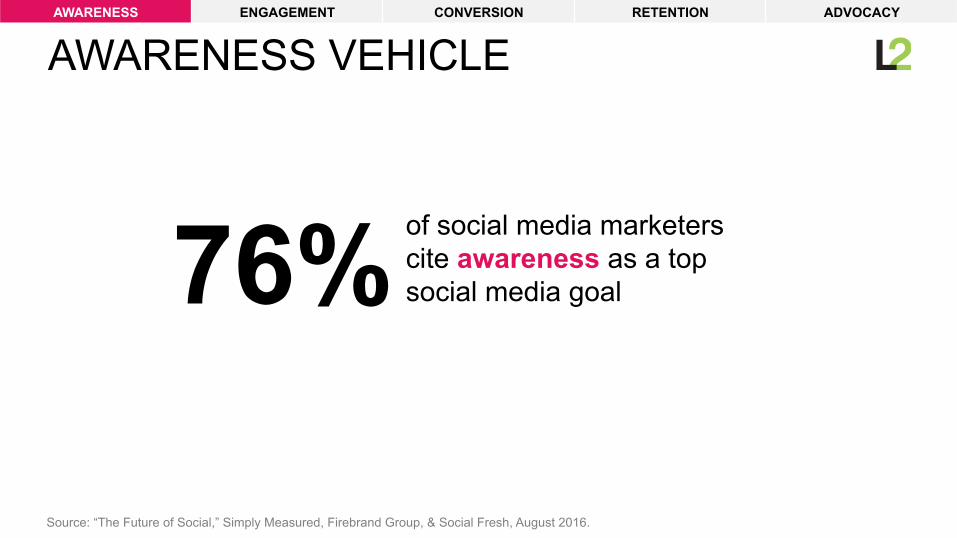
AWARENESS VEHICLE
Source: “The Future of Social,” Simply Measured, Firebrand Group, & Social Fresh, August 2016.
AWARENESS ENGAGEMENT CONVERSION RETENTION ADVOCACY
76% of social media marketers cite awareness as a top social media goal
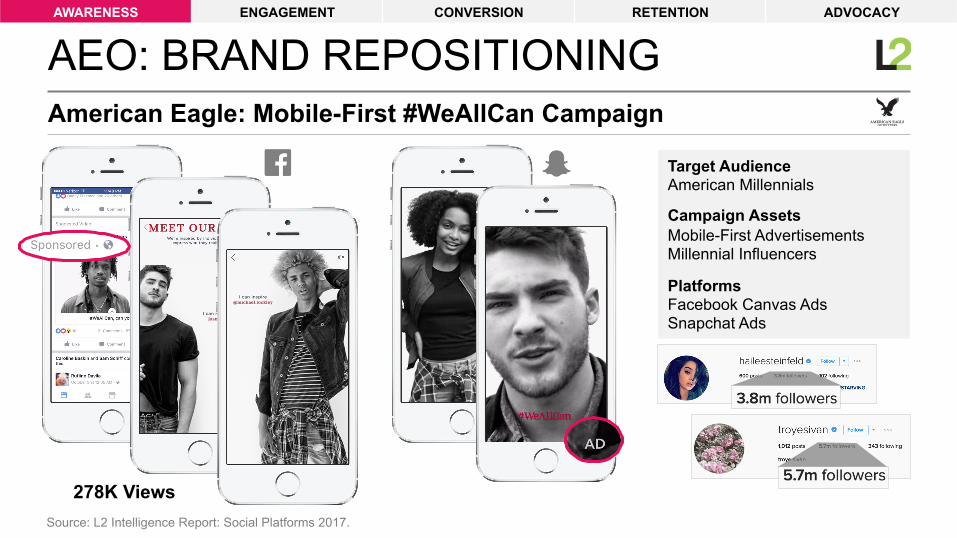
American Eagle: Mobile-First #WeAllCan Campaign
AEO: BRAND REPOSITIONING
Source: L2 Intelligence Report: Social Platforms 2017.
Target Audience American Millennials
Campaign Assets Mobile-First Advertisements Millennial Influencers
Platforms Facebook Canvas Ads Snapchat Ads
AWARENESS ENGAGEMENT CONVERSION RETENTION ADVOCACY
278K Views
ENGAGING EXISTING COMMUNITIES
Source: “The Future of Social,” Simply Measured, Firebrand Group, & Social Fresh, August 2016.
AWARENESS ENGAGEMENT CONVERSION RETENTION ADVOCACY
34% of social media marketers cite customer loyalty as a top social media goal
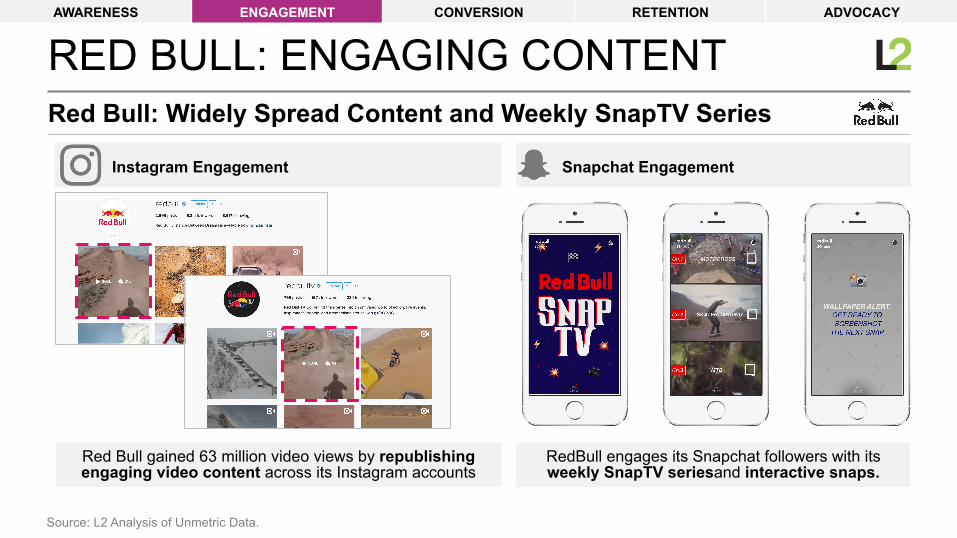
Instagram Engagement Snapchat Engagement
Red Bull: Widely Spread Content and Weekly SnapTV Series
RED BULL: ENGAGING CONTENT
Source: L2 Analysis of Unmetric Data.
AWARENESS ENGAGEMENT CONVERSION RETENTION ADVOCACY
RedBull engages its Snapchat followers with its weekly SnapTV seriesand interactive snaps.
Red Bull gained 63 million video views by republishing engaging video content across its Instagram accounts
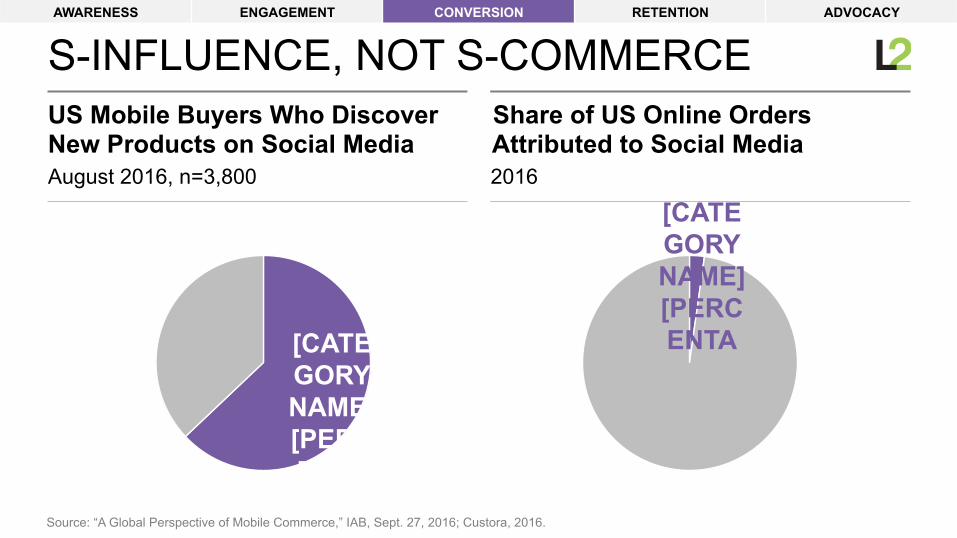
Can social commerce work?
AWARENESS ENGAGEMENT CONVERSION RETENTION ADVOCACY
[CATEGORY NAME][PERCENTA[CATE
GORY NAME][PERCENTA
August 2016, n=3,800 2016
US Mobile Buyers Who Discover Share of US Online Orders New Products on Social Media Attributed to Social Media
S-INFLUENCE, NOT S-COMMERCE AWARENESS ENGAGEMENT CONVERSION RETENTION ADVOCACY
Source: “A Global Perspective of Mobile Commerce,” IAB, Sept. 27, 2016; Custora, 2016.
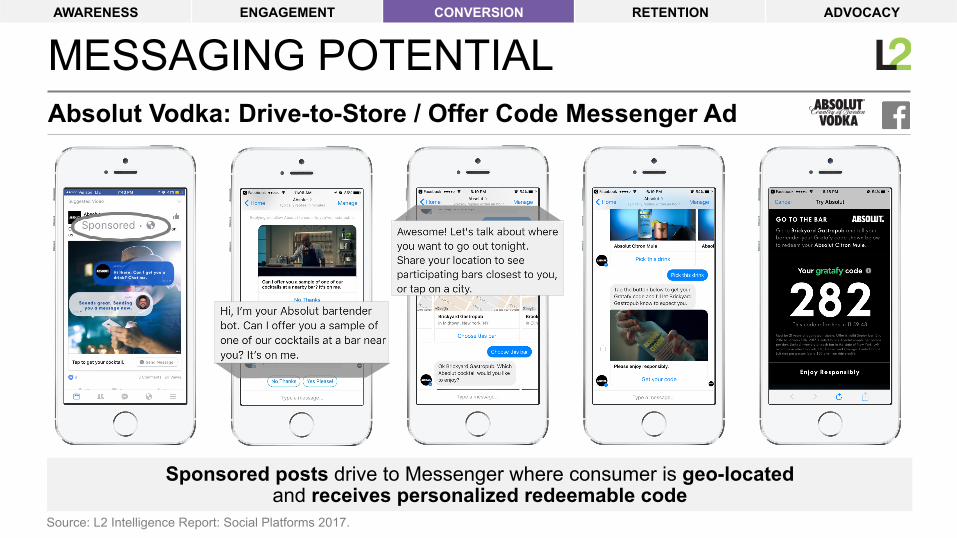
Absolut Vodka: Drive-to-Store / Offer Code Messenger Ad
MESSAGING POTENTIAL
Source: L2 Intelligence Report: Social Platforms 2017.
Sponsored posts drive to Messenger where consumer is geo-located and receives personalized redeemable code
AWARENESS ENGAGEMENT CONVERSION RETENTION ADVOCACY
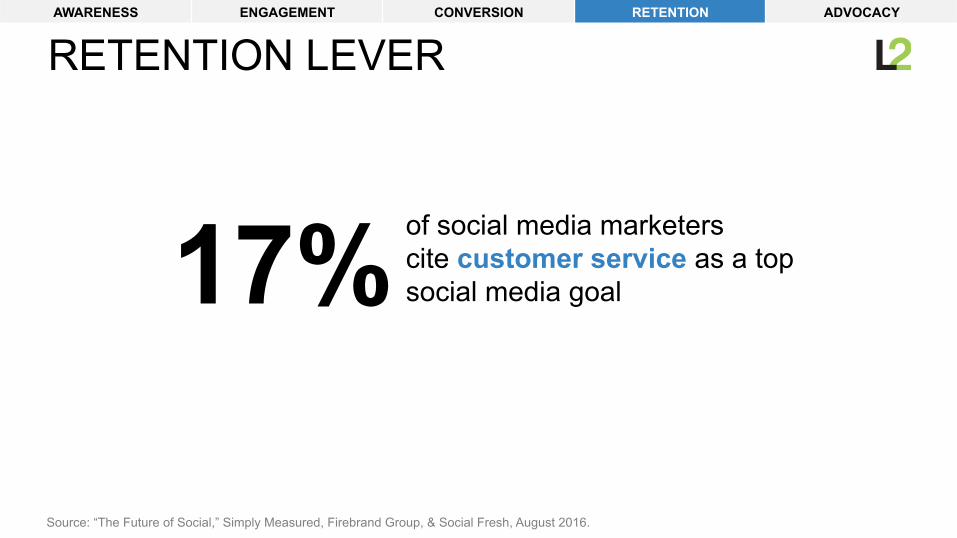
RETENTION LEVER
Source: “The Future of Social,” Simply Measured, Firebrand Group, & Social Fresh, August 2016.
AWARENESS ENGAGEMENT CONVERSION RETENTION ADVOCACY
17% of social media marketers cite customer service as a top social media goal
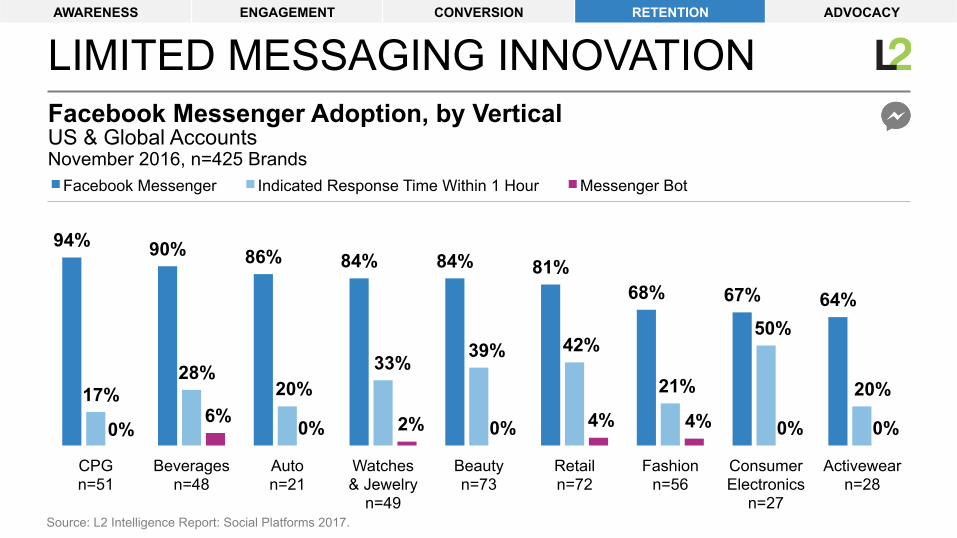
November 2016, n=425 Brands US & Global Accounts Facebook Messenger Adoption, by Vertical
LIMITED MESSAGING INNOVATION
Source: L2 Intelligence Report: Social Platforms 2017.
94% 90% 86% 84% 84% 81% 68% 67% 64%
17% 28%
20% 33% 39% 42%
21%
50%
20%
0% 6% 0% 2% 0% 4% 4% 0% 0%
CPG n=51
Beverages n=48
Auto n=21
Watches & Jewelry
n=49
Beauty n=73
Retail n=72
Fashion n=56
Consumer Electronics
n=27
Activewear n=28
Facebook Messenger Indicated Response Time Within 1 Hour Messenger Bot
AWARENESS ENGAGEMENT CONVERSION RETENTION ADVOCACY
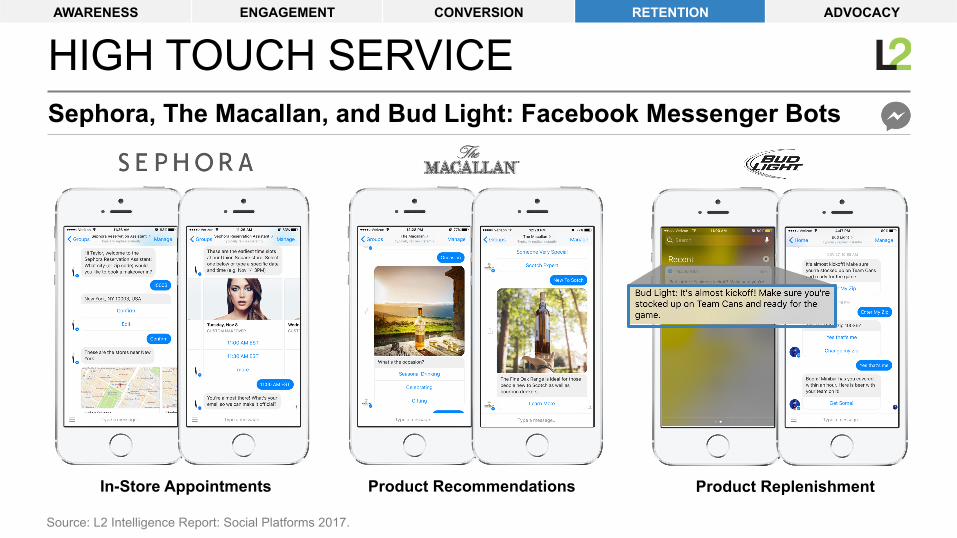
Sephora, The Macallan, and Bud Light: Facebook Messenger Bots
HIGH TOUCH SERVICE
Source: L2 Intelligence Report: Social Platforms 2017.
AWARENESS ENGAGEMENT CONVERSION RETENTION ADVOCACY
Product Recommendations Product Replenishment In-Store Appointments
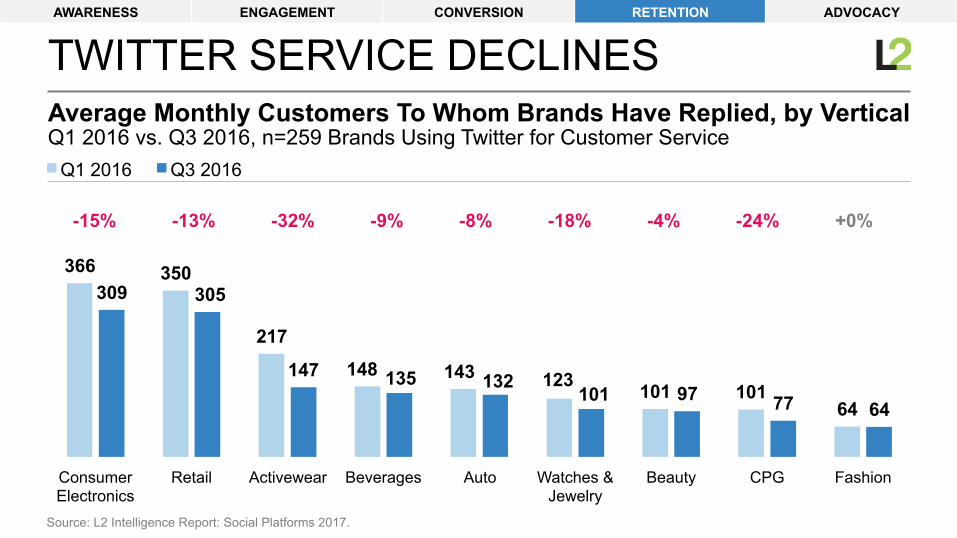
Q1 2016 vs. Q3 2016, n=259 Brands Using Twitter for Customer Service Average Monthly Customers To Whom Brands Have Replied, by Vertical
TWITTER SERVICE DECLINES
Source: L2 Intelligence Report: Social Platforms 2017.
366 350
217
148 143 123 101 101 64
309 305
147 135 132 101 97 77 64
Consumer Electronics
Retail Activewear Beverages Auto Watches & Jewelry
Beauty CPG Fashion
Q1 2016 Q3 2016
-15% -13% -32% -9% -8% -18% -4% -24% +0%
AWARENESS ENGAGEMENT CONVERSION RETENTION ADVOCACY
Advocacy
AWARENESS ENGAGEMENT CONVERSION RETENTION ADVOCACY
WHAT’S MISSING?
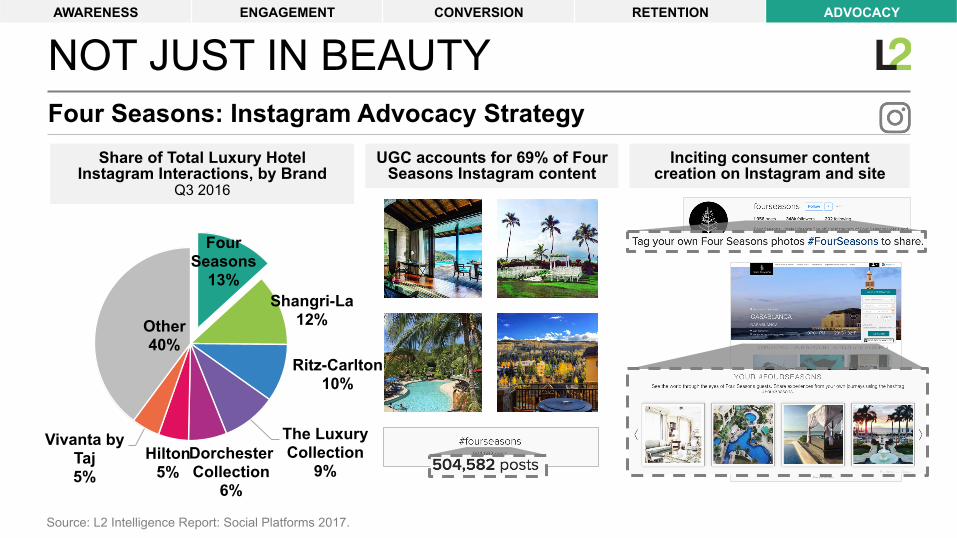
Four Seasons: Instagram Advocacy Strategy
NOT JUST IN BEAUTY
Source: L2 Intelligence Report: Social Platforms 2017.
AWARENESS ENGAGEMENT CONVERSION RETENTION ADVOCACY
Four Seasons
13% Shangri-La
12%
Ritz-Carlton 10%
The Luxury Collection
9% Dorchester Collection
6%
Hilton 5%
Vivanta by Taj 5%
Other 40%
Share of Total Luxury Hotel Instagram Interactions, by Brand
Q3 2016
Inciting consumer content creation on Instagram and site
UGC accounts for 69% of Four Seasons Instagram content

CONCLUSIONS SOCIAL PLATFORMS 2017
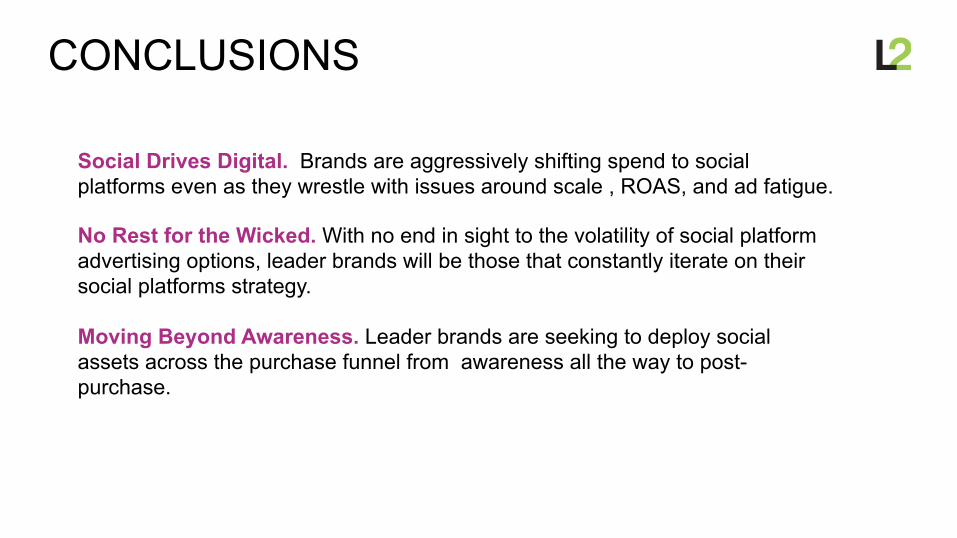
CONCLUSIONS
Social Drives Digital. Brands are aggressively shifting spend to social platforms even as they wrestle with issues around scale , ROAS, and ad fatigue.
No Rest for the Wicked. With no end in sight to the volatility of social platform advertising options, leader brands will be those that constantly iterate on their social platforms strategy.
Moving Beyond Awareness. Leader brands are seeking to deploy social assets across the purchase funnel from awareness all the way to post-purchase.
QUESTIONS? [email protected]
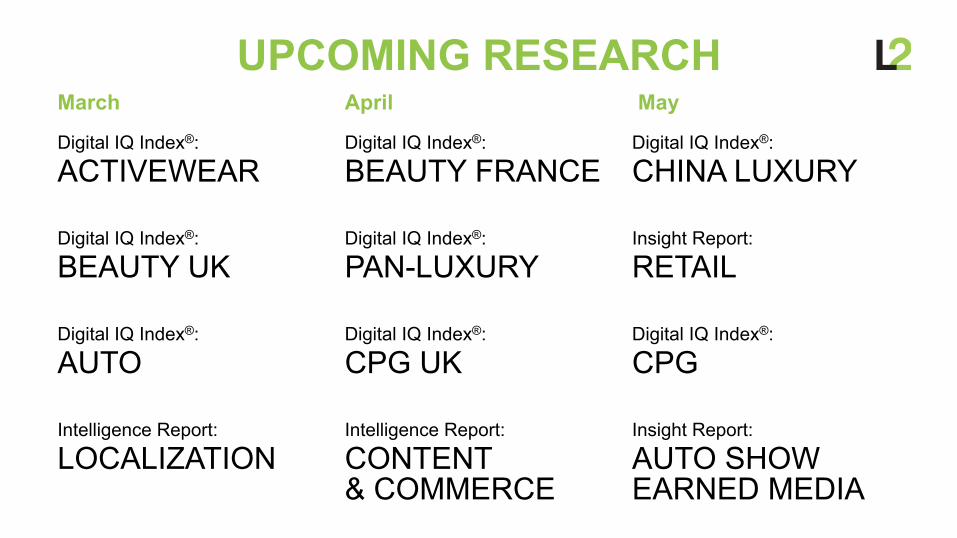
March April May
Digital IQ Index®:
ACTIVEWEAR Digital IQ Index®:
BEAUTY FRANCE Digital IQ Index®:
CHINA LUXURY
Digital IQ Index®:
BEAUTY UK Digital IQ Index®:
PAN-LUXURY Insight Report:
RETAIL
Digital IQ Index®:
AUTO Digital IQ Index®:
CPG UK Digital IQ Index®:
CPG
Intelligence Report:
LOCALIZATION Intelligence Report:
CONTENT & COMMERCE
Insight Report:
AUTO SHOW EARNED MEDIA
UPCOMING RESEARCH
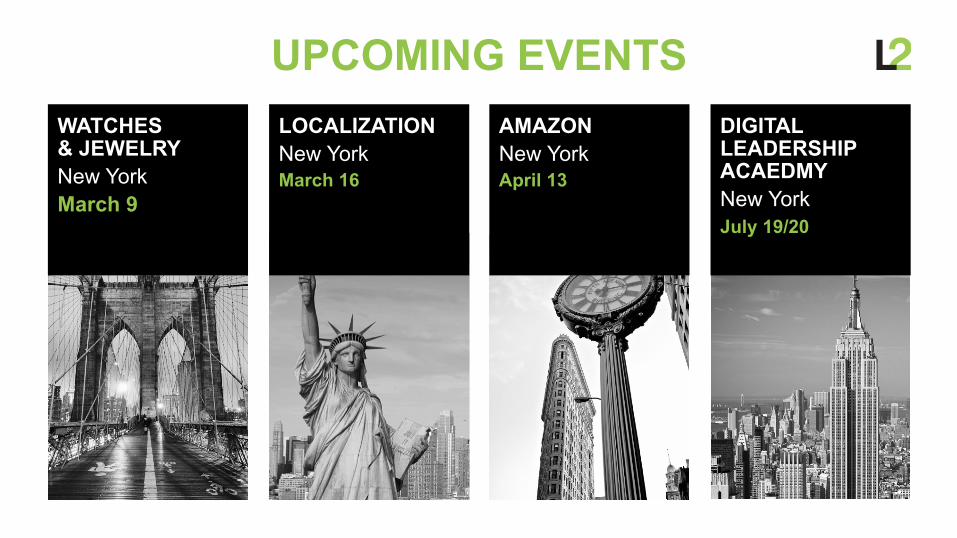
UPCOMING EVENTS WATCHES & JEWELRY New York March 9
LOCALIZATION New York March 16
AMAZON New York April 13
DIGITAL LEADERSHIP ACAEDMY New York July 19/20