Embed Size (px)
Citation preview
MM III - Group Assignment:
Marketing Research for a Work Life Balance Mobile App
Rahul MandloiRituparna MohantySomak GhoshSoumya Ranjan SahooVikrant Verma
UM14337UM14339UM14348UM14351UM14363
Our App - 24
24
I am
People
Perform
Your Pulse
Sync NowInformation
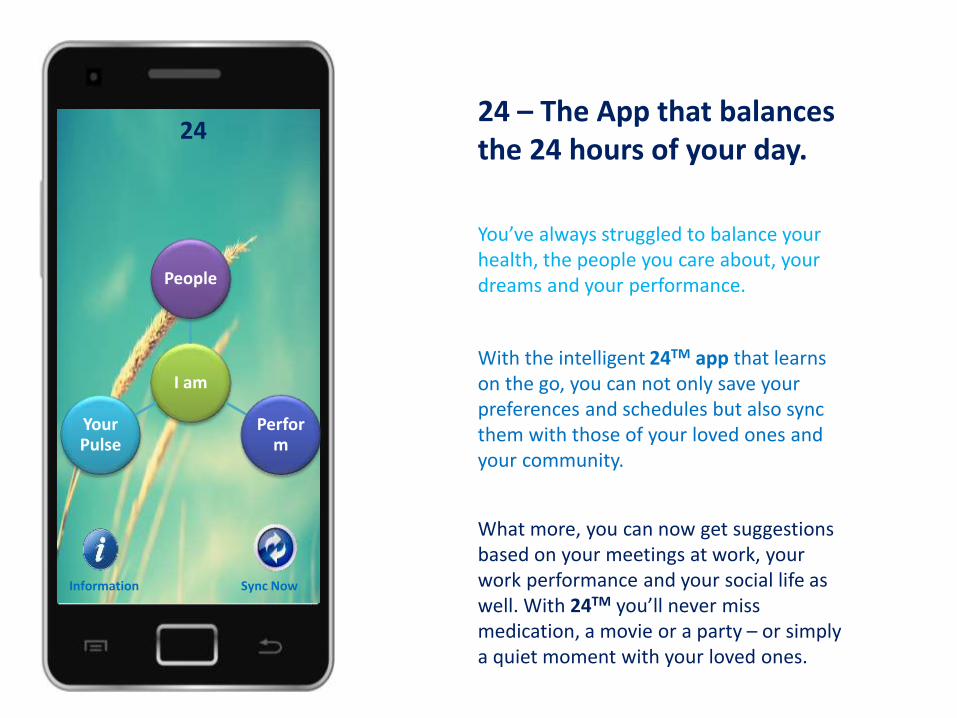
24 – The App that balances the 24 hours of your day.
You’ve always struggled to balance your health, the people you care about, your dreams and your performance.
With the intelligent 24TM app that learns on the go, you can not only save your preferences and schedules but also sync them with those of your loved ones and your community.
What more, you can now get suggestions based on your meetings at work, your work performance and your social life as well. With 24TM you’ll never miss medication, a movie or a party – or simply a quiet moment with your loved ones.
24
Sync Now
Information
24 – The App that balances the 24 hours of your day
Your Pulse
Medicator
Life Plus
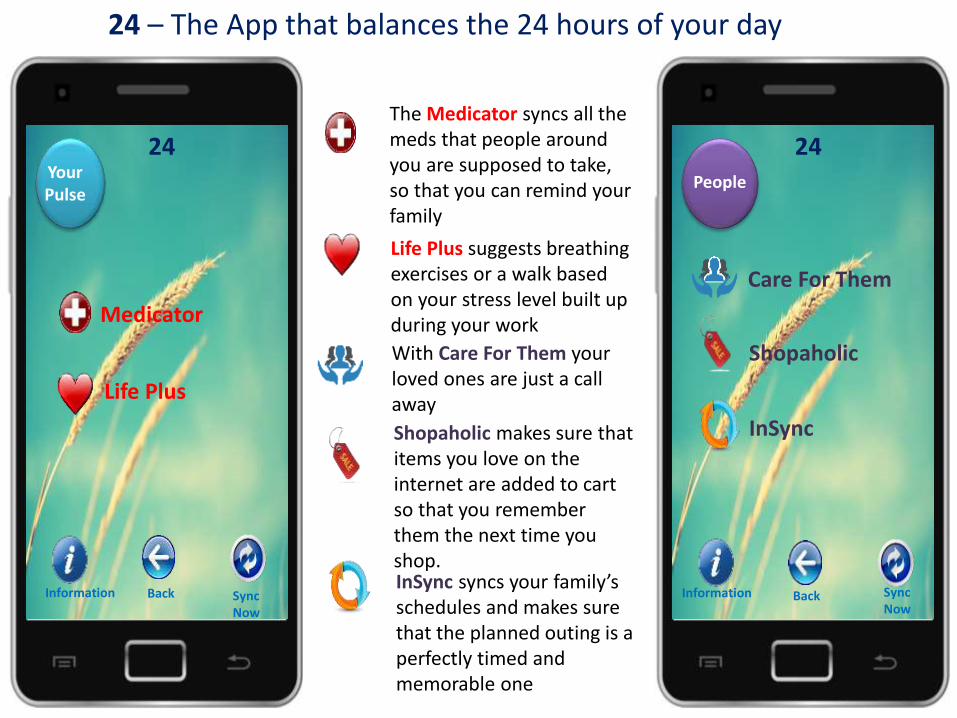
The Medicator syncs all the meds that people around you are supposed to take, so that you can remind your family
Life Plus suggests breathing exercises or a walk based on your stress level built up during your work
Back
24
Sync Now
Information
People
Care For Them
Shopaholic
InSync
Back
With Care For Them your loved ones are just a call away
Shopaholic makes sure that items you love on the internet are added to cart so that you remember them the next time you shop.InSync syncs your family’s schedules and makes sure that the planned outing is a perfectly timed and memorable one
24
Sync Now
Information
24 – The App that balances the 24 hours of your day.
Work Smart
NetworKing
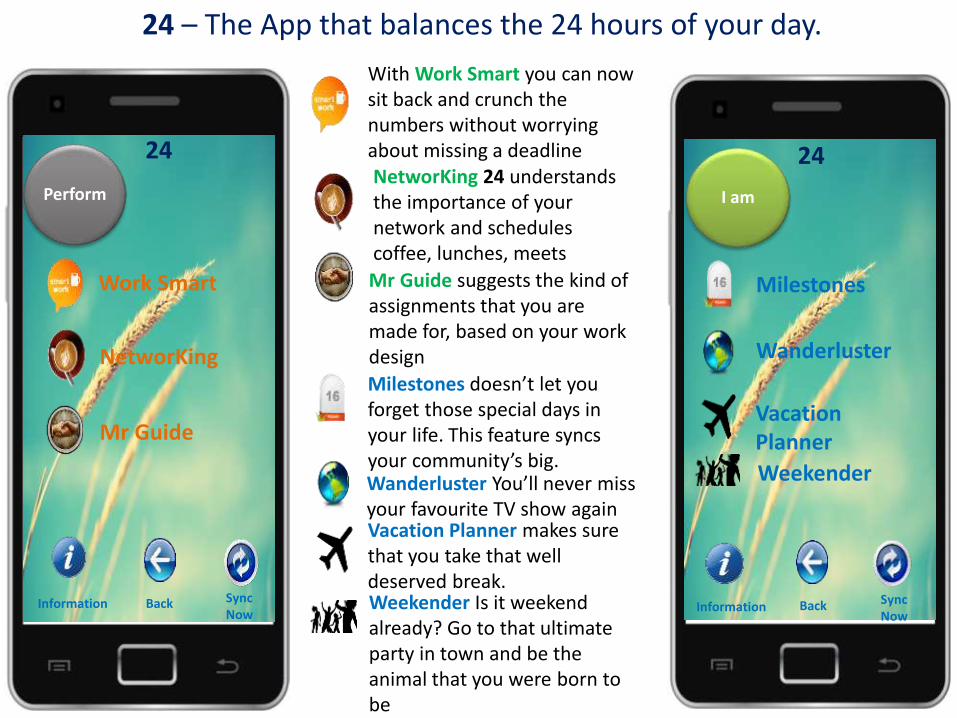
With Work Smart you can now sit back and crunch the numbers without worrying about missing a deadlineNetworKing 24 understands the importance of your network and schedules coffee, lunches, meets
Mr Guide
Mr Guide suggests the kind of assignments that you are made for, based on your work design
Back
Perform
24
Sync Now
Information
Milestones
Vacation Planner
Back
I am
Wanderluster
Weekender
Milestones doesn’t let you forget those special days in your life. This feature syncs your community’s big.Wanderluster You’ll never miss your favourite TV show againVacation Planner makes sure that you take that well deserved break. Weekender Is it weekend already? Go to that ultimate party in town and be the animal that you were born to be
Interface Connectivity PriceCompatibility
with OS
User-friendly Offline FreeAndroid and
Windows
User-friendly Online FreemiumAndroid and
Windows
User-friendly Online Premium Windows-iOS
Highly loaded Offline Freemium Windows-iOS
Highly loadedBoth Online and
Offline PremiumAndroid and
Windows
Highly loaded Online Free iOS-Android
User-friendlyBoth Online and
Offline Freemium iOS-Android
User-friendly Offline Premium iOS-Android
User-friendlyBoth Online and
Offline Free Windows-iOS
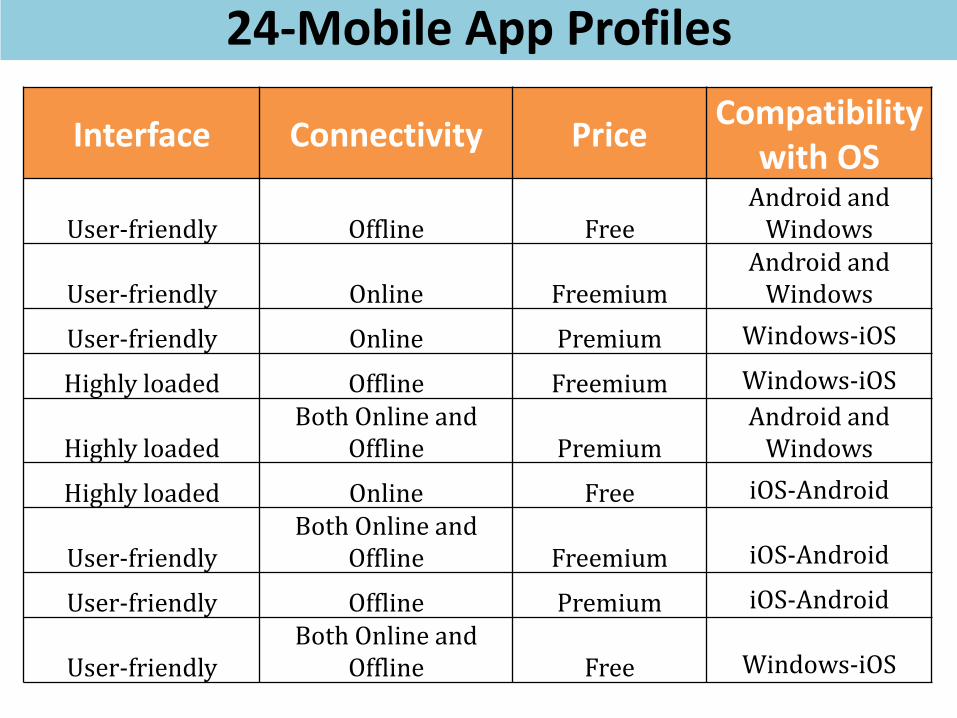
24-Mobile App Profiles
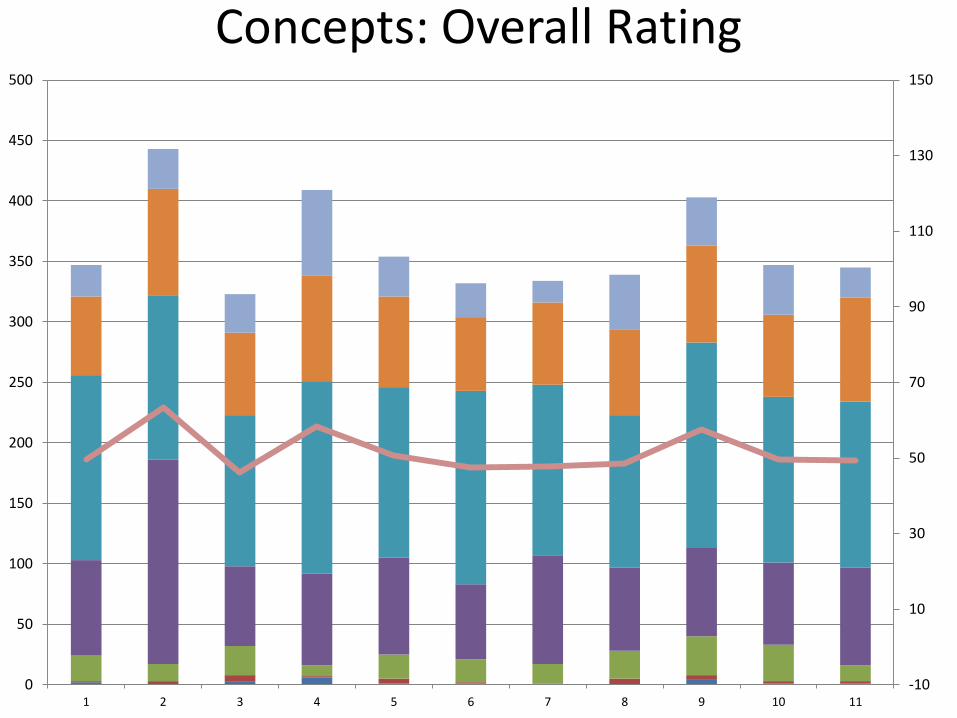
Concepts: Overall Rating
-10
10
30
50
70
90
110
130
150
0
50
100
150
200
250
300
350
400
450
500
1 2 3 4 5 6 7 8 9 10 11
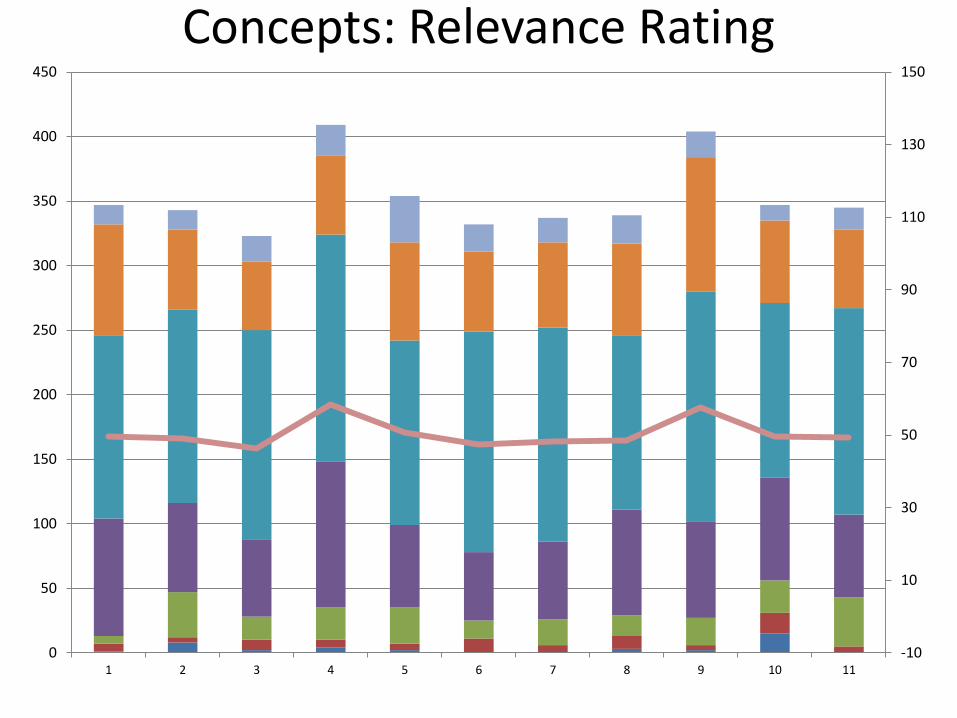
Concepts: Relevance Rating
-10
10
30
50
70
90
110
130
150
0
50
100
150
200
250
300
350
400
450
1 2 3 4 5 6 7 8 9 10 11
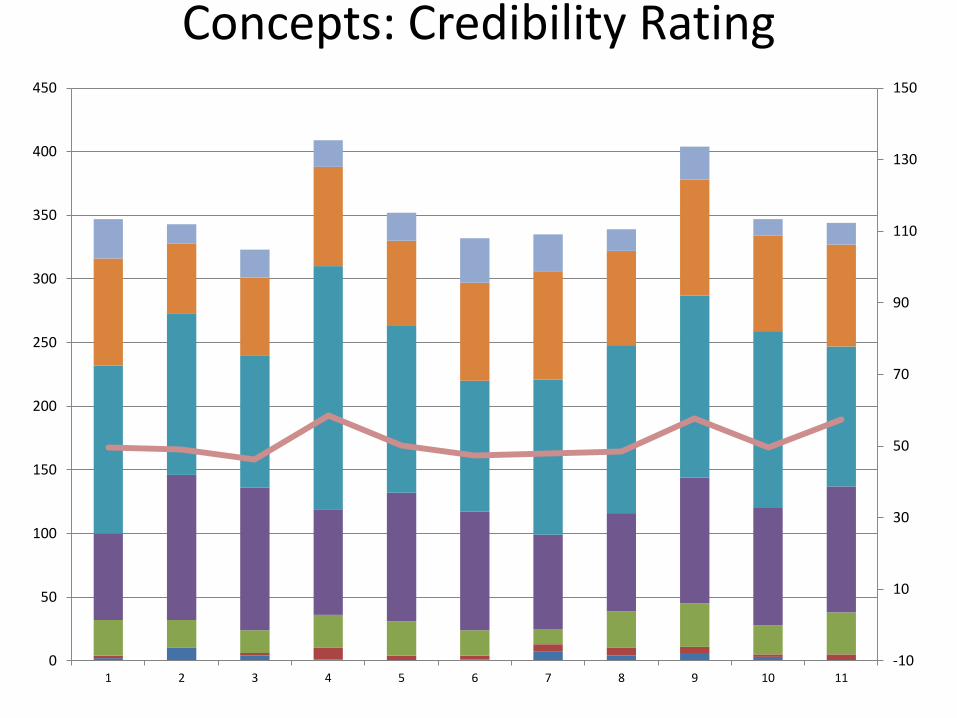
Concepts: Credibility Rating
-10
10
30
50
70
90
110
130
150
0
50
100
150
200
250
300
350
400
450
1 2 3 4 5 6 7 8 9 10 11
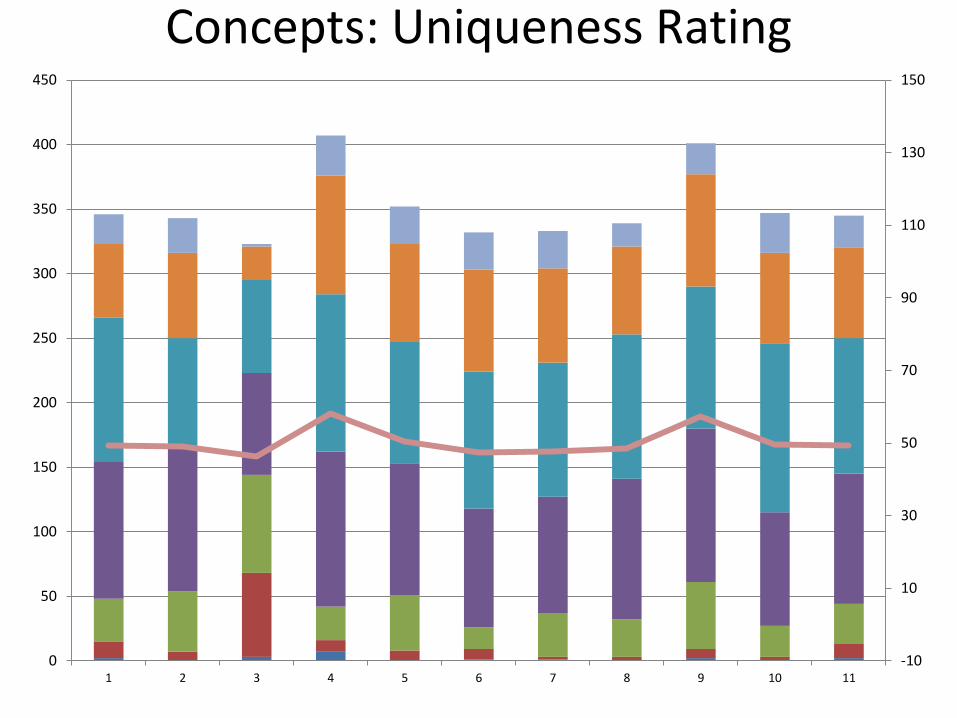
Concepts: Uniqueness Rating
-10
10
30
50
70
90
110
130
150
0
50
100
150
200
250
300
350
400
450
1 2 3 4 5 6 7 8 9 10 11
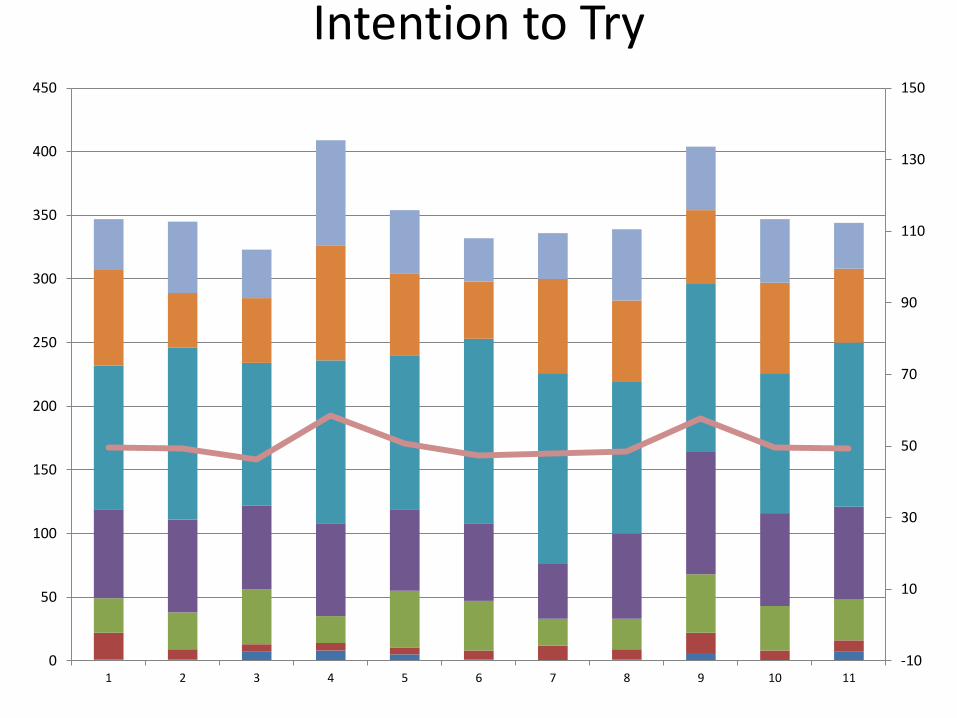
Intention to Try
-10
10
30
50
70
90
110
130
150
0
50
100
150
200
250
300
350
400
450
1 2 3 4 5 6 7 8 9 10 11
Analyses
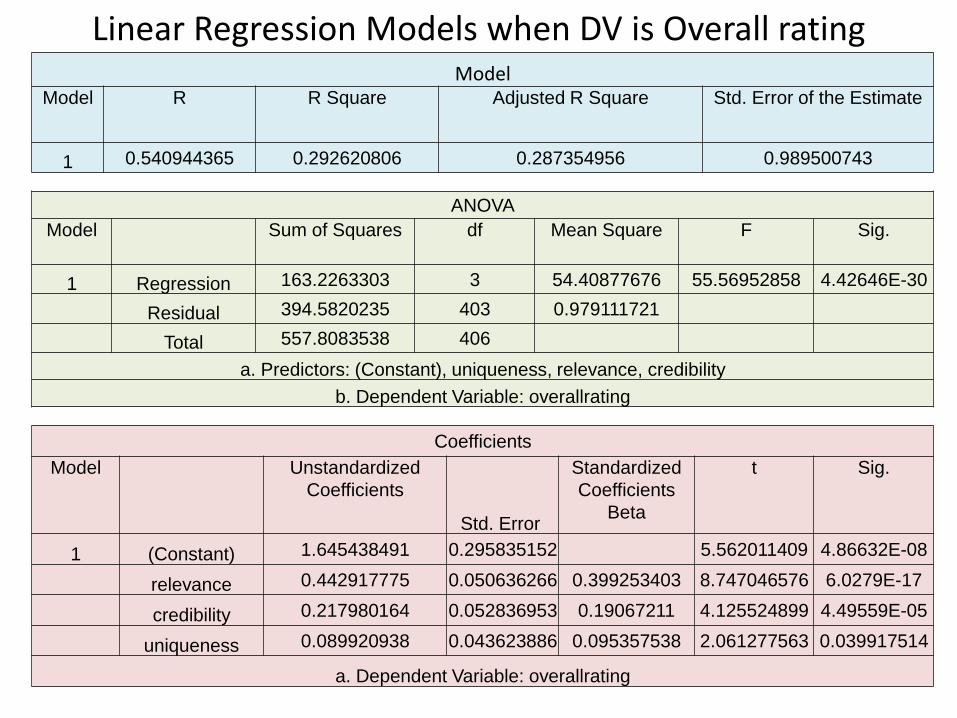
Linear Regression Models when DV is Overall ratingModel
Model R R Square Adjusted R Square Std. Error of the Estimate
1 0.540944365 0.292620806 0.287354956 0.989500743
ANOVA
Model Sum of Squares df Mean Square F Sig.
1 Regression 163.2263303 3 54.40877676 55.56952858 4.42646E-30
Residual 394.5820235 403 0.979111721
Total 557.8083538 406
a. Predictors: (Constant), uniqueness, relevance, credibility
b. Dependent Variable: overallrating
Coefficients
Model Unstandardized
Coefficients
Std. Error
Standardized
Coefficients
Beta
t Sig.
1 (Constant) 1.645438491 0.295835152 5.562011409 4.86632E-08
relevance 0.442917775 0.050636266 0.399253403 8.747046576 6.0279E-17
credibility 0.217980164 0.052836953 0.19067211 4.125524899 4.49559E-05
uniqueness 0.089920938 0.043623886 0.095357538 2.061277563 0.039917514
a. Dependent Variable: overallrating
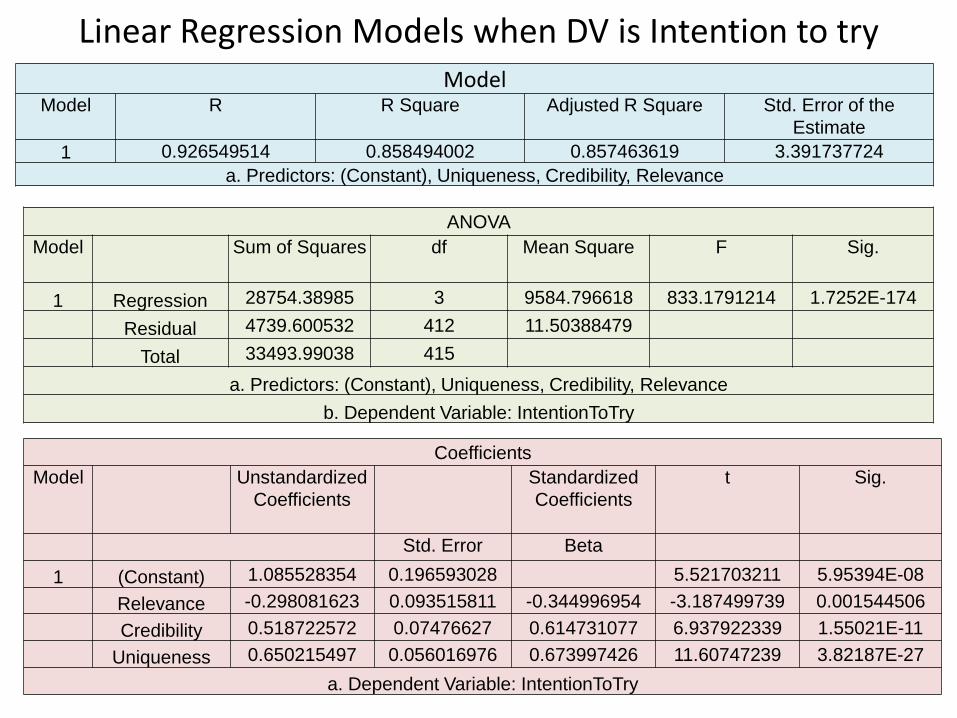
Linear Regression Models when DV is Intention to tryModel
Model R R Square Adjusted R Square Std. Error of the
Estimate
1 0.926549514 0.858494002 0.857463619 3.391737724
a. Predictors: (Constant), Uniqueness, Credibility, Relevance
ANOVA
Model Sum of Squares df Mean Square F Sig.
1 Regression 28754.38985 3 9584.796618 833.1791214 1.7252E-174
Residual 4739.600532 412 11.50388479
Total 33493.99038 415
a. Predictors: (Constant), Uniqueness, Credibility, Relevance
b. Dependent Variable: IntentionToTry
Coefficients
Model Unstandardized
Coefficients
Standardized
Coefficients
t Sig.
Std. Error Beta
1 (Constant) 1.085528354 0.196593028 5.521703211 5.95394E-08
Relevance -0.298081623 0.093515811 -0.344996954 -3.187499739 0.001544506
Credibility 0.518722572 0.07476627 0.614731077 6.937922339 1.55021E-11
Uniqueness 0.650215497 0.056016976 0.673997426 11.60747239 3.82187E-27
a. Dependent Variable: IntentionToTry
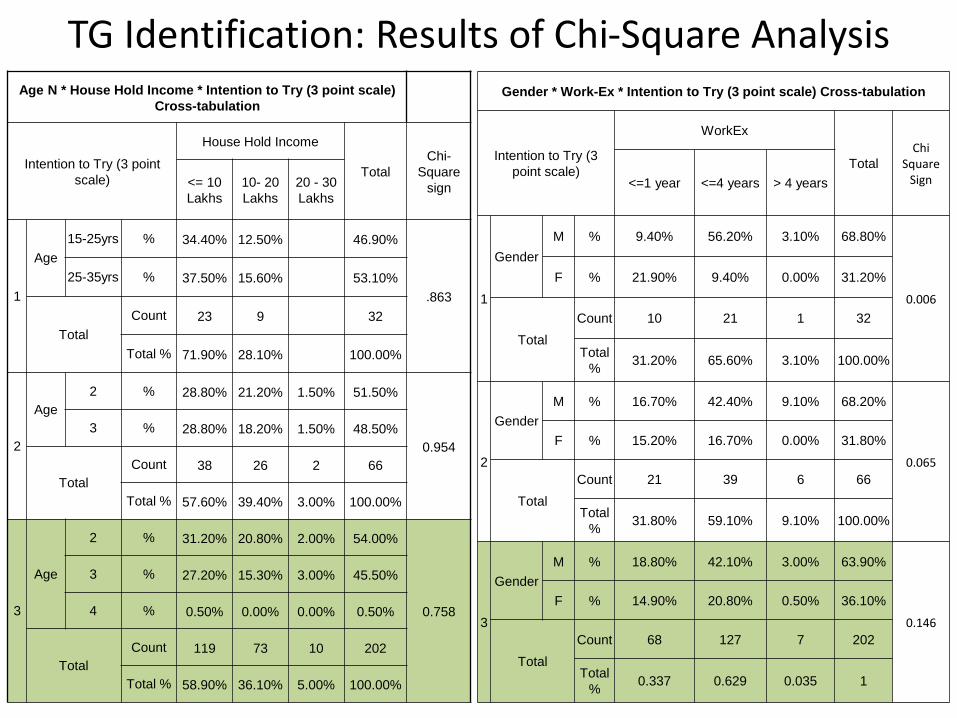
TG Identification: Results of Chi-Square AnalysisAge N * House Hold Income * Intention to Try (3 point scale)
Cross-tabulation
Intention to Try (3 point
scale)
House Hold Income
Total
Chi-
Square
sign<= 10
Lakhs
10- 20
Lakhs
20 - 30
Lakhs
1
Age
15-25yrs % 34.40% 12.50% 46.90%
.863
25-35yrs % 37.50% 15.60% 53.10%
Total
Count 23 9 32
Total % 71.90% 28.10% 100.00%
2
Age
2 % 28.80% 21.20% 1.50% 51.50%
0.954
3 % 28.80% 18.20% 1.50% 48.50%
Total
Count 38 26 2 66
Total % 57.60% 39.40% 3.00% 100.00%
3
Age
2 % 31.20% 20.80% 2.00% 54.00%
0.758
3 % 27.20% 15.30% 3.00% 45.50%
4 % 0.50% 0.00% 0.00% 0.50%
Total
Count 119 73 10 202
Total % 58.90% 36.10% 5.00% 100.00%
Gender * Work-Ex * Intention to Try (3 point scale) Cross-tabulation
Intention to Try (3
point scale)
WorkEx
Total
Chi Square
Sign<=1 year <=4 years > 4 years
1
Gender
M % 9.40% 56.20% 3.10% 68.80%
0.006
F % 21.90% 9.40% 0.00% 31.20%
Total
Count 10 21 1 32
Total
%31.20% 65.60% 3.10% 100.00%
2
Gender
M % 16.70% 42.40% 9.10% 68.20%
0.065
F % 15.20% 16.70% 0.00% 31.80%
Total
Count 21 39 6 66
Total
%31.80% 59.10% 9.10% 100.00%
3
Gender
M % 18.80% 42.10% 3.00% 63.90%
0.146
F % 14.90% 20.80% 0.50% 36.10%
Total
Count 68 127 7 202
Total
%0.337 0.629 0.035 1
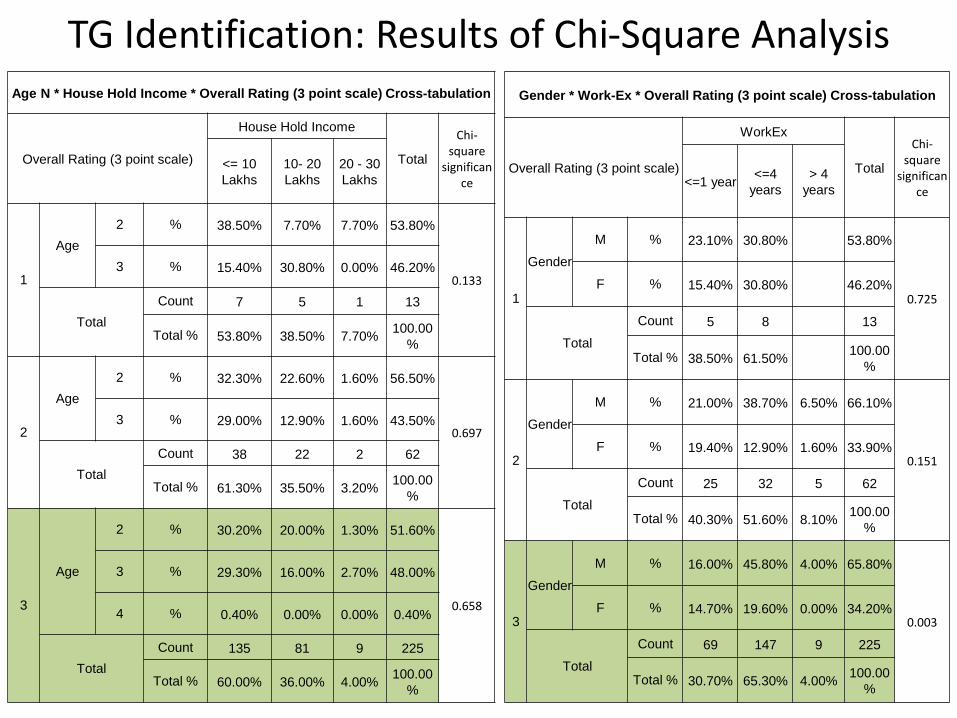
TG Identification: Results of Chi-Square AnalysisAge N * House Hold Income * Overall Rating (3 point scale) Cross-tabulation
Overall Rating (3 point scale)
House Hold Income
Total
Chi-square
significance
<= 10
Lakhs
10- 20
Lakhs
20 - 30
Lakhs
1
Age
2 % 38.50% 7.70% 7.70% 53.80%
0.1333 % 15.40% 30.80% 0.00% 46.20%
Total
Count 7 5 1 13
Total % 53.80% 38.50% 7.70%100.00
%
2
Age
2 % 32.30% 22.60% 1.60% 56.50%
0.6973 % 29.00% 12.90% 1.60% 43.50%
Total
Count 38 22 2 62
Total % 61.30% 35.50% 3.20%100.00
%
3
Age
2 % 30.20% 20.00% 1.30% 51.60%
0.658
3 % 29.30% 16.00% 2.70% 48.00%
4 % 0.40% 0.00% 0.00% 0.40%
Total
Count 135 81 9 225
Total % 60.00% 36.00% 4.00%100.00
%
Gender * Work-Ex * Overall Rating (3 point scale) Cross-tabulation
Overall Rating (3 point scale)
WorkEx
Total
Chi-square
significance
<=1 year<=4
years
> 4
years
1
Gender
M % 23.10% 30.80% 53.80%
0.725F % 15.40% 30.80% 46.20%
Total
Count 5 8 13
Total % 38.50% 61.50%100.00
%
2
Gender
M % 21.00% 38.70% 6.50% 66.10%
0.151F % 19.40% 12.90% 1.60% 33.90%
Total
Count 25 32 5 62
Total % 40.30% 51.60% 8.10%100.00
%
3
Gender
M % 16.00% 45.80% 4.00% 65.80%
0.003F % 14.70% 19.60% 0.00% 34.20%
Total
Count 69 147 9 225
Total % 30.70% 65.30% 4.00%100.00
%
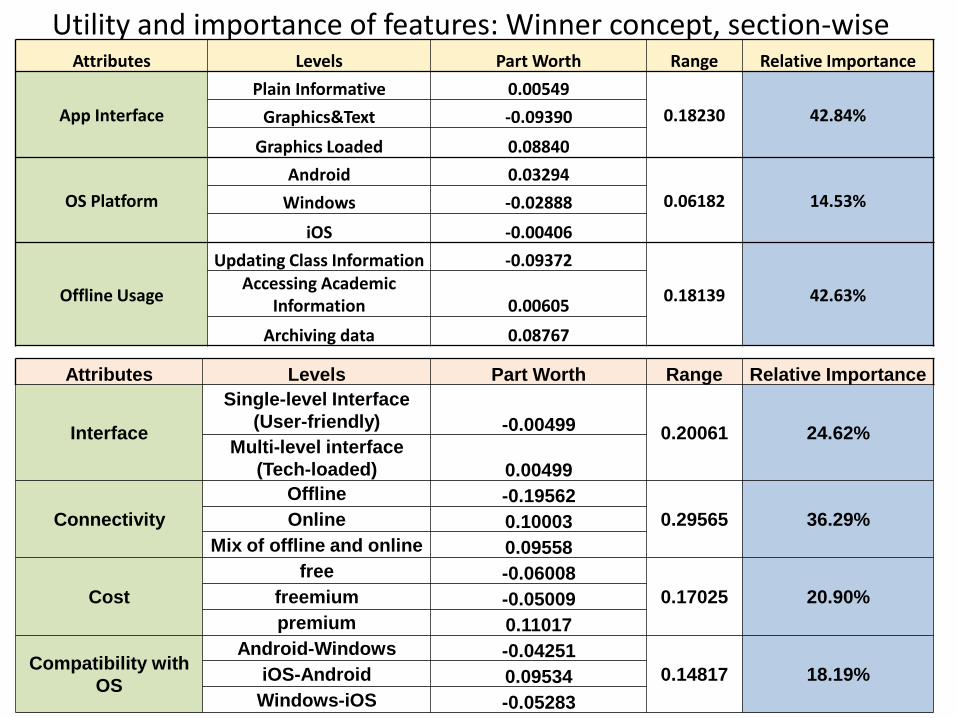
Utility and importance of features: Winner concept, section-wiseAttributes Levels Part Worth Range Relative Importance
App Interface
Plain Informative 0.00549
0.18230 42.84%Graphics&Text -0.09390
Graphics Loaded 0.08840
OS Platform
Android 0.03294
0.06182 14.53%Windows -0.02888
iOS -0.00406
Offline Usage
Updating Class Information -0.09372
0.18139 42.63%Accessing Academic
Information 0.00605
Archiving data 0.08767
Attributes Levels Part Worth Range Relative Importance
Interface
Single-level Interface
(User-friendly) -0.00499 0.20061 24.62%Multi-level interface
(Tech-loaded) 0.00499
Connectivity
Offline -0.19562
0.29565 36.29%Online 0.10003
Mix of offline and online 0.09558
Cost
free -0.06008
0.17025 20.90%freemium -0.05009
premium 0.11017
Compatibility with
OS
Android-Windows -0.04251
0.14817 18.19%iOS-Android 0.09534
Windows-iOS -0.05283
Attitudinal Segmentation
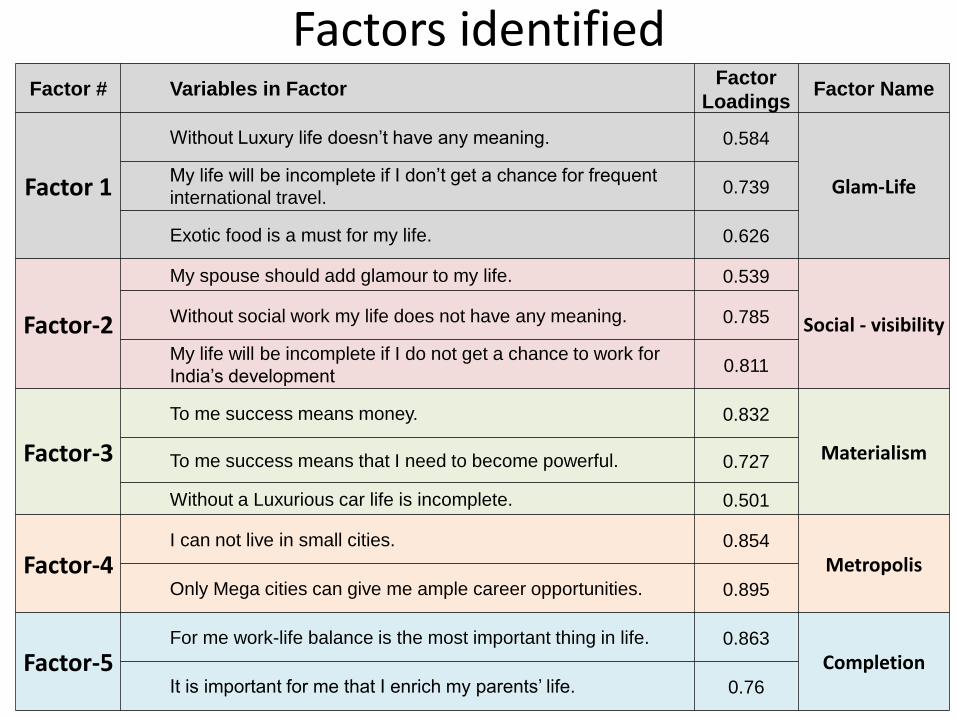
Factors identifiedFactor # Variables in Factor
Factor
LoadingsFactor Name
Factor 1
Without Luxury life doesn’t have any meaning. 0.584
Glam-LifeMy life will be incomplete if I don’t get a chance for frequent
international travel.0.739
Exotic food is a must for my life. 0.626
Factor-2
My spouse should add glamour to my life. 0.539
Social - visibilityWithout social work my life does not have any meaning. 0.785
My life will be incomplete if I do not get a chance to work for
India’s development0.811
Factor-3
To me success means money. 0.832
MaterialismTo me success means that I need to become powerful. 0.727
Without a Luxurious car life is incomplete. 0.501
Factor-4I can not live in small cities. 0.854
MetropolisOnly Mega cities can give me ample career opportunities. 0.895
Factor-5For me work-life balance is the most important thing in life. 0.863
CompletionIt is important for me that I enrich my parents’ life. 0.76
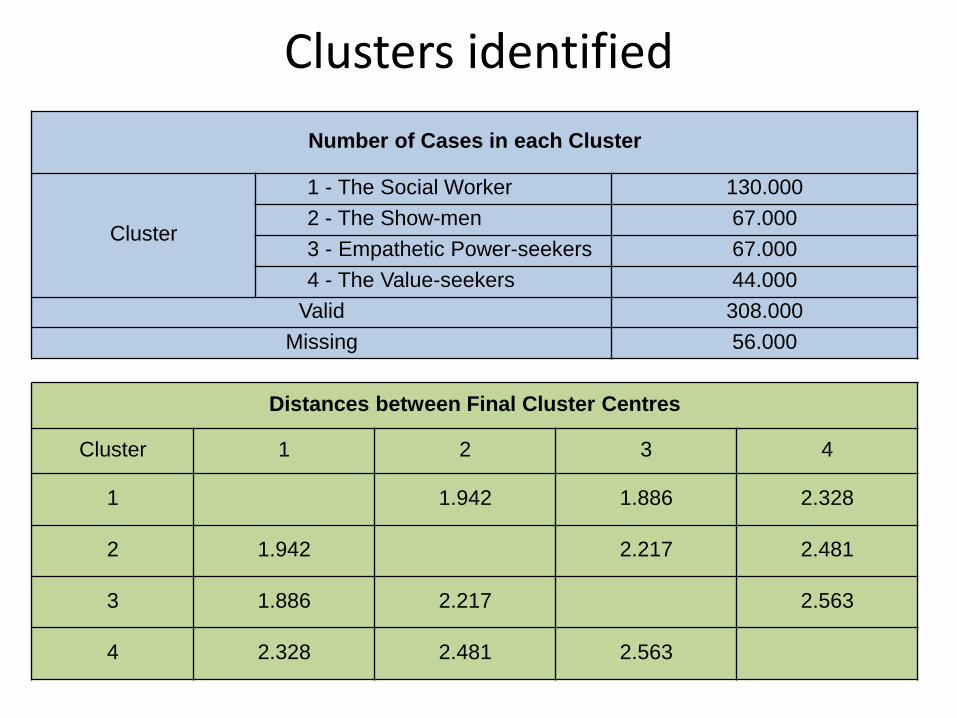
Clusters identified
Distances between Final Cluster Centres
Cluster 1 2 3 4
1 1.942 1.886 2.328
2 1.942 2.217 2.481
3 1.886 2.217 2.563
4 2.328 2.481 2.563
Number of Cases in each Cluster
Cluster
1 - The Social Worker 130.000
2 - The Show-men 67.000
3 - Empathetic Power-seekers 67.000
4 - The Value-seekers 44.000
Valid 308.000
Missing 56.000
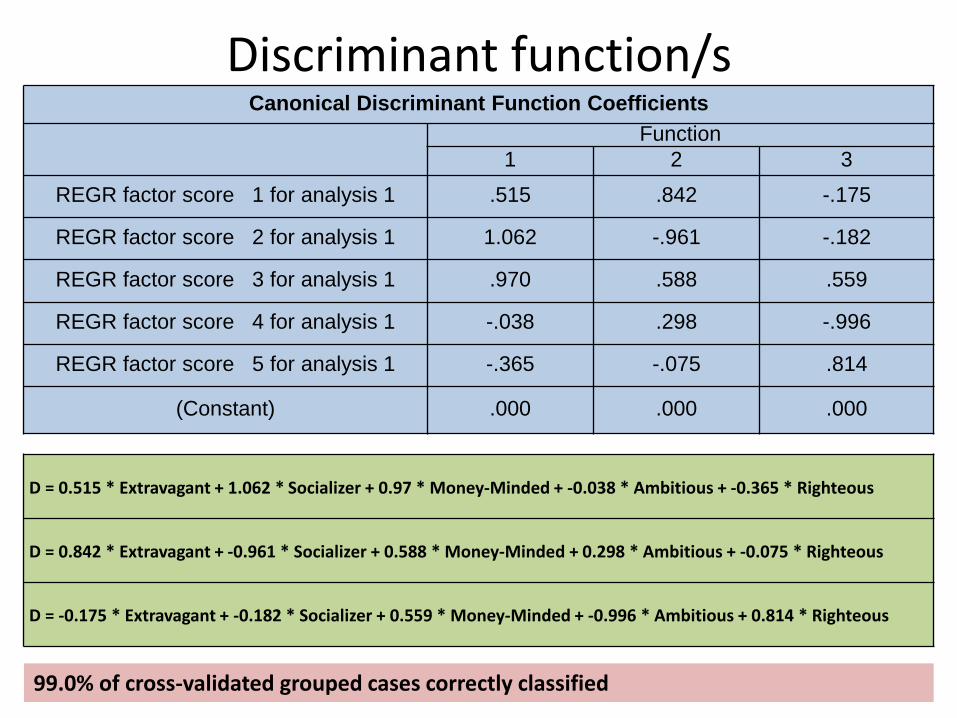
Discriminant function/sCanonical Discriminant Function Coefficients
Function
1 2 3
REGR factor score 1 for analysis 1 .515 .842 -.175
REGR factor score 2 for analysis 1 1.062 -.961 -.182
REGR factor score 3 for analysis 1 .970 .588 .559
REGR factor score 4 for analysis 1 -.038 .298 -.996
REGR factor score 5 for analysis 1 -.365 -.075 .814
(Constant) .000 .000 .000
D = 0.515 * Extravagant + 1.062 * Socializer + 0.97 * Money-Minded + -0.038 * Ambitious + -0.365 * Righteous
D = 0.842 * Extravagant + -0.961 * Socializer + 0.588 * Money-Minded + 0.298 * Ambitious + -0.075 * Righteous
D = -0.175 * Extravagant + -0.182 * Socializer + 0.559 * Money-Minded + -0.996 * Ambitious + 0.814 * Righteous
99.0% of cross-validated grouped cases correctly classified
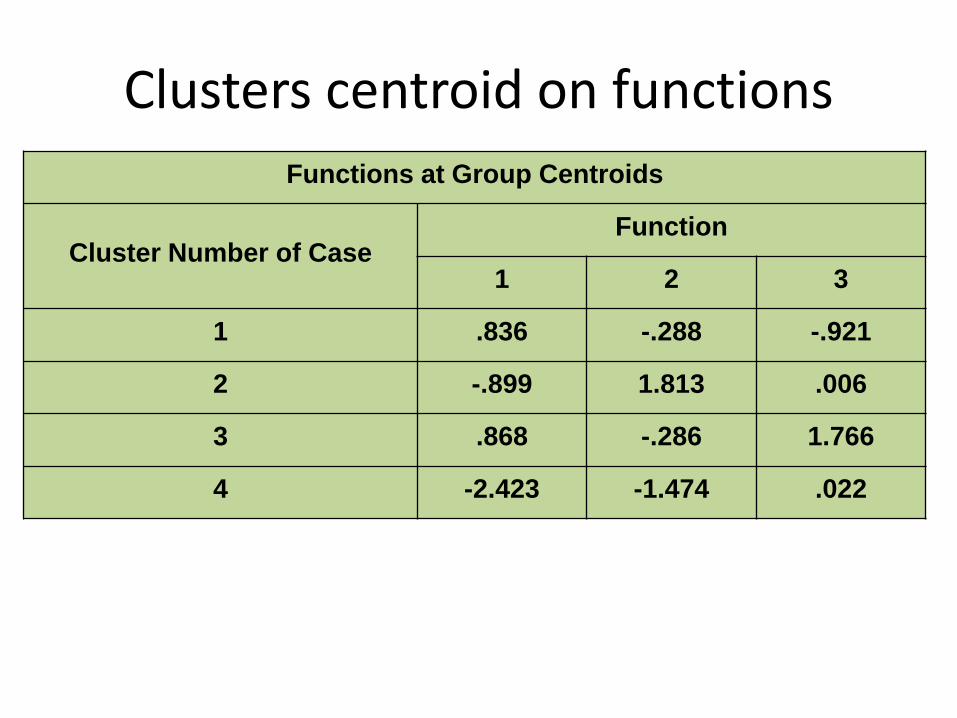
Clusters centroid on functions
Functions at Group Centroids
Cluster Number of CaseFunction
1 2 3
1 .836 -.288 -.921
2 -.899 1.813 .006
3 .868 -.286 1.766
4 -2.423 -1.474 .022
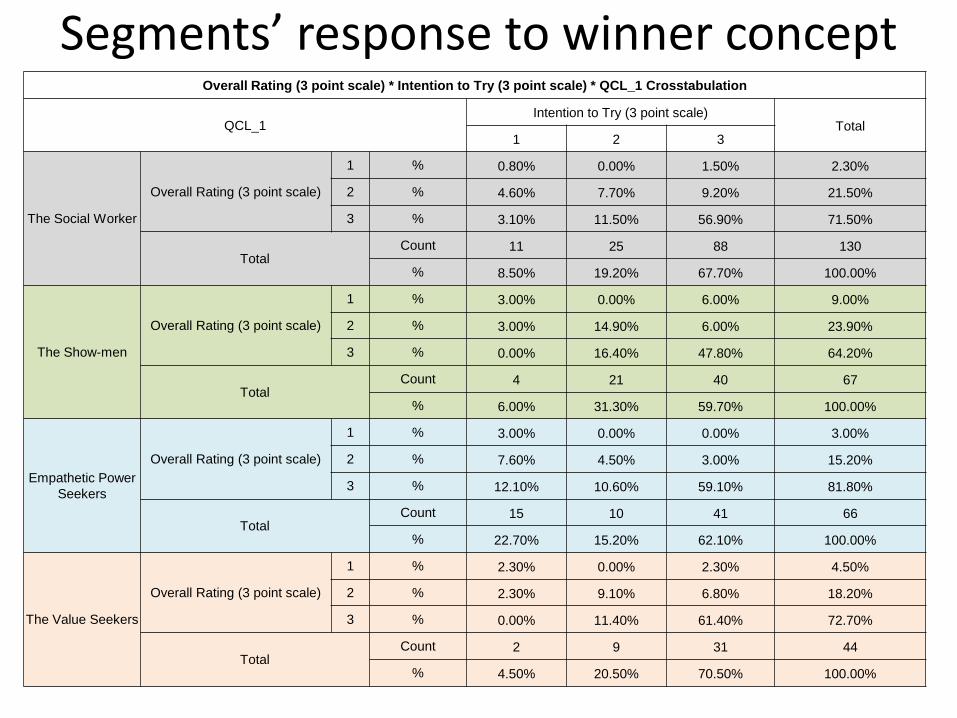
Segments’ response to winner conceptOverall Rating (3 point scale) * Intention to Try (3 point scale) * QCL_1 Crosstabulation
QCL_1Intention to Try (3 point scale)
Total1 2 3
The Social Worker
Overall Rating (3 point scale)
1 % 0.80% 0.00% 1.50% 2.30%
2 % 4.60% 7.70% 9.20% 21.50%
3 % 3.10% 11.50% 56.90% 71.50%
TotalCount 11 25 88 130
% 8.50% 19.20% 67.70% 100.00%
The Show-men
Overall Rating (3 point scale)
1 % 3.00% 0.00% 6.00% 9.00%
2 % 3.00% 14.90% 6.00% 23.90%
3 % 0.00% 16.40% 47.80% 64.20%
TotalCount 4 21 40 67
% 6.00% 31.30% 59.70% 100.00%
Empathetic Power
Seekers
Overall Rating (3 point scale)
1 % 3.00% 0.00% 0.00% 3.00%
2 % 7.60% 4.50% 3.00% 15.20%
3 % 12.10% 10.60% 59.10% 81.80%
TotalCount 15 10 41 66
% 22.70% 15.20% 62.10% 100.00%
The Value Seekers
Overall Rating (3 point scale)
1 % 2.30% 0.00% 2.30% 4.50%
2 % 2.30% 9.10% 6.80% 18.20%
3 % 0.00% 11.40% 61.40% 72.70%
TotalCount 2 9 31 44
% 4.50% 20.50% 70.50% 100.00%
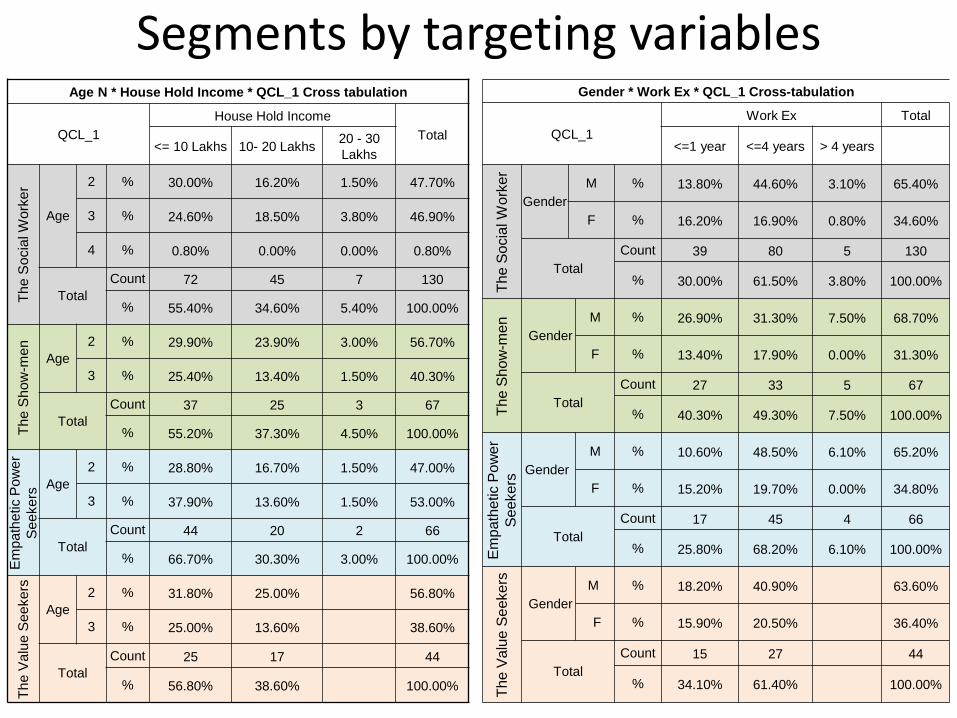
Segments by targeting variables Gender * Work Ex * QCL_1 Cross-tabulation
QCL_1
Work Ex Total
<=1 year <=4 years > 4 years
The S
ocia
l W
ork
er
Gender
M % 13.80% 44.60% 3.10% 65.40%
F % 16.20% 16.90% 0.80% 34.60%
Total
Count 39 80 5 130
% 30.00% 61.50% 3.80% 100.00%
The S
how
-men
Gender
M % 26.90% 31.30% 7.50% 68.70%
F % 13.40% 17.90% 0.00% 31.30%
Total
Count 27 33 5 67
% 40.30% 49.30% 7.50% 100.00%
Em
path
etic P
ow
er
Seekers
Gender
M % 10.60% 48.50% 6.10% 65.20%
F % 15.20% 19.70% 0.00% 34.80%
Total
Count 17 45 4 66
% 25.80% 68.20% 6.10% 100.00%
The V
alu
eS
eekers
Gender
M % 18.20% 40.90% 63.60%
F % 15.90% 20.50% 36.40%
Total
Count 15 27 44
% 34.10% 61.40% 100.00%
Age N * House Hold Income * QCL_1 Cross tabulation
QCL_1
House Hold Income
Total<= 10 Lakhs 10- 20 Lakhs
20 - 30
Lakhs
Th
e S
ocia
l W
ork
er
Age
2 % 30.00% 16.20% 1.50% 47.70%
3 % 24.60% 18.50% 3.80% 46.90%
4 % 0.80% 0.00% 0.00% 0.80%
Total
Count 72 45 7 130
% 55.40% 34.60% 5.40% 100.00%
Th
e S
ho
w-m
en
Age
2 % 29.90% 23.90% 3.00% 56.70%
3 % 25.40% 13.40% 1.50% 40.30%
Total
Count 37 25 3 67
% 55.20% 37.30% 4.50% 100.00%
Em
pa
the
tic
Po
we
r
Se
eke
rs
Age
2 % 28.80% 16.70% 1.50% 47.00%
3 % 37.90% 13.60% 1.50% 53.00%
Total
Count 44 20 2 66
% 66.70% 30.30% 3.00% 100.00%
Th
e V
alu
e S
ee
ke
rs
Age
2 % 31.80% 25.00% 56.80%
3 % 25.00% 13.60% 38.60%
Total
Count 25 17 44
% 56.80% 38.60% 100.00%
Marketing Strategy- STP
We have used two forms of segmentation data – demographic segmentationand attitudinal segmentation to converge on our target groups.
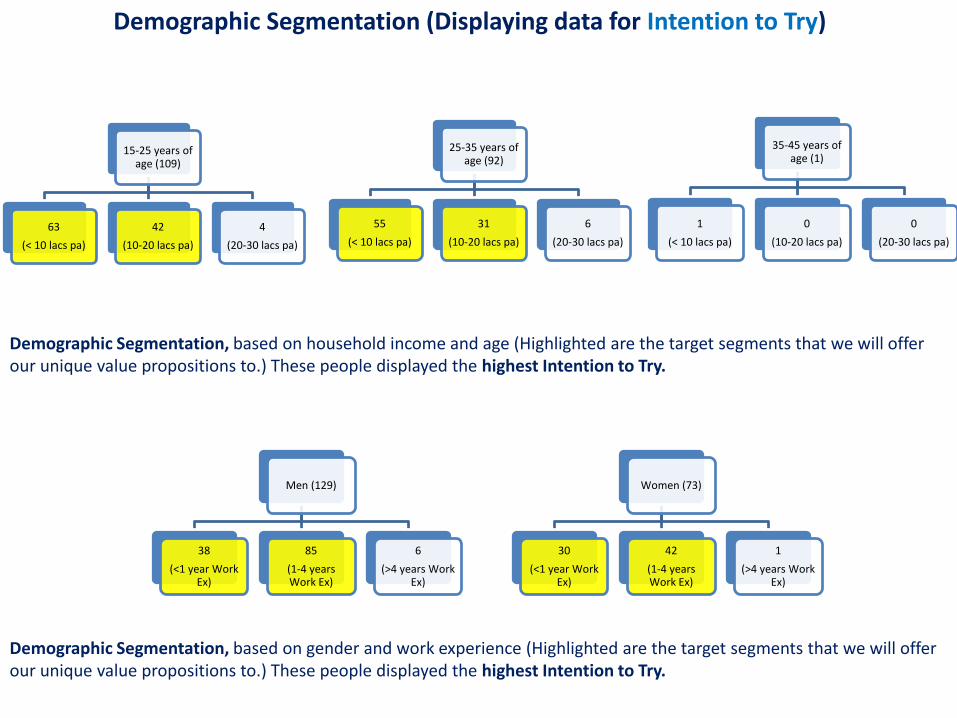
We deal with Demographic Segmentation to get a rudimentary picture of the careers and lifestyles of people (based on the age groups) – this will help us identify what is the mentality of people that are ready to try the app and/or have rated the app highly. We have also segmented on the basis of gender – we get a clear of the stress levels at the workplace of men and women – based on the two afore mentioned criteria, thus telling us again, which groups are we going to target and how do we position our product.
Demographic Segmentation
15-25 years of age (109)
63
(< 10 lacs pa)
42
(10-20 lacs pa)
4
(20-30 lacs pa)
25-35 years of age (92)
55
(< 10 lacs pa)
31
(10-20 lacs pa)
6
(20-30 lacs pa)
35-45 years of age (1)
1
(< 10 lacs pa)
0
(10-20 lacs pa)
0
(20-30 lacs pa)
Demographic Segmentation (Displaying data for Intention to Try)
Demographic Segmentation, based on household income and age (Highlighted are the target segments that we will offer our unique value propositions to.) These people displayed the highest Intention to Try.
Men (129)
38
(<1 year Work Ex)
85
(1-4 years Work Ex)
6
(>4 years Work Ex)
Women (73)
30
(<1 year Work Ex)
42
(1-4 years Work Ex)
1
(>4 years Work Ex)
Demographic Segmentation, based on gender and work experience (Highlighted are the target segments that we will offer our unique value propositions to.) These people displayed the highest Intention to Try.
15-25 years of age (116)
68
(< 10 lacs pa)
45
(10-20 lacs pa)
3
(20-30 lacs pa)
25-35 years of age (92)
66
(< 10 lacs pa)
36
(10-20 lacs pa)
6
(20-30 lacs pa)
35-45 years of age (1)
1
(< 10 lacs pa)
0
(10-20 lacs pa)
0
(20-30 lacs pa)
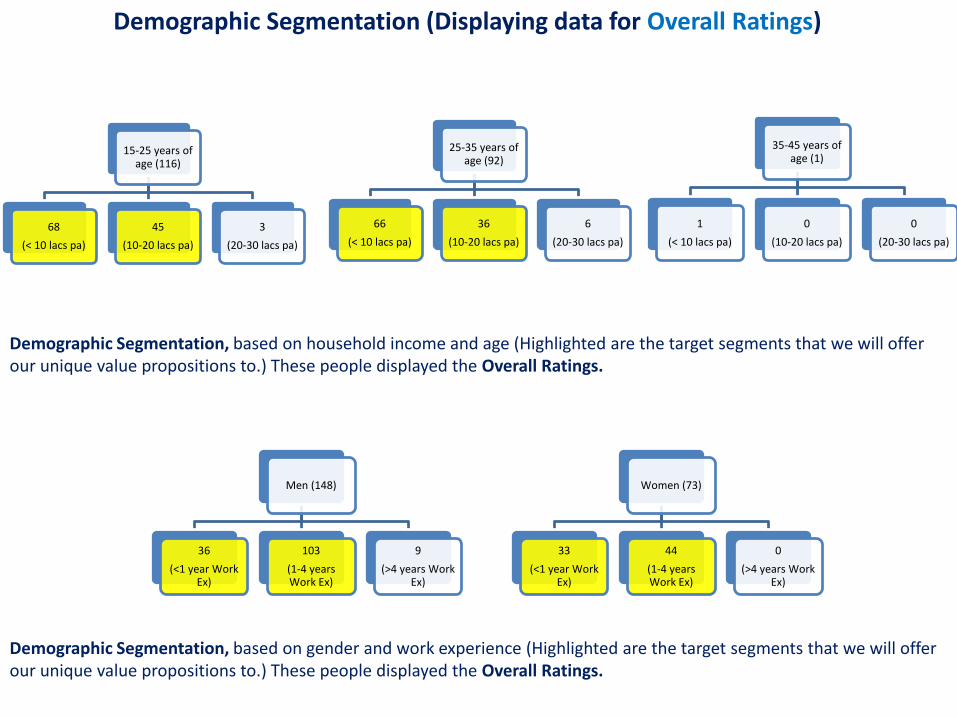
Demographic Segmentation (Displaying data for Overall Ratings)
Demographic Segmentation, based on household income and age (Highlighted are the target segments that we will offer our unique value propositions to.) These people displayed the Overall Ratings.
Men (148)
36
(<1 year Work Ex)
103
(1-4 years Work Ex)
9
(>4 years Work Ex)
Women (73)
33
(<1 year Work Ex)
44
(1-4 years Work Ex)
0
(>4 years Work Ex)
Demographic Segmentation, based on gender and work experience (Highlighted are the target segments that we will offer our unique value propositions to.) These people displayed the Overall Ratings.
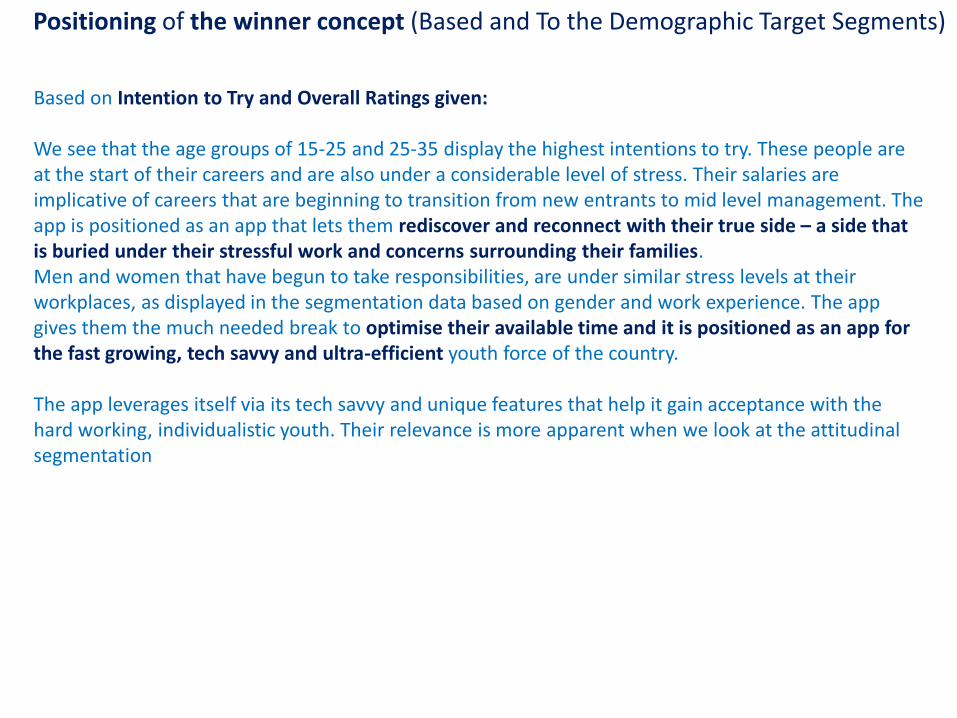
Positioning of the winner concept (Based and To the Demographic Target Segments)
Based on Intention to Try and Overall Ratings given:
We see that the age groups of 15-25 and 25-35 display the highest intentions to try. These people are at the start of their careers and are also under a considerable level of stress. Their salaries are implicative of careers that are beginning to transition from new entrants to mid level management. The app is positioned as an app that lets them rediscover and reconnect with their true side – a side that is buried under their stressful work and concerns surrounding their families.Men and women that have begun to take responsibilities, are under similar stress levels at their workplaces, as displayed in the segmentation data based on gender and work experience. The appgives them the much needed break to optimise their available time and it is positioned as an app for the fast growing, tech savvy and ultra-efficient youth force of the country.
The app leverages itself via its tech savvy and unique features that help it gain acceptance with the hard working, individualistic youth. Their relevance is more apparent when we look at the attitudinal segmentation
Attitudinal Segmentation is a critical aspect of the Marketing Strategy.Through the questionnaire, we capture the underlying attitudinal orientations of people and this is a more direct indicator of their preference for the app (and its features.)
The positioning that we will attempt here will be more direct and relevant to the attitudinal orientations of people.
This level of segmentation gives us a clear picture of the needs, wants and desires of people, how they project themselves in the world – and subsequently we try and bring a degree of coherence between the features of the product designed and the preferences of people.
Attitudinal Segmentation
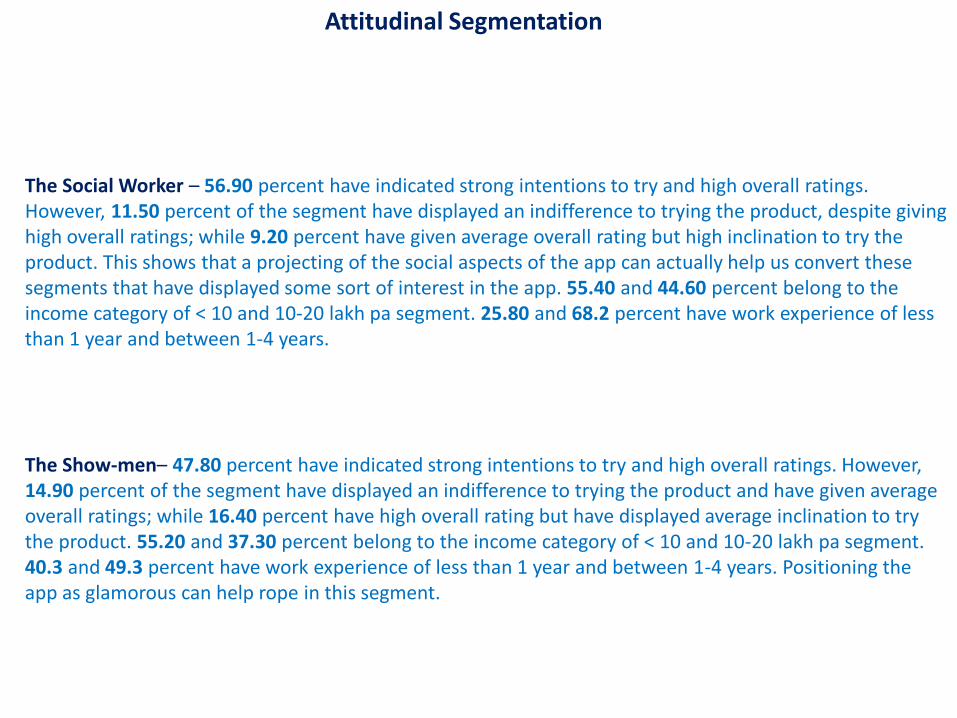
The Social Worker – 56.90 percent have indicated strong intentions to try and high overall ratings. However, 11.50 percent of the segment have displayed an indifference to trying the product, despite giving high overall ratings; while 9.20 percent have given average overall rating but high inclination to try the product. This shows that a projecting of the social aspects of the app can actually help us convert these segments that have displayed some sort of interest in the app. 55.40 and 44.60 percent belong to the income category of < 10 and 10-20 lakh pa segment. 25.80 and 68.2 percent have work experience of less than 1 year and between 1-4 years.
Attitudinal Segmentation
The Show-men– 47.80 percent have indicated strong intentions to try and high overall ratings. However, 14.90 percent of the segment have displayed an indifference to trying the product and have given average overall ratings; while 16.40 percent have high overall rating but have displayed average inclination to try the product. 55.20 and 37.30 percent belong to the income category of < 10 and 10-20 lakh pa segment. 40.3 and 49.3 percent have work experience of less than 1 year and between 1-4 years. Positioning the app as glamorous can help rope in this segment.
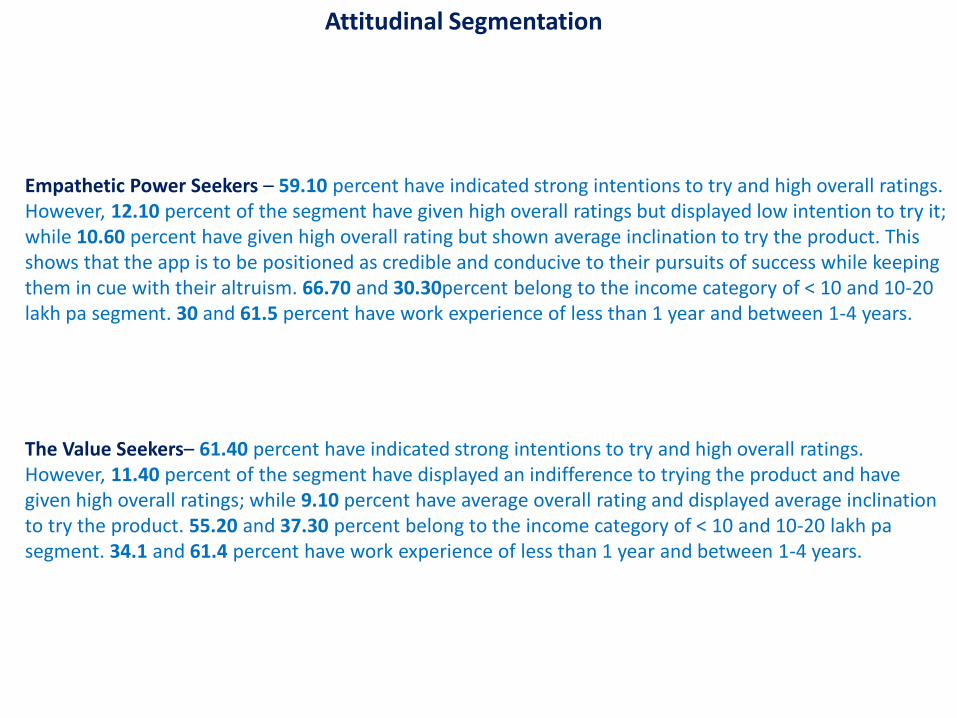
Empathetic Power Seekers – 59.10 percent have indicated strong intentions to try and high overall ratings. However, 12.10 percent of the segment have given high overall ratings but displayed low intention to try it; while 10.60 percent have given high overall rating but shown average inclination to try the product. This shows that the app is to be positioned as credible and conducive to their pursuits of success while keeping them in cue with their altruism. 66.70 and 30.30percent belong to the income category of < 10 and 10-20 lakh pa segment. 30 and 61.5 percent have work experience of less than 1 year and between 1-4 years.
Attitudinal Segmentation
The Value Seekers– 61.40 percent have indicated strong intentions to try and high overall ratings. However, 11.40 percent of the segment have displayed an indifference to trying the product and have given high overall ratings; while 9.10 percent have average overall rating and displayed average inclination to try the product. 55.20 and 37.30 percent belong to the income category of < 10 and 10-20 lakh pa segment. 34.1 and 61.4 percent have work experience of less than 1 year and between 1-4 years.

This app is to be positioned as a tech savvy app for the young socially sensitised generation that offers a host of options and features. It should help them serve their community better while contributing to a change in their lifestyles and the society through intelligent planning of their schedules and fulfilling activities in life. It must complement the intense lifestyle of the young working crowd (reflected in the segmentation details). It should help them balance their stressful work life with traditional values that will help them retain their original culture and project them as responsible, fun loving, socially and self aware individuals with a convincing measure of probity.
Positioning
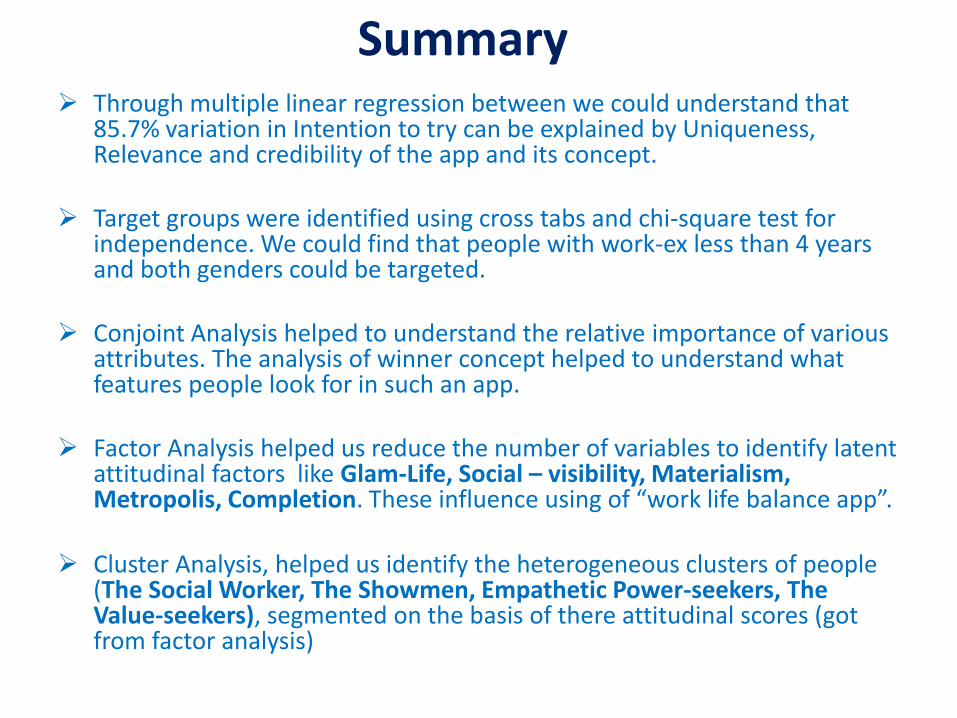
Summary Through multiple linear regression between we could understand that
85.7% variation in Intention to try can be explained by Uniqueness, Relevance and credibility of the app and its concept.
Target groups were identified using cross tabs and chi-square test for independence. We could find that people with work-ex less than 4 years and both genders could be targeted.
Conjoint Analysis helped to understand the relative importance of various attributes. The analysis of winner concept helped to understand what features people look for in such an app.
Factor Analysis helped us reduce the number of variables to identify latent attitudinal factors like Glam-Life, Social – visibility, Materialism, Metropolis, Completion. These influence using of “work life balance app”.
Cluster Analysis, helped us identify the heterogeneous clusters of people (The Social Worker, The Showmen, Empathetic Power-seekers, The Value-seekers), segmented on the basis of there attitudinal scores (got from factor analysis)
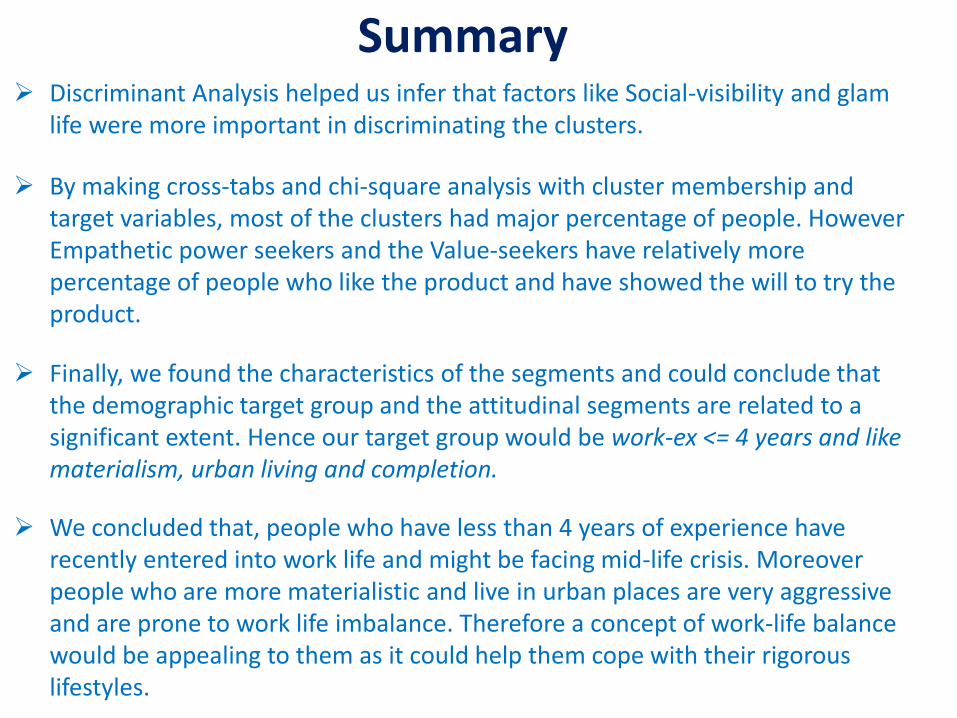
Discriminant Analysis helped us infer that factors like Social-visibility and glam life were more important in discriminating the clusters.
By making cross-tabs and chi-square analysis with cluster membership and target variables, most of the clusters had major percentage of people. However Empathetic power seekers and the Value-seekers have relatively more percentage of people who like the product and have showed the will to try the product.
Finally, we found the characteristics of the segments and could conclude that the demographic target group and the attitudinal segments are related to a significant extent. Hence our target group would be work-ex <= 4 years and like materialism, urban living and completion.
We concluded that, people who have less than 4 years of experience have recently entered into work life and might be facing mid-life crisis. Moreover people who are more materialistic and live in urban places are very aggressive and are prone to work life imbalance. Therefore a concept of work-life balance would be appealing to them as it could help them cope with their rigorous lifestyles.
Summary