Embed Size (px)
Citation preview
1
Hispanic Brand Loyalty2015
2
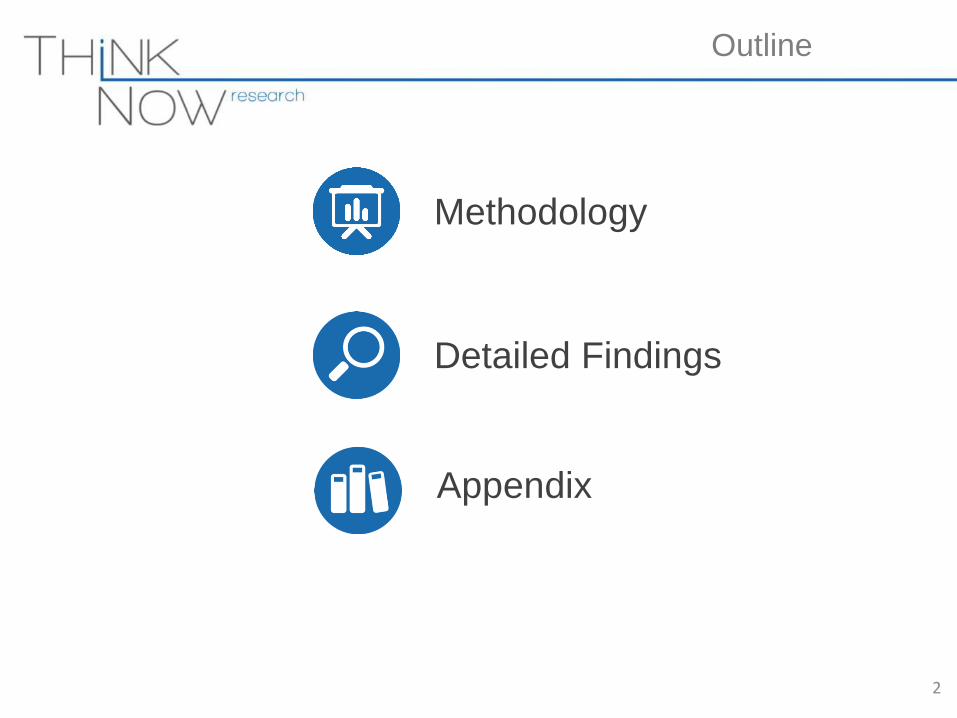
Outline
Methodology
Detailed Findings
Appendix
3
Methodology
4
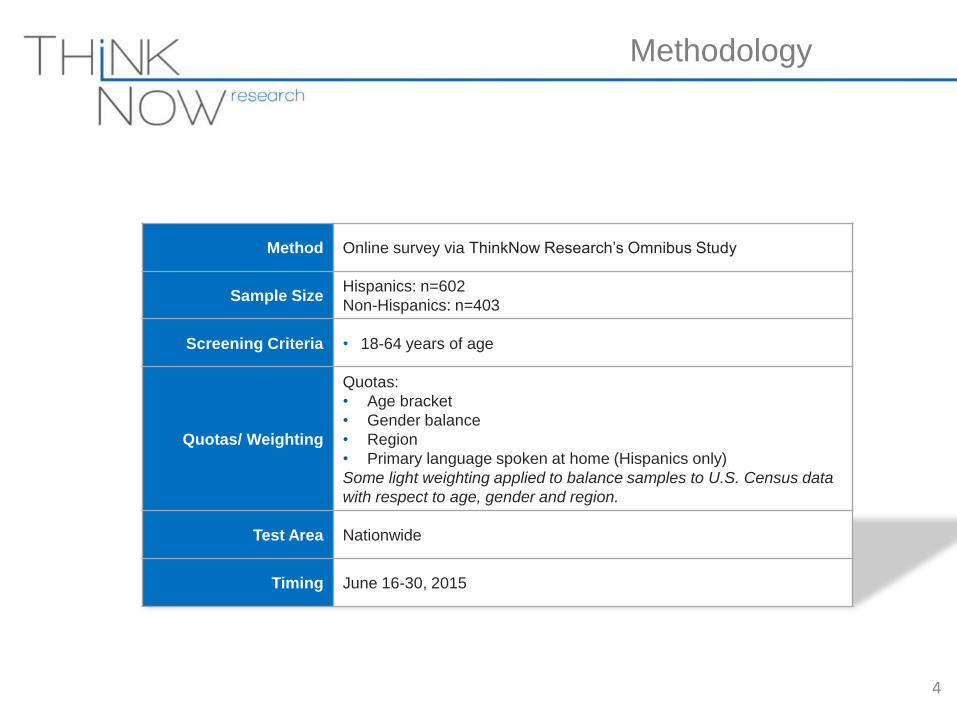
Methodology
Method Online survey via ThinkNow Research’s Omnibus Study
Sample SizeHispanics: n=602
Non-Hispanics: n=403
Screening Criteria • 18-64 years of age
Quotas/ Weighting
Quotas:
• Age bracket
• Gender balance
• Region
• Primary language spoken at home (Hispanics only)
Some light weighting applied to balance samples to U.S. Census data
with respect to age, gender and region.
Test Area Nationwide
Timing June 16-30, 2015
Our research indicates that Hispanics
are more loyal to some brands than
Non-Hispanics but less loyal to others.
5
6
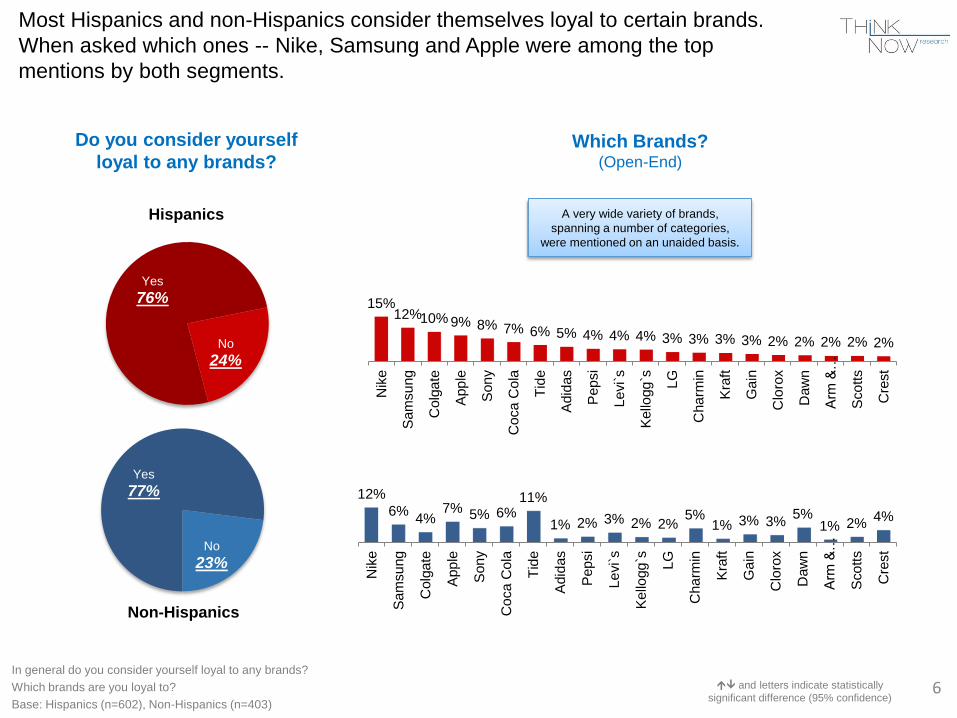
Most Hispanics and non-Hispanics consider themselves loyal to certain brands.
When asked which ones -- Nike, Samsung and Apple were among the top
mentions by both segments.
Yes
76%
No
24%
Yes
77%
No
23%
Hispanics
Non-Hispanics
15%12%10% 9% 8% 7% 6% 5% 4% 4% 4% 3% 3% 3% 3% 2% 2% 2% 2% 2%
N
ike
S
am
su
ng
C
olg
ate
A
pp
le
S
on
y
C
oca C
ola
T
ide
A
did
as
P
ep
si
L
evi`
s
K
ello
gg`s
L
G
C
ha
rmin
K
raft
G
ain
C
loro
x
D
aw
n
A
rm &
…
S
co
tts
C
rest
12%
6%4%
7% 5% 6%11%
1% 2% 3% 2% 2%5%
1% 3% 3%5%
1% 2%4%
N
ike
S
am
sung
C
olg
ate
A
pple
S
ony
C
oca C
ola
T
ide
A
did
as
P
epsi
Le
vi`
s
K
ello
gg`s
LG
C
harm
in
K
raft
G
ain
C
loro
x
D
aw
n
A
rm &
…
S
cotts
C
rest
In general do you consider yourself loyal to any brands?
Which brands are you loyal to?
Base: Hispanics (n=602), Non-Hispanics (n=403)
and letters indicate statistically
significant difference (95% confidence)
Do you consider yourself
loyal to any brands?Which Brands?
(Open-End)
A very wide variety of brands,
spanning a number of categories,
were mentioned on an unaided basis.
7
41%
26%20% 20% 16%
11% 11% 7%
24%
29%29%
22%21%
25% 21%
16%
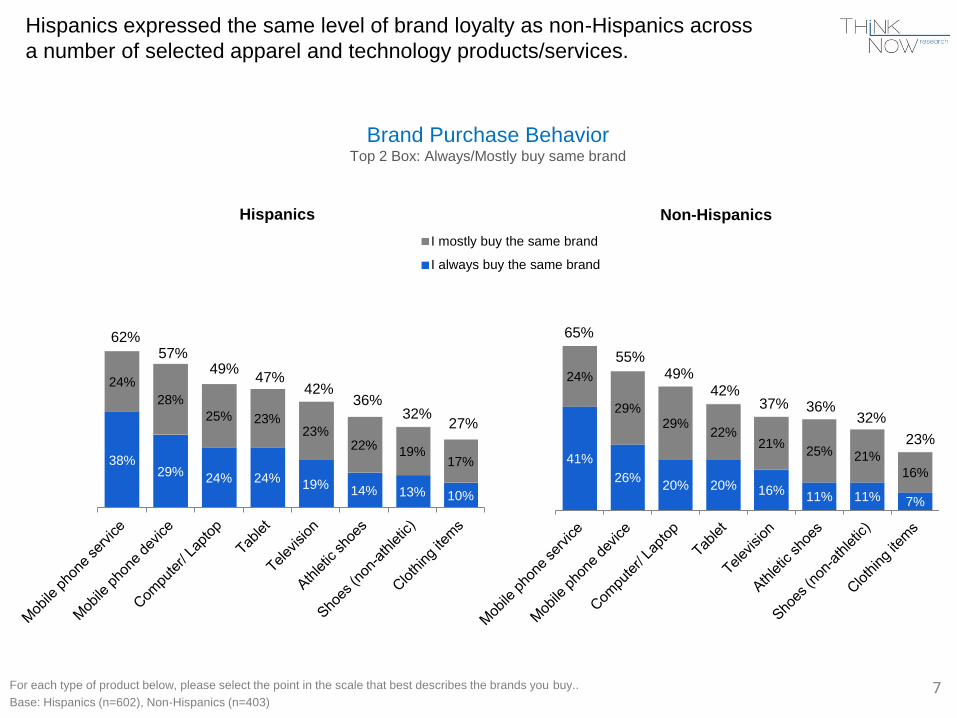
Hispanics expressed the same level of brand loyalty as non-Hispanics across
a number of selected apparel and technology products/services.
38%29%
24% 24%19%
14% 13% 10%
24%
28%
25% 23%23%
22%19%
17%
I mostly buy the same brand
I always buy the same brand
Brand Purchase BehaviorTop 2 Box: Always/Mostly buy same brand
Hispanics Non-Hispanics
62%57%
49%47%
42%36%
32%27%
65%
55%49%
42%37% 36%
32%
23%
For each type of product below, please select the point in the scale that best describes the brands you buy..
Base: Hispanics (n=602), Non-Hispanics (n=403)
When looked at by acculturation level,
the findings suggest that Hispanics
who are Less Acculturated or
Bicultural are more likely to be brand
loyal compared to the Most
Acculturated.
8
9
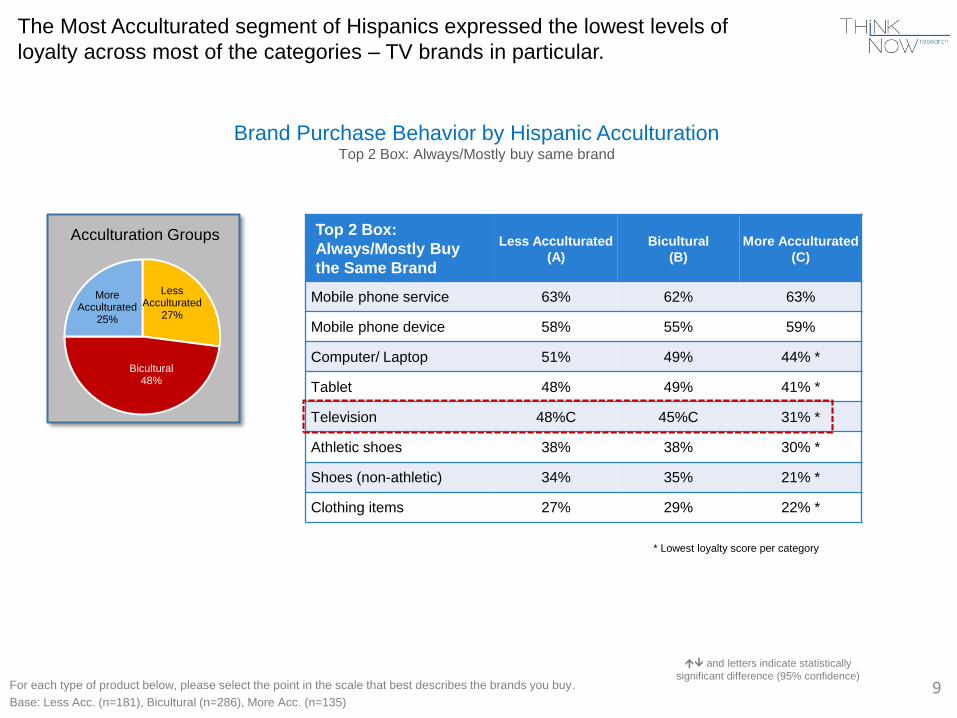
Less Acculturated
27%
Bicultural48%
More Acculturated
25%
Acculturation Groups Top 2 Box:
Always/Mostly Buy
the Same Brand
Less Acculturated
(A)
Bicultural
(B)
More Acculturated
(C)
Mobile phone service 63% 62% 63%
Mobile phone device 58% 55% 59%
Computer/ Laptop 51% 49% 44% *
Tablet 48% 49% 41% *
Television 48%C 45%C 31% *
Athletic shoes 38% 38% 30% *
Shoes (non-athletic) 34% 35% 21% *
Clothing items 27% 29% 22% *
For each type of product below, please select the point in the scale that best describes the brands you buy.
Base: Less Acc. (n=181), Bicultural (n=286), More Acc. (n=135)
and letters indicate statistically
significant difference (95% confidence)
Brand Purchase Behavior by Hispanic AcculturationTop 2 Box: Always/Mostly buy same brand
The Most Acculturated segment of Hispanics expressed the lowest levels of
loyalty across most of the categories – TV brands in particular.
* Lowest loyalty score per category
10
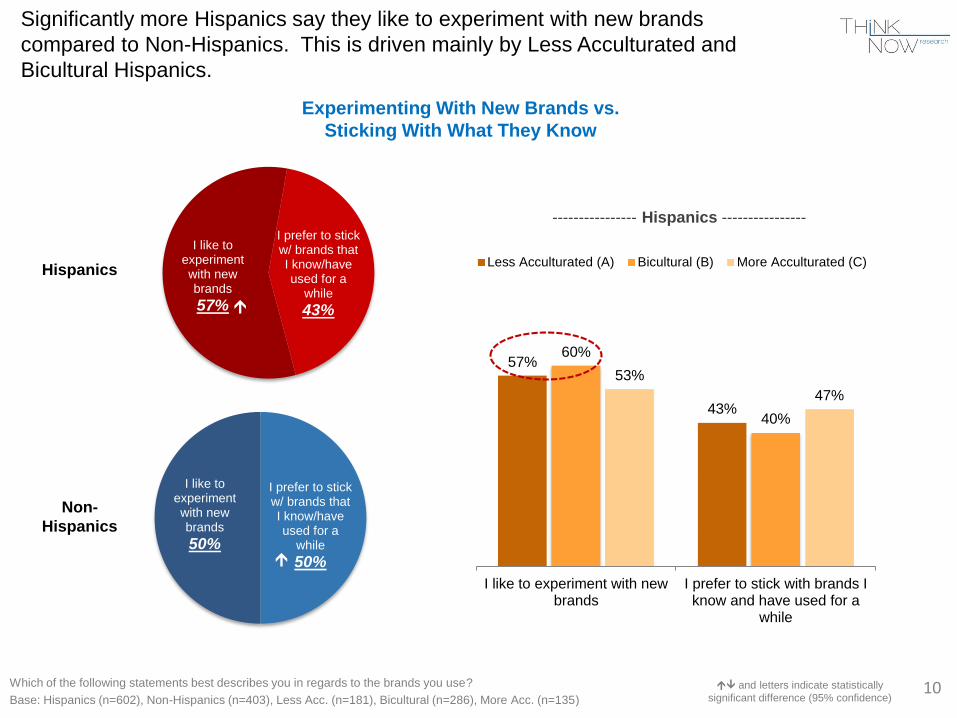
Significantly more Hispanics say they like to experiment with new brands
compared to Non-Hispanics. This is driven mainly by Less Acculturated and
Bicultural Hispanics.
Experimenting With New Brands vs.
Sticking With What They Know
Which of the following statements best describes you in regards to the brands you use?
Base: Hispanics (n=602), Non-Hispanics (n=403), Less Acc. (n=181), Bicultural (n=286), More Acc. (n=135)
57%
43%
60%
40%
53%
47%
I like to experiment with newbrands
I prefer to stick with brands Iknow and have used for a
while
Less Acculturated (A) Bicultural (B) More Acculturated (C)
I like to experiment with new brands
57%
I prefer to stick w/ brands that I know/have used for a
while
43%
I like to experiment with new brands
50%
I prefer to stick w/ brands that I know/have used for a
while
50%
Hispanics
Non-
Hispanics
and letters indicate statistically
significant difference (95% confidence)
---------------- Hispanics ----------------
11
Appendix
12
Hispanics
n=602
Non-
Hispanics
n=403
Hispanics
n=602
Non-
Hispanics
n=403
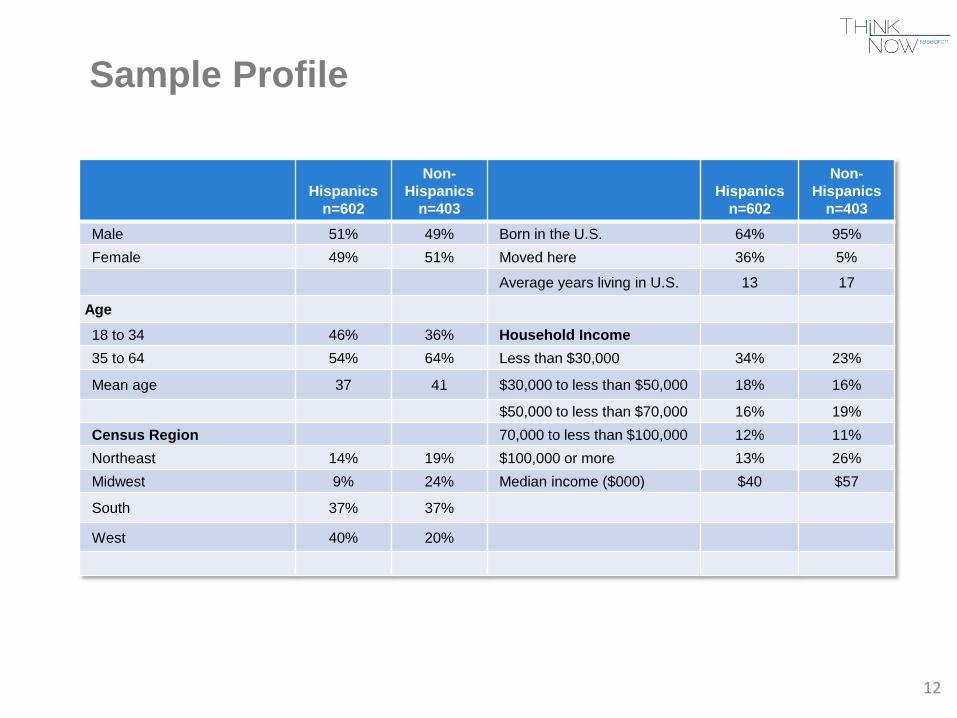
Male 51% 49% Born in the U.S. 64% 95%
Female 49% 51% Moved here 36% 5%
Average years living in U.S. 13 17
Age
18 to 34 46% 36% Household Income
35 to 64 54% 64% Less than $30,000 34% 23%
Mean age 37 41 $30,000 to less than $50,000 18% 16%
$50,000 to less than $70,000 16% 19%
Census Region 70,000 to less than $100,000 12% 11%
Northeast 14% 19% $100,000 or more 13% 26%
Midwest 9% 24% Median income ($000) $40 $57
South 37% 37%
West 40% 20%
Sample Profile
13
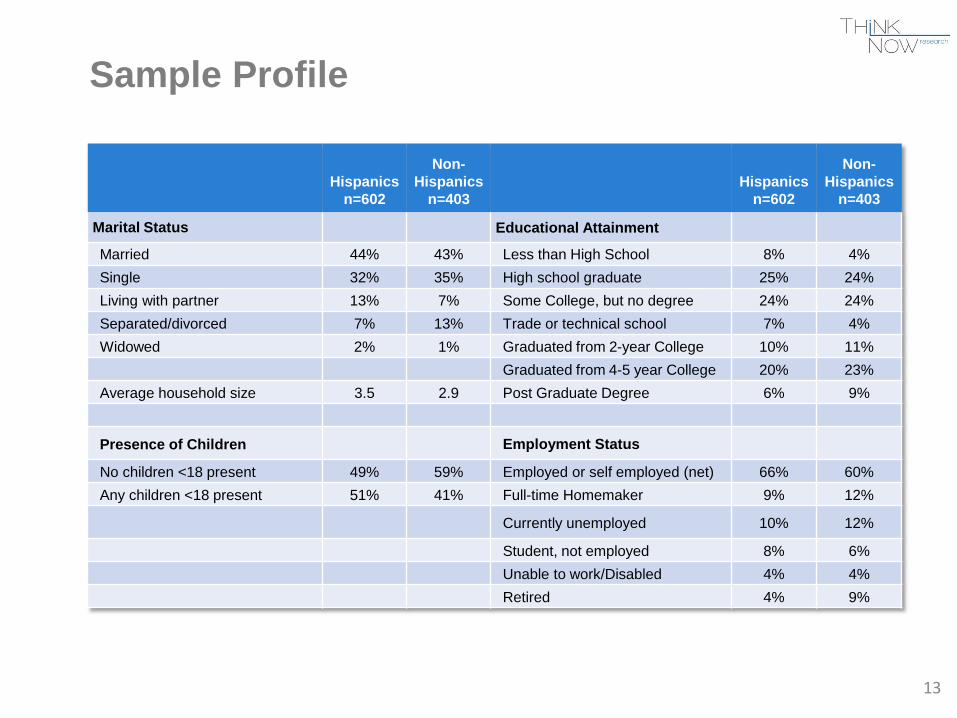
Sample Profile
Hispanics
n=602
Non-
Hispanics
n=403
Hispanics
n=602
Non-
Hispanics
n=403
Marital Status Educational Attainment
Married 44% 43% Less than High School 8% 4%
Single 32% 35% High school graduate 25% 24%
Living with partner 13% 7% Some College, but no degree 24% 24%
Separated/divorced 7% 13% Trade or technical school 7% 4%
Widowed 2% 1% Graduated from 2-year College 10% 11%
Graduated from 4-5 year College 20% 23%
Average household size 3.5 2.9 Post Graduate Degree 6% 9%
Presence of Children Employment Status
No children <18 present 49% 59% Employed or self employed (net) 66% 60%
Any children <18 present 51% 41% Full-time Homemaker 9% 12%
Currently unemployed 10% 12%
Student, not employed 8% 6%
Unable to work/Disabled 4% 4%
Retired 4% 9%
14
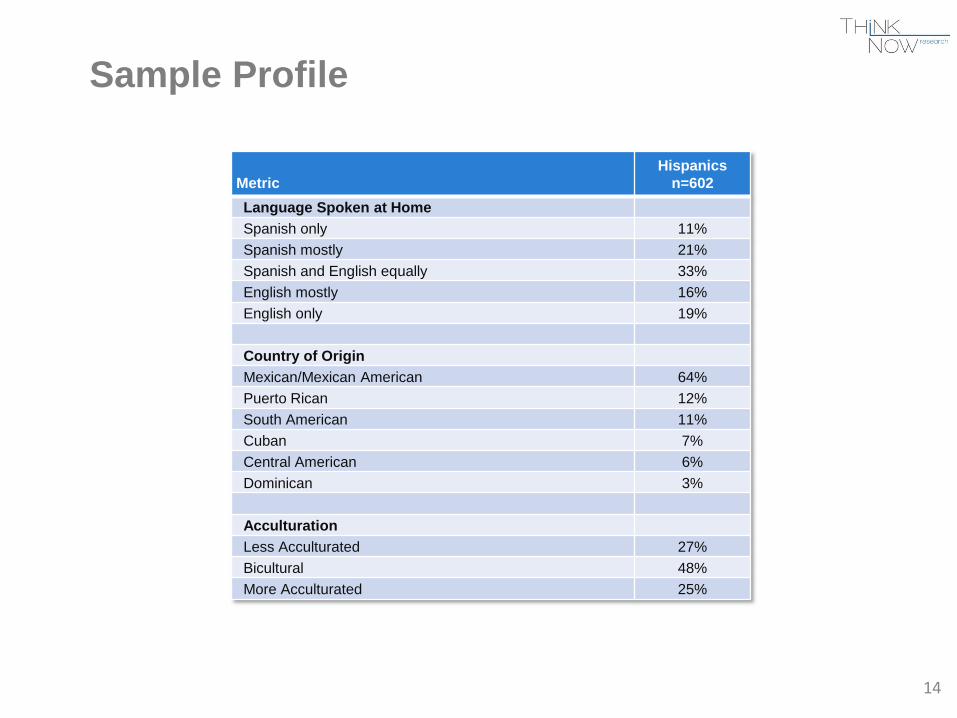
Sample Profile
Metric
Hispanics
n=602
Language Spoken at Home
Spanish only 11%
Spanish mostly 21%
Spanish and English equally 33%
English mostly 16%
English only 19%
Country of Origin
Mexican/Mexican American 64%
Puerto Rican 12%
South American 11%
Cuban 7%
Central American 6%
Dominican 3%
Acculturation
Less Acculturated 27%
Bicultural 48%
More Acculturated 25%