Embed Size (px)
Citation preview

Content Marketing StrategyD I Y D A T A V I S U A L I S A T I O N T O F U E L Y O U R
@ K R Y S T I A N S Z A S T O K

@ K R Y S T I A N S Z A S T O K
W H Y D A T A V I S U A L I S A T I O N ?
Killer content results in
great, natural links
Boring industry
could mean
interesting data
Has the potential to
be more successful than an
infographic

T H E C U R R E N T Q U A L I T Y O F C A R E H O M E S I N E N G L A N D
@ K R Y S T I A N S Z A S T O K

@ K R Y S T I A N S Z A S T O K
P R O C E S S O V E R V I E W
Brainstorming
and exploring
ideas
1 Pre-outreach
and validation
2
Visual Design
3
Implementation
4Setting KPIs
5
Preparing for
launch
6
@ K R Y S T I A N S Z A S T O K
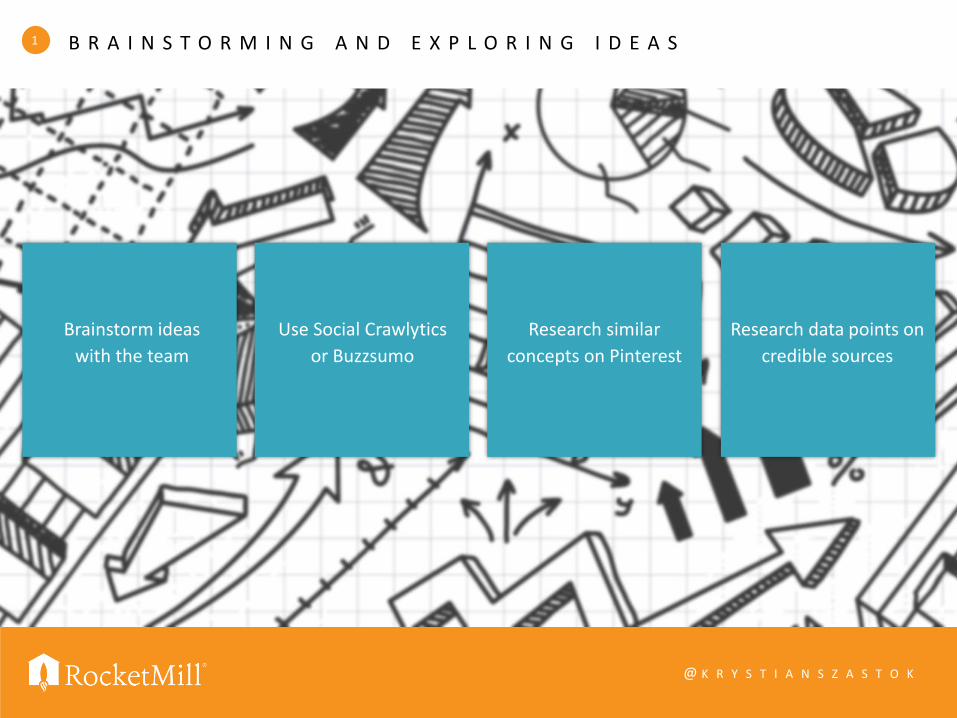
B R A I N S T O R M I N G A N D E X P L O R I N G I D E A S1
Brainstorm ideas
with the team
Use Social Crawlytics
or Buzzsumo
Research similar
concepts on Pinterest
Research data points on
credible sources

@ K R Y S T I A N S Z A S T O K
P R E - O U T R E A C H A N D V A L I D A T I O N2
Validate with your
team whether
your story is potent
Run the idea/concept
past prospects and
influencers
Journalists
(if you’re aiming for a
news angle)

@ K R Y S T I A N S Z A S T O K
V I S U A L D E S I G N3
Create the right
information hierarchyHelp your audience
discern relationships
in the data
How much detail does
the audience need?
Create a sketch and
send it to someone
not involved in the
project
• What are the top 2-3 insights
that would captivate your
audience?
• In what order should they be
communicated visually?
@ K R Y S T I A N S Z A S T O K
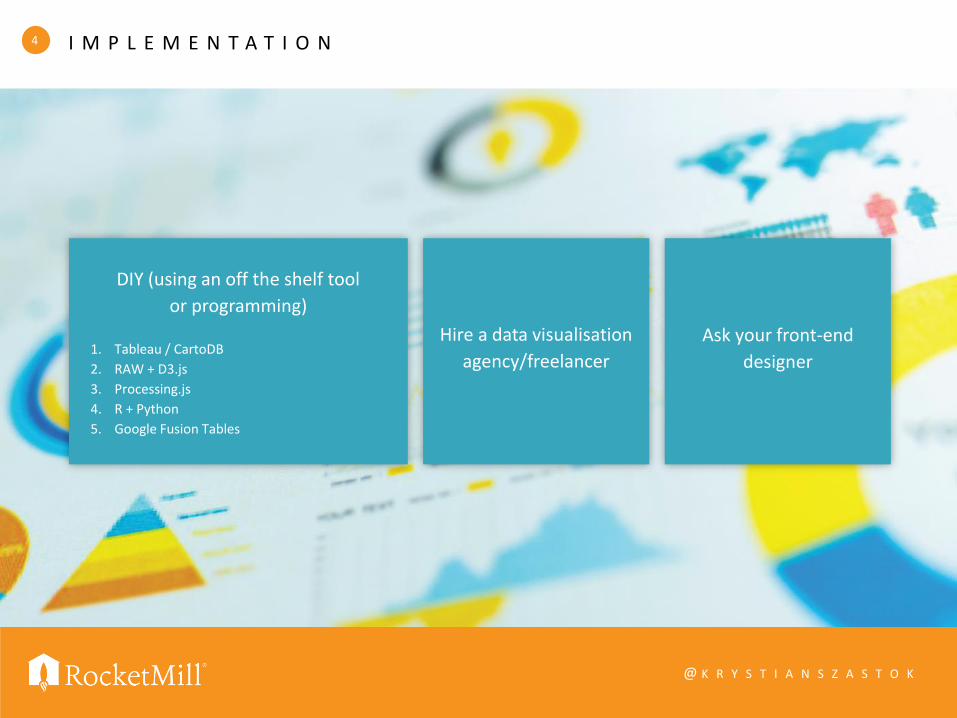
I M P L E M E N T A T I O N4
DIY (using an off the shelf tool
or programming)
Hire a data visualisation
agency/freelancer
Ask your front-end
designer1. Tableau / CartoDB
2. RAW + D3.js
3. Processing.js
4. R + Python
5. Google Fusion Tables

@ K R Y S T I A N S Z A S T O K
S M A R T K P I S5
S P E C I F I C - It has to be clear what the KPI exactly measures.
M E A S U R A B L E - The KPI should be measurable, don’t be vague.
A C H I E V A B L E - Nothing is more discouraging than striving for a goal that you can’t obtain.
R E L E V A N T - The KPI has to be relevant to business objectives.
T I M E B O U N D - It is important to express the value of the KPI in time.

@ K R Y S T I A N S Z A S T O K
S E T T I N G K P I S6
X Number of
inbound links from
new root domains
over 3 months
X Number of
unique referral visits
over 3 months
X Number of
specific micro conversions
over 3 months

@ K R Y S T I A N S Z A S T O K
P R E P A R I N G F O R L A U N C H7
1 2 3 4
Identify more key
influencers
Tracking of micro
conversions
Media pack/visual
assets
Craft social media
messages

@ K R Y S T I A N S Z A S T O K
P R E P A R I N G F O R L A U N C H7
Produce editorial
content for third
party placements
5 6 7
Prepare
emails/messages
for outreach
Prepare phone scripts

H E R E ’ S H O W I ’ V E D O N E I T

B A C K T O O U R E X A M P L E
@ K R Y S T I A N S Z A S T O K

@ K R Y S T I A N S Z A S T O K
B R A I N S T O R M I N G & C O N C E P T P H A S E
I D E A O N E
Map Age Expectancy vs. Care Home Density
• Density of care homes across counties in England
• Age expectancy across counties in England

T H E D A T A D I D N ’ T T E L L U S A P O T E N T S T O R Y
@ K R Y S T I A N S Z A S T O K
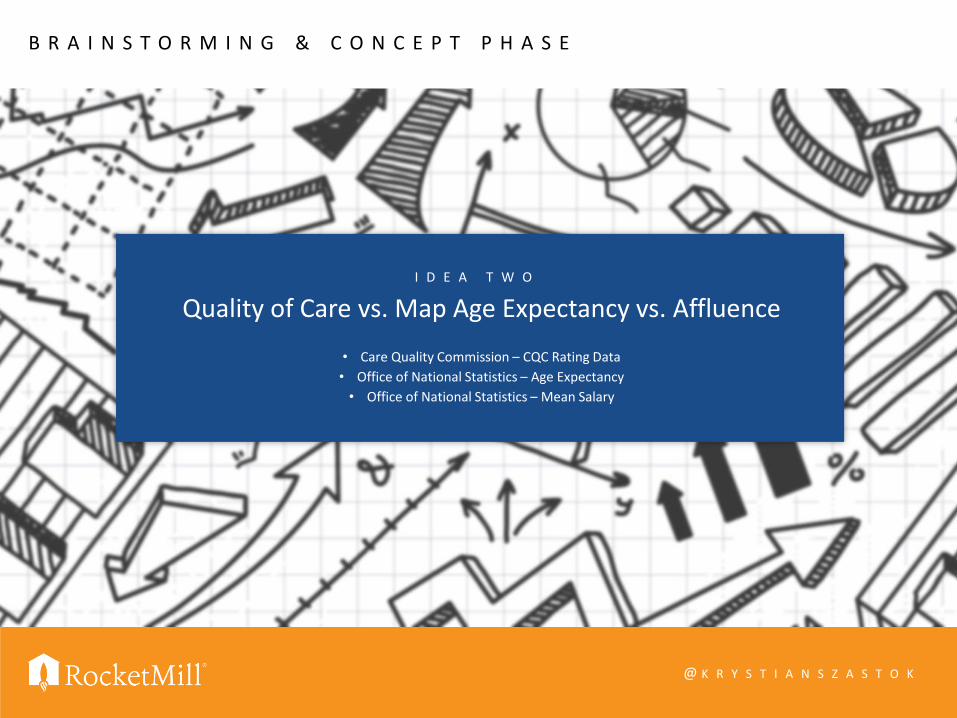
B R A I N S T O R M I N G & C O N C E P T P H A S E
I D E A T W O
Quality of Care vs. Map Age Expectancy vs. Affluence
• Care Quality Commission – CQC Rating Data
• Office of National Statistics – Age Expectancy
• Office of National Statistics – Mean Salary

T H E D A T A T O L D U S M U L T I P L E S T O R I E S

@ K R Y S T I A N S Z A S T O K
W H A T ’ S T H E S T O R Y ?
The most affluent counties provide the lowest levels of care.
This is interesting because it contradicts common assumption.
@ K R Y S T I A N S Z A S T O K
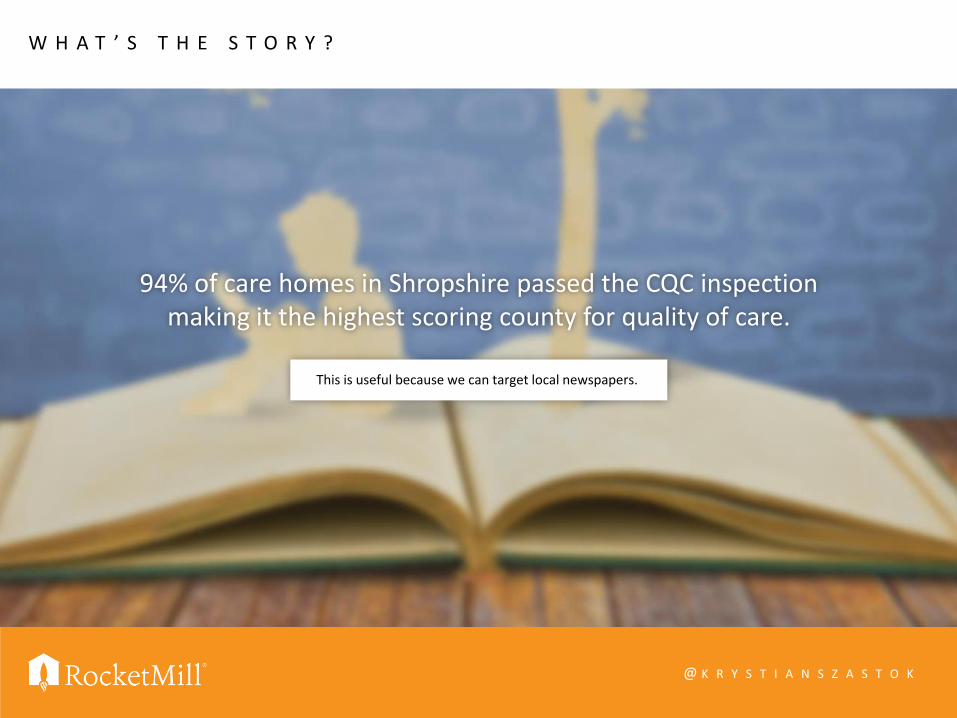
W H A T ’ S T H E S T O R Y ?
94% of care homes in Shropshire passed the CQC inspection making it the highest scoring county for quality of care.
This is useful because we can target local newspapers.
W H A T ’ S T H E S T O R Y ?
@ K R Y S T I A N S Z A S T O K
36% of care homes in Nottinghamshire failed the CQC inspection making it the lowest scoring county for quality of care.
This is a potent story in its own right.

I M P L E M E N T A T I O N
@ K R Y S T I A N S Z A S T O K

@ K R Y S T I A N S Z A S T O K
I N I T I A L S K E T C H / M O C K - U P

@ K R Y S T I A N S Z A S T O K
V I S U A L H I E R A R C H Y

@ K R Y S T I A N S Z A S T O K
W H A T D I D W E A C H I E V E ?
Quoted
and referred
to on national radio
Featured on front
page of Nottingham
Post in print
A number of industry
leading publications
covered it

@ K R Y S T I A N S Z A S T O K
C O M M O N D A T A V I S U A L I S A T I O N M I S T A K E S
Lack of story
Too much
information
and detail
Lack of
validation
Variety for the
sake of variety
Inappropriate
hierarchy

B O O K S A N D R E S O U R C E S T H A T H E L P E D M E
@ K R Y S T I A N S Z A S T O K
http://bit.ly/data-vis-brightonseo

@ K R Y S T I A N S Z A S T O K