Embed Size (px)
Citation preview
8/6/2019 GEO VISUALISATION
http://slidepdf.com/reader/full/geo-visualisation 1/13
Geo VisualizationTerm paper
6/3/2011
IIT Guwahati
B V S K Chaithanya kaki
8/6/2019 GEO VISUALISATION
http://slidepdf.com/reader/full/geo-visualisation 2/13
Introduction:
Geovisualization, short for Geographic Visualization, refers to a set of tools and techniquessupporting geospatial data analysis through the use of interactive visualization.
Like the related fields of scientific visualization[1] and information visualization [2] geovisualization emphasizes knowledge construction over knowledge storage or informationtransmission.[1] To do this, geovisualization communicates geospatial information in ways that,when combined with human understanding, allow for data exploration and decision-making
processes.[1][3][4]
Traditional, static maps have a limited exploratory capability; the graphical representations areinextricably linked to the geographical information beneath. GIS and geovisualization allow formore interactive maps; including the ability to explore different layers of the map, to zoom in orout, and to change the visual appearance of the map, usually on a computer display.[5] Geovisualization represents a set of cartographic technologies and practices that take advantageof the ability of modern microprocessors to render changes to a map in real time, allowing usersto adjust the mapped data on the fly.[1]
The term visualization is first mentioned in the cartographic literature at least as early as 1953, in
an article by University of Chicago geographer Allen K. Philbrick. New developments in thefield of computer science prompted the National Science Foundation to redefine the term in a1987 report which placed visualization at the convergence of computer graphics, imageprocessing, computer vision, computer-aided design, signal processing, and user interface studies[6] and emphasized both the knowledge creation and hypothesis generation aspects of scientificvisualization.[1]
Geovisualization developed as a field of research in the early 1980s, based largely on the work of French graphic theorist Jacques Bertin.[4] Bertin‟s work on cartographic design and informationvisualization share with the National Science Foundation report a focus on the potential for theuse of “dynamic visual displays as prompts for scientific insight and on the methods throughwhich dynamic visual displays might leverage perceptual cognitive processes to facilitatescientific thinking”.[4]
Geovisualization has continued to grow as a subject of practice and research. The InternationalCartographic Association (ICA) established a Commission on Visualization & VirtualEnvironments in 1995.

8/6/2019 GEO VISUALISATION
http://slidepdf.com/reader/full/geo-visualisation 3/13
Geovisualization is closely related to other visualization fields, such as scientific visualization[1] and
information visualization.[2]
Owing to its roots in cartography, geovisualization contributes to these other
fields by way of the map metaphor, which “has been widely used to visualize non-geographic
information in the domains of information visualization and domain knowledge visualization.[3] It is also
related to urban simulation.
8/6/2019 GEO VISUALISATION
http://slidepdf.com/reader/full/geo-visualisation 4/13
Indian Space Research Organisation (ISRO) unveiled beta version of “Bhuvan”, a web-basedmapping tool like Google Earth. “Bhuvan” means Earth in Sanskrit. The application can bedownloaded from http://bhuvan.nrsc.gov.in/ (The website is almost inaccessible at the time of
writing this article.)
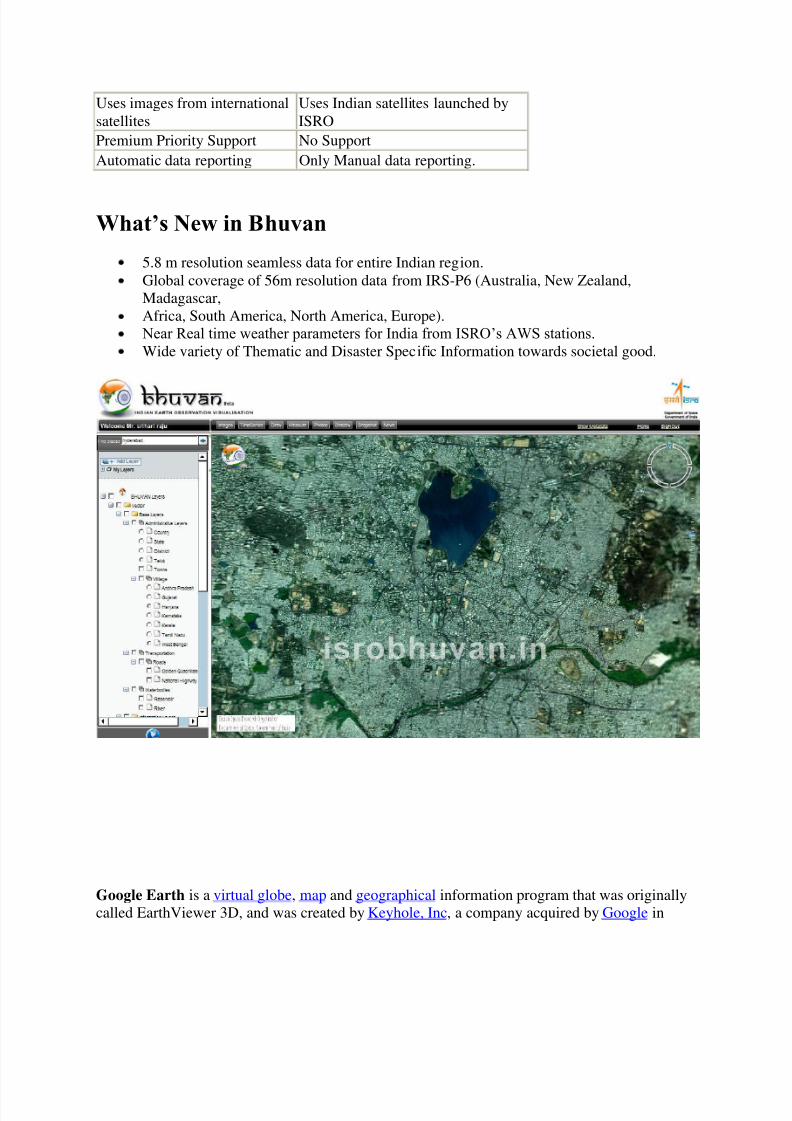
Bhuvan promises to give better 3D satellite imagery of India than is currently being offered byGoogle Earth. Bhuvan has a many India-specific features like weather information,
administrative boundaries of all states and districts, etc.. Bhuvan has best resolutions over theIndian sub-continent. It allows users to fly from space to street level, grab, spin and zoom downto any place. Viewers can zoom into Bhuvan maps up to 10 metres compared to Google Earth‟s200 metres and Wikemapia‟s 50 metres.
But I am not at all happy with this message on the website “Best viewed in IE 6.0 or higher.” It also provides tools for measuring, drawing, saving, printing and visualizing thematic
information. The resolutions currently on offer are good enough to view a vehicle moving on aroad quite clearly.
The launch ceremony was organized by Astronautical Society of India in New Delhi.Hyderabad-based National Remote Sensing Agency (NRSA), a part of ISRO, had a lead role indesigning and developing “Bhuvan”. The day marks the 90th birth anniversary of the father of Indian space programme Vikram Sarabhai.
NRSA scientists developed the content using data provided by Indian satellites like Resourcesat-1. Bhuvan also focus on rural and thematic applications like wasteland mapping and terrainprofile. It contains weather details like humidity levels. The data shown on the portal has been
approved by the government of India. Sensitive information has been kept out of the publicdomain.
Bhuvan: The meaning
Bhuvan(meaning earth in Sanskrit) a web tool just like Goggle Earth promises to give a
gateway to explore and discover virtual earth in 3D space with specific emphasis on Indian
region.
Bhuvan:The significance
Bhuvan gives an easy way to experience, explore and visualize IRS images over Indian
region. The Indian Space Research Organisation (ISRO) has unveiled its beta version of
8/6/2019 GEO VISUALISATION
http://slidepdf.com/reader/full/geo-visualisation 5/13
8/6/2019 GEO VISUALISATION
http://slidepdf.com/reader/full/geo-visualisation 6/13
8/6/2019 GEO VISUALISATION
http://slidepdf.com/reader/full/geo-visualisation 7/13
* Fly to locations ( Flies from the current location directly to the selected location)
* Heads-Up Display ( HUD) naviation controls ( Tilt slider, north indicator, opacity, compass ring, zoom
slider)
* Navigation using the 3D view Pop-up menu (Fly-in, Fly out, jump in, jump around, view point)
* 3D Fly through (3D view to fly to locations, objects in the terrain, and navigate freely using the
mouse or keyboard)
* Drawing 2D objects (Text labels, polylines, polygons, rectangles, 2D arrows, circles, ellipse)
* Drawing 3D Objects (placing of expressive 3D models, 3D polygons, boxes)
* Snapshot creation (copies the 3D view to a floating window and allows to save to a external file)
* Measurement tools (Horizontal distance, aerial distance, vertical distance, measure area)
* Shadow Analysis (it sets the sun position based on the given time creating shadows and effects the
lighting on the terrain)
* Urban Design Tools (to build roads, junctions and traffic lights in an urban setting)
* Contour map ( Displays a colorized terrain map and contour lines)
* Draw tools (Creates simples markers, free hand lines, urban designs)
Bhuvan vs Google Earth
While Google Earth functions on a downloadable customer, Bhuvan functions within the internetbrowser (just supports Windows as well as For example 6 and above).
The actual ISRO Bhuvan presently has severe overall performance issues. The site presentlyreally unstable. This provides upward or hangs the browser every once in a while. Whenever acoating (condition, area, taluk, and so on.) is actually turned on, it makes unevenly andoccasionally does not render at all. The actual routing solar panel didn‟t fill routinely and itexperienced like a rare sighting when we might really make use of the solar panel.
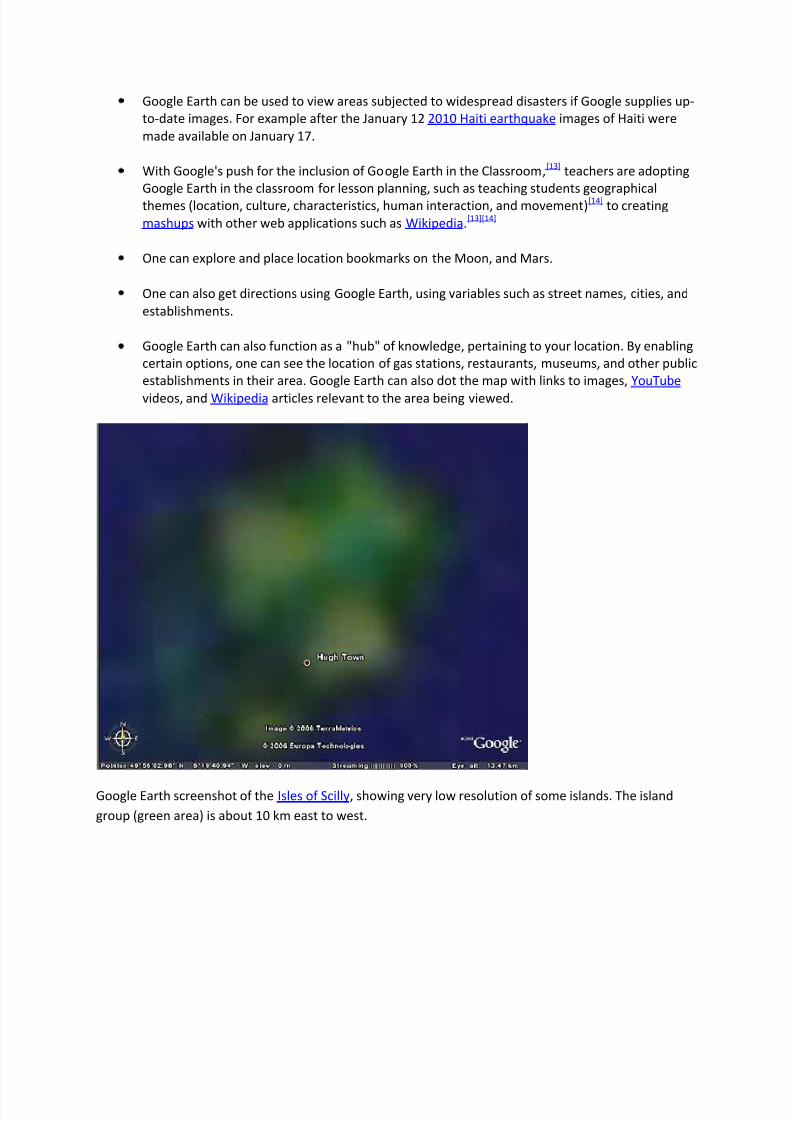
The actual guarantee of high resolution images is not kept. As the support promises move asmuch as Ten metres from the walk out as towards Two hundred metres for Search engines Earth,
8/6/2019 GEO VISUALISATION
http://slidepdf.com/reader/full/geo-visualisation 8/13
all of us didn‟t experience a single image along with nearly just as much detailing. In fact,comparative results for the area such as New Delhi‟s Connaught Place or even Red Fort make itsobvious regarding the inferior performance associated with ISRO Earth as of this moment.
The actual navigation resources are similar to Search engines Earth (General electric).
The research doesn‟t function if your query returns multiple outcomes. A pop up eye-port shouldreally provide the multiple outcomes that the consumer is supposed to be able to choose.Throughout two days associated with infrequent screening, we discovered the result only once.All of those other period, the window would pop up, however nothing would be displayed. Oncethe research is actually accurate, the program „flies in‟ towards the exact place, exactly the sameway because General electric.
Users need to produce a merchant account and download the plug-in.
Bhuvan packs lots of data on weather, water bodies as well as population details of various
admin models. I was unable to entry weather information. Clicking on icons associated withadministrative units show basic info like the population. For professional customers, Bhuvanmight maintain some attraction. For instance, there‟s a drought map that cab be employed toevaluate drought scenario across many there is a flood chart that exhibits Bihar throughout theKosi basin and after. With Isro support, Bhuvan could supply this kind of relevant data everyonce in awhile, however the application requirements major improvements in terms of functionality prior to it will be of great interest towards the ordinary person.
Users may also not modify any kind of information or even tag locations.
We hope Bhuvan has the capacity to repair the insects soon. However actually after that, to be a
reputable alternative to existing applying services, as well as to get brand new users to try this, ita lot provide higher resolution images. User curiosity is going to be spurred only if they are ableto observe their house or even school or even nearby street in high resolution. With Isro data, thisreally is easily possible.
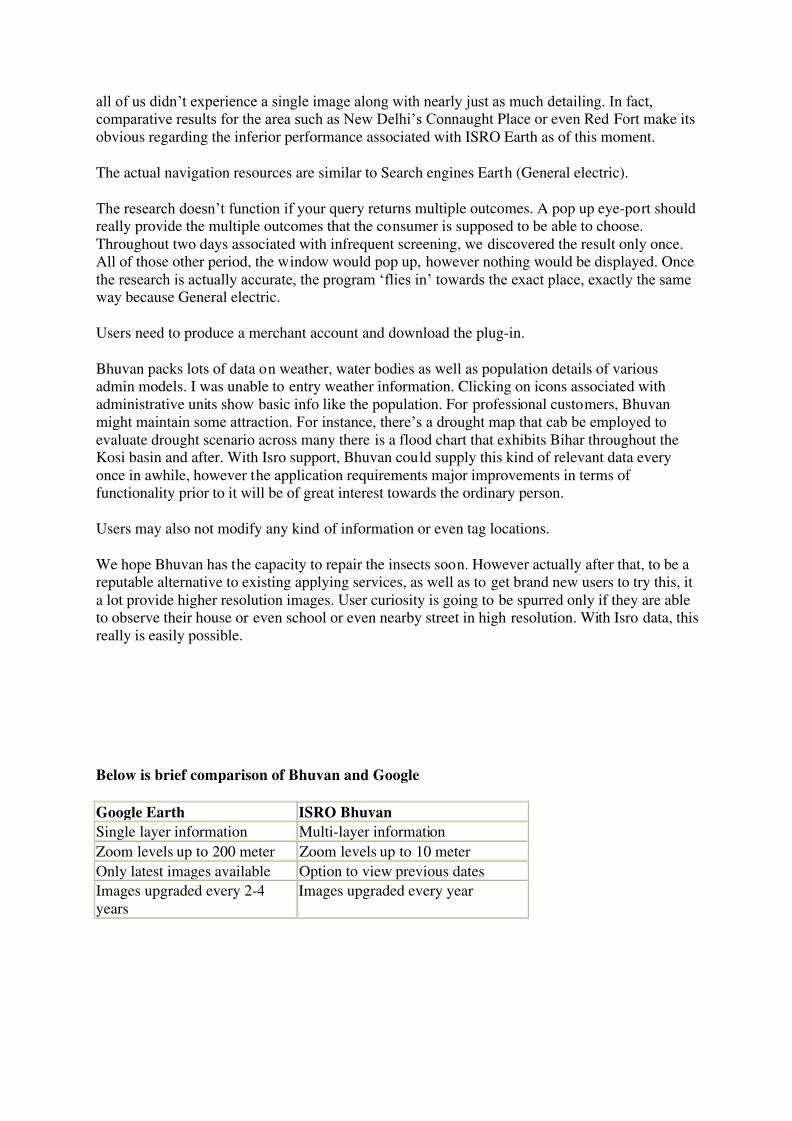
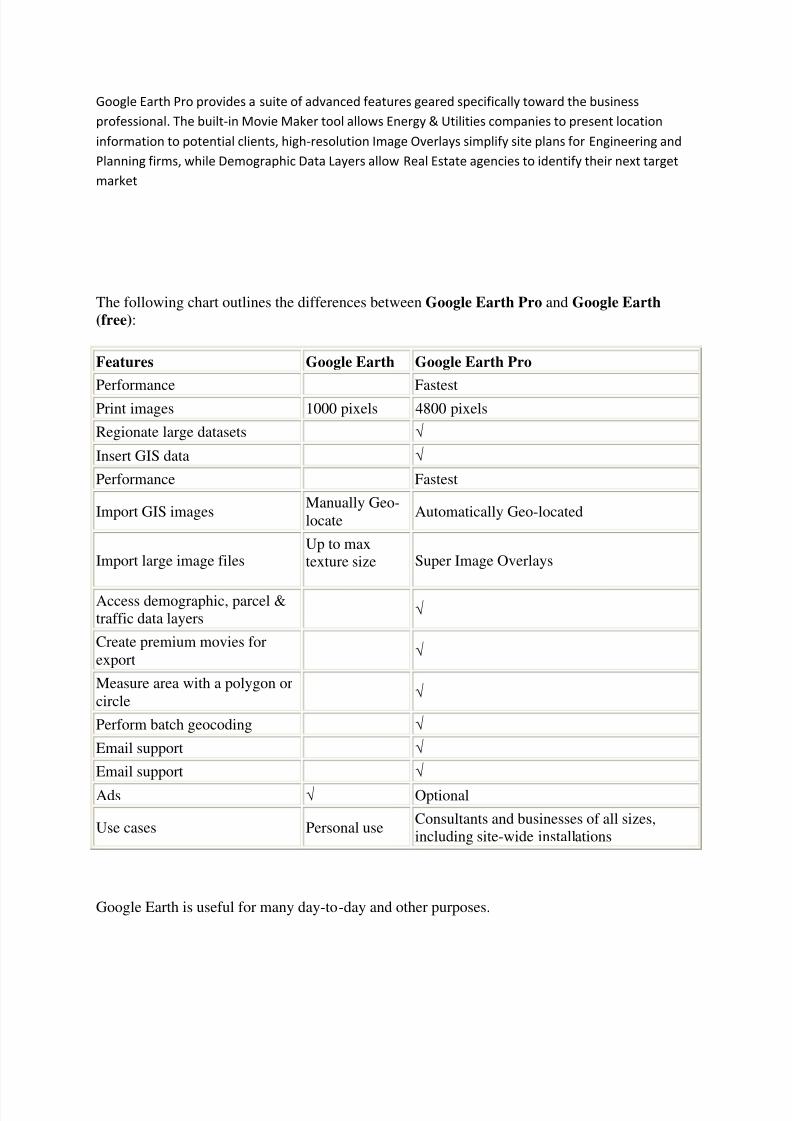
Below is brief comparison of Bhuvan and Google
Google Earth ISRO Bhuvan
Single layer information Multi-layer information
Zoom levels up to 200 meter Zoom levels up to 10 meter
Only latest images available Option to view previous dates
Images upgraded every 2-4years
Images upgraded every year
8/6/2019 GEO VISUALISATION
http://slidepdf.com/reader/full/geo-visualisation 9/13
8/6/2019 GEO VISUALISATION
http://slidepdf.com/reader/full/geo-visualisation 10/13
8/6/2019 GEO VISUALISATION
http://slidepdf.com/reader/full/geo-visualisation 11/13
8/6/2019 GEO VISUALISATION
http://slidepdf.com/reader/full/geo-visualisation 12/13
8/6/2019 GEO VISUALISATION
http://slidepdf.com/reader/full/geo-visualisation 13/13
http://earth.google.com/support/bin/answer.py?hl=en&answer=189
188
http://www.infocera.com/BHUVAN__from_ISRO:_A_tough_competit
or_of_Google_earth._5326.htm