Embed Size (px)
DESCRIPTION
Craig Sullivan, well known conversion consultant from the UK. Slides from his saturday keynote at Conversion Hotel 2014 #CH2014 #enjoy
Citation preview

Oh Boy!
These A/B tests appear to be bullshit!

@OptimiseOrDie
• UX, Analytics, Testing and Innovation
• Started doing testing & CRO 2004
• Split tested over 40M visitors in 19 languages
• 60+ mistakes with AB testing
• I’ve made every one of them
• Like riding a bike…
• Get in touch for workshops, skill transfer, CRO methodology design, training and programme mentoring…

@OptimiseOrDie
Hands on!


@OptimiseOrDie
Timeline
Tested stupid ideas, lots
Most AB or MVT tests are bullshit
Discovered AB testing
Triage, Triangulation, Prioritisation, Maths
Zen Plumbing
AB Test Hype Cycle

@OptimiseOrDie

@OptimiseOrDie

Oppan Gangnam Style!
@OptimiseOrDie

#1 : You’re doing it in the wrong place
@OptimiseOrDie

#1 : You’re doing it in the wrong place There are 4 areas a CRO expert always looks at: 1. Inbound a+ri.on (medium, source, landing page,
keyword, intent and many more…) 2. Key conversion points (product, basket, registraBon) 3. Processes, lifecycles and steps (forms, logins,
registraBon, checkout, onboarding, emails, push) 4. Layers of engagement (search, category, product, add)
5. Use visitor flow reports for aIriBon – very useful. 6. For key conversion points, look at loss rates &
interacBons 7. Processes and steps – look at funnels or make your own 8. Layers and engagement – make a ring model
@OptimiseOrDie

Examples – Concept
Bounce
Engage
Outcome
@OptimiseOrDie

Examples – 16-‐25Railcard.co.uk
Bounce
Login to Account
Content Engage
Start Application
Type and Details
Eligibility
Photo
Complete
@OptimiseOrDie

Examples – Guide Dogs
Bounce
Content Engage
Donation Pathway
Donation Page
Starts process
Funnel steps
Complete
@OptimiseOrDie

Within a layer
Page 1
Page 2
Page 3
Page 4 Page 5
Exit
Deeper Layer
Like Contact
Wishlist
Micro Conversions
@OptimiseOrDie

#1 : Make a Money Model • Get to know the flow and loss (leaks) inbound, inside and
through key processes or conversion points. • Once you know the key steps you’re losing people at and how
much traffic you have – make a money model. • 20,000 see the basket page – what’s the basket page to
checkout page raBo? • EsBmate how much you think you can shi\ the key metric
(e.g. basket adds, basket -‐> checkout) • What downstream revenue or profit would that generate? • Sort by the money column • CongratulaBons – you’ve now built the worlds first IT plan for
growth with a return on investment esBmate aIached! • I’ll talk more about prioriBsing later – but a good real world
analogy for you to use:
@OptimiseOrDie

Think like a store owner! If you can’t refurbish the entire store, which floors or departments will you invest in optimising? Wherever there is: • Footfall • Low return • Opportunity
@OptimiseOrDie

Insight -‐ Inputs
#FAIL
CompeBtor copying
Guessing Dice rolling
An arBcle the CEO read
CompeBtor change
Panic
Ego
Opinion Cherished noBons MarkeBng
whims Cosmic rays Not ‘on brand’ enough
IT inflexibility
Internal company needs
Some dumbass consultant
Shiny feature blindness Knee jerk
reactons
#2 : Your hypothesis is crap!
@OptimiseOrDie

Insight -‐ Inputs
Insight
SegmentaBon
Surveys Sales and Call Centre
Session Replay
Social analyBcs
Customer contact
Eye tracking
Usability tesBng
Forms analyBcs Search
analyBcs Voice of Customer
Market research
A/B and MVT tesBng
Big & unstructured
data
Web analyBcs
CompeBtor evals Customer
services
#2 : These are the inputs you need…
@OptimiseOrDie
Insight -‐ Inputs
@OptimiseOrDie
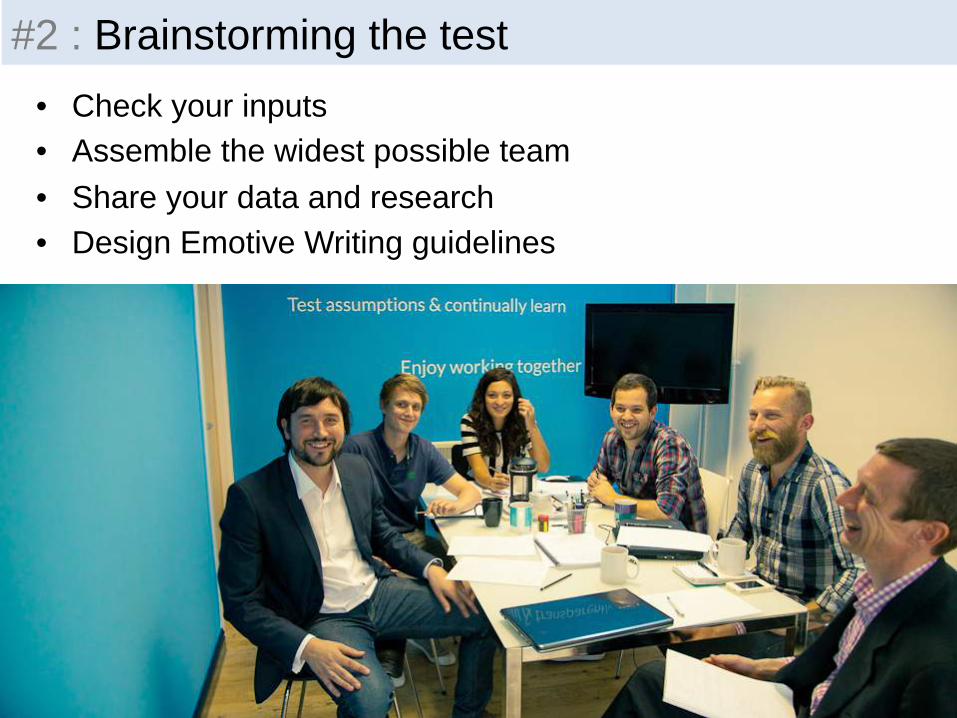
#2 : Brainstorming the test
• Check your inputs • Assemble the widest possible team
• Share your data and research • Design Emotive Writing guidelines

Insight -‐ Inputs
@OptimiseOrDie
#2 : Emotive Writing - example
Customers do not know what to do and need support and advice • Emphasize the fact that you understand that their situation is stressful • Emphasize your expertise and leadership in vehicle glazing and will help them get the best
solution for their situation • Explain what they will need to do online and during the call-back so that they know what the
next steps will be • Explain that they will be able ask any other questions they might have during the call-back
Customers do not feel confident in assessing the damage • Emphasize the fact that you will help them assess the damage correctly online Customers need to understand the benefits of booking online • Emphasize that the online booking system is quick, easy and provides all the information
they need in regards with their appointment and general cost information Customers mistrust insurers and find dealing with their insurance situation very frustrating
• Where possible communicate the fact that the job is most likely to be free for insured customers, or good value for money for cash customers
• Show that you understand the hassle of dealing with insurance companies – emphasise that you will help with their insurance paperwork for them, freeing them of this burden
Some customers cannot be bothered to take action to fix their car glass • Emphasize the consequences of not doing anything,
e.g. ‘It’s going to cost you more if the chip develops into a crack’

Insight -‐ Inputs
@OptimiseOrDie
#2 : THE DARK SIDE
“Keep your family safe and get back on the road fast with Autoglass.”

Insight -‐ Inputs
@OptimiseOrDie
#2 : NOW YOU CAN BEGIN
• You should have inputs, research, data, guidelines • Sit down with the team and prompt with 12 questions:
– Who is this page (or process) for? – What problem does this solve for the user? – How do we know they need it? – What is the primary action we want people to take? – What might prompt the user to take this action? – How will we know if this is doing what we want it to do? – How do people get to this page? – How long are people here on this page? – What can we remove from this page? – How can we test this solution with people? – How are we solving the users needs in different and better ways than
other places on our site? – If this is a homepage, ask these too (bit.ly/1fX2RAa)

Insight -‐ Inputs
@OptimiseOrDie
#2 : PROMPT YOURSELF
• Check your UX or Copywriting guidelines.
• Use Get Mental Notes
• What levers can we apply now? • Create a hypothesis:
“WE BELIEVE THAT DOING [A] FOR PEOPLE [B] WILL MAKE OUTCOME [C] HAPPEN. WE'LL KNOW THIS WHEN WE SEE DATA [D] AND FEEDBACK [E]”
www.GetMentalNotes.com

Insight -‐ Inputs
@OptimiseOrDie
#2 : THE FUN BIT!
• Collaborative Sketching • Brainwriting • Refine and Test!

We believe that doing [A] for People [B] will make outcome [C] happen.
We’ll know this when we observe data [D] and obtain feedback [E]. (reverse)
@OptimiseOrDie

#2 : Solutions • You need multiple tool inputs
– Tool decks are here : www.slideshare.net/sullivac
• Collaborative, Customer connected team – If you’re not doing this, you’re hosed
• Session replay tools provide vital input – Get vital additional customer evidence
• Simple page Analytics don’t cut it – Invest in your analytics, especially event tracking
• Ego, Opinion, Cherished notions – fill gaps – Fill these vacuums with insights and data
• Champion the user
– Give them a chair at every meeting @OptimiseOrDie

Insight -‐ Inputs
@OptimiseOrDie
#2 : HYPOTHESIS DESIGN SUMMARY
• Inputs – get the right stuff • Research, Guidelines, Data • Framing the problem(s) • Questions to get you going • Use card prompts for Psychology • Create a hypothesis • Collaborative Sketching • Brainwriting • Refine and Check Hypothesis
• Instrument and Test
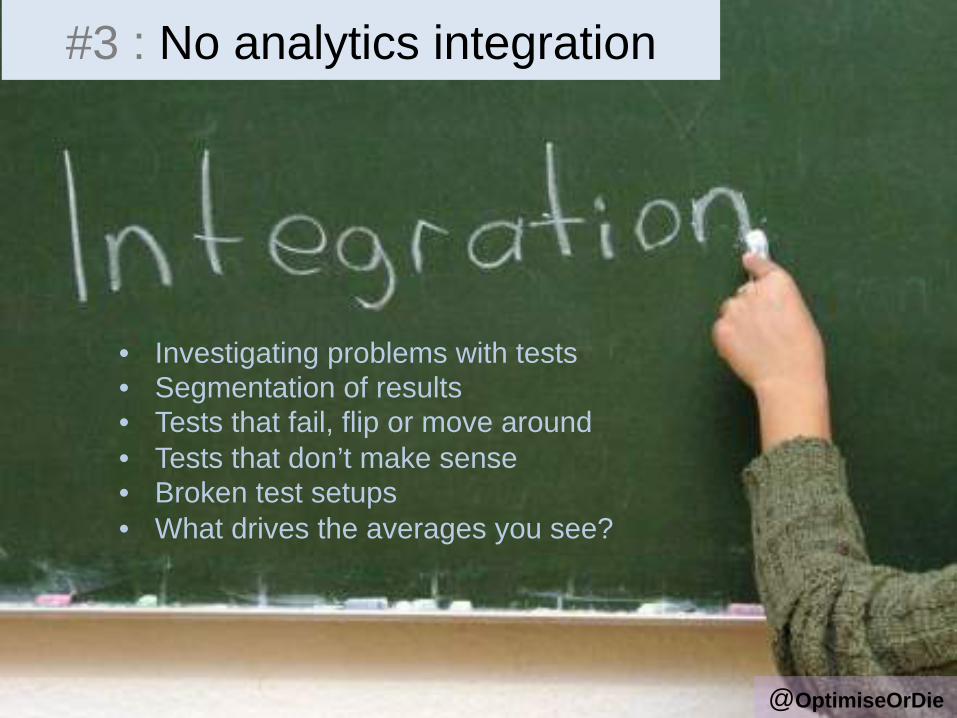
#3 : No analytics integration
• Investigating problems with tests • Segmentation of results • Tests that fail, flip or move around • Tests that don’t make sense • Broken test setups • What drives the averages you see?
@OptimiseOrDie

29
A B B A

These Danish porn sites are so
hardcore!
We’re still waiting for our
AB tests to finish!
• Use a test length calculator like this one: • visualwebsiteoptimizer.com/ab-split-test-duration/
#4 : The test will finish after you die

@OptimiseOrDie
#5 : You get false results

The 95% Stopping Problem
• Many people use 95, 99% ‘confidence’ to stop • This value is unreliable • Read this Nature article : bit.ly/1dwk0if
• You can hit 95% early in a test • If you stop, it could be a false positive • Tools need to be smarter about inference
• This 95% thingy – it’s last on your list for reasons to stop testing
• Let me explain
@OptimiseOrDie

#5 : When to stop • Self stopping is a huge problem:
– “I stopped the test when it looked good” – “It hit 20% on Thursday, so I figured – Bme to cut and run” – “We need test Bme for something else. Looks good to us” – “We’ve got a big sample now so why not finish it today?”
• False Posi.ves and Nega.ves – If you cut part of a business cycle, you bias the segments you have in
the test. – So if you ignore weekend shoppers by stopping your test on Friday,
that will affect results – The other problems is FALSE POSITIVES and FALSE NEGATIVES
@OptimiseOrDie

#5 : When to stop
@OptimiseOrDie
Scenario 1 Scenario 2 Scenario 3 Scenario 4 A"er 200 observa-ons Insignificant Insignificant Significant! Significant!
A"er 500 observa-ons Insignificant Significant! Insignificant Significant!
End of experiment Insignificant Significant! Insignificant Significant!
Scenario 1 Scenario 2 Scenario 3 Scenario 4 A"er 200 observa-ons Insignificant Insignificant Significant! Significant!
A"er 500 observa-ons Insignificant Significant! trial stopped trial stopped
End of experiment Insignificant Significant! Significant! Significant!

@OptimiseOrDie
The 95% Stopping Problem

The 95% Stopping Problem
@OptimiseOrDie

The 95% Stopping Problem
@OptimiseOrDie abtestguide.com/calc/

62.5cm +/- 1cm
@OptimiseOrDie
9.1% ± 0.5
9.3% ± 0.5
9.1% ± 0.2
9.3% ± 0.2
9.1% ± 0.1
9.3% ± 0.1

Graph is a range, not a line:
9.1 ± 0.3% 9.1 ± 0.9% 9.1 ± 1.9%

“You should know that stopping a test once it’s significant is deadly sin number 1 in A/B testing land. 77% of A/A tests (testing the same thing as A and B) will reach significance at a certain point.”
Ton Wesseling, Online Dialogue “I always tell people that you need a representative sample if your data needs to be valid. What does ‘representative’ mean? First of all you need to include all the weekdays and weekends. You need different weather, because it impacts buyer behaviour. But most important: Your traffic needs to have all traffic sources, especially newsletter, special campaigns, TV,… everything! The longer the test runs, the more insights you get.
Andre Morys, Web Arts
The 95% Stopping Problem

“Statistical Significance does not equal Validity” http://bit.ly/1wMfmY2 “Why every Internet Marketer should be a Statistician” http://bit.ly/1wMfs1G “Understanding the Cycles in your site” http://mklnd.com/1pGSOUP
Three Articles you MUST read

Business & Purchase Cycles
@OptimiseOrDie
• Customers change • Your traffic mix changes • Markets, competitors • Be aware of all the waves • Always test whole cycles • Minimum 2 cycles (wk/mo) • Don’t exclude slower buyers
Start Test Finish Avg Cycle

When to stop? • MINIMUM two business cycles (week/mo.) • MINIMUM of 1 purchase cycle
• MINIMUM 250 outcomes/conversions per creative • MORE if relative difference is low
• ALWAYS test full weeks
• KNOW what marketing and cycles are doing • RUN a test length calculator - bit.ly/XqCxuu
• SET your test run time • Run it
• Stop it • Analyse the data
• When do I run over? Not enough data…
@OptimiseOrDie

44
#6 : You peek too early!

#6 : The early stages of a test… • Ignore the graphs. Don’t draw conclusions. Don’t dance. Calm down. • Get a feel for the test but don’t do anything yet! • Remember – in A/B -‐ 50% of returning visitors will see a new shiny website! • UnBl your test has had at least 2 business cycles and 250+ outcomes, don’t bother
even gewng remotely excited! • Watching regularly is good though. You’re looking for anything that looks really
odd – if everyone is looking (but not concluding) then oddiBes will get spoIed. • All tests move around or show big swings early in the tesBng cycle. Here is a very
high traffic site – it sBll takes 10 days to start seIling. Lower traffic sites will stretch this period further.
45

#7 : No QA testing for the AB test?

#7 – BIG SECRET! • Over 40% of tests have had QA issues. • Over £20M in browser conversion issues!
Browser tesBng www.crossbrowsertesting.com
www.browserstack.com www.spoon.net
www.cloudtesting.com
www.multibrowserviewer.com
www.saucelabs.com
Tablets & Mobiles www.deviceanywhere.com www.perfectomobile.com
FREE Device lab! www.opendevicelab.com
@OptimiseOrDie

#7 : What other QA testing should I do?
• TesBng from several locaBons (office, home, elsewhere) • TesBng the IP filtering is set up • Test tags are firing correctly (analyBcs and the test tool) • Test as a repeat visitor and check session Bmeouts • Cross check figures from 2+ sources • Monitor closely from launch, recheck, watch • WATCH FOR BIAS!
@OptimiseOrDie

#8 : Tests are random and not prioritised
Once you have a list of potential test areas, rank them by opportunity vs. effort. The common ranking metrics that I use include: • Opportunity (revenue, impact) • Dev resource • Time to market • Risk / Complexity
Make yourself a quadrant diagram and plot them

#9 : Velocity or Scope problems
0 6 12 18
Months
Conversion
@OptimiseOrDie

#9 : Widen the optimisation scope
@OptimiseOrDie

#9 : Solutions • Give Priority Boarding for opportunities
– The best seats reserved for metric shifters
• Release more often to close the gap – More testing resource helps, analytics ‘hawk eye’
• Kaizen – continuous improvement – Others call it JFDI (just f***ing do it)
• Make changes AS WELL as tests, basically! – These small things add up as well as compounding effort
• Run simultaneous tests – With analytics integration, decoding this becomes easy
• Online Hair Booking – over 100 tiny tweaks – No functional changes at all – 37% improvement
• Completed in-between product releases – The added lift for 10 days work, worth 360k
@OptimiseOrDie

53
#11 : Your test fails
@OptimiseOrDie
#11: Your test fails • Learn from the failure! If you can’t learn from the failure,
you’ve designed a crap test. • Next Bme you design, imagine all your stuff failing. What would
you do? If you don’t know or you’re not sure, get it changed so that a negaBve becomes insigh{ul.
• So : failure itself at a creaBve or variable level should tell you something.
• On a failed test, always analyse the segmentaBon and analyBcs • One or more segments will be over and under • Check for varied performance • Now add the failure info to your Knowledge Base: • Look at it carefully – what does the failure tell you? Which
element do you think drove the failure? • If you know what failed (e.g. making the price bigger) then you
have very useful informaBon • You turned the handle the wrong way • Now brainstorm a new test
@OptimiseOrDie

#12 : The test is ‘about the same’ • Analyse the segmentaBon • Check the analyBcs and instrumentaBon • One or more segments may be over and under • They may be cancelling out – the average is a lie • The segment level performance will help you (beware of
small sample sizes) • If you genuinely have a test which failed to move any
segments, it’s a crap test – be bolder • This usually happens when it isn’t bold or brave enough in
shi\ing away from the original design, parBcularly on lower traffic sites
• Get tesBng again!
@OptimiseOrDie

• There are three reasons it is moving around – Your sample size (outcomes) is sBll too small – The external traffic mix, customers or reacBon has
suddenly changed or – Your inbound markeBng driven traffic mix is
completely volaBle (very rare)
• Check the sample size • Check all your markeBng acBvity • Check the instrumentaBon • If no reason, check segmentaBon
#13 : The test keeps moving around
@OptimiseOrDie

• Something like this can happen:
• Check your sample size. If it’s still small, then expect this until the test settles. • If the test does genuinely flip – and quite severely – then something has changed with
the traffic mix, the customer base or your advertising. Maybe the PPC budget ran out? Seriously!
• To analyse a flipped test, you’ll need to check your segmented data. This is why you have a split testing package AND an analytics system.
• The segmented data will help you to identify the source of the shift in response to your test. I rarely get a flipped one and it’s always something changing on me, without being told. The heartless bastards.
#14 : The test has flipped on me

• No – and this is why: – It’s a waste of Bme – It’s easier to test and monitor instead – You are eaBng into test Bme – Also applies to A/A/B/B tesBng – A/B/A running at 25%/50%/25% is the best
• Read my post here : hIp://bit.ly/WcI9EZ
58
#15 : Should I run an A/A test first

#16 : Nobody feels the test
• You promised a 25% rise in checkouts -‐ you only see 2% • Traffic, AdverBsing, MarkeBng may have changed • Check they’re using the same precise metrics • Run a calibraBon exercise • I o\en leave a 5 or 10% stub running in a test • This tracks old creaBve once new one goes live • If conversion is also down for that one, BINGO! • Remember – the AB test is an esBmate – it doesn’t
precisely record future performance • This is why infrequent tesBng is bad • Always be trying a new test instead of basking in the
glory of one you ran 6 months ago. You’re only as good as your next test.
@OptimiseOrDie
#17 : You forgot about Mobile & Tablet
• If you’re AB tesBng a responsive site, pay aIenBon • Content will break differently on many screens • Know thy users and their devices • Use bango or google analyBcs to define a test list • Make sure you test mobile devices & viewports • What looks good on your desk may not be for the user • Harder to design cross device tests • You’ll need to segment mobile, tablet & desktop response
in the analyBcs or AB tesBng package • Your personal phone is not a device mix • Ask me about making your device list • Buy core devices, rent the rest from deviceanywhere.com
@OptimiseOrDie

• If small volumes, contact customers – reach out. • If data volumes aren’t there, there are sBll customers! • Drive design from levers you can apply – game the system • Pick clean and simple clusters of change (hypothesis driven) • Use a goal at an earlier ring stage or funnel step • Beware of using clickthroughs when aIriBon is high on the
other side • Try before and a\er tesBng on idenBcal Bme periods
(measure in analyBcs model) • Be careful about small sample sizes (<100 outcomes) • Are you working automated emails? • Fix JFDI, performance and UX issues too!
#18 : Oh shit – no traffic
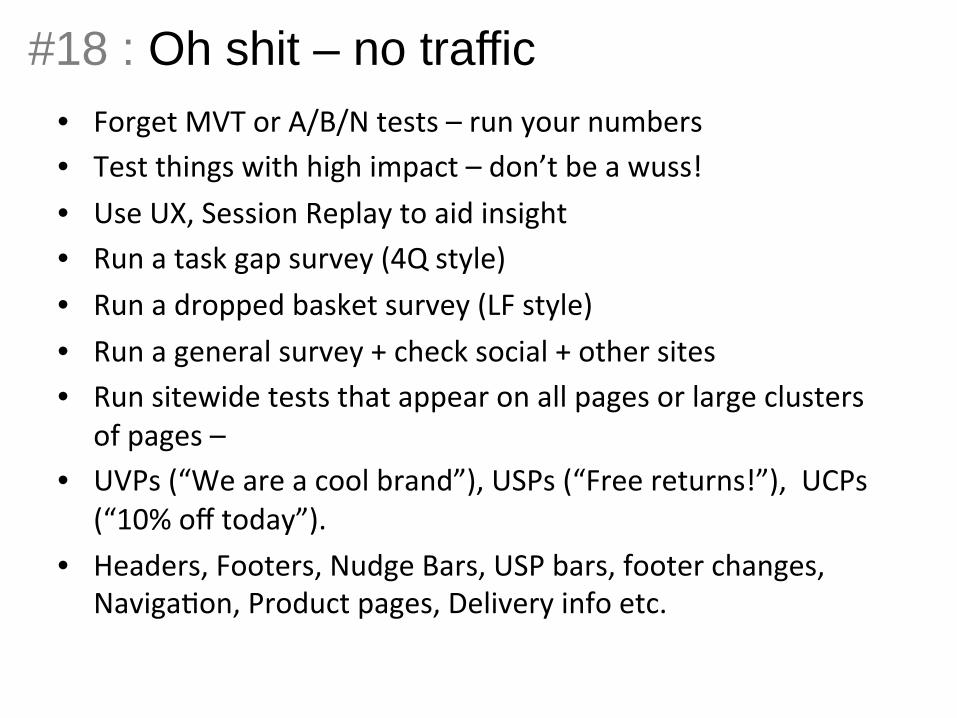
• Forget MVT or A/B/N tests – run your numbers • Test things with high impact – don’t be a wuss! • Use UX, Session Replay to aid insight • Run a task gap survey (4Q style) • Run a dropped basket survey (LF style) • Run a general survey + check social + other sites • Run sitewide tests that appear on all pages or large clusters
of pages – • UVPs (“We are a cool brand”), USPs (“Free returns!”), UCPs
(“10% off today”). • Headers, Footers, Nudge Bars, USP bars, footer changes,
NavigaBon, Product pages, Delivery info etc.
#18 : Oh shit – no traffic
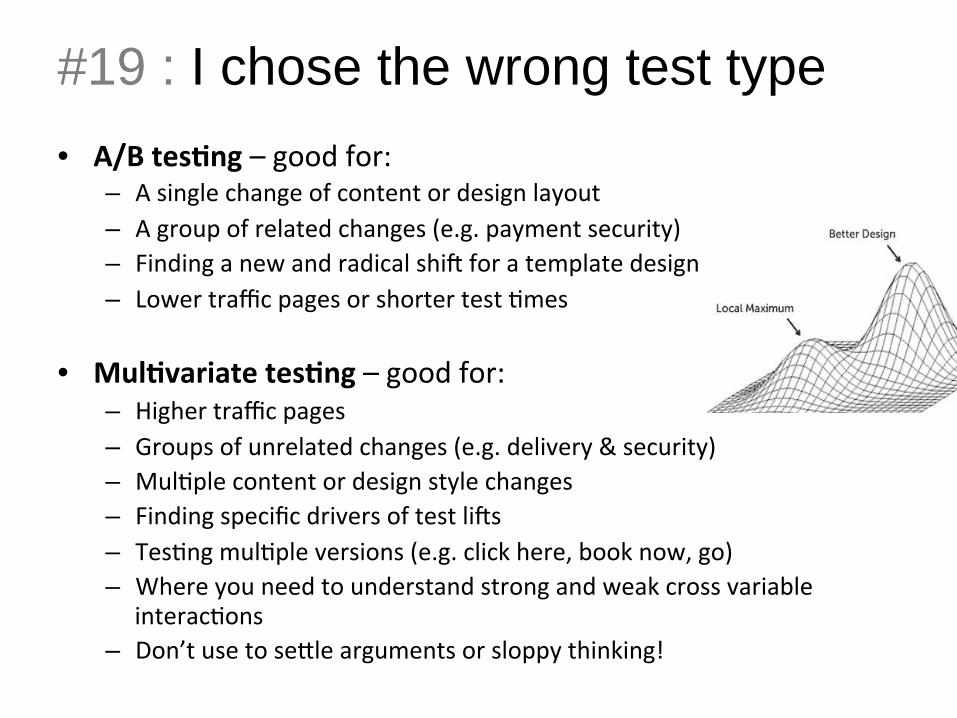
#19 : I chose the wrong test type
• A/B tes.ng – good for: – A single change of content or design layout – A group of related changes (e.g. payment security) – Finding a new and radical shi\ for a template design – Lower traffic pages or shorter test Bmes
• Mul.variate tes.ng – good for: – Higher traffic pages – Groups of unrelated changes (e.g. delivery & security) – MulBple content or design style changes – Finding specific drivers of test li\s – TesBng mulBple versions (e.g. click here, book now, go) – Where you need to understand strong and weak cross variable
interacBons – Don’t use to seIle arguments or sloppy thinking!
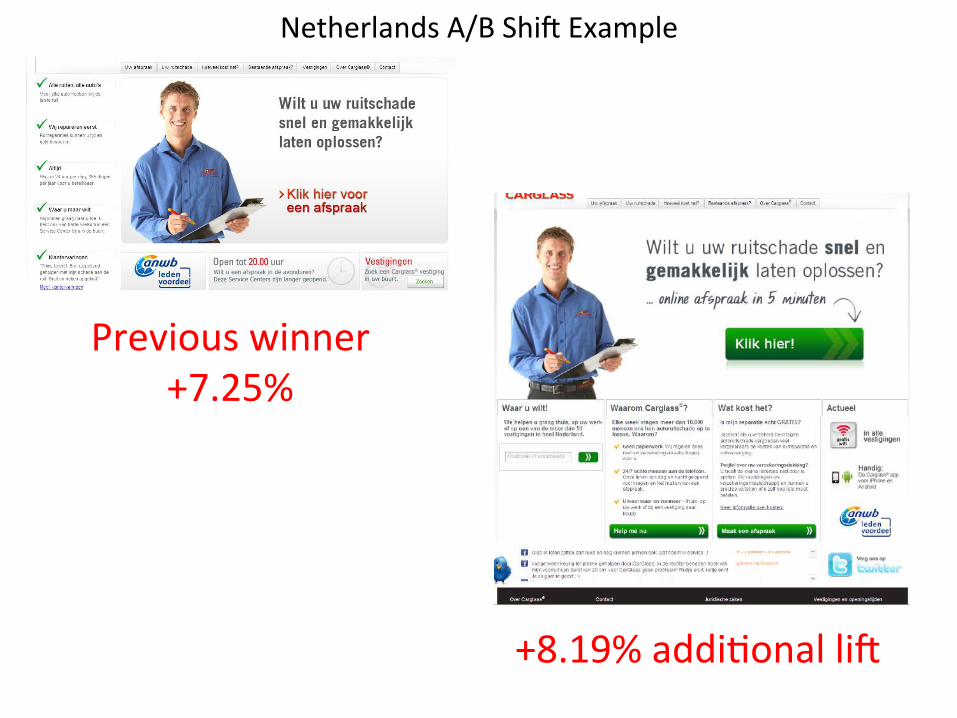
Netherlands A/B Shi\ Example
Previous winner +7.25%
+8.19% addiBonal li\

#20 – Other flavours of tes.ng • Micro tes.ng (.ny change) – good for:
– Proving to the boss that tesBng works – DemonstraBng to IT that it works without impact – Showing the impact of a seemingly Bny change – Proof of concept before larger test
• Funnel tes.ng – good for: – Checkouts – Lead gen – Forms processes – QuotaBons – Any mulB-‐step process with data entry
• Fake it and Build it – good for: – TesBng new business ideas – Trying out promoBons on a test sample – EsBmaBng impact before you build – Helps you calculate ROI – You can even split test enBre server farms
Vs.

#20 – Other flavours of tes.ng
“Congratulations! Today you’re the lucky winner of our random awards programme. You get all these extra features for free, on us. Enjoy.”

Top F***ups for 2014 1. TesBng in the wrong place 2. Your hypothesis inputs are crap 3. No analyBcs integraBon 4. Your test will finish a\er you die 5. You don’t test for long enough 6. You peek before it’s ready 7. No QA for your split test 8. OpportuniBes are not prioriBsed 9. TesBng cycles are too slow 10. You don’t know when tests are ready 11. Your test fails 12. The test is ‘about the same’ 13. Test flips behaviour 14. Test keeps moving around 15. You run an A/A test and waste Bme 16. Nobody ‘feels’ the test 17. You forgot you were responsive 18. You forgot you had no traffic 19. You ran the wrong test type 20. You didn’t try all the flavours of tesBng
@OptimiseOrDie

WE’RE ALL WINGING IT

2004 Headspace
What I thought I knew in 2004
Reality

2014 Headspace
What I know I know
On a good day

Guessaholics Anonymous

Rumsfeldian Space
@OptimiseOrDie
Rumsfeldian Space
@OptimiseOrDie

The 5 Legged Optimisation Barstool @OptimiseOrDie
#1 Smart Talented Polymath People
Flexible and Agile teams

@OptimiseOrDie
Fittest? Agile!

@OptimiseOrDie
#2 : Analytics Investment (tools, people, dev time)

@OptimiseOrDie
#3 : User research and insight

@OptimiseOrDie
#3 : THE BEST IDEAS COME FROM?

“On the average, five times as many people read the headline as read the body copy. When you have written your headline, you have spent eighty cents out of your dollar.”
David Ogilvy “In 9 years and 40M split tests with visitors, the majority of my testing success came from playing with the words.” @OptimiseOrDie
#4 : GREAT COPYWRITING

“Would you like to…” “I would like to...” http://www.theguardian.com/info/developer-blog/2013/jan/02/interactive-button-text-grammar Use the WYLTIWLT test for button copy!
#4 : COPYWRITING TIP

• Google Content Experiments bit.ly/Ljg7Ds
• Optimizely www.optimizely.com
• Visual Website Optimizer www.visualwebsiteoptimizer.com
• Multi Armed Bandit Explanation bit.ly/Xa80O8
• New Machine Learning Tools www.conductrics.com
www.rekko.com
@OptimiseOrDie
#5 : Split Testing Tools

@OptimiseOrDie
#1 Culture & Team #2 Toolkit & Analytics investment #3 UX, CX, Service Design, Insight #4 Persuasive Copywriting #5 Experimentation (testing) tools
The 5 Legged Optimisation Barstool

READ STUFF
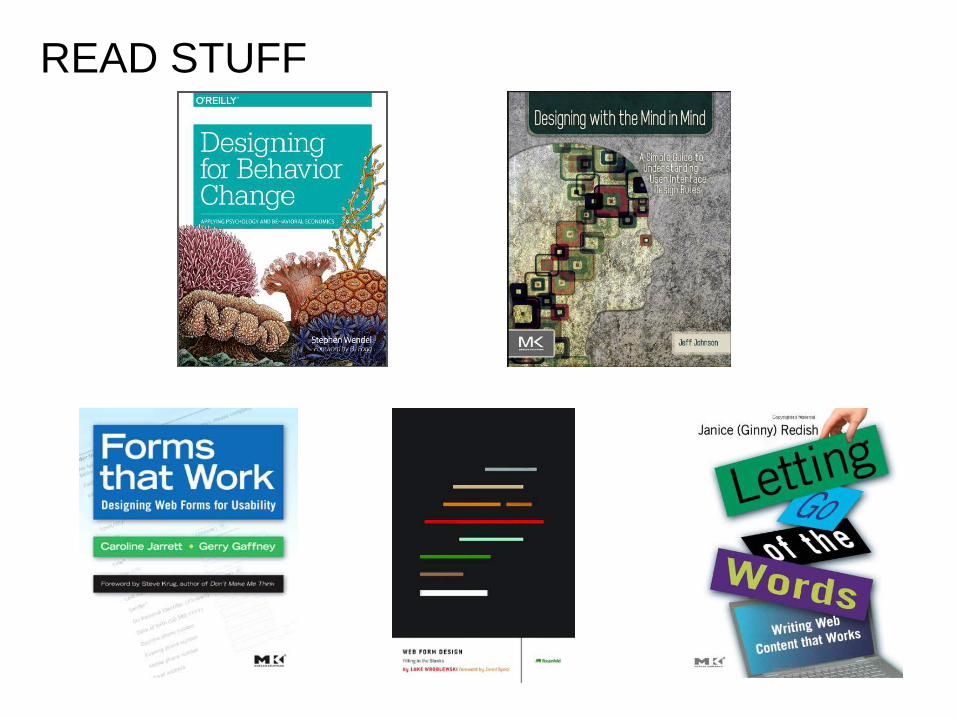
READ STUFF

READ STUFF

#5 : FIND STUFF
@OptimiseOrDie
@danbarker Analytics @fastbloke Analytics @timlb Analytics @jamesgurd Analytics @therustybear Analytics @carmenmardiros Analytics @davechaffey Analytics @priteshpatel9 Analytics @cutroni Analytics @avinash Analytics @Aschottmuller Analytics, CRO @cartmetrix Analytics, CRO @Kissmetrics CRO / UX @Unbounce CRO / UX @Morys CRO / Neuro @UXFeeds UX / Neuro @Psyblog Neuro @Gfiorelli1 SEO / Analytics
@PeepLaja CRO @TheGrok CRO @UIE UX @LukeW UX / Forms @cjforms UX / Forms @axbom UX @iatv UX @Chudders Photo UX @JeffreyGroks Innovation @StephanieRieger Innovation @BrianSolis Innovation @DrEscotet Neuro @TheBrainLady Neuro @RogerDooley Neuro @Cugelman Neuro @Smashingmag Dev / UX @uxmag UX @Webtrends UX / CRO

#5 : LEARN STUFF
@OptimiseOrDie
Baymard.com Lukew.com Smashingmagazine.com ConversionXL.com Medium.com Whichtestwon.com Unbounce.com Measuringusability.com RogerDooley.com Kissmetrics.com Uxmatters.com Smartinsights.com Econsultancy.com Cutroni.com
www.GetMentalNotes.com

#12 : The Best Companies…
• Invest con.nually in analyBcs instrumentaBon, tools, people • Use an Agile, itera.ve, cross-‐silo, one team project culture • Prefer collabora.ve tools to having lots of meeBngs • Priori.se development based on numbers and insight • PracBce real con.nuous product improvement, not SLEDD*
• Are fixing bugs, cru\, bad stuff as well as opBmising • Source photos and content that support persuasion and
uBlity • Have cross channel, cross device design, tesBng and QA • Segment their data for valuable insights, every test or change • Con.nually reduce cycle (iteraBon) Bme in their process • Blend ‘long’ design, conBnuous improvement AND split tests • Make op.misa.on the engine of change, not the slave of ego * Single Large Expensive Doomed Developments

THE FUTURE OF TESTING
Get your quesBons in!
@OptimiseOrDie
Mail : [email protected]
Deck : slideshare.com/sullivac
Linkedin : linkd.in/pvrg14