Embed Size (px)
Citation preview
“Active Learning.” Active Learning. N.p., n.d. Web. 14 Apr. 2015. <http://changingminds.org/explanations/learning/active_learning.htm/>.
3M. “Polishing Your Presentation.” (n.d.): n. pag. Web. <http://web.archive.org/web/20001102203936/http:/3m.com/meetingnetwork/files/meet-ingguide_pres.pdf/>.
Lloyd, Ian. “Why Every SEO Strategy Needs Infographics - SEO & Marketing Blog - WMG.” WMG. Web Marketing Group, 12 Feb. 2014. Web. 14 Apr. 2015. <http://www.webmarketinggroup.co.uk/blog/why-every-seo-strategy-needs-infographics/>.
Home School. “Discover Your Learning Style.” Homeschool World. Home School, n.d. Web. 14 Apr. 2015. <http://www.home-school.com/news/discover-your-learning-style.php>.
McCue, TJ. “Why Infographics Rule.” Forbes. Forbes Magazine, n.d. Web. 14 Apr. 2015. <http://www.forbes.com/sites/tjmccue/2013/01/08/what-is-an-infographic-and-ways-to-make-it-go-viral/>.
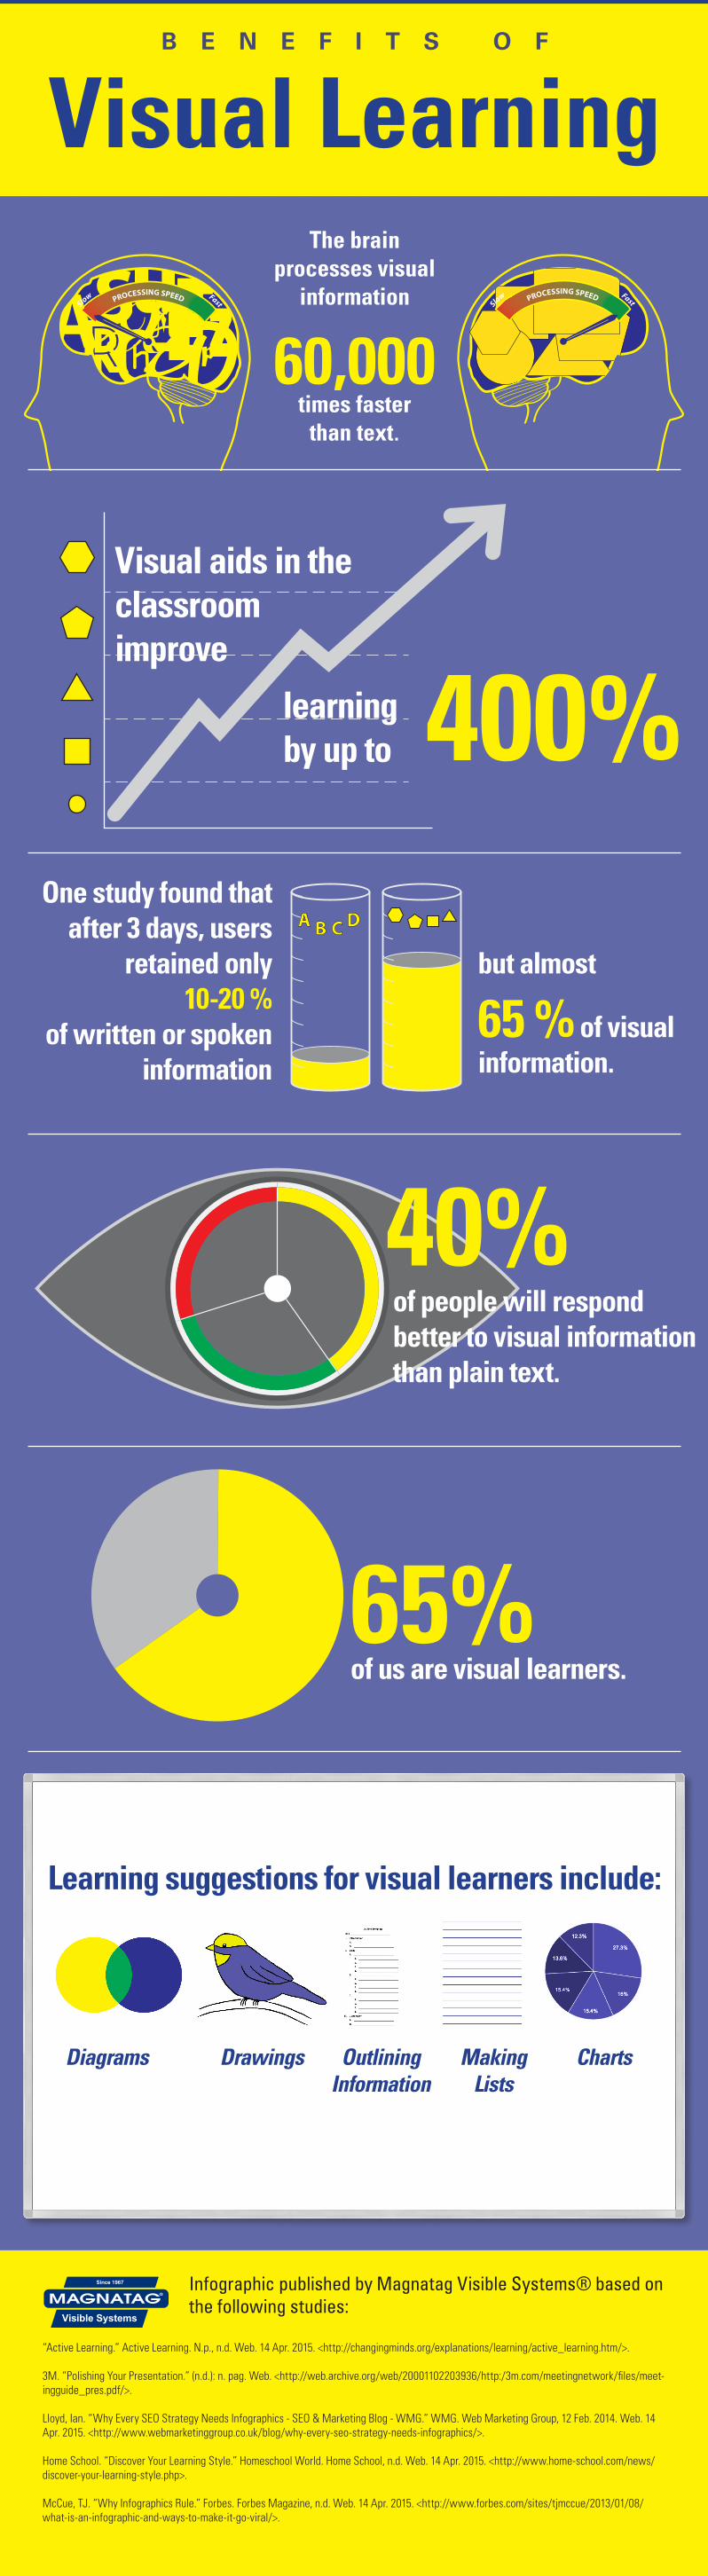
The brain processes visual
information
60,000 times faster
than text.
One study found that after 3 days, users
retained only 10-20 %
of written or spoken information
but almost
65 % of visual information.
40%
Learning suggestions for visual learners include:
of people will respond better to visual information than plain text.
of us are visual learners.
Diagrams Drawings OutliningInformation
MakingLists
Charts
65%
PROCESSING SPEED
Slow Fast Slo
w FastPROCESSING SPEED
Infographic published by Magnatag Visible Systems® based on the following studies:
Since 1967
Visual aids in the classroom improve
learning by up to 400%
B E N E F I T S O F
Visual Learning