Embed Size (px)
Citation preview

6 Challenges Associated with Workforce Management Presented by: Brad Justice August 25, 2016
• Identify the eight main workforce management challenges associated with today’s call center.
• Describe the primary issues that complicate the workforce management process.
• Outline potential solutions and alternatives for addressing some of these challenges and problems.
In this session, you will:
Session Overview

What are your biggest workforce management challenges?
Let’s Take a Vote!
Audience Poll
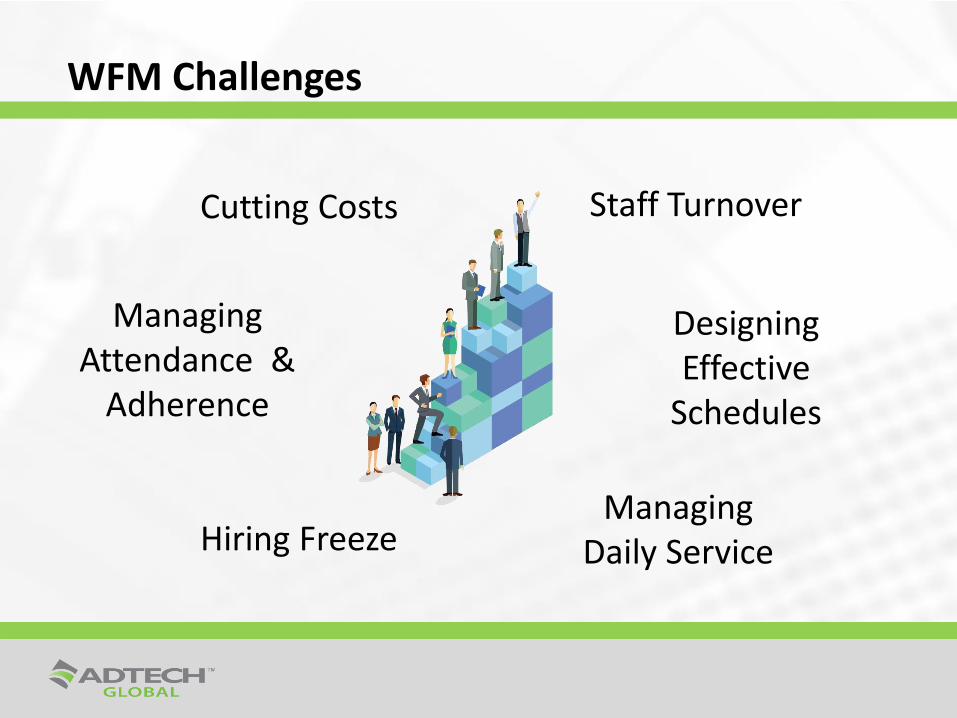
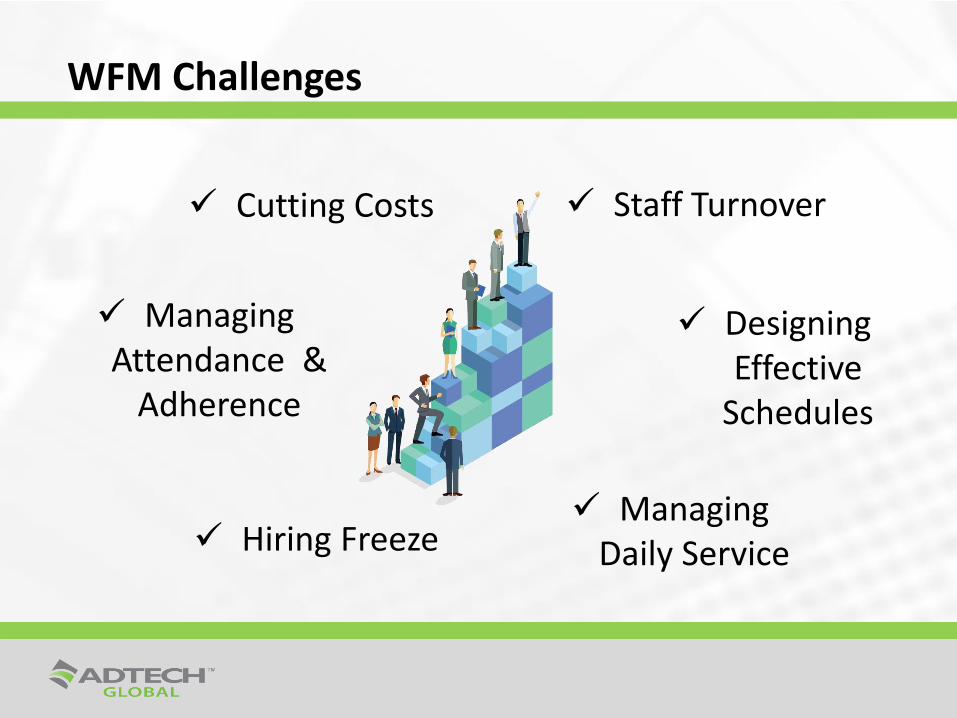
Designing Effective
Schedules
Cutting Costs
Managing Attendance &
Adherence
Managing Daily Service Hiring Freeze
Staff Turnover
WFM Challenges
Challenge #1
Staff Turnover
WFM Challenges
• First day no-shows
• Loss during training
• Competition in local area
• Internal transfers
• Other:
Turnover Challenges
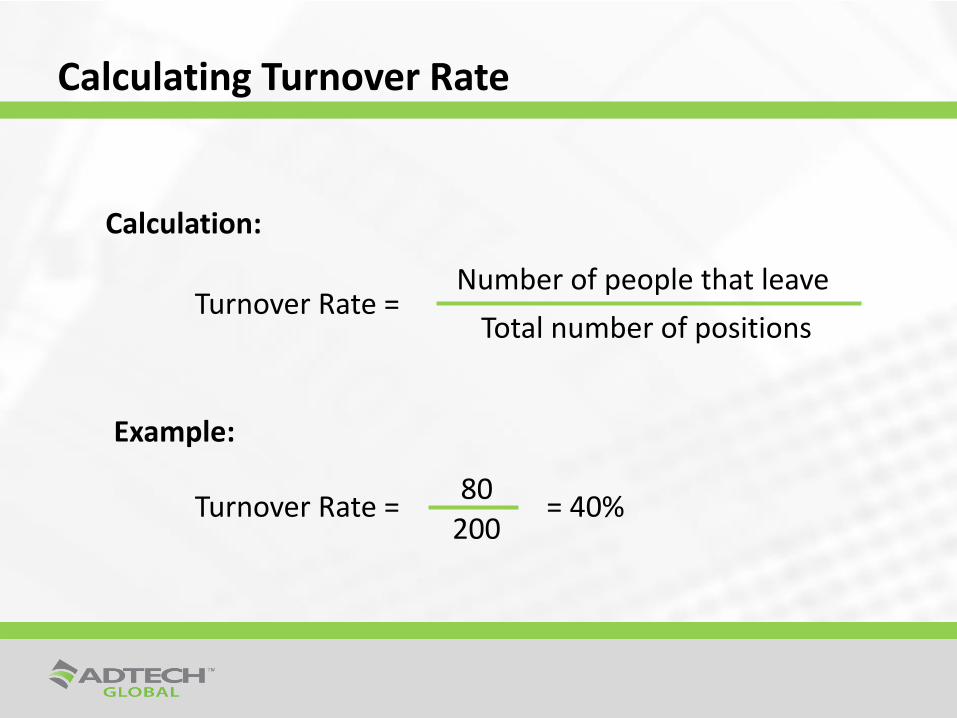
Turnover Rate = = 40% 80
200
Calculation:
Example:
Turnover Rate = Number of people that leave
Total number of positions
Calculating Turnover Rate
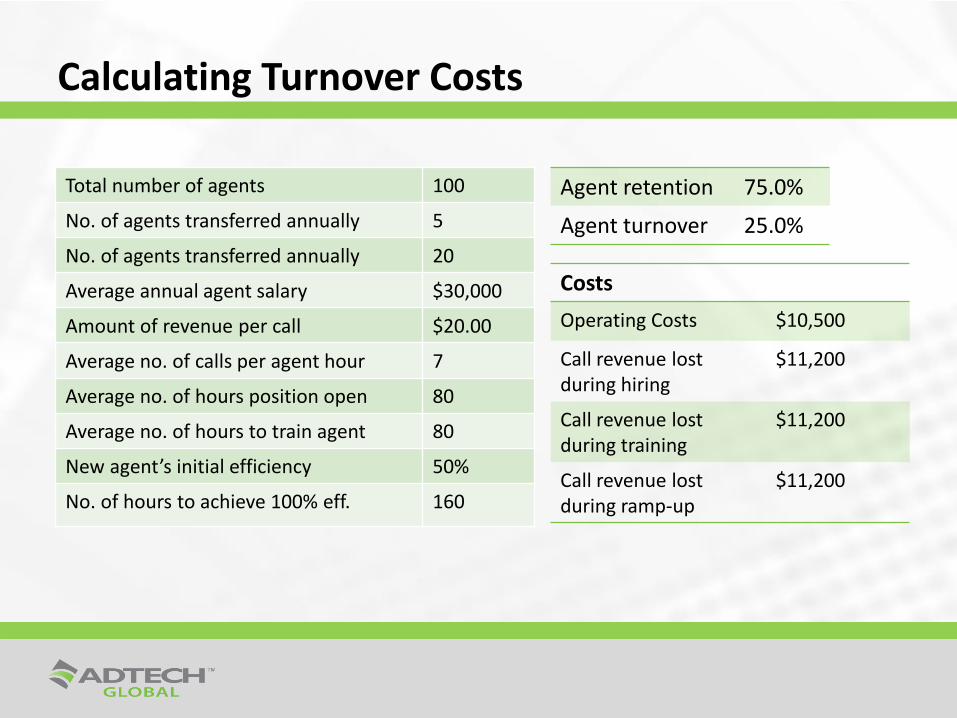
Total number of agents 100
No. of agents transferred annually 5
No. of agents transferred annually 20
Average annual agent salary $30,000
Amount of revenue per call $20.00
Average no. of calls per agent hour 7
Average no. of hours position open 80
Average no. of hours to train agent 80
New agent’s initial efficiency 50%
No. of hours to achieve 100% eff. 160
Agent retention 75.0%
Agent turnover 25.0%
Costs
Operating Costs $10,500
Call revenue lost during hiring
$11,200
Call revenue lost during training
$11,200
Call revenue lost during ramp-up
$11,200
Calculating Turnover Costs
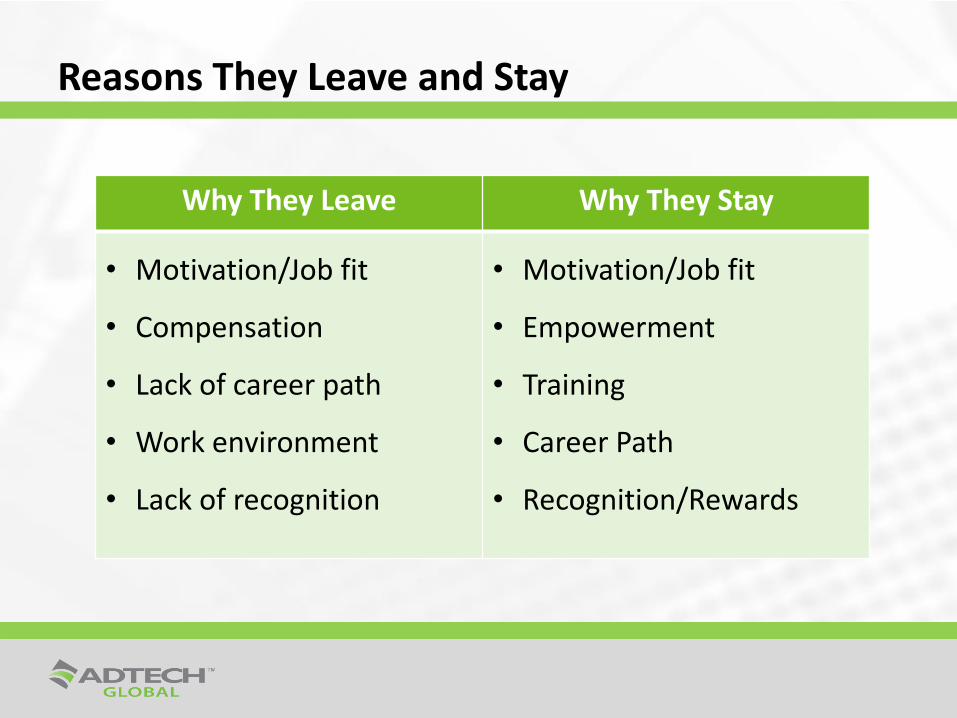
Why They Leave Why They Stay
• Motivation/Job fit
• Compensation
• Lack of career path
• Work environment
• Lack of recognition
• Motivation/Job fit
• Empowerment
• Training
• Career Path
• Recognition/Rewards
Reasons They Leave and Stay
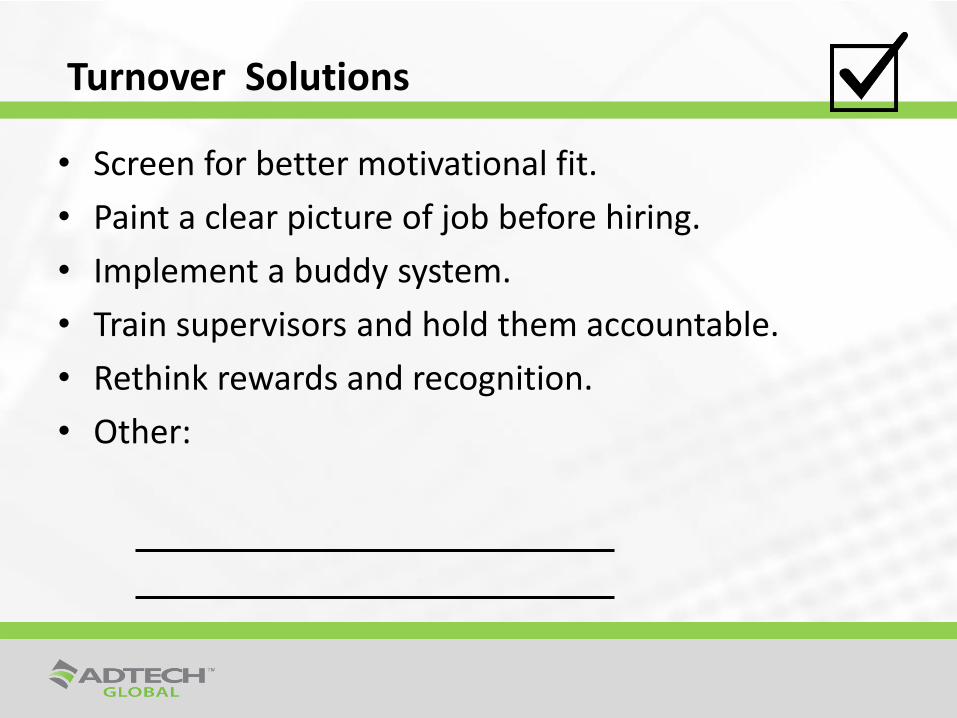
• Screen for better motivational fit.
• Paint a clear picture of job before hiring.
• Implement a buddy system.
• Train supervisors and hold them accountable.
• Rethink rewards and recognition.
• Other:
Turnover Solutions
WFM Challenges
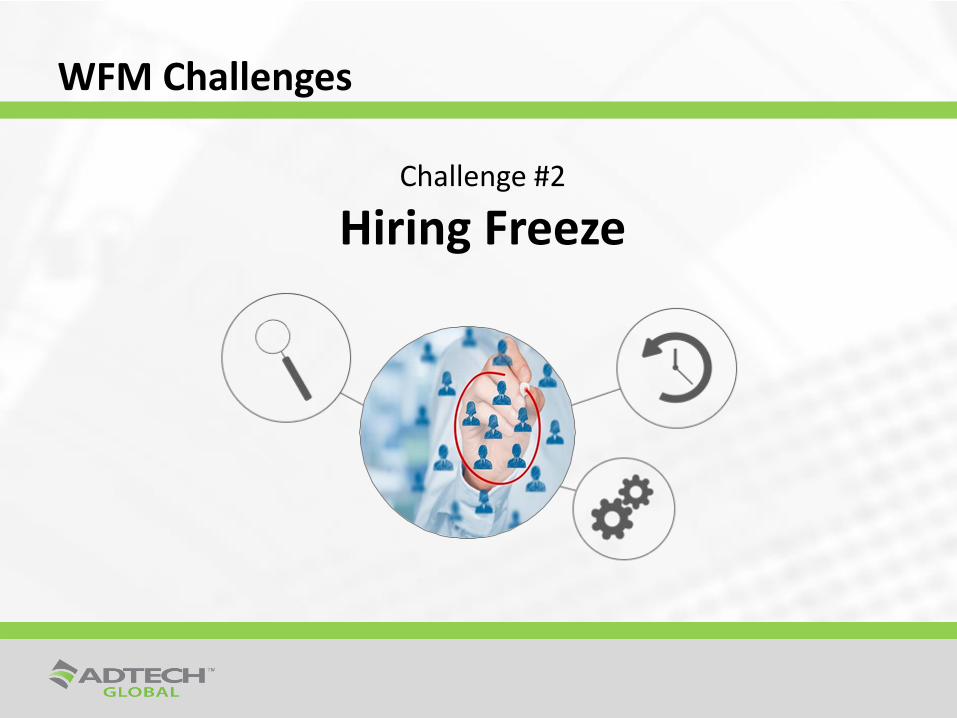
Challenge #2
Hiring Freeze
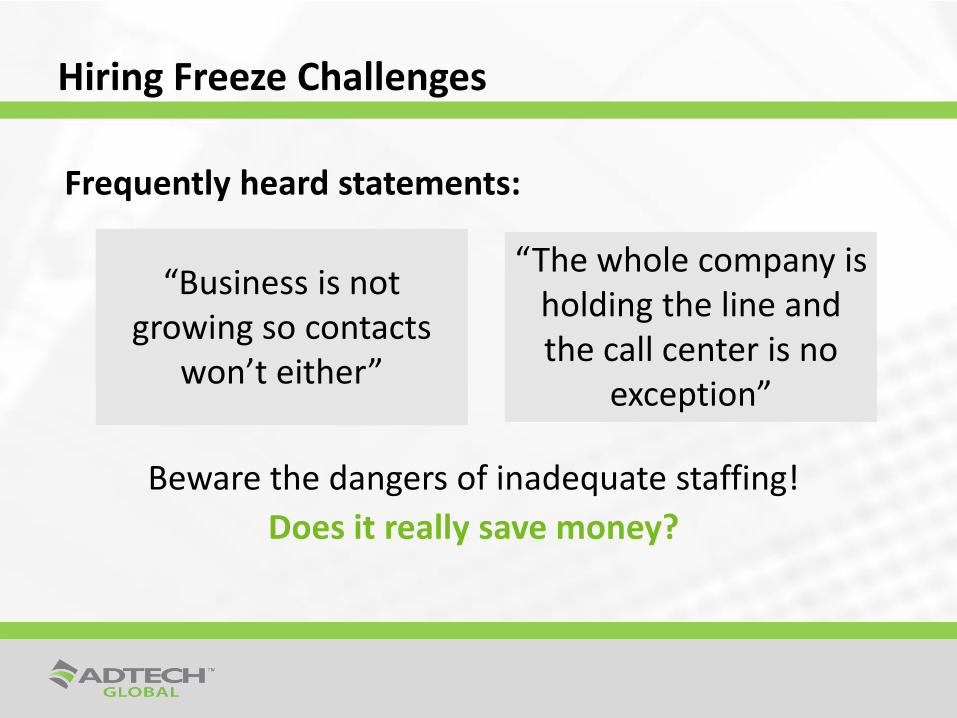
Frequently heard statements:
Beware the dangers of inadequate staffing!
Does it really save money?
“The whole company is holding the line and the call center is no
exception”
“Business is not growing so contacts
won’t either”
Hiring Freeze Challenges
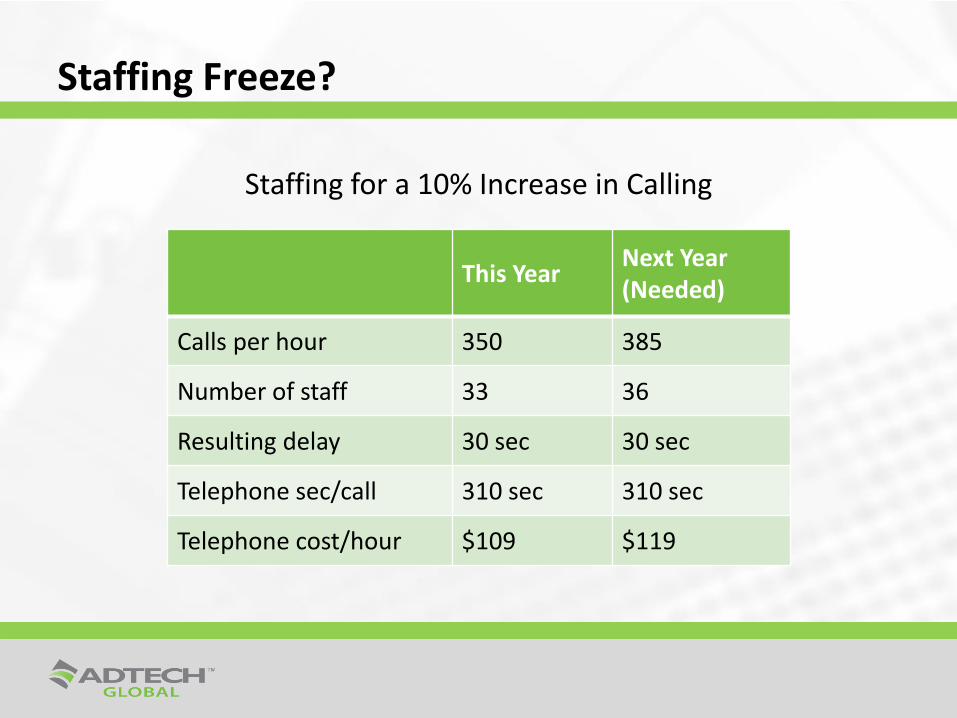
Staffing for a 10% Increase in Calling
This Year Next Year (Needed)
Calls per hour 350 385
Number of staff 33 36
Resulting delay 30 sec 30 sec
Telephone sec/call 310 sec 310 sec
Telephone cost/hour $109 $119
Staffing Freeze?
The Cost of Understanding
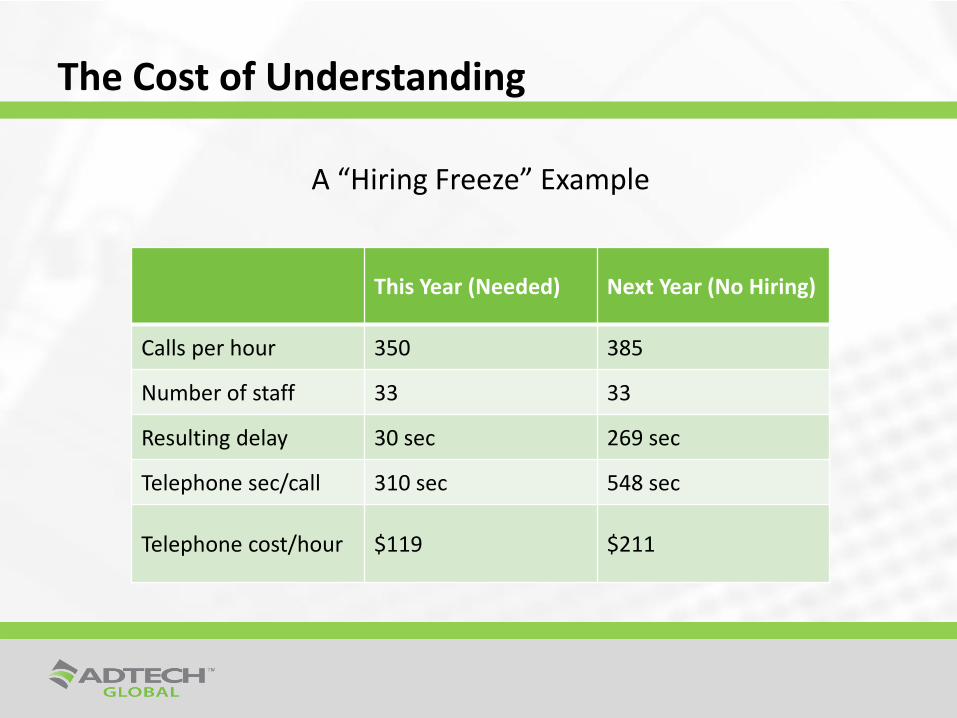
A “Hiring Freeze” Example
This Year (Needed) Next Year (No Hiring)
Calls per hour 350 385
Number of staff 33 33
Resulting delay 30 sec 269 sec
Telephone sec/call 310 sec 548 sec
Telephone cost/hour $119 $211

Staffing Tradeoffs
The Costs of Understaffing
• Increased Telecom Costs
•
•
•
•
•
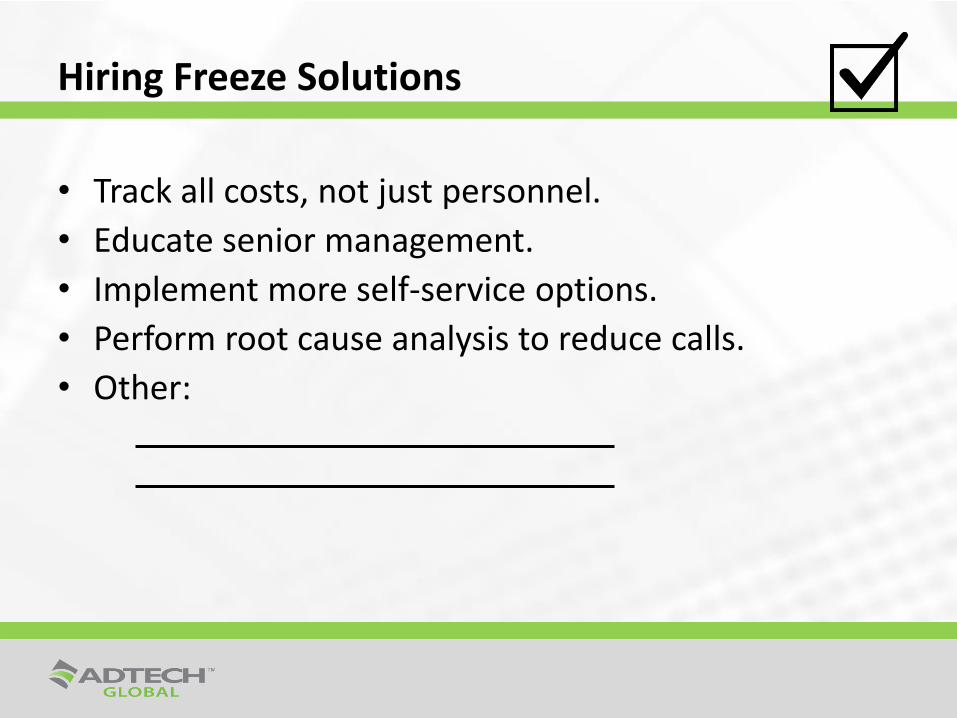
Hiring Freeze Solutions
• Track all costs, not just personnel.
• Educate senior management.
• Implement more self-service options.
• Perform root cause analysis to reduce calls.
• Other:

WFM Challenges
Challenge #3
Cutting Costs
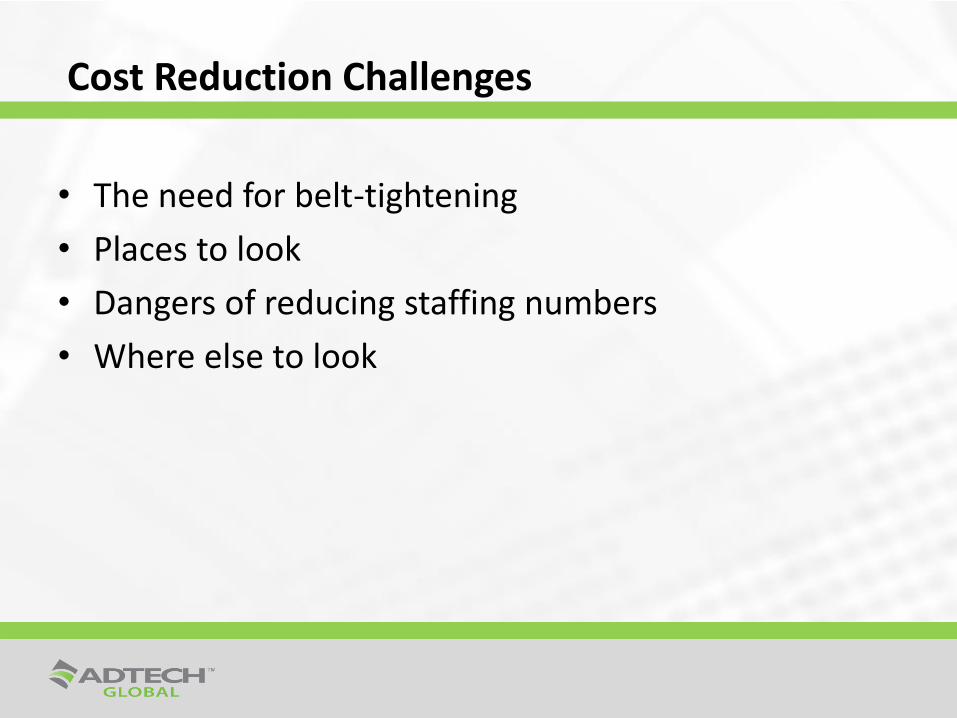
Cost Reduction Challenges
• The need for belt-tightening
• Places to look
• Dangers of reducing staffing numbers
• Where else to look
Cost Cutting Measures
Audience Poll
How many of you been asked to cut costs in your center in the past 12 months?
Cost Cutting Measures
Traditional Cost-Cutting Strategy:
Reduce staff.
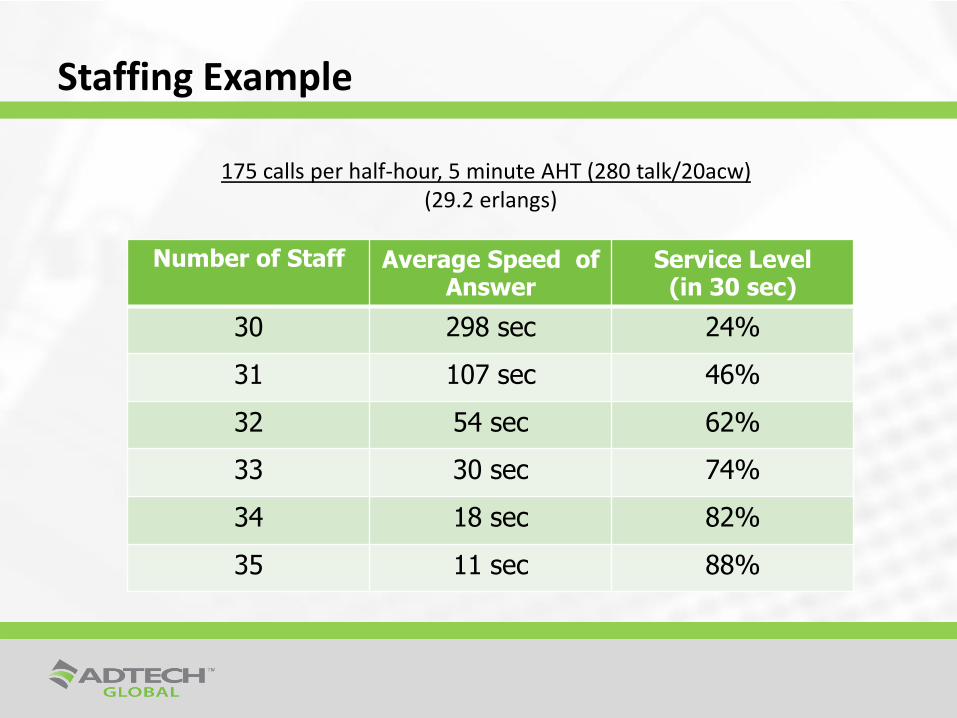
Staffing Example
Number of Staff Average Speed of Answer
Service Level (in 30 sec)
30 298 sec 24%
31 107 sec 46%
32 54 sec 62%
33 30 sec 74%
34 18 sec 82%
35 11 sec 88%
175 calls per half-hour, 5 minute AHT (280 talk/20acw) (29.2 erlangs)
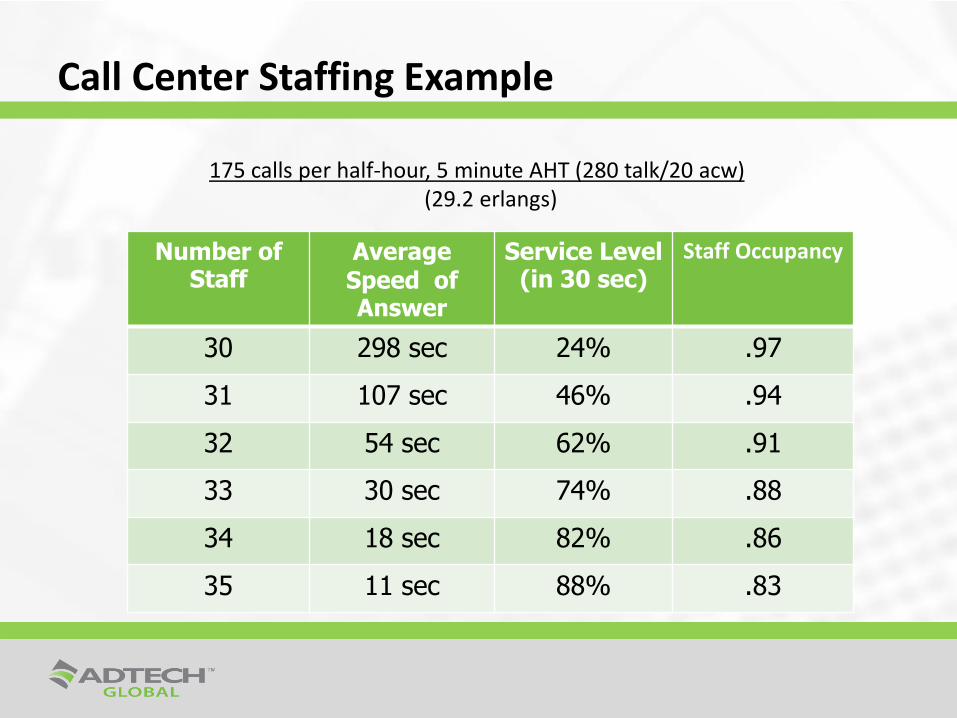
Call Center Staffing Example
175 calls per half-hour, 5 minute AHT (280 talk/20 acw) (29.2 erlangs)
Number of Staff
Average Speed of Answer
Service Level (in 30 sec)
Staff Occupancy
30 298 sec 24% .97
31 107 sec 46% .94
32 54 sec 62% .91
33 30 sec 74% .88
34 18 sec 82% .86
35 11 sec 88% .83
Cost Cutting Measures
Traditional Cost-Cutting Strategy:
• Reduce staff
Better Cost-Cutting Strategies:
• Alter workload
• Utilize technology
• Re-engineer processes
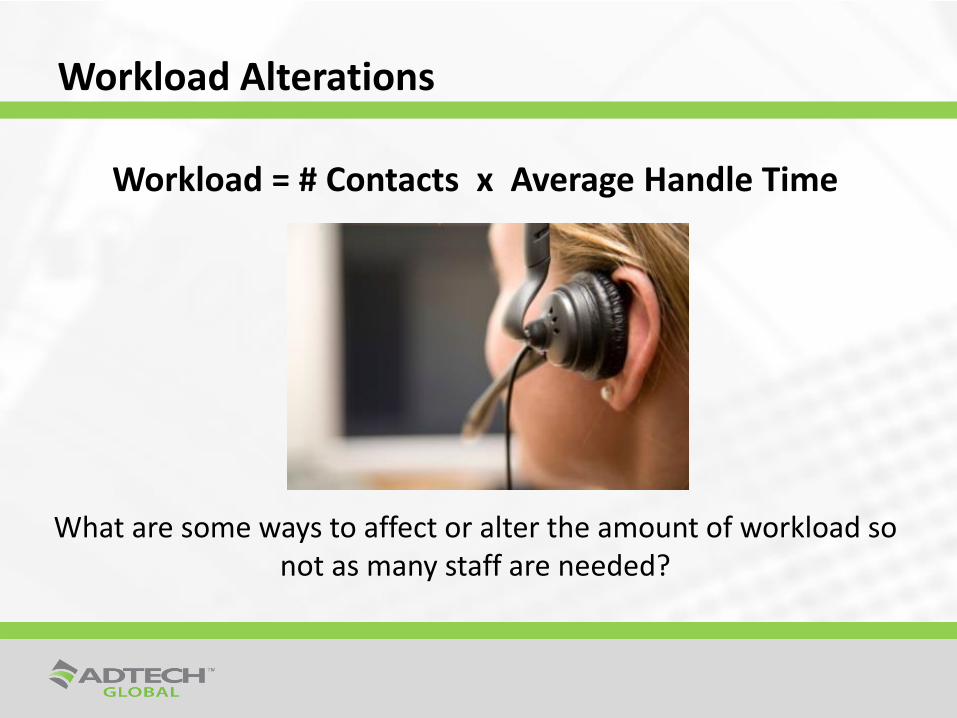
Workload Alterations
What are some ways to affect or alter the amount of workload so not as many staff are needed?
Workload = # Contacts x Average Handle Time

Technology Cost Cutting Measures
Making the Most of Contact Center Technologies
• ACD
• IVR
• CTI
• Contact Management
Process Reengineering
• Re-think some of your support center processes and look for savings opportunities.
– Shrinkage
– Scheduling options
– Hours of operation
– Workload blending
Cost Cutting Solutions
• Re-engineer processes.
• Educate senior management on trade-offs.
• Make better use of existing technology.
• Other:
WFM Challenges
Challenge #4
Managing Attendance and Adherence
Attendance and Adherence Challenges
• Mondays!
• Time off (FMLA, Workers Comp)
• Earned vacation days
• Family friendly policies
• Management enforcement
• Other:
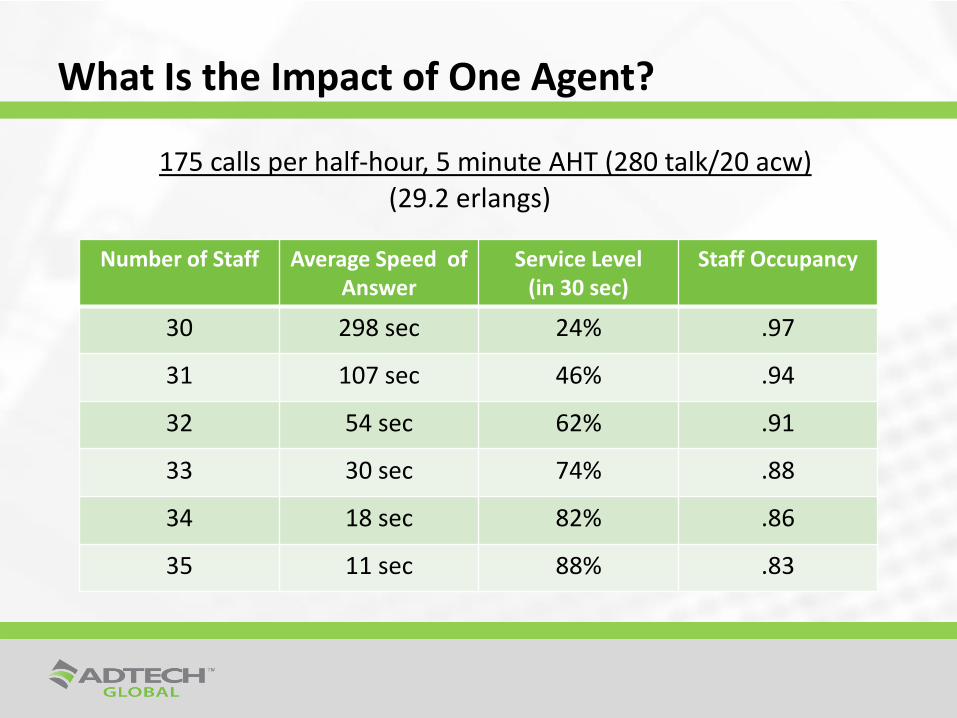
What Is the Impact of One Agent?
175 calls per half-hour, 5 minute AHT (280 talk/20 acw) (29.2 erlangs)
Number of Staff Average Speed of
Answer Service Level
(in 30 sec) Staff Occupancy
30 298 sec 24% .97
31 107 sec 46% .94
32 54 sec 62% .91
33 30 sec 74% .88
34 18 sec 82% .86
35 11 sec 88% .83
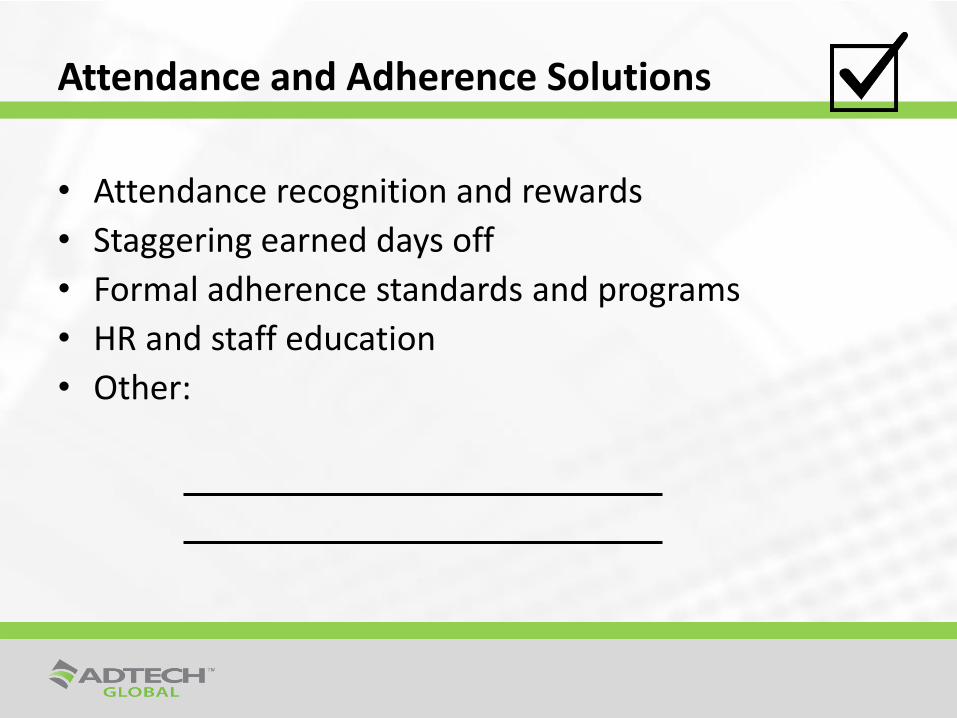
Attendance and Adherence Solutions
• Attendance recognition and rewards
• Staggering earned days off
• Formal adherence standards and programs
• HR and staff education
• Other:

WFM Challenges
Challenge #5
Designing Effective Schedules
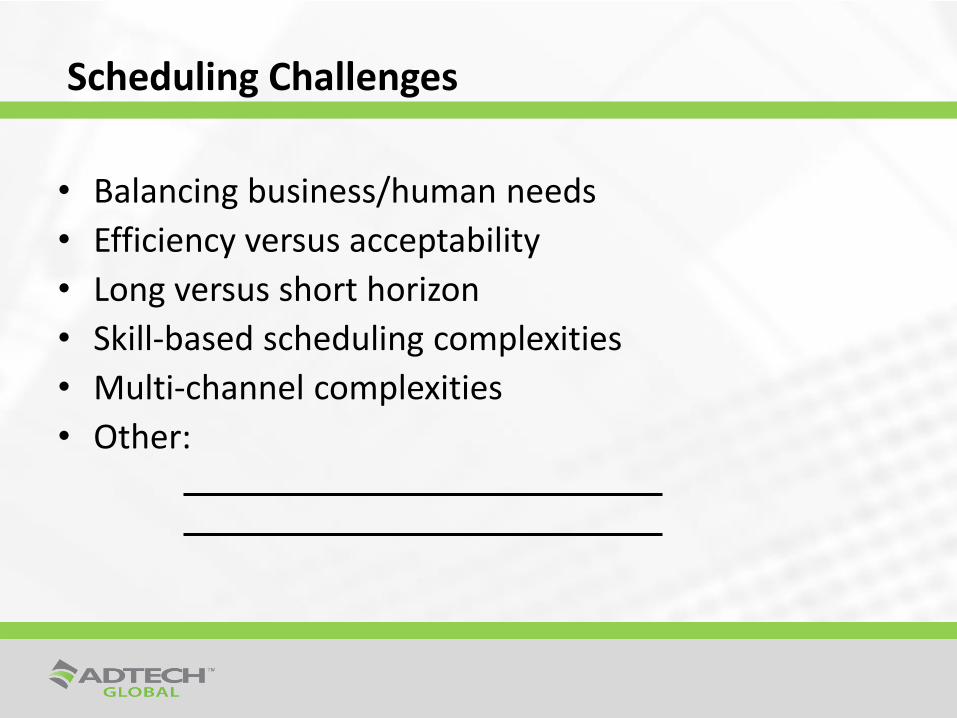
Scheduling Challenges
• Balancing business/human needs
• Efficiency versus acceptability
• Long versus short horizon
• Skill-based scheduling complexities
• Multi-channel complexities
• Other:

Scheduling Strategies
• Full vs part-time mix
• Different shift lengths
• Days on/off mix
• Staggered start times
As you build schedules, try and expand your mix:
Flexibility is the key.
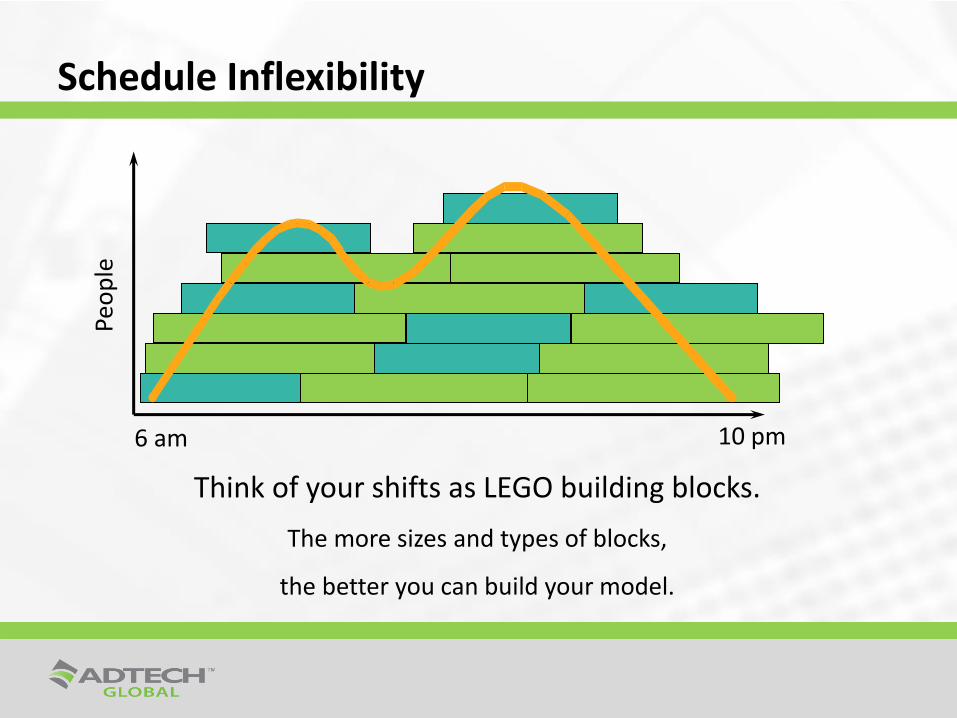
Schedule Inflexibility
6 am 10 pm
Peo
ple
Think of your shifts as LEGO building blocks.
The more sizes and types of blocks,
the better you can build your model.
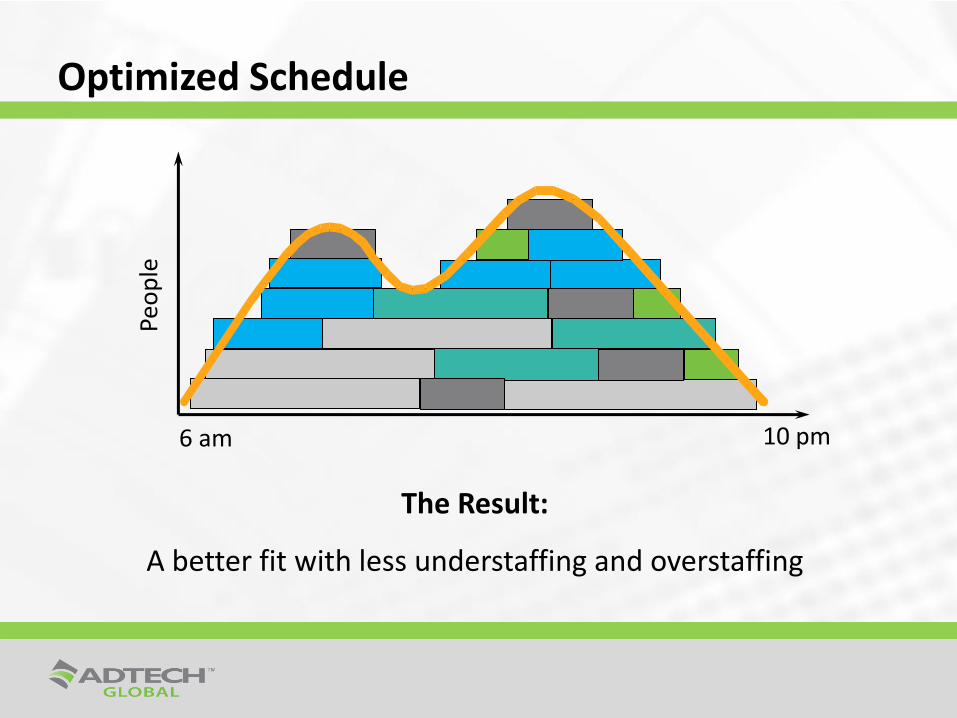
Optimized Schedule
6 am 10 pm
Peo
ple
The Result:
A better fit with less understaffing and overstaffing
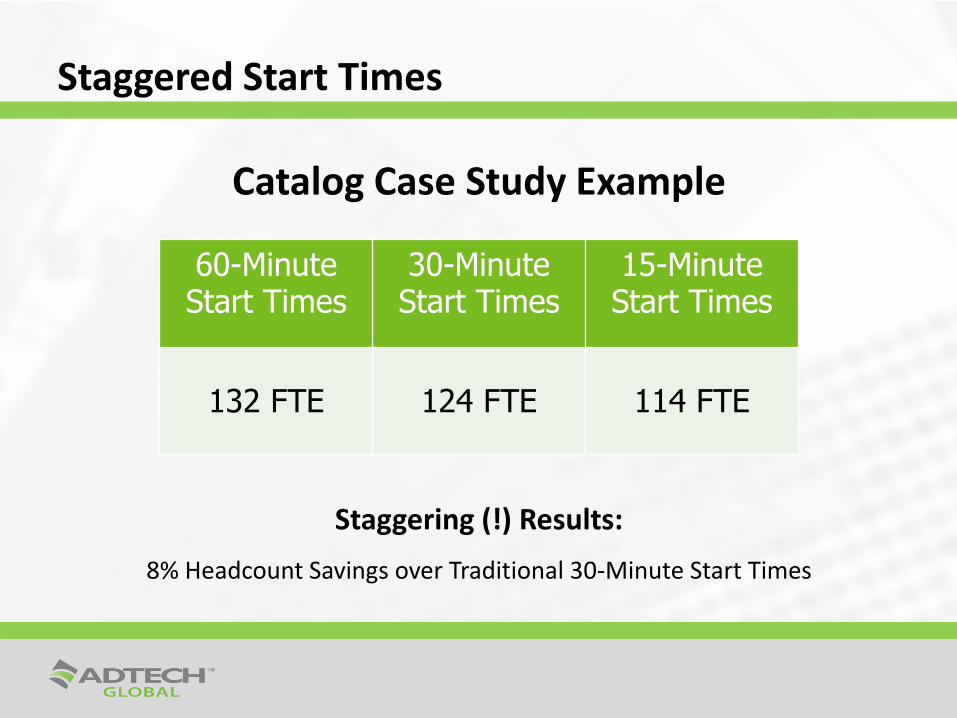
Staggered Start Times
Catalog Case Study Example
Staggering (!) Results:
8% Headcount Savings over Traditional 30-Minute Start Times
60-Minute Start Times
30-Minute Start Times
15-Minute Start Times
132 FTE 124 FTE 114 FTE
Scheduling Solutions
• Implement schedule mix to: – Utilize sufficient part-time staff.
– Expand shift definitions.
– Stagger start times.
• Consider performance-based versus seniority-based schedules.
• Use simulation for complex scenarios.
• Other:
WFM Challenges
Challenge #6
Managing Daily Service and Performance
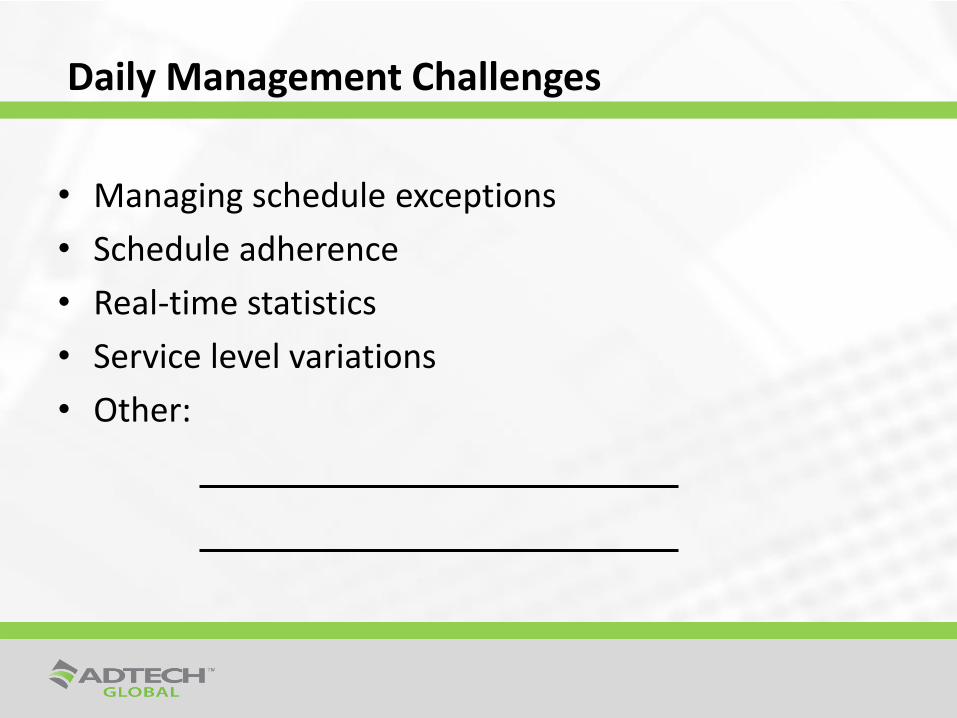
Daily Management Challenges
• Managing schedule exceptions
• Schedule adherence
• Real-time statistics
• Service level variations
• Other:
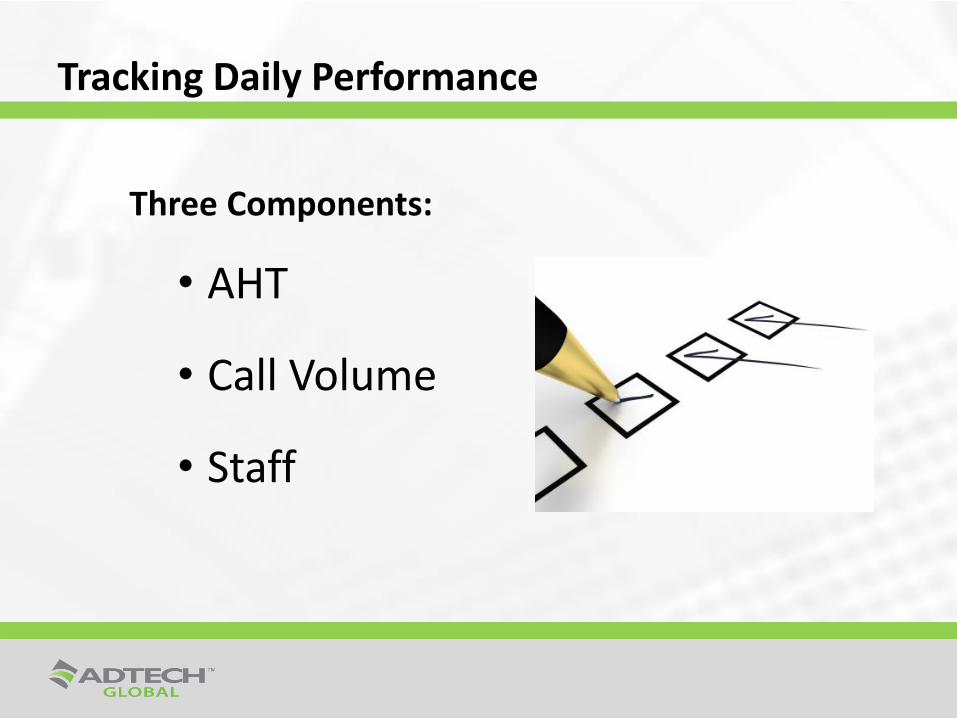
Tracking Daily Performance
Three Components:
• AHT
• Call Volume
• Staff
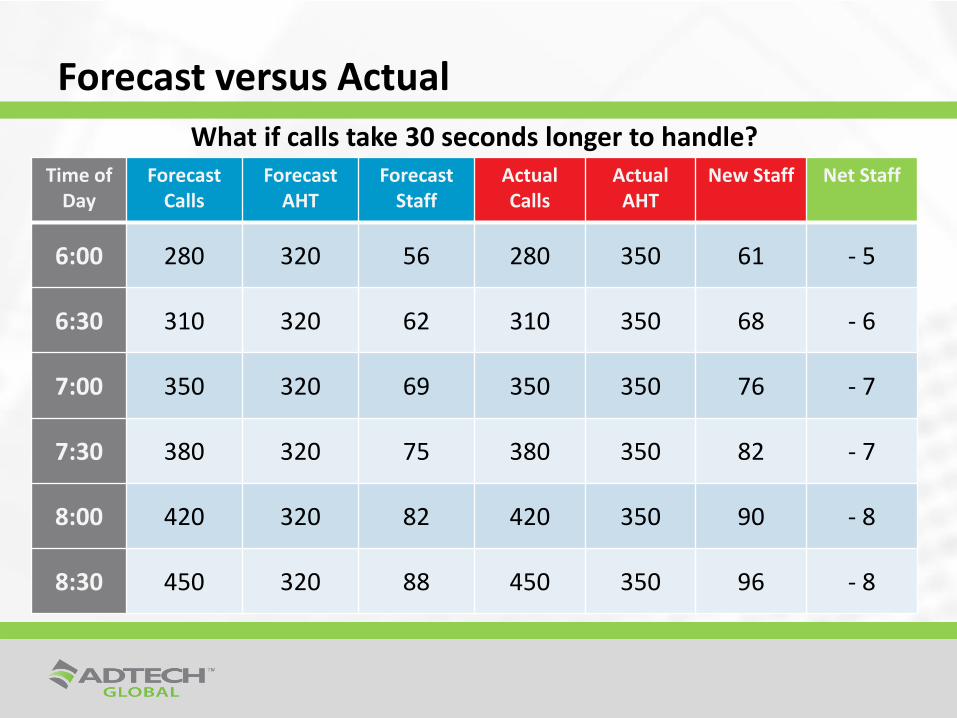
Forecast versus Actual
What if calls take 30 seconds longer to handle? Time of
Day Forecast
Calls Forecast
AHT Forecast
Staff Actual Calls
Actual AHT
New Staff Net Staff
6:00 280 320 56 280 350 61 - 5
6:30 310 320 62 310 350 68 - 6
7:00 350 320 69 350 350 76 - 7
7:30 380 320 75 380 350 82 - 7
8:00 420 320 82 420 350 90 - 8
8:30 450 320 88 450 350 96 - 8
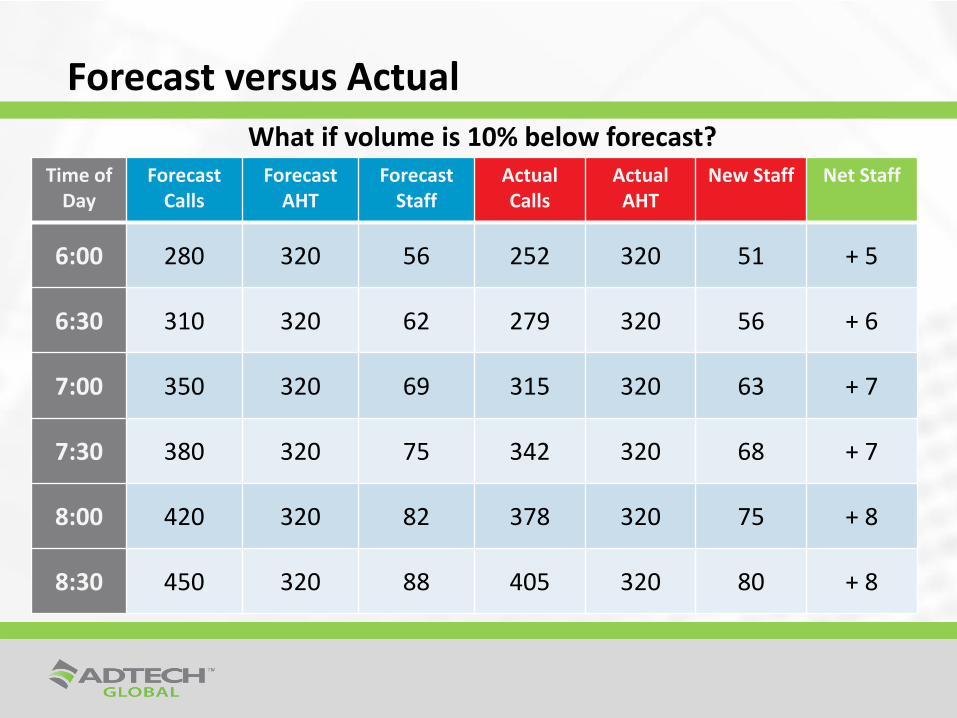
Forecast versus Actual
What if volume is 10% below forecast? Time of
Day Forecast
Calls Forecast
AHT Forecast
Staff Actual Calls
Actual AHT
New Staff Net Staff
6:00 280 320 56 252 320 51 + 5
6:30 310 320 62 279 320 56 + 6
7:00 350 320 69 315 320 63 + 7
7:30 380 320 75 342 320 68 + 7
8:00 420 320 82 378 320 75 + 8
8:30 450 320 88 405 320 80 + 8
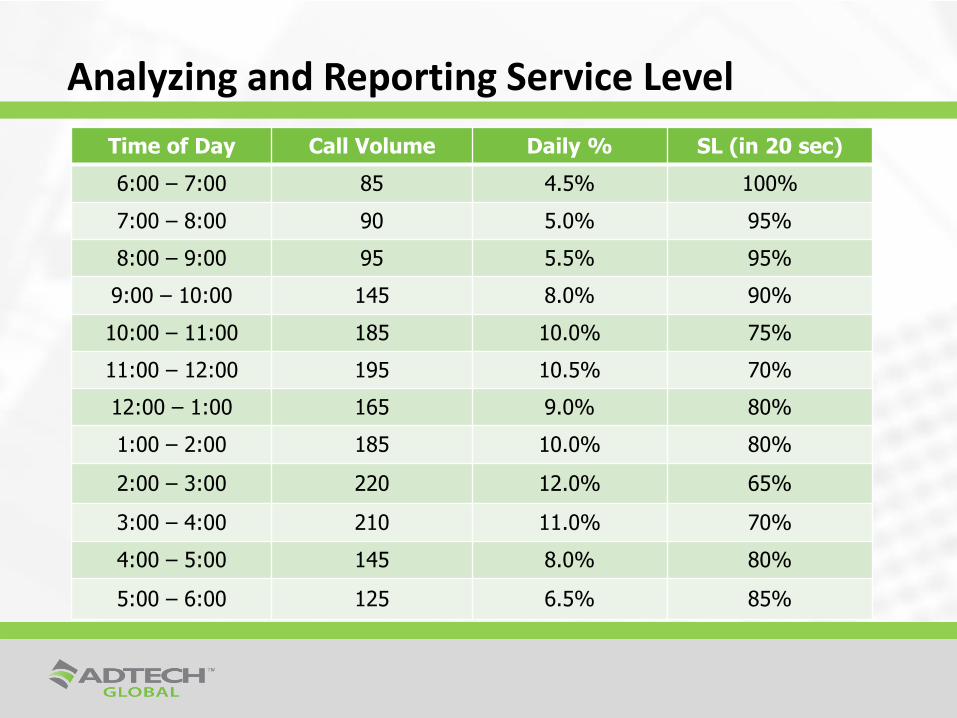
Analyzing and Reporting Service Level
Time of Day Call Volume Daily % SL (in 20 sec)
6:00 – 7:00 85 4.5% 100%
7:00 – 8:00 90 5.0% 95%
8:00 – 9:00 95 5.5% 95%
9:00 – 10:00 145 8.0% 90%
10:00 – 11:00 185 10.0% 75%
11:00 – 12:00 195 10.5% 70%
12:00 – 1:00 165 9.0% 80%
1:00 – 2:00 185 10.0% 80%
2:00 – 3:00 220 12.0% 65%
3:00 – 4:00 210 11.0% 70%
4:00 – 5:00 145 8.0% 80%
5:00 – 6:00 125 6.5% 85%
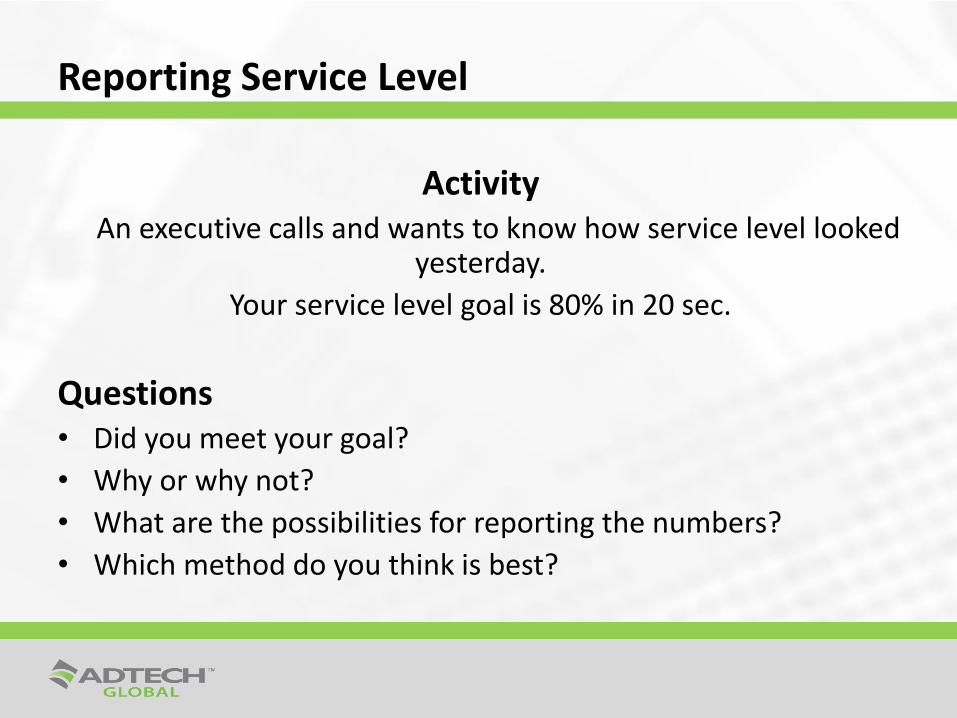
Reporting Service Level
Activity An executive calls and wants to know how service level looked
yesterday.
Your service level goal is 80% in 20 sec.
Questions • Did you meet your goal?
• Why or why not?
• What are the possibilities for reporting the numbers?
• Which method do you think is best?
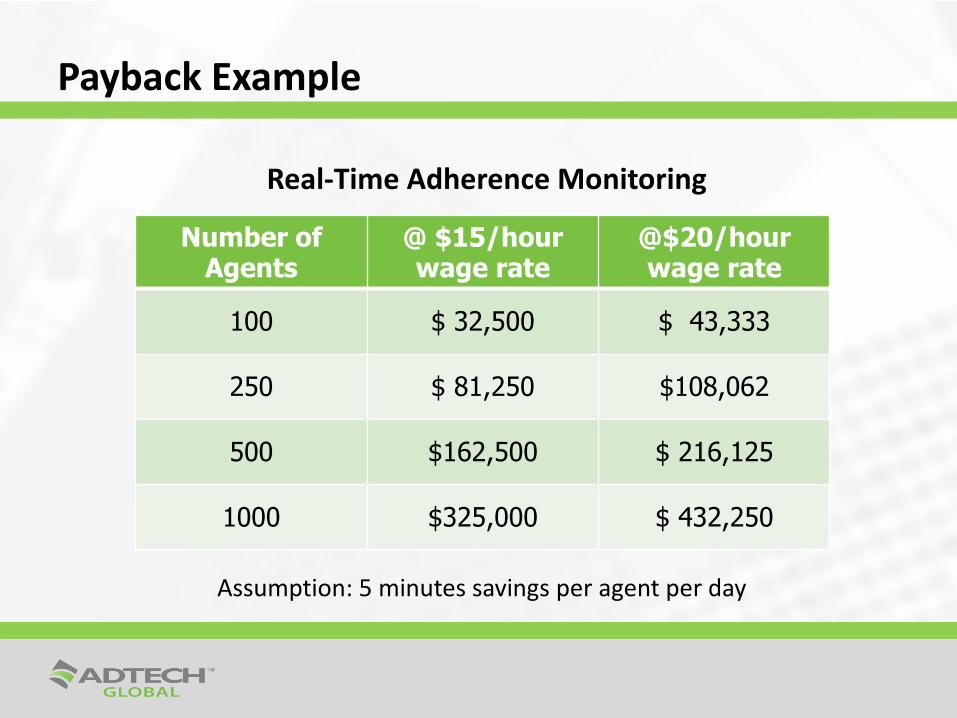
Payback Example
Real-Time Adherence Monitoring
Number of Agents
@ $15/hour wage rate
@$20/hour wage rate
100 $ 32,500 $ 43,333
250 $ 81,250 $108,062
500 $162,500 $ 216,125
1000 $325,000 $ 432,250
Assumption: 5 minutes savings per agent per day
Daily Management Solutions
• Reliable schedule exception process
• Tracking/reporting of activity categories
• New service definitions
• Real-time adherence monitoring
• Reaction strategies “handbook”
• Other:
Designing Effective
Schedules
Cutting Costs
Managing Attendance &
Adherence
Managing Daily Service Hiring Freeze
Staff Turnover
WFM Challenges

Thank You!
Good luck with your workforce management challenges!