Embed Size (px)
DESCRIPTION
Citation preview
Focused on Profitable, Consistent Growth Investor Presentation
February 2014
Certain information contained in this presentation may constitute forward-looking statements, such as information relating to expected performance. These forward-looking statements are subject to a number of factors and uncertainties that could cause actual results and experiences to differ materially from the anticipated results and expectations expressed in such forward-looking statements. We caution readers not to place undue reliance on any forward-looking statements, which speak only as of the date made.
Among the factors that may cause actual results and experiences to differ from anticipated results and expectations expressed in such forward-looking statements are the following: (i) the effect of, or changes in, general economic conditions; (ii) fluctuations in the cost and availability of inputs and raw materials, such as live cattle, live swine, feed grains (including corn and soybean meal) and energy; (iii) market conditions for finished products, including competition from other global and domestic food processors, supply and pricing of competing products and alternative proteins and demand for alternative proteins; (iv) successful rationalization of existing facilities and operating efficiencies of the facilities; (v) risks associated with our commodity purchasing activities; (vi) access to foreign markets together with foreign economic conditions, including currency fluctuations, import/export restrictions and foreign politics; (vii) outbreak of a livestock disease (such as avian influenza or bovine spongiform encephalopathy), which could have an adverse effect on livestock we own, the availability of livestock we purchase, consumer perception of certain protein products or our ability to access certain domestic and foreign markets; (viii) changes in availability and relative costs of labor and contract growers and our ability to maintain good relationships with employees, labor unions, contract growers and independent producers providing us livestock; (ix) issues related to food safety, including costs resulting from product recalls, regulatory compliance and any related claims or litigation; (x) changes in consumer preference and diets and our ability to identify and react to consumer trends; (xi) significant marketing plan changes by large customers or loss of one or more large customers; (xii) adverse results from litigation; (xiii) risks associated with leverage, including cost increases due to rising interest rates or changes in debt ratings or outlook; (xiv) compliance with and changes to regulations and laws (both domestic and foreign), including changes in accounting standards, tax laws, environmental laws, agricultural laws and occupational, health and safety laws; (xv) our ability to make effective acquisitions or joint ventures and successfully integrate newly acquired businesses into existing operations; (xvi) effectiveness of advertising and marketing programs; and (xvii) those factors listed under Item 1A. “Risk Factors” included in our September 28, 2013, Annual Report filed on Form 10-K.
FORWARD-LOOKING STATEMENTS
2
• Tyson Foods has made a turnaround since 2009
• Producing more consistent, stable earnings
• Growth strategy implemented in 2012 – Growing international in-country production – Growing domestic prepared foods and value-added products
• Measurable growth – Annual 3 - 4% revenue growth – At least 10% EPS growth over time
EXECUTIVE SUMMARY
3
• Tyson Today
• The Global Marketplace
• Strategic Growth
• Financial Results and Outlook
• Appendix
TODAY’S DISCUSSION
4

Tyson Today
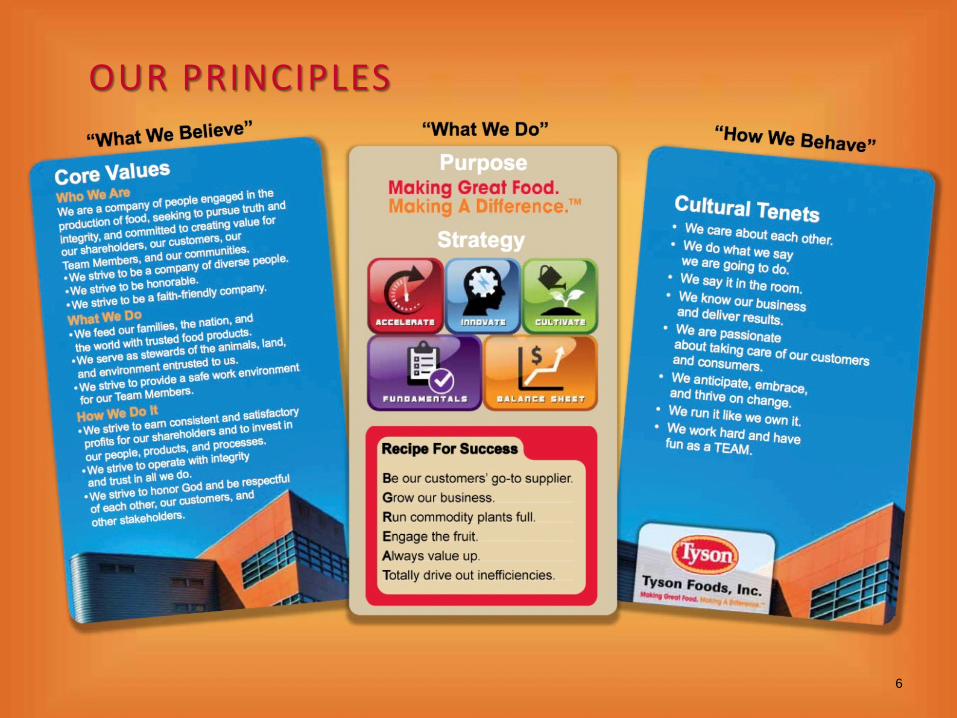
OUR PRINCIPLES
6
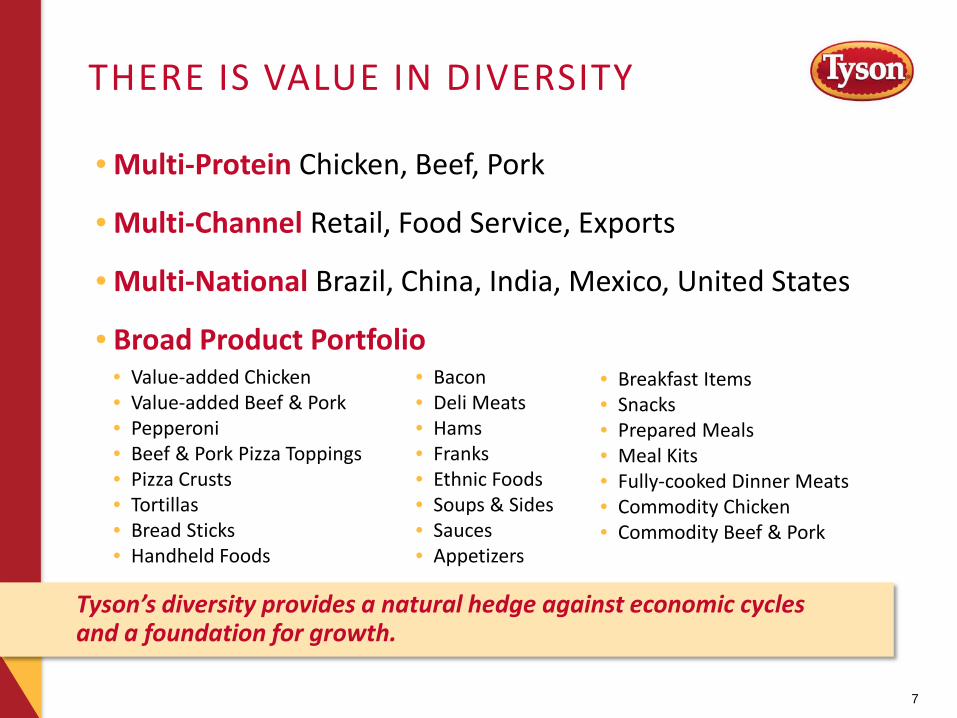
• Multi-Protein Chicken, Beef, Pork
• Multi-Channel Retail, Food Service, Exports
• Multi-National Brazil, China, India, Mexico, United States
• Broad Product Portfolio
THERE IS VALUE IN DIVERSITY
7
• Value-added Chicken • Value-added Beef & Pork • Pepperoni • Beef & Pork Pizza Toppings • Pizza Crusts • Tortillas • Bread Sticks • Handheld Foods
• Bacon • Deli Meats • Hams • Franks • Ethnic Foods • Soups & Sides • Sauces • Appetizers
• Breakfast Items • Snacks • Prepared Meals • Meal Kits • Fully-cooked Dinner Meats • Commodity Chicken • Commodity Beef & Pork
Tyson’s diversity provides a natural hedge against economic cycles and a foundation for growth.
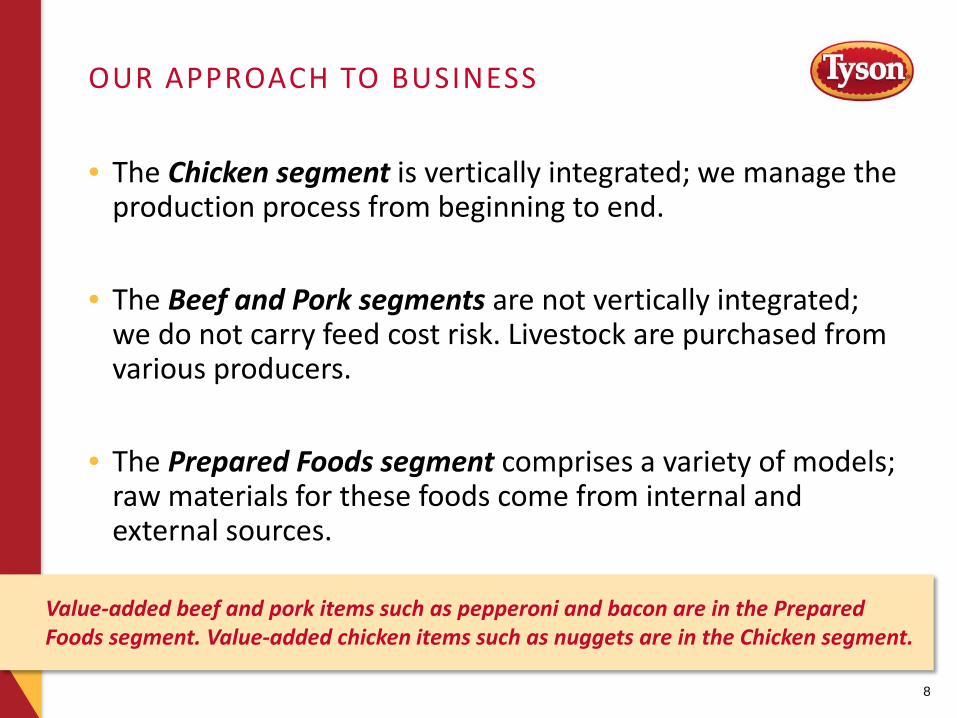
• The Chicken segment is vertically integrated; we manage the production process from beginning to end.
• The Beef and Pork segments are not vertically integrated; we do not carry feed cost risk. Livestock are purchased from various producers.
• The Prepared Foods segment comprises a variety of models; raw materials for these foods come from internal and external sources.
OUR APPROACH TO BUSINESS
8
Value-added beef and pork items such as pepperoni and bacon are in the Prepared Foods segment. Value-added chicken items such as nuggets are in the Chicken segment.
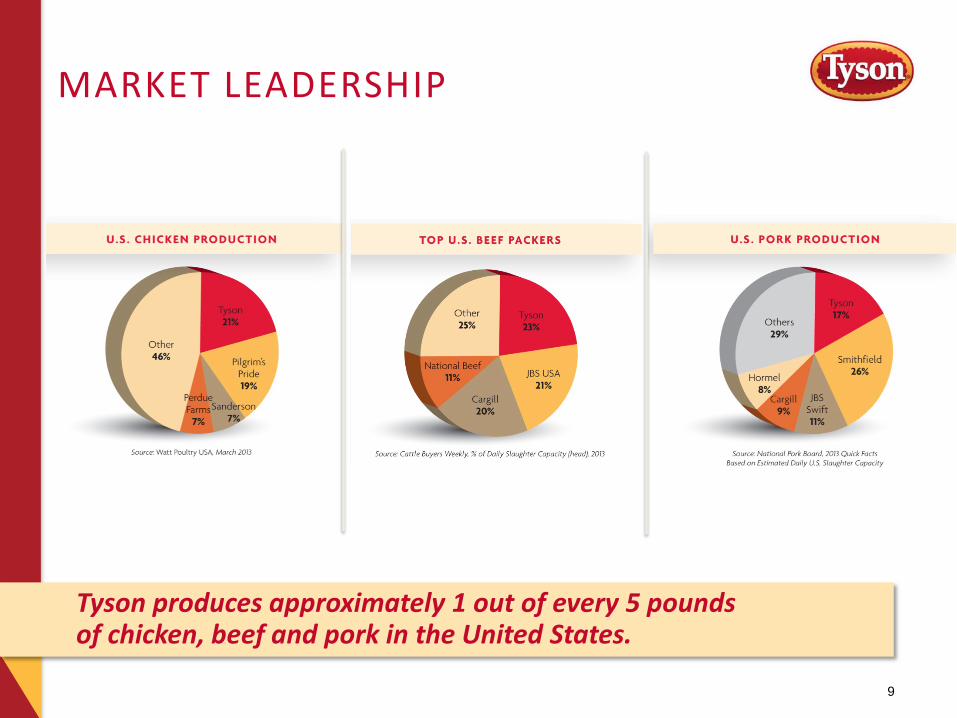
MARKET LEADERSHIP
9
Tyson produces approximately 1 out of every 5 pounds of chicken, beef and pork in the United States.
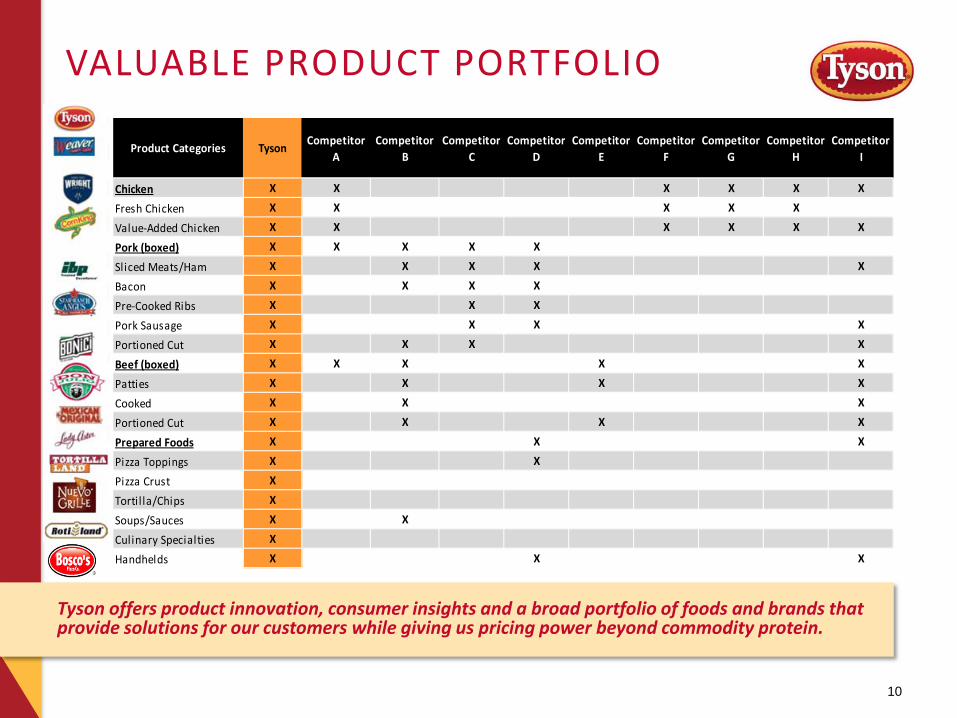
VALUABLE PRODUCT PORTFOLIO
Tyson offers product innovation, consumer insights and a broad portfolio of foods and brands that provide solutions for our customers while giving us pricing power beyond commodity protein.
10
Product Categories Tyson Competitor A
Competitor B
Competitor C
Competitor D
Competitor E
Competitor F
Competitor G
Competitor H
Competitor I
Chicken X X X X X X
Fresh Chicken X X X X X
Value-Added Chicken X X X X X X
Pork (boxed) X X X X X
Sliced Meats/Ham X X X X X
Bacon X X X X
Pre-Cooked Ribs X X X
Pork Sausage X X X X
Portioned Cut X X X X
Beef (boxed) X X X X X
Patties X X X X
Cooked X X X
Portioned Cut X X X X
Prepared Foods X X X
Pizza Toppings X X
Pizza Crust X
Tortil la/Chips X
Soups/Sauces X X
Culinary Specialties X
Handhelds X X X
FOUR-YEAR PERFORMANCE: AT A GLANCE
• Delivered record sales each year
• Generated $5 billion in operating cash flows after funding $700 million in working capital increases
• Invested $2.5 billion back into the business to fuel continued improvement, growth and acquisitions
• Paid down over $1 billion in debt and reduced interest expense
• Returned $1.3 billion to shareholders via stock repurchases and dividends
• Improved net debt to cap to 17% (Gross debt to cap = 28%)
• Established investment grade rating profiles with Moody’s, S&P and Fitch
• Improved liquidity to $2.1 billion at the end of fiscal 2013
• Achieved $795 million in operating efficiencies in the chicken segment (more than $1 billion in total since 2008)
• Averaged over $2 adjusted earnings per share from continuing operations*
* See Appendix for non-GAAP reconciliations
11
Tyson Foods has achieved an improved level of performance while navigating global economic challenges, unfavorable market dynamics and often staggering input cost increases. From FY2010 through FY2013 Tyson:
“The turnaround is over. It’s time to turn it on.” – Donnie Smith, Tyson Foods President & CEO
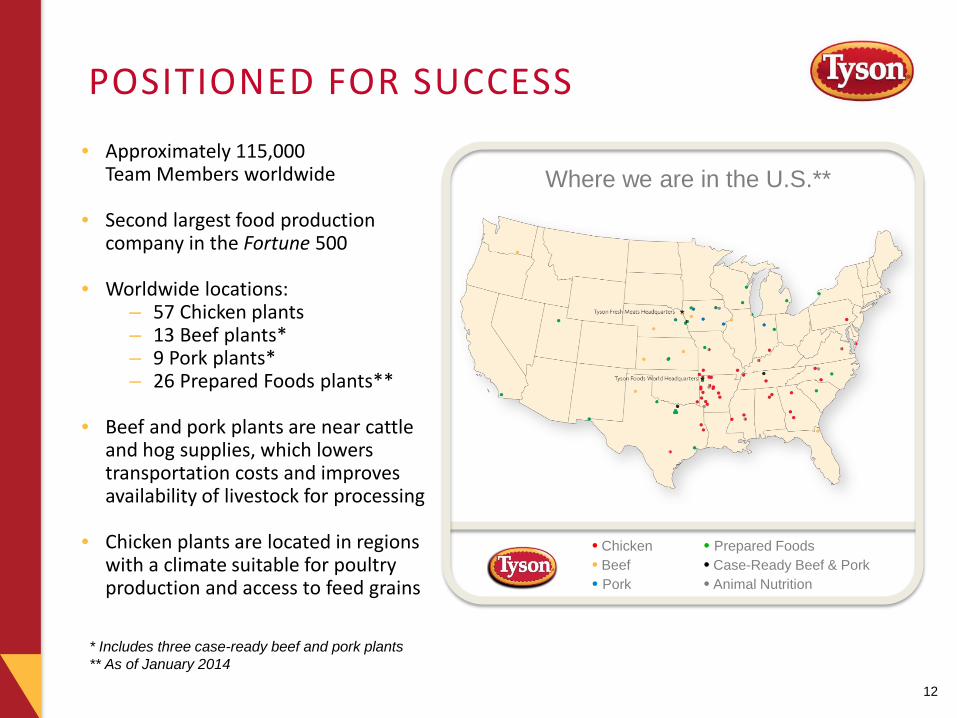
POSITIONED FOR SUCCESS
• Approximately 115,000 Team Members worldwide
• Second largest food production company in the Fortune 500
• Worldwide locations: – 57 Chicken plants – 13 Beef plants* – 9 Pork plants* – 26 Prepared Foods plants**
• Beef and pork plants are near cattle
and hog supplies, which lowers transportation costs and improves availability of livestock for processing
• Chicken plants are located in regions with a climate suitable for poultry production and access to feed grains
12
* Includes three case-ready beef and pork plants ** As of January 2014
• Chicken • Beef • Pork
• Prepared Foods • Case-Ready Beef & Pork • Animal Nutrition
Where we are in the U.S.**
FarmCheck™ Responsible Sourcing
Four Guiding Principles 1. Program
Care enough to check on the farm, in person
2. Advisory Panel Be humble enough to seek expert advice
3. Our Research Program Be curious enough to find better ways
4. Our Internal Management Teams Be committed enough to give it our full attention
13
• Active in the fight against hunger since for more than 15 years
• Donated nearly 100 million pounds of much needed protein to food banks.
• Partners with Share Our Strength, Lift Up America, Feeding America, National Urban League and the League of United Latin American Citizens to raise awareness and help feed the hungry across the nation.
• Meals That Matter disaster relief program begun in 2012 to support our long-standing tradition of feeding people during times of disaster.
MAKING GREAT FOOD. MAKING A DIFFERENCE™
14
The Global Marketplace
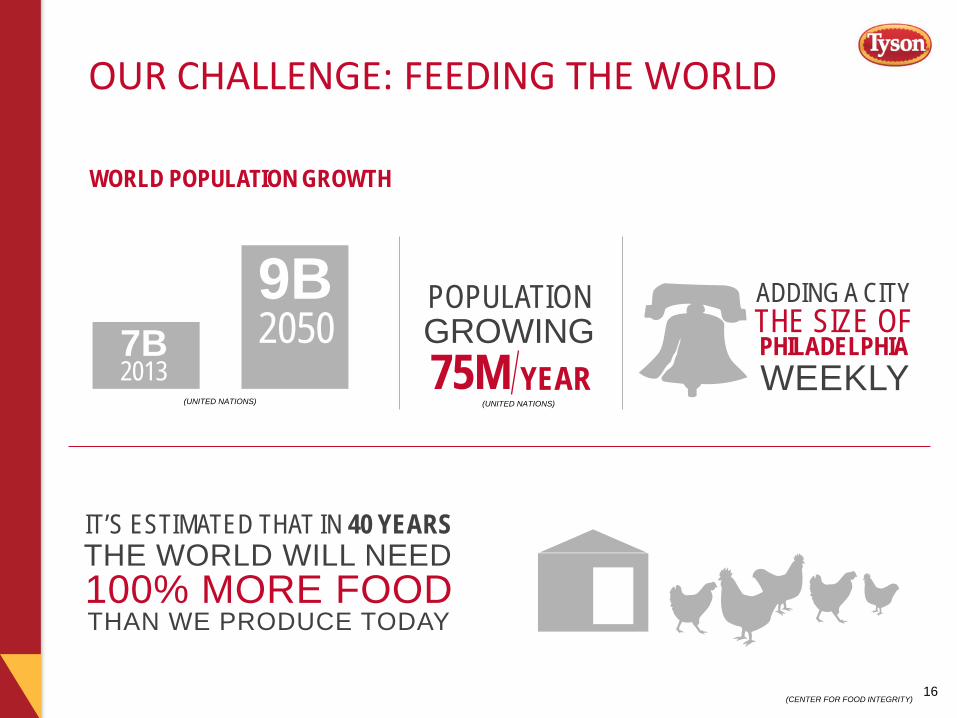
OUR CHALLENGE: FEEDING THE WORLD
WORLD POPULATION GROWTH
75M YEAR
POPULATION GROWING
ADDING A CITY THE SIZE OF PHILADELPHIA WEEKLY
7B 2013
9B 2050
(UNITED NATIONS)
(CENTER FOR FOOD INTEGRITY)
IT’S ESTIMATED THAT IN 40 YEARS THE WORLD WILL NEED 100% MORE FOOD THAN WE PRODUCE TODAY
16
(UNITED NATIONS)
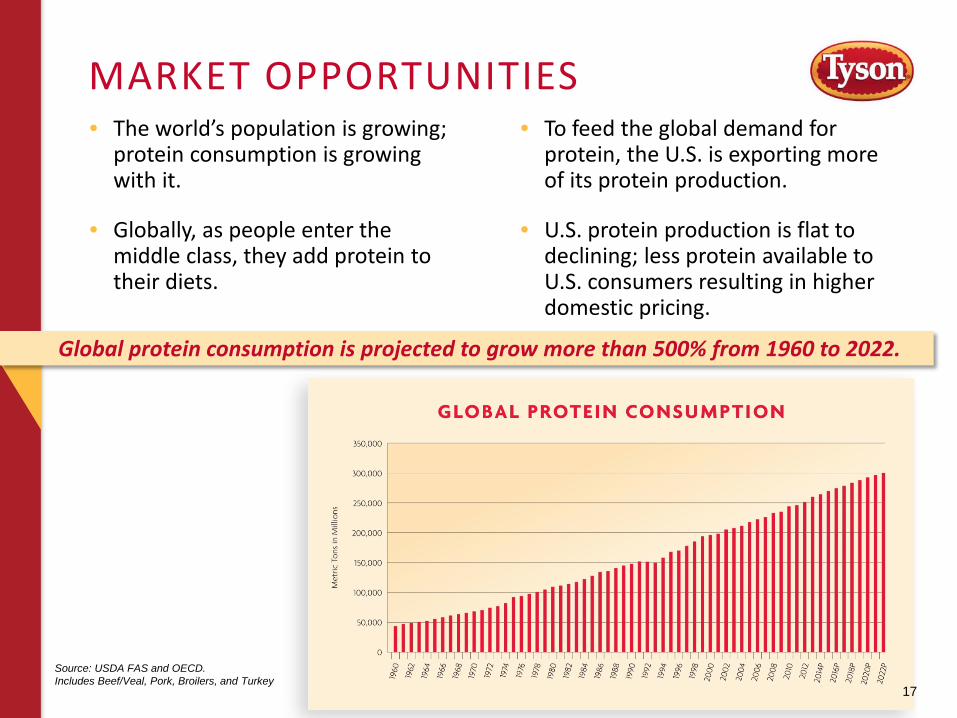
• The world’s population is growing; protein consumption is growing with it.
• Globally, as people enter the middle class, they add protein to their diets.
MARKET OPPORTUNITIES
17
Source: USDA FAS and OECD. Includes Beef/Veal, Pork, Broilers, and Turkey
• To feed the global demand for protein, the U.S. is exporting more of its protein production.
• U.S. protein production is flat to declining; less protein available to U.S. consumers resulting in higher domestic pricing.
Global protein consumption is projected to grow more than 500% from 1960 to 2022.
100
110
120
130
140
150
160
170
180
190
230
235
240
245
250
255
260
265
270
275
280
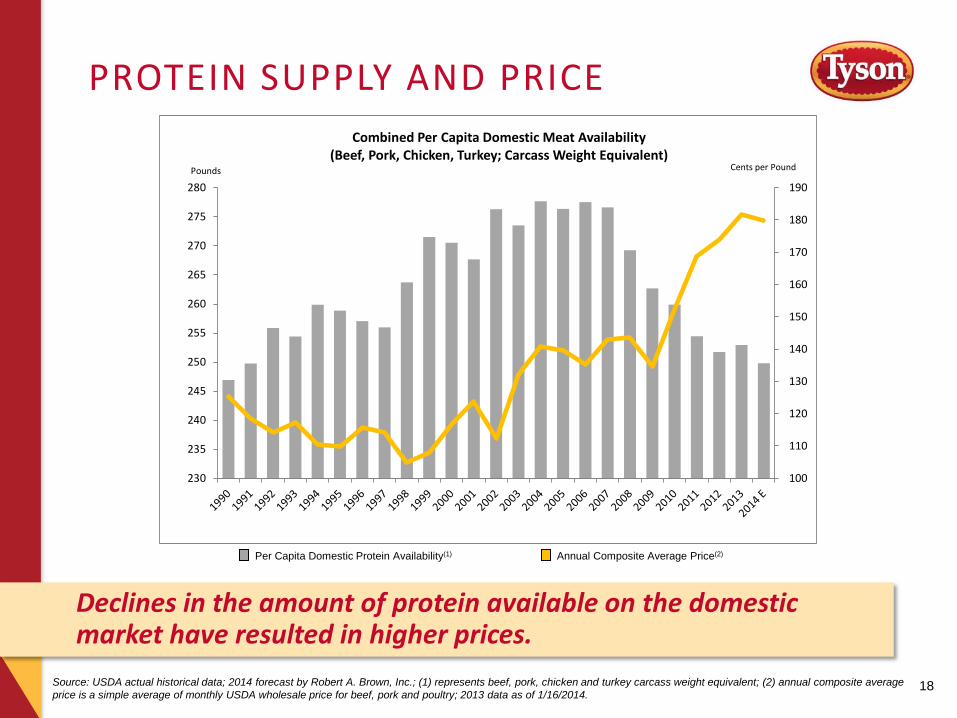
Combined Per Capita Domestic Meat Availability (Beef, Pork, Chicken, Turkey; Carcass Weight Equivalent)
Cents per Pound
Source: USDA actual historical data; 2014 forecast by Robert A. Brown, Inc.; (1) represents beef, pork, chicken and turkey carcass weight equivalent; (2) annual composite average price is a simple average of monthly USDA wholesale price for beef, pork and poultry; 2013 data as of 1/16/2014.
PROTEIN SUPPLY AND PRICE
18
Per Capita Domestic Protein Availability(1) Annual Composite Average Price(2)
Declines in the amount of protein available on the domestic market have resulted in higher prices.
Pounds
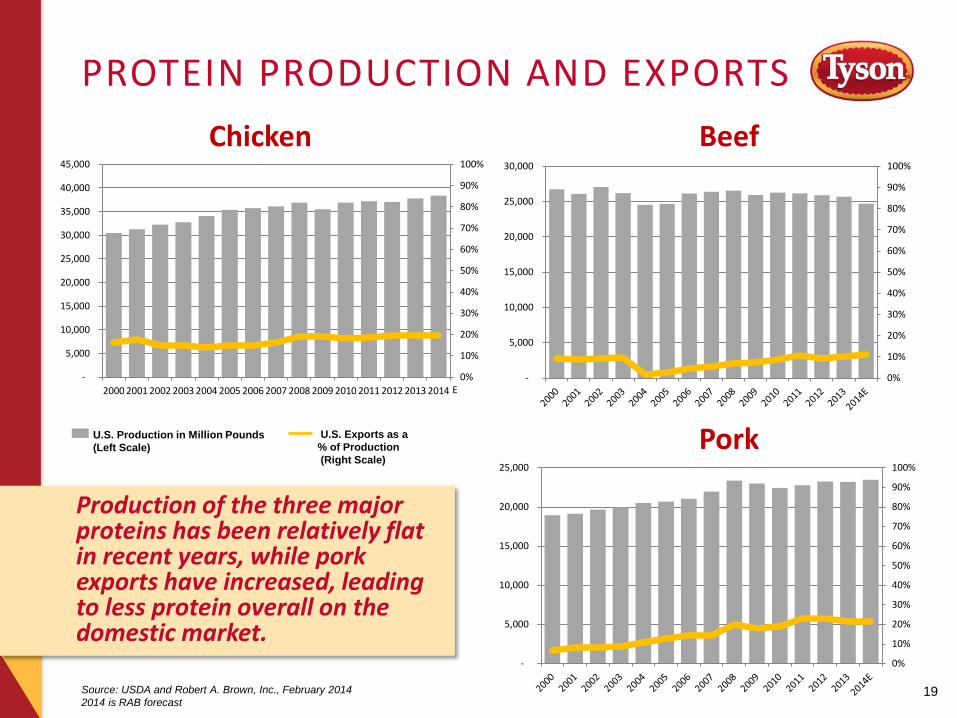
PROTEIN PRODUCTION AND EXPORTS
19 Source: USDA and Robert A. Brown, Inc., February 2014 2014 is RAB forecast
Production of the three major proteins has been relatively flat in recent years, while pork exports have increased, leading to less protein overall on the domestic market.
Chicken Beef
Pork U.S. Exports as a % of Production (Right Scale)
U.S. Production in Million Pounds (Left Scale)
0%
10%
20%
30%
40%
50%
60%
70%
80%
90%
100%
-
5,000
10,000
15,000
20,000
25,000
30,000
35,000
40,000
45,000
2000 2001 2002 2003 2004 2005 2006 2007 2008 2009 2010 2011 2012 2013 2014 E 0%
10%
20%
30%
40%
50%
60%
70%
80%
90%
100%
-
5,000
10,000
15,000
20,000
25,000
30,000
0%
10%
20%
30%
40%
50%
60%
70%
80%
90%
100%
-
5,000
10,000
15,000
20,000
25,000
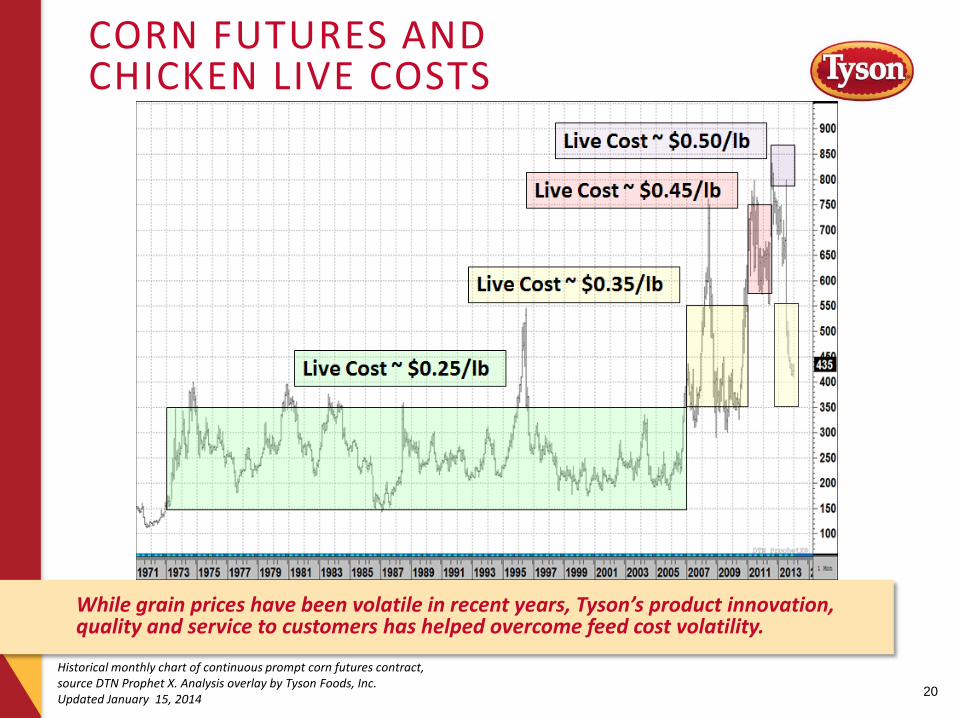
CORN FUTURES AND CHICKEN LIVE COSTS
20
While grain prices have been volatile in recent years, Tyson’s product innovation, quality and service to customers has helped overcome feed cost volatility.
Historical monthly chart of continuous prompt corn futures contract, source DTN Prophet X. Analysis overlay by Tyson Foods, Inc. Updated January 15, 2014
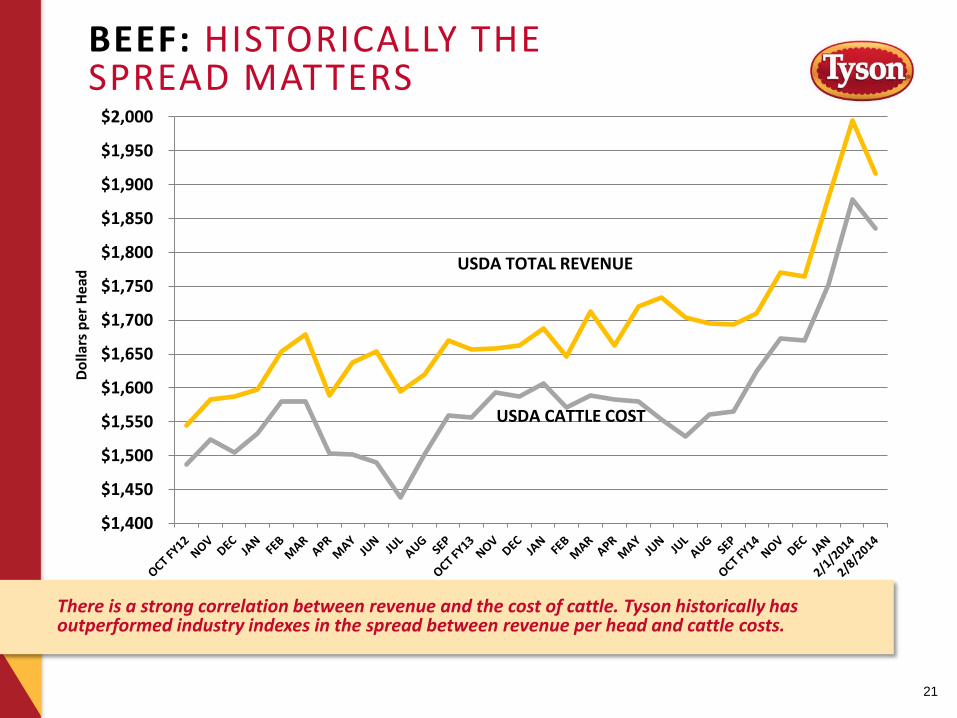
BEEF: HISTORICALLY THE SPREAD MATTERS
21
Dolla
rs p
er H
ead
There is a strong correlation between revenue and the cost of cattle. Tyson historically has outperformed industry indexes in the spread between revenue per head and cattle costs.
$1,400
$1,450
$1,500
$1,550
$1,600
$1,650
$1,700
$1,750
$1,800
$1,850
$1,900
$1,950
$2,000
USDA TOTAL REVENUE
USDA CATTLE COST
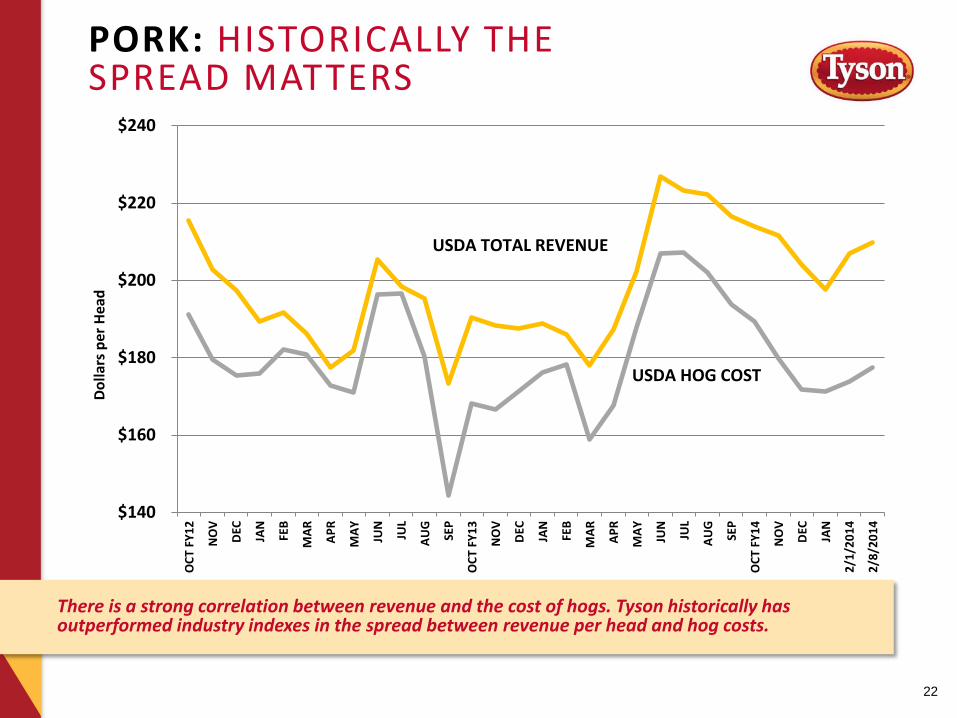
PORK: HISTORICALLY THE SPREAD MATTERS
22
Dolla
rs p
er H
ead
There is a strong correlation between revenue and the cost of hogs. Tyson historically has outperformed industry indexes in the spread between revenue per head and hog costs.
$140
$160
$180
$200
$220
$240
OCT
FY1
2
NO
V
DEC JAN
FEB
MAR AP
R
MAY JU
N
JUL
AUG
SEP
OCT
FY1
3
NO
V
DEC JAN
FEB
MAR AP
R
MAY JU
N
JUL
AUG
SEP
OCT
FY1
4
NO
V
DEC JAN
2/1/
2014
2/8/
2014
USDA TOTAL REVENUE
USDA HOG COST
Strategic Growth
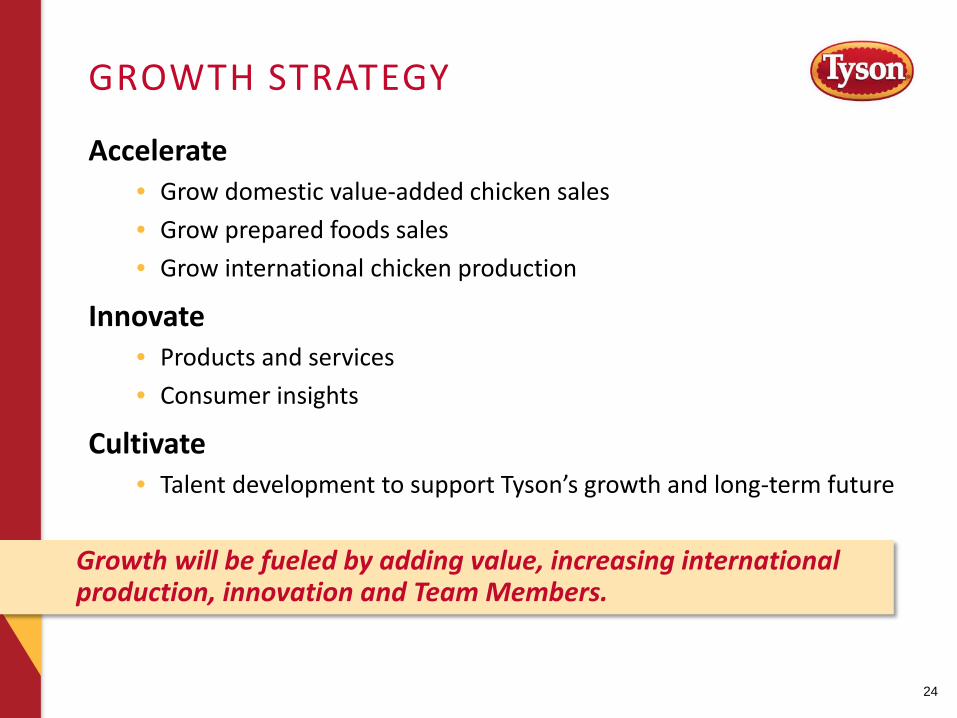
Accelerate • Grow domestic value-added chicken sales • Grow prepared foods sales • Grow international chicken production
Innovate • Products and services • Consumer insights
Cultivate • Talent development to support Tyson’s growth and long-term future
GROWTH STRATEGY
24
Growth will be fueled by adding value, increasing international production, innovation and Team Members.
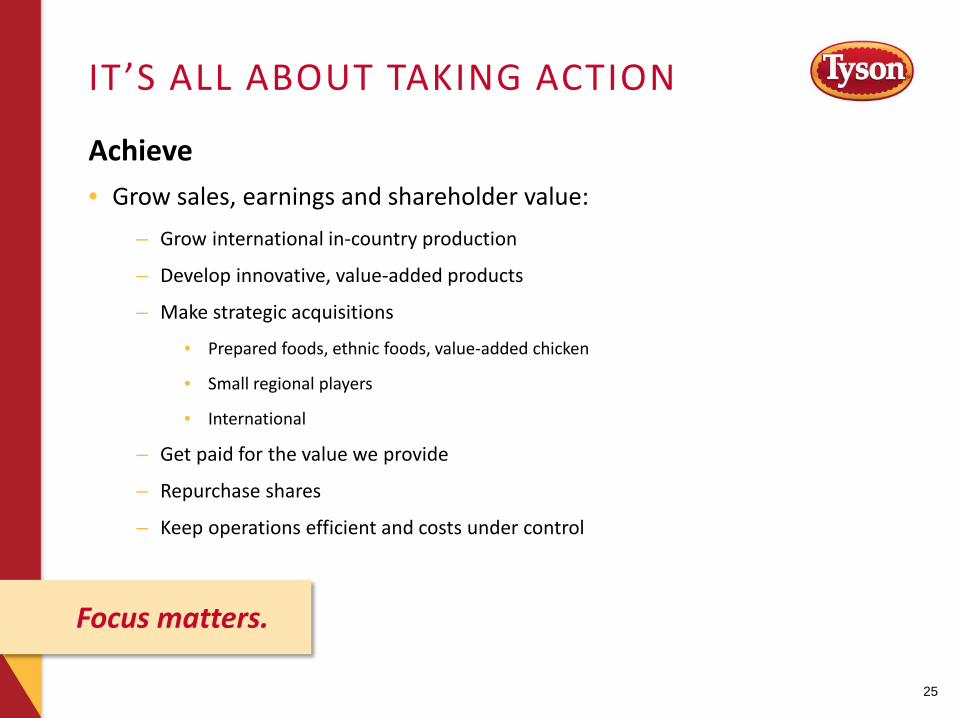
Achieve • Grow sales, earnings and shareholder value:
– Grow international in-country production
– Develop innovative, value-added products
– Make strategic acquisitions
• Prepared foods, ethnic foods, value-added chicken
• Small regional players
• International
– Get paid for the value we provide
– Repurchase shares
– Keep operations efficient and costs under control
IT ’S ALL ABOUT TAKING ACTION
25
Focus matters.
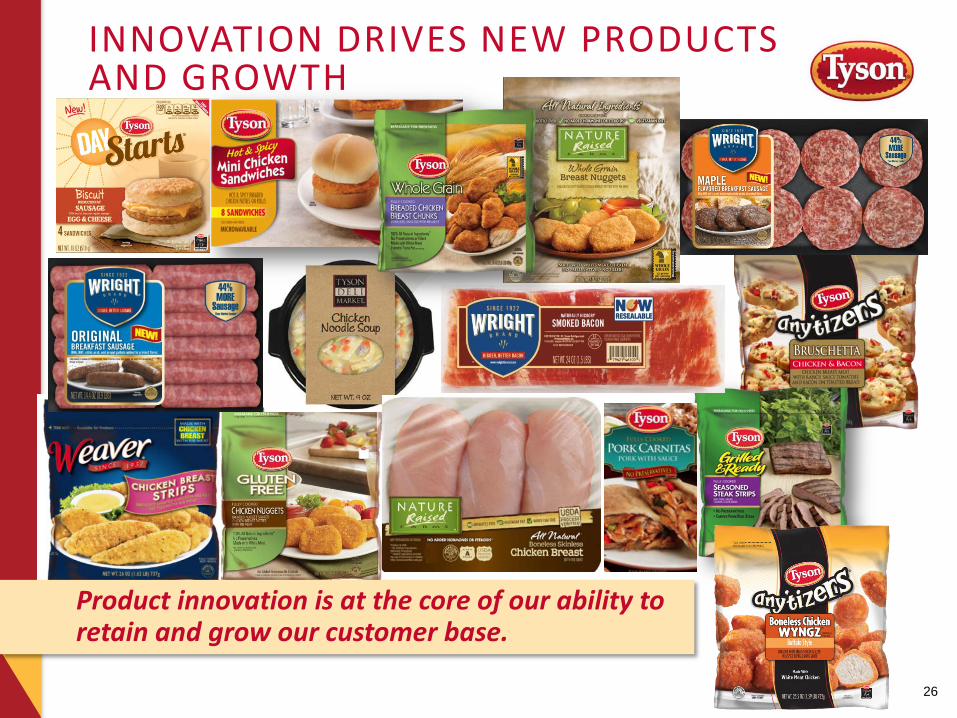
INNOVATION DRIVES NEW PRODUCTS AND GROWTH
26
Product innovation is at the core of our ability to retain and grow our customer base.
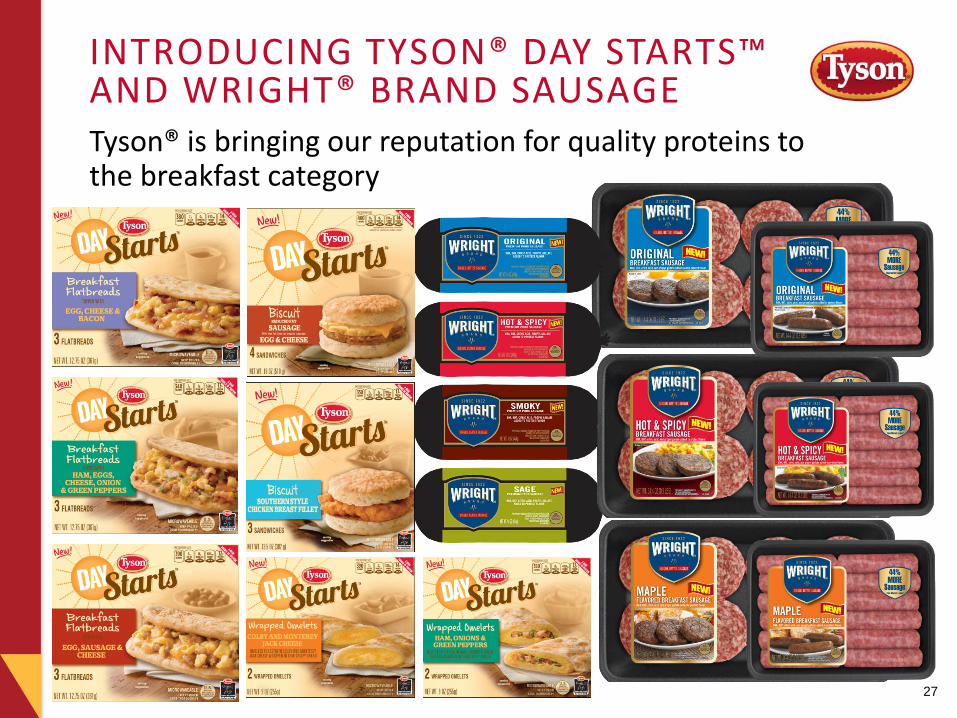
Tyson® is bringing our reputation for quality proteins to the breakfast category
INTRODUCING TYSON® DAY STARTS™ AND WRIGHT® BRAND SAUSAGE
27
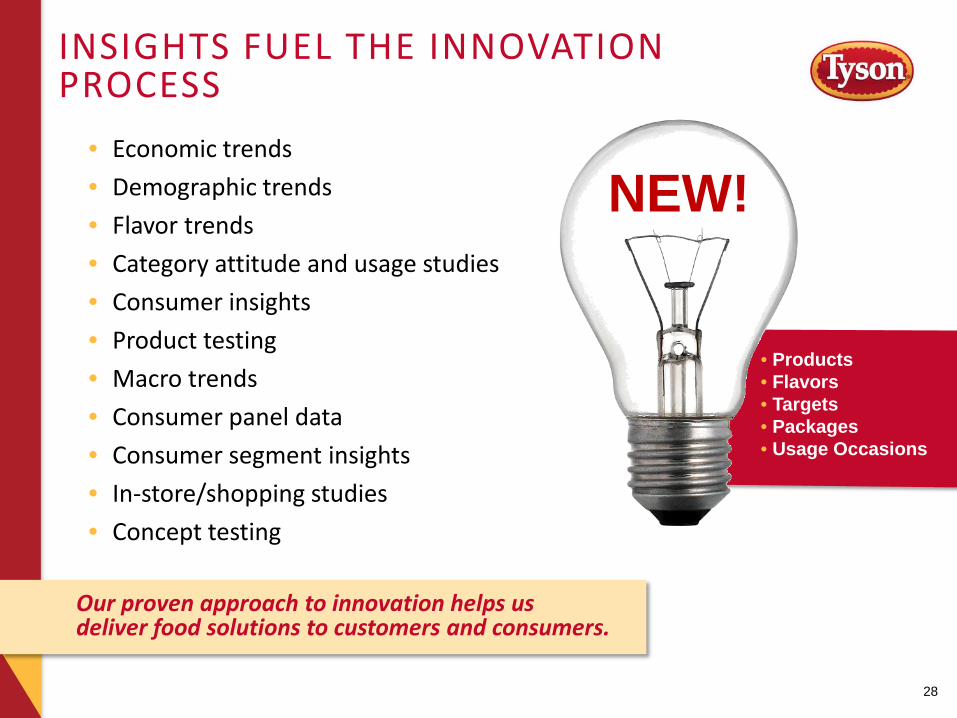
• Economic trends • Demographic trends • Flavor trends • Category attitude and usage studies • Consumer insights • Product testing • Macro trends • Consumer panel data • Consumer segment insights • In-store/shopping studies • Concept testing
INSIGHTS FUEL THE INNOVATION PROCESS
28
Our proven approach to innovation helps us deliver food solutions to customers and consumers.
• Products • Flavors • Targets • Packages • Usage Occasions
NEW!

Financial Results and Outlook
INVESTMENT THESIS • Strong balance sheet provides attractive options for growth:
– Reinvestment in Tyson through CapEx – Strategic acquisitions in prepared foods and value-added chicken – Return capital to shareholders through repurchase program and dividends
• Aggressively increase international in-country production where demand for protein is growing
• Measurable growth: – Annual 3 - 4% revenue growth – At least 10% EPS growth over time
• Become the leading “solution-providing” food company – not only a commodity protein company:
– Lean-thinking culture focused on operational excellence and continuous improvement – Superior quality, service and innovation to be the customer’s go-to supplier – Alternative channels such as convenience stores, dollar stores and drug store chains
30
Tyson strives to be the investment of choice.
• Reduced net debt by $3.4 billion from FY01 through FY13
• Decreased net debt to cap from 58% to 17% from FY01 through FY13
• Invested $558 million in FY13 CapEx
• Achieved $1.3 billion in operating cash flow in FY13, fourth consecutive year above $1 billion
• Liquidity at the end of FY13 was $2.1 billion, well above our targeted range of $1.2 billion to $1.5 billion
• Invested $550 million in FY13 to repurchase 21.1 million shares
• At the beginning of FY14, increased the regular quarterly dividend by 50% to $0.075 per share, following a 25% increase the previous year and a $0.10 per share special dividend in December 2012
BALANCE SHEET STRENGTH
31
A strong capital structure creates opportunities.
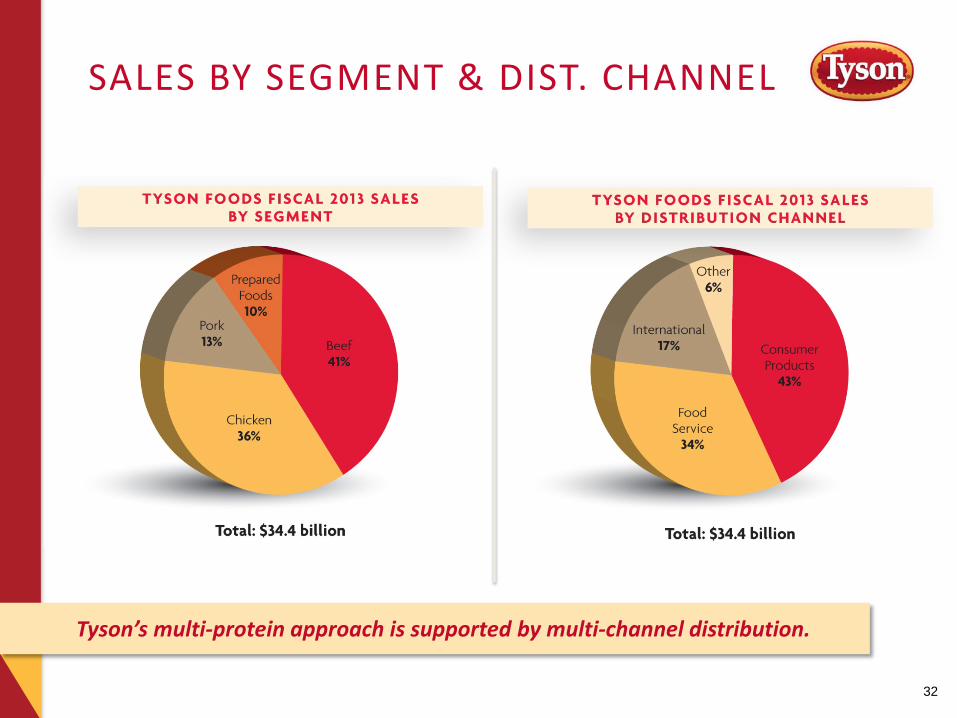
SALES BY SEGMENT & DIST. CHANNEL
32
Tyson’s multi-protein approach is supported by multi-channel distribution.
-$1.00
-$0.50
$0.00
$0.50
$1.00
$1.50
$2.00
$2.50
$3.00
2004 2005 2006 2007 2008 2009 2010 2011 2012 2013 2014E
$1.90
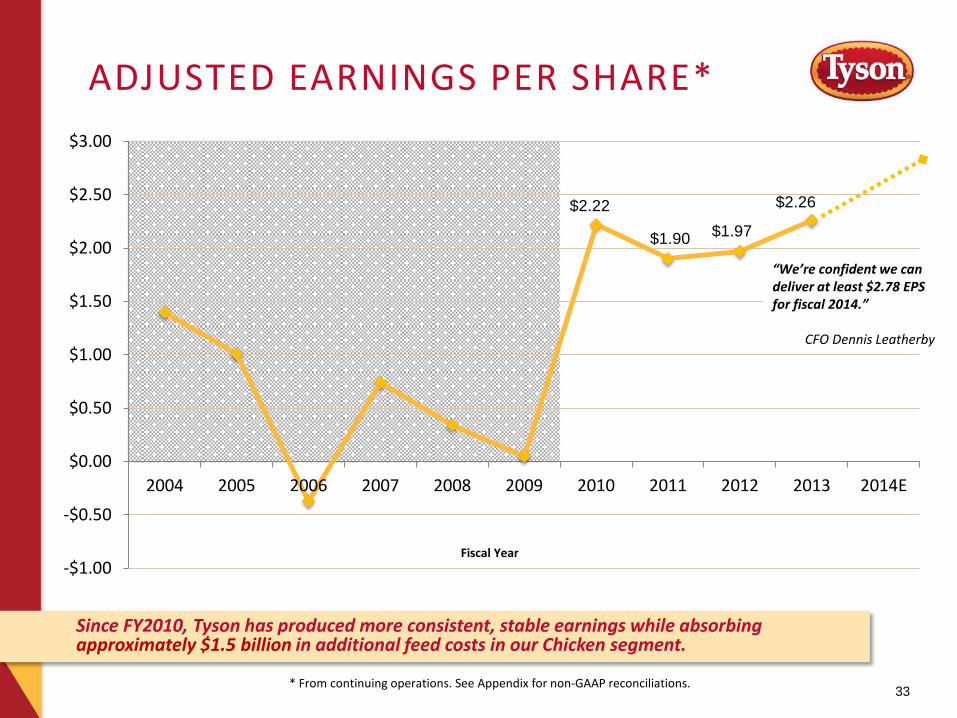
ADJUSTED EARNINGS PER SHARE*
33
Fiscal Year
* From continuing operations. See Appendix for non-GAAP reconciliations.
$2.22 $1.97
Since FY2010, Tyson has produced more consistent, stable earnings while absorbing approximately $1.5 billion in additional feed costs in our Chicken segment.
$2.26
“We’re confident we can deliver at least $2.78 EPS for fiscal 2014.”
CFO Dennis Leatherby
$0
$200
$400
$600
$800
$1,000
$1,200
$1,400
$1,600
$1,800
2004 2005 2006 2007 2008 2009 2010 2011 2012 2013
$1,565
$1,289 $1,286 $1,375
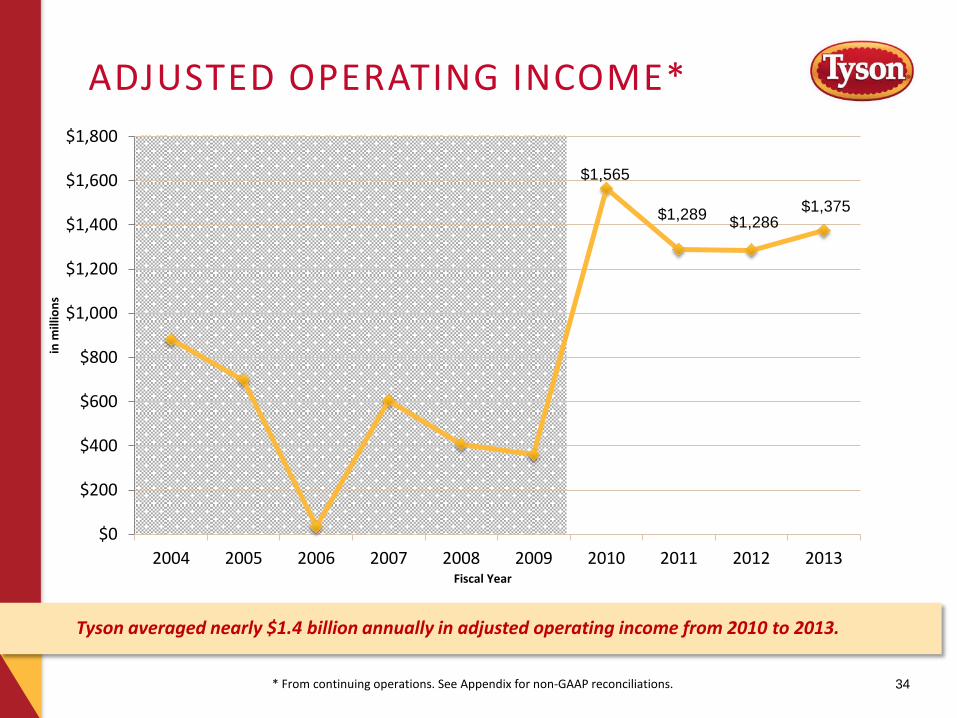
ADJUSTED OPERATING INCOME*
34
Fiscal Year
in m
illio
ns
* From continuing operations. See Appendix for non-GAAP reconciliations.
Tyson averaged nearly $1.4 billion annually in adjusted operating income from 2010 to 2013.
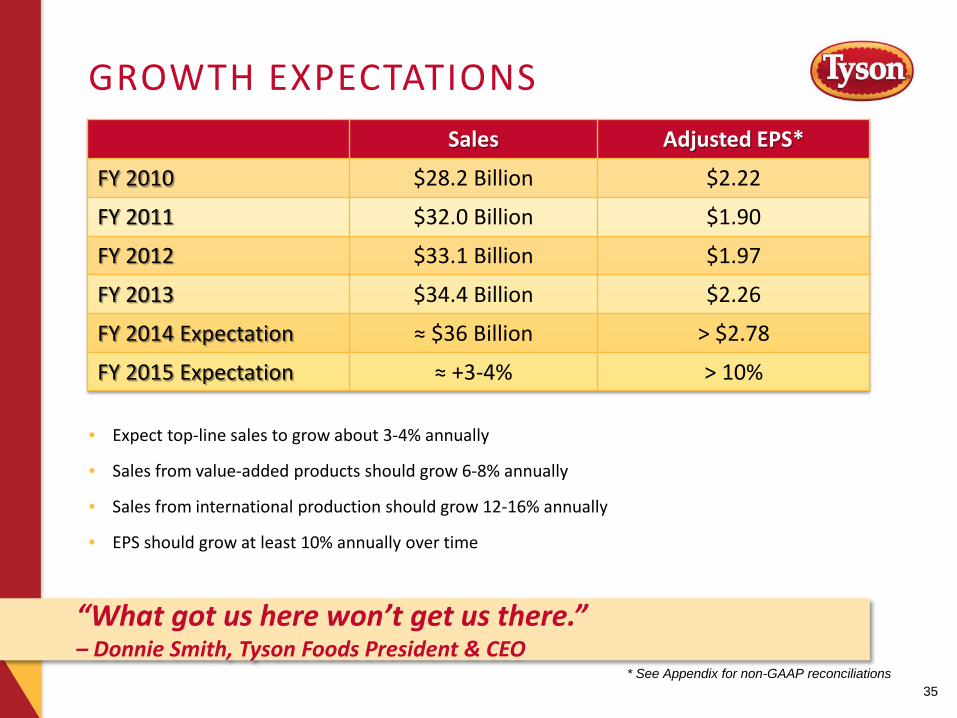
Sales Adjusted EPS*
FY 2010 $28.2 Billion $2.22
FY 2011 $32.0 Billion $1.90
FY 2012 $33.1 Billion $1.97
FY 2013 $34.4 Billion $2.26
FY 2014 Expectation ≈ $36 Billion > $2.78
FY 2015 Expectation ≈ +3-4% > 10%
GROWTH EXPECTATIONS
35 * See Appendix for non-GAAP reconciliations
“What got us here won’t get us there.” – Donnie Smith, Tyson Foods President & CEO
• Expect top-line sales to grow about 3-4% annually
• Sales from value-added products should grow 6-8% annually
• Sales from international production should grow 12-16% annually
• EPS should grow at least 10% annually over time
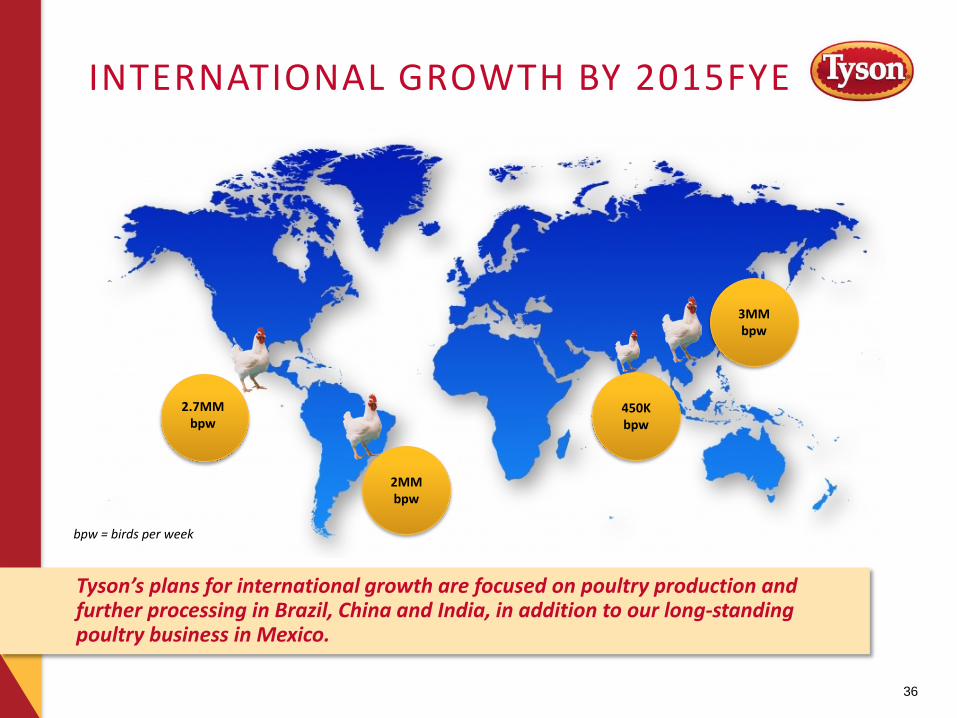
INTERNATIONAL GROWTH BY 2015FYE
36
Tyson’s plans for international growth are focused on poultry production and further processing in Brazil, China and India, in addition to our long-standing poultry business in Mexico.
2.7MM bpw
2MM bpw
450K bpw
3MM bpw
bpw = birds per week
• Capital expenditures to grow existing businesses: – Capital maintenance level approximates $250 million a year – FY14 CapEx plan is $700 million
• Acquisitions advance growth strategies around value-added products and international production:
– Profit improvement CapEx target greater than 20% Modified Internal Rate of Return
– Acquisitions and joint ventures target greater than 20% Return on Invested Capital
• Return cash to shareholders: – Share repurchases – Dividends
PRIORITIES FOR USES OF CASH
37
• Be the best-in-class operator in beef, pork and chicken
• Consistently outperform beef and pork industry indexes
• Achieved more than $1 billion in operational efficiencies in our chicken segment since 2008
CONTINUOUS IMPROVEMENT
38
• Tyson Foods is growing into a solution-providing food company:
– Being a commodity protein company is not our goal or our destiny – Pursuing value-added product development – Delivering quality, service and innovation enables us to be the
customers’ go-to supplier – Growth into alternate channels such as convenience stores,
dollar stores and drug store chains offer opportunities
• Strong balance sheet gives Tyson options to grow
• Aggressively growing international in-country production
• Pursuing prepared foods and value-added chicken acquisitions
• Establishing a culture of lean thinking, operational excellence and continuous improvement
• Expectations of annual 3-4% revenue growth and at least 10% EPS growth over time
• Share repurchases and increased dividends
WHY TYSON?
39

Blank
Appendix
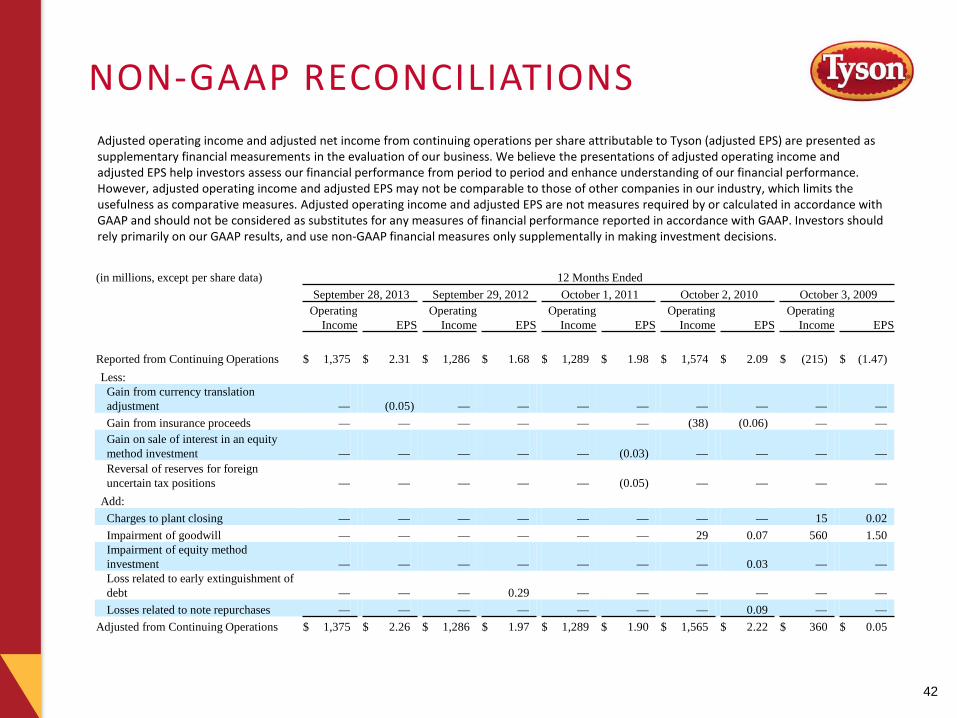
NON-GAAP RECONCILIATIONS Adjusted operating income and adjusted net income from continuing operations per share attributable to Tyson (adjusted EPS) are presented as supplementary financial measurements in the evaluation of our business. We believe the presentations of adjusted operating income and adjusted EPS help investors assess our financial performance from period to period and enhance understanding of our financial performance. However, adjusted operating income and adjusted EPS may not be comparable to those of other companies in our industry, which limits the usefulness as comparative measures. Adjusted operating income and adjusted EPS are not measures required by or calculated in accordance with GAAP and should not be considered as substitutes for any measures of financial performance reported in accordance with GAAP. Investors should rely primarily on our GAAP results, and use non-GAAP financial measures only supplementally in making investment decisions.
(in millions, except per share data) 12 Months Ended September 28, 2013 September 29, 2012 October 1, 2011 October 2, 2010 October 3, 2009
Operating
Income EPS Operating
Income EPS Operating
Income EPS Operating
Income EPS Operating
Income EPS
Reported from Continuing Operations $ 1,375 $ 2.31 $ 1,286 $ 1.68 $ 1,289 $ 1.98 $ 1,574 $ 2.09 $ (215) $ (1.47) Less:
Gain from currency translation adjustment — (0.05 ) — — — — — — — — Gain from insurance proceeds — — — — — — (38) (0.06) — — Gain on sale of interest in an equity method investment — — — — — (0.03) — — — — Reversal of reserves for foreign uncertain tax positions — — — — — (0.05) — — — —
Add: Charges to plant closing — — — — — — — — 15 0.02 Impairment of goodwill — — — — — — 29 0.07 560 1.50 Impairment of equity method investment — — — — — — — 0.03 — — Loss related to early extinguishment of debt — — — 0.29 — — — — — — Losses related to note repurchases — — — — — — — 0.09 — —
Adjusted from Continuing Operations $ 1,375 $ 2.26 $ 1,286 $ 1.97 $ 1,289 $ 1.90 $ 1,565 $ 2.22 $ 360 $ 0.05
42
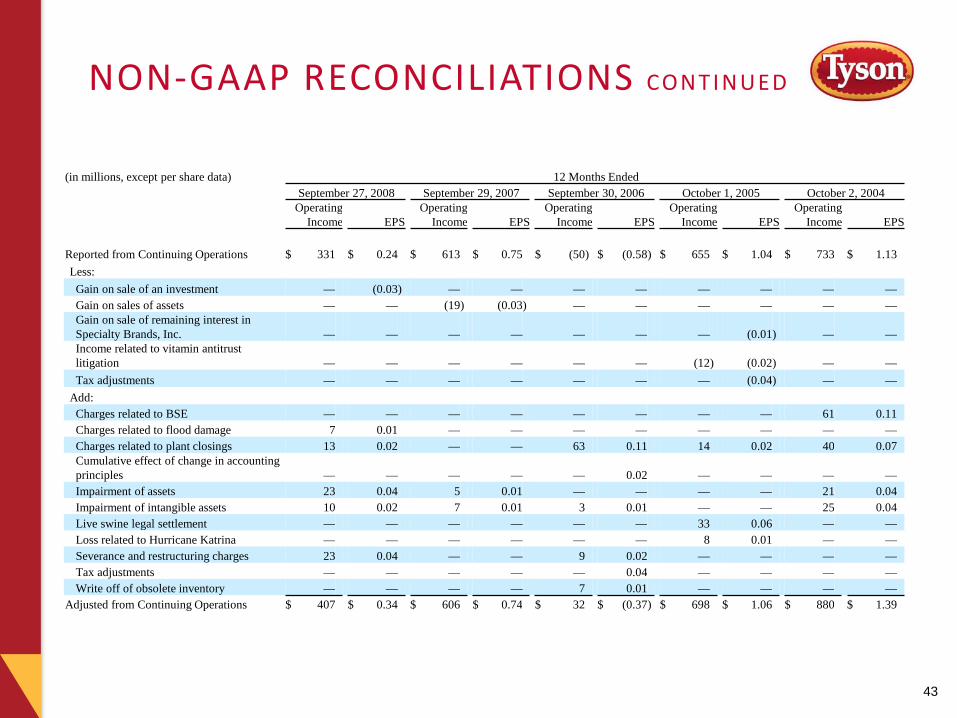
NON-GAAP RECONCILIATIONS CON TI N UED
(in millions, except per share data) 12 Months Ended September 27, 2008 September 29, 2007 September 30, 2006 October 1, 2005 October 2, 2004
Operating
Income EPS Operating
Income EPS Operating
Income EPS Operating
Income EPS Operating
Income EPS Reported from Continuing Operations $ 331 $ 0.24 $ 613 $ 0.75 $ (50 ) $ (0.58 ) $ 655 $ 1.04 $ 733 $ 1.13 Less:
Gain on sale of an investment — (0.03 ) — — — — — — — — Gain on sales of assets — — (19 ) (0.03 ) — — — — — — Gain on sale of remaining interest in Specialty Brands, Inc. — — — — — — — (0.01 ) — — Income related to vitamin antitrust litigation — — — — — — (12 ) (0.02 ) — — Tax adjustments — — — — — — — (0.04 ) — —
Add: Charges related to BSE — — — — — — — — 61 0.11 Charges related to flood damage 7 0.01 — — — — — — — — Charges related to plant closings 13 0.02 — — 63 0.11 14 0.02 40 0.07 Cumulative effect of change in accounting principles — — — — — 0.02 — — — — Impairment of assets 23 0.04 5 0.01 — — — — 21 0.04 Impairment of intangible assets 10 0.02 7 0.01 3 0.01 — — 25 0.04 Live swine legal settlement — — — — — — 33 0.06 — — Loss related to Hurricane Katrina — — — — — — 8 0.01 — — Severance and restructuring charges 23 0.04 — — 9 0.02 — — — — Tax adjustments — — — — — 0.04 — — — — Write off of obsolete inventory — — — — 7 0.01 — — — —
Adjusted from Continuing Operations $ 407 $ 0.34 $ 606 $ 0.74 $ 32 $ (0.37 ) $ 698 $ 1.06 $ 880 $ 1.39
43