Embed Size (px)
DESCRIPTION
For the Hera Group, the Sustainability Report is a primary tool for reporting on its activities and results in the economic, environmental and social fields, as well as a fundamental tool for providing information to and dialoguing with stakeholders. Since 2008, the Sustainability Report has been approved by the Board of Directors of Hera S.p.A. when the Financial Statements are approved; this aspect testifies to the role that this instrument has within the company’s planning and control system. Dedicated meetings have increased the distribution across communities served, with the distribution to all customer branches and through local press, to all employees and other various stakeholders. Hera’s Sustainability Report provides the principles which guide our actions, the performance achieved, the objectives reached compared to stated and future objectives, the results of our dialogue with stakeholders and projects in the field. Within the Report, particular importance was accorded to local projects.
Citation preview

287.9INVESTMENTS(millions of Euro)
51.9 %SEPARATE WASTE COLLECTION
Increased growth compared to 2002, which has doubled since 2002
Capital expenditures in the territory continue to be high, 63% greater compared to 2002
20122002
10,862 DIRECT AND INDIRECT EMPLOYMENT
The Group has 6,629 direct and indirect employees, in addition to a work force estimated at 4,233 units in 2012 generated by supply orders
2012
2002
Contains fi gures
for the three areas
of responsibility:
economic, social
and environmental.
Focus on commitments
made, the results
obtained and the
outlook for the future.
THE RESULTS OF TEN YEARS OF ACTIVITY SUSTAINABILITY REPORT 2012
THE HERA GROUP: COMMITTED TO A SUSTAINABLE TERRITORY
2
Contents The Report .................................................................................................................................................. 4
Reading this Report ................................................................................................................................................ 4 Drawing up this report ........................................................................................................................................... 6
About us .................................................................................................................................................... 11 Hera today ............................................................................................................................................................. 11 History ................................................................................................................................................................... 12 Services managed .................................................................................................................................................. 13 The mission and values ......................................................................................................................................... 14 Managing sustainability ....................................................................................................................................... 15 The instruments of governance............................................................................................................................ 23 The Organisation .................................................................................................................................................. 27 Governing Corporate Social Responsibility ....................................................................................................... 29
Dialogue with stakeholders ...................................................................................................................... 40 Hera’s stakeholders .............................................................................................................................................. 40 Dialogue and consultation initiatives................................................................................................................... 41 Dialogue on the Sustainability Report ................................................................................................................ 43
Results and Value added .......................................................................................................................... 45 Operating results .................................................................................................................................................. 45 Allocation of value added ..................................................................................................................................... 51
Workforce ................................................................................................................................................. 56 Objectives and performance ................................................................................................................................ 56 Breakdown ............................................................................................................................................................ 57 Turnover ................................................................................................................................................................ 62 Diversity and equal opportunities ....................................................................................................................... 64 Training and professional development .............................................................................................................. 69 Pay, salaries and bonuses ..................................................................................................................................... 74 Health and safety .................................................................................................................................................. 77 Industrial relations ............................................................................................................................................... 85 Internal communication ....................................................................................................................................... 88 Recreational associations ..................................................................................................................................... 91 The internal climate survey ................................................................................................................................. 91 Other dialogue and consultation initiatives ........................................................................................................ 94
Customers ................................................................................................................................................. 95 Objectives and performance ................................................................................................................................ 95 Breakdown ............................................................................................................................................................ 96 Service quality ..................................................................................................................................................... 113 Quality of drinking water ................................................................................................................................... 118 Service safety and continuity ............................................................................................................................. 123 Customer relations ............................................................................................................................................. 130 Customer satisfaction survey ............................................................................................................................. 137 Other dialogue and consultation initiatives ...................................................................................................... 140
Shareholders ........................................................................................................................................... 142 Objectives and performance .............................................................................................................................. 142 Breakdown .......................................................................................................................................................... 142 Corporate Governance and safeguards for shareholders ................................................................................ 145 Distribution of dividends .................................................................................................................................... 146 Stock exchange share performance ................................................................................................................... 146 Relations with investors and financial analysts ................................................................................................ 149
Financial Institutions ............................................................................................................................. 151 Public Administration ............................................................................................................................ 171
Breakdown .......................................................................................................................................................... 171 Relationships with municipalities and other local authorities......................................................................... 172 Relations with regulatory and supervisory authorities .................................................................................... 173 Research projects ................................................................................................................................................ 181 Disputes ............................................................................................................................................................... 184
Local Communities ................................................................................................................................. 187 Objectives and performance .............................................................................................................................. 187 Breakdown .......................................................................................................................................................... 188 Communication ................................................................................................................................................... 188 Environmental education ................................................................................................................................... 191 Media relations ................................................................................................................................................... 193

3
Sponsorships and donations ............................................................................................................................... 194 Environmental provisions and compensations relating to new Hera plants .................................................. 198 Associations and Hera membership .................................................................................................................. 202 Dialogue with local communities ....................................................................................................................... 203
The environment and future generations ............................................................................................. 207 Objectives and performance .............................................................................................................................. 207 Environmental aspects of the activities managed by Hera .............................................................................. 208 Energy production .............................................................................................................................................. 210 Energy consumption ........................................................................................................................................... 222 Production and distribution of water ................................................................................................................ 226 Wastewater purification quality ........................................................................................................................ 230 Atmospheric emissions ....................................................................................................................................... 235 Greenhouse gas emissions .................................................................................................................................. 247 Waste collection .................................................................................................................................................. 249 Separate waste collection.................................................................................................................................... 256 Waste disposal ..................................................................................................................................................... 264 Waste produced by Hera .................................................................................................................................... 273 Biodiversity ......................................................................................................................................................... 274
Appendices .............................................................................................................................................. 276
4
The Report
Reading this Report
For the Hera Group, the Sustainability Report is a primary tool for reporting on its activities and results in the economic, environmental and social fields, as well as a fundamental tool for providing information to and dialoguing with stakeholders. Since 2008, the Sustainability Report has been approved by the Board of Directors of Hera S.p.A. when the Financial Statements are approved; this aspect testifies to the role that this instrument has within the company’s planning and control system. Dedicated meetings have increased the distribution across communities served, with the distribution to all customer branches and through local press, to all employees and other various stakeholders. Hera’s Sustainability Report provides the principles which guide our actions, the performance achieved, the objectives reached compared to stated and future objectives, the results of our dialogue with stakeholders and projects in the field. Within the Report, particular importance was accorded to local projects. Some of the technical terms used in this document are defined in the attached glossary. This Sustainability Report, the eleventh published by the Hera Group, can also be viewed on the internet site www.gruppohera.it, where it can be downloaded both in Italian and English. An accessible version of the report is available on the Group’s internet site, in Italian and in English, which includes further documentation and details. The document indicates the issues for which additional information is available on the website. You will find an assessment sheet in this report. It is extremely important for us to receive information since this will enable us to improve the content matter and presentation of the Sustainability Report: just fill in the attached form and send it back to us. We hope you enjoy reading our report! The greenhouse gas emissions created by the use of paper for the preparation of this Sustainability Report have been neutralised thanks to Hera’s compliance with GAIA, the Life project jointly funded by the European Commission and furthered by the Municipality of Bologna in partnership with Cittalia, Impronta Etica, CNR and Unindustria Bologna, with the aim of increasing green areas in the city of Bologna by means of planting new trees. Hera’s compliance with GAIA during 2013 took practical shape in the start of the “Give a tree to your city” campaign, promoting online bills. Through this campaign, Hera aims to plant two thousand new trees in urban areas. The number of trees required to neutralise this Report will be added. Hera is a member of Impronta Etica, an association for promoting Corporate Social Responsibility.
5
Information: Corporate Social Responsibility Department, Hera S.p.A. Viale Carlo Berti Pichat 2/4 40127 Bologna Tel. + 39 051.287.038 Fax + 39 051.287.224 [email protected] www.gruppohera.it
6
Drawing up this report
Standards The 2012 Sustainability Report was drawn up on the basis of the AA1000 standard which provides the steps required for preparing social and sustainability reports. The report content matter was selected in compliance with GRI and GBS guidelines, and taking into consideration the information deemed useful for corporate stakeholders. In this issue of the report, guideline G3 (3.1 version) is used as a reference for the sixth year and the sectorial supplement dedicated to the Electric Utility sector (Final Version of the Sustainability Reporting Guidelines & Electric Utility Sector Supplement approved in April 2009) is used for the fourth year. The G3 Reporting Guidelines were drawn up in 2006 by the Global Reporting Initiative to evaluate the economic, environmental and social performance of companies; in March 2011, the 3.1 version of the guidelines was published with additions specifically concerning local communities, human rights and gender problems. The Electric Utility supplement was created in 2009 by the Global Reporting Initiative and contains specific indicators for the electric utility sector; the Gruppo di Studio per il Bilancio Sociale (GBS) had, instead, proposed its Principles for the Preparation of Social Report in 2001. On 8 June 2004, the Hera Group ratified its commitment to the aims of the Global Compact, an international declaration of the intention to obtain consensus and support for certain fundamental principles and relating to standards applying to work, human rights and environmental safeguards. In 2011, Hera’s annual communication on progress achieved, represented by the Sustainability Report, was acknowledged as of an advanced level within the Differentiation Programme launched by Global Compact in February 2011.
Structure of the document The first two sections of the report provide an account of how the company was created, its identity, mission, corporate strategies, sustainability policies and the key indicators for assessing economic, environmental and social sustainability. The third section describes the methods applied for the dialogue with stakeholders. The fourth section highlights corporate economic returns by means of the methodology based on value added allocated to stakeholders proposed by the GBS. The next sections provide an account of the results achieved for each class of stakeholder, given as performance ratings of a qualitative and quantitative nature and related to the objectives set forth in the previous report and achievement of these. In each section, the stakeholder listening, dialogue and involvement initiatives are indicated. The objectives for the coming years for each class of stakeholder have been set in line with the company’s strategic planning instruments; in certain cases, future targets which the company has committed to have been specified with numeric indicators.
7
Reporting actions The Report is drawn up on a yearly basis through a process that follows the steps indicated in Guideline AA1000. An internal procedure was issued in January 2012 for the preparation of the Sustainability Report, which describes the activities required for planning, achieving, approving, disclosing and presenting the report and the associated responsibilities. The social and environmental sustainability objectives set out in the Report have been defined with reference to the planning and control instruments used by the Group: Business Plan 2012-2016, Budget 2013 and Balanced Scorecard 2013. These interconnected instruments contain sustainability objectives which have an effect on stakeholders. In particular, the Business Plan 2012-2016 includes further sustainability-related indicators for which quantitative targets have been defined. The final data collection actions required for the report entailed the distribution of forms providing the technical indications used to construct the indicators. Lastly, in defining the contents of this Report, with the objective of complying as fully as possible with the principle of “materiality” of the GRI guidelines, the results of the analysis of the 2012 press review, blog, forum and newsgroup as well as the results of the activities for stakeholder involvement were considered.
SA8000 Reporting This Sustainability Report is the tool for external communication and for stakeholder engagement support, set out in the SA8000 standard, which started to be applied in Hera in 2012. During this phase, the standard was applied to Hera S.p.A., i.e. to the working conditions of the parent company’s 4,109 employees (around 63% of the Group’s employees). During a second phase starting in 2014, the standard will be extended in order to reach over 91% of Group employees (with the exception of Marche Multiservizi).
The Guidance Committee for the Sustainability Report and the work group The reporting process was led by a Guidance Committee composed of the Chief Executive Officer, the General Manager of Operations, the Corporate Social Responsibility Manager, the Energy Manager, the Quality, Safety and Environment Manager, the Chief Executive Officer of Hera Comm, the Water Manager, the External Relations Manager, the Chief Executive Officer of Herambiente, the person in charge of Management Control, the Environmental Services Manager, the Technology and Development Manager, the Administration, Finance and Control Manager, the Operations Technical Services Manager, the General Manager for Development and the Market, and the Customer Technical Manager. This report was drawn up by the Corporate Social Responsibility Department of Hera S.p.A., with the participation of numerous contacts, both in terms of data collection and for the descriptions and comments.
8
Guidance Committee: Maurizio Chiarini, Roberto Barilli, Filippo M. Bocchi, Angelo Bruschi, Ennio Dottori, Cristian Fabbri, Franco Fogacci, Giuseppe Gagliano, Claudio Galli, Rita Malossi, Tiziano Mazzoni, Salvatore Molè, Luca Moroni, Franco Sami, Stefano Venier, Susanna Zucchelli. Corporate Social Responsibility Department: Filippo M. Bocchi, Paola Brandolini, Benny Buozzi, Gabriele Magli, Gianluca Principato. The following persons contributed to the preparation of the 2012 Sustainability Report. Luciano Agostini; Patrizia Albertazzi; Marta Alesi; Stefano Amaducci; Marco Amesso; Roberto Anello; Claudio Anzalone; Alberto Apollo; Alessandro Armuzzi; Claudio Artioli; Silvia Baccarani; Stefano Baldassini; Valentina Balducci; Teresa Barbera; Sergio Baroni; Cinzia Barraco; Andrea Basso; Alessandro Battistini; Roberto Bazzani; Paola Bazzocchi; Beatrice Beleggia; Marina Bellei; Denis Benati; Davide Bigarelli; Cecilia Bondioli; Enrico Bordigoni; Paolo Bosi; Sandro Bosso; Carlo Botti; Giacomo Bracali; Guglielmo Calabrese; Alessandro Camilleri; Raffaella Camporesi; Giancarlo Campri; Ugo Canonico; Chiara Canova; Andrea Capano; Emilio Caporossi; Matteo Capponcelli; Alessandra Cascone; Dario Casone; Michele Castaldini; Giovanna Cavazzuti; Paolo Cecchin; Massimo Chiacchiararelli; Gaia Cioci; Claudio Coltelli; Luigi Coluccio; Giovanna Coppini; Michele Corradini; Elisa Costa; Adriana Covizzi; Barbara Cremonini; Margherita Cumani; Cristina Dal Pozzo; Giuseppe D'Aleo; Roberto Dardi; Isabella Data; Giuseppe Devoto; Stefano Di Tillo; Alessia Evangelisti; Cristian Eziotti; Franco Fabbri; Mila Fabbri; Erika Fabbri; Roberto Fabbri; Dario Farina; Gian Battista Fauchè; Fausto Ferraresi; Carlo Ferri; Fabrizio Ferri; Giovanna Filanti; Stefano Filipponio; Riccardo Finelli; Mara Fiorini; Matteo Foschi; Giacomo Fossi; Alessandro Gaddoni; Francesco Galasso; Alessandra Galeotti; Cristina Gasperini; Loris Gavagna; Patrizia Gavioli; Elena Giudice; Luca Giulianelli; Daniele Giunchi; Giorgio Golinelli; Francesco Gramolini; Claudia Grassi; Filippo Gridelli; Marcello Guerrini; Monica Guidi; Valeria Guizzardi; Jens Klint Hansen; Salvatore Rudi Iaconis; Marco Impiglia; Sabina Isidori; Katia Laffi; Chiara Lambertini; Fortuna Laselva; Lorenzo Lazzaroni; Davide Lombardi; Patrizia Lombardi; Marco Longo; Nicoletta Lorenzi; Barbara Lucchesi; Maurizio Magagni; Maria Cristina Magni; Micaela Maini; Marco Malagoli; Isabella Malagoli; Stefania Malorzo; Fabio Marcantonini; Elena Marchetti; Luca Marchi; Leonarda Maresta; Fabio Martelli; Michele Martignani; Danilo Mascheroni; Pietro Carlo Masetti Calzolari; Barbara Masia; Fabrizio Mazzacurati; Laura Minelli; Beatrice Montanari; Anna Montanari; Daniela Montani; Antonio Monteleone; Mariarita Montevecchi; Susanna Morelli; Alessandro Morgagni; Catia Musolesi; Pietro Musolesi; Roberto Mussoni; Daniele Nasci; Cecilia Natali; Vincenzo Palazzo; Paolo Paoli; Andreas Papageorgiou; Valentina Pasolini ; Alessandro Pastorino; Roberta Pè; Diego Pedrini; Stefano Pelliconi; Carla Petraglia; Angelo Pettazzoni; Silvia Pfnister; Rossana Piovani; Paola Piraccini; Alessandra Piromallo; Claudio Poli; Lorenzo Pompei; Cinzia Pozzetti; Daniela Pulvirenti; Andrea Ramonda; Gian Carlo Randi; Roberto Raneri; Luigi Ranieri; Giulio Renato; Carmelo Mario Riccio; Marcello Rita; Barbara Romualdi; Michela Ronci; Valeria Rosati; Raffaella Rossi; Simone Rossi; Maria Cristina Rovini; Giovanni Sandei; Stefania Santacroce; Marco Santandrea; Andrea Santinelli; Alberto Santini; Marco Sarracino; Annalisa Schiavo; Pietro Selleri; Andrea Serra; Walther Sirri; Carlo Sussi; Paolo Tangerini; Ivan Tani; Mauro Tiviroli; Massimo Vai; Gianluca Valentini; Stefano Venturi; Marco Venturi; Carlotta Venturoli; Roberta Veronesi; Elmo Veronesi; Daniele Villano Rispoli; Leo Violi; Stefania Virgili; Danilo Vivarelli; Paolo Zaccherini; Alfonso Zagarrì; Emanuel Zamagni; Raffaella Zanfini; Giulia Zanotti; Federico Zonarelli; Chiara Zotti.
Scope of reporting The scope of this document includes all the companies in the Hera Group, consolidated using the line-by-line method in the Group’s consolidated financial statements. Furthermore, the companies in which the Group holds investments, Calenia Energia (parent company holding of 15%) and SET (parent company holding of 39%), which manage two electricity power stations, were also considered only insofar as the aspects involving atmospheric emissions. Compared to 2011 the scope of reporting includes the
9
following companies: Energonut (which manages a waste-to-energy treatment plant in Molise and became part of the scope of consolidation in October 2012), Feronia (which manages a landfill in Finale Emilia, Modena, and became part of the scope of consolidation in January 2012) and Sviluppo Ambiente Toscana (which supervises the construction of the waste-to-energy plant of Sesto Fiorentino, Florence). Again, compared to 2011, the merger by incorporation in December 2012 of Marche Multiservizi Falconara (company managing the environmental services in 6 municipalities in the province of Ancona) in Marche Multiservizi and the sale of the business unit dealing with the Bologna cemetery services to Hera Servizi Cimiteriali is reported. In certain cases, the findings do not tally fully with the report, in terms of scope of reporting. The data gaps in question (indicated by notes accompanying the individual tables) may be ascribed, variously, to the lack of certain items, or to the fact that certain items are not sufficiently significant, or to the fact that the pertaining data cannot be collected by applying the same management and recording procedures.
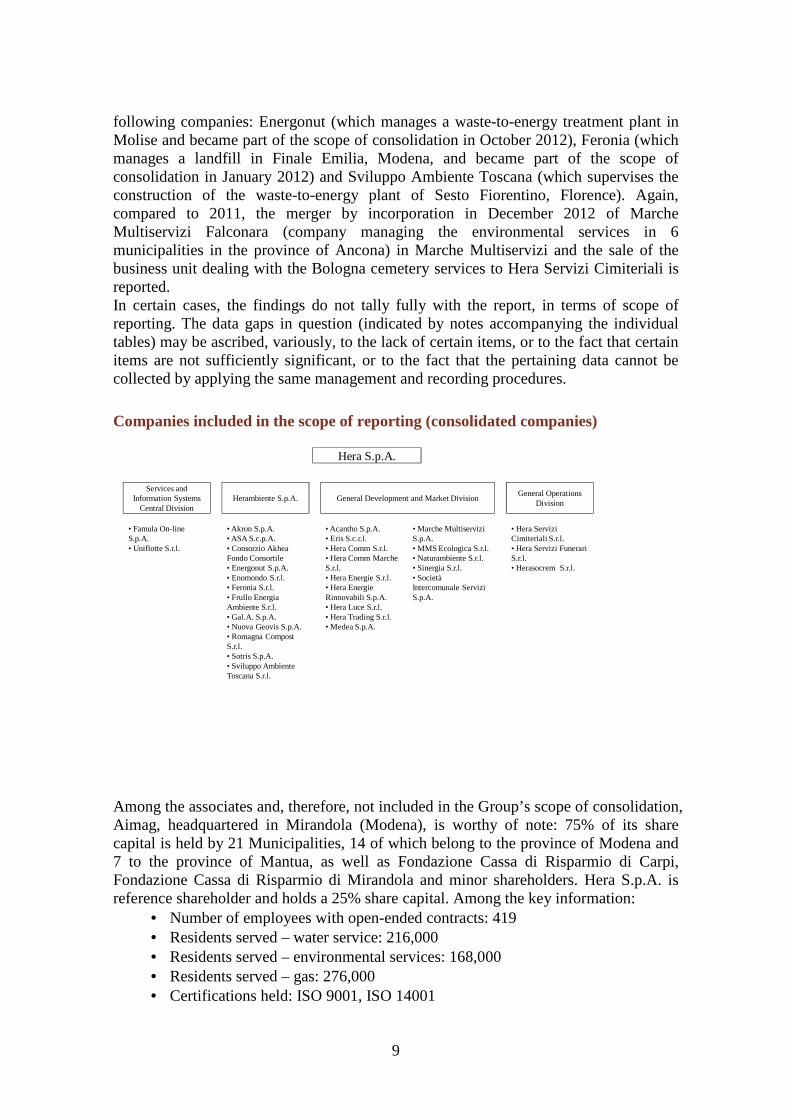
Companies included in the scope of reporting (consolidated companies)
Hera S.p.A.
Services and Information Systems
Central Division
• Famula On-line S.p.A.• Uniflotte S.r.l.
Herambiente S.p.A.
• Akron S.p.A. • ASA S.c.p.A.• Consorzio Akhea Fondo Consortile• Energonut S.p.A.• Enomondo S.r.l.• Feronia S.r.l.• Frullo Energia Ambiente S.r.l. • Gal.A. S.p.A.• Nuova Geovis S.p.A.• Romagna Compost S.r.l.• Sotris S.p.A.• Sviluppo Ambiente Toscana S.r.l.
General Development and Market Division
• Acantho S.p.A.• Eris S.c.r.l.• Hera Comm S.r.l.• Hera Comm Marche S.r.l.• Hera Energie S.r.l.• Hera Energie Rinnovabili S.p.A.• Hera Luce S.r.l.• Hera Trading S.r.l.• Medea S.p.A.
• Marche Multiservizi S.p.A.• MMS Ecologica S.r.l.• Naturambiente S.r.l.• Sinergia S.r.l.• Società Intercomunale Servizi S.p.A.
• Hera Servizi Cimiteriali S.r.l.• Hera Servizi Funerari S.r.l.• Herasocrem S.r.l.
General Operations Division
Among the associates and, therefore, not included in the Group’s scope of consolidation, Aimag, headquartered in Mirandola (Modena), is worthy of note: 75% of its share capital is held by 21 Municipalities, 14 of which belong to the province of Modena and 7 to the province of Mantua, as well as Fondazione Cassa di Risparmio di Carpi, Fondazione Cassa di Risparmio di Mirandola and minor shareholders. Hera S.p.A. is reference shareholder and holds a 25% share capital. Among the key information:
• Number of employees with open-ended contracts: 419 • Residents served – water service: 216,000 • Residents served – environmental services: 168,000 • Residents served – gas: 276,000 • Certifications held: ISO 9001, ISO 14001
10
In 2012, Aimag was awarded with the Oscar di Bilancio award in the category of unlisted small-medium enterprises since “submitting a clear and complete reporting of the objectives achieved and of those planned for the following three-year period”.
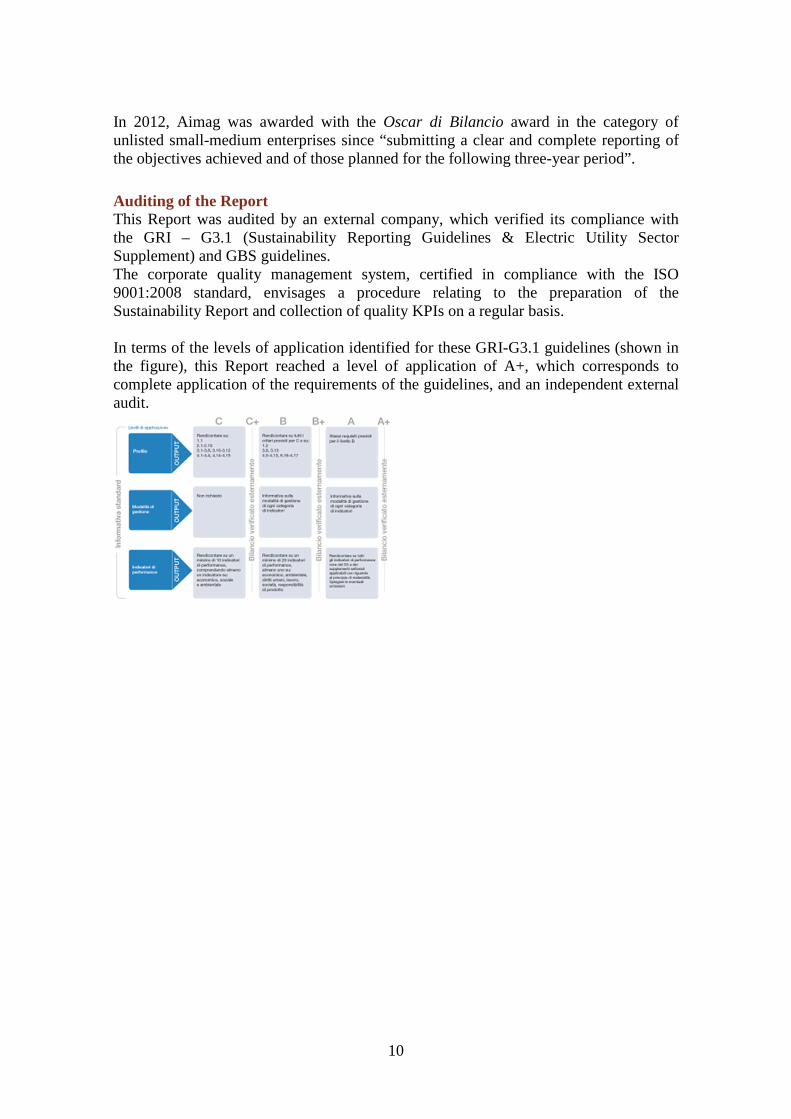
Auditing of the Report This Report was audited by an external company, which verified its compliance with the GRI – G3.1 (Sustainability Reporting Guidelines & Electric Utility Sector Supplement) and GBS guidelines. The corporate quality management system, certified in compliance with the ISO 9001:2008 standard, envisages a procedure relating to the preparation of the Sustainability Report and collection of quality KPIs on a regular basis. In terms of the levels of application identified for these GRI-G3.1 guidelines (shown in the figure), this Report reached a level of application of A+, which corresponds to complete application of the requirements of the guidelines, and an independent external audit.
11
About us
Hera today
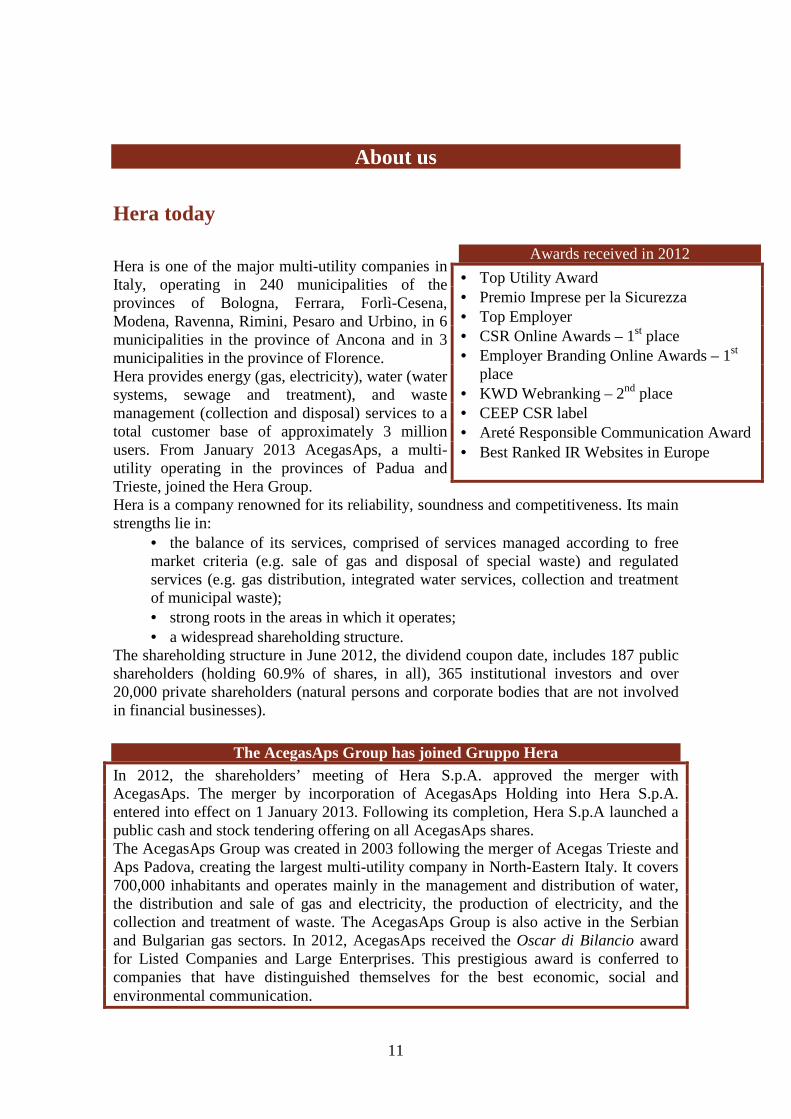
Hera is one of the major multi-utility companies in Italy, operating in 240 municipalities of the provinces of Bologna, Ferrara, Forlì-Cesena, Modena, Ravenna, Rimini, Pesaro and Urbino, in 6 municipalities in the province of Ancona and in 3 municipalities in the province of Florence. Hera provides energy (gas, electricity), water (water systems, sewage and treatment), and waste management (collection and disposal) services to a total customer base of approximately 3 million users. From January 2013 AcegasAps, a multi-utility operating in the provinces of Padua and Trieste, joined the Hera Group. Hera is a company renowned for its reliability, soundness and competitiveness. Its main strengths lie in:
• the balance of its services, comprised of services managed according to free market criteria (e.g. sale of gas and disposal of special waste) and regulated services (e.g. gas distribution, integrated water services, collection and treatment of municipal waste); • strong roots in the areas in which it operates; • a widespread shareholding structure.
The shareholding structure in June 2012, the dividend coupon date, includes 187 public shareholders (holding 60.9% of shares, in all), 365 institutional investors and over 20,000 private shareholders (natural persons and corporate bodies that are not involved in financial businesses).
The AcegasAps Group has joined Gruppo Hera In 2012, the shareholders’ meeting of Hera S.p.A. approved the merger with AcegasAps. The merger by incorporation of AcegasAps Holding into Hera S.p.A. entered into effect on 1 January 2013. Following its completion, Hera S.p.A launched a public cash and stock tendering offering on all AcegasAps shares. The AcegasAps Group was created in 2003 following the merger of Acegas Trieste and Aps Padova, creating the largest multi-utility company in North-Eastern Italy. It covers 700,000 inhabitants and operates mainly in the management and distribution of water, the distribution and sale of gas and electricity, the production of electricity, and the collection and treatment of waste. The AcegasAps Group is also active in the Serbian and Bulgarian gas sectors. In 2012, AcegasAps received the Oscar di Bilancio award for Listed Companies and Large Enterprises. This prestigious award is conferred to companies that have distinguished themselves for the best economic, social and environmental communication.
Awards received in 2012
• Top Utility Award • Premio Imprese per la Sicurezza • Top Employer • CSR Online Awards – 1st place • Employer Branding Online Awards – 1st
place • KWD Webranking – 2nd place • CEEP CSR label • Areté Responsible Communication Award • Best Ranked IR Websites in Europe
12
2012 AcegasAps figures are reported below: • Turnover of Euro 626 million • EBITDA of Euro 129 million • 1,800 employees • 700 thousand inhabitants served
History
The group was founded at the close of 2002 following one of the most significant business combination operations ever conducted in Italy within the public utilities sector. After its establishment, deriving from the merger of 11 local public service concerns, the company was partly privatized via the placing of 44.5% of the share capital on the Milan stock exchange (Borsa di Milano). The shared aggregation process which led to the formation of Hera has continued over time through various operations concentrated on companies in the energy, water and waste management sectors, operating in geographical areas bordering the areas managed. The following are the most significant operations. Agea joined Hera in 2004 (Agea is an energy and waste management operator in the province of Ferrara), as did Acosea (integrated water service in the province of Ferrara) and Ecologia Ambiente (treatment of special waste). The merger with Meta took place in September 2005. Meta is operational in Modena in the energy, water and environmental sectors. The company Geat Distribuzione Gas (gas distribution in Riccione) merged with the group in early 2006. Always in 2006, Hera acquired the power grid from Enel in 18 municipalities in the province of Modena, and increased its equity investment in the companies Aspes Multiservizi and acquired an equity investment in SAT (multiutilities operating respectively in the provinces of Pesaro and Urbino and Modena). In 2007 the merger between Megas of Urbino and Aspes Multiservizi of Pesaro gave rise to a new company, Marche Multiservizi of which the Hera Group will hold 41.8%. The merger takes effect on 1 January 2008. Also in 2007, the merger of SAT S.p.A. into Hera S.p.A. was approved, with effective date of 1 January 2008. Since 2009 Hera holds 25% of the share capital of Aimag, multi-utility operating in the provinces of Modena and Mantua. In 2011, the merger by incorporation of Sadori Gas into Hera Comm Marche, a subsidiary of Hera Comm which it now holds a stake of 57.38%. Among the extraordinary operations of 2012 was the acquisition by Herambiente SpA of an additional stake in the share capital of Feronia Srl, a company operating in the environmental sector in the province of Modena, coming to hold a stake of 70% and the acquisition by Herambiente of the entire share capital of Energonut SpA, owner of a waste incineration plant located in Molise. Lastly, the merger by incorporation of AcegasAps Holding into Hera S.p.A. is planned for 2013.

13
Services managed
Energy services Water services Waste Management Services
Sale and distribution of gas and electricity. District heating, heat management and public lighting
Integrated water services (civil and industrial water system, sewerage and purification)
Collection, recovery, treatment and disposal of urban and special waste
Customers Gas: 1.1 million Electricity: 541,000
Water 1.2 million
Municipalities served Gas distribution: 167 Electricity distribution: 24 District Heating: 8 Public lighting: 59 Heat management: 162
Water system: 225 Sewerage and purification: 227
Waste collection: 187
Residents served 2.5 million 3.1 million 2.8 million Volumes Gas sold: 3.5 billion
cubic metres Electricity sold: 9.5 TWh
Water sold: 252.7 million cubic metres
Waste collected: 1.8 million tons Waste disposed of: 4.9 million tons
Customers and municipalities served in the local areas*
FerraraEnergy services: 202 thousand (56%)Water services: 256 thousand (71%)Waste management services : 135 thousand (38%)
RavennaEnergy services: 242 thousand (87%)Water services: 279 thousand (100%)Waste management services : 279 thousand (100%)
RiminiEnergy services: 36 thousand (11%)Water services: 331 thousand (100%)Waste management services : 314 thousand (95%)
Marche MultiserviziEnergy services: 250 thousand (68%)Water services: 287 thousand (78%)Waste management services : 274 thousand (75%)
Imola-FaenzaEnergy services: 195 thousand (76%)Water services: 257 thousand (100%)Waste management services : 257 thousand (100%)
BolognaEnergy services: 810 thousand (94%)Water services: 845 thousand (98%)Servizi ambientali: 688 thousand (79%)
ModenaEnergy services: 476 thousand (67%)Water services: 467 thousand (66%)Waste management services : 495 thousand (70%)
Hera GroupEnergy services: 2,6 million (71%), 171 municipalitiesWater services: 3,1 million (88%), 227 municipalitiesServizi ambientali: 2,8 million (80%), 187 municipalities
Forlì-CesenaEnergy services: 329 thousand (83%)Water services: 398 thousand (100%)Waste management services : 398 thousand (100%)
* Number of municipalities and residents in the municipalities in which Hera manages at least one energy service (distribution of gas or electricity, or district heating), water service (water systems, sewage or

14
purification) and waste management service (separated or non-separated waste collection, or sweeping) and the percentage of total residents in the province or the area of reference (as at 1 January 2012, source: Emilia-Romagna region).
The mission and values
The mission
“Hera’s goal is to be the best multi-utility in Italy for its customers, workforce and shareholders. It aims to achieve this through further development of an original corporate model capable of innovation and of forging strong links with the areas in which it operates by respecting the local environment. For Hera, being the best means inspiring the pride and trust of:
• customers, who receive, thanks to Hera’s responsiveness to their needs, quality services that satisfy their expectations; • the women and men who work at Hera, whose skills, engagement and passion are the foundation of the company’s success; • shareholders, confident that the economic value of the company will continue to be generated, in full respect of the principles of social responsibility; • the areas in which Hera operates, where economic, social and environmental wealth represent the promise of a sustainable future; • suppliers, key elements in the value chain and partners for growth.”
Charter of values
Integrity : Proud to belong to a group of people known for their honest and upright conduct Transparency: Sincere, clear messages for all stakeholders Personal responsibility: Shared commitment to the good of the company Consistency: Living up to our Mission and Values
Company operational principles
Creation of value and social and environmental responsibility : To be a company that is sustainable in time, and to improve society and the environment for future generations Service quality and excellence: Putting customers first, as a trustworthy provider of services and safety Efficiency: Promoting the value of available resources, never wasting them Innovation and ongoing improvement: Feeling you are part of a team that generates ideas and improvement Engagement and optimisation of personnel: Sharing knowledge for self-improvement and improvement Empowerment to choose: Selecting the optimal solution for growth
15
The company’s Mission, Charter of Values and Operational Principles are set forth and detailed on the Group’s website, on the corporate intranet and in the Code of Ethics, which is revised every three years. The Mission, Charter of Values and Operational Principles were created with the participation of the Hera Group’s entire workforce and were approved by the Board of Directors of Hera S.p.A..
Managing sustainability
Corporate strategy The Hera Group’s strategy is based on the corporate mission and affirms the Group’s desire to guarantee an innovative corporate model based on a multi-business approach with strong roots in the community, which places sustainability as a key element of company choices and lines of development. The Business Plan defined by the Hera Group for the period 2012-2016, takes the direction adopted by the Group since its establishment, following organic growth lines and development through external acquisitions. In particular, the Business Plan addresses the difficult economic, regulatory and competitive environment of today. It provides a series of strategic actions based on the Group’s strong points, such as the expertise gained by the Group and its economic and financial solidity, with a view to anticipating the future dynamics of the sectors it operates in. The main guidelines developed in the Business Plan are:
• drawing value from the Group’s assets and focusing on operational efficiency and on the ongoing improvement of the service levels provided; • strengthening its service portfolio, with a view to maintaining a mix of services ensuring both growth and profitability, while implementing an approach that increasingly focuses on end consumers; • developing networks following a smart area/smart city approach with the aim to ensure that the services provided meet the requirements of the local area; • gradually reviewing the waste disposal plants, with a view to increasing the amount of plants dedicated to the recovery and recycling of materials; • developing initiatives regarding renewable sources; • enhancing organic growth strategies and growth through external acquisitions.
The strategic priorities of the Business Plan have been defined by taking into key consideration sustainability in all its aspects (social, environmental and economic), through:
• ensuring ongoing investment in personnel training, safety at the workplace and internal climate; • reducing CO2 emissions from the Group’s plants; • reducing water leaks and securing water supplies; • maintaining quality and safety standards at levels higher than those required by the regulator and consolidating the quality levels of structures in contact with the customer; • maintaining the characteristics and strong local roots which have characterised the Group’s development since its establishment.

16
• increasing separate waste collection goals throughout all local areas and optimising the management of waste disposal plants; • consolidating the Group’s profitability and its economic and financial balance, increasing the value added distributed in the area.
The strategy outlined in the Business Plan once again confirms the Group’s contribution to growth in both operational and economic terms. In particular, 2016 forecasts report over 2.5 million customers served in the energy sector, totalling 4.5 billion cubic metres of gas and 10.6 TWh of electricity sold, over 90 plants dedicated to waste disposal and recovery (energy and materials) and around 90,000 kilometres of networks managed.
The “balanced” scorecard of the Hera Group
The Balanced Scorecard approach enables us to assign “balanced” objectives to our management team. “Balanced” objectives means objectives distributed over four areas: development, quality and corporate social responsibility, organisational integration, efficiency upgrading. The Balanced Scorecard approach provides a methodology pinpointing strategy which it translates into day-to-day actions and objectives on an organisation-wide basis. The innovation of this approach consists in considering the achievement of strategic objectives of social and environmental sustainability (such as, for example, the involvement of stakeholders, the increased quality of services to customers, the professional development of employees and attention to environmental impact) as a condition for the achievement of the economic and financial objectives over the medium and long term.
What is the balanced scorecard? The balanced scorecard is a strategic control system (which can be linked to an employee incentive system), which is based on the connection between strategy and the day to day running of the company. It was devised in the early 1990’s by the American academics, R. Kaplan and D. Norton. It has generated an immense following among leading corporations in the USA and is now being taken up by major European players.
Each year, the strategic map, updated based on the contents of the business plan, provides a summary of the strategic objectives of the Group and its commitments to stakeholders set forth in the Sustainability Report. To achieve the 29 strategic objectives for the purpose of increasing the company’s long-term value, 42 priority projects were selected during the 2012 budgeting process. These were assigned to members of the Executive Committee. Of these projects, 4 fell within the strategic macro-area of “Involvement of personnel, professional development, dialogue with stakeholders,” 6 within the strategic macro-area of “Optimisation of organisational model and software,” 5 within “Commercial and tariff policy development”, 6 within “Improvement of quality, environmental impact and company image”, 9 within “Development of plants, raw materials and complementary business activities,” and, lastly, 12 projects within “Efficiency and rationalisation”.
17
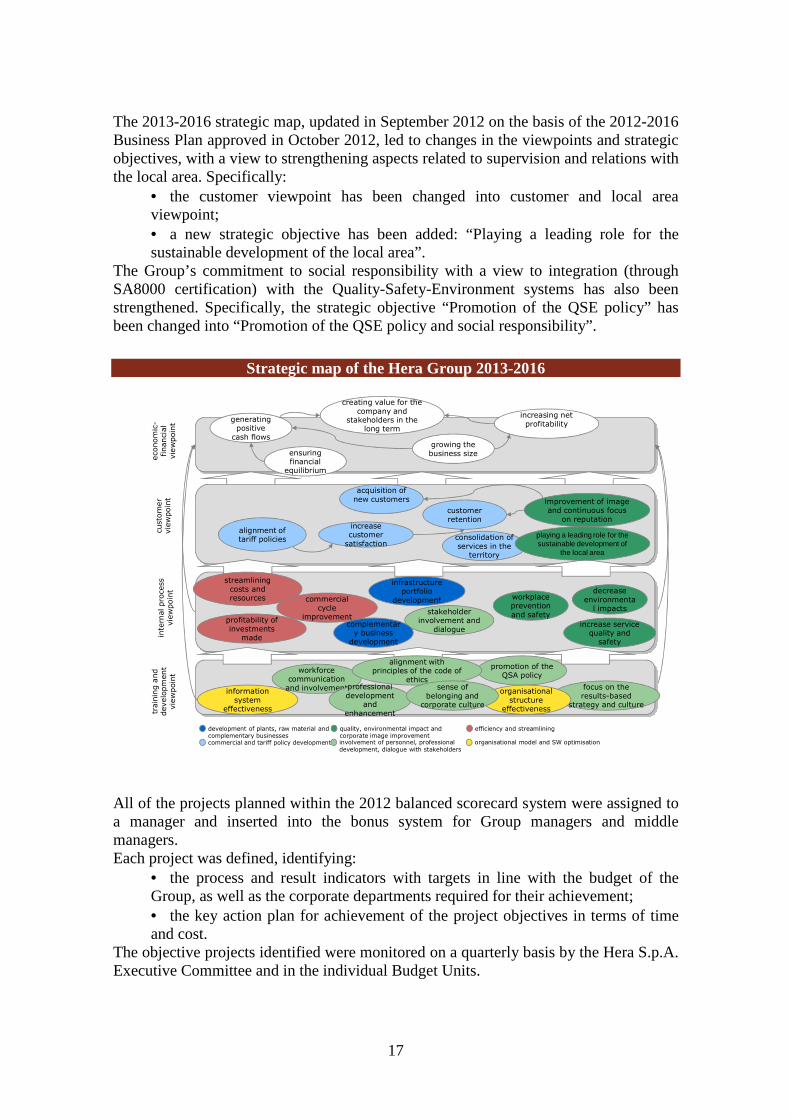
The 2013-2016 strategic map, updated in September 2012 on the basis of the 2012-2016 Business Plan approved in October 2012, led to changes in the viewpoints and strategic objectives, with a view to strengthening aspects related to supervision and relations with the local area. Specifically:
• the customer viewpoint has been changed into customer and local area viewpoint; • a new strategic objective has been added: “Playing a leading role for the sustainable development of the local area”.
The Group’s commitment to social responsibility with a view to integration (through SA8000 certification) with the Quality-Safety-Environment systems has also been strengthened. Specifically, the strategic objective “Promotion of the QSE policy” has been changed into “Promotion of the QSE policy and social responsibility”.
Strategic map of the Hera Group 2013-2016
generating positive
cash flowsgrowing the business size
increasing net profitability
information system
effectiveness
workforce communication
and involvementprofessional development
and enhancement
promotion of the QSA policy
focus on the results-based
strategy and culture
econom
ic-
financi
al
vie
wpoin
t
custo
mer
vie
wpoin
tin
tern
al pro
cess
vie
wpoin
t
train
ing a
nd
develo
pm
ent
vie
wpoin
t
development of plants, raw material and complementary businessescommercial and tariff policy development organisational model and SW optimisationinvolvement of personnel, professional
development, dialogue with stakeholders
quality, environmental impact and corporate image improvement
efficiency and streamlining
decrease environmenta
l impactsstakeholder involvement and
dialogueprofitability of investments
made
infrastructure portfolio
development
customer retention
increase customer
satisfaction
improvement of image and continuous focus
on reputation
creating value for the company and
stakeholders in the long term
alignment with principles of the code of
ethics
streamlining costs and resources
organisational structure
effectiveness
increase service quality and
safety
alignment of tariff policies
complementary business
development
acquisition of new customers
commercial cycle
improvement
sense of belonging and
corporate culture
ensuring financial
equilibrium
workplace prevention and safety
consolidation of services in the
territory
playing a leading role for the sustainable development of
the local area
All of the projects planned within the 2012 balanced scorecard system were assigned to a manager and inserted into the bonus system for Group managers and middle managers. Each project was defined, identifying:
• the process and result indicators with targets in line with the budget of the Group, as well as the corporate departments required for their achievement; • the key action plan for achievement of the project objectives in terms of time and cost.
The objective projects identified were monitored on a quarterly basis by the Hera S.p.A. Executive Committee and in the individual Budget Units.
18
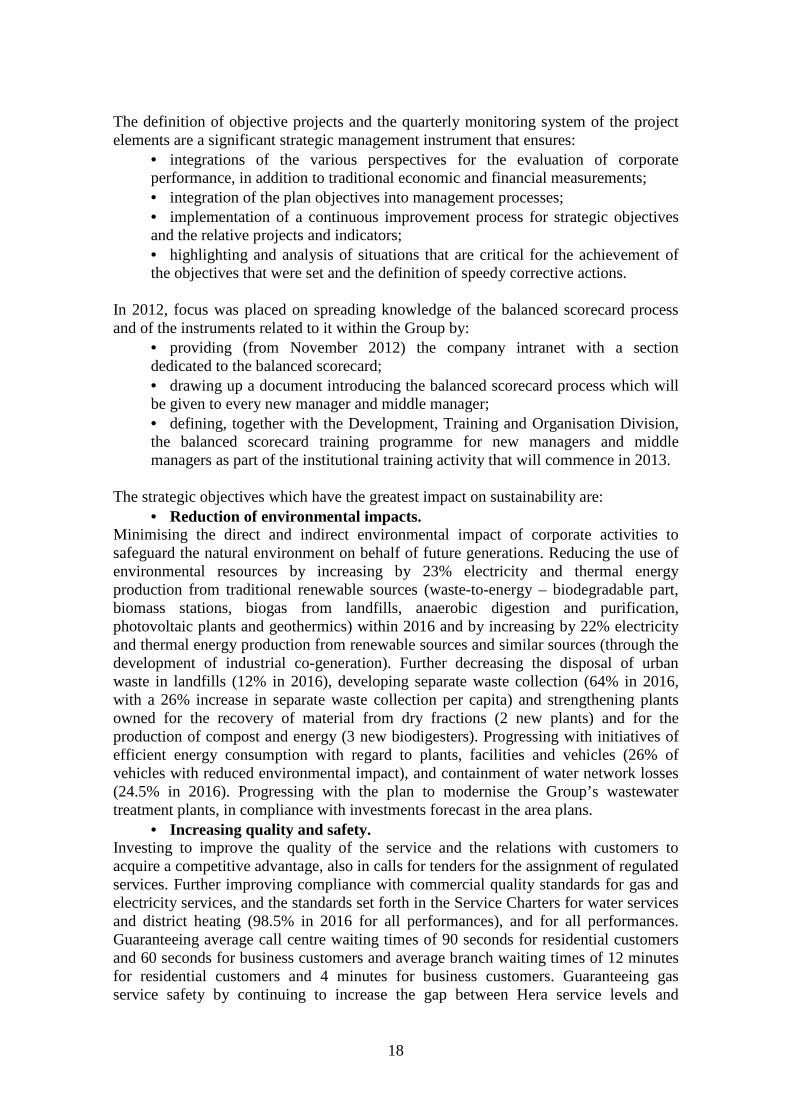
The definition of objective projects and the quarterly monitoring system of the project elements are a significant strategic management instrument that ensures:
• integrations of the various perspectives for the evaluation of corporate performance, in addition to traditional economic and financial measurements; • integration of the plan objectives into management processes; • implementation of a continuous improvement process for strategic objectives and the relative projects and indicators; • highlighting and analysis of situations that are critical for the achievement of the objectives that were set and the definition of speedy corrective actions.
In 2012, focus was placed on spreading knowledge of the balanced scorecard process and of the instruments related to it within the Group by:
• providing (from November 2012) the company intranet with a section dedicated to the balanced scorecard; • drawing up a document introducing the balanced scorecard process which will be given to every new manager and middle manager; • defining, together with the Development, Training and Organisation Division, the balanced scorecard training programme for new managers and middle managers as part of the institutional training activity that will commence in 2013.
The strategic objectives which have the greatest impact on sustainability are:
• Reduction of environmental impacts. Minimising the direct and indirect environmental impact of corporate activities to safeguard the natural environment on behalf of future generations. Reducing the use of environmental resources by increasing by 23% electricity and thermal energy production from traditional renewable sources (waste-to-energy – biodegradable part, biomass stations, biogas from landfills, anaerobic digestion and purification, photovoltaic plants and geothermics) within 2016 and by increasing by 22% electricity and thermal energy production from renewable sources and similar sources (through the development of industrial co-generation). Further decreasing the disposal of urban waste in landfills (12% in 2016), developing separate waste collection (64% in 2016, with a 26% increase in separate waste collection per capita) and strengthening plants owned for the recovery of material from dry fractions (2 new plants) and for the production of compost and energy (3 new biodigesters). Progressing with initiatives of efficient energy consumption with regard to plants, facilities and vehicles (26% of vehicles with reduced environmental impact), and containment of water network losses (24.5% in 2016). Progressing with the plan to modernise the Group’s wastewater treatment plants, in compliance with investments forecast in the area plans.
• Increasing quality and safety. Investing to improve the quality of the service and the relations with customers to acquire a competitive advantage, also in calls for tenders for the assignment of regulated services. Further improving compliance with commercial quality standards for gas and electricity services, and the standards set forth in the Service Charters for water services and district heating (98.5% in 2016 for all performances), and for all performances. Guaranteeing average call centre waiting times of 90 seconds for residential customers and 60 seconds for business customers and average branch waiting times of 12 minutes for residential customers and 4 minutes for business customers. Guaranteeing gas service safety by continuing to increase the gap between Hera service levels and

19
regulatory requirements (network inspections and emergencies). Completing the gas, water and electricity network modelling. Continuing the roll-out plan for electronic gas meters in compliance with legal requirements.
• Playing a leading role for the sustainable development of the local area Enhancing, reporting and communicating Hera’s contribution to the sustainable development of the local area also with regard to other geographical areas. Ensuring the sustainability of the services provided in the area by making investments during the 2012-2016 period (including AcegasAps e Aimag) totalling around Euro 1,900 million: over 1,200 million in the networks (600 million in the integrated water cycle) and almost 500 million in the waste management sector. Regarding network investments, developing smart network sustainability projects (grid, water and gas, lighting and connections). Contributing to the definition of the Regional Waste Plan and playing a leading role in its implementation.
• Workplace prevention and safety. Preventing and reducing occupational health and safety risks through the implementation of management systems, training, the involvement of and raising awareness amongst all workers concerning workplace safety objectives and goals. Repeating the “A year for Safety” programme in all areas with the aim to further reduce the accident indices as set forth in the plan. Gradually extending Hera’s approach to health and safety in the workplace to all suppliers and the monitoring of accident rates to 80% of service and job suppliers in terms of value ordered.
• Dialogue with stakeholders and the local area. Further developing stakeholder involvement and dialogue initiatives, ensuring transparent communication concerning company decisions, which is able to distinguish the Group and make it competitive. Consolidating and promoting, through involvement and dialogue with stakeholders, the model of a socially responsible business capable of reaching a balance between different interests, in order to improve competitiveness over the long term and create shared values in the local areas. Promoting Hera’s contributions to economic, social and environmental development for the local area and for stakeholders, including through specific consultation activities and dialogue with stakeholders.
• Communication and workforce involvement. Implementing systematic instruments for dialogue with the workforce and adopting the consequent corrective actions (biennial internal climate surveys and improvement plans, downward communication, meetings between Top Management and employees, etc.). Further improving the internal communication tools. Sharing strategies and objectives during annual company-wide meetings. Maintaining the positive internal climate index trend, reaching an ESI of 68 in 2015.
• Career advancement and efficient use of skills and know-how. Strengthening the institutional and managerial training model and making learning processes more efficient to support technological and organisational innovation processes (strengthening of the Corporate University and identification and enhancement of the Apprenticeship Communities). In line with the leadership model, promoting the acquisition of managerial skills necessary to be ready for the new competitive context. Continuing with the Graduates Project and providing continuity in the definition of individual development paths towards roles of responsibility for high-potential resources. Making the Group’s approach to optimizing diversity and respect for equal opportunities an ever more concrete reality.
20
• Alignment with Code of Ethics principles. Ensuring the constant diffusion of the company Charter of Values and Code of Ethics. Monitoring compliance through the full implementation of the activation system defined by the Board of Directors, providing for verification and updating, if necessary, in 2013 at the end of the second three-year period of implementation.
• Sense of belonging and corporate culture. Disseminating corporate values and culture with the aim of increasing the sense of belonging of the entire workforce. Ensuring dissemination of the contents of the Charter of Values and the Code of Ethics (including its implementation system) after changes in the scope (acquisitions, integrations, etc.) also by performing new training activities for the entire workforce. Completing in 2016 the implementation of the integrated leadership model with the performance assessment system which favours alignment between the corporate behaviours and culture.
• Promotion of QSE policy and social responsibility Promoting the development within the Group of an integrated and certified management system for quality, safety and the environment, disseminating a culture of respect for and enactment of QSE policy commitments. Continuing the programme to extend the certifications within the Hera Group in order to minimise risks and increase the company’s competitive position (especially as regards SA8000 and ISO 50001). The commitments to stakeholders listed in this report are contained in the Hera Balanced Scorecard. This is to provide guarantees of consistency and coherence among the various instruments used for management and achievement of the Group strategy (Business plan, Sustainability Report, management reporting, bonus system).
Hera ranked first among Italian utilities In 2012 Hera won the Top Utility Award, the prize which assesses the economic, financial, commercial, industrial and sustainability performance of Italy’s 100 largest energy, gas, water and waste management companies. The survey conducted by Althesys awarded Hera for its ability to combine efficiency, cost-effectiveness, and attention to customers and residents. One of the five assessment areas specifically considered environmental and social sustainability, including relations with the local community and the various stakeholders.
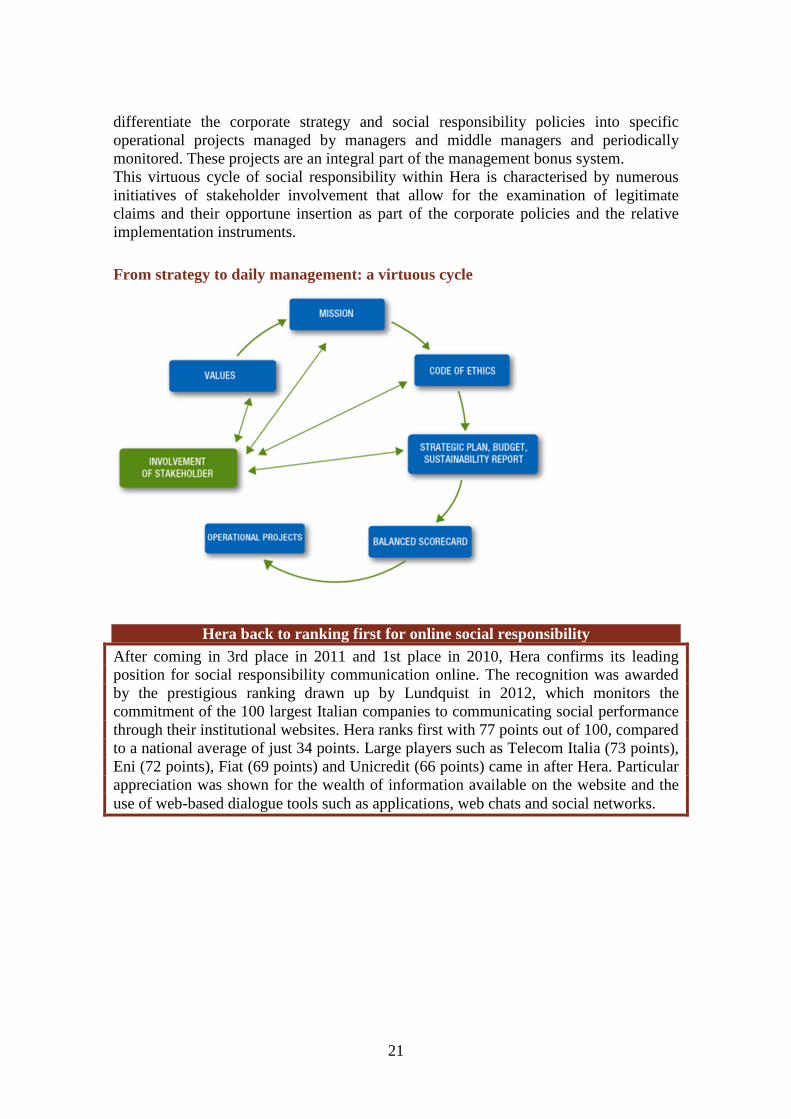
Corporate Social Responsibility within Hera Hera acts to develop and promote corporate policies with a view to adopting a corporate model that is capable of meeting the needs of the various stakeholders in a balanced manner. Hera has published the Sustainability Report since its establishment, and added Corporate Social Responsibility to its strategy, as Hera considers CSR a valid instrument for increasing competitiveness and a key element in reaching sustainable development for the company and the local area in which it operates. The Mission and Charter of Values expressed in the Code of Ethics dictate the guidelines for corporate conduct and underlie each corporate action and relationship. A shared Mission, Charter of Values and Conduct established in the Code of Ethics is the strategic and cultural framework in which the Business Plan takes shape, results are reported in a transparent way through the Sustainability Report, and economic planning is carried out annually. The Balanced Scorecard system makes it possible to
21
differentiate the corporate strategy and social responsibility policies into specific operational projects managed by managers and middle managers and periodically monitored. These projects are an integral part of the management bonus system. This virtuous cycle of social responsibility within Hera is characterised by numerous initiatives of stakeholder involvement that allow for the examination of legitimate claims and their opportune insertion as part of the corporate policies and the relative implementation instruments.
From strategy to daily management: a virtuous cycle
Hera back to ranking first for online social responsibility After coming in 3rd place in 2011 and 1st place in 2010, Hera confirms its leading position for social responsibility communication online. The recognition was awarded by the prestigious ranking drawn up by Lundquist in 2012, which monitors the commitment of the 100 largest Italian companies to communicating social performance through their institutional websites. Hera ranks first with 77 points out of 100, compared to a national average of just 34 points. Large players such as Telecom Italia (73 points), Eni (72 points), Fiat (69 points) and Unicredit (66 points) came in after Hera. Particular appreciation was shown for the wealth of information available on the website and the use of web-based dialogue tools such as applications, web chats and social networks.

22
2005 2006 2007 2008 2009 2010 2011 2012
Economic Responsibility Value added (in millions of €) 722.1 802.5 817.1 923.8 977.4 1,010.4 1,042.6 1,075.6 Total investments (in millions of €) 346.9 504.8 471.8 429.7 429.3 353.9 324.9 289.3 ROI (Operating Income/Net Capital Employed)
8.8% 8.6% 7.4% 8.9% 8.1% 8.5% 8.7% 8.2%
EBITDA per open ended contract employee (thousands of €)
65.4 68.5 74.2 82.7 87.5 93.6 99.4 101,2
Total return for shareholders since listing (%)
94.2% 184.6% 171.8% 53.0% 70.0% 72.1% 42.3% 59.7%
Social Responsibility Open-ended contract employees (average annual % of total workforce)
95.5% 93.2% 92.7% 93.7% 95.0% 95.8% 96.2% 97.0%
Hours of training per capita 18.5 20.1 24.3 33.2 23.0 23.0 28.1 27.5 Workforce attending at least one training course (%)
82.2% 92.5% 92.1% 97.6% 93.4% 96.0% 95.6% 97.1%
Accident frequency index (number of accidents/hours worked x 1,000,000)
50.1 47.5 42.4 37.6 32.6 29.6 23.40 22.7
Internal climate index (score 0-100) 50 - 53 - 58 - 64 - Index of customer satisfaction for residential customers (score 0-100)
67 67 65 67 69 69 70 69
Compliance with AEEG and Service Charter quality standards (gas, electricity, integrated water service, district heating)
94.7%* 94.6% 94.8% 95.8% 97.5% 98.6% 98.7% 99.5%
Emergency gas services: percentage of calls with intervention within 60 minutes
94.7% 96.3% 96.8% 96.5% 96.8% 97.8% 98.9% 98.7%
Average call centre response time for residential customers (seconds)
70.2 34.5 46.2 66.1 33.2 33.8 37.4 39.9
Average branch operator waiting time (minutes)
26.9 23.7 20.7 19.3 14.6 14.5 10.5 9.9
Value of supplies from local suppliers (% of total)
- - - 66% 68% 64% 65% 65%
Value of supplies from ISO 9001 certified suppliers (% of total)
- - - 72% 77% 78% 79% 80%
No. environmental education programme students
33,505 37,622 36,014 45,617 39,901 41,306 52,017 51,906
Environmental responsibility Portion of energy produced from renewable sources (incl. waste-to-energy at 51%)
25.2% 27.6% 27.3% 32.0% 27.6% 25.8% 30.0% 29.2%
Portion of energy produced from renewable sources (incl. waste-to-energy at 51%) and similar
50.8% 51.2% 51.1% 54.0% 63.1% 67.8% 72.8% 71.5%
Waste-to-energy plant emission levels vs legal limits (real concentrations/legal limits: best value <100%)
22.4% 21.2% 19.3% 17.1% 13.4% 13.0% 12.0% 11.0%
Quality of treated water vs legal limits (real concentrations/legal limits: best value <100%)
- - - - 35.5% 36.1% 38.3% 40.8%
Compliance with Kyoto Protocol (real emissions/assigned emissions)
98% 86% 64% 70% 89% 57% 56% 54%
Non-invoiced water (physical and administrative losses from the civil aqueduct): cm/km of network/day
- 8.48 8.33 8.00 7.87 7.99 7.83 -
Separate waste collection 28.9% 31.2% 36.0% 42.0% 44.8% 47.8% 50.5% 51.9% Kilos of separate waste collection per capita 199 217 250 297 310 340 347 343 Vehicles using low environmental impact fuels. (Methane, LPG, Electric powered) (% of Total)
9.2% 13.7% 14.0% 15.8% 17.6% 18.4% 19.2% 19.3%
Portion of urban waste collected for disposal via landfill (% total collected solid waste)
- 37.0% 37.3% 36.0% 30.1% 25.0% 23.1% 21.4%
* Gas service.
Key Performance Indicators

23
The instruments of governance
Corporate governance Hera is a multi-utility company with public sector majority shareholders and a markedly diversified shareholder base. Regarding Corporate Governance, the Group adopted statutory procedures, with specific attention to the implementation of the principles contained in the Code of Conduct prepared by Borsa Italiana. The main governance bodies of Hera are the Board of Directors, the Executive Committee, Board of Statutory Auditors, the internal committees and the Shareholders’ Meeting. The Board of Directors is supported in its duties by 2 committees: the Remuneration Committee and the Internal Control Committee. The Board of Directors has also established a Supervisory Body pursuant to Legislative Decree no. 231/2001, as well as an Ethics Committee to monitor the dissemination and implementation of the principles in Hera Group’s Code of Ethics.
The Board of Directors The Articles of Association which were applicable until 31 December 2012 established that the Board of Directors be comprised of 18 members elected on the basis of lists. Specifically, they provided that 14 members be selected from a majority list while the remaining 4 members be selected from a minority list. The Shareholders’ Meeting of 15 October 2012, within the aggregation process with the AcegasAps Group, adopted new Articles of Association, applicable from 1 January 2013, which provide that the Board of Directors be composed of 20 members and, consequently, that two new members be appointed with the same date of effect. Article 17 of the Articles of Association applicable from 1 January 2013, therefore, provide that 16 members be selected from a majority list while the remaining 4 members be selected from a minority list. The local authorities holding shares have entered into a Voting Trust and Share Transfer Rules Agreement which provides clauses on the method of forming the majority list, and there is also another consultation agreement signed by 4 minority shareholders for the appointment of members of the Board of Directors. The articles of association provide that the Board shall meet at least once each quarter or whenever the chairman considers it necessary or a meeting is requested by at least one third of its members or the Board of Statutory Auditors; it furthermore provides that the Board be vested with broad and unrestricted powers for the ordinary and extraordinary management of the company. It is empowered to carry out all such actions as it deems necessary for and conducive to achieving the company purpose except those placed explicitly, by law or the Articles of Association, under the responsibility of the Shareholders’ Meeting. The Board of Directors met 13 times in 2012.
24
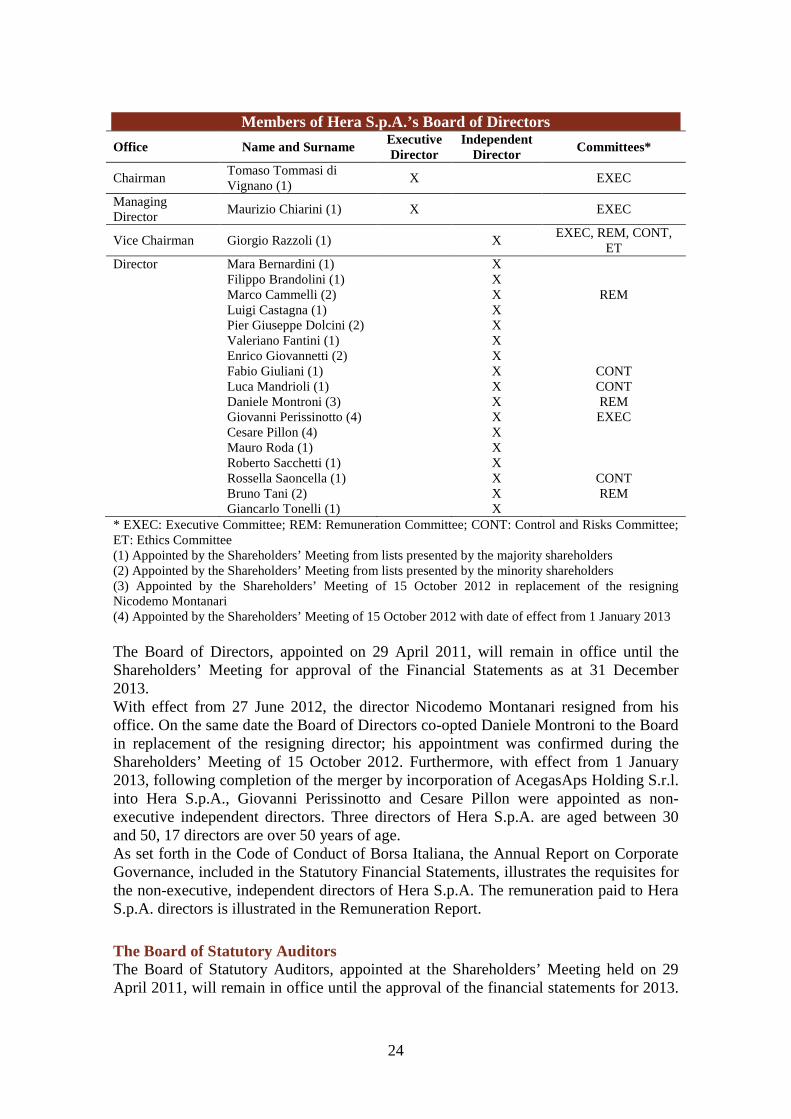
Members of Hera S.p.A.’s Board of Directors
Office Name and Surname Executive Director
Independent Director
Committees*
Chairman Tomaso Tommasi di Vignano (1)
X EXEC
Managing Director
Maurizio Chiarini (1) X EXEC
Vice Chairman Giorgio Razzoli (1) X EXEC, REM, CONT,
ET Director Mara Bernardini (1) X Filippo Brandolini (1) X Marco Cammelli (2) X REM Luigi Castagna (1) X Pier Giuseppe Dolcini (2) X Valeriano Fantini (1) X Enrico Giovannetti (2) X Fabio Giuliani (1) X CONT Luca Mandrioli (1) X CONT Daniele Montroni (3) X REM Giovanni Perissinotto (4) X EXEC Cesare Pillon (4) X Mauro Roda (1) X Roberto Sacchetti (1) X Rossella Saoncella (1) X CONT Bruno Tani (2) X REM Giancarlo Tonelli (1) X * EXEC: Executive Committee; REM: Remuneration Committee; CONT: Control and Risks Committee; ET: Ethics Committee (1) Appointed by the Shareholders’ Meeting from lists presented by the majority shareholders (2) Appointed by the Shareholders’ Meeting from lists presented by the minority shareholders (3) Appointed by the Shareholders’ Meeting of 15 October 2012 in replacement of the resigning Nicodemo Montanari (4) Appointed by the Shareholders’ Meeting of 15 October 2012 with date of effect from 1 January 2013 The Board of Directors, appointed on 29 April 2011, will remain in office until the Shareholders’ Meeting for approval of the Financial Statements as at 31 December 2013. With effect from 27 June 2012, the director Nicodemo Montanari resigned from his office. On the same date the Board of Directors co-opted Daniele Montroni to the Board in replacement of the resigning director; his appointment was confirmed during the Shareholders’ Meeting of 15 October 2012. Furthermore, with effect from 1 January 2013, following completion of the merger by incorporation of AcegasAps Holding S.r.l. into Hera S.p.A., Giovanni Perissinotto and Cesare Pillon were appointed as non-executive independent directors. Three directors of Hera S.p.A. are aged between 30 and 50, 17 directors are over 50 years of age. As set forth in the Code of Conduct of Borsa Italiana, the Annual Report on Corporate Governance, included in the Statutory Financial Statements, illustrates the requisites for the non-executive, independent directors of Hera S.p.A. The remuneration paid to Hera S.p.A. directors is illustrated in the Remuneration Report.
The Board of Statutory Auditors The Board of Statutory Auditors, appointed at the Shareholders’ Meeting held on 29 April 2011, will remain in office until the approval of the financial statements for 2013.
25
It is the corporate body that monitors correct administration, especially insofar as the adequacy of the organisational, administrative and accounting structure adopted by the directors and its operation. The Articles of Association establish that the members of the Board of Statutory Auditors are appointed on the basis of the lists submitted by shareholders in order to ensure that the minority appoints the Chairman and an alternate auditor. The remaining two permanent members and one alternate auditor are selected from a majority list. With effect from 9 July 2012, the alternate auditor Stefano Ceccacci resigned from his office. The Shareholders’ Meeting of 15 October 2012 appointed Massimo Spina in replacement of the resigning auditor, who will remain in office until the Shareholders’ Meeting is called to approve the Financial Statements as at 31 December 2013.
The Executive Committee The Executive Committee, appointed by the Board of Directors on 2 May 2011, in accordance with article 23.3 of the Articles of Association, with regard to the yearly definition of the Group’s business plan and the proposed appointments of top level managers, has the duty to express an opinion prior to their submittal to the Board of Directors; it is also expected to adopt resolutions, in relation to defined brackets of amounts, concerning contracts and agreements related to the corporate purpose, consultancy relationships with outside professional experts, the company’s membership in organisations, associations and other bodies, settlement of disputes and releases of creditor claims, acts amending or terminating contracts for credit lines and loans, and stipulation, amendment and termination of investment contracts. The Executive Committee is composed of the Chairman, Vice Chairman and Chief Executive Officer of Hera S.p.A. It met 7 times in 2012. On 24 January 2013, the Board of Directors appointed a further member of the Executive Committee: the Director Giovanni Perissinotto.
The Remuneration Committee The Remuneration Committee was appointed by the Board of Directors on 2 May 2011. The task of this committee is to make proposals to the Board of Directors with regard to remuneration of the Chairman, the Chief Executive Officer, and directors who cover specific roles, as well as to propose the general criteria to be adopted with regard to remuneration of senior managers and middle managers. The Committee met 3 times in 2012. The Committee is made up of four non-executive independent directors, and upon invitation by the Committee chairman, the Chief Executive Officer and the Chairman of the Board of Directors may participate in its meetings.
The Internal Control Committee The function of the Internal Control Committee, which was appointed by the Board of Directors on 2 May 2011, is to consult and propose. It is composed of four independent, non-executive directors. Its task is to assess the reliability of the internal control system to ensure the efficiency of corporate operations, reliability with regard to information of a financial nature, compliance with the law and with regulations, and protection of corporate assets. The procedure for transactions with Related parties implemented by the Board of Directors in December 2010 requires that the Internal Control Committee
26
be responsible for guaranteeing the substantial correctness of operations with related parties by issuing a specific opinion. Following adoption by the Board of Directors, on 17 December 2012, of the updates to the Code of Conduct, the Internal Control Committee also took on the function of Risk Management Committee with a view to managing corporate risks and supporting the administrative body in its assessments and decisions. Taking part in its meetings are the Chairman of the Board of Statutory Auditors or another Auditor designated by the said Chairman, as well as, when expressly requested by the committee Chairman, the Chief Executive Officer and the Chairman of the Board of Directors. The Committee for Internal Control met 11 times in 2012.
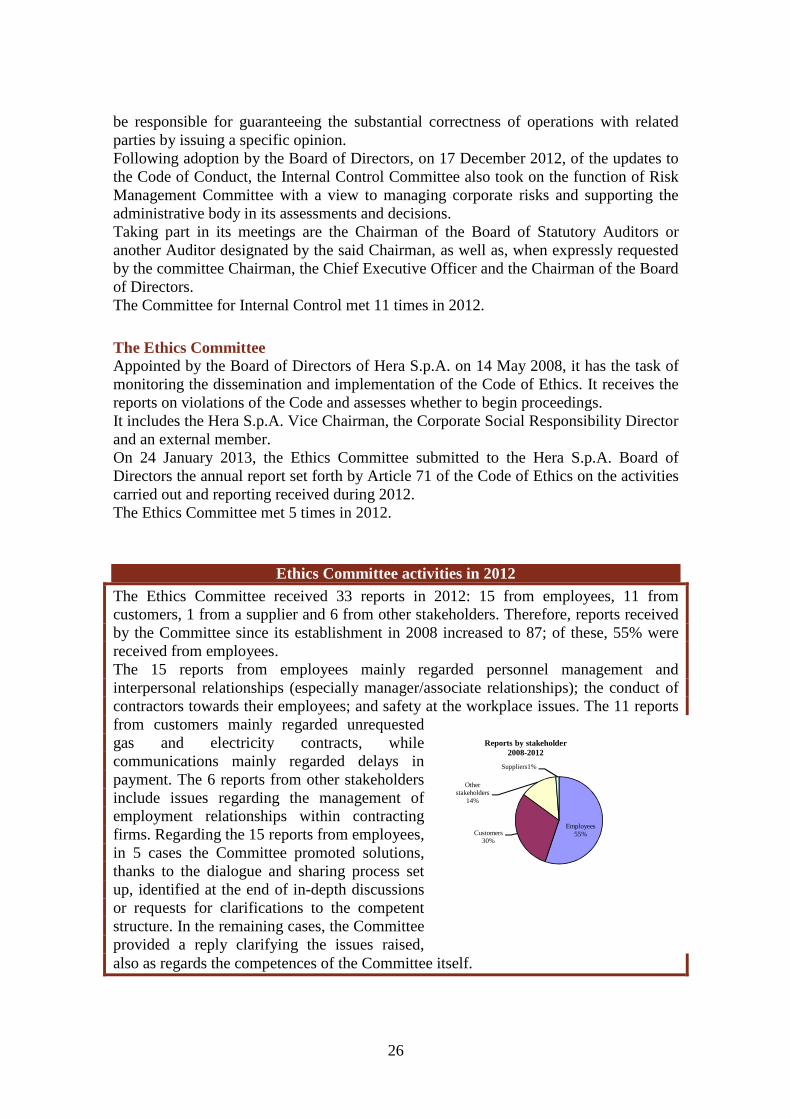
The Ethics Committee Appointed by the Board of Directors of Hera S.p.A. on 14 May 2008, it has the task of monitoring the dissemination and implementation of the Code of Ethics. It receives the reports on violations of the Code and assesses whether to begin proceedings. It includes the Hera S.p.A. Vice Chairman, the Corporate Social Responsibility Director and an external member. On 24 January 2013, the Ethics Committee submitted to the Hera S.p.A. Board of Directors the annual report set forth by Article 71 of the Code of Ethics on the activities carried out and reporting received during 2012. The Ethics Committee met 5 times in 2012.
Ethics Committee activities in 2012 The Ethics Committee received 33 reports in 2012: 15 from employees, 11 from customers, 1 from a supplier and 6 from other stakeholders. Therefore, reports received by the Committee since its establishment in 2008 increased to 87; of these, 55% were received from employees. The 15 reports from employees mainly regarded personnel management and interpersonal relationships (especially manager/associate relationships); the conduct of contractors towards their employees; and safety at the workplace issues. The 11 reports from customers mainly regarded unrequested gas and electricity contracts, while communications mainly regarded delays in payment. The 6 reports from other stakeholders include issues regarding the management of employment relationships within contracting firms. Regarding the 15 reports from employees, in 5 cases the Committee promoted solutions, thanks to the dialogue and sharing process set up, identified at the end of in-depth discussions or requests for clarifications to the competent structure. In the remaining cases, the Committee provided a reply clarifying the issues raised, also as regards the competences of the Committee itself.
Employees 55%Customers
30%
Other stakeholders
14%
Suppliers1%
Reports by stakeholder2008-2012
27
Regarding the 11 reports from customers, the relevant departments were involved for an in-depth evaluation which in 5 cases led to resolving the issue. In the other cases, after the detailed evaluation a reply was sent from the interested department and/or Committee to the customer, clarifying the issue. On 31 December, 11 reports were being processed. Among the practical and regulatory results of the Committee’s activities in 2012, the following is pointed out: • a communication to the Central Personnel and Organisation Department regarding
the management of family relationships within the organisation, resulting in a service order aimed at ensuring transparency and impartiality during personnel selection activities and management operations;
• a communication to TOS directors regarding uniform conduct towards water service users in the event of delays in payment;
• a communication to the Central Personnel and Organisation Department regarding gifts and benefits, resulting in an internal notice in order to raise awareness about the good practice to donate any gifts received to local non-profit organisations.
Supervisory Body The task of the Supervisory Body is to supervise and control compliance with, and the functioning and effectiveness of, the Organisational Model for the prevention of crimes which may be linked to administrative liabilities of the Group companies, according to the terms of Legislative Decree no. 231/2001. This body is an independent body appointed by the Boards of Directors of the Group companies participating in “Progetto 231”1. The Supervisory Board reports to each Board of Directors on matters of concern as per Legislative Decree no. 231/2001. It avails itself of the Internal Auditing Department for purposes of control, analysis and other duties undertaken. The supervisory body includes the Internal Auditing Director, the Legal and Corporate Affairs Director and one external member.
The Organisation
The Hera model is different from other multi-utilities because it has achieved business and operational integration founded on a Holding which makes use of Central Divisions for set-up, support and control, which guarantee an integrated Group perspective and favours the exploitation of synergies. The holding also has General Divisions which steer and coordinate the strategic areas of relevant businesses and also guarantee the operational management of the Group’s activities through dedicated business lines. Within the Operations General Management, taking into account the altered regulatory and market framework and with a view to further improve the monitoring of the Group’s area of operation, steps have started to be taken to modify the organisational model (with operational effects from 1 January 2013) based on a business line
1 These companies are: Hera S.p.A., Acantho, Akron, Asa, Enomondo, Eris, Famula On-line, FEA, Hera Comm, Hera Luce, Hera Trading, Herambiente, Medea, Nuova Geovis, Romagna Compost, Sinergia, Sotris, and Uniflotte (89% of the Group’s open-ended contract employees work in these companies).
28
approach. To this regard the following were established: the Energy, Water and Waste Management Divisions, each focusing on a specific strategic business area; the Customer Technical Division, with a view to offering a unified view of the technical service provided to final customers; and, in order to further improve the monitoring of local areas, seven local areas to ensure the continuation and development of relationships with main local stakeholders based on a more proactive approach. To this end, seven Area Managers have been appointed whose role is to monitor relationships with leading local stakeholders and to proactively handle the requests throughout the local areas. The Area Managers report directly to the Business Directors who are responsible for monitoring the seven local areas (one local area is assigned to every Director, apart from the Water and Waste Management Directors who are in charge of two areas). Consistently with the development of the General Operations Division and with a view to developing a supervision strategy more focused on the company’s business areas, new organisational configurations for the Central Divisions have been defined and implemented, including the hierarchical reorganisation of the functions previously allocated within the territorial operational structures, as well as further actions aimed at strengthening the optimum balance between process governance and internal customer orientation. In 2012, the ongoing improvement process within the Group continued by applying the Lean Organisation methodology in new corporate contexts (approvals and logistics in Herambiente, and invoice and collection and operational processes with regard to Networks and Waste Management). In the General Development and Market Division, the organisational changes continued aimed at guaranteeing greater process efficiency and standardisation and at further improving final customer services (especially thanks to the organisational review within the Households Market). Two committees have been set up for purposes of corporate management:
• Managing Committee: responsible for analysing and sharing policies, strategies and operational planning decisions, while fostering integration between the various functions; • Executive Committee: meets every three months to monitor business performance and the progress of Balanced Scorecard projects.
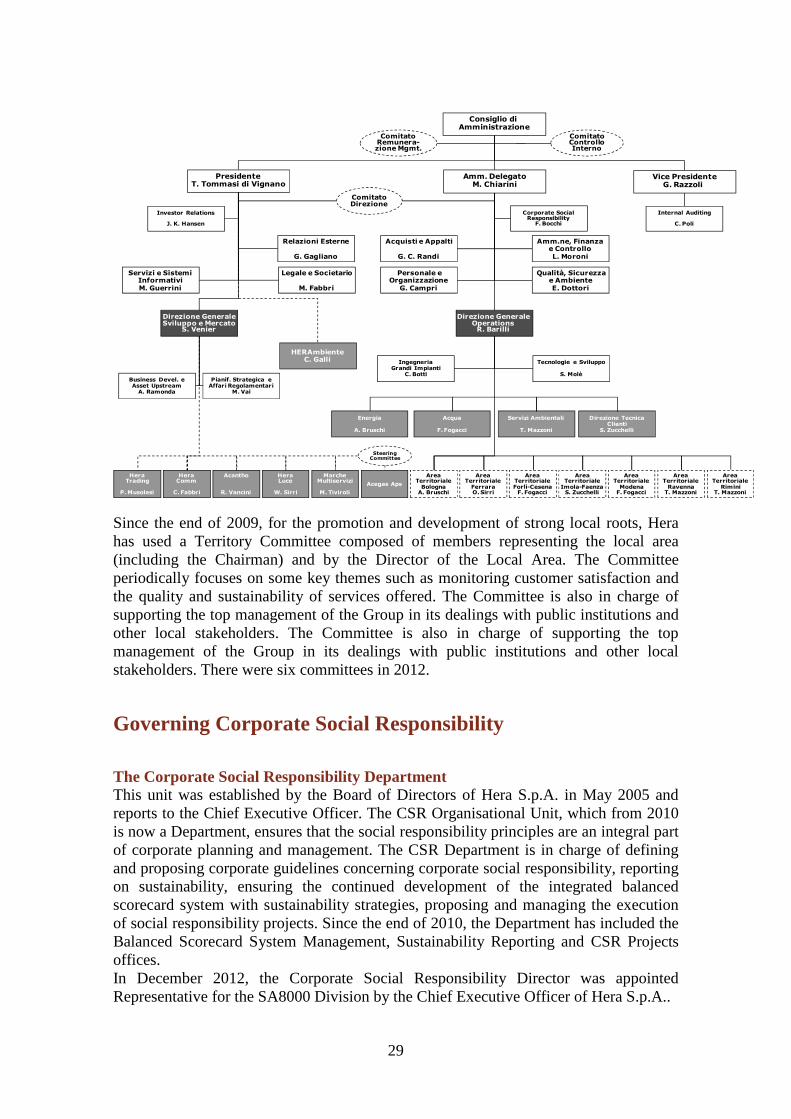
29
Since the end of 2009, for the promotion and development of strong local roots, Hera has used a Territory Committee composed of members representing the local area (including the Chairman) and by the Director of the Local Area. The Committee periodically focuses on some key themes such as monitoring customer satisfaction and the quality and sustainability of services offered. The Committee is also in charge of supporting the top management of the Group in its dealings with public institutions and other local stakeholders. The Committee is also in charge of supporting the top management of the Group in its dealings with public institutions and other local stakeholders. There were six committees in 2012.
Governing Corporate Social Responsibility
The Corporate Social Responsibility Department This unit was established by the Board of Directors of Hera S.p.A. in May 2005 and reports to the Chief Executive Officer. The CSR Organisational Unit, which from 2010 is now a Department, ensures that the social responsibility principles are an integral part of corporate planning and management. The CSR Department is in charge of defining and proposing corporate guidelines concerning corporate social responsibility, reporting on sustainability, ensuring the continued development of the integrated balanced scorecard system with sustainability strategies, proposing and managing the execution of social responsibility projects. Since the end of 2010, the Department has included the Balanced Scorecard System Management, Sustainability Reporting and CSR Projects offices. In December 2012, the Corporate Social Responsibility Director was appointed Representative for the SA8000 Division by the Chief Executive Officer of Hera S.p.A..
Hera Trading
P. Musolesi
Consiglio di Amministrazione
Area Territoriale Forlì-Cesena
F. Fogacci
Area Territoriale
FerraraO. Sirri
Area Territoriale
BolognaA. Bruschi
Area Territoriale
Imola-FaenzaS. Zucchelli
Vice PresidenteG. Razzoli
Servizi e Sistemi InformativiM. Guerrini
Internal Auditing
C. Poli
Amm. DelegatoM. Chiarini
HERAmbienteC. Galli
Personale e Organizzazione
G. Campri
Acquisti e Appalti
G. C. Randi
Amm.ne, Finanza e ControlloL. Moroni
Legale e Societario
M. Fabbri
Direzione Generale Operations
R. Barilli
Comitato Controllo Interno
Comitato Remunera-zione Mgmt.
Area Territoriale
ModenaF. Fogacci
Area Territoriale
RavennaT. Mazzoni
Area Territoriale
RiminiT. Mazzoni
Comitato Direzione
Corporate Social Responsibility
F. Bocchi
Investor Relations
J. K. Hansen
Relazioni Esterne
G. Gagliano
Qualità, Sicurezza e AmbienteE. Dottori
Acantho
R. Vancini
HeraLuce
W. Sirri
Hera Comm
C. Fabbri
Direzione Generale Sviluppo e Mercato
S. Venier
PresidenteT. Tommasi di Vignano
Acqua
F. Fogacci
Servizi Ambientali
T. Mazzoni
Energia
A. Bruschi
Tecnologie e Sviluppo
S. Molè
IngegneriaGrandi Impianti
C. BottiBusiness Devel. e Asset Upstream
A. Ramonda
Pianif. Strategica e Affari Regolamentari
M. Vai
Direzione Tecnica Clienti
S. Zucchelli
Marche Multiservizi
M. Tiviroli
Acegas Aps
SteeringCommittee
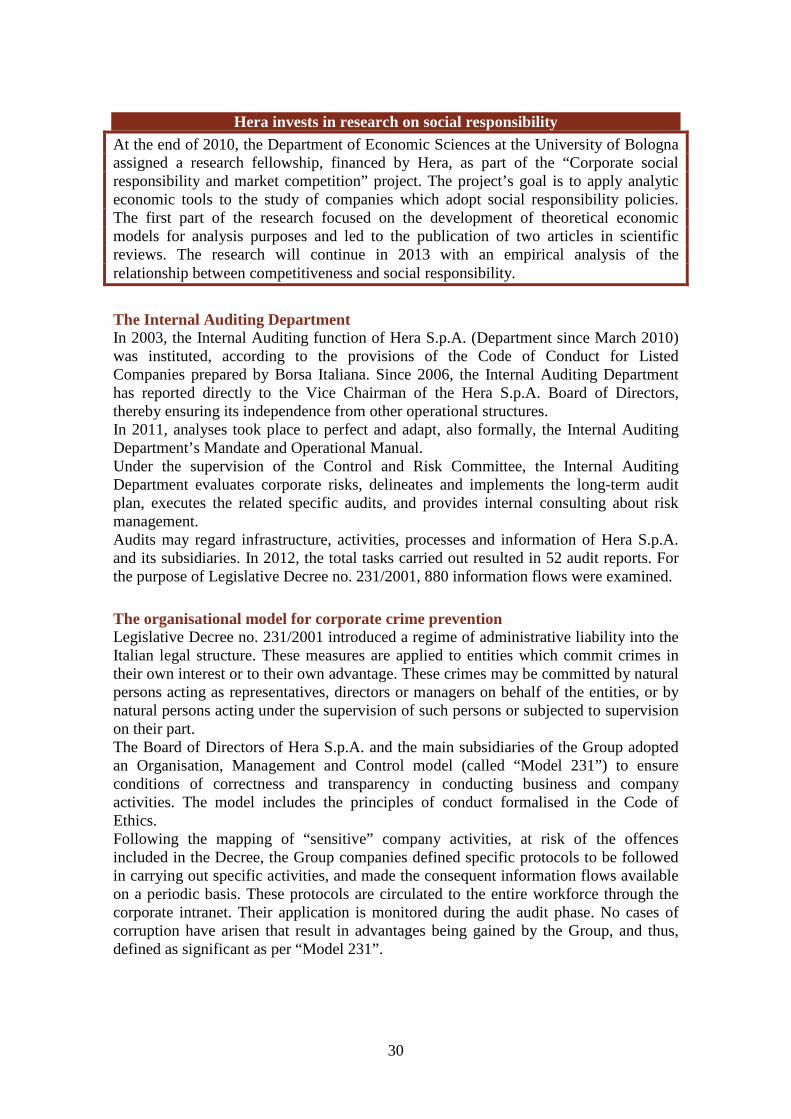
30
Hera invests in research on social responsibility At the end of 2010, the Department of Economic Sciences at the University of Bologna assigned a research fellowship, financed by Hera, as part of the “Corporate social responsibility and market competition” project. The project’s goal is to apply analytic economic tools to the study of companies which adopt social responsibility policies. The first part of the research focused on the development of theoretical economic models for analysis purposes and led to the publication of two articles in scientific reviews. The research will continue in 2013 with an empirical analysis of the relationship between competitiveness and social responsibility.
The Internal Auditing Department In 2003, the Internal Auditing function of Hera S.p.A. (Department since March 2010) was instituted, according to the provisions of the Code of Conduct for Listed Companies prepared by Borsa Italiana. Since 2006, the Internal Auditing Department has reported directly to the Vice Chairman of the Hera S.p.A. Board of Directors, thereby ensuring its independence from other operational structures. In 2011, analyses took place to perfect and adapt, also formally, the Internal Auditing Department’s Mandate and Operational Manual. Under the supervision of the Control and Risk Committee, the Internal Auditing Department evaluates corporate risks, delineates and implements the long-term audit plan, executes the related specific audits, and provides internal consulting about risk management. Audits may regard infrastructure, activities, processes and information of Hera S.p.A. and its subsidiaries. In 2012, the total tasks carried out resulted in 52 audit reports. For the purpose of Legislative Decree no. 231/2001, 880 information flows were examined.
The organisational model for corporate crime prevention Legislative Decree no. 231/2001 introduced a regime of administrative liability into the Italian legal structure. These measures are applied to entities which commit crimes in their own interest or to their own advantage. These crimes may be committed by natural persons acting as representatives, directors or managers on behalf of the entities, or by natural persons acting under the supervision of such persons or subjected to supervision on their part. The Board of Directors of Hera S.p.A. and the main subsidiaries of the Group adopted an Organisation, Management and Control model (called “Model 231”) to ensure conditions of correctness and transparency in conducting business and company activities. The model includes the principles of conduct formalised in the Code of Ethics. Following the mapping of “sensitive” company activities, at risk of the offences included in the Decree, the Group companies defined specific protocols to be followed in carrying out specific activities, and made the consequent information flows available on a periodic basis. These protocols are circulated to the entire workforce through the corporate intranet. Their application is monitored during the audit phase. No cases of corruption have arisen that result in advantages being gained by the Group, and thus, defined as significant as per “Model 231”.
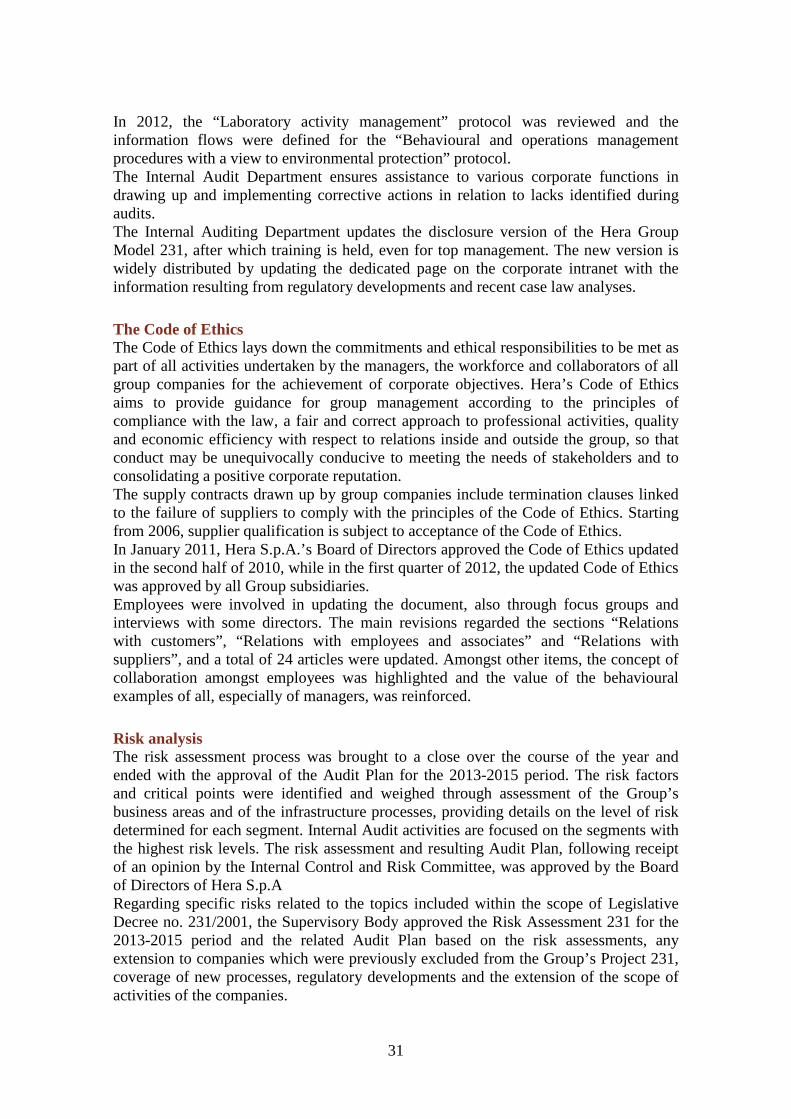
31
In 2012, the “Laboratory activity management” protocol was reviewed and the information flows were defined for the “Behavioural and operations management procedures with a view to environmental protection” protocol. The Internal Audit Department ensures assistance to various corporate functions in drawing up and implementing corrective actions in relation to lacks identified during audits. The Internal Auditing Department updates the disclosure version of the Hera Group Model 231, after which training is held, even for top management. The new version is widely distributed by updating the dedicated page on the corporate intranet with the information resulting from regulatory developments and recent case law analyses.
The Code of Ethics The Code of Ethics lays down the commitments and ethical responsibilities to be met as part of all activities undertaken by the managers, the workforce and collaborators of all group companies for the achievement of corporate objectives. Hera’s Code of Ethics aims to provide guidance for group management according to the principles of compliance with the law, a fair and correct approach to professional activities, quality and economic efficiency with respect to relations inside and outside the group, so that conduct may be unequivocally conducive to meeting the needs of stakeholders and to consolidating a positive corporate reputation. The supply contracts drawn up by group companies include termination clauses linked to the failure of suppliers to comply with the principles of the Code of Ethics. Starting from 2006, supplier qualification is subject to acceptance of the Code of Ethics. In January 2011, Hera S.p.A.’s Board of Directors approved the Code of Ethics updated in the second half of 2010, while in the first quarter of 2012, the updated Code of Ethics was approved by all Group subsidiaries. Employees were involved in updating the document, also through focus groups and interviews with some directors. The main revisions regarded the sections “Relations with customers”, “Relations with employees and associates” and “Relations with suppliers”, and a total of 24 articles were updated. Amongst other items, the concept of collaboration amongst employees was highlighted and the value of the behavioural examples of all, especially of managers, was reinforced.
Risk analysis The risk assessment process was brought to a close over the course of the year and ended with the approval of the Audit Plan for the 2013-2015 period. The risk factors and critical points were identified and weighed through assessment of the Group’s business areas and of the infrastructure processes, providing details on the level of risk determined for each segment. Internal Audit activities are focused on the segments with the highest risk levels. The risk assessment and resulting Audit Plan, following receipt of an opinion by the Internal Control and Risk Committee, was approved by the Board of Directors of Hera S.p.A Regarding specific risks related to the topics included within the scope of Legislative Decree no. 231/2001, the Supervisory Body approved the Risk Assessment 231 for the 2013-2015 period and the related Audit Plan based on the risk assessments, any extension to companies which were previously excluded from the Group’s Project 231, coverage of new processes, regulatory developments and the extension of the scope of activities of the companies.
32
The Risk Committee The Risk Committee was established in March 2011 and is composed of the Chairman, Chief Executive Officer and Vice-Chairman of Hera S.p.A., the General Development and Market Director, the Administration, Finance and Control Director, and the Analysis and Energy Risk Control Director. The Risk Committee is the main body that steers, monitors and provides information about risk management strategies, and has the following tasks: defining general guidelines for the Risk Management process; ensuring corporate risk mapping and monitoring; ensuring the definition of risk policies and measurement parameters to be submitted for approval to the Board of Directors of Hera S.p.A.; guaranteeing six-monthly reporting to the Board of Directors; and defining and ensuring the submission of information protocols to the Internal Committee, the Internal Auditing Division and the Board of Statutory Auditors.
Risk management In January 2004, Hera created the Risk Management & Control department within its organisation, in order to optimise the company risk profile, adopt pro-active behaviours in relation to pure corporate risk, minimising threats and taking advantage of opportunities, in order to ensure increasingly efficient protection of human, material and intangible business assets, and contribute to the growth of corporate value. Risk Management processes are applied in a continuous and circular process including typical phases such as risk awareness, danger identification, risk analysis, risk management and treatment, and the control and auditing of the Risk Management policies carried out. To pursue corporate objectives, both in terms of wealth preservation and growth of value, the Hera group integrates synergy actions offered by two main risk management tools: an insurance coverage program provided by leading international insurance companies and the implementation of a strategy to eliminate or reduce risks through specific and effective intervention programs. To this regard, in 2012, two important projects were concluded regarding the control and reduction of corporate risks. The first, called MIRAF (Improvement of Fleet-associated Risks) allowed the identification of a series of improvement areas regarding fleet management and operational activities, whereas the second project, called SIGUR (Single Risk Management System), implemented an effective IT system for managing and unifying risk analysis procedures, making it possible to obtain a single corporate risk profile and so assess the actions that may be implemented within the risk reduction strategies.
The Quality, Safety and Environmental Management System QSE Management Systems have long been one of Hera’s leading and strategic corporate objectives: their implementation by organisations is regarded as an important instrument for checking, analysing and improving the performance of activities and services. These systems also allow effective cross-sectorial coordination between corporate departments and are a valid support for managerial decisions. Among the leading results obtained during 2012:
• strengthening of the integrated quality, safety and environmental management system certification of Hera S.p.A. and of many other Group companies, including Herambiente, Hera Comm and Uniflotte. This is a very important
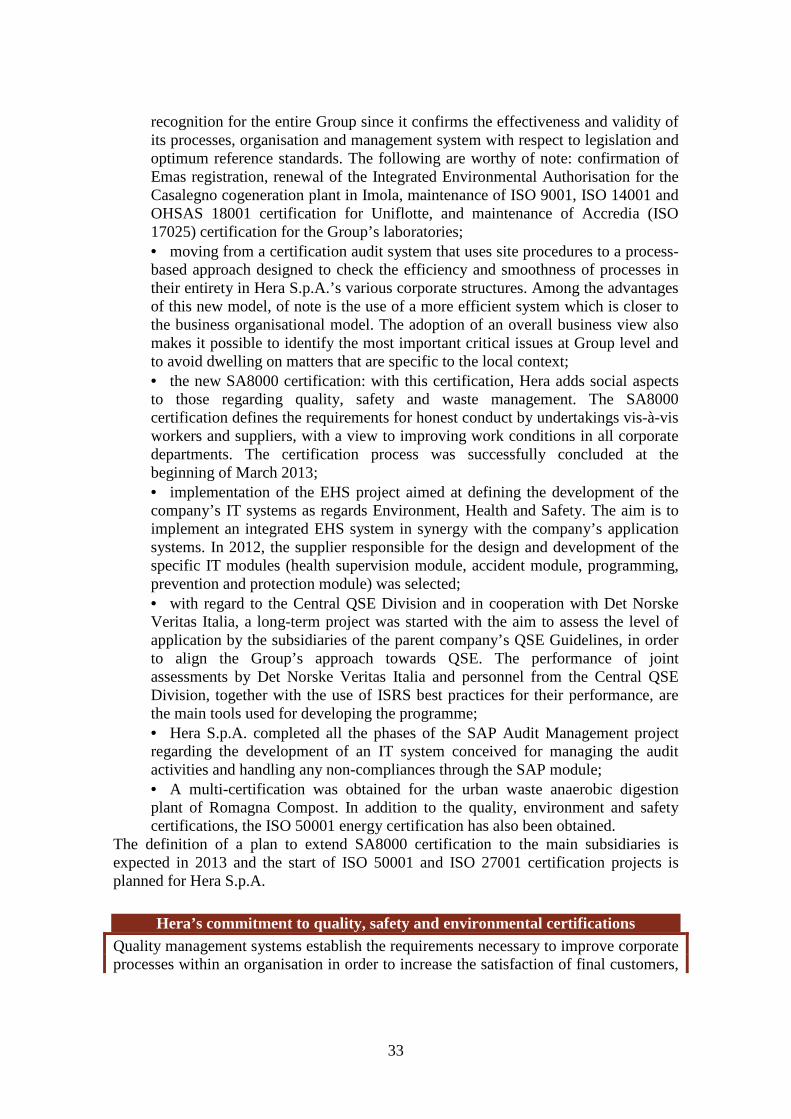
33
recognition for the entire Group since it confirms the effectiveness and validity of its processes, organisation and management system with respect to legislation and optimum reference standards. The following are worthy of note: confirmation of Emas registration, renewal of the Integrated Environmental Authorisation for the Casalegno cogeneration plant in Imola, maintenance of ISO 9001, ISO 14001 and OHSAS 18001 certification for Uniflotte, and maintenance of Accredia (ISO 17025) certification for the Group’s laboratories; • moving from a certification audit system that uses site procedures to a process-based approach designed to check the efficiency and smoothness of processes in their entirety in Hera S.p.A.’s various corporate structures. Among the advantages of this new model, of note is the use of a more efficient system which is closer to the business organisational model. The adoption of an overall business view also makes it possible to identify the most important critical issues at Group level and to avoid dwelling on matters that are specific to the local context; • the new SA8000 certification: with this certification, Hera adds social aspects to those regarding quality, safety and waste management. The SA8000 certification defines the requirements for honest conduct by undertakings vis-à-vis workers and suppliers, with a view to improving work conditions in all corporate departments. The certification process was successfully concluded at the beginning of March 2013; • implementation of the EHS project aimed at defining the development of the company’s IT systems as regards Environment, Health and Safety. The aim is to implement an integrated EHS system in synergy with the company’s application systems. In 2012, the supplier responsible for the design and development of the specific IT modules (health supervision module, accident module, programming, prevention and protection module) was selected; • with regard to the Central QSE Division and in cooperation with Det Norske Veritas Italia, a long-term project was started with the aim to assess the level of application by the subsidiaries of the parent company’s QSE Guidelines, in order to align the Group’s approach towards QSE. The performance of joint assessments by Det Norske Veritas Italia and personnel from the Central QSE Division, together with the use of ISRS best practices for their performance, are the main tools used for developing the programme; • Hera S.p.A. completed all the phases of the SAP Audit Management project regarding the development of an IT system conceived for managing the audit activities and handling any non-compliances through the SAP module; • A multi-certification was obtained for the urban waste anaerobic digestion plant of Romagna Compost. In addition to the quality, environment and safety certifications, the ISO 50001 energy certification has also been obtained.
The definition of a plan to extend SA8000 certification to the main subsidiaries is expected in 2013 and the start of ISO 50001 and ISO 27001 certification projects is planned for Hera S.p.A.
Hera’s commitment to quality, safety and environmental certifications Quality management systems establish the requirements necessary to improve corporate processes within an organisation in order to increase the satisfaction of final customers,
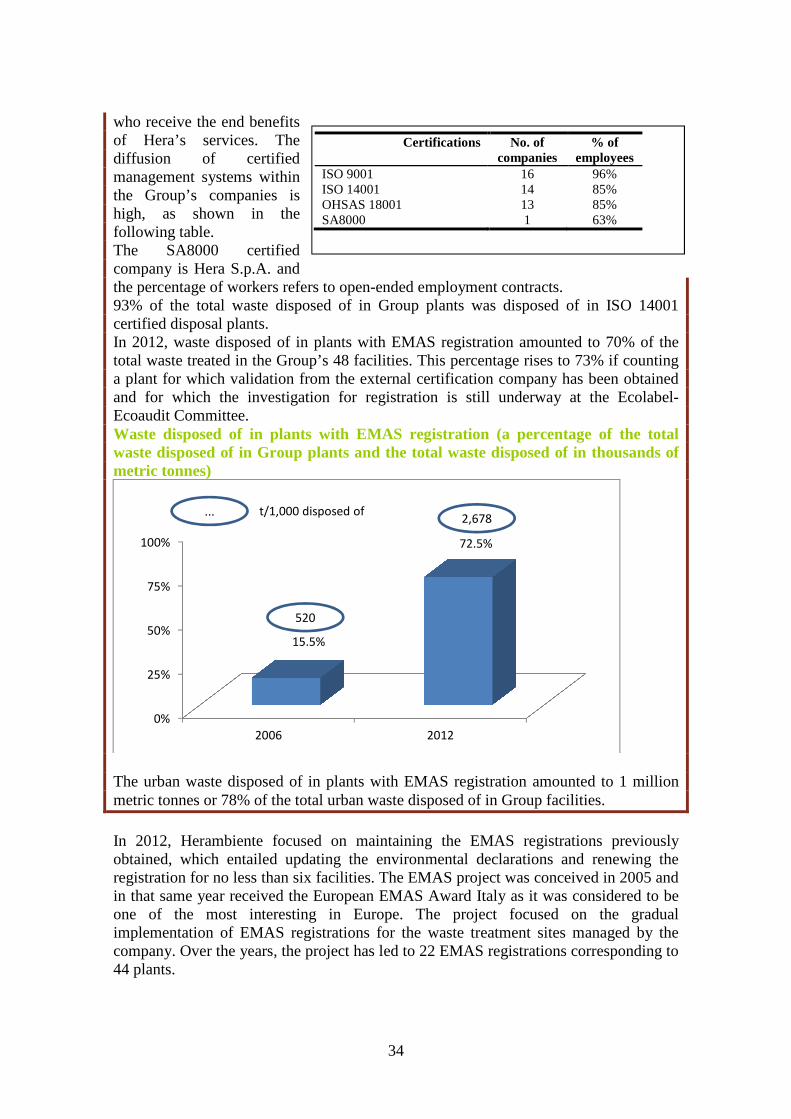
34
who receive the end benefits of Hera’s services. The diffusion of certified management systems within the Group’s companies is high, as shown in the following table. The SA8000 certified company is Hera S.p.A. and the percentage of workers refers to open-ended employment contracts. 93% of the total waste disposed of in Group plants was disposed of in ISO 14001 certified disposal plants. In 2012, waste disposed of in plants with EMAS registration amounted to 70% of the total waste treated in the Group’s 48 facilities. This percentage rises to 73% if counting a plant for which validation from the external certification company has been obtained and for which the investigation for registration is still underway at the Ecolabel-Ecoaudit Committee. Waste disposed of in plants with EMAS registration (a percentage of the total waste disposed of in Group plants and the total waste disposed of in thousands of metric tonnes)
The urban waste disposed of in plants with EMAS registration amounted to 1 million metric tonnes or 78% of the total urban waste disposed of in Group facilities.
In 2012, Herambiente focused on maintaining the EMAS registrations previously obtained, which entailed updating the environmental declarations and renewing the registration for no less than six facilities. The EMAS project was conceived in 2005 and in that same year received the European EMAS Award Italy as it was considered to be one of the most interesting in Europe. The project focused on the gradual implementation of EMAS registrations for the waste treatment sites managed by the company. Over the years, the project has led to 22 EMAS registrations corresponding to 44 plants.
0%
25%
50%
75%
100%
2006 2012
15.5%
72.5%
2,678
520
... t/1,000 disposed of
Certifications
No. of companies
% of employees
ISO 9001 16 96% ISO 14001 14 85% OHSAS 18001 13 85% SA8000 1 63%
35
With a view to rationalising the project, it was decided to exclude plants which are no longer active, such as decommissioned landfills, from the registration process, since, in light of the application of environmental standards which are already operative, it was difficult to pursue the continuous improvement of the environmental performance of these plants. Management of the landfills, including the procedures for running and controlling the environmental impacts, is kept in the general part, common to all of Herambiente’s Environmental Declarations. Herambiente’s commitment in 2013 will focus on maintaining the EMAS registrations obtained previously, including three new registrations obtained in September 2012, regarding the “Area 2” site in Modena (waste-to-energy plant and chemical-physical plant), the Zocca site (landfill) and the Stradelli Guelfi site (transfer station of Bologna), in addition to the renewal of 6 registrations. EMAS registration of the Ravenna sector will also be extended to the new Disidrat plant which entered into service in June 2012, whereas the landfill of Firenzuola (Florence) is still awaiting registration from the Ecolabel and Ecoaudit Committee. The section “The environment and future generations” sets forth a list of the plants with ISO 14001 certification and EMAS registration.
An award for the remote control of waste-to-energy plants Herambiente was one of the 10 companies to receive special mention for its outstanding efforts in the Waste and Resources sector within the Sustainable Development 2012 Award, established for the fourth consecutive year by the Foundation for Sustainable Development and by Ecomondo. The award is granted to companies whose activities and facilities produce significant environmental benefits, are able to innovate, reach effective results in economic and occupational terms, and have a potential for diffusion. Herambiente received the award for its project regarding the remote control of waste-to-energy plants.
Major regulatory developments most impacting sustainability and the businesses managed Water and waste management 2012 focused on the public consultation process launched by AEEG (Italian Authority for Electricity and Natural Gas) for defining the new tariff scheme for the Integrated Water Service. Given the importance of the issue, the consulting procedure was particularly long and complex and included the publication by AEEG of two consultation documents as well as several meetings between AEEG and operators. Upon conclusion of the procedure, AEEG defined the Temporary Tariff Method, by Resolution no. 585/2012/R/Idr of 28 December 2012, which covers years 2012 and 2013. The regulation of the Fully Operational Method, which will enter into effect in 2014, will be subject to separate consultation during 2013. The Temporary Tariff Method calculates 2012 and 2013 costs with new procedures while taking into account a principle of gradual adjustment with respect to the previous tariff levels. In particular, the objectives to improve operating cost efficiency, already laid down in the Area Plans previously approved by the Water and Waste Regulatory Authorities, have been preserved. Instead with regard to capital costs, the financial and tax expenses of the overall investments made, as resulting from the operators’ financial statements and revalued by inflation, are recognised. In some cases, obligations to allocate a portion of

36
tariff revenues to funds to be used specifically for investments in the water sector, are indicated. Resolution no. 585/12 lays down that 2012 and 2013 approved costs for each operator must be calculated by the Water and Waste Regulatory Authorities according to the temporary tariff method and no later than 31 March 2013, and that the AEEG must approve the definitive values no later than 30 June 2013. Regarding the impact on final customers, in order to avoid retroactive adjustments, the new 2013 tariffs will be applied without modifying the current tariff scheme from the second half of 2013. Instead, the revision of 2012 approved costs will be included in 2014 tariffs with suitable mechanisms that will be defined by AEEG. The provisions of the Temporary Tariff Method do not deal with the reimbursement to final users of the integrated water service tariff component pertaining to the return on invested capital for the 21 July – 31 December 2011 period, abrogated following the outcome of the referendum of 12 and 13 June 2011. The procedures for returning this component to users will be defined by AEEG in a separate decision which will be issued by May 2013, according to the provisions set out in resolution no. 38/2013/R/Idr. Regarding waste management, the regulatory changes of greatest interest regard the municipal waste tax (TARES) reform initially regulated by Article 14 of Decree Law no. 201/2011. The recent Stability Law made some changes to the original text, most importantly, it increased the waste tax given that the revenue of the TARES must fully cover waste collection and disposal costs as well as those related to inseparable municipal services (e.g. public lighting and road maintenance). Tax collection up to 31 December 2013 is assigned to the entities that carried out waste management services up to 31 December 2012. The time framework for paying the municipal waste tax is currently the subject of a parliamentary debate: Decree Law of 14/01/2013 has postponed the deadline for the first instalment from January to July, however, a decree law by the Ministry of the Environment is pending which will provide a new timing for payment of the tax in order to diminish the negative effects of the extension on users and operators. In addition to paying a higher tax (0.30/0.40 per square metre), users must also pay the first instalment in July, together with other tax disbursements such as IMU (property tax) and Irpef/Ires (personal income tax/corporate income tax). On the other hand, since invoicing the first TARES instalment in July, waste management service operators will collect the tax between September and October, leading to an increase in net circulating capital and the use of debt to finance current activities. We believe the forthcoming Government must take measures aimed at recovering operators’ and local authorities’ financial imbalances in order to maintain the current waste management service levels which make the Emilia-Romagna region stand out in Europe. Lastly, it is pointed out that from July 2012 the Emilia-Romagna region has shared the guidelines for drawing up the Regional Waste Management Plan (PRGR). The Plan sets challenging objectives in terms of separate waste collection, recovery and new disposal strategies. The guideline, published in July, was followed up by several meetings and discussions between local bodies, operators and trade associations: the diffusion of the first draft of the PRGR was planned for the end of 2012 however, at the time of the preparation of this Report, it has not yet been published. Local Public Services

37
By ruling no. 199 of 20 July 2012, the Constitutional Court declared Article 4 of Decree Law no. 138/ 2011 to be illegitimate since it proposed the same content of Article 23-bis, already abrogated by the referendum of June 2011. Among the most significant provisions, Article 4 prevented the direct awarding of public service contracts by local bodies and envisaged different time limits based on the corporate structure of the companies awarded (in-house companies, mixed public-private companies, listed companies). Consequently, given the declared unconstitutionality of the article at issue, the service contracts currently in force will continue until their natural expiry. Regarding economically significant Local Public Services, Article 34 of Decree Law no. 179/2012 (so-called “Development 2”), laid down the obligation for the contracting entity to publish a report on the website explaining, for the type of award chosen, the reasons and existence of the requirements set forth in Community law, as well as the specific content of public service and universal service obligations, also indicating the financial offsets, if applicable. The Decree Law also attributes a wide range of functions to the government agencies of the Water and Waste Regulatory Authorities, such as the selection of the form of management and related assignment and control. Lastly, it is pointed out that Decree Law no. 174/2012 adjusted the accounting controls carried out in local bodies, implementing a wide range of practical innovations. The regulation must include a suitable information system aimed at determining the financial relations between the owning body and the company, the accounting, management and organisational situation of the company, the service contracts, the quality of services and compliance with legislation regarding public finance obligations. Furthermore, the Decree Law provides that the overall results of the activities of the local body and of the companies in which investments are held must be determined through the Consolidated Financial Statements. Renewable Energy Source incentives 2012 was an important year as regards regulatory updates regarding incentivisation of the production of energy from renewable sources. The reorganisation of the incentivisation mechanisms started in 2011 by Decree Law no. 28/2011; it was then implemented during 2012 through several Ministerial Decrees aimed at steering Italy towards reaching the national objectives assigned by the European Community. The mechanisms that have been implemented seek to incentivise the production of electricity and thermal energy from renewable sources, as well as to reduce final gross consumption of energy by incentivising energy efficiency actions. The most significant provisions issued during 2012 are the Decrees of 5 and 6 of July which govern the incentivisation of electricity from solar photovoltaic plants (so-called Quinto Conto Energia – Fifth Energy Account) and from plants using renewable sources other than photovoltaic plants. Two Decrees published on 28 December 2012 are also of interest. The first regulates the incentivisation measures for the production of thermal energy from renewable sources and minor energy efficiency interventions, while the second determines the national quantitative objectives of energy saving that must be achieved by electricity and gas distribution companies for the three-year period 2013-2016 and for upgrading the white certificates mechanism. These implementation Decrees were followed up by means of provisions issued by relevant institutional bodies (foremost the GSE (Energy Services Manager) and the Gas and Electricity Authority), with a view to regulating specific technical and application rules.

38
The National Energy Strategy In September 2012 the Ministry of Economic Development (MSE) published a public consultation document in order to launch a discussion about the contents of the future National Energy Strategy (SEN). The draft disclosed by the MSE outlined the general objectives and action priorities. The policy document, which provides the guidelines for the next energy policies at national level, aims at reaching the decarbonisation environmental objectives, reducing energy costs and achieving independent energy procurement. Among SEN’s action priorities: promoting energy efficiency interventions, developing Italy’s role as a gas hub, reorganising fuel refining and the fuel distribution network, and updating the local and national governance systems. The discussion phase ended on 30 November 2012. Further developments are pending which will be implemented by the next government. Emilia earthquake of 20 May 2012: concessions for citizens hit by the earthquake By resolution no. 6/2013/R/Com, AEEG implemented automatic tariff concessions for a period of two years from 20 May 2012, date of the first earthquake. Network tariffs and general system costs have been reduced for electricity, gas and integrated water service users already connected on 19 May 2012 and located in the Municipalities indicated in the Ministerial Decree of the Minister of Economy and Finance of 1 June 2012 (in addition to the Municipalities of Ferrara and Mantua), as well as for temporary housing unit users. The decision has had significant effects on the local area managed by the HERA Group, where the users concerned by the concessions amount to around 150,000 supply points for the gas sector only. The concessions may also be requested by users located in Bologna, Modena, Reggio Emilia and Rovigo that have obtained postponement of payment deadlines for tax obligations and by users located in the Municipalities hit by the earthquake, other than the previous ones. Alongside the tariff concessions, the elimination of costs for any new connections, successions or transfers requested by persons whose houses (located in the Municipalities hit by the earthquake) are unusable, is also provided for according to the same deadlines. Automatic payment by instalments, without interest, of the gas and electricity bills (for a minimum period of 24 months) and of the integrated water service (for a minimum period of 12 months) for which payment deadlines had been suspended for six months following the earthquake, as a result of resolution no. 235/12/R/Com, is also provided for. The concessions related to reduced tariffs and payments for services, and those regarding the suspension of payment deadlines were implemented by AEEG in compliance with Decree Law no. 74/12, converted by Law no. 122/12. New management rules for the “Consumer Branch” By resolution no. 548/2012/R/Com, AEEG implemented the new rules based upon which the energy Consumer Branch will control the complaints received from final consumers or prosumers (entities that are both producers – only for plants with a capacity of up to 10 MW – and final consumers of electricity) which have previously submitted complaints to sellers or distributors and have not received a reply according to the time limit set out in the regulation, or have received a reply that is not deemed
39
satisfactory. The aim of the resolution is to ensure greater timeliness when replying to the complaints of the concerned parties. The Energy customers’ mediation service The “Energy Customers’ Mediation Service” will soon be launched (1 April 2013). This out-of-court dispute resolution tool (which will support other tools currently used, such as joint mediation procedures) intends to verify the feasibility of an agreement between consumers and operators, and may be freely accepted by the parties. The novelty introduced by the procedure regards the fact that the procedure is managed by the Single Buyer, on behalf of AEEG, at national level. Given the upcoming due date, the activities carried out by the work group established by AEEG are currently being finalised. They involve the participation of associations representing consumers and operators (including Federutility, of which the Hera Group is a member) and seek to provide clarity to operators and consumers as to the relationship between this tool and other out-of-court dispute resolution methods.

40
Dialogue with stakeholders
An industrial group with the characteristics of Hera must take into account the needs and demands of its many stakeholders. Hera periodically surveys the satisfaction of its customers and employees. The results are used to define improvement initiatives.
Hera’s stakeholders
An industrial group with the characteristics of Hera must take into account the needs and demands of a wide range of stakeholders which often may be conflicting. Corporate Social Responsibility means considering, within company decisions, all legitimate demands of the various categories of stakeholders, balancing these demands and integrating them into company strategy. Hera has mapped its company stakeholders. The starting point was a survey of corporate stakeholders and of current listening and dialogue activities. Various stakeholder classes were then identified and, for each, a breakdown was provided. The presence of targets of particular interest and the issues of particular significance to these targets were also identified. Then, an assessment was made of the influence that each group exerts on corporate decision-making processes and the significance with respect to corporate activities. These two aspects are assessed in the light of the decision-making power, pertaining to legal or contractual obligations, employment relations with the company and links with corporate strategies. Mapping of the stakeholders and key issues to be targeted by involvement actions enabled us to pinpoint the stakeholders that are the most important for the company (workforce, customers, shareholders), a second group of stakeholders with interests of a broader nature however able to influence corporate decisions (financial institutions, suppliers, public administration, local communities) and a category of stakeholders whose interests are only indirectly represented (the environment and future generations).
41
Dialogue and consultation initiatives
Stakeholder Main categories Key issues Main dialogue and consultation initiatives
Wo
rkfo
rce - Employees
- Non-employee workforce
- Trade unions
Stability, internal climate, training,
career advancement,
bonuses, remuneration,
life/work balance, equal
opportunities, safety, internal communication
- Biennial internal climate survey: following the survey carried out in 2011, 22 improvement actions were defined, 12 of which were developed in 2012, 2 only for the part related to 2012 and 8 are under way. The fifth survey will be carried out in 2013 - Satisfaction survey on the main internal communication tools: all Group workforce involved, around 1,600 questionnaires filled in (around 1,200 of which online), focus groups with around 70 employees, 10 in-depth interviews - Meetings of the Chairman and Chief Executive Officer to illustrate the business plan to all staff (16 meetings held in March 2012, with all staff) - “Passaparola” (“Word of mouth”) project: approximately 180 meetings and 1,600 employees involved in at least one meeting - Meetings to present the Sustainability Report 2011 (involving approx. 500 workers) - Application of the Group’s Supplementary Collective Labour Agreement signed on 24 March 2010: LaborHERA (technical study for organisational and work quality innovation) met four times in 2012 - 11 workers appointed by the corporate trade unions for the position of SA8000 workers’ representative; the first two meetings with the SA8000 management representative were held in December 2012
Cu
sto
mer
s
- Residential customers
- Customer bases in areas served
- Business customers
- Consumer groups and trade
associations
Service quality, tariffs,
transparency, safety, service
reliability, communication and information
- Residential and business customer annual survey: 3,028 interviews to non-eligible residential customers and 449 to free-market customers, a stratified sample by local area, consumer range and service, 1,228 interviews of the various types of business customers, a stratified sample by local area and turnover -Survey of the satisfaction of customers with the district heating service: 405 customer interviews conducted - In application of the joint mediation procedure, 81 requests for mediation were received from customers in 2012 - 635 cases managed through the new direct contact channel with consumers’ associations. In 2012, 29 meetings were held with the concerned associations, in the seven areas in which Hera operates - Consultation with customers regarding the project on improving the legibility of bills which will be implemented in 2013
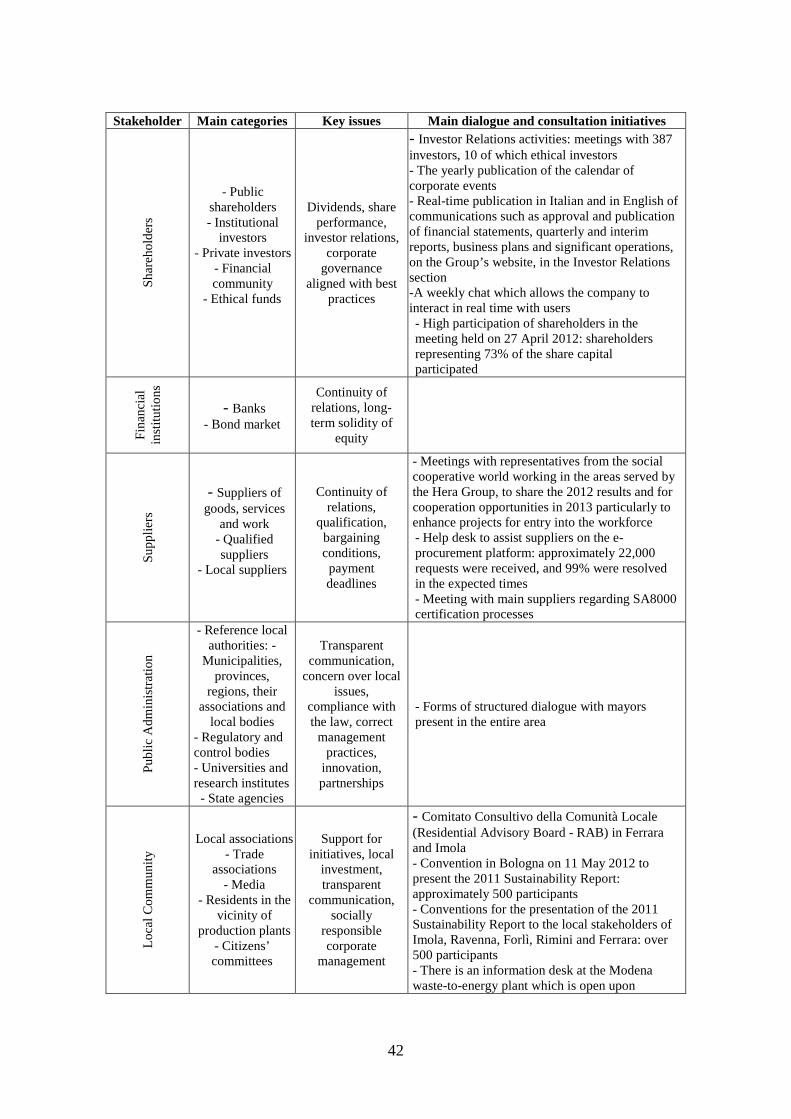
42
Stakeholder Main categories Key issues Main dialogue and consultation initiatives
Sh
areh
old
ers
- Public shareholders - Institutional
investors - Private investors
- Financial community
- Ethical funds
Dividends, share performance,
investor relations, corporate
governance aligned with best
practices
- Investor Relations activities: meetings with 387 investors, 10 of which ethical investors - The yearly publication of the calendar of corporate events - Real-time publication in Italian and in English of communications such as approval and publication of financial statements, quarterly and interim reports, business plans and significant operations, on the Group’s website, in the Investor Relations section -A weekly chat which allows the company to interact in real time with users - High participation of shareholders in the meeting held on 27 April 2012: shareholders representing 73% of the share capital participated
Fin
anci
al
inst
itutio
ns
- Banks - Bond market
Continuity of relations, long-term solidity of
equity
Su
pp
liers
- Suppliers of goods, services
and work - Qualified suppliers
- Local suppliers
Continuity of relations,
qualification, bargaining conditions, payment deadlines
- Meetings with representatives from the social cooperative world working in the areas served by the Hera Group, to share the 2012 results and for cooperation opportunities in 2013 particularly to enhance projects for entry into the workforce - Help desk to assist suppliers on the e-procurement platform: approximately 22,000 requests were received, and 99% were resolved in the expected times - Meeting with main suppliers regarding SA8000 certification processes
Pu
blic
Ad
min
istr
atio
n
- Reference local authorities: -
Municipalities, provinces,
regions, their associations and
local bodies - Regulatory and control bodies - Universities and research institutes - State agencies
Transparent communication,
concern over local issues,
compliance with the law, correct management
practices, innovation, partnerships
- Forms of structured dialogue with mayors present in the entire area
Lo
cal C
om
mu
nity
Local associations - Trade
associations - Media
- Residents in the vicinity of
production plants - Citizens’ committees
Support for initiatives, local
investment, transparent
communication, socially
responsible corporate
management
- Comitato Consultivo della Comunità Locale (Residential Advisory Board - RAB) in Ferrara and Imola - Convention in Bologna on 11 May 2012 to present the 2011 Sustainability Report: approximately 500 participants - Conventions for the presentation of the 2011 Sustainability Report to the local stakeholders of Imola, Ravenna, Forlì, Rimini and Ferrara: over 500 participants - There is an information desk at the Modena waste-to-energy plant which is open upon
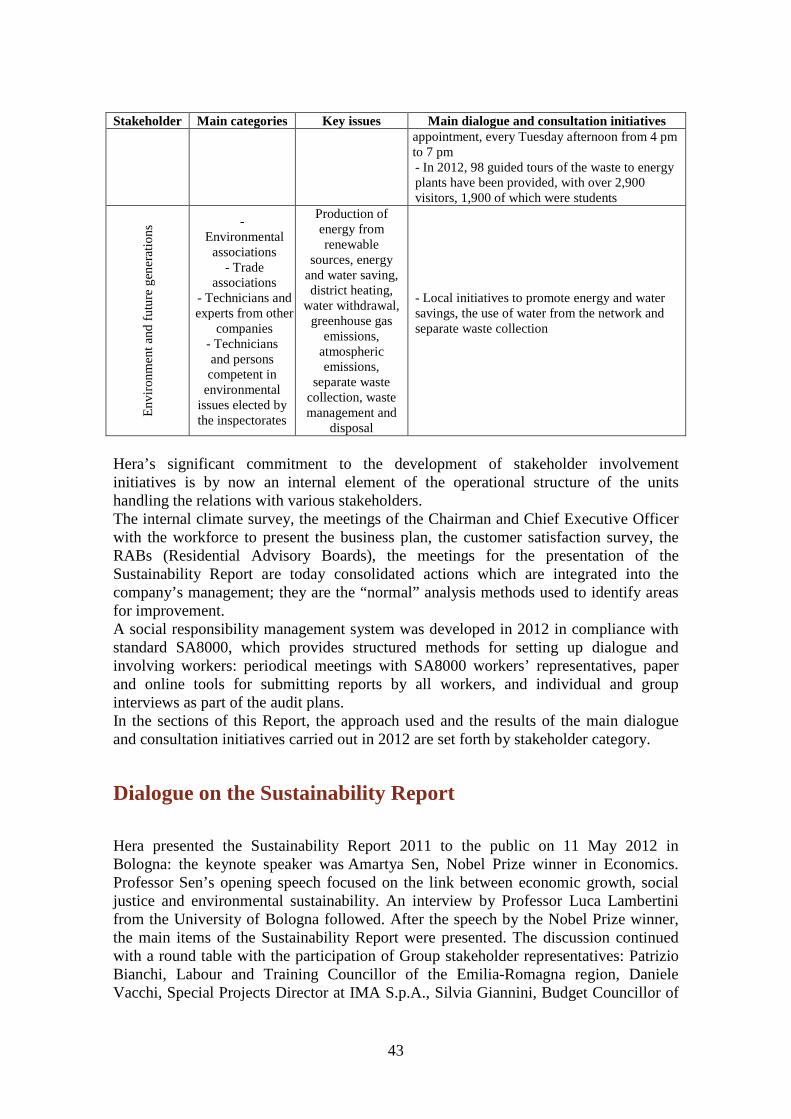
43
Stakeholder Main categories Key issues Main dialogue and consultation initiatives appointment, every Tuesday afternoon from 4 pm to 7 pm - In 2012, 98 guided tours of the waste to energy plants have been provided, with over 2,900 visitors, 1,900 of which were students
En
viro
nm
ent a
nd f
utu
re g
ener
atio
ns
- Environmental associations
- Trade associations
- Technicians and experts from other
companies - Technicians and persons competent in
environmental issues elected by the inspectorates
Production of energy from renewable
sources, energy and water saving, district heating,
water withdrawal, greenhouse gas
emissions, atmospheric emissions,
separate waste collection, waste management and
disposal
- Local initiatives to promote energy and water savings, the use of water from the network and separate waste collection
Hera’s significant commitment to the development of stakeholder involvement initiatives is by now an internal element of the operational structure of the units handling the relations with various stakeholders. The internal climate survey, the meetings of the Chairman and Chief Executive Officer with the workforce to present the business plan, the customer satisfaction survey, the RABs (Residential Advisory Boards), the meetings for the presentation of the Sustainability Report are today consolidated actions which are integrated into the company’s management; they are the “normal” analysis methods used to identify areas for improvement. A social responsibility management system was developed in 2012 in compliance with standard SA8000, which provides structured methods for setting up dialogue and involving workers: periodical meetings with SA8000 workers’ representatives, paper and online tools for submitting reports by all workers, and individual and group interviews as part of the audit plans. In the sections of this Report, the approach used and the results of the main dialogue and consultation initiatives carried out in 2012 are set forth by stakeholder category.
Dialogue on the Sustainability Report
Hera presented the Sustainability Report 2011 to the public on 11 May 2012 in Bologna: the keynote speaker was Amartya Sen, Nobel Prize winner in Economics. Professor Sen’s opening speech focused on the link between economic growth, social justice and environmental sustainability. An interview by Professor Luca Lambertini from the University of Bologna followed. After the speech by the Nobel Prize winner, the main items of the Sustainability Report were presented. The discussion continued with a round table with the participation of Group stakeholder representatives: Patrizio Bianchi, Labour and Training Councillor of the Emilia-Romagna region, Daniele Vacchi, Special Projects Director at IMA S.p.A., Silvia Giannini, Budget Councillor of
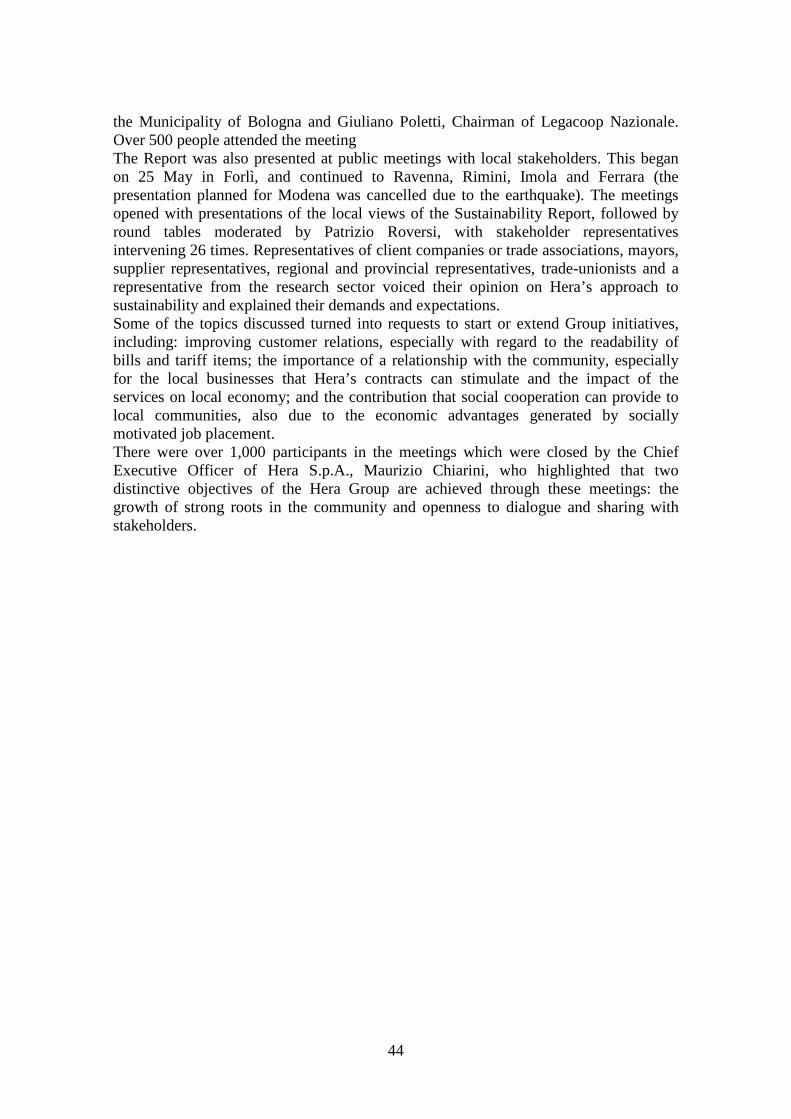
44
the Municipality of Bologna and Giuliano Poletti, Chairman of Legacoop Nazionale. Over 500 people attended the meeting The Report was also presented at public meetings with local stakeholders. This began on 25 May in Forlì, and continued to Ravenna, Rimini, Imola and Ferrara (the presentation planned for Modena was cancelled due to the earthquake). The meetings opened with presentations of the local views of the Sustainability Report, followed by round tables moderated by Patrizio Roversi, with stakeholder representatives intervening 26 times. Representatives of client companies or trade associations, mayors, supplier representatives, regional and provincial representatives, trade-unionists and a representative from the research sector voiced their opinion on Hera’s approach to sustainability and explained their demands and expectations. Some of the topics discussed turned into requests to start or extend Group initiatives, including: improving customer relations, especially with regard to the readability of bills and tariff items; the importance of a relationship with the community, especially for the local businesses that Hera’s contracts can stimulate and the impact of the services on local economy; and the contribution that social cooperation can provide to local communities, also due to the economic advantages generated by socially motivated job placement. There were over 1,000 participants in the meetings which were closed by the Chief Executive Officer of Hera S.p.A., Maurizio Chiarini, who highlighted that two distinctive objectives of the Hera Group are achieved through these meetings: the growth of strong roots in the community and openness to dialogue and sharing with stakeholders.
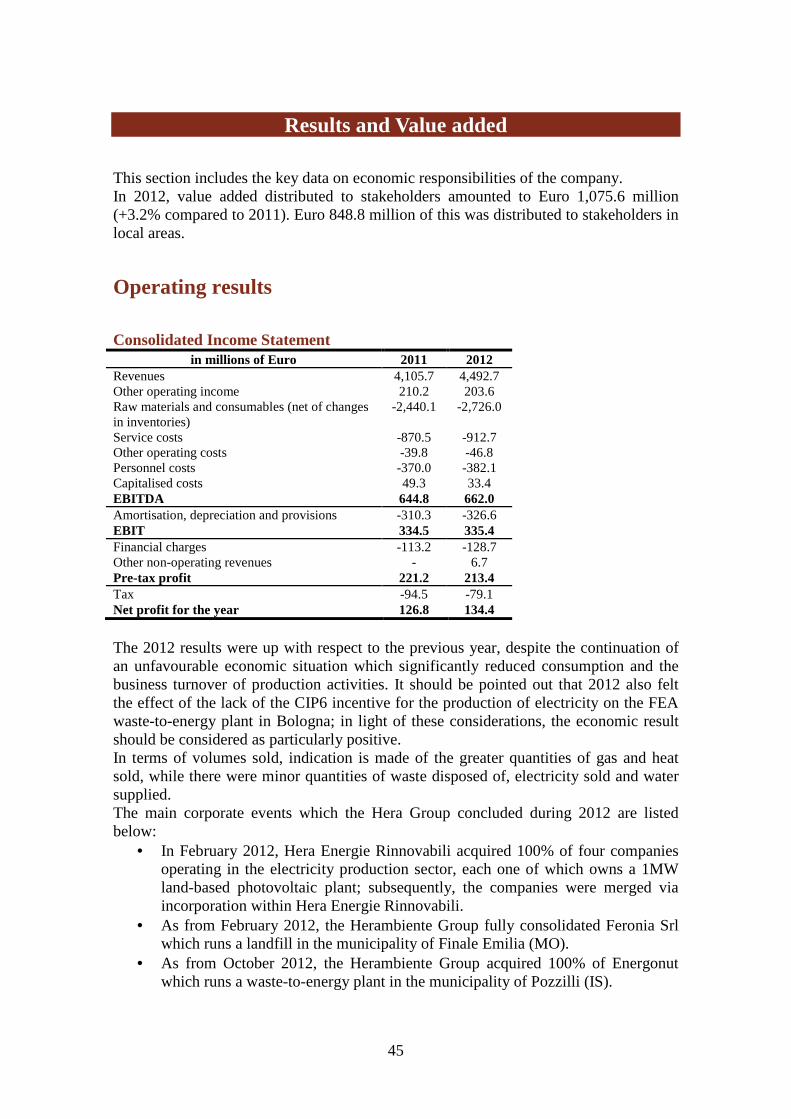
45
Results and Value added
This section includes the key data on economic responsibilities of the company. In 2012, value added distributed to stakeholders amounted to Euro 1,075.6 million (+3.2% compared to 2011). Euro 848.8 million of this was distributed to stakeholders in local areas.
Operating results
Consolidated Income Statement in millions of Euro 2011 2012
Revenues 4,105.7 4,492.7 Other operating income 210.2 203.6 Raw materials and consumables (net of changes in inventories)
-2,440.1 -2,726.0
Service costs -870.5 -912.7 Other operating costs -39.8 -46.8 Personnel costs -370.0 -382.1 Capitalised costs 49.3 33.4 EBITDA 644.8 662.0 Amortisation, depreciation and provisions -310.3 -326.6 EBIT 334.5 335.4 Financial charges -113.2 -128.7 Other non-operating revenues - 6.7 Pre-tax profit 221.2 213.4 Tax -94.5 -79.1 Net profit for the year 126.8 134.4
The 2012 results were up with respect to the previous year, despite the continuation of an unfavourable economic situation which significantly reduced consumption and the business turnover of production activities. It should be pointed out that 2012 also felt the effect of the lack of the CIP6 incentive for the production of electricity on the FEA waste-to-energy plant in Bologna; in light of these considerations, the economic result should be considered as particularly positive. In terms of volumes sold, indication is made of the greater quantities of gas and heat sold, while there were minor quantities of waste disposed of, electricity sold and water supplied. The main corporate events which the Hera Group concluded during 2012 are listed below:
• In February 2012, Hera Energie Rinnovabili acquired 100% of four companies operating in the electricity production sector, each one of which owns a 1MW land-based photovoltaic plant; subsequently, the companies were merged via incorporation within Hera Energie Rinnovabili.
• As from February 2012, the Herambiente Group fully consolidated Feronia Srl which runs a landfill in the municipality of Finale Emilia (MO).
• As from October 2012, the Herambiente Group acquired 100% of Energonut which runs a waste-to-energy plant in the municipality of Pozzilli (IS).

46
• As from July 2012, the Marche Multiservizi Group included Marche Multiservizi Falconara within its sphere of consolidation, a company involved in Urban Hygiene services in the municipality of Falconara and another 5 municipalities.
As already emerged from previous years’ financial statements, the Consolidated Income Statement incorporates the application of the interpretation of accounting standard IFRIC 12 “Service Concession Arrangements” which changed the procedure for reporting company events for companies operating in industries regulated by specific concessions. In accounting terms, the effect of the application of this principle, which does not alter the results, is the representation in the income statement of the investment work carried out on assets under concession, limited to grid services. Therefore, other operating income was higher by Euro 129.3 million for 2012 and by Euro 143.6 million for 2011, capitalised costs were lower by Euro 33.8 million in 2012 and Euro 35.5 million in 2011 and operating Service costs, materials and other operating expenses were higher by Euro 95.5 million in 2012 and Euro 108.1 million in 2011. EBITDA rose from Euro 644.8 million in 2011 to Euro 662.0 million in 2012, +2.7%; EBIT increased from Euro 334.5 million to Euro 335.4 million; the pre-tax result increased 3.5%, passing from Euro 221.2 million to Euro 213.4 million; the net profit rose from Euro 126.8 million as of 31 December 2011 to Euro 134.4 million in 2012, +6.0%. Revenues rose Euro 387.0 million, +9.4%, increasing from Euro 4,105.7 million in 2011 to Euro 4,492.7 million in 2012. This was mainly due to: (i) greater volumes of gas sold (ii) higher gas and electricity revenues due to the increase in the prices of the raw materials, amounting to around Euro 280 million, and (iii), greater revenues from the supply of the integrated water service. The increase in costs for raw materials, amounting to Euro 285.9 million, when compared with last year, was affected by the higher volumes of gas sold and the increases in the price of the raw material, by around Euro 280 million, as already indicated previously. Other operating costs (Service costs were up by Euro 42.2 million and Other operating costs by Euro 7.0 million), saw a total increase of Euro 49.2 million (+5.4%); the increase is attributable to higher costs for transporting electricity and gas (representing around 75%). Personnel costs rose 3.3%, from Euro 370 million as of 31 December 2011 to Euro 382.1 million in 2012. The increase is mainly due to the remuneration increases from the national collective labour agreement (CNNL), offset partly by a reduction in average resources, despite the inclusion of MMS Falconara and Energonut in the scope of consolidation. The decrease in Capitalised costs, which fell from Euro 49.3 million to Euro 33.4 million, is essentially linked to minor work carried out on plants and work between Group companies. The consolidated EBITDA of the Group as at 31 December 2012 was up, passing from Euro 644.8 million to Euro 662.00 million, disclosing growth of Euro 17.2 million (+2.7%), despite the lower revenues for around Euro 18.0 million relating to the termination of the CIP6 incentive on the FEA waste-to-energy plant in the Bologna area.
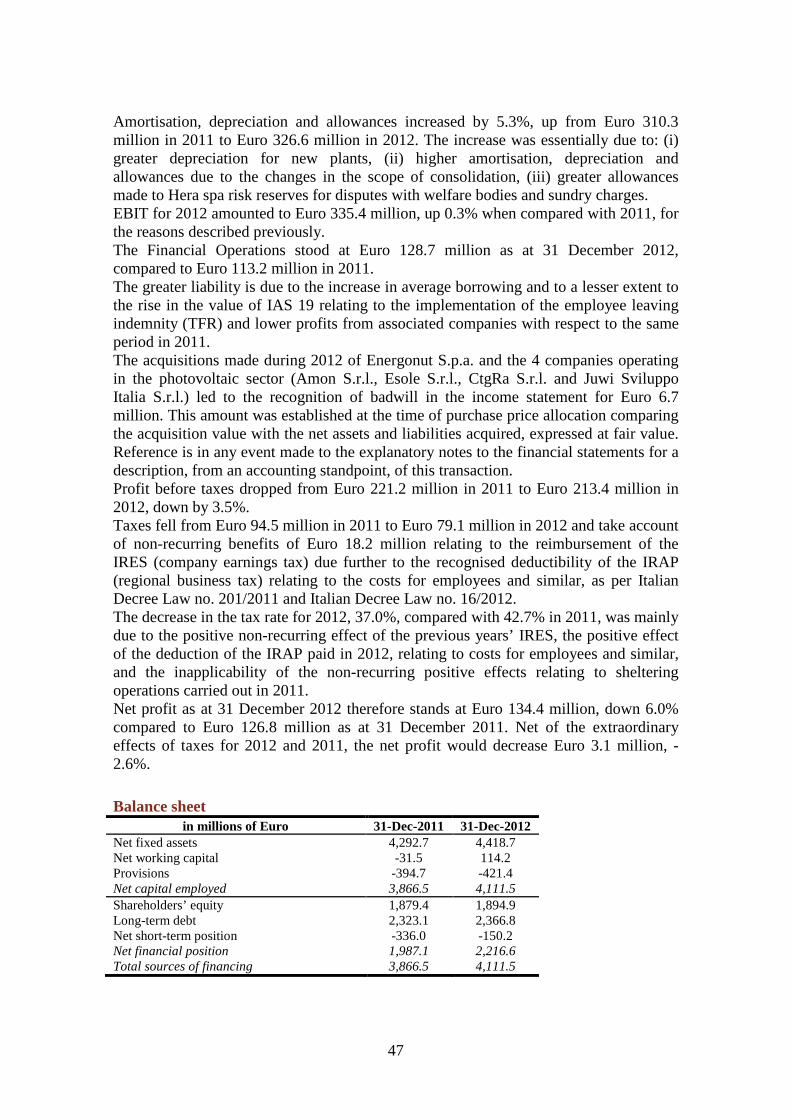
47
Amortisation, depreciation and allowances increased by 5.3%, up from Euro 310.3 million in 2011 to Euro 326.6 million in 2012. The increase was essentially due to: (i) greater depreciation for new plants, (ii) higher amortisation, depreciation and allowances due to the changes in the scope of consolidation, (iii) greater allowances made to Hera spa risk reserves for disputes with welfare bodies and sundry charges. EBIT for 2012 amounted to Euro 335.4 million, up 0.3% when compared with 2011, for the reasons described previously. The Financial Operations stood at Euro 128.7 million as at 31 December 2012, compared to Euro 113.2 million in 2011. The greater liability is due to the increase in average borrowing and to a lesser extent to the rise in the value of IAS 19 relating to the implementation of the employee leaving indemnity (TFR) and lower profits from associated companies with respect to the same period in 2011. The acquisitions made during 2012 of Energonut S.p.a. and the 4 companies operating in the photovoltaic sector (Amon S.r.l., Esole S.r.l., CtgRa S.r.l. and Juwi Sviluppo Italia S.r.l.) led to the recognition of badwill in the income statement for Euro 6.7 million. This amount was established at the time of purchase price allocation comparing the acquisition value with the net assets and liabilities acquired, expressed at fair value. Reference is in any event made to the explanatory notes to the financial statements for a description, from an accounting standpoint, of this transaction. Profit before taxes dropped from Euro 221.2 million in 2011 to Euro 213.4 million in 2012, down by 3.5%. Taxes fell from Euro 94.5 million in 2011 to Euro 79.1 million in 2012 and take account of non-recurring benefits of Euro 18.2 million relating to the reimbursement of the IRES (company earnings tax) due further to the recognised deductibility of the IRAP (regional business tax) relating to the costs for employees and similar, as per Italian Decree Law no. 201/2011 and Italian Decree Law no. 16/2012. The decrease in the tax rate for 2012, 37.0%, compared with 42.7% in 2011, was mainly due to the positive non-recurring effect of the previous years’ IRES, the positive effect of the deduction of the IRAP paid in 2012, relating to costs for employees and similar, and the inapplicability of the non-recurring positive effects relating to sheltering operations carried out in 2011. Net profit as at 31 December 2012 therefore stands at Euro 134.4 million, down 6.0% compared to Euro 126.8 million as at 31 December 2011. Net of the extraordinary effects of taxes for 2012 and 2011, the net profit would decrease Euro 3.1 million, -2.6%.
Balance sheet in millions of Euro 31-Dec-2011 31-Dec-2012
Net fixed assets 4,292.7 4,418.7 Net working capital -31.5 114.2 Provisions -394.7 -421.4 Net capital employed 3,866.5 4,111.5 Shareholders’ equity 1,879.4 1,894.9 Long-term debt 2,323.1 2,366.8 Net short-term position -336.0 -150.2 Net financial position 1,987.1 2,216.6 Total sources of financing 3,866.5 4,111.5
48
The net capital employed in 2012 increased 6.3% from Euro 3,866.5 million to Euro 4,111.5 million as a result of the additional net fixed assets and the greater net working capital. Net fixed assets as at 31 December 2012 amounted to Euro 4,418.7 million compared with Euro 4,292.7 million in December 2011, involving an increase of 2.9% due to the investments made during the year and the extension of the scope of consolidation of the Hera Group with the acquisition of new subsidiary companies with a high capital intensity. Net working capital rose, reporting an increase of around Euro 145.7 million when compared with December 2011. The change was due in the first place to an increase in trade receivables, due to the earthquake which hit the areas in the Emilia Romagna region served by the Hera Group and the postponement in the collection of Green Certificates, already partly collected at the beginning of 2013, as well as a decrease in trade payables, due to the seasonal trend with moderate temperatures in the last few months of the year which led to lower purchases of raw materials. In conclusion, the change in working capital is explained by an increase in tax receivables, being the effect of the IRES deduction relating to IRAP for 2012 and the recording of the recovery of IRES for the year 2007 until 2011 as per Italian Decree Law no. 201/2011. Provisions at the end of 2012 amounted to Euro 421.4, up 6.8% with respect to the balance in December 2011 of Euro 394.7 million. Shareholders’ equity rose from Euro 1,879.4 million to Euro 1,894.9 million due to dividends authorised for a total of Euro 114.0 million.
Operating investments (non financial) in millions of Euro 2011 2012
Gas/District Heating/Heat Management Services 52.2 40.3 Electricity/Industrial Cogeneration Services 33.8 32.0 Integrated Water Service 100.6 93.5 Waste Management Services 70.1 47.9 Other Services 14.0 12.2 Central Structure 54.2 62.0 Total 324.9 287.9
Gas service investments were lower than in the same period last year. Investments relating to the Gas service in the area in question regarded network expansion, enhancement and upgrading of networks and plant systems. District heating concerned extension work on the network in the areas of Bologna (Euro 4.5 million), Imola (Euro 2.7 million), Forlì-Cesena (Euro 1.2 million), Ferrara (Euro 1.2 million) and Modena (Euro 0.5 million). Heat Management service investments concerned structural work on thermal plants operated by companies of the Group. Electricity service investments mainly concerned the extension of the service and special maintenance of the plants and distribution grids in the Modena and Imola areas, along with network support services. Investments increased with respect to the same period last year following the acquisition of photovoltaic plants by Hera Energie Rinnovabili. The investments in electricity and heat production plants (CCGT) refer to the Imola cogeneration plant, while the industrial cogeneration measures concerned the building of new plants at area companies.
49
With regard to the Integrated Water Cycle, investments mainly refer to expansions, enhancements and upgrades of networks and facilities, and to regulatory compliance mostly in the treatment and sewage sphere. The measures in the Water Cycle reported a reduction with respect to the same period in the previous year.
Investments in the integrated water service (2012)
With regard to the integrated water service, during 2012 39% of investments concerned the extraordinary maintenance of the networks, while 34% concerned plant, specifically in the treatment sphere. Investments for the extension of networks and connections were up slightly, equating to 27% of the total With regard to Waste Management, maintenance and upgrade measures on the existing facilities in the area decreased with respect to the previous year mainly in the waste-to-energy sphere, partly offset by the measures taken to build two new anaerobic bio-digesters. With regard in particular to investments in the sphere of waste-to-energy plants, during 2012 no investments were made for new plants. The Other services area in the Telecommunications sphere saw investments down with respect to the same period in 2011; the Other item included investments in cemetery services inclusive of the construction of the new crematory complex. There was an overall increase in investments within the Central Structure sphere when compared with last year, due to measures for constructing new premises and the maintenance measures on the vehicle fleet. Other investments include the completion of the laboratories and the remote control structures.
Financial equity investments and acquisitions in millions of Euro 2011 2012
Investments 0.0 1.3
In 2012, financial equity investments for Euro 1.3 million were made, relating to the acquisition of holdings in the capital of the company Q. Termo for the construction of an incinerator in Florence.
Connections 8,5%
Network expansion 18,3%
Network maintenance
39,4%
Plant maintenance 16,4%
Plant expansion 17,4%

50
Total investments of the Territorial Operating Structures (in millions of €)
62% of investments made by the Territorial Operating Structures concern the integrated water service
22,7
7,8
13,9
6,7
12,4
10
12,6
86,1
15,6
4,5
4,1
15,4
3,1
0,5
51,8
8,6
0
50
100
150
200
TOSBologna
TOSFerrara
TOS Forlì-Cesena
TOS Imola-Faenza
TOSModena
TOSRavenna
TOS Rimini Totale
Integrated water service Other investments
137,913,1
13,1
27,8
15,3
18,0
12,3
38,3
Environmental costs and investments The measurement of the costs and the environmental investments makes it possible to quantify in economic terms the interventions carried out in order to improve the environmental sustainability of the Group and the territory in which it operates, thereby showing how much of the activity translates into environmental improvement. Any cost or investment connected to interventions which resulted in a significant positive environmental impact was defined as an environmental expense. Taking account of the activities managed by Hera, several characteristic activities carried out by the company such as separate waste collection, the operation of composting plants or the expansion of treatment plants were also taken into consideration.
Environmental costs and investments in millions of Euro 2011 2012
Costs 245.5 232.3 Investments 126.0 133.0 The data refer to the following companies: Hera S.p.A., Herambiente, Hera Comm, Hera Energie Rinnovabili, Uniflotte With respect to the energy services, environmental costs pertain to the emergency response services for gas network safety, ordinary maintenance of the gas network, the operation of plants for the generation of energy from renewable sources, the operation of the networks and district heating plants. For the water service, environmental costs are connected to the emergency response service, the ordinary maintenance of the aqueduct and sewage systems and to the disposal of waste water treatment and purification sludge.
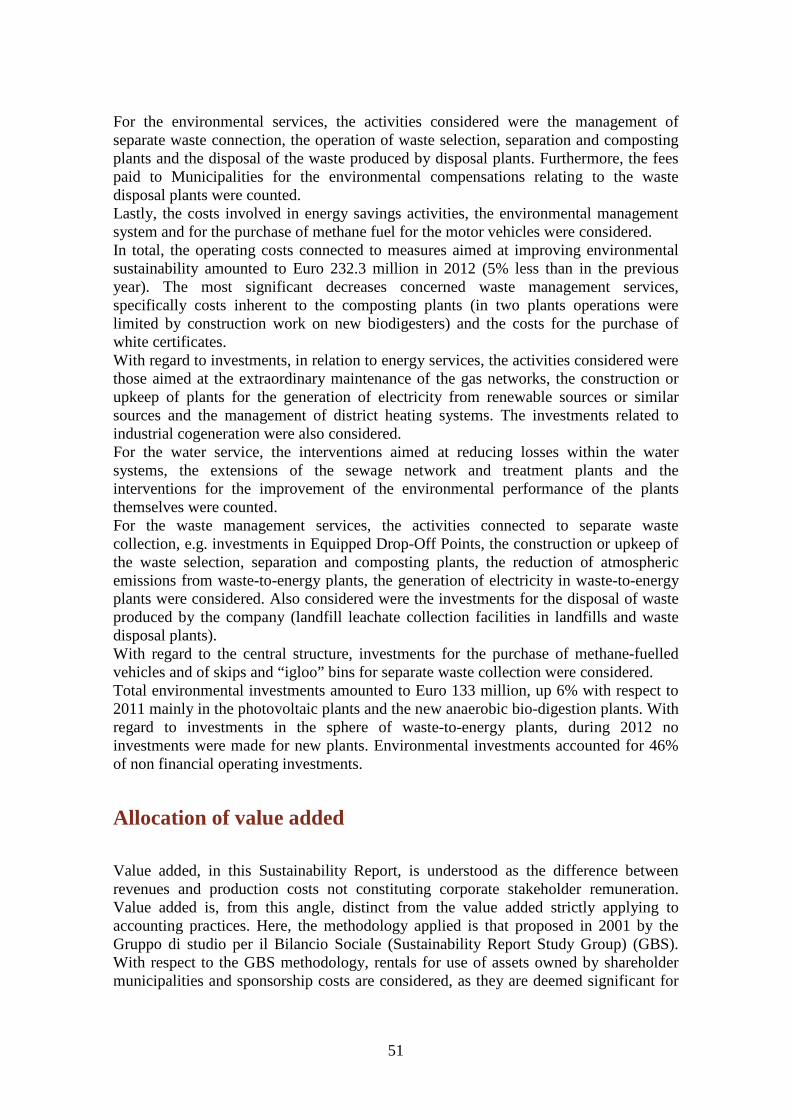
51
For the environmental services, the activities considered were the management of separate waste connection, the operation of waste selection, separation and composting plants and the disposal of the waste produced by disposal plants. Furthermore, the fees paid to Municipalities for the environmental compensations relating to the waste disposal plants were counted. Lastly, the costs involved in energy savings activities, the environmental management system and for the purchase of methane fuel for the motor vehicles were considered. In total, the operating costs connected to measures aimed at improving environmental sustainability amounted to Euro 232.3 million in 2012 (5% less than in the previous year). The most significant decreases concerned waste management services, specifically costs inherent to the composting plants (in two plants operations were limited by construction work on new biodigesters) and the costs for the purchase of white certificates. With regard to investments, in relation to energy services, the activities considered were those aimed at the extraordinary maintenance of the gas networks, the construction or upkeep of plants for the generation of electricity from renewable sources or similar sources and the management of district heating systems. The investments related to industrial cogeneration were also considered. For the water service, the interventions aimed at reducing losses within the water systems, the extensions of the sewage network and treatment plants and the interventions for the improvement of the environmental performance of the plants themselves were counted. For the waste management services, the activities connected to separate waste collection, e.g. investments in Equipped Drop-Off Points, the construction or upkeep of the waste selection, separation and composting plants, the reduction of atmospheric emissions from waste-to-energy plants, the generation of electricity in waste-to-energy plants were considered. Also considered were the investments for the disposal of waste produced by the company (landfill leachate collection facilities in landfills and waste disposal plants). With regard to the central structure, investments for the purchase of methane-fuelled vehicles and of skips and “igloo” bins for separate waste collection were considered. Total environmental investments amounted to Euro 133 million, up 6% with respect to 2011 mainly in the photovoltaic plants and the new anaerobic bio-digestion plants. With regard to investments in the sphere of waste-to-energy plants, during 2012 no investments were made for new plants. Environmental investments accounted for 46% of non financial operating investments.
Allocation of value added
Value added, in this Sustainability Report, is understood as the difference between revenues and production costs not constituting corporate stakeholder remuneration. Value added is, from this angle, distinct from the value added strictly applying to accounting practices. Here, the methodology applied is that proposed in 2001 by the Gruppo di studio per il Bilancio Sociale (Sustainability Report Study Group) (GBS). With respect to the GBS methodology, rentals for use of assets owned by shareholder municipalities and sponsorship costs are considered, as they are deemed significant for
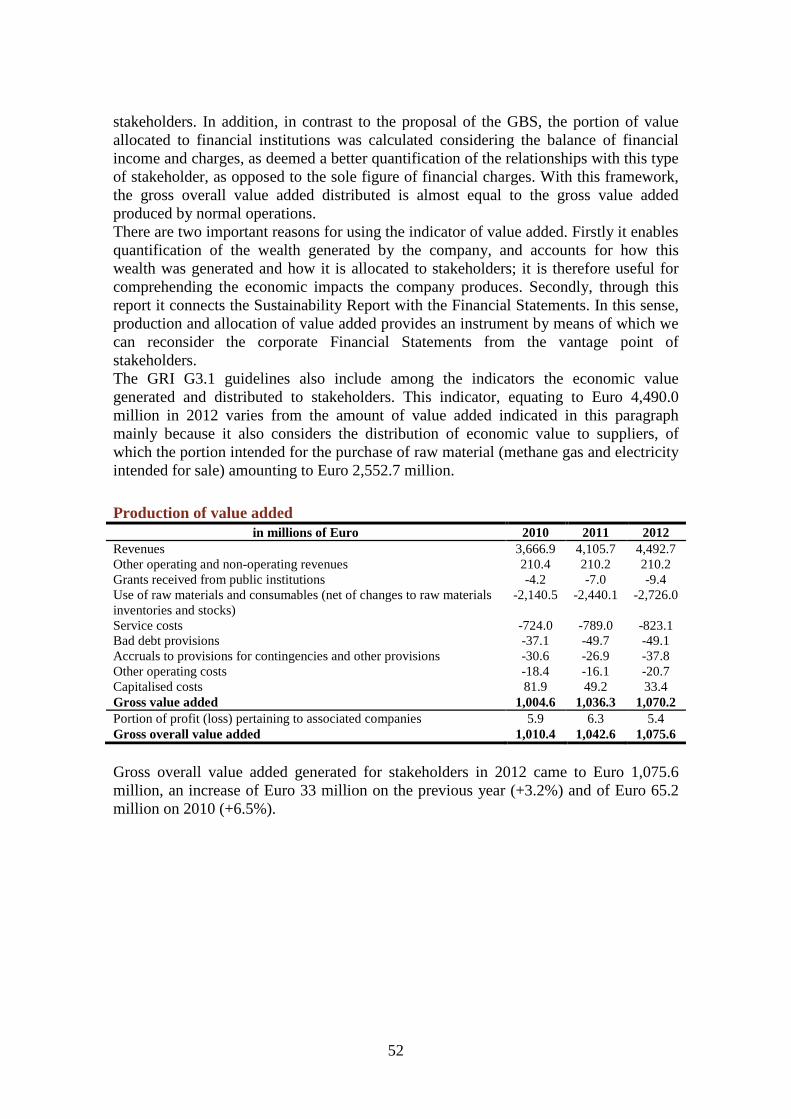
52
stakeholders. In addition, in contrast to the proposal of the GBS, the portion of value allocated to financial institutions was calculated considering the balance of financial income and charges, as deemed a better quantification of the relationships with this type of stakeholder, as opposed to the sole figure of financial charges. With this framework, the gross overall value added distributed is almost equal to the gross value added produced by normal operations. There are two important reasons for using the indicator of value added. Firstly it enables quantification of the wealth generated by the company, and accounts for how this wealth was generated and how it is allocated to stakeholders; it is therefore useful for comprehending the economic impacts the company produces. Secondly, through this report it connects the Sustainability Report with the Financial Statements. In this sense, production and allocation of value added provides an instrument by means of which we can reconsider the corporate Financial Statements from the vantage point of stakeholders. The GRI G3.1 guidelines also include among the indicators the economic value generated and distributed to stakeholders. This indicator, equating to Euro 4,490.0 million in 2012 varies from the amount of value added indicated in this paragraph mainly because it also considers the distribution of economic value to suppliers, of which the portion intended for the purchase of raw material (methane gas and electricity intended for sale) amounting to Euro 2,552.7 million.
Production of value added in millions of Euro 2010 2011 2012
Revenues 3,666.9 4,105.7 4,492.7 Other operating and non-operating revenues 210.4 210.2 210.2 Grants received from public institutions -4.2 -7.0 -9.4 Use of raw materials and consumables (net of changes to raw materials inventories and stocks)
-2,140.5 -2,440.1 -2,726.0
Service costs -724.0 -789.0 -823.1 Bad debt provisions -37.1 -49.7 -49.1 Accruals to provisions for contingencies and other provisions -30.6 -26.9 -37.8 Other operating costs -18.4 -16.1 -20.7 Capitalised costs 81.9 49.2 33.4 Gross value added 1,004.6 1,036.3 1,070.2 Portion of profit (loss) pertaining to associated companies 5.9 6.3 5.4 Gross overall value added 1,010.4 1,042.6 1,075.6
Gross overall value added generated for stakeholders in 2012 came to Euro 1,075.6 million, an increase of Euro 33 million on the previous year (+3.2%) and of Euro 65.2 million on 2010 (+6.5%).

53
Distribution of value added to stakeholders in millions of Euro 2010 2011 2012
Workforce 361.9 35.8% 370.0 35.4% 382.1 35.5% Shareholders 125.2 12.4% 122.6 11.8% 135.1 12.6% Company 241.1 23.9% 238.1 22.8% 239.0 22.2% Financial institutions/Banks 115.6 11.4% 119.5 11.5% 134.1 12.5% Public Administration 164.8 16.3% 190.4 18.3% 183.3 17.0% Local community 1.8 0.2% 2.0 0.2% 2.0 0.2% Gross overall value added 1,010.4 100.0% 1,042.6 100.0% 1,075.6 100.0%
The portion of value added intended for the workforce increased Euro 12.1 million (+3%) compared to 2011. Compared to the total value added produced, this portion represents 35.5%, and consists of wages and salaries (including employer social security contributions and provision for employee leaving indemnities). The portion allocated to the shareholders of Hera S.p.A. and the minority shareholders of the subsidiaries rose by Euro 12.6 million (+10.3%) and equates to 12.6% of the total. Of this portion, Euro 119.4 million was allocated as dividends distributed to Hera S.p.A. shareholders, and Euro 15.7 million was allocated as dividends for minority shareholders of the subsidiaries of Hera S.p.A. (this portion came to Euro 22.2 million in 2011). A portion totalling 22.2% of the value added generated in 2012 was re-invested in the company. This portion increased with respect to 2011 and includes the amortisation/depreciation of investments made by the company (Euro 239.7 million). The portion of value added allocated to financial institutions in 2012 came to Euro 134.1 million (12.5% of the total, +12% compared to 2011). This share comprises Euro 248.7 million in financial charges, and Euro 114.6 million in financial income.
Distribution of value added to stakeholders (2012)
The portion distributed to Public Administration amounted to Euro 183.3 million, 17.0% of the total (-3.8% compared to 2011). Duties and taxes amounted to Euro 100.3 million (9.3% of the total value added distributed, 13% less when compared to 2011). It should be recalled that in 2011 the taxes and duties had reported an increase of 43% with respect to 2010 for two reasons: (i) non-recurring positive effects totalling Euro 25.6 million relating to the freeing up, by means of substitute tax, of the additional values recorded in the financial statements
Workforce 35,5%
Shareholders 12,6%
Company 22,2%
Financial Institutions/Bank
s 12,5%
Public Administration
17,0%
Local Community 0,2%
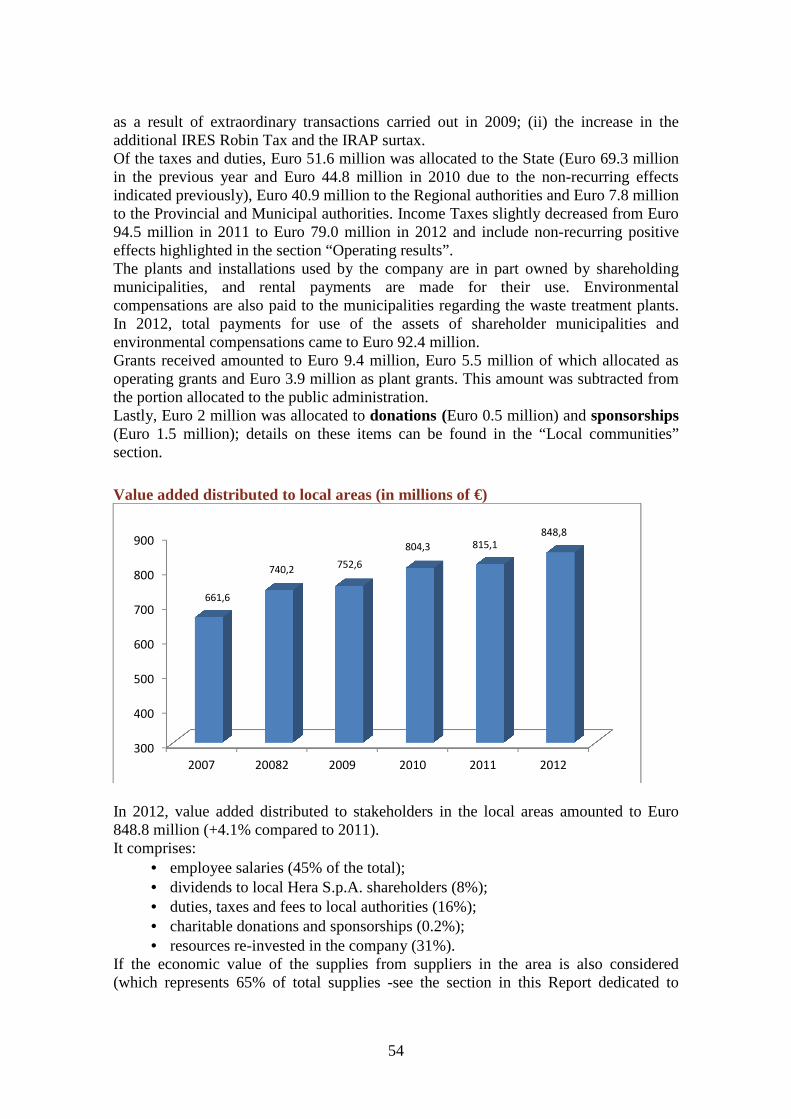
54
as a result of extraordinary transactions carried out in 2009; (ii) the increase in the additional IRES Robin Tax and the IRAP surtax. Of the taxes and duties, Euro 51.6 million was allocated to the State (Euro 69.3 million in the previous year and Euro 44.8 million in 2010 due to the non-recurring effects indicated previously), Euro 40.9 million to the Regional authorities and Euro 7.8 million to the Provincial and Municipal authorities. Income Taxes slightly decreased from Euro 94.5 million in 2011 to Euro 79.0 million in 2012 and include non-recurring positive effects highlighted in the section “Operating results”. The plants and installations used by the company are in part owned by shareholding municipalities, and rental payments are made for their use. Environmental compensations are also paid to the municipalities regarding the waste treatment plants. In 2012, total payments for use of the assets of shareholder municipalities and environmental compensations came to Euro 92.4 million. Grants received amounted to Euro 9.4 million, Euro 5.5 million of which allocated as operating grants and Euro 3.9 million as plant grants. This amount was subtracted from the portion allocated to the public administration. Lastly, Euro 2 million was allocated to donations (Euro 0.5 million) and sponsorships (Euro 1.5 million); details on these items can be found in the “Local communities” section.
Value added distributed to local areas (in millions of €)
In 2012, value added distributed to stakeholders in the local areas amounted to Euro 848.8 million (+4.1% compared to 2011). It comprises:
• employee salaries (45% of the total); • dividends to local Hera S.p.A. shareholders (8%); • duties, taxes and fees to local authorities (16%); • charitable donations and sponsorships (0.2%); • resources re-invested in the company (31%).
If the economic value of the supplies from suppliers in the area is also considered (which represents 65% of total supplies -see the section in this Report dedicated to
300
400
500
600
700
800
900
2007 20082 2009 2010 2011 2012
661,6
740,2752,6
804,3 815,1848,8

55
suppliers - and which can be estimated as 848.9 million), the total wealth distributed to local areas in 2012 can therefore be estimated as Euro 1,697.7 million. The minority shareholders of the subsidiaries have not been taken into consideration in the calculation of the value added distributed to the local areas; with regard to the distribution of the dividends of Hera S.p.A., here reference is made to the share composition as of the 2011 dividend payment date.
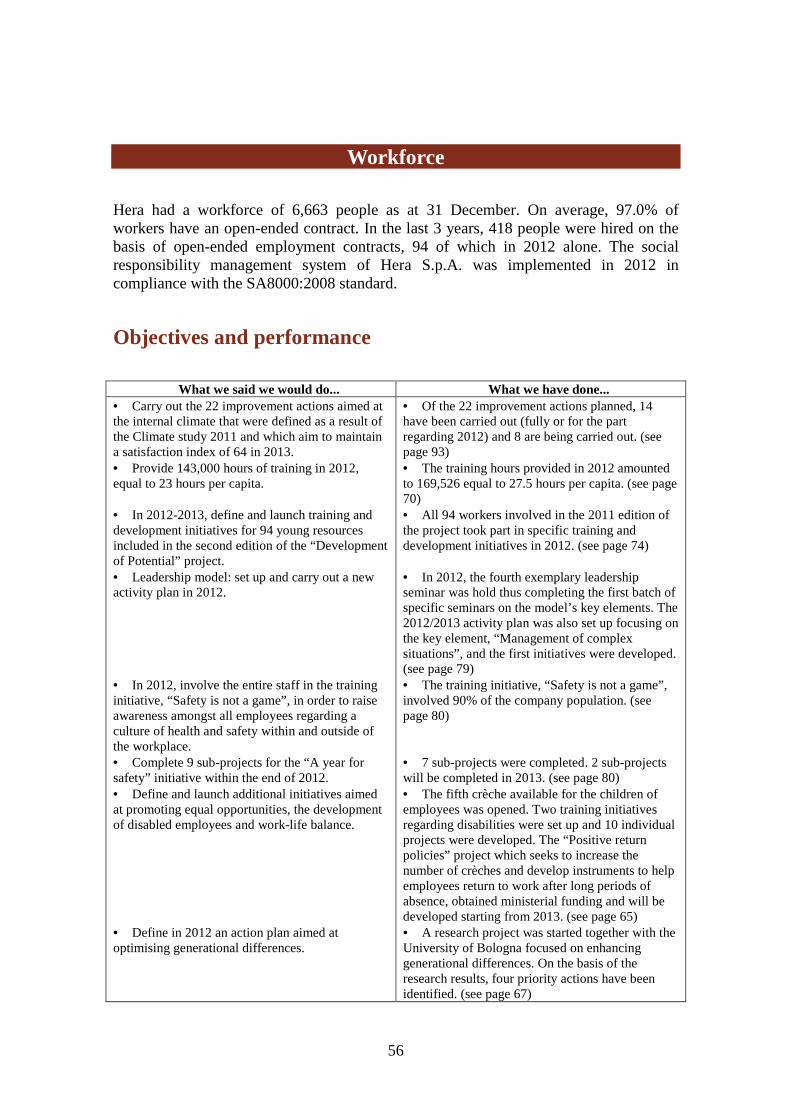
56
Workforce
Hera had a workforce of 6,663 people as at 31 December. On average, 97.0% of workers have an open-ended contract. In the last 3 years, 418 people were hired on the basis of open-ended employment contracts, 94 of which in 2012 alone. The social responsibility management system of Hera S.p.A. was implemented in 2012 in compliance with the SA8000:2008 standard.
Objectives and performance
What we said we would do... What we have done... • Carry out the 22 improvement actions aimed at the internal climate that were defined as a result of the Climate study 2011 and which aim to maintain a satisfaction index of 64 in 2013. • Provide 143,000 hours of training in 2012, equal to 23 hours per capita. • In 2012-2013, define and launch training and development initiatives for 94 young resources included in the second edition of the “Development of Potential” project. • Leadership model: set up and carry out a new activity plan in 2012. • In 2012, involve the entire staff in the training initiative, “Safety is not a game”, in order to raise awareness amongst all employees regarding a culture of health and safety within and outside of the workplace. • Complete 9 sub-projects for the “A year for safety” initiative within the end of 2012. • Define and launch additional initiatives aimed at promoting equal opportunities, the development of disabled employees and work-life balance. • Define in 2012 an action plan aimed at optimising generational differences.
• Of the 22 improvement actions planned, 14 have been carried out (fully or for the part regarding 2012) and 8 are being carried out. (see page 93) • The training hours provided in 2012 amounted to 169,526 equal to 27.5 hours per capita. (see page 70) • All 94 workers involved in the 2011 edition of the project took part in specific training and development initiatives in 2012. (see page 74) • In 2012, the fourth exemplary leadership seminar was hold thus completing the first batch of specific seminars on the model’s key elements. The 2012/2013 activity plan was also set up focusing on the key element, “Management of complex situations”, and the first initiatives were developed. (see page 79) • The training initiative, “Safety is not a game”, involved 90% of the company population. (see page 80) • 7 sub-projects were completed. 2 sub-projects will be completed in 2013. (see page 80) • The fifth crèche available for the children of employees was opened. Two training initiatives regarding disabilities were set up and 10 individual projects were developed. The “Positive return policies” project which seeks to increase the number of crèches and develop instruments to help employees return to work after long periods of absence, obtained ministerial funding and will be developed starting from 2013. (see page 65) • A research project was started together with the University of Bologna focused on enhancing generational differences. On the basis of the research results, four priority actions have been identified. (see page 67)
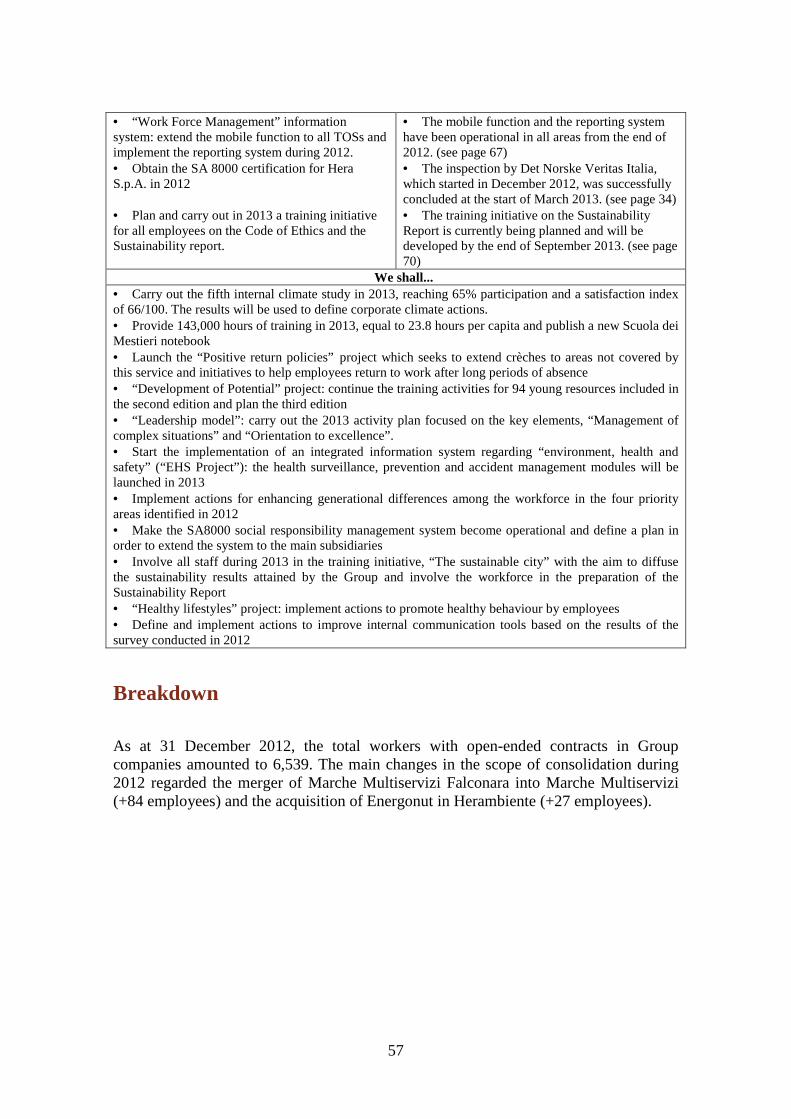
57
• “Work Force Management” information system: extend the mobile function to all TOSs and implement the reporting system during 2012. • Obtain the SA 8000 certification for Hera S.p.A. in 2012 • Plan and carry out in 2013 a training initiative for all employees on the Code of Ethics and the Sustainability report.
• The mobile function and the reporting system have been operational in all areas from the end of 2012. (see page 67) • The inspection by Det Norske Veritas Italia, which started in December 2012, was successfully concluded at the start of March 2013. (see page 34) • The training initiative on the Sustainability Report is currently being planned and will be developed by the end of September 2013. (see page 70)
We shall... • Carry out the fifth internal climate study in 2013, reaching 65% participation and a satisfaction index of 66/100. The results will be used to define corporate climate actions. • Provide 143,000 hours of training in 2013, equal to 23.8 hours per capita and publish a new Scuola dei Mestieri notebook • Launch the “Positive return policies” project which seeks to extend crèches to areas not covered by this service and initiatives to help employees return to work after long periods of absence • “Development of Potential” project: continue the training activities for 94 young resources included in the second edition and plan the third edition • “Leadership model”: carry out the 2013 activity plan focused on the key elements, “Management of complex situations” and “Orientation to excellence”. • Start the implementation of an integrated information system regarding “environment, health and safety” (“EHS Project”): the health surveillance, prevention and accident management modules will be launched in 2013 • Implement actions for enhancing generational differences among the workforce in the four priority areas identified in 2012 • Make the SA8000 social responsibility management system become operational and define a plan in order to extend the system to the main subsidiaries • Involve all staff during 2013 in the training initiative, “The sustainable city” with the aim to diffuse the sustainability results attained by the Group and involve the workforce in the preparation of the Sustainability Report • “Healthy lifestyles” project: implement actions to promote healthy behaviour by employees • Define and implement actions to improve internal communication tools based on the results of the survey conducted in 2012
Breakdown
As at 31 December 2012, the total workers with open-ended contracts in Group companies amounted to 6,539. The main changes in the scope of consolidation during 2012 regarded the merger of Marche Multiservizi Falconara into Marche Multiservizi (+84 employees) and the acquisition of Energonut in Herambiente (+27 employees).
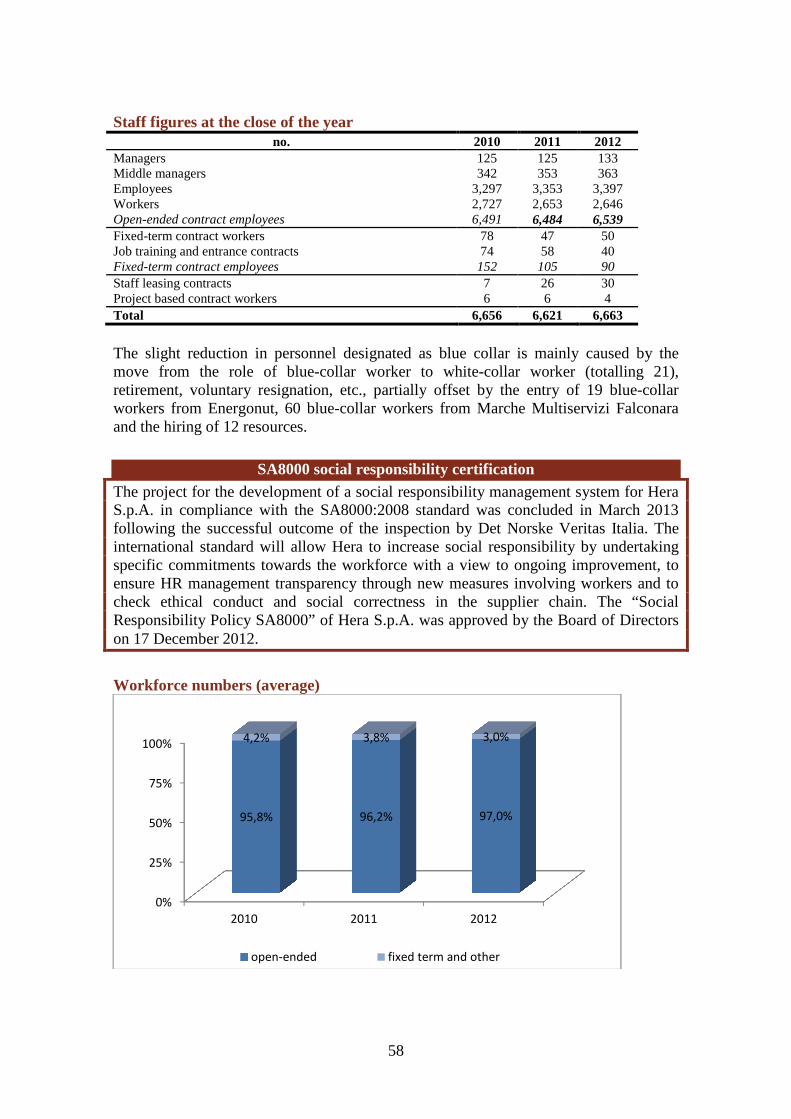
58
Staff figures at the close of the year no. 2010 2011 2012
Managers 125 125 133 Middle managers 342 353 363 Employees 3,297 3,353 3,397 Workers 2,727 2,653 2,646 Open-ended contract employees 6,491 6,484 6,539 Fixed-term contract workers 78 47 50 Job training and entrance contracts 74 58 40 Fixed-term contract employees 152 105 90 Staff leasing contracts 7 26 30 Project based contract workers 6 6 4 Total 6,656 6,621 6,663
The slight reduction in personnel designated as blue collar is mainly caused by the move from the role of blue-collar worker to white-collar worker (totalling 21), retirement, voluntary resignation, etc., partially offset by the entry of 19 blue-collar workers from Energonut, 60 blue-collar workers from Marche Multiservizi Falconara and the hiring of 12 resources.
SA8000 social responsibility certification The project for the development of a social responsibility management system for Hera S.p.A. in compliance with the SA8000:2008 standard was concluded in March 2013 following the successful outcome of the inspection by Det Norske Veritas Italia. The international standard will allow Hera to increase social responsibility by undertaking specific commitments towards the workforce with a view to ongoing improvement, to ensure HR management transparency through new measures involving workers and to check ethical conduct and social correctness in the supplier chain. The “Social Responsibility Policy SA8000” of Hera S.p.A. was approved by the Board of Directors on 17 December 2012.
Workforce numbers (average)
0%
25%
50%
75%
100%
2010 2011 2012
95,8% 96,2% 97,0%
4,2% 3,8% 3,0%
open-ended fixed term and other
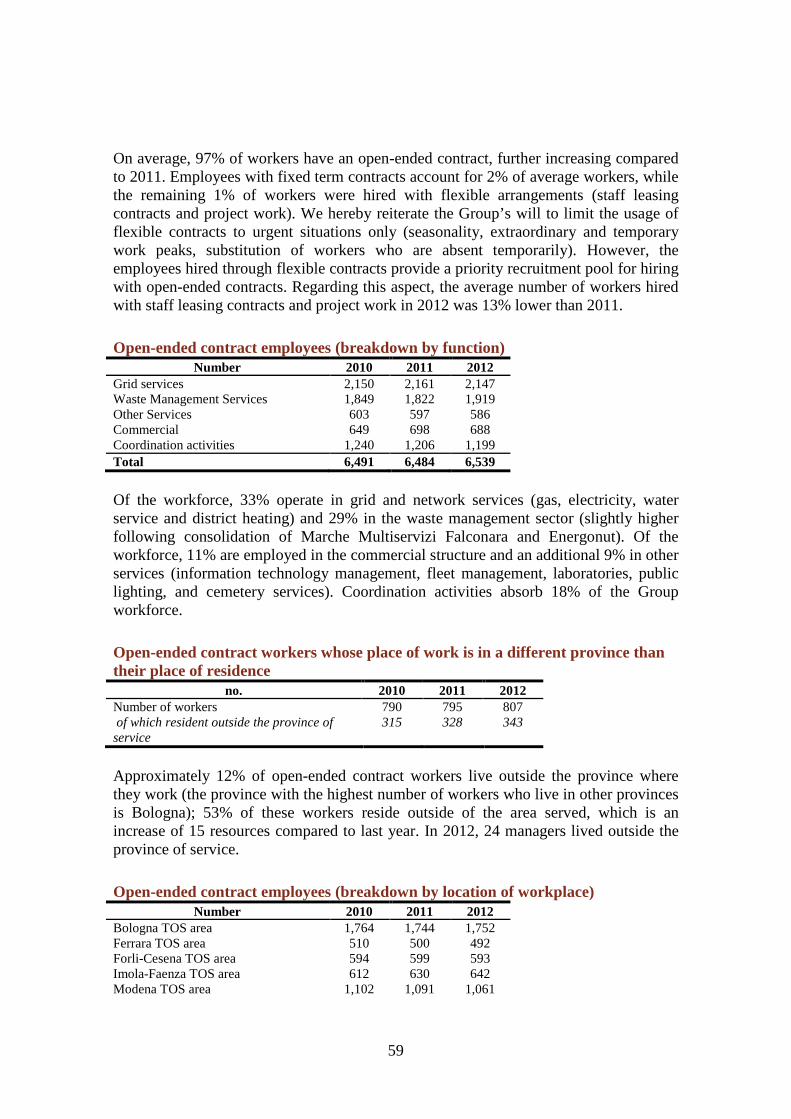
59
On average, 97% of workers have an open-ended contract, further increasing compared to 2011. Employees with fixed term contracts account for 2% of average workers, while the remaining 1% of workers were hired with flexible arrangements (staff leasing contracts and project work). We hereby reiterate the Group’s will to limit the usage of flexible contracts to urgent situations only (seasonality, extraordinary and temporary work peaks, substitution of workers who are absent temporarily). However, the employees hired through flexible contracts provide a priority recruitment pool for hiring with open-ended contracts. Regarding this aspect, the average number of workers hired with staff leasing contracts and project work in 2012 was 13% lower than 2011.
Open-ended contract employees (breakdown by function) Number 2010 2011 2012
Grid services 2,150 2,161 2,147 Waste Management Services 1,849 1,822 1,919 Other Services 603 597 586 Commercial 649 698 688 Coordination activities 1,240 1,206 1,199 Total 6,491 6,484 6,539
Of the workforce, 33% operate in grid and network services (gas, electricity, water service and district heating) and 29% in the waste management sector (slightly higher following consolidation of Marche Multiservizi Falconara and Energonut). Of the workforce, 11% are employed in the commercial structure and an additional 9% in other services (information technology management, fleet management, laboratories, public lighting, and cemetery services). Coordination activities absorb 18% of the Group workforce.
Open-ended contract workers whose place of work is in a different province than their place of residence
no. 2010 2011 2012 Number of workers 790 795 807 of which resident outside the province of service
315 328 343
Approximately 12% of open-ended contract workers live outside the province where they work (the province with the highest number of workers who live in other provinces is Bologna); 53% of these workers reside outside of the area served, which is an increase of 15 resources compared to last year. In 2012, 24 managers lived outside the province of service.
Open-ended contract employees (breakdown by location of workplace) Number 2010 2011 2012
Bologna TOS area 1,764 1,744 1,752 Ferrara TOS area 510 500 492 Forli-Cesena TOS area 594 599 593 Imola-Faenza TOS area 612 630 642 Modena TOS area 1,102 1,091 1,061
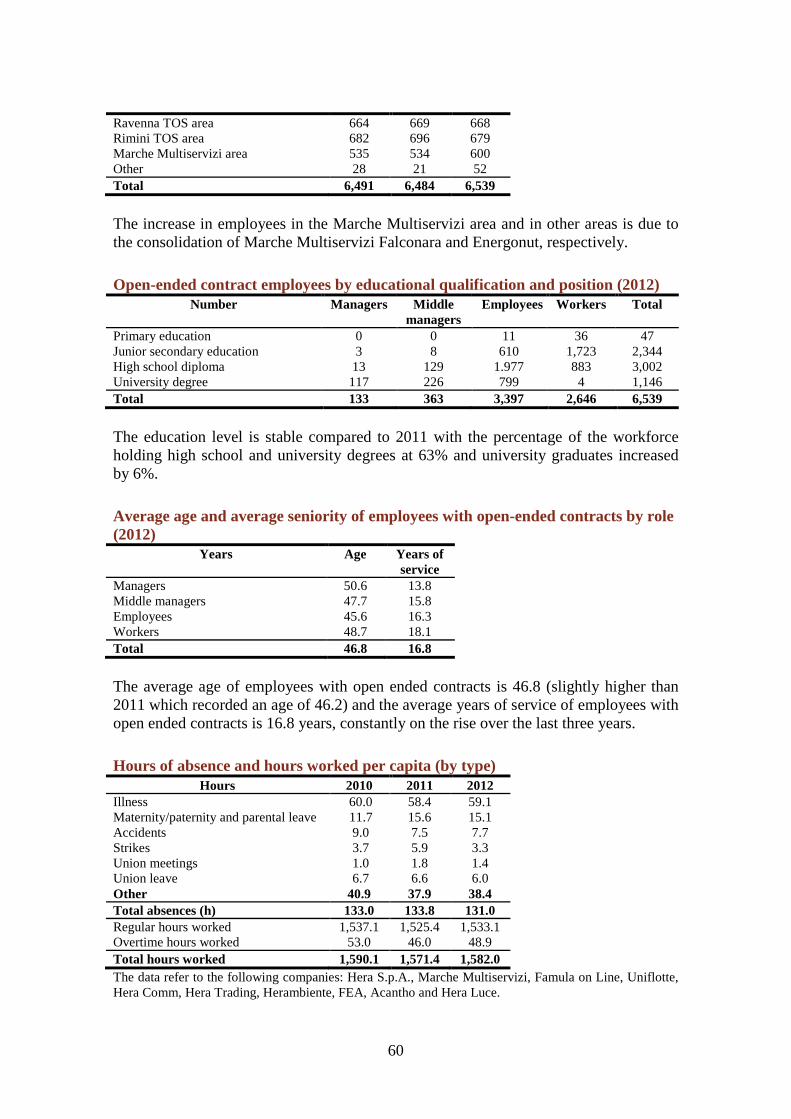
60
The increase in employees in the Marche Multiservizi area and in other areas is due to the consolidation of Marche Multiservizi Falconara and Energonut, respectively.
Open-ended contract employees by educational qualification and position (2012) Number Managers Middle
managers Employees Workers Total
Primary education 0 0 11 36 47 Junior secondary education 3 8 610 1,723 2,344 High school diploma 13 129 1.977 883 3,002 University degree 117 226 799 4 1,146 Total 133 363 3,397 2,646 6,539
The education level is stable compared to 2011 with the percentage of the workforce holding high school and university degrees at 63% and university graduates increased by 6%.
Average age and average seniority of employees with open-ended contracts by role (2012)
Years Age Years of service
Managers 50.6 13.8 Middle managers 47.7 15.8 Employees 45.6 16.3 Workers 48.7 18.1 Total 46.8 16.8
The average age of employees with open ended contracts is 46.8 (slightly higher than 2011 which recorded an age of 46.2) and the average years of service of employees with open ended contracts is 16.8 years, constantly on the rise over the last three years.
Hours of absence and hours worked per capita (by type) Hours 2010 2011 2012
Illness 60.0 58.4 59.1 Maternity/paternity and parental leave 11.7 15.6 15.1 Accidents 9.0 7.5 7.7 Strikes 3.7 5.9 3.3 Union meetings 1.0 1.8 1.4 Union leave 6.7 6.6 6.0 Other 40.9 37.9 38.4 Total absences (h) 133.0 133.8 131.0 Regular hours worked 1,537.1 1,525.4 1,533.1 Overtime hours worked 53.0 46.0 48.9 Total hours worked 1,590.1 1,571.4 1,582.0 The data refer to the following companies: Hera S.p.A., Marche Multiservizi, Famula on Line, Uniflotte, Hera Comm, Hera Trading, Herambiente, FEA, Acantho and Hera Luce.
Ravenna TOS area 664 669 668 Rimini TOS area 682 696 679 Marche Multiservizi area 535 534 600 Other 28 21 52 Total 6,491 6,484 6,539
61
With regard to the hours of absence per capita, there has been a 2% decrease compared to 2011. Overtime hours continue to represent a reduced percentage compared to the total hours worked (average number of hours per capita: 4 hours/month) although slightly increasing over the past year. The decrease compared to 2007 is around 40%. The hours of absence due to accidents are stable and well below (-44%) 2007 figures. The “Other” item in the table mainly refers to leave requested to assist family members with disabilities or illness, leave for medical check-ups, therapy and treatment, and leave for academic purposes. Overtime in certain operational units due to the heavy snow in February 2012 influenced this slight increase. New indicators have been developed as part of the SA8000 project which analyse the amount of overtime work in the various units and specifically for each employee: the aim is to monitor compliance with contractual regulations and with the weekly and monthly caps as precisely as possible, and to effectively apply the overall objectives to improve working conditions.
Hera confirmed one of the “Top Employer” companies Hera received the Top Employers award from the CRF Institute (the “Top Employers HR Best Practices Survey”) once again in 2012. The survey awards companies with the highest qualitative standards for human resources. This is the third year in a row for the Group, which is ranked among the top Italian companies with excellence levels in HR management and strategies for attracting, motivating and creating loyalty in talents. Together with the “excellent” rating, Hera also received the “Special Award” for “company culture”: the values upon which Hera founds its action, i.e. transparency, coherence, training and development, as well as the strong commitment to social responsibility were recognised.
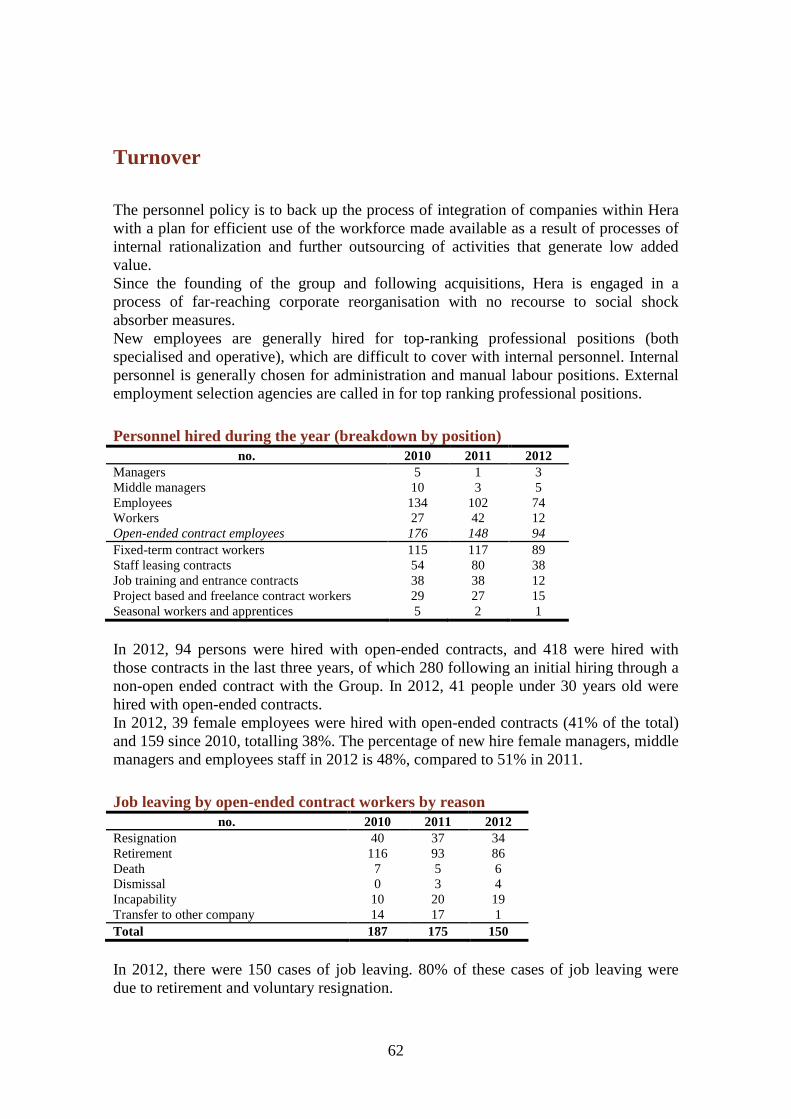
62
Turnover
The personnel policy is to back up the process of integration of companies within Hera with a plan for efficient use of the workforce made available as a result of processes of internal rationalization and further outsourcing of activities that generate low added value. Since the founding of the group and following acquisitions, Hera is engaged in a process of far-reaching corporate reorganisation with no recourse to social shock absorber measures. New employees are generally hired for top-ranking professional positions (both specialised and operative), which are difficult to cover with internal personnel. Internal personnel is generally chosen for administration and manual labour positions. External employment selection agencies are called in for top ranking professional positions.
Personnel hired during the year (breakdown by position) no. 2010 2011 2012
Managers 5 1 3 Middle managers 10 3 5 Employees 134 102 74 Workers 27 42 12 Open-ended contract employees 176 148 94 Fixed-term contract workers 115 117 89 Staff leasing contracts 54 80 38 Job training and entrance contracts 38 38 12 Project based and freelance contract workers 29 27 15 Seasonal workers and apprentices 5 2 1
In 2012, 94 persons were hired with open-ended contracts, and 418 were hired with those contracts in the last three years, of which 280 following an initial hiring through a non-open ended contract with the Group. In 2012, 41 people under 30 years old were hired with open-ended contracts. In 2012, 39 female employees were hired with open-ended contracts (41% of the total) and 159 since 2010, totalling 38%. The percentage of new hire female managers, middle managers and employees staff in 2012 is 48%, compared to 51% in 2011.
Job leaving by open-ended contract workers by reason no. 2010 2011 2012
Resignation 40 37 34 Retirement 116 93 86 Death 7 5 6 Dismissal 0 3 4 Incapability 10 20 19 Transfer to other company 14 17 1 Total 187 175 150
In 2012, there were 150 cases of job leaving. 80% of these cases of job leaving were due to retirement and voluntary resignation.
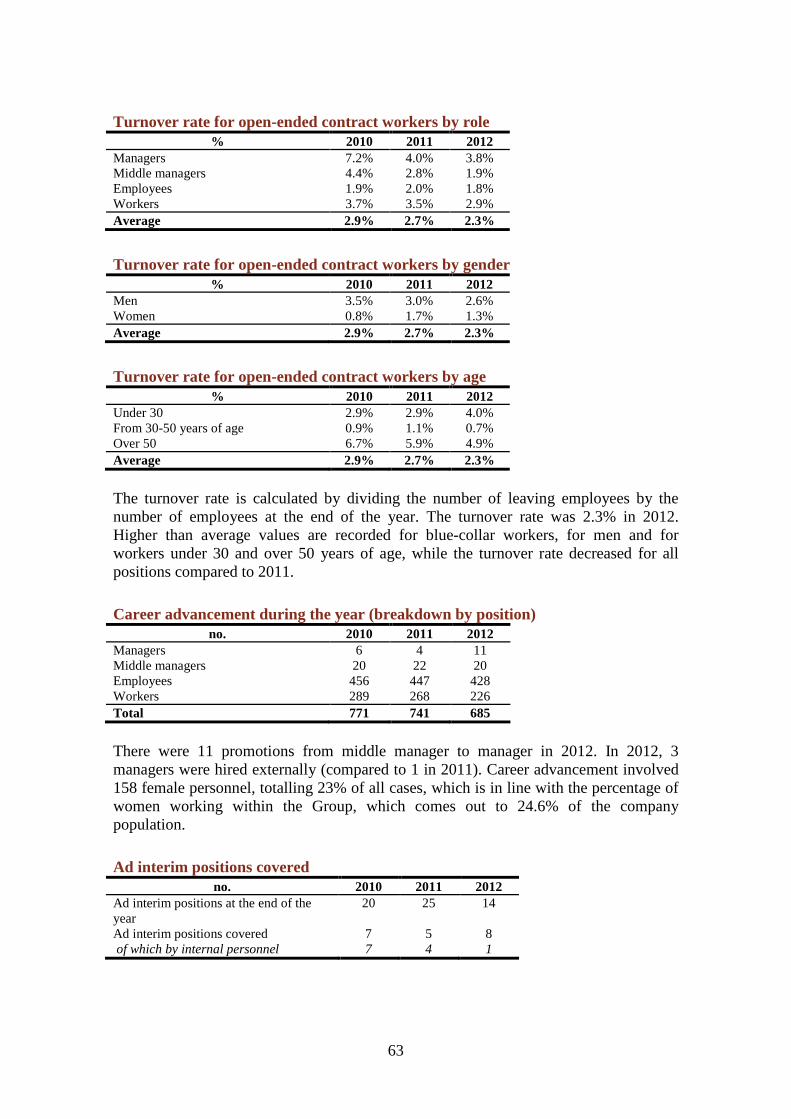
63
Turnover rate for open-ended contract workers by role % 2010 2011 2012
Managers 7.2% 4.0% 3.8% Middle managers 4.4% 2.8% 1.9% Employees 1.9% 2.0% 1.8% Workers 3.7% 3.5% 2.9% Average 2.9% 2.7% 2.3%
Turnover rate for open-ended contract workers by gender % 2010 2011 2012
Men 3.5% 3.0% 2.6% Women 0.8% 1.7% 1.3% Average 2.9% 2.7% 2.3%
Turnover rate for open-ended contract workers by age % 2010 2011 2012
Under 30 2.9% 2.9% 4.0% From 30-50 years of age 0.9% 1.1% 0.7% Over 50 6.7% 5.9% 4.9% Average 2.9% 2.7% 2.3%
The turnover rate is calculated by dividing the number of leaving employees by the number of employees at the end of the year. The turnover rate was 2.3% in 2012. Higher than average values are recorded for blue-collar workers, for men and for workers under 30 and over 50 years of age, while the turnover rate decreased for all positions compared to 2011.
Career advancement during the year (breakdown by position) no. 2010 2011 2012
Managers 6 4 11 Middle managers 20 22 20 Employees 456 447 428 Workers 289 268 226 Total 771 741 685
There were 11 promotions from middle manager to manager in 2012. In 2012, 3 managers were hired externally (compared to 1 in 2011). Career advancement involved 158 female personnel, totalling 23% of all cases, which is in line with the percentage of women working within the Group, which comes out to 24.6% of the company population.
Ad interim positions covered no. 2010 2011 2012
Ad interim positions at the end of the year
20 25 14
Ad interim positions covered 7 5 8 of which by internal personnel 7 4 1
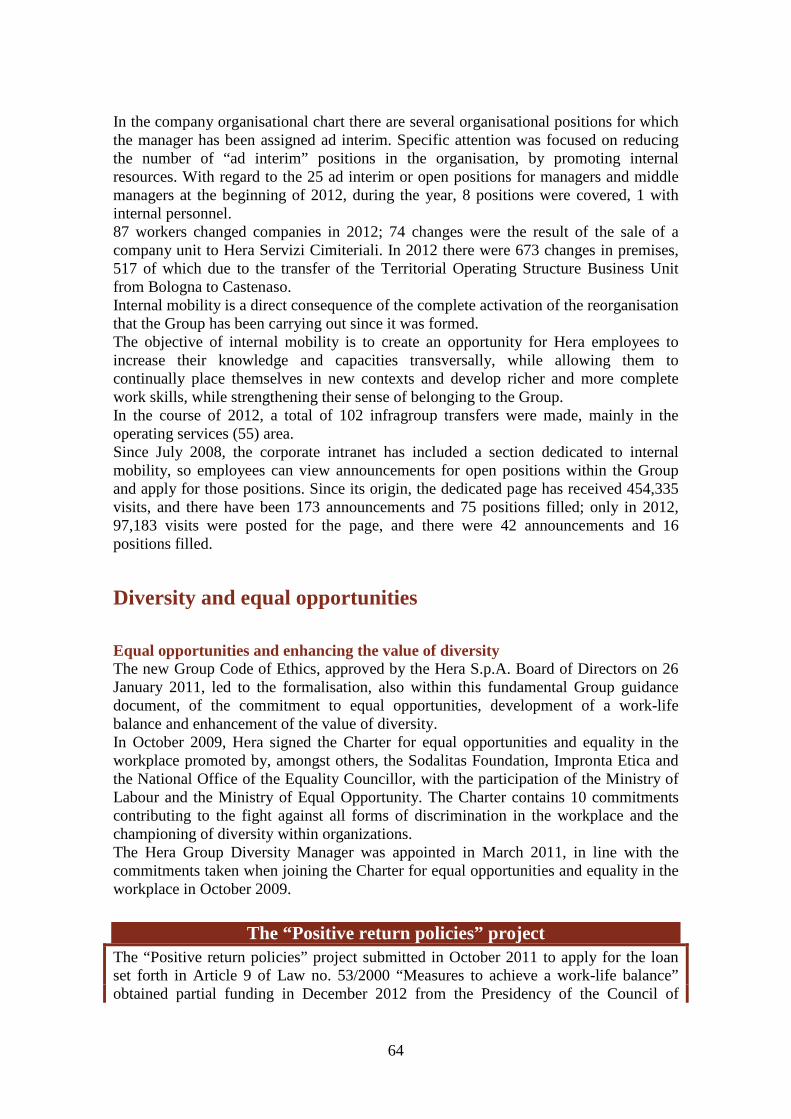
64
In the company organisational chart there are several organisational positions for which the manager has been assigned ad interim. Specific attention was focused on reducing the number of “ad interim” positions in the organisation, by promoting internal resources. With regard to the 25 ad interim or open positions for managers and middle managers at the beginning of 2012, during the year, 8 positions were covered, 1 with internal personnel. 87 workers changed companies in 2012; 74 changes were the result of the sale of a company unit to Hera Servizi Cimiteriali. In 2012 there were 673 changes in premises, 517 of which due to the transfer of the Territorial Operating Structure Business Unit from Bologna to Castenaso. Internal mobility is a direct consequence of the complete activation of the reorganisation that the Group has been carrying out since it was formed. The objective of internal mobility is to create an opportunity for Hera employees to increase their knowledge and capacities transversally, while allowing them to continually place themselves in new contexts and develop richer and more complete work skills, while strengthening their sense of belonging to the Group. In the course of 2012, a total of 102 infragroup transfers were made, mainly in the operating services (55) area. Since July 2008, the corporate intranet has included a section dedicated to internal mobility, so employees can view announcements for open positions within the Group and apply for those positions. Since its origin, the dedicated page has received 454,335 visits, and there have been 173 announcements and 75 positions filled; only in 2012, 97,183 visits were posted for the page, and there were 42 announcements and 16 positions filled.
Diversity and equal opportunities
Equal opportunities and enhancing the value of diversity The new Group Code of Ethics, approved by the Hera S.p.A. Board of Directors on 26 January 2011, led to the formalisation, also within this fundamental Group guidance document, of the commitment to equal opportunities, development of a work-life balance and enhancement of the value of diversity. In October 2009, Hera signed the Charter for equal opportunities and equality in the workplace promoted by, amongst others, the Sodalitas Foundation, Impronta Etica and the National Office of the Equality Councillor, with the participation of the Ministry of Labour and the Ministry of Equal Opportunity. The Charter contains 10 commitments contributing to the fight against all forms of discrimination in the workplace and the championing of diversity within organizations. The Hera Group Diversity Manager was appointed in March 2011, in line with the commitments taken when joining the Charter for equal opportunities and equality in the workplace in October 2009.
The “Positive return policies” project The “Positive return policies” project submitted in October 2011 to apply for the loan set forth in Article 9 of Law no. 53/2000 “Measures to achieve a work-life balance” obtained partial funding in December 2012 from the Presidency of the Council of

65
Ministers amounting to Euro 257 thousand. The funding was granted as a result of the innovative and socially significant measures proposed. The goal of the project is to develop actions to achieve a work-life balance and supporting mechanisms for those who take maternity and parental leave, or leave under Law no. 104/1992. These actions and instruments include specific training initiatives, agreements with private crèches and awareness raising actions aimed at changing the company’s culture with respect to work-life balance. The interventions will be set up starting from 2013. The project was defined by controlling the needs of employees through two focus groups, one for mothers and fathers and another for beneficiaries of Law 104, and through questionnaires to all employees of the areas which do not have company crèches.
The main initiatives carried out in the last two years include:
• publication of the second edition of the “Mamma&Papà al lavoro” (“Mummy & Daddy at work”) booklet to better inform employees of their rights and the company’s human resource management policies on maternity and parental leave; • publication of the “Disability and work” booklet, to inform differently-abled workers and the persons who look after and assist differently-abled relatives of their rights; • opening of new company and intercompany crèches: after Cesena, Imola and Ravenna, the Bologna and Rimini crèches were opened in 2011 and 2012, respectively; • awareness raising and training aimed at optimising differences and diversity, especially within the “Developing resources” project. In collaboration with the ASPHI Foundation, an e-learning training course open to all workers was set up to study disability issues in depth; • the spread of a culture and of good practices regarding effective time and meeting management, also by planning training courses that will be implemented in 2013.
“Disability and work” booklet The “Disability and work” booklet, which focuses on informing differently-abled workers and the persons who look after and assist differently-abled relatives of their rights, was published in 2012. The booklet provides complete and summary information about benefits, such as leaves established by law, and is part of the actions developed by the Group to promote the knowledge of instruments for achieving work-life balance (including the “Mamma&Papà al Lavoro” booklet) and to implement interventions that focus on and enhance of the value of diversity. The booklet is available on the Corporate Intranet and is provided to each new hire. This booklet was also created jointly with the Group’s union organisation.

66
Female staff (breakdown by position) % 2010 2011 2012
Managers 14.4% 16.0% 17.3% Middle managers 29.8% 28.9% 28.9% Total managers and middle managers 25.7% 25.5% 25.8% Management employees 33.1% 33.7% 32.9% Total managers, middle managers and management employees
30.5% 31.0% 30.6%
Non-management employees 41.2% 42.1% 42.8% Total employees 39.1% 39.6% 39.9% Workers 4.7% 4.7% 4.7% Total 23.7% 24.3% 24.6%
Female staff levels among open-ended contract workers reached 24.6% in 2012, a slight and continuous increase in the three-year period considered. Female personnel levels among managerial and executive positions come to 25.8%, rising by 8% in executive positions. Considering all contractual qualifications that provide for a managerial role (managers, middle managers and management employees), women comprise approximately 31%.
Personnel by age group % 2010 2011 2012
Under 30 2.1% 2.1% 2.6% From 30 to 50 64.1% 65.7% 61.3% Over 50 33.8% 32.2% 36.1% Total 100.0% 100.0% 100.0
There are over 2,000 open-ended contract employees over 50 years of age (an increase of 13.1% compared to 2011 due to the entry of Marche Multiservizi Falconara in the Marche Multiservizi Group). Hera is among the first companies in Italy to have set up its own research project focused on enhancing generational differences: “GenerActions”. The project was developed in cooperation with the University of Bologna and its main goal was to promote inter-generational dialogue by studying the opinions of workers with respect to different age groups. The research results identified four priority intervention areas for which an action plan has been defined which will be implemented starting from 2013: inter-generational dialogue, development opportunities, work-life balance and monitoring of the level of attention towards generational differences.
Part-time contracts no. 2010 2011 2012
Men 30 30 30 Women 187 206 217 Total 217 236 247
Part-time arrangements, as regulated by current labour agreements, are considered a valid instrument in providing a response to labour flexibility needs both in terms of organisational and employee needs.
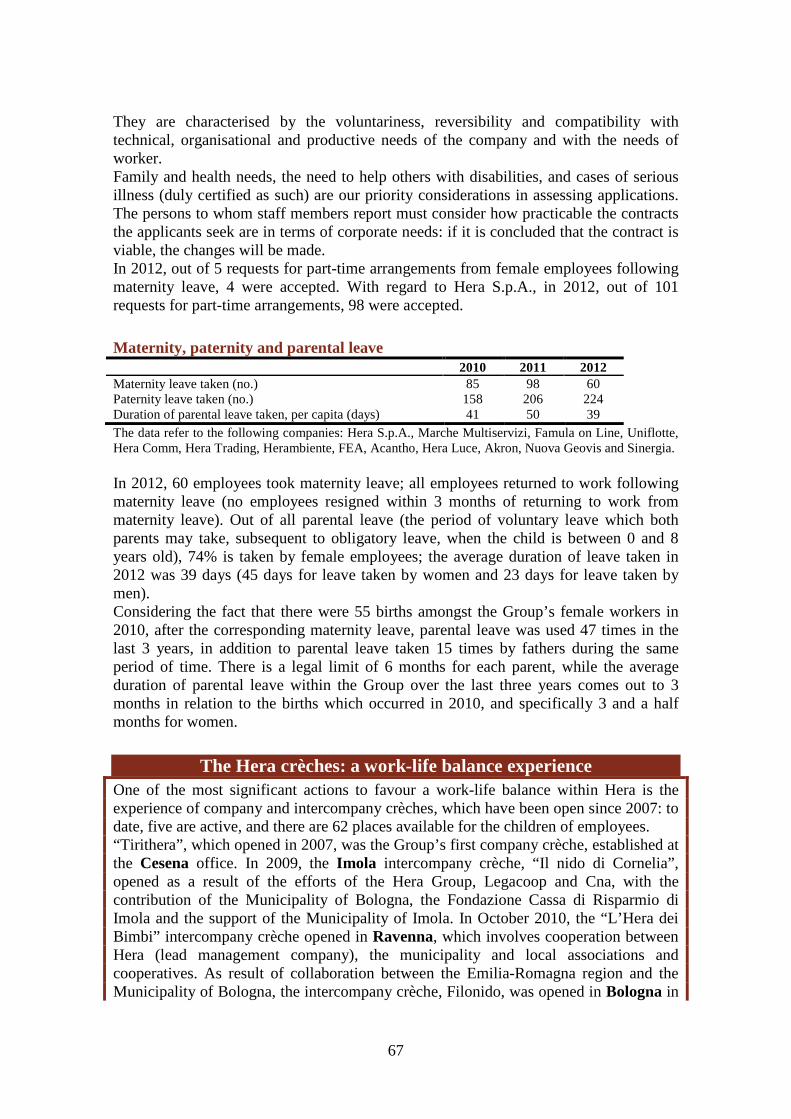
67
They are characterised by the voluntariness, reversibility and compatibility with technical, organisational and productive needs of the company and with the needs of worker. Family and health needs, the need to help others with disabilities, and cases of serious illness (duly certified as such) are our priority considerations in assessing applications. The persons to whom staff members report must consider how practicable the contracts the applicants seek are in terms of corporate needs: if it is concluded that the contract is viable, the changes will be made. In 2012, out of 5 requests for part-time arrangements from female employees following maternity leave, 4 were accepted. With regard to Hera S.p.A., in 2012, out of 101 requests for part-time arrangements, 98 were accepted.
Maternity, paternity and parental leave 2010 2011 2012
Maternity leave taken (no.) 85 98 60 Paternity leave taken (no.) 158 206 224 Duration of parental leave taken, per capita (days) 41 50 39 The data refer to the following companies: Hera S.p.A., Marche Multiservizi, Famula on Line, Uniflotte, Hera Comm, Hera Trading, Herambiente, FEA, Acantho, Hera Luce, Akron, Nuova Geovis and Sinergia. In 2012, 60 employees took maternity leave; all employees returned to work following maternity leave (no employees resigned within 3 months of returning to work from maternity leave). Out of all parental leave (the period of voluntary leave which both parents may take, subsequent to obligatory leave, when the child is between 0 and 8 years old), 74% is taken by female employees; the average duration of leave taken in 2012 was 39 days (45 days for leave taken by women and 23 days for leave taken by men). Considering the fact that there were 55 births amongst the Group’s female workers in 2010, after the corresponding maternity leave, parental leave was used 47 times in the last 3 years, in addition to parental leave taken 15 times by fathers during the same period of time. There is a legal limit of 6 months for each parent, while the average duration of parental leave within the Group over the last three years comes out to 3 months in relation to the births which occurred in 2010, and specifically 3 and a half months for women.
The Hera crèches: a work-life balance experience One of the most significant actions to favour a work-life balance within Hera is the experience of company and intercompany crèches, which have been open since 2007: to date, five are active, and there are 62 places available for the children of employees. “Tirithera”, which opened in 2007, was the Group’s first company crèche, established at the Cesena office. In 2009, the Imola intercompany crèche, “Il nido di Cornelia”, opened as a result of the efforts of the Hera Group, Legacoop and Cna, with the contribution of the Municipality of Bologna, the Fondazione Cassa di Risparmio di Imola and the support of the Municipality of Imola. In October 2010, the “L’Hera dei Bimbi” intercompany crèche opened in Ravenna, which involves cooperation between Hera (lead management company), the municipality and local associations and cooperatives. As result of collaboration between the Emilia-Romagna region and the Municipality of Bologna, the intercompany crèche, Filonido, was opened in Bologna in

68
September 2011. Lastly, in 2012, Hera signed an agreement with ASP Valloni which runs the new intercompany crèche in Rimini , opened in December 2012 inside a facility of the Local Health Authority. During the 2012/2013 school year, 31 children of employees attended the Group’s company and intercompany crèches.
Persons belonging to quotas set forth by Law no. 68/1999 no. 2010 2011 2012
Persons belonging to quotas set forth by Law no. 68/1999
347 340 340
The data refer to the following companies: Hera S.p.A., Marche Multiservizi, Famula on Line, Uniflotte, Hera Comm, Hera Trading, Hera Luce, Herambiente, Akron, FEA, Medea, Nuova Geovis, Sinergia and Acantho. In all provinces in which it operates, Hera complies with the obligations of Law no. 68/1999, which requires that personnel belonging to protected recruitment categories be hired in the proportion set forth in that law. Fulfilling those obligations involves the use of the regional compensations and agreements, the objective of which is to gradually fulfil employment obligations. This law promotes the recruitment and integration within the sphere of work of certain classes of persons (the differently-abled, orphans etc.), and also provides that the worker’s recruitment process is carried out by way of solutions agreed between the company, the Regional Employment Office and the worker. At the end of 2012, there were 340 persons belonging to the categories set forth in Law no. 68/1999 working in Group companies: 294 were classified within Article 1 of the law (disabled). Overall there are: 140 workers, 197 employees and 3 managers/middle managers. In 2012, a total of 20 resources were hired or already employed and recognised as classified within Law no. 68/1999, against the same number of terminations.
Developing resources: 2012 action plan To employ the competences and potential of differently-abled persons working in the company, analyse their satisfaction, improve their work and, if necessary, implement work requalification, increasing productivity: this is why “Developing Resources” was developed starting in 2008 with the support of the ASPHI Foundation which promotes the integration of differently-abled persons in schools, the workplace and society. Among the key actions carried out in 2012: • ten individual projects were initiated (specific training, job changes, IT
implementation and innovation of support instruments), and were carried out and monitored with the specific procedures described in 2010;
• an e-learning training initiative was carried out aimed at raising awareness of disability in workers. Optional access by workers was tested (resulting in almost 100 accesses) and the initiative was promoted with an accessible online cartoon, i.e. that may be used by people with visual impairment;
• a training initiative was carried out in November 2012 on the management of disabilities and diversity for twenty managers and management employees involved in a project focused on spreading the organisational culture and improving manager/associate relationships.
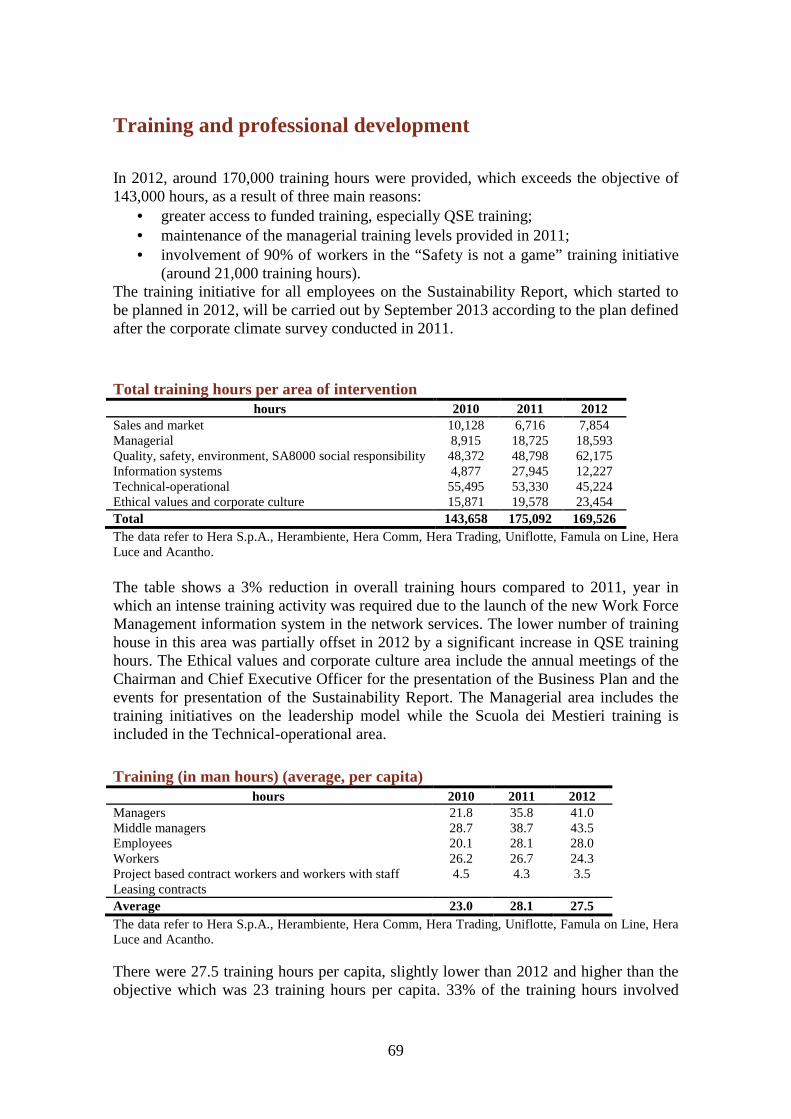
69
Training and professional development
In 2012, around 170,000 training hours were provided, which exceeds the objective of 143,000 hours, as a result of three main reasons:
• greater access to funded training, especially QSE training; • maintenance of the managerial training levels provided in 2011; • involvement of 90% of workers in the “Safety is not a game” training initiative
(around 21,000 training hours). The training initiative for all employees on the Sustainability Report, which started to be planned in 2012, will be carried out by September 2013 according to the plan defined after the corporate climate survey conducted in 2011.
Total training hours per area of intervention hours 2010 2011 2012
Sales and market 10,128 6,716 7,854 Managerial 8,915 18,725 18,593 Quality, safety, environment, SA8000 social responsibility 48,372 48,798 62,175 Information systems 4,877 27,945 12,227 Technical-operational 55,495 53,330 45,224 Ethical values and corporate culture 15,871 19,578 23,454 Total 143,658 175,092 169,526 The data refer to Hera S.p.A., Herambiente, Hera Comm, Hera Trading, Uniflotte, Famula on Line, Hera Luce and Acantho. The table shows a 3% reduction in overall training hours compared to 2011, year in which an intense training activity was required due to the launch of the new Work Force Management information system in the network services. The lower number of training house in this area was partially offset in 2012 by a significant increase in QSE training hours. The Ethical values and corporate culture area include the annual meetings of the Chairman and Chief Executive Officer for the presentation of the Business Plan and the events for presentation of the Sustainability Report. The Managerial area includes the training initiatives on the leadership model while the Scuola dei Mestieri training is included in the Technical-operational area.
Training (in man hours) (average, per capita) hours 2010 2011 2012
Managers 21.8 35.8 41.0 Middle managers 28.7 38.7 43.5 Employees 20.1 28.1 28.0 Workers 26.2 26.7 24.3 Project based contract workers and workers with staff Leasing contracts
4.5 4.3 3.5
Average 23.0 28.1 27.5 The data refer to Hera S.p.A., Herambiente, Hera Comm, Hera Trading, Uniflotte, Famula on Line, Hera Luce and Acantho. There were 27.5 training hours per capita, slightly lower than 2012 and higher than the objective which was 23 training hours per capita. 33% of the training hours involved
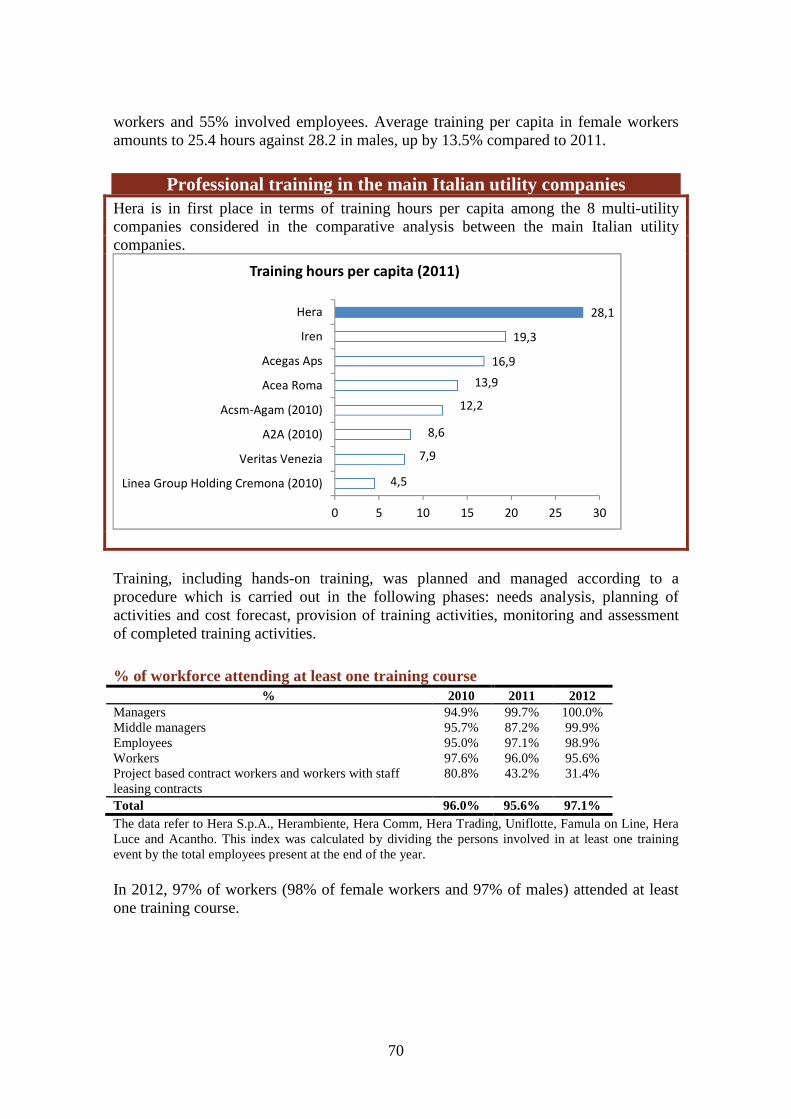
70
workers and 55% involved employees. Average training per capita in female workers amounts to 25.4 hours against 28.2 in males, up by 13.5% compared to 2011.
Professional training in the main Italian utility companies Hera is in first place in terms of training hours per capita among the 8 multi-utility companies considered in the comparative analysis between the main Italian utility companies.
Training, including hands-on training, was planned and managed according to a procedure which is carried out in the following phases: needs analysis, planning of activities and cost forecast, provision of training activities, monitoring and assessment of completed training activities.
% of workforce attending at least one training course % 2010 2011 2012
Managers 94.9% 99.7% 100.0% Middle managers 95.7% 87.2% 99.9% Employees 95.0% 97.1% 98.9% Workers 97.6% 96.0% 95.6% Project based contract workers and workers with staff leasing contracts
80.8% 43.2% 31.4%
Total 96.0% 95.6% 97.1% The data refer to Hera S.p.A., Herambiente, Hera Comm, Hera Trading, Uniflotte, Famula on Line, Hera Luce and Acantho. This index was calculated by dividing the persons involved in at least one training event by the total employees present at the end of the year. In 2012, 97% of workers (98% of female workers and 97% of males) attended at least one training course.
4,5
7,9
8,6
12,2
13,9
16,9
19,3
28,1
0 5 10 15 20 25 30
Linea Group Holding Cremona (2010)
Veritas Venezia
A2A (2010)
Acsm-Agam (2010)
Acea Roma
Acegas Aps
Iren
Hera
Training hours per capita (2011)
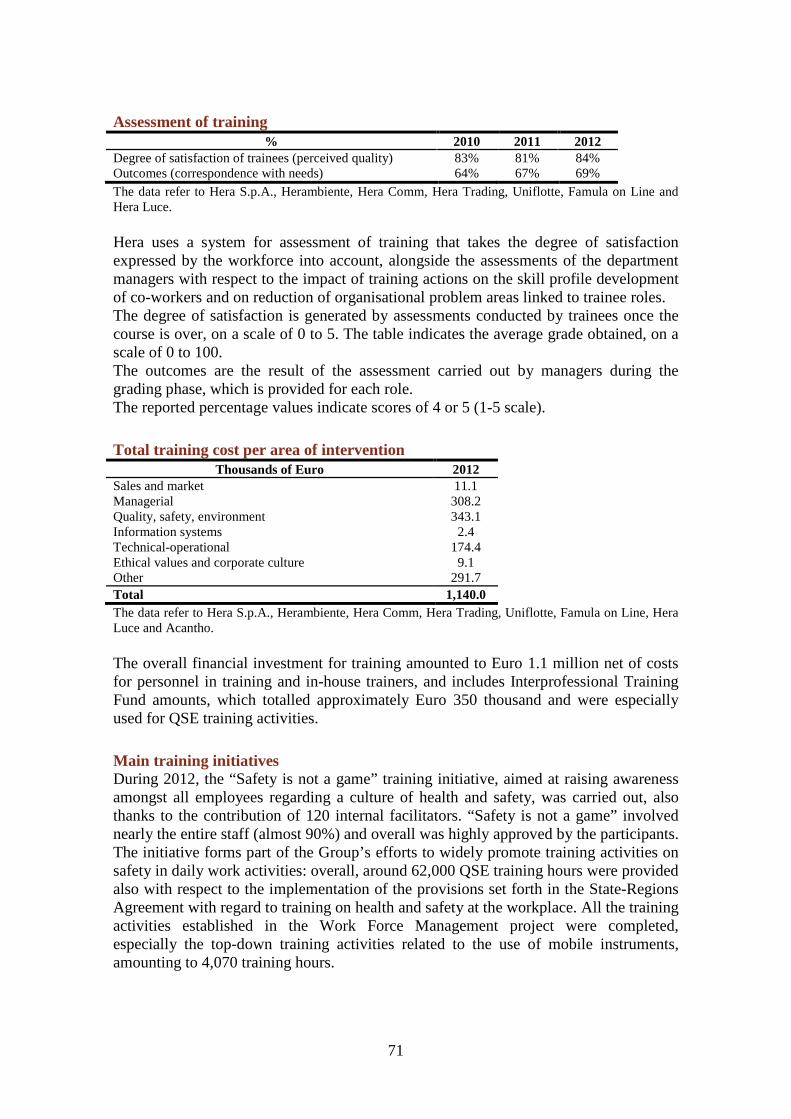
71
Assessment of training % 2010 2011 2012
Degree of satisfaction of trainees (perceived quality) 83% 81% 84% Outcomes (correspondence with needs) 64% 67% 69% The data refer to Hera S.p.A., Herambiente, Hera Comm, Hera Trading, Uniflotte, Famula on Line and Hera Luce. Hera uses a system for assessment of training that takes the degree of satisfaction expressed by the workforce into account, alongside the assessments of the department managers with respect to the impact of training actions on the skill profile development of co-workers and on reduction of organisational problem areas linked to trainee roles. The degree of satisfaction is generated by assessments conducted by trainees once the course is over, on a scale of 0 to 5. The table indicates the average grade obtained, on a scale of 0 to 100. The outcomes are the result of the assessment carried out by managers during the grading phase, which is provided for each role. The reported percentage values indicate scores of 4 or 5 (1-5 scale).
Total training cost per area of intervention Thousands of Euro 2012
Sales and market 11.1 Managerial 308.2 Quality, safety, environment 343.1 Information systems 2.4 Technical-operational 174.4 Ethical values and corporate culture 9.1 Other 291.7 Total 1,140.0 The data refer to Hera S.p.A., Herambiente, Hera Comm, Hera Trading, Uniflotte, Famula on Line, Hera Luce and Acantho. The overall financial investment for training amounted to Euro 1.1 million net of costs for personnel in training and in-house trainers, and includes Interprofessional Training Fund amounts, which totalled approximately Euro 350 thousand and were especially used for QSE training activities.
Main training initiatives During 2012, the “Safety is not a game” training initiative, aimed at raising awareness amongst all employees regarding a culture of health and safety, was carried out, also thanks to the contribution of 120 internal facilitators. “Safety is not a game” involved nearly the entire staff (almost 90%) and overall was highly approved by the participants. The initiative forms part of the Group’s efforts to widely promote training activities on safety in daily work activities: overall, around 62,000 QSE training hours were provided also with respect to the implementation of the provisions set forth in the State-Regions Agreement with regard to training on health and safety at the workplace. All the training activities established in the Work Force Management project were completed, especially the top-down training activities related to the use of mobile instruments, amounting to 4,070 training hours.
72
Work Force Management: IT serving network and plant management Work Force Management, the Group’s new information system designed to improve all operating activities, on networks and plants (gas, water, electricity and district heating) was launched in 2011. The project continued in 2012 with: • the initiation of the mobile function, which was applied to Emergency Support
services, involving dispatching activities to operating teams, technical final reporting and feedback on the progress of activities in the field through portable devices used by the teams, connected in real time with the coordination centres;
• the creation of an integrated environment for reporting the main technical, management and economic information.
The function will be applicable in all local areas.
Managerial training interventions are reported, such as the high-level training course on “Regulation and the Market for Public Utility Services” and “Development of Managerial Skills” (2,592 hours) in cooperation with the University of Bologna and the Alma Graduate School, as well as 60 training initiatives (totalling around 100 sessions) through funded training, 5,866 training hours regarding first aid and a total of 4,791 hours on fire prevention.
HerAcademy: the strengthening of Hera Group’s Corporate University
The initiatives of HerAcademy, the Group’s Corporate University founded in 2011 with the aim to enhance experience and develop the skills of its workforce by promoting cooperation and the exchange of knowledge, continued during 2012. Specifically, the first workshop was held with the participation of internal and external guests entitled “Government and governance of public utility services” and a second workshop was planned entitled “Utilities, levels of governance, citizens: what are the possibilities of collaboration for the development of infrastructures?”. Furthermore, a university orientation initiative took place at the Faculty of Law of the University of Bologna for the children of Group employees approaching university enrolment and saw the participation of guests from the university field and some Group Directors.
The Scuola dei Mestieri and its progress The Scuola dei Mestieri which has now reached its eighth year is a project for efficient use of the technical and operational skills that are present within the Hera Group. The aim is to raise the level of awareness of professional conduct and of skill transfer potential from operator to operator. There are 14 notebooks printed and published for the Scuola dei Mestieri: in 2012 the fourteenth notebook called “Managing learning in the central control room” was published, while during 2013 those already published will be updated and a new notebook will be published. Developing the organisational performances and strengthening the company sense of belonging are among the objectives that led us to further develop the Scuola dei Mestieri model, guiding its evolution in the Apprenticeship Communities (groups aimed at producing and sharing action procedures and practical knowledge). In 2012, development work related to customer management continued in all regional areas also

73
by using forums and the wiki environment; the preparatory analysis and design activities for the development of a Personnel and Organisation Apprenticeship Community were also completed and will be further finalised during 2013.
Courses focusing on the development of potential Initiatives focused on enhancing and developing the potential of young employees of the Group were set up during 2012. With reference to the second edition of the project, launched in 2011, all the participants (94 resources) received personal feedback on the assessment results and were involved in specific training and development initiatives designed to provide self-development tools and to present the contents of the Groups’ Leadership Model. Furthermore, the courses dedicated to the resources from the 2008 edition and the relative monitoring continued; the first intercorporate experience-based courses were held in December 2012, which will continue during 2013. Overall, 90 women and 104 men participated in the project’s two editions.
The Leadership Model The Leadership model describes the key elements necessary to best interpret Hera’s mission and values, and the skills which Hera managers should have and develop (with the aim to contribute to attaining the corporate objectives), which are related to four key elements: management of complex situations, orientation to excellence, focus on service and exemplary leadership. After carrying out the articulated plan of initiatives in 2011 aimed at managers and middle managers, during 2012, the first batch of seminars was completed regarding the model’s key elements, to provide points for reflection, also through the testimonials of important external speakers. The fourth seminar on exemplary leadership was held in October which saw the participation of Andrea Pontremoli, the Chief Executive Officer of Dallara Automobili. Overall 1,569 training hours on the Leadership Model were carried out in 2012. During the course of the year, the 2012/2013 activity plan, focusing on the key element “Management of complex situations”, was set up and implemented. The first classroom sessions were planned and held, aimed at examining the two skills upon which the key element is founded: decision-making and flexibility. An email communication campaign was launched in July, on a quarterly basis, dedicated to the key element at issue. The aim was to provide points for reflection and reading tips to develop a library and allow personal in-depth study. Regarding new appointments or assignments consistent with the Model’s targeted population, training sessions were held on the knowledge and in-depth study of the Model and on the development of skills related to co-worker and team management.
Agreements with Universities The Hera Group has set up several framework agreements over the past years with leading universities in the Emilia-Romagna region (the University of Bologna, the University of Modena and Reggio Emilia, and the University of Ferrara), which include the assignment of six-monthly scholarships for final year students and for recent graduates.
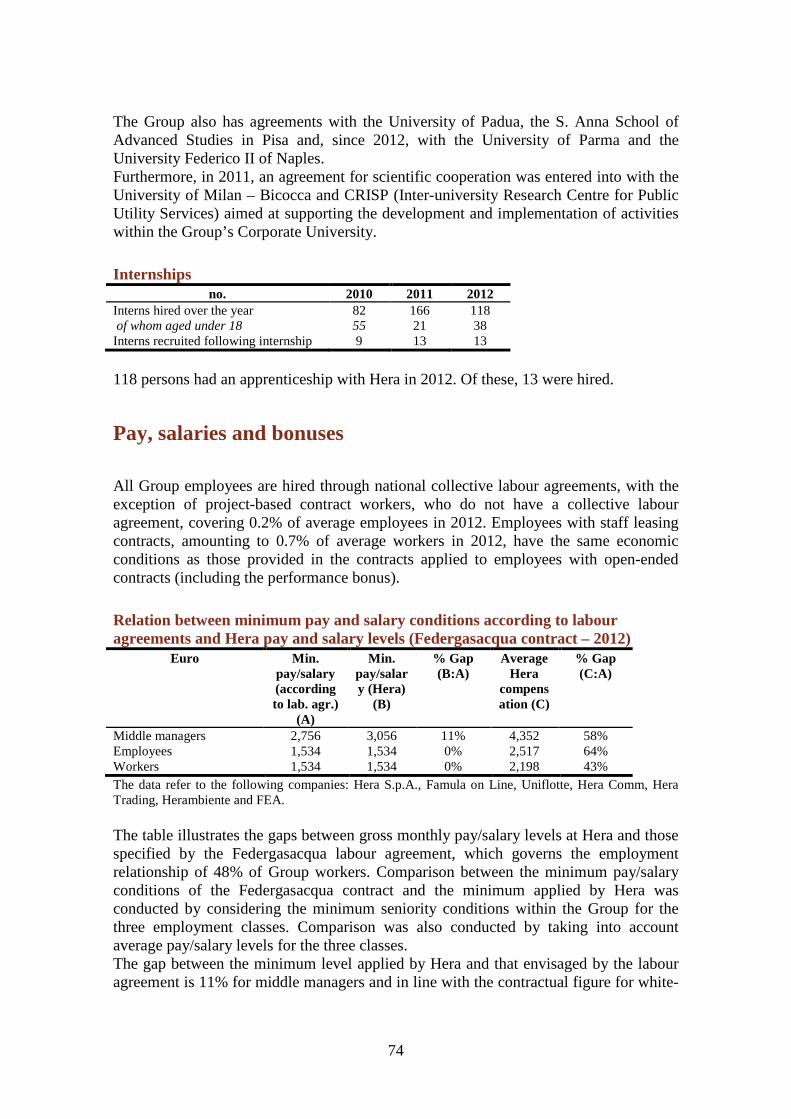
74
The Group also has agreements with the University of Padua, the S. Anna School of Advanced Studies in Pisa and, since 2012, with the University of Parma and the University Federico II of Naples. Furthermore, in 2011, an agreement for scientific cooperation was entered into with the University of Milan – Bicocca and CRISP (Inter-university Research Centre for Public Utility Services) aimed at supporting the development and implementation of activities within the Group’s Corporate University.
Internships no. 2010 2011 2012
Interns hired over the year 82 166 118 of whom aged under 18 55 21 38 Interns recruited following internship 9 13 13
118 persons had an apprenticeship with Hera in 2012. Of these, 13 were hired.
Pay, salaries and bonuses
All Group employees are hired through national collective labour agreements, with the exception of project-based contract workers, who do not have a collective labour agreement, covering 0.2% of average employees in 2012. Employees with staff leasing contracts, amounting to 0.7% of average workers in 2012, have the same economic conditions as those provided in the contracts applied to employees with open-ended contracts (including the performance bonus).
Relation between minimum pay and salary conditions according to labour agreements and Hera pay and salary levels (Federgasacqua contract – 2012)
Euro Min. pay/salary (according to lab. agr.)
(A)
Min. pay/salary (Hera)
(B)
% Gap (B:A)
Average Hera
compensation (C)
% Gap (C:A)
Middle managers 2,756 3,056 11% 4,352 58% Employees 1,534 1,534 0% 2,517 64% Workers 1,534 1,534 0% 2,198 43% The data refer to the following companies: Hera S.p.A., Famula on Line, Uniflotte, Hera Comm, Hera Trading, Herambiente and FEA. The table illustrates the gaps between gross monthly pay/salary levels at Hera and those specified by the Federgasacqua labour agreement, which governs the employment relationship of 48% of Group workers. Comparison between the minimum pay/salary conditions of the Federgasacqua contract and the minimum applied by Hera was conducted by considering the minimum seniority conditions within the Group for the three employment classes. Comparison was also conducted by taking into account average pay/salary levels for the three classes. The gap between the minimum level applied by Hera and that envisaged by the labour agreement is 11% for middle managers and in line with the contractual figure for white-

75
collar and blue-collar workers. The average salary, on the other hand, is 58% higher than the minimum labour agreement conditions for middle managers, 64% higher for white-collar workers and 43% higher for blue-collar workers.
Relation between senior management compensation according to labour agreements and Hera levels (Confservizi contract)
Euro 2012 Minimum according to labour agr. (A) 4,692 Hera minimum (B) 5,308 % Gap (B:A) 13% Average Hera compensation (C) 9,240 % Gap (C:A) 97% Average market salary for managers 10,375 % difference compared to the market -11% Data do not include Marche Multiservizi. The above table illustrates the gaps between average gross compensation levels and the gross compensation levels envisaged by the national collective labour agreement for the senior management class. For this class, the contract to which reference is made is that of the local public services providers’ association, Confservizi. The average salary of Hera managers is 97% higher than the minimum salary stipulated in the contract, while the minimum salary is 13% higher than the Confservizi contract. The average salary of Hera managers is 11% lower than the average market salaries for managers, as reported in the Hay Compensation Report – Total Cash Italia 2012.
Average salaries by gender (2012) Euro Men Women
Managers 9,534 7,854 Middle managers 4,358 4,342 Employees 2,588 2,430 Workers 2,199 1,804
The salary gap between men and women within the management class is significant (approximately Euro 1,700): this figure is influenced by the fact that there are fewer female directors than male (5 out of 41). The average salary of middle managers is essentially homogeneous, while the salary gap between men and women is due to the fact that 67% of management employees are male. The salary gap between male and female blue-collar workers is related to the different level of skills and tasks carried out.
Gross performance bonus (per capita) Euro 2010 2011 2012
Middle managers 1,534 1,541 1,567 Employees 1,318 1,325 1,357 Workers 1,221 1,228 1,251 Weighted average 1,289 1,297 1,325 The data refer to the following companies: Hera S.p.A., Famula on Line, Uniflotte, Hera Comm, Hera Trading, Herambiente and FEA.

76
In line with the Group Supplementary Collective Labour Agreement stipulated on 24 March 2010, the 2012 performance bonus for managers, employees and workers is based on profitability, productivity and sustainability indicators. The profitability and productivity indices consist of the Group’s gross operating margin and the per capita gross operating margin of the companies belonging to the Group and the territorial operating structures. The main sustainability indices for 2012 (which have an impact of up to 20%) include: reduction in the number of claims, percentage of separate waste collection, commercial quality standards defined by AEEG, compliance with the standards defined in the water service charter, indices of accident frequency, severity and rate, near-accident indices, water supply activation times, percentage of the water network subject to active research for losses, business and residential customer satisfaction index, and average arrival time after emergency calls. The 24 March 2010 agreement identified the amount of the performance bonus in 2010-2012, as well as the portions which are assigned to personnel as consolidated productivity during the three years, and are subtracted from the overall bonus amount.
Other incentive systems Starting from 2006, the incentive system of the Hera Group has been linked to the balanced scorecard system. According to this system, the variable component of individual compensation for managers and middle managers is calculated as a percentage value of gross annual salaries and is defined at the end of the year on the basis of results obtained relative to the objectives set at the start of the year. The balanced individual scorecard is structured in three parts:
• the first consists of specific project-objectives deriving from translation in operating terms of the objectives contained in the Group’s strategic map; • the second contains the economic objectives defined in the budget for the year; • the third involves an assessment on the behaviours set forth in the Group leadership model.
The structure of the balanced individual scorecard, or the weights assigned to the three areas, vary according to the seniority of the employee and the department. The final assignment of the bonus is weighted according to the results reached insofar as certain Group parameters: financial-economic results and customer satisfaction index for residential customers. The assignment of the objectives to employees and the assessment of their achievement take place through a clearly defined process which is based on the decision of the top management for the individual balanced scorecards of the directors and managers and of the directors for the individual balanced scorecards of the managers. The activity takes place with the coordination of the Balanced Scorecard System Management function within the Corporate Social Responsibility Department and personnel departments. Approximately 49% of the variable remuneration of Hera Group managers is linked to the completion of the projects planned in the balanced scorecard system (the remaining 51% is linked to respect of budget objectives and compliance with the behaviours set forth in the leadership model). A total of 445 managers and middle managers received a bonus linked to the balanced scorecard in 2012. This is added to 110 employees who received an incentive bonus in the forms provided by the merit-based policies of the Group in 2012.
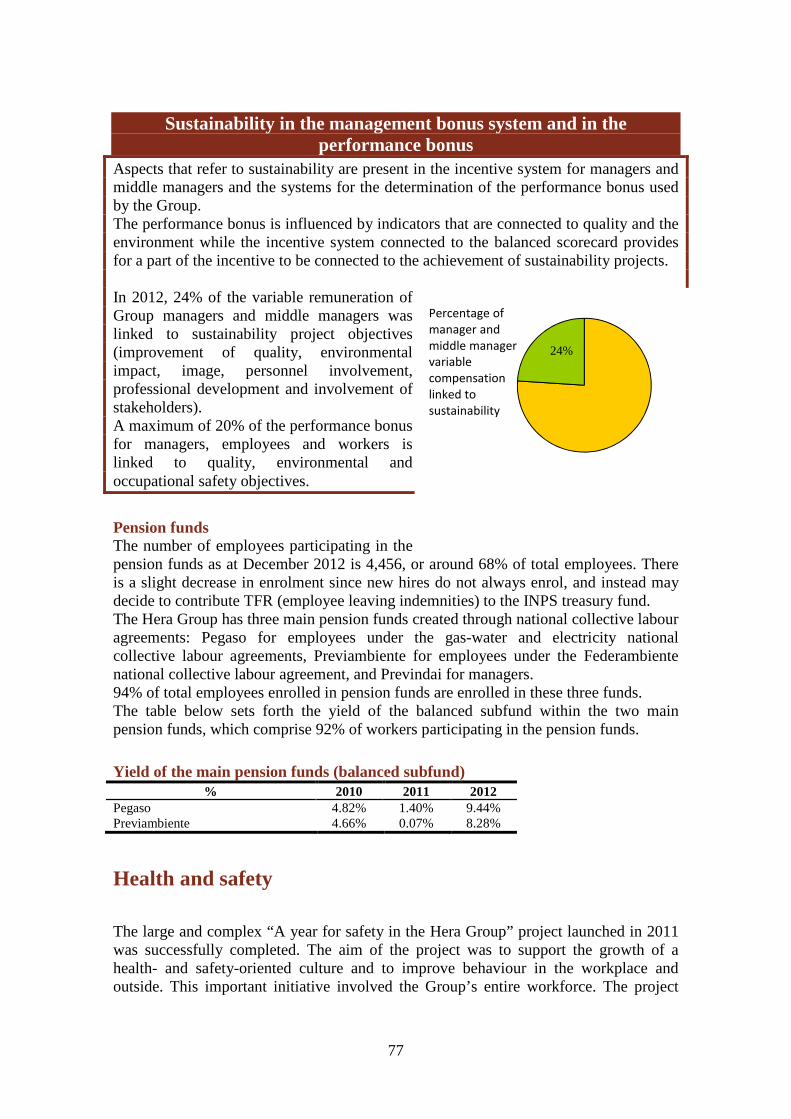
77
Sustainability in the management bonus system and in the performance bonus
Aspects that refer to sustainability are present in the incentive system for managers and middle managers and the systems for the determination of the performance bonus used by the Group. The performance bonus is influenced by indicators that are connected to quality and the environment while the incentive system connected to the balanced scorecard provides for a part of the incentive to be connected to the achievement of sustainability projects. In 2012, 24% of the variable remuneration of Group managers and middle managers was linked to sustainability project objectives (improvement of quality, environmental impact, image, personnel involvement, professional development and involvement of stakeholders). A maximum of 20% of the performance bonus for managers, employees and workers is linked to quality, environmental and occupational safety objectives.
Pension funds The number of employees participating in the pension funds as at December 2012 is 4,456, or around 68% of total employees. There is a slight decrease in enrolment since new hires do not always enrol, and instead may decide to contribute TFR (employee leaving indemnities) to the INPS treasury fund. The Hera Group has three main pension funds created through national collective labour agreements: Pegaso for employees under the gas-water and electricity national collective labour agreements, Previambiente for employees under the Federambiente national collective labour agreement, and Previndai for managers. 94% of total employees enrolled in pension funds are enrolled in these three funds. The table below sets forth the yield of the balanced subfund within the two main pension funds, which comprise 92% of workers participating in the pension funds.
Yield of the main pension funds (balanced subfund) % 2010 2011 2012
Pegaso 4.82% 1.40% 9.44% Previambiente 4.66% 0.07% 8.28%
Health and safety
The large and complex “A year for safety in the Hera Group” project launched in 2011 was successfully completed. The aim of the project was to support the growth of a health- and safety-oriented culture and to improve behaviour in the workplace and outside. This important initiative involved the Group’s entire workforce. The project
24%
Percentage of
manager and
middle manager
variable
compensation
linked to
sustainability

78
was managed by a Guidance committee made up of top management and was monitored by a Coordination Group which reported progress to the Guidance committee. This group also included a Scientific Committee made up of three external labour, health and safety specialists from various disciplines (legal, economic and psychosocial).
Premio Imprese per la Sicurezza: Hera wins the 2012 Prize The closing ceremony of the Sviluppo Imprese in Sicurezza project, called “La sicurezza conviene sempre” (“Safety always pays”), held in Rome on 24 April 2012, saw the awarding of the Premio Imprese per la Sicurezza, the initiative of Confindustria and INAIL (National Institute for Insurance against Accidents at Work), implemented with the technical support of APQI (Italian Quality Awards Association) e Accredia (Italian Accreditation Body), in which 260 national companies participated. Hera was ranked among the five best companies participating in the initiative and won the 2012 Prize. The prize was awarded at the end of a careful evaluation process carried out by a Scientific and Technical Committee composed of expert evaluators which examined all the participating companies in order to assess the organisations’ pro-active approach towards health and safety at the workplace and their commitment to innovation.
“A year for safety in the Hera Group” comprised 16 projects, some of which were applied throughout the Group and therefore managed centrally. Others, instead, were assigned and carried out by the individual area structures. In 2011, 7 projects had been successfully completed and the same number of projects were completed in 2012. The remaining 2 projects will be completed in 2013. Among the projects developed and completed in 2012, the “Safety is not a game” project is worthy of note. The project involved all the areas and the Group’s entire workforce. The top-down training activities aimed at involving and raising awareness in employees on safety, with the support of an animated software application, and also thanks to the important contribution of 120 Group employees as facilitators-trainers. The projects that achieved the expected results were presented during a convention held at the Fiera Ambiente Lavoro on 11 October 2012. This event gave the Group the opportunity to explain the most important activities carried out during the year, also thanks to the intervention of health and safety experts and of members of the project’s scientific committee. Some projects were assessed in order to replicate them in other areas and so transfer the success stories to other structures of the Group. Among these, replication of the scientific study on work-related stress will be started during the first months of 2013, specifically, the subjective phase will be carried out by submitting a questionnaire involving the Central Bodies of Hera S.p.A. with the support of teaching staff from the University of Bologna. Furthermore, as part of the Area Topic Tables initiative, the memorandum of understanding with the Regional Command of the Fire Brigade will be extended. Parallel with the development of project-related activities, a set of process and result indicators has been prepared and will be included within the 2012 Balanced Scorecard system.

79
A year for safety: project progress Safety is not a game
This training initiative employs team games and involves the entire company population, increasing awareness of safety at all levels and stimulating new workers to adopt specific behaviours in all aspects of life, in and outside the workplace.
As at 31 December 2012, 90% of the company population had been trained, amounting to around 5,195 workers and 20,780 training hours. Further sessions have been planned for the first quarter of 2013 (classroom or e-learning lessons) for resources still to be trained (around 300 equal to 5% of the company population). Regarding the level of knowledge/satisfaction, the average evaluation in the satisfaction questionnaire was 4.1 (on a scale from 1 to 5). The project is complete.
Scientific study to define the economic model This research aims to assess safety management impacts by comparing the various organisational and management models adopted by companies to prevent occupational health and safety risks with consequences on efficiency and competitiveness.
The data needed to quantify the costs associated with accidents in the Emilia and Romagna areas were obtained and analysed in 2011. The project was completed in 2012 with the identification and quantification of the economic impacts of health and safety organisation and management. The main results are briefly reported below: • the significant amount of costs associated with the unsafe condition was
acquired and the average daily cost of the accident was estimated (direct and indirect costs);
• the “seriousness of the accidents” factor was identified (rather than the frequency) as priority factor in economic impact terms;
• the costs associated with unsafe conditions gradually decreased as the organisation’s commitment to prevention gradually increased. The ROP (Return on Prevention) value was estimated, i.e. the summary economic performance index of the prevention activities.
The project is complete.
National waste management service guidelines Contribution from the Hera Group in defining guidelines within a project launched by the Rubes Triva Foundation in partnership with INAIL to define guidelines for creating a Workers’ Health and Safety Management System for the waste management services and territorial companies.
The project was completed successfully. The National Guidelines were published in November 2012 by INAIL-Federambiente and officially presented during Ecomondo, the international exhibition for the recovery of waste and energy and sustainable development, held from 7 to 10 November. The project is complete.
Alcoholism regulation Preparation of a document implementing the directives of the framework law and any implementing regulations related to alcohol and alcohol-related issues. The completed document will be formalised as a Corporate Regulation on alcohol, and its goal is to ensure implementing procedures, with controls carried out during the workday during which the worker must have a blood alcohol level of zero.
The corporate regulation on alcohol was issued with service order no. 90 of 28 September 2011. During 2012, 1,659 blood alcohol levels were tested in Group workers falling within the categories provided for in Annex I of Decision of 16 March 2006 published in Official Gazette no. 75 of 30 March 2006. The project is complete.
Increase in the quality of supplier monitoring This initiative intends to supplement the supplier control system, also on aspects relative to health and safety. The project’s objective is for a protocol to be drawn up which helps to locate data relative to accidents for a group of suppliers representing 75% of the value of goods and services purchased. The work group is also required to identify performance indices regarding health and safety to be included as criteria for the periodic supplier assessment.
1,600 suppliers of services and work were involved. 740 suppliers replied, representing 60% of the value of services and work supplied in 2012. All the supplier control checklists were reviewed, emphasising the importance of the company contact person during the monitoring process. A specific training activity was carried out involving around 700 workers dealing with contract management for a total of 40 courses each lasting 4 hours. The project is complete.
Hera S.p.A. integrated certification Execution of an integrated process which controls the company’s performance (Central bodies and TOS-BU) in relation to 3 internationally recognised quality, environmental, and occupational health and safety management standards.
Hera S.p.A. obtained the integrated certification according to ISO 9001, ISO 14001 and OHSAS 18001 standards (September 2011) with excellent overall system results. The project is complete.
Herambiente OHSAS 18001 Process to assess the occupational health and safety management and control system in order to obtain the OHSAS 18001 certification for Herambiente.
Herambiente obtained the OHSAS 18001 certification. The controls carried out by Det Norske Veritas Italia, the certifying body, were completed on 21 December 2011. The project is complete.
Uniflotte OHSAS 18001 Process to assess the occupational health and safety management and control system in order to obtain the OHSAS 18001 certification for Uniflotte.
Uniflotte obtained the OHSAS 18001 certification. The controls carried out by Det Norske Veritas Italia, the certifying body, were completed on 29 December 2011. The project is complete.
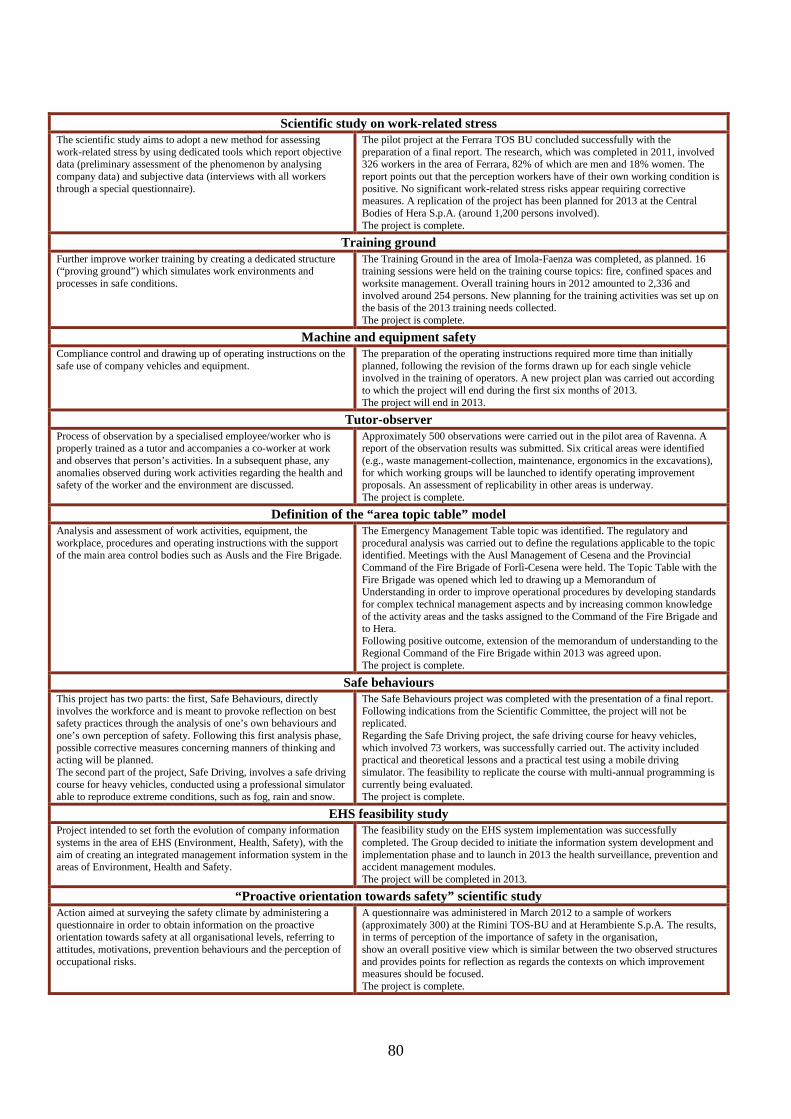
80
Scientific study on work-related stress The scientific study aims to adopt a new method for assessing work-related stress by using dedicated tools which report objective data (preliminary assessment of the phenomenon by analysing company data) and subjective data (interviews with all workers through a special questionnaire).
The pilot project at the Ferrara TOS BU concluded successfully with the preparation of a final report. The research, which was completed in 2011, involved 326 workers in the area of Ferrara, 82% of which are men and 18% women. The report points out that the perception workers have of their own working condition is positive. No significant work-related stress risks appear requiring corrective measures. A replication of the project has been planned for 2013 at the Central Bodies of Hera S.p.A. (around 1,200 persons involved). The project is complete.
Training ground Further improve worker training by creating a dedicated structure (“proving ground”) which simulates work environments and processes in safe conditions.
The Training Ground in the area of Imola-Faenza was completed, as planned. 16 training sessions were held on the training course topics: fire, confined spaces and worksite management. Overall training hours in 2012 amounted to 2,336 and involved around 254 persons. New planning for the training activities was set up on the basis of the 2013 training needs collected. The project is complete.
Machine and equipment safety Compliance control and drawing up of operating instructions on the safe use of company vehicles and equipment.
The preparation of the operating instructions required more time than initially planned, following the revision of the forms drawn up for each single vehicle involved in the training of operators. A new project plan was carried out according to which the project will end during the first six months of 2013. The project will end in 2013.
Tutor-observer Process of observation by a specialised employee/worker who is properly trained as a tutor and accompanies a co-worker at work and observes that person’s activities. In a subsequent phase, any anomalies observed during work activities regarding the health and safety of the worker and the environment are discussed.
Approximately 500 observations were carried out in the pilot area of Ravenna. A report of the observation results was submitted. Six critical areas were identified (e.g., waste management-collection, maintenance, ergonomics in the excavations), for which working groups will be launched to identify operating improvement proposals. An assessment of replicability in other areas is underway. The project is complete.
Definition of the “area topic table” model Analysis and assessment of work activities, equipment, the workplace, procedures and operating instructions with the support of the main area control bodies such as Ausls and the Fire Brigade.
The Emergency Management Table topic was identified. The regulatory and procedural analysis was carried out to define the regulations applicable to the topic identified. Meetings with the Ausl Management of Cesena and the Provincial Command of the Fire Brigade of Forlì-Cesena were held. The Topic Table with the Fire Brigade was opened which led to drawing up a Memorandum of Understanding in order to improve operational procedures by developing standards for complex technical management aspects and by increasing common knowledge of the activity areas and the tasks assigned to the Command of the Fire Brigade and to Hera. Following positive outcome, extension of the memorandum of understanding to the Regional Command of the Fire Brigade within 2013 was agreed upon. The project is complete.
Safe behaviours This project has two parts: the first, Safe Behaviours, directly involves the workforce and is meant to provoke reflection on best safety practices through the analysis of one’s own behaviours and one’s own perception of safety. Following this first analysis phase, possible corrective measures concerning manners of thinking and acting will be planned. The second part of the project, Safe Driving, involves a safe driving course for heavy vehicles, conducted using a professional simulator able to reproduce extreme conditions, such as fog, rain and snow.
The Safe Behaviours project was completed with the presentation of a final report. Following indications from the Scientific Committee, the project will not be replicated. Regarding the Safe Driving project, the safe driving course for heavy vehicles, which involved 73 workers, was successfully carried out. The activity included practical and theoretical lessons and a practical test using a mobile driving simulator. The feasibility to replicate the course with multi-annual programming is currently being evaluated. The project is complete.
EHS feasibility study Project intended to set forth the evolution of company information systems in the area of EHS (Environment, Health, Safety), with the aim of creating an integrated management information system in the areas of Environment, Health and Safety.
The feasibility study on the EHS system implementation was successfully completed. The Group decided to initiate the information system development and implementation phase and to launch in 2013 the health surveillance, prevention and accident management modules. The project will be completed in 2013.
“Proactive orientation towards safety” scientific study Action aimed at surveying the safety climate by administering a questionnaire in order to obtain information on the proactive orientation towards safety at all organisational levels, referring to attitudes, motivations, prevention behaviours and the perception of occupational risks.
A questionnaire was administered in March 2012 to a sample of workers (approximately 300) at the Rimini TOS-BU and at Herambiente S.p.A. The results, in terms of perception of the importance of safety in the organisation, show an overall positive view which is similar between the two observed structures and provides points for reflection as regards the contexts on which improvement measures should be focused. The project is complete.
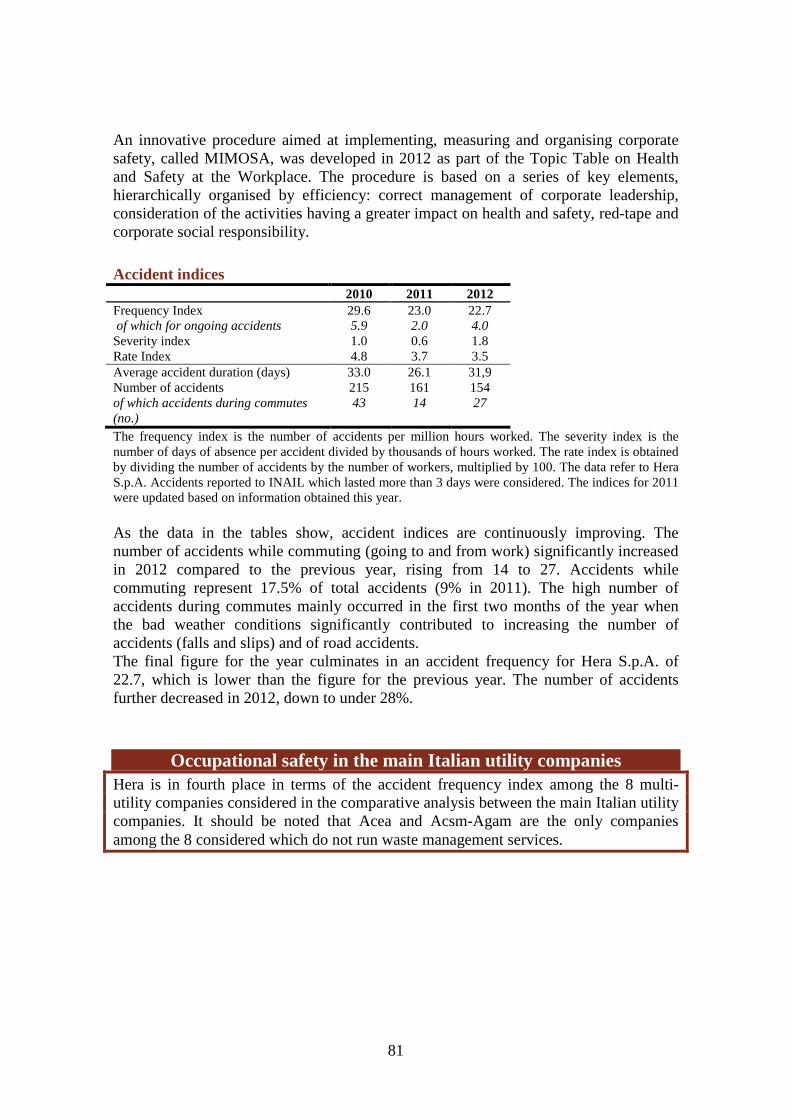
81
An innovative procedure aimed at implementing, measuring and organising corporate safety, called MIMOSA, was developed in 2012 as part of the Topic Table on Health and Safety at the Workplace. The procedure is based on a series of key elements, hierarchically organised by efficiency: correct management of corporate leadership, consideration of the activities having a greater impact on health and safety, red-tape and corporate social responsibility.
Accident indices 2010 2011 2012
Frequency Index 29.6 23.0 22.7 of which for ongoing accidents 5.9 2.0 4.0 Severity index 1.0 0.6 1.8 Rate Index 4.8 3.7 3.5 Average accident duration (days) 33.0 26.1 31,9 Number of accidents 215 161 154 of which accidents during commutes (no.)
43 14 27
The frequency index is the number of accidents per million hours worked. The severity index is the number of days of absence per accident divided by thousands of hours worked. The rate index is obtained by dividing the number of accidents by the number of workers, multiplied by 100. The data refer to Hera S.p.A. Accidents reported to INAIL which lasted more than 3 days were considered. The indices for 2011 were updated based on information obtained this year. As the data in the tables show, accident indices are continuously improving. The number of accidents while commuting (going to and from work) significantly increased in 2012 compared to the previous year, rising from 14 to 27. Accidents while commuting represent 17.5% of total accidents (9% in 2011). The high number of accidents during commutes mainly occurred in the first two months of the year when the bad weather conditions significantly contributed to increasing the number of accidents (falls and slips) and of road accidents. The final figure for the year culminates in an accident frequency for Hera S.p.A. of 22.7, which is lower than the figure for the previous year. The number of accidents further decreased in 2012, down to under 28%.
Occupational safety in the main Italian utility companies Hera is in fourth place in terms of the accident frequency index among the 8 multi-utility companies considered in the comparative analysis between the main Italian utility companies. It should be noted that Acea and Acsm-Agam are the only companies among the 8 considered which do not run waste management services.

82
A mortal accident occurred in Rimini in March 2012 which involved a waste management service operator while driving a company vehicle. In compliance with the provisions of current legislation, 7,500 days of absence are attributed to this mortal accident. As a result, the indicator related to the accident severity index significantly increased during 2012. The investigation phase relative to this occurrence is currently being carried out as of the reporting date. With regard to the mortal accident in 2009 that occurred at the waste-to-energy plant of Forlì, the findings phase has been carried out and the decisions of the Public Prosecutor have yet to be issued as of the reporting date. Accident indices are higher for workers, since they are more at risk of accidents. In 2012, the accident frequency index for blue-collar workers was 44.0. In 2011 it was 41.2. The accident severity index for blue-collar workers was 4.0, and excluding the mortal accident, 1.4 (0.9 in 2011).
Frequency index (breakdown by function) 2011 2012
Grid services 18.9 22.5 Waste management and cemetery services 50.4
41.6
Coordination activities 3.5 6.6 Average 23.0 22.7 The data refer to Hera S.p.A.
48,4
46,7
43,0
33,6
24,5
23,5
23,2
11,8
0 10 20 30 40 50 60 70 80
A2A (2010)
Veritas Venezia
Linea Group Holding Cremona (2010)
Acegas Aps
Hera
Iren
Acea Roma
Acsm-Agam (2010)
Accident Frequency Index (2011)
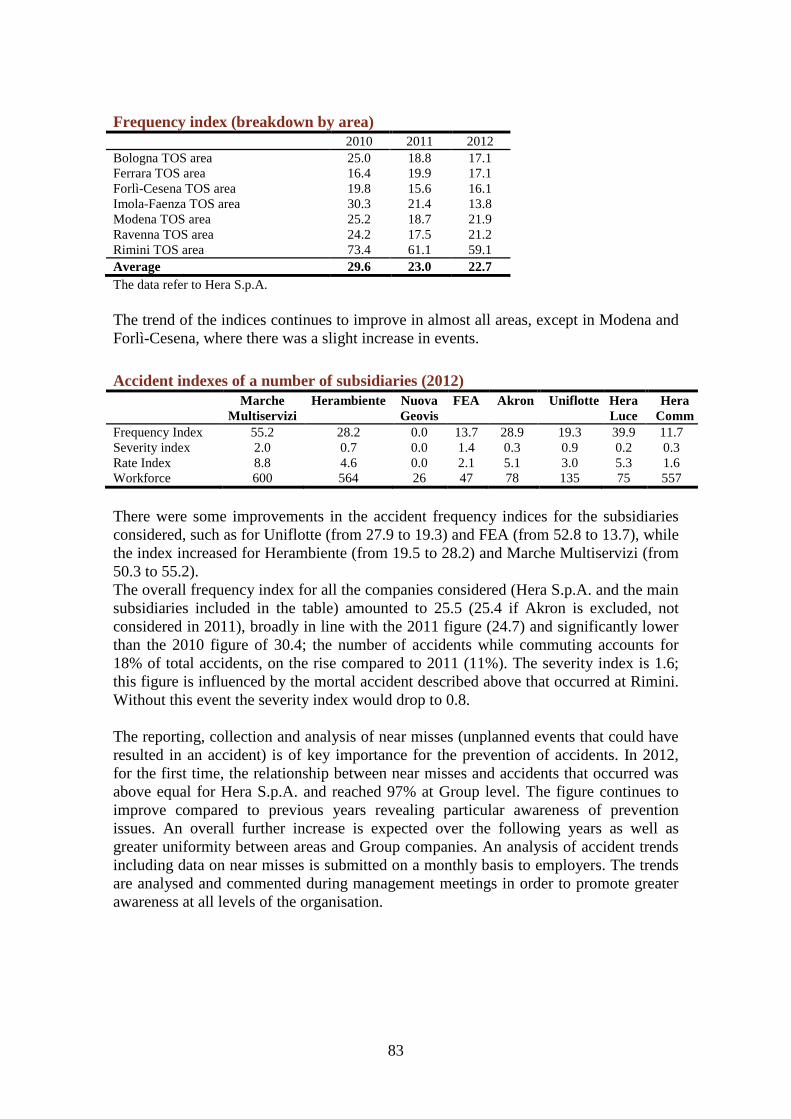
83
Frequency index (breakdown by area) 2010 2011 2012
Bologna TOS area 25.0 18.8 17.1 Ferrara TOS area 16.4 19.9 17.1 Forlì-Cesena TOS area 19.8 15.6 16.1 Imola-Faenza TOS area 30.3 21.4 13.8 Modena TOS area 25.2 18.7 21.9 Ravenna TOS area 24.2 17.5 21.2 Rimini TOS area 73.4 61.1 59.1 Average 29.6 23.0 22.7 The data refer to Hera S.p.A. The trend of the indices continues to improve in almost all areas, except in Modena and Forlì-Cesena, where there was a slight increase in events.
Accident indexes of a number of subsidiaries (2012) Marche
Multiservizi Herambiente Nuova
Geovis FEA Akron Uniflotte Hera
Luce Hera
Comm Frequency Index 55.2 28.2 0.0 13.7 28.9 19.3 39.9 11.7 Severity index 2.0 0.7 0.0 1.4 0.3 0.9 0.2 0.3 Rate Index 8.8 4.6 0.0 2.1 5.1 3.0 5.3 1.6 Workforce 600 564 26 47 78 135 75 557
There were some improvements in the accident frequency indices for the subsidiaries considered, such as for Uniflotte (from 27.9 to 19.3) and FEA (from 52.8 to 13.7), while the index increased for Herambiente (from 19.5 to 28.2) and Marche Multiservizi (from 50.3 to 55.2). The overall frequency index for all the companies considered (Hera S.p.A. and the main subsidiaries included in the table) amounted to 25.5 (25.4 if Akron is excluded, not considered in 2011), broadly in line with the 2011 figure (24.7) and significantly lower than the 2010 figure of 30.4; the number of accidents while commuting accounts for 18% of total accidents, on the rise compared to 2011 (11%). The severity index is 1.6; this figure is influenced by the mortal accident described above that occurred at Rimini. Without this event the severity index would drop to 0.8. The reporting, collection and analysis of near misses (unplanned events that could have resulted in an accident) is of key importance for the prevention of accidents. In 2012, for the first time, the relationship between near misses and accidents that occurred was above equal for Hera S.p.A. and reached 97% at Group level. The figure continues to improve compared to previous years revealing particular awareness of prevention issues. An overall further increase is expected over the following years as well as greater uniformity between areas and Group companies. An analysis of accident trends including data on near misses is submitted on a monthly basis to employers. The trends are analysed and commented during management meetings in order to promote greater awareness at all levels of the organisation.
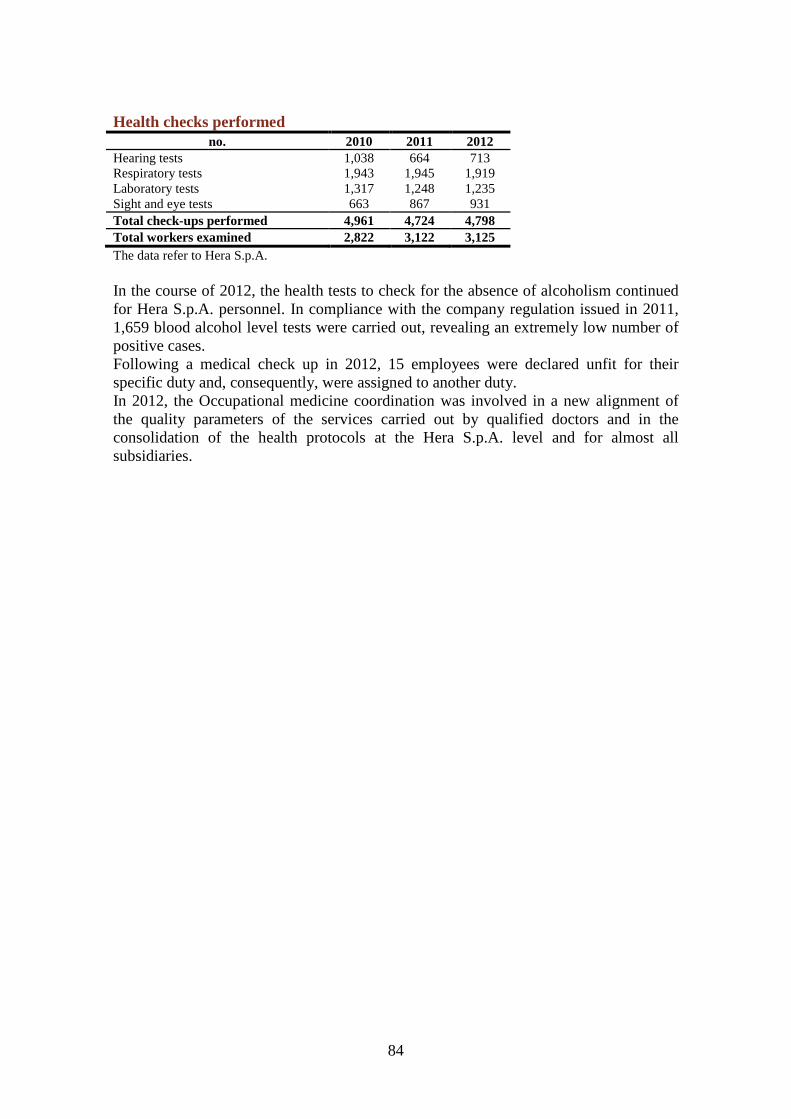
84
Health checks performed no. 2010 2011 2012
Hearing tests 1,038 664 713 Respiratory tests 1,943 1,945 1,919 Laboratory tests 1,317 1,248 1,235 Sight and eye tests 663 867 931 Total check-ups performed 4,961 4,724 4,798 Total workers examined 2,822 3,122 3,125 The data refer to Hera S.p.A. In the course of 2012, the health tests to check for the absence of alcoholism continued for Hera S.p.A. personnel. In compliance with the company regulation issued in 2011, 1,659 blood alcohol level tests were carried out, revealing an extremely low number of positive cases. Following a medical check up in 2012, 15 employees were declared unfit for their specific duty and, consequently, were assigned to another duty. In 2012, the Occupational medicine coordination was involved in a new alignment of the quality parameters of the services carried out by qualified doctors and in the consolidation of the health protocols at the Hera S.p.A. level and for almost all subsidiaries.
85
Industrial relations
In January 2012, following presentation of the Business Plan, several meetings were set up with the trade unions aimed at examining issues regarding investments, safety initiatives, water saving, protection of water resources, waste cycle and separate waste collection. An agreement was signed in March with the National Trade Union Organisations and with the Group’s Union Organisation which provided for an increase from 5% to 15% (pursuant to Article 8-bis of the Federambiente CCNL (collective labour agreement)) of the quota of personnel in type B cooperatives awarded with contracts regarding waste collection services, road sweeping services and the management of drop-off points, which may be excluded from the obligation to apply the CCNL (national collective labour agreement) for waste management services. The exclusion must be included in the limits stated above, with regard to the economic volume of the road sweeping, collection, waste transportation (excluding transfer activities), septic tank cleaning and rubbish skip cleaning activities, as laid down in Article 3(1)(a) of the CCNL (national collective labour agreement). Application of the above CCNL (national collective labour agreement) is subject to submission by the social cooperatives of a specific work placement project for disadvantaged personnel: the aim of the institute is to support employment integration for persons at risk of social exclusion. In April the Group signed an agreement with the Trade Unions on the reorganisation project for the Ravenna laboratory. The project intends rationalising the management of activities by focusing on the analysis of special and industrial waste in the Ravenna laboratory and by transferring the other analytical activities to different Group laboratories. The logistics were also streamlined by relocating the laboratories to existing structures in Herambiente and returning the previous ones to Romagna Acque. Negotiations regarding the criteria for identifying personnel dedicated to the Gas Service reached a conclusion. The negotiations were initiated after the issuing of the Ministerial Decree governing the effects on staff of the new tender arrangements for gas services. By agreement between the parties, in June the objectives of the 2011 Group performance bonus were subject to final reporting and the objectives for the 2012 Group performance bonus were identified. Negotiations were subsequently set up for defining the new 2013/2015 agreement. Also in June, an agreement between the Parties was reached on the definition of the network emergency system which can be activated if an event occurs capable of causing serious and/or far reaching effects on safety and service continuity. The staff involved will be chosen among voluntary participants who meet the requirements needed for the intervention defined with the Trade Unions. In relation to training, as set forth in the Supplementary Collective Labour Agreement, the Group training plan for 2012 was presented and an agreement was reached on financed training for Hera S.p.A., Herambiente and Hera Comm. Discussions also began on standardising working hours involving employees of all offices, with the exclusion of organisational structures (Billing Department, Remote Control, Chemical Laboratory, Networks and Waste Management) which require special hours.

86
Meetings aimed at involving trade unions in the AcegasAps integration progress were launched in August and a Memorandum of Understanding was signed between the Trade Union Organisations and Hera S.p.A.’s Member Bodies. On the basis of the agreements taken, negotiations were started to draw up a new Contracts Protocol with the Group’s Union Organisation and to define a new Industrial Relations Protocol with national Trade Union Organisations, signed in March 2013. Furthermore, the Group’s Business Plan integrated with AcegasAps was presented to National and Regional Confederation union representatives and to Sector-based union representatives. As a consequence of the company’s decision to implement a new organisation for the General Operations Division, the joint examination provided for in the Group’s supplementary labour agreement was initiated with the Union Organisation. In the meetings held between October and December, the discussions focused on pointing out the reasons (dictated by the evolving regulatory framework in the sectors of interest) which moved the company towards an organisation by business lines. The new organisational structures of the General Operations Division were presented through targeted meetings. LaborHera met 4 times and was set up to analyse the trend of the performance bonus indicators and, at local level, to examine issues regarding safety at the workplace. In 2012, the trade unions were involved in the development process of the SA8000 management system of Hera S.p.A., firstly with the participation in preliminary meetings regarding the start of the development process and then with the request to identify the names of the SA8000 worker representatives. Seminars were held with the latter regarding the contents of the standard and the roles covered within the social responsibility management system. The SA8000 worker representatives were involved in reviewing management and checking the certification carried out by DNV at the end of 2012 – start of 2013. Hera continued to cooperate with Employers’ Associations by taking part in commissions and delegations to prepare the national collective labour agreements for the gas/water and waste management sectors. Cooperation with Federutility also continued on the new electricity sector classification and seniority conditions system and on regulations for the entire sector regarding exercising the right to strike. Cooperation with Federambiente continued on drawing up the articles of association and the regulation for the medical assistance fund set forth in the Federambiente national collective labour agreement.
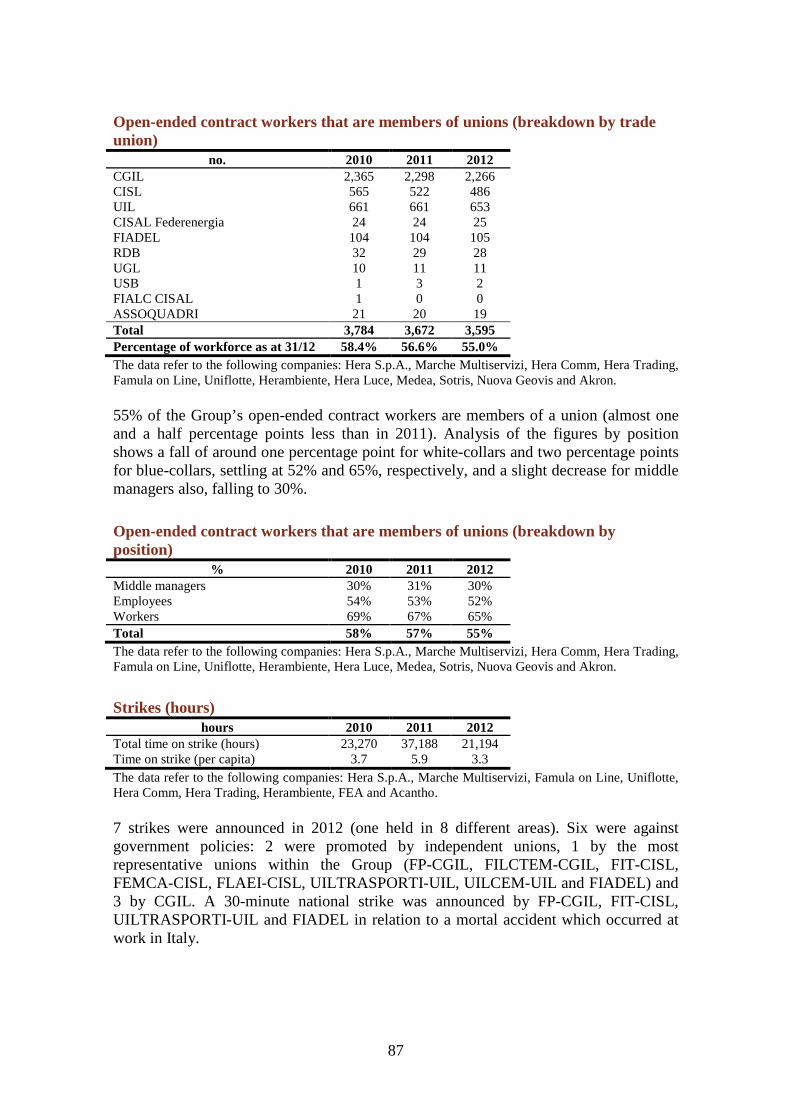
87
Open-ended contract workers that are members of unions (breakdown by trade union)
no. 2010 2011 2012 CGIL 2,365 2,298 2,266 CISL 565 522 486 UIL 661 661 653 CISAL Federenergia 24 24 25 FIADEL 104 104 105 RDB 32 29 28 UGL 10 11 11 USB 1 3 2 FIALC CISAL 1 0 0 ASSOQUADRI 21 20 19 Total 3,784 3,672 3,595 Percentage of workforce as at 31/12 58.4% 56.6% 55.0% The data refer to the following companies: Hera S.p.A., Marche Multiservizi, Hera Comm, Hera Trading, Famula on Line, Uniflotte, Herambiente, Hera Luce, Medea, Sotris, Nuova Geovis and Akron. 55% of the Group’s open-ended contract workers are members of a union (almost one and a half percentage points less than in 2011). Analysis of the figures by position shows a fall of around one percentage point for white-collars and two percentage points for blue-collars, settling at 52% and 65%, respectively, and a slight decrease for middle managers also, falling to 30%.
Open-ended contract workers that are members of unions (breakdown by position)
% 2010 2011 2012 Middle managers 30% 31% 30% Employees 54% 53% 52% Workers 69% 67% 65% Total 58% 57% 55% The data refer to the following companies: Hera S.p.A., Marche Multiservizi, Hera Comm, Hera Trading, Famula on Line, Uniflotte, Herambiente, Hera Luce, Medea, Sotris, Nuova Geovis and Akron.
Strikes (hours) hours 2010 2011 2012
Total time on strike (hours) 23,270 37,188 21,194 Time on strike (per capita) 3.7 5.9 3.3 The data refer to the following companies: Hera S.p.A., Marche Multiservizi, Famula on Line, Uniflotte, Hera Comm, Hera Trading, Herambiente, FEA and Acantho. 7 strikes were announced in 2012 (one held in 8 different areas). Six were against government policies: 2 were promoted by independent unions, 1 by the most representative unions within the Group (FP-CGIL, FILCTEM-CGIL, FIT-CISL, FEMCA-CISL, FLAEI-CISL, UILTRASPORTI-UIL, UILCEM-UIL and FIADEL) and 3 by CGIL. A 30-minute national strike was announced by FP-CGIL, FIT-CISL, UILTRASPORTI-UIL and FIADEL in relation to a mortal accident which occurred at work in Italy.
88
Litigation with the workforce no. 2010 2011 2012
Litigation pending at the close of the year
40 37 36
Considering the Hera Group with the sole exclusion of Marche Multiservizi, as at 31 December 2012, 32 cases of litigation were pending, with specific balance sheet provisions made in view of the potential costs. Of these, 6 were for recognition of a higher employment level, 4 for dismissals for just cause, 1 for nullity of the fixed-term contract, 6 for recognition of an open-ended employment agreement, 7 for compensation of damages and payment of contractual indemnity, 2 to appeal a transfer, 2 for disciplinary sanctions, 3 regarding pensions and settlement of contributions, and 1 lodged in the first instance by the company for verification of the legitimacy of the disciplinary sanction applied. The Marche Multiservizi Group has 4 cases pending with personnel, 3 for recognition of a higher employment level and 1 for nullity of the fixed-term contract. In 2012, 135 disciplinary measures were taken against Group employees, in compliance with the applicable national labour agreements (compared to 151 in 2011). They mainly involved oral or written reprimands (59 cases), withholdings on salary (47 cases totalling Euro 2,608, 27 of which pertaining to Hera S.p.A. totalling Euro 1,793) and 27 temporary suspensions from work (21 less serious and 6 more serious cases). In two cases, it was necessary to resort to termination without notice. The number of temporary suspensions from work is the same as that reported in 2011 (against 28 in 2010 and 46 in 2009). All measures taken are consistent with the establishment of a new sanction system which was agreed with the trade unions and involves the application of withholdings from the accrual of holidays using a progressive system if the work schedule is not respected.
Internal communication
Many projects and initiatives began in 2012 to increase the dissemination and sharing of information and to involve the workforce. To mark the tenth anniversary of the Hera Group, a new logo was created with the wording “Dove sei ci siamo” (Wherever you are, we’re here) to strengthen the idea of being close to internal and external customers’ needs. A wide-ranging editorial project was also carried out that led to the publication of the book entitled “Energie umane” (“Human energies”). By enhancing the past, portraying the present and imagining the future, the book provides stories and photographs of workers to describe the ten years of Hera. The volume was distributed in November to over 6,000 Group workers. Several initiatives were carried out to promote the project internally: from publishing articles in the House Organ, projecting a video during the meetings between the workforce and the Chairman and CEO, and developing materials with the ten-year logo (banner stands at the entrance of company offices, biodegradable plastic cups, napkins for the canteen, sugar packets, folders, notebooks, pens, etc.), to creating a specific intranet section with a version of the book that can be leafed through online.
89
Another significant action carried out in 2012 was the satisfaction survey on the main internal communication tools: the House Organ, the Corporate Intranet, the annual meetings between the Chairman and CEO and the entire workforce, and VideoHera (the large monitors placed in the main employee meeting and gathering areas, where the main Hera and Ansa news is published). All Group workers were involved in the survey and filled in either a paper or online questionnaire (overall, 1,610 questionnaires were filled in), and 80 colleagues attended focus groups and in-depth interviews in order to express their evaluations and offer their suggestions. The Overall Satisfaction Index of the internal communication tools is 64, on a scale from 1 to 100. The intranet obtained the highest approval level (67 points). Positive evaluations were also given to the annual meetings with the Chairman and CEO (65 points) and to the House Organ (63 points), the most diffused tools among the workforce. Relevant improvement actions will be defined and implemented in 2013. The activities to enrich the contents of the House Organ continued, to favour a better use of it as a source of useful and updated information, which announces news to all colleagues. It contained a wide range of features and of ongoing and detailed articles, planned to provide visibility to the invisible work and the projects of the company’s various structures (for example, the features on the internal climate survey and on the “La Grande Macchina del Mondo” (“The Great Engine of the World”) education project for schools, and the insert focusing on the effective management of meetings). General interest articles, meetings and events also continue to be published in the House Organ. The fourth edition of Bimbi in Hera (Children at Hera) was successfully held in 2012. The party was organised at the main corporate offices with lots of activities for Hera employees’ children with the aim of showing them where their parents work. 250 children and around 200 colleagues took part in the event throughout all the areas. As usual, employees particularly appreciated the recreational and sporting gatherings organised together with the Recreational associations to facilitate meeting and integration amongst co-workers from different areas. The “Hera Cup” sailing regatta and the long weekend with the “Hera Ski Adventure” giant slalom were organised for sixth time, reaching 300 and 270 participants, respectively.
Sustainable expenditure, in the company Considering the environmental benefits of locally grown produce and the need for work-life balance, cooperation between the Employees’ Association and Management in Ravenna led to organising the sale of fruit, season vegetables, meat and cheese in the square next to the car park of the offices in Via Romea. Every Tuesday afternoon, for a couple of hours, this useful service is provided to Hera employees and to the members of the corporate Association, enhancing the quality and origin of local produce.
Many activities were carried out to support information and promote the dissemination of topics of interest to workers, including the “Disabilità e lavoro” (“Disability and work”) booklet, the new edition of “Mamma & Papà al lavoro” (“Mummy and Daddy at work”), and the internal campaigns raising awareness about a more respectful use of common spaces (such as meeting rooms and services) and of resources (distribution of Hera2O cups that are not disposable but can be washed and re-used by all the workforce).

90
Monitoring of the company canteens continues by the Canteen Commissions (one for each area) which are composed of colleagues and are coordinated and supervised by the area Facility Management. They meet on a quarterly basis to assess the quality of the service provided and compliance with the specifications and to propose any improvements. An exhibition was held in the company canteens, in cooperation with Concerta (the canteen operator), in which panels explained the strong points of the service provided (use of network water, locally grown produce, etc.). Regarding the VolontariHeraPer initiative, the National Food Collection Day was promoted in 2012 in favour of the Banco Alimentare Foundation.
The Corporate Intranet On the Corporate Intranet reserved for Group employees, broad visibility was afforded in 2012 to information and initiatives involving the workforce. The employee satisfaction survey on the internal communication tools revealed that the corporate internet is the most highly appreciated tool and is used for a much more increasing number of activities compared to the past. Around 70% of employees interviewed consider the intranet a very useful tool that is necessary for their work. Approximately 500 news items with daily updates were posted during the year and, on average, 1 million intranet pages were visited per month. Among the main novelties of 2012: the balanced scorecard system section, launched in November and reaching 1,261 pages visited in one month, and the section on Solidarity and Volunteering, with a part dedicated to the initiatives carried out by employees to deal with the damages caused by the earthquake in May 2012. An e-Learning course was also published on the intranet in 2012 focused on raising awareness in the workforce about disability issues. The use of videos to communicate on the most important topics with increased efficiency continued: around forty company videos were created in 2012. Employees were also pleased with the online announcement board, on which around 400 announcements were posted in 2012 directly by users.
Renovation and reconstruction of premises In 2012, the process for identifying the new integrated maintenance supplier through a European call for tenders was completed for an overall amount above Euro 60 million over a period of 5-7 years. As part of the tender, the supplier was requested to finance 5 energy containment projects, during the period of validity of the contract, totalling approximately 146 kWh/m3 of improvement. With regard to activities carried out for company personnel, the completion of the “Frullo” office in Bologna (new class A building – Decree of the Regional Government no. 152/2008) is worthy of note, with an overall investment of Euro 19 million and subsequent transfer of all the operating activities of the Bologna area to the new building complex. Safety works carried out on the Ferrara office which became necessary after the earthquake of May 2012 are also worth pointing out. Employees were able to return to their offices, which had presented risks for their safety, after just three weeks. The “Molino Rosso” site in Imola, although not mandatory by law, was adapted to resist earthquakes.
91
In 2013, the works on the “Pievesistina” waste-management site in Cesena will be completed and the safety control activities, especially at the Modena, Bologna “Frullo”, Imola “Molino Rosso” and Ravenna “Romea Nord” sites, will be continued.
Frullo Warehouse: technology and memory side by side “Warm” offices, a modern warehouse decorated with green plants and with walls that speak of Hera and its history: forklift trucks and notes written on pieces of paper were no longer sufficient; today, the warehouse operators at Hera’s Bologna premises use scanners, QR code readers, electronically-controlled vertical warehouses and much more. The operators work in a well lighted environment, with pedestrian walkways and designated routes for forklift trucks, efficient and silent fumes extraction systems, and even a break room with lively and colourful paintings: these aspects promote a positive work environment in which employees are pleased to work.
Recreational associations
The workforce has the option of taking part in the activities organised by the recreational associations of the various areas, set up in order to foster relations among employees. The associations organise cultural, recreational, sports and tourism activities, promote special commercial agreements, organise dinner parties, outings, Christmas and carnival events, competitive sports events, fishing competitions and ski excursions. These associations also provide theatre season tickets and book-lending services. For their members, the associations contribute a portion to book spending on the part of student workers and the children of employees and other contributions for sporting activities and discounts from several businesses. The associations are managed independently by a Management Board whose members are elected directly by association members. The Group contributes to the activities of the associations by guaranteeing the financial resources envisaged as a part of national collective labour agreements and of locally stipulated agreements and provides space for recreational activities or for management of these activities which are also promoted though the internal communications instruments. In 2012, 5,108 employees were members of the associations. The activities of the associations have been financed with contributions by the company (approximately Euro 609 thousand) and the employees (approximately Euro 21 thousand). Excluding Marche Multiservizi, roughly 22,500 people participated in the activities organised by the associations.
The internal climate survey
The internal climate survey is a fundamental instrument in the ongoing process of improvement, involvement and enhancement of the workforce, which are two of the operational principles set forth in the Hera Group Charter of Values. It began being

92
applied in the Hera Group in 2005 and is carried out every two years to facilitate the implementation and consolidation of the actions for improvement. After analysing the results of the survey carried out in 2011, 22 improvement actions were defined: results and actions were communicated through the House Organ to all employees in February 2012. These actions were assigned to a manager and monitored on a quarterly basis through a specific report and using the balanced scorecard. Of the 22 actions planned, 12 were fully carried out in 2012, 2 only for the part related to 2012 and 8 are being carried out and will be completed in 2013.
Progress to 31 December 2012 of the improvement actions launched as a result of the 2011 internal climate survey
Role in Hera Improvement actions The situation as at 31 December 2012
• To define an action plan concerning the generation gap (e.g., reciprocal tutoring between employees belonging to different targets due to role and seniority).
• To favour a work-life balance through initiatives intended to
train and prepare specific materials and tools to manage long absences, and to favour a rapid re-entry to work. Extension of agreements with crèches to the areas of Ferrara, Modena, Rimini and Forlì.
• To disseminate culture and best practices for the effective and
efficient organisation of meetings, also through training courses.
• To provide visibility to operative roles (through internal communication tools).
• To optimise Hera’s compensation policies.
• A study was carried out together with the Faculty of Psychology of the University of Bologna regarding the generation gap within the company. The study was based on interviews, focus groups and questionnaires provided to around 400 employees. Actions in 4 priority areas were defined which will be implemented from the first quarter 2013.
• The 2012 edition of the “Mamma e Papà al lavoro” (“Mummy and Daddy at Work”) booklet was published (focused on the rights and obligations relating to work/life balance and parental leave) and the Disabilità e lavoro (Disability and work) new booklet (focused on the opportunities and rights of differently-abled workers and workers who assist differently-abled individuals). The request for funding was successfully granted in November. The activities will be launched from March 2013. The agreement for a company crèche in Rimini was initiated regardless of the financing (three requests received from employees for 2012-2013 which were met).
• A special feature was published in the House Organ regarding the effective management of meetings: the material (posters and table cards) was displayed in the meeting rooms. An e-learning course on time and meeting management will be available in the first quarter of 2013
• Eight in-depth articles on operative roles were published in the House Organ
• An in-depth article on “Top Employers – Corporate Culture” was published in the House Organ, in which one of the criteria focused on compensation. The contents of the Compensation and Incentives section of the Group’s website were updated.
Workplace Improvement actions The situation as at 31.12.12
• To provide continuity to the “Passaparola” (“Word of mouth”) project, also aimed at more and timely sharing of company projects and initiatives, and its extension to other Group areas.
• To provide continuity to actions begun as part of the “A year
for safety” project. • To provide continuity to actions undertaken for employees to
increase their awareness of opportunities linked to knowledge of the labour agreement, the performance bonus and calculation criteria.
• To control and if necessary update internal communication tools.
• The “Passaparola” project continued, with different levels of application in the areas also depending on the absorption of resources in the organisational changes during the last quarter of 2012. The project will be reviewed in view of the “Development of the DGO (General Operations Division) organisational model” project in 2013
• The “Safety is not a game” project was completed: 5,195 persons were involved, equal to 90% of the company population
• The agreement for the renewal of the Federambiente National Collective Labour Agreements of June 2011 (economic alignment with the new Fise National Collective Labour Agreement) and the document regarding the objectives contained in the 2012 performance bonus agreements were published
• A survey on internal communication tools was carried out by means of interviews, focus groups and questionnaires (paper and online). The results of the survey were published in the House
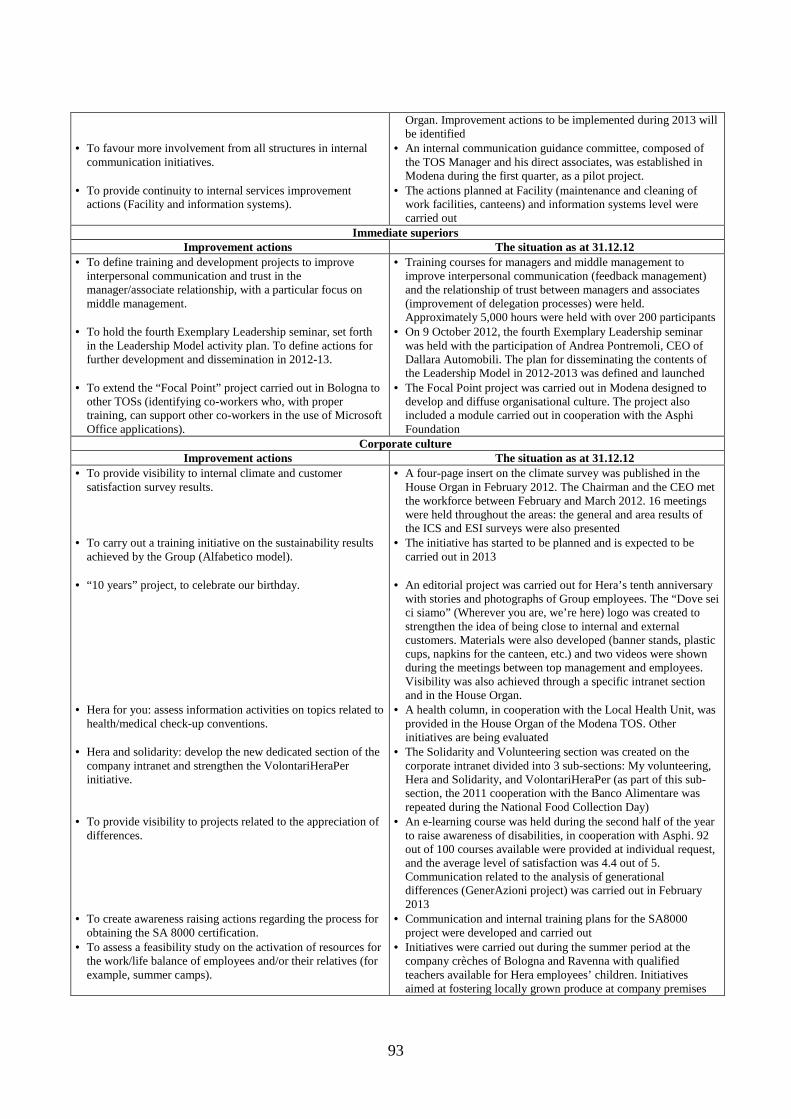
93
• To favour more involvement from all structures in internal
communication initiatives. • To provide continuity to internal services improvement
actions (Facility and information systems).
Organ. Improvement actions to be implemented during 2013 will be identified
• An internal communication guidance committee, composed of the TOS Manager and his direct associates, was established in Modena during the first quarter, as a pilot project.
• The actions planned at Facility (maintenance and cleaning of work facilities, canteens) and information systems level were carried out
Immediate superiors Improvement actions The situation as at 31.12.12
• To define training and development projects to improve interpersonal communication and trust in the manager/associate relationship, with a particular focus on middle management.
• To hold the fourth Exemplary Leadership seminar, set forth
in the Leadership Model activity plan. To define actions for further development and dissemination in 2012-13.
• To extend the “Focal Point” project carried out in Bologna to
other TOSs (identifying co-workers who, with proper training, can support other co-workers in the use of Microsoft Office applications).
• Training courses for managers and middle management to improve interpersonal communication (feedback management) and the relationship of trust between managers and associates (improvement of delegation processes) were held. Approximately 5,000 hours were held with over 200 participants
• On 9 October 2012, the fourth Exemplary Leadership seminar was held with the participation of Andrea Pontremoli, CEO of Dallara Automobili. The plan for disseminating the contents of the Leadership Model in 2012-2013 was defined and launched
• The Focal Point project was carried out in Modena designed to develop and diffuse organisational culture. The project also included a module carried out in cooperation with the Asphi Foundation
Corporate culture Improvement actions The situation as at 31.12.12
• To provide visibility to internal climate and customer satisfaction survey results.
• To carry out a training initiative on the sustainability results
achieved by the Group (Alfabetico model).
• “10 years” project, to celebrate our birthday. • Hera for you: assess information activities on topics related to
health/medical check-up conventions.
• Hera and solidarity: develop the new dedicated section of the company intranet and strengthen the VolontariHeraPer initiative.
• To provide visibility to projects related to the appreciation of
differences. • To create awareness raising actions regarding the process for
obtaining the SA 8000 certification. • To assess a feasibility study on the activation of resources for
the work/life balance of employees and/or their relatives (for example, summer camps).
• A four-page insert on the climate survey was published in the House Organ in February 2012. The Chairman and the CEO met the workforce between February and March 2012. 16 meetings were held throughout the areas: the general and area results of the ICS and ESI surveys were also presented
• The initiative has started to be planned and is expected to be carried out in 2013
• An editorial project was carried out for Hera’s tenth anniversary
with stories and photographs of Group employees. The “Dove sei ci siamo” (Wherever you are, we’re here) logo was created to strengthen the idea of being close to internal and external customers. Materials were also developed (banner stands, plastic cups, napkins for the canteen, etc.) and two videos were shown during the meetings between top management and employees. Visibility was also achieved through a specific intranet section and in the House Organ.
• A health column, in cooperation with the Local Health Unit, was provided in the House Organ of the Modena TOS. Other initiatives are being evaluated
• The Solidarity and Volunteering section was created on the corporate intranet divided into 3 sub-sections: My volunteering, Hera and Solidarity, and VolontariHeraPer (as part of this sub-section, the 2011 cooperation with the Banco Alimentare was repeated during the National Food Collection Day)
• An e-learning course was held during the second half of the year to raise awareness of disabilities, in cooperation with Asphi. 92 out of 100 courses available were provided at individual request, and the average level of satisfaction was 4.4 out of 5. Communication related to the analysis of generational differences (GenerAzioni project) was carried out in February 2013
• Communication and internal training plans for the SA8000 project were developed and carried out
• Initiatives were carried out during the summer period at the company crèches of Bologna and Ravenna with qualified teachers available for Hera employees’ children. Initiatives aimed at fostering locally grown produce at company premises
94
were promoted with the company associations of Modena and Ravenna
Other dialogue and consultation initiatives
For the seventh year running, in 2012 the Chairman and Chief Executive Officer met with the entire workforce to illustrate the business plan, to present the results of the corporate climate survey and the annual customer satisfaction survey, and to comment upon the Groups most significant projects: 16 meetings were held in the various areas over a couple of weeks, involving over 80% of the workforce. Among the novelties, in order to increase employees’ involvement and participation in the meetings, two videos were shown to celebrate the Group’s ten years and to promote the workers’ involvement in the Human Energies editorial project. During the second and third quarter, the top-down communication meetings related to the “Passaparola” (“Word of mouth”) project were carried out in the areas. The meetings addressed 3,500 employees of the TOSs and were aimed at favouring knowledge of the main corporate activities and initiatives, enhancing and standardising the many communication initiatives already available. In line with previous years, the main indicators contained in the Sustainability Report were presented to the Trade Union Organisations in 2012. During presentation of the Group’s business plan, integrated with AcegasAps, the following were highlighted: Hera’s training initiatives, data on the internal climate survey and customer survey, and details of the activities carried out for increasing separated waste collection and reducing water losses.

95
Customers
In 2012, Hera served approximately 3.3 million residents, the majority of which are located in the six provinces of Emilia-Romagna. Hera also provided services to local businesses, for which fast track channels have been created. In de-regulated services (gas and electricity), Hera sold gas and electricity to 1.7 million customers in almost all regions of Italy. Hera has surveyed its customers’ satisfaction each year since 2005. Surveys are carried out by telephone and the results are used to define improvement objectives.
Objectives and performance
What we said we would do... What we have done... • Ensure call centre waiting time of no more than 40 seconds for households and no more than 25 seconds for companies in 2012. • Ensure average branch waiting time of no more than 12 minutes in 2012. Ensure average waiting time of less than 5 minutes for small business customers at the eight main branches. • Guarantee compliance with specific commercial quality standards for gas and electricity services, and the standards set forth in the approved Service Charters, in 98.5% of cases in 2012. • Ensure a response within 120 seconds for 95% of calls to the gas service emergency number in 2012. • Improve response times to complaints, guaranteeing compliance with the response time set by the AEEG in at least 95% of cases in 2012. • Continue to promote delivery of electronic bills: in 2012, increase the number of customers who use this service by 40%. • Continue to promote the quality of tap water with additional information initiatives in 2012. • In 2012, plan actions to improve the readability and clarity of the bill and work estimates. • Improve the usability and content of the Hera OnLine website, and in 2012 plan new services to provide online.
• Call centre waiting times were 40 seconds for residential customers and 25 seconds for business customers. (see page Errore. Il segnalibro non è definito.) • In 2012 the average waiting time at branches was 10 minutes. The average waiting time for small business customers at the eight main branches was 3 minutes (see page Errore. Il segnalibro non è definito.) • In 2012, the percentage of compliance with specific standards was 99.6%, compared to 98.7% in 2011. (see page 282) • In 2012, the percentage of responses to gas service emergency calls within 120 seconds was 93%. This figure was negatively influenced by the calls associated with the February snowfalls: excluding the month of February, the percentage rises to 95%. (see page 127) • The claims response time set by AEEG (40 calendar days) for gas and electricity services was respected in 98.3% of the cases, compared to 96.8% in 2011. (see page 135) • In December 2012, customers using this service increased by 65% compared to 2011. A campaign promoting electronic bills in partnership with 69 municipalities was launched (see page 134) • The “In buone acque” (“In good water”) report was published once again in 2012 and for the first time included the results of the tests carried out by the Local Health Units. The report was presented also thanks to an online chat. The water labels started to be published in the bills from September 2012. (see page 120) • The project was launched in 2012, involving customers, and will be completed in 2013. (see page 100) • The new Hera Comm website was published in
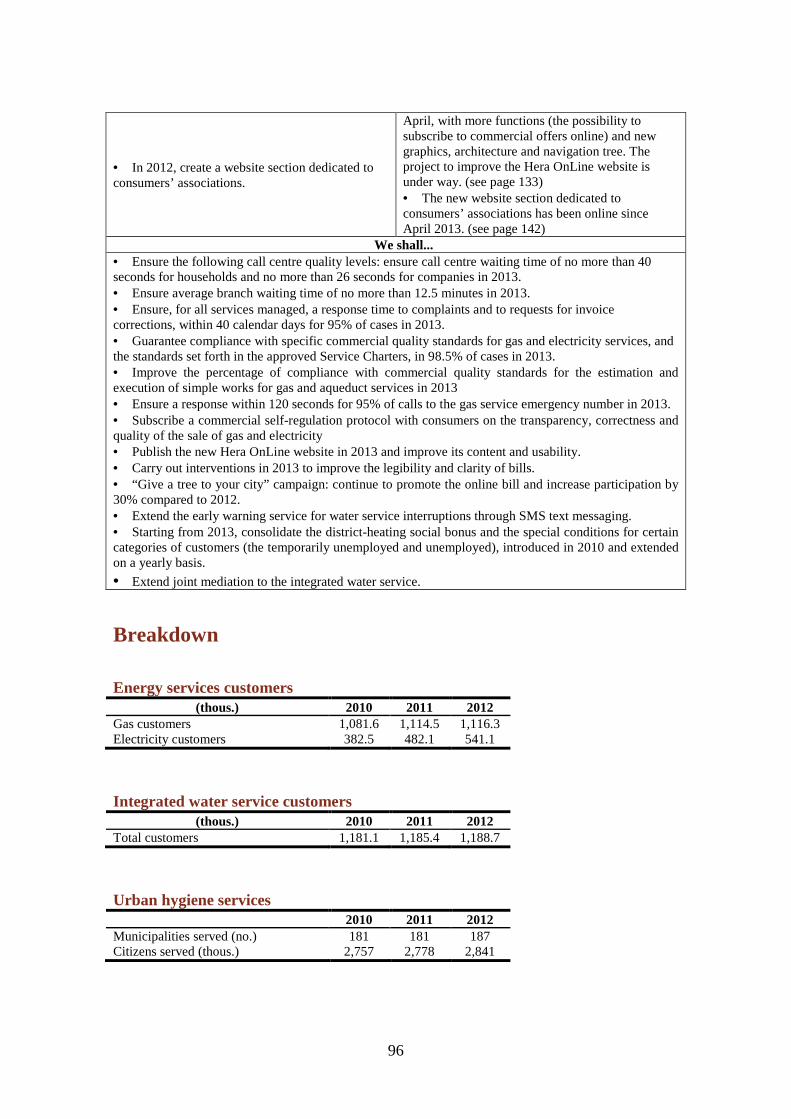
96
• In 2012, create a website section dedicated to consumers’ associations.
April, with more functions (the possibility to subscribe to commercial offers online) and new graphics, architecture and navigation tree. The project to improve the Hera OnLine website is under way. (see page 133) • The new website section dedicated to consumers’ associations has been online since April 2013. (see page 142)
We shall... • Ensure the following call centre quality levels: ensure call centre waiting time of no more than 40 seconds for households and no more than 26 seconds for companies in 2013. • Ensure average branch waiting time of no more than 12.5 minutes in 2013. • Ensure, for all services managed, a response time to complaints and to requests for invoice corrections, within 40 calendar days for 95% of cases in 2013. • Guarantee compliance with specific commercial quality standards for gas and electricity services, and the standards set forth in the approved Service Charters, in 98.5% of cases in 2013. • Improve the percentage of compliance with commercial quality standards for the estimation and execution of simple works for gas and aqueduct services in 2013 • Ensure a response within 120 seconds for 95% of calls to the gas service emergency number in 2013. • Subscribe a commercial self-regulation protocol with consumers on the transparency, correctness and quality of the sale of gas and electricity • Publish the new Hera OnLine website in 2013 and improve its content and usability. • Carry out interventions in 2013 to improve the legibility and clarity of bills. • “Give a tree to your city” campaign: continue to promote the online bill and increase participation by 30% compared to 2012. • Extend the early warning service for water service interruptions through SMS text messaging. • Starting from 2013, consolidate the district-heating social bonus and the special conditions for certain categories of customers (the temporarily unemployed and unemployed), introduced in 2010 and extended on a yearly basis.
• Extend joint mediation to the integrated water service.
Breakdown
Energy services customers (thous.) 2010 2011 2012
Gas customers 1,081.6 1,114.5 1,116.3 Electricity customers 382.5 482.1 541.1
Integrated water service customers (thous.) 2010 2011 2012
Total customers 1,181.1 1,185.4 1,188.7
Urban hygiene services 2010 2011 2012
Municipalities served (no.) 181 181 187 Citizens served (thous.) 2,757 2,778 2,841

97
There was an additional increase in the number of customers in 2012, particularly for energy services. The growth was more significant in the electricity sector were customers increased by 12%. As regards the residential market, the growth was more evident: +19%. The intense commercial activities carried out made it possible to acquire 150,000 free market customers, especially in the regions of Emilia-Romagna, Marche and Tuscany. The excellent results achieved have been possible due to product innovation, multi-service offerings and simplified management. Particularly, product innovation was achieved with low costs and transparency, proposed with the new free market options “Prezzo Netto Hera Casa”, “Prezzo Fisso Hera Casa, and from 2013, “Prezzo Fisso Hera Casa Natura”, in addition to the possibility for all residential customers of the electricity sector to choose between two consumption profiles, “Sole-Luna” and “24” which allow customers to choose, respectively, a twin rate or single rate price for the energy component. Proximity to the customer was strengthened in widespread activities at over 120 branches located throughout the areas served, with excellent service levels and continuous reinforcement of the sales force. Regarding these last two aspects, strong attention was placed on the maintenance of high behavioural standards, in line with the Code of Ethics and the Code of commercial conduct governing the sale of electricity and natural gas. In 2013, we will continue to work on focusing on customer needs and service levels by:
• developing new products and offers aimed at providing customers with added value; • continuously improving in management streamlining; • continuously training representatives and the sales force, maintaining direct and continuous quality controls.
Commercial policies Hera’s policy of commercial development is founded on the following main pillars:
• multiple services offer: simplifying management for customers by proposing a single contact point and only one bill for energy services (gas and electricity) and the concessions (water and urban hygiene) in the areas handled; • proximity to customers: to be physically close to customers through approximately 120 branches and the widespread sales structure; to be quickly accessible through a call centre and the web; to be socially responsible and contribute with our activities to the growth of the area and of the local communities; • simplification of management: to give customers the option of managing bills on their own through the Hera OnLine portal and requesting electronic mailing of the bill and the direct debiting of utilities. • low cost and transparency: to make our offers always competitive and clear and adapted to the needs of all customers (over thirty offers are currently available, many of which can be customised further).
The commercial strategy applies to all customer segments: households, small and medium sized companies, large companies, condominiums and public bodies, with the households segment achieving an increasingly central role.

98
The portfolio of gas and electricity offers includes a variety of proposals ranging from procurement options connected with energy wholesale markets, as in the case of “Prezzo Netto Hera Casa”, to the safety and stability of expenditure resulting from the application of fixed costs that cover the “energy component”, as in the case of the “Prezzo Fisso Hera Casa” offer. Furthermore, particular interest was shown towards environmental sustainability leading to the “Prezzo Fisso Hera Casa Natura” offer which combines the advantage of a fixed cost together with the twofold prerogative of reducing paper consumption and the emission of CO2 in the environment. The two offers, Prezzo Netto Hera Casa and Prezzo Fisso Hera Casa Natura, are particularly innovative:
Prezzo Netto Hera Casa is Hera Comm’s electricity and gas offer for residential customers available since April 2012. This innovative offer is unique on the market and gives families the possibility to easily access the main wholesale energy markets. The offer is linked to the performance of the two most significant wholesale price references: the “Single National Price” for electricity and the Dutch “TTF” price for gas. To this regard, the “TTF” is the same price reference introduced by the AEEG among the parameters on the basis of which the economic conditions of the gas protection service are updated, from April-June 2012, with the aim to transfer the benefits associated with the competitive mechanisms of European wholesale markets also to the economic protection conditions. “Prezzo Netto Hera”, therefore, makes it is possible to access two competitive wholesale markets, thanks to Hera Comm’s intermediation, and a monthly contribution to be added to the price of energy which varies depending on yearly consumption.
Prezzo Fisso Hera Casa Natura is Hera Comm’s “sustainable” fixed-price offer for residential customers. The offer will start in 2013 and Hera Comm’s aim is to stimulate customers and raise their awareness of issues regarding “sustainability”. The supply of “CO-FER” certified electricity from renewable sources will be guaranteed and the offer will include, both for electricity and gas customers, online billing and automatic payment of the bills from the bank. Thanks to this offer, customers will contribute to reducing the use of paper and the emission of CO2 in the environment. By subscribing to this offer, customers will also take part in the initiative promoted by Hera: “Get rid of bills, give a tree to your city”. The project, in partnership with the main municipalities of the Emilia-Romagna regions, will result in the planting of new trees in the cities.
Before subscribing to Hera Comm’s offer as part of the free market, the customer receives a sheet summarising all payments, set up according to the templates provided by AEEG ARG/com resolution no. 104/2010, which provides a comparison of the estimated annual expenses deriving from the offer with the estimate of annual expenses deriving from the economic terms and conditions of the supply for the service subject to protection, defined by the AEEG. A project to improve the readability and the clarity of bills was also launched in 2012. The project included the organisation of focus groups with customers belonging to the households segment and to the companies segment. The aim of the groups was to identify both the strong and weak points of current bills and then identify the elements
99
considered more important and useful by the customers. Individual eye-tracking tests were also carried out. This tool allowed data and evidence to be collected that were not consciously reinterpreted by the customers, thus allowing us to identify which aspects of the stimulus (in this case the bill) attracted their attention and were truly assimilated. It also allowed us to reconstruct the distribution of the attentive resources among the various elements and to obtain accurate and objective information about the visual behaviour of the individuals during the first seconds of observation. The new multi-service bill, which will take into account the tests carried out, will be tested once again on customers in order to assess its effectiveness, before becoming available by the end of 2013.
Less paper with online contracts Since August 2012 it has been possible to directly subscribe to Hera electricity and gas offers by visiting the Hera Comm website and stipulating a contract online. After the customer inserts their details, a mail is sent to them with a link they can use to confirm the contract. The customer has 5 days to confirm. In a subsequent mail they will receive a PDF of the contract which does not need to be signed or returned, just merely filed away. The online stipulation of the contract involves the issuing of electronic bills thus helping to further reduce the use of paper.
The Hera Comm sales network and commercial conduct To sell energy services to medium and small customers (households and companies), Hera Comm uses multifirm agents which propose contracts through door-to-door sales, by telephone, or by setting up appointments with customers. The Quality system defines agency selection, which involves assessing conduct in similar sectors, loyalty to a principal company, corporate solidity and years of business. Hera Comm regularly provide all of their commercial staff and managers of agencies or their subagents, with specific training including the content of the Code of commercial conduct defined by AEEG and the rights recognised to end customers. For telephone sales, personnel uses a sales script which is regularly updated with new regulatory aspects and represents a guide of information to be transferred to the potential customer during the pre-contractual phase. Hera Comm Area Managers also periodically support customers in assessing whether the rules provided have been applied correctly. Training is always provided before delivering the materials necessary to conclude contracts with end customers. Regarding the rules of conduct for agents and subagents, Hera Comm has used a Sales Manual for years (integral part of the Agency Mandate, which includes the Hera Group Code of Ethics), which all partners must sign. Regarding recognisability, sales personnel must display their identity card and must present themselves to the customer clearly explaining that they work for a Hera Comm authorised agency. There is particular focus on the quality of contracts proposed by agencies, specifically any unrequested contracts, for which the Hera Comm agency mandate sets forth specific penalties. All non-compliances related to any unrequested contracts, together with other types of non-compliance, are tracked in order to apply the penalties set forth and, if the agency does not apply corrective actions, the agency mandate is terminated for just cause. In order to promptly intercept unrequested contracts and ensure more customer protection, Hera Comm has also decided to:

100
• send a welcome letter to domestic customers for paper contracts as well and not only for contracts concluded by telephone; • send the welcome letter to non-domestic customers; • extend the right to back out of the contract to non-domestic customers and to domestic customers, even if the contract was stipulated at a branch and not by telephone. • in order to ensure the prompt receipt of the customer’s change of decision, activate the free market supply two months after the customers signs the contract.
Controls and corrective measures concerning this phenomenon regard contracts formalised by employees and by sales agents. All contracts are subject to a preventive quality check aimed at controlling the authenticity of the contract’s signing, while for telephone contracts, there is also a system to check the quality of a sampling of calls. If fraudulent conduct is suspected, Hera Comm initiates controls and corrective actions aimed at excluding its personnel’s sales methods which do not comply with the legal and regulatory context in force and professional integrity. AEEG resolution no. 153/2012/R/com (“Adoption of preventive recovery measures in cases of unrequested contracts and activations of electricity and/or natural gas supply) represents a significant measure to confront the phenomenon of incorrect commercial practices and, consequently, unrequested gas and electricity contracts. From 1 June 2012 (date on which the above Resolution entered into effect) to 31 December 2012, Hera Comm handled 108 complaints with a specific complaint management procedure for unrequested contracts, 37 of which were related to gas supplies and 71 to electricity supplies. Regarding these complaints, the application of recovery measures regarded 59 contracts, 21 related to gas supply contracts and 38 to electricity supply. The overall number of new gas and electricity contracts signed by Hera Comm in 2012 amounted to 243,434 (201,051 related to domestic customers and 42,383 to non-domestic customers). In accordance with Resolution 153/2012/R/com, the sales companies may be provided with a “self-regulation protocol”: this further tool seeks to limit the phenomenon of unrequested contracts. In order to guarantee maximum transparency towards customers, Hera Comm will adopt a self-regulation code by the end of 2013 which will also support customers in understanding the energy market. The protocol will be defined together with consumer associations.
Tariffs and billing Hera manages service concessions (e.g. the integrated water cycle, urban waste, and gas and electricity distribution) and free market services (e.g. waste disposal and gas and electricity sales). For service concessions, the tariffs applied by Hera are regulated by controlling authorities (AEEG – Italian Authority for Electricity and Natural Gas and ATO – Water and Waste Regulatory Authority of Emilia-Romagna for water services and waste management), while for free market services, tariffs are freely determined by the sales company. For sales tariffs, AEEG defines and updates quarterly the prices for domestic and non-domestic electricity customers which have chosen to not take advantage of a free market option and for natural gas service domestic customers which, having chosen to not take advantage of a free market option, are subject to the protective economic conditions defined by AEEG. The costs of Hera services for an average customer
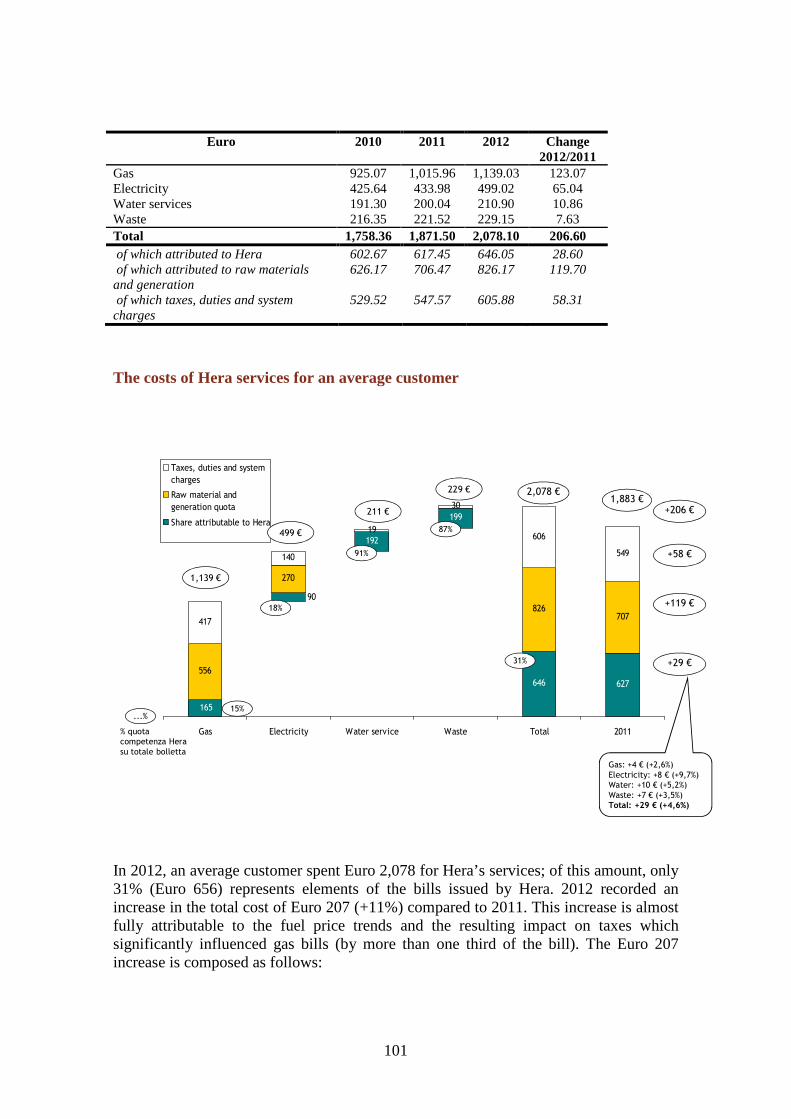
101
Euro 2010 2011 2012 Change
2012/2011 Gas 925.07 1,015.96 1,139.03 123.07 Electricity 425.64 433.98 499.02 65.04 Water services 191.30 200.04 210.90 10.86 Waste 216.35 221.52 229.15 7.63 Total 1,758.36 1,871.50 2,078.10 206.60 of which attributed to Hera 602.67 617.45 646.05 28.60 of which attributed to raw materials and generation
626.17 706.47 826.17 119.70
of which taxes, duties and system charges
529.52 547.57 605.88 58.31
The costs of Hera services for an average customer
192
199
646 627
556
270
826707
417
140
19
30
606
549
90
165
Gas Electricity Water service Waste Total 2011
Taxes, duties and system
charges
Raw material and
generation quota
Share attributable to Hera
+206 €
2,078 €1,883 €
+58 €
+119 €
+29 €
15%
18%
87%
91%
...%
% quota
competenza Hera
su totale bolletta
31%
1,139 €
499 €
211 €
229 €
Gas: +4 € (+2,6%)
Electricity: +8 € (+9,7%)
Water: +10 € (+5,2%)
Waste: +7 € (+3,5%)
Total: +29 € (+4,6%)
In 2012, an average customer spent Euro 2,078 for Hera’s services; of this amount, only 31% (Euro 656) represents elements of the bills issued by Hera. 2012 recorded an increase in the total cost of Euro 207 (+11%) compared to 2011. This increase is almost fully attributable to the fuel price trends and the resulting impact on taxes which significantly influenced gas bills (by more than one third of the bill). The Euro 207 increase is composed as follows:
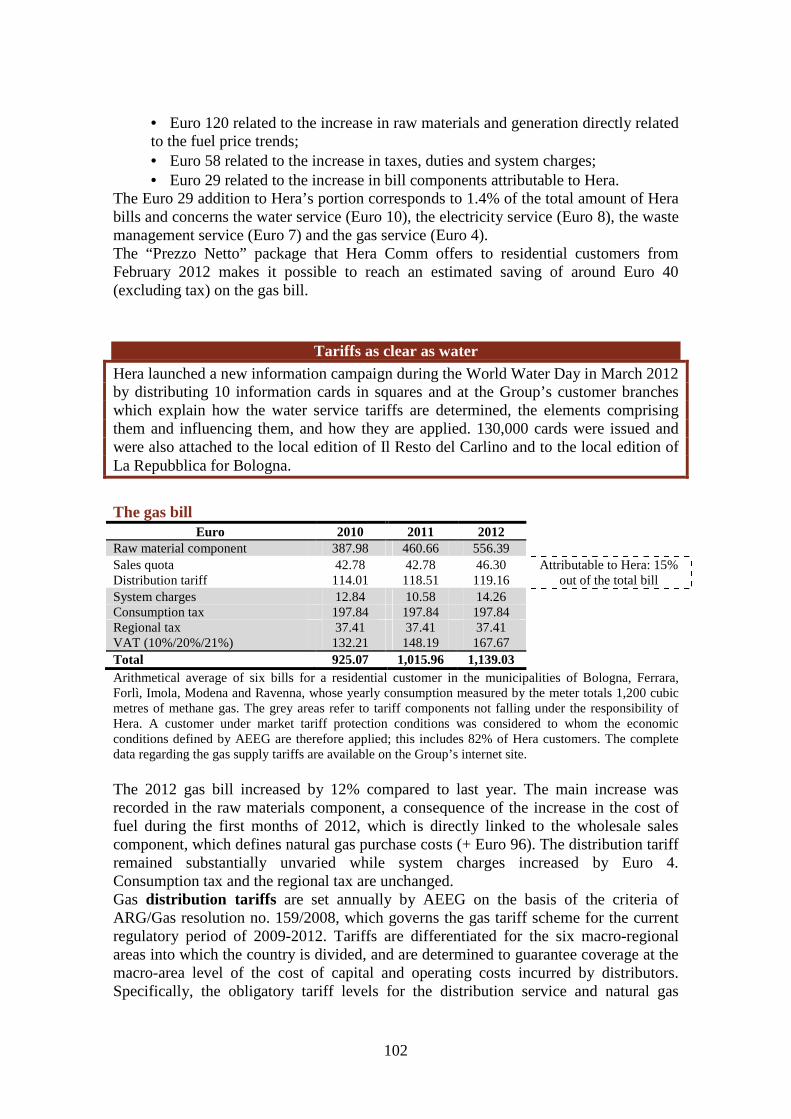
102
• Euro 120 related to the increase in raw materials and generation directly related to the fuel price trends; • Euro 58 related to the increase in taxes, duties and system charges; • Euro 29 related to the increase in bill components attributable to Hera.
The Euro 29 addition to Hera’s portion corresponds to 1.4% of the total amount of Hera bills and concerns the water service (Euro 10), the electricity service (Euro 8), the waste management service (Euro 7) and the gas service (Euro 4). The “Prezzo Netto” package that Hera Comm offers to residential customers from February 2012 makes it possible to reach an estimated saving of around Euro 40 (excluding tax) on the gas bill.
Tariffs as clear as water Hera launched a new information campaign during the World Water Day in March 2012 by distributing 10 information cards in squares and at the Group’s customer branches which explain how the water service tariffs are determined, the elements comprising them and influencing them, and how they are applied. 130,000 cards were issued and were also attached to the local edition of Il Resto del Carlino and to the local edition of La Repubblica for Bologna.
The gas bill Euro 2010 2011 2012
Raw material component 387.98 460.66 556.39 Sales quota 42.78 42.78 46.30 Attributable to Hera: 15%
out of the total bill Distribution tariff 114.01 118.51 119.16 System charges 12.84 10.58 14.26 Consumption tax 197.84 197.84 197.84 Regional tax 37.41 37.41 37.41 VAT (10%/20%/21%) 132.21 148.19 167.67 Total 925.07 1,015.96 1,139.03 Arithmetical average of six bills for a residential customer in the municipalities of Bologna, Ferrara, Forlì, Imola, Modena and Ravenna, whose yearly consumption measured by the meter totals 1,200 cubic metres of methane gas. The grey areas refer to tariff components not falling under the responsibility of Hera. A customer under market tariff protection conditions was considered to whom the economic conditions defined by AEEG are therefore applied; this includes 82% of Hera customers. The complete data regarding the gas supply tariffs are available on the Group’s internet site. The 2012 gas bill increased by 12% compared to last year. The main increase was recorded in the raw materials component, a consequence of the increase in the cost of fuel during the first months of 2012, which is directly linked to the wholesale sales component, which defines natural gas purchase costs (+ Euro 96). The distribution tariff remained substantially unvaried while system charges increased by Euro 4. Consumption tax and the regional tax are unchanged. Gas distribution tariffs are set annually by AEEG on the basis of the criteria of ARG/Gas resolution no. 159/2008, which governs the gas tariff scheme for the current regulatory period of 2009-2012. Tariffs are differentiated for the six macro-regional areas into which the country is divided, and are determined to guarantee coverage at the macro-area level of the cost of capital and operating costs incurred by distributors. Specifically, the obligatory tariff levels for the distribution service and natural gas

103
metering for January-December 2012 were approved by ARG/Gas resolution no. 195/2011. On average, the distribution tariff affected the total bill for 2012 by 10%. Part of the distribution tariff includes components to cover general gas system charges (such as energy saving promotion costs) which the individual distributors treat as contra-items, paying the relative proceeds to the national Adjustment Fund. These bill components are included in the “system charges” item. In 2012, system charges updated by ARG/com resolution no. 201/2011, as updated quarterly, decreased by approximately Euro 4 compared to the previous year. The portion of sales relative to the economic conditions of the supply for the service subject to protections, defined by AEEG, is governed by ARG/gas resolution no. 64/2009. This resolution specifically defines:
• the wholesale component, which is updated on a quarterly basis. During 2011, AEEG started a reform of the economic conditions of natural gas supply for the protected service (implemented by ARG/gas resolution no. 116/2012) which, by transposing the indications laid down in Decree Law no. 1/2012, establishes a gradual modification of the updating formula of this tariff component: starting from April 2012, and for an increasing percentage in the following quarters, it will be linked to the gas costs of the European wholesale market • the components to cover transport and storage costs; • the retail sales component, the value of which was updated for 2012 by ARG/gas resolution no. 200/2011.
The raw materials component is calculated as the wholesale sales components plus the transport and storage components and accounted for an average of 48.8% of the bill total in 2012. Lastly, in 2012, taxes account for an average of 35.4% of the total. These taxes are due to the State and regional local government authorities (consumption tax, additional regional tax and VAT). Taxes are set by specific provisions by the Ministry of the Economy and Finance and the regional government authorities, and vary according to the use of the gas, whether for heating or only for cooking or industrial uses. Beginning in January 2008, VAT is applied at 10% for up to 480 cubic metres per year, and VAT of 20% is applied to amounts over that for bills issued until 16 September 2011, and VAT of 21% is applied for subsequent bills due to the entry into force of the law converting Decree Law no. 138/2011. As an alternative to the protective economic conditions, customers may choose the “Prezzo Netto” offer from the portfolio of Hera Comm’s free market offers. By subscribing to the offer, customers may bind their costs to the gas wholesale market. Subscription to the “Prezzo Netto” offer enables savings of approximately Euro 40 on an annual basis exclusive of the taxes as may be inferred from the comparative sheet of December 2012 which provides a comparison between the estimated annual expenses deriving from the free market offer and the estimated economic supply conditions for the service subject to protection, defined by the AEEG. In fact, before subscribing to Hera Comm’s offer as part of the free market, the domestic customer receives a comparative sheet, set up according to the templates provided by AEEG ARG/com no. resolution no. 104/2010. The comparative sheets are available at Hera Comm’s website.
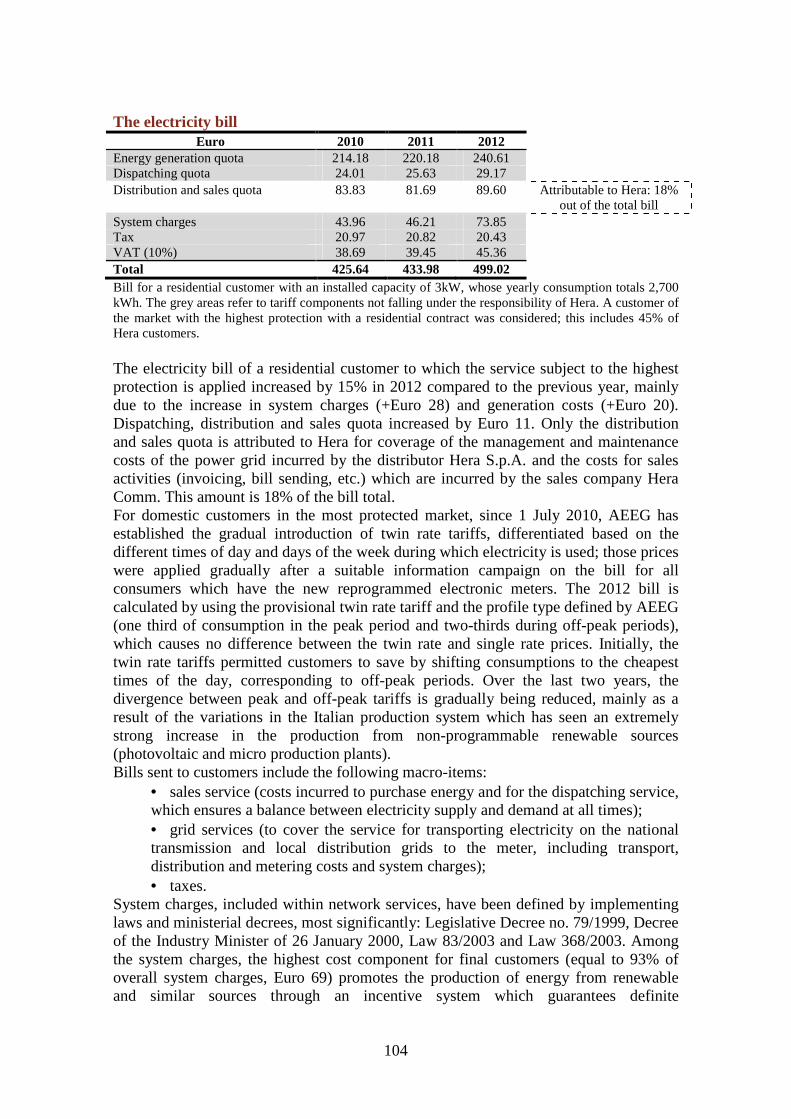
104
The electricity bill Euro 2010 2011 2012
Energy generation quota 214.18 220.18 240.61 Dispatching quota 24.01 25.63 29.17 Distribution and sales quota 83.83 81.69 89.60 Attributable to Hera: 18%
out of the total bill System charges 43.96 46.21 73.85 Tax 20.97 20.82 20.43 VAT (10%) 38.69 39.45 45.36 Total 425.64 433.98 499.02 Bill for a residential customer with an installed capacity of 3kW, whose yearly consumption totals 2,700 kWh. The grey areas refer to tariff components not falling under the responsibility of Hera. A customer of the market with the highest protection with a residential contract was considered; this includes 45% of Hera customers. The electricity bill of a residential customer to which the service subject to the highest protection is applied increased by 15% in 2012 compared to the previous year, mainly due to the increase in system charges (+Euro 28) and generation costs (+Euro 20). Dispatching, distribution and sales quota increased by Euro 11. Only the distribution and sales quota is attributed to Hera for coverage of the management and maintenance costs of the power grid incurred by the distributor Hera S.p.A. and the costs for sales activities (invoicing, bill sending, etc.) which are incurred by the sales company Hera Comm. This amount is 18% of the bill total. For domestic customers in the most protected market, since 1 July 2010, AEEG has established the gradual introduction of twin rate tariffs, differentiated based on the different times of day and days of the week during which electricity is used; those prices were applied gradually after a suitable information campaign on the bill for all consumers which have the new reprogrammed electronic meters. The 2012 bill is calculated by using the provisional twin rate tariff and the profile type defined by AEEG (one third of consumption in the peak period and two-thirds during off-peak periods), which causes no difference between the twin rate and single rate prices. Initially, the twin rate tariffs permitted customers to save by shifting consumptions to the cheapest times of the day, corresponding to off-peak periods. Over the last two years, the divergence between peak and off-peak tariffs is gradually being reduced, mainly as a result of the variations in the Italian production system which has seen an extremely strong increase in the production from non-programmable renewable sources (photovoltaic and micro production plants). Bills sent to customers include the following macro-items:
• sales service (costs incurred to purchase energy and for the dispatching service, which ensures a balance between electricity supply and demand at all times); • grid services (to cover the service for transporting electricity on the national transmission and local distribution grids to the meter, including transport, distribution and metering costs and system charges); • taxes.
System charges, included within network services, have been defined by implementing laws and ministerial decrees, most significantly: Legislative Decree no. 79/1999, Decree of the Industry Minister of 26 January 2000, Law 83/2003 and Law 368/2003. Among the system charges, the highest cost component for final customers (equal to 93% of overall system charges, Euro 69) promotes the production of energy from renewable and similar sources through an incentive system which guarantees definite

105
compensation for the energy produced and special conditions for the connection of the plants to the networks. This component has constantly increased over the past years following the increase in production from renewable sources and the costs for adapting the network to these sources. In addition to the regulated tariffs of the highest protection market, customers can choose amongst the various packages offered by free market suppliers: Hera Comm offers “Prezzo Netto” for residential customers and small companies. By subscribing to this offer, customers can connect their costs to the electricity wholesale market. Before participating in offers introduced by Hera Comm in the free market, the customer receives a sheet summarising the fees, drawn up in the manner defined by AEEG resolution ARG/com no. 104/2010, in which the estimate of annual expenses generated by the offer proposed is compared with the estimate of the annual expense resulting from the economic conditions of the supply for the most protected market, defined by AEEG.
Integrated water services bill Euro 2010 2011 2012
Aqueduct 84.83 87.52 88.61 Attributable to Hera: 91%
out of the total bill Sewage 20.73 21.97 23.66 Purification 56.43 59.87 64.32 Fixed quota 11.91 12.50 15.14 VAT (10%) 17.39 18.19 19.17 Total 191.30 200.04 210.90 Weighted average, on the basis of citizens residing in the municipalities, of seven bills for a household of 3 residents in the municipalities of Bologna, Ferrara, Forlì, Imola, Modena, Ravenna and Rimini whose yearly consumption totals 130 m3 of water. The grey areas refer to tariff components not falling under the responsibility of Hera. The average bill for a residential customer for 130 m3 per year increased from Euro 191.30 in 2010 to Euro 210.90 in 2012, an increase of 5.4% over the last year, and 5.4% in the previous year. From 2005 and up to 2011, the tariffs for the water cycle were set by the Water and Waste Regulatory Authorities (they had previously been defined by the CIPE) with regard to all components relative to the variable water quota, the fixed quota, and sewage and purification quotas. The tariffs applied for 2008-2011 are those resolved by the Waste and Water Regulatory Authorities in accordance with agreements subscribed for the five-year period 2008-2012, in application of the new regional method introduced by the Regional Council President Decree no. 49 of 13 March 2006 (except for the Modena ATO, for which the agreement refers to 2010-2014, the first regulatory period during which Regional Council President Decree no. 49 of 13 March 2006 applies), and the Bologna ATO, for which the agreement refers to 2011-2015). Since 2008, the tariff has also included the costs for management of rainwater for Water and Waste Regulatory Authorities of Bologna, Ferrara, Forlì-Cesena (limited to a small part of the municipality of Cesenatico), Modena, Ravenna and Rimini.
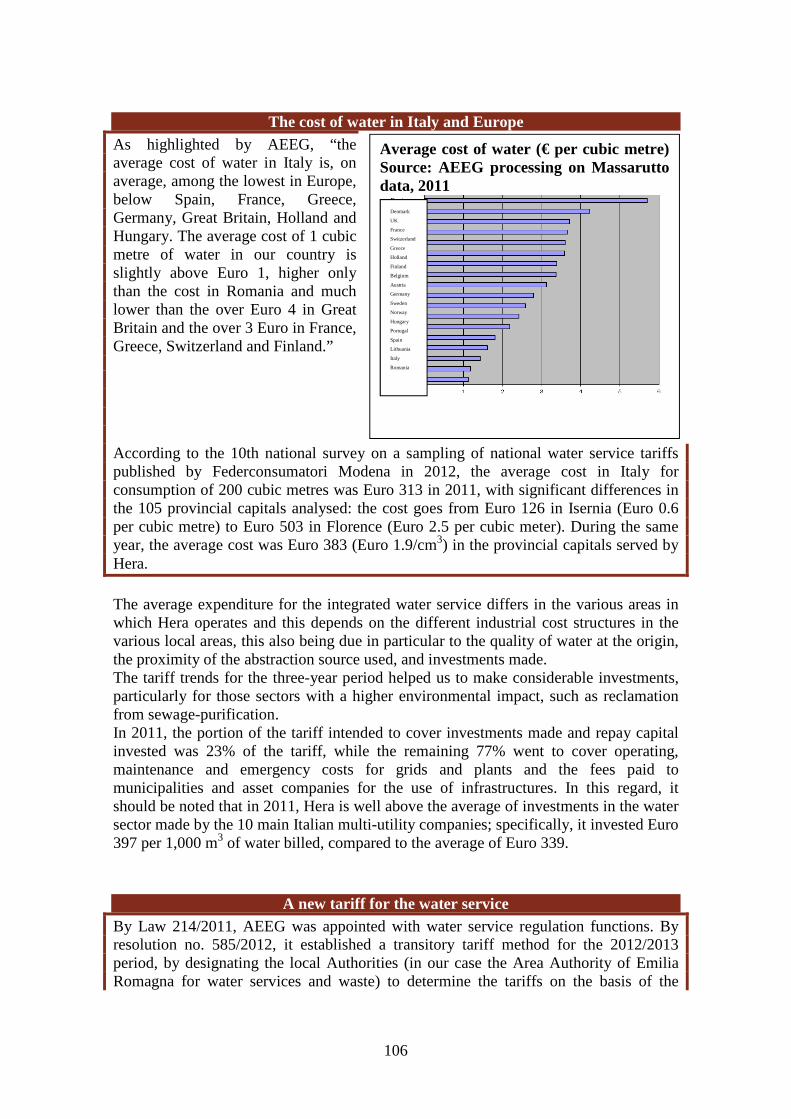
106
The cost of water in Italy and Europe As highlighted by AEEG, “the average cost of water in Italy is, on average, among the lowest in Europe, below Spain, France, Greece, Germany, Great Britain, Holland and Hungary. The average cost of 1 cubic metre of water in our country is slightly above Euro 1, higher only than the cost in Romania and much lower than the over Euro 4 in Great Britain and the over 3 Euro in France, Greece, Switzerland and Finland.” According to the 10th national survey on a sampling of national water service tariffs published by Federconsumatori Modena in 2012, the average cost in Italy for consumption of 200 cubic metres was Euro 313 in 2011, with significant differences in the 105 provincial capitals analysed: the cost goes from Euro 126 in Isernia (Euro 0.6 per cubic metre) to Euro 503 in Florence (Euro 2.5 per cubic meter). During the same year, the average cost was Euro 383 (Euro 1.9/cm3) in the provincial capitals served by Hera.
The average expenditure for the integrated water service differs in the various areas in which Hera operates and this depends on the different industrial cost structures in the various local areas, this also being due in particular to the quality of water at the origin, the proximity of the abstraction source used, and investments made. The tariff trends for the three-year period helped us to make considerable investments, particularly for those sectors with a higher environmental impact, such as reclamation from sewage-purification. In 2011, the portion of the tariff intended to cover investments made and repay capital invested was 23% of the tariff, while the remaining 77% went to cover operating, maintenance and emergency costs for grids and plants and the fees paid to municipalities and asset companies for the use of infrastructures. In this regard, it should be noted that in 2011, Hera is well above the average of investments in the water sector made by the 10 main Italian multi-utility companies; specifically, it invested Euro 397 per 1,000 m3 of water billed, compared to the average of Euro 339.
A new tariff for the water service By Law 214/2011, AEEG was appointed with water service regulation functions. By resolution no. 585/2012, it established a transitory tariff method for the 2012/2013 period, by designating the local Authorities (in our case the Area Authority of Emilia Romagna for water services and waste) to determine the tariffs on the basis of the
Average cost of water (€ per cubic metre) Source: AEEG processing on Massarutto data, 2011
Denmark
UK
France
Switzerland
Greece
Holland
Finland
Belgium
Austria
Germany
Sweden
Norway
Hungary
Portugal
Spain
Lithuania
Italy
Romania

107
approved method. The Authority must establish the 2012/2013 tariffs, on a temporary basis, no later than 31 March 2013, which will be confirmed by AEEG within 30 June 2013. The new tariff method is based on the principle of the full coverage of costs, although providing gradual achievement of the approved tariff. It also establishes a criterion, albeit temporary, of cost-effectiveness by comparison to the area plans approved by the Area Authority. The temporary tariff method also introduces equalising mechanisms and a first approach to the development of investments by providing for the establishment of a dedicated fund. The new tariff method respects the outcome of the referendum and eliminates the return of capital invested from the calculation of the tariff. In compliance with the provisions of EU law, it includes the coverage of operating costs, amortisation, financial charges and taxes. It also establishes principles for improving service quality which will be further developed in the definitive tariff method valid from 2014. Various fulfilments have already been provided for, including the transparency of bills which will become effective from 1 January 2014.
The Italian Ministerial Decree dated 30 September 2009, implementing Law no. 13/2009 regarding customers connected to the sewage network without purified sewage, establishes that if there are no purification plants in place, or if such plants are temporarily off-line, users connected to the sewers do not have to pay the portion of the tariff regarding purification. Nonetheless, charges already incurred and expected for the design and construction of purification plants shall be deduced from the amount to be returned/subjected to the provisions of law. The Ministerial Decree sets the term for returning the tariff component regarding purification at five years. Hera surveyed users connected to the public sewerage network and not connected to treatment plants, and identified the amounts paid by each user for the treatment service, the volumes of water invoiced to them and the relative reference periods and provided this information to all Water and Waste Regulatory Authorities which resolved on the lists and authorised the operator to disburse refunds. Customers can check if they are entitled on the Group’s website. The percentage of users in the areas served by Hera who are connected to the sewer network without purified sewage accounts for 0.5% of the total. In Italy, approximately 17% of users were in this situation in 2007 (Blue Book, Utilitatis, 2009).
Billing for waste management Euro 2010 2011 2012
Fixed quota 78.18 80.21 82.14 Attributable to Hera: 87% out of the total bill Variable quota 109.95 112.41 117.12
Additional province charges 9.41 9.63 9.96 VAT (10%) 18.81 19.26 19.93 Total 216.35 221.52 229.15 Weighted average, on the basis of residing citizens, of six bills for a household of 3 people, resident in the municipalities of Ferrara, Forlì, Imola, Modena, Ravenna, and Rimini, in an apartment measuring 80 m2. The grey areas refer to tariff components not falling under the responsibility of Hera. A household of 3 people, residing in an apartment measuring 80 square metres paid approximately Euro 229 in 2012, an increase of approximately Euro 8 compared to 2011 (3.4%). This average increase was especially influenced by the increased tariffs in
108
the province of Ravenna, an area in which there had been no increases since 2010. Therefore, the upward trend recorded between 2010 and 2011 continues, which is lower than the 4.8% average tariff increase for the urban waste service recorded in Italy in 2012 (national consumer price index for the general public, waste collection, source: Istat). Tariff increases are caused by the need to raise tariffs toward completely covering service costs as laid down in the Ronchi decree. The coverage of costs in 2011 was 94% as resulting from the most recent economic and financial reporting available. The temporary data available for 2012 (to be confirmed after the definitive reporting) is 98%.
The cost of urban hygiene services in Italy The Waste Dossier published in 2012 by the Osservatorio Prezzi e Tariffe di Cittadinanzattiva compares the tariffs for urban hygiene services in various Italian provincial capitals.
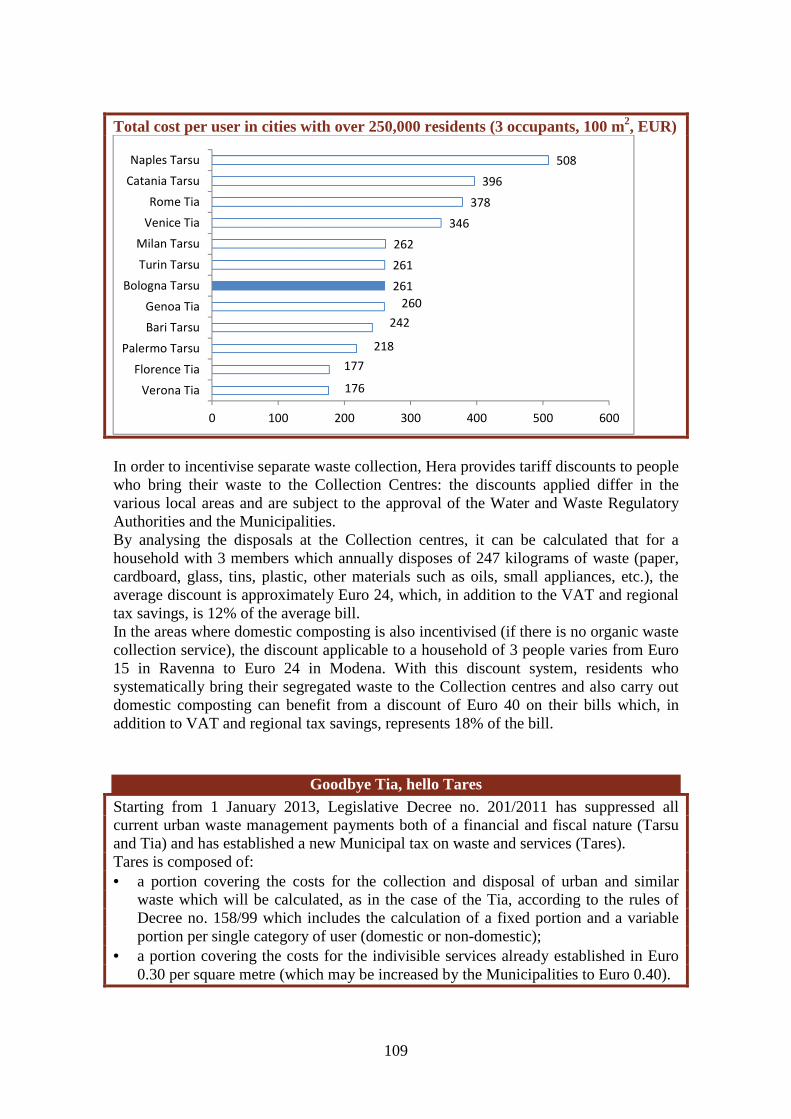
109
Total cost per user in cities with over 250,000 residents (3 occupants, 100 m2, EUR)
In order to incentivise separate waste collection, Hera provides tariff discounts to people who bring their waste to the Collection Centres: the discounts applied differ in the various local areas and are subject to the approval of the Water and Waste Regulatory Authorities and the Municipalities. By analysing the disposals at the Collection centres, it can be calculated that for a household with 3 members which annually disposes of 247 kilograms of waste (paper, cardboard, glass, tins, plastic, other materials such as oils, small appliances, etc.), the average discount is approximately Euro 24, which, in addition to the VAT and regional tax savings, is 12% of the average bill. In the areas where domestic composting is also incentivised (if there is no organic waste collection service), the discount applicable to a household of 3 people varies from Euro 15 in Ravenna to Euro 24 in Modena. With this discount system, residents who systematically bring their segregated waste to the Collection centres and also carry out domestic composting can benefit from a discount of Euro 40 on their bills which, in addition to VAT and regional tax savings, represents 18% of the bill.
Goodbye Tia, hello Tares Starting from 1 January 2013, Legislative Decree no. 201/2011 has suppressed all current urban waste management payments both of a financial and fiscal nature (Tarsu and Tia) and has established a new Municipal tax on waste and services (Tares). Tares is composed of: • a portion covering the costs for the collection and disposal of urban and similar
waste which will be calculated, as in the case of the Tia, according to the rules of Decree no. 158/99 which includes the calculation of a fixed portion and a variable portion per single category of user (domestic or non-domestic);
• a portion covering the costs for the indivisible services already established in Euro 0.30 per square metre (which may be increased by the Municipalities to Euro 0.40).
176
177
218
242
260
261
261
262
346
378
396
508
0 100 200 300 400 500 600
Verona Tia
Florence Tia
Palermo Tarsu
Bari Tarsu
Genoa Tia
Bologna Tarsu
Turin Tarsu
Milan Tarsu
Venice Tia
Rome Tia
Catania Tarsu
Naples Tarsu
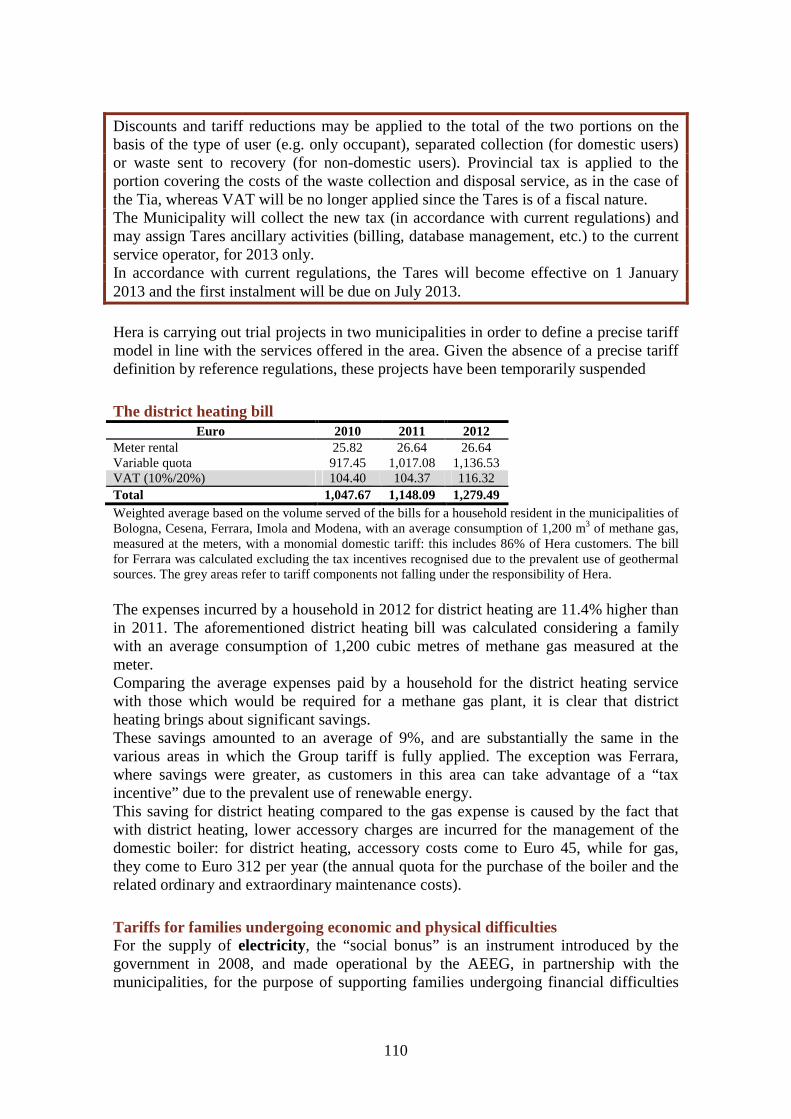
110
Discounts and tariff reductions may be applied to the total of the two portions on the basis of the type of user (e.g. only occupant), separated collection (for domestic users) or waste sent to recovery (for non-domestic users). Provincial tax is applied to the portion covering the costs of the waste collection and disposal service, as in the case of the Tia, whereas VAT will be no longer applied since the Tares is of a fiscal nature. The Municipality will collect the new tax (in accordance with current regulations) and may assign Tares ancillary activities (billing, database management, etc.) to the current service operator, for 2013 only. In accordance with current regulations, the Tares will become effective on 1 January 2013 and the first instalment will be due on July 2013.
Hera is carrying out trial projects in two municipalities in order to define a precise tariff model in line with the services offered in the area. Given the absence of a precise tariff definition by reference regulations, these projects have been temporarily suspended
The district heating bill Euro 2010 2011 2012
Meter rental 25.82 26.64 26.64 Variable quota 917.45 1,017.08 1,136.53 VAT (10%/20%) 104.40 104.37 116.32 Total 1,047.67 1,148.09 1,279.49 Weighted average based on the volume served of the bills for a household resident in the municipalities of Bologna, Cesena, Ferrara, Imola and Modena, with an average consumption of 1,200 m3 of methane gas, measured at the meters, with a monomial domestic tariff: this includes 86% of Hera customers. The bill for Ferrara was calculated excluding the tax incentives recognised due to the prevalent use of geothermal sources. The grey areas refer to tariff components not falling under the responsibility of Hera. The expenses incurred by a household in 2012 for district heating are 11.4% higher than in 2011. The aforementioned district heating bill was calculated considering a family with an average consumption of 1,200 cubic metres of methane gas measured at the meter. Comparing the average expenses paid by a household for the district heating service with those which would be required for a methane gas plant, it is clear that district heating brings about significant savings. These savings amounted to an average of 9%, and are substantially the same in the various areas in which the Group tariff is fully applied. The exception was Ferrara, where savings were greater, as customers in this area can take advantage of a “tax incentive” due to the prevalent use of renewable energy. This saving for district heating compared to the gas expense is caused by the fact that with district heating, lower accessory charges are incurred for the management of the domestic boiler: for district heating, accessory costs come to Euro 45, while for gas, they come to Euro 312 per year (the annual quota for the purchase of the boiler and the related ordinary and extraordinary maintenance costs).
Tariffs for families undergoing economic and physical difficulties For the supply of electricity, the “social bonus” is an instrument introduced by the government in 2008, and made operational by the AEEG, in partnership with the municipalities, for the purpose of supporting families undergoing financial difficulties

111
and large families, guaranteeing savings on their electricity expenses. The electricity bonus is also provided for persons with physical difficulties, meaning cases of serious illnesses which require the use of electronic medical devices which are crucial for keeping the patient alive. For families undergoing financial difficulties and large families, the bonus provides savings ranging from a minimum of Euro 63 to a maximum of Euro 139 (Euro 155 for the seriously ill). The amount is differentiated based on the number of members of the family. From 2013, the electricity bonus provided for persons with physical difficulties will no longer be defined on a fixed basis but will be linked to the level of consumption and to the number of electronic medical devices present, with the possibility to obtain retroactive recognition of the new mechanism. Also for gas, the “social bonus” provides a reduction in bills for low-income families and large families. The bonus was introduced by the government in 2009 and made operational by the AEEG, also in this case in partnership with the municipalities. The bonus exclusively applies to natural gas distributed through the network (and not to gas in cylinders or LPG) and to consumption in the user’s residence. The bonus can be requested by all domestic customers who use natural gas with a direct supply contract or through a condominium plant. The bonus is determined each year by the Authority in order to provide savings ranging from a minimum of Euro 35 to a maximum of Euro 318. In 2011, the gas and electricity bonuses issued to Hera Comm customers amounted to 43,001 (32,540 in 2010) for overall Euro 3.6 million.
The district heating social bonus For the third year, Hera has voluntarily introduced a bonus to offset expenses for the district heating service, to be applied with the same procedures as those used to apply the offset to gas and electricity service expenses. The bonus varies from Euro 86 to Euro 160 per year, based on the number of household members and the climatic area. 863 applications were submitted in 2012 (815 in the previous year) amounting to Euro 123 thousand.
For the water service, the tariffs set by the Water and Waste Regulatory Authorities of Modena (only in municipalities where the per capita tariff is not applied), Pesaro-Urbino, Ravenna and Rimini envisage a tariff for “domestic use by large families” with reductions for families with more than six members (and with more than 3 members for the Modena Area). The Water and Waste Regulatory Authorities of Ferrara, Modena, Rimini and Forlì-Cesena (only in some municipalities) have also provided incentives for disadvantaged families with ISEE (Equivalent economic status indicator) income below the thresholds set forth by the various municipalities, in accordance with requirements set forth in the implementing regulations. The amount of incentives granted in 2012 amounted to Euro 887 thousand.
The per capita tariff rewards water savings In some municipalities in the provinces of Bologna, Modena and Ravenna, the Water and Waste Regulatory Authorities have introduced a tariff for domestic uses, which takes into account the number of household members (per capita tariff) to incentivise water savings and facilitate large households.
112
With the per capita tariff, the bill is calculated taking into consideration the number of household members: tariffs are favourable for low levels of consumption, while they are penalising for consumption exceeding the amount set for each person based on the savings objectives of the Water Protection Plan of the Emilia-Romagna region (a base supply of 150 litres per day per inhabitant was set, so, 55 cubic metres per year). The per capita supply, as well as the consumption brackets, vary based on the number of persons in the household, thereby facilitating large households which necessarily have a higher consumption. The per capita tariff is applied only to domestic users and, in 2012, it was applied in 50 municipalities located in the provinces of Bologna (including Bologna), in 16 municipalities of Modena (including Modena) and in one municipality in the province of Ravenna. 50% of the population served by Hera resides in these municipalities.
Regarding waste management services, Hera applies social tariff reductions in favour of parties who are experiencing serious social/assistance difficulties, who can be recognised as totally or partially exempt from the TIA payment. Funds have been allocated for this purpose by the Municipalities, and they may be paid directly to the parties concerned, identified based on income. Coverage of the collected amounts connected to the bills of these households is in any case paid to the Operator. From year to year, the municipalities resolve on the above funds in order to include them within the financial plans to cover service costs. Furthermore, in some areas the tariff can be reduced in favour of domestic users with one individual disabled household member, or with a degree of permanent invalidity of over 60%. Hera allows customers faced with financial difficulties to pay their bills in instalments. Usually, three monthly instalments are allowed, which can be increased up to nine in some cases of financial hardship (registration of the customer in the workers’ mobility lists reported by social services). The interest rate applied to the instalment amount is the official reference rate of the European Central Bank (equal to 0.75% at the end of 2012), increased by 3.5%: with the exception of amounts relating to the TIA tariff, for which the legal rate defined through ministerial decree is applied (2.5% in 2012). The AEEG established that for adjustment bills of significant amounts with respect to the estimated bills, customers can request to pay in instalments: in this case, the official reference interest rate of the European Central Bank is applicable. Throughout 2012, approximately 126,000 instalment plans were applied for residential customers, an increase of roughly 41% compared to the previous year (+35% in terms of value divided into instalments). Even the number of instalment plans implemented for business customers rose by 42% (approximately 8,300), with an increase of 26% in the overall value compared to 2011. The agreements involve possible suspension of service if the bill is not paid. In these cases, the procedure involves sending a first reminder approximately 20 days after the bill’s expiry (only for debts of up to Euro 250) and a subsequent reminder (after an additional 20 days) by registered mail, which informs the customer that the service is at risk of suspension. If payment is not made, the supply is suspended, on average three months after the bill expires. The customer may request to pay the bill in instalments throughout this period. If the suspension involves condominium users, it is customary to inform the residents individually before the service is suspended. For the supply of
113
water, Hera limits or suspends the supply in compliance with the provisions of the Integrated Water Service Charter and regulations in force in the various ATOs.
Benefits for unemployed and laid off customers extended for the third year Hera decided to extend for the third consecutive year the benefits already set forth for these customer categories, which were set to expire on June 2012. The benefits introduced in 2010 also incorporated a request made by trade unions and local authorities, and were founded on the basis of the desire to contribute in a practical manner to facing the criticalities generated by the economic and financial crisis. The benefit consists of granting 6 months of instalment payments without interest for bills for all services provided between 1 July 2012 and 30 June 2013, or the extension of the payment due date, and is intended for customers who are taking advantage of the extraordinary temporary lay-off fund, in mobility or dismissed for unjust reasons.
Service quality
Electricity and gas Regulation of quality divides the standards to be met into “general” and “specific”. Failure to meet the latter due to causes attributable to Hera requires the payment of indemnities to customers or to the sales company requiring technical data from the distributor, which may vary depending on the type of supply (low or medium voltage for electricity, the meter category for gas), the delay in executing the service and the times required for compensation. The automatic compensation varies from Euro 20 to Euro 140 based on the type of supply, and can increase based on the delay in the provision of service or the fulfilment times. Among the specific quality standards for the distribution service, we note the time limits for executing works, activating supply, and the failure to comply with the punctuality bracket for appointments scheduled with customers (ARG/gas resolution no. 120/2008). For sales, the standards monitored are compliance with the time limits for adjusting bills and claim response time (Consolidated Regulations on the Quality of Electricity and Natural Gas Sales Service).
Water and waste management When managing the integrated water service and the urban waste management service, the operator is committed to complying with specific minimum quality standards set forth in the Service Charter. The Service charter is drawn up on the basis of a reference template prepared by the Water and Waste Regulatory Authorities and annexed to signed agreements. The water service charters have been applied for all provinces since 2011, including that of Modena, although it has not yet been approved. The approved service charters were presented to the consumer associations and made available at branches and on the website, following a notification regarding their approval provided in the bill. The Waste Management Services Charter has only been approved by the Water and Waste Regulatory Authorities of Ferrara.
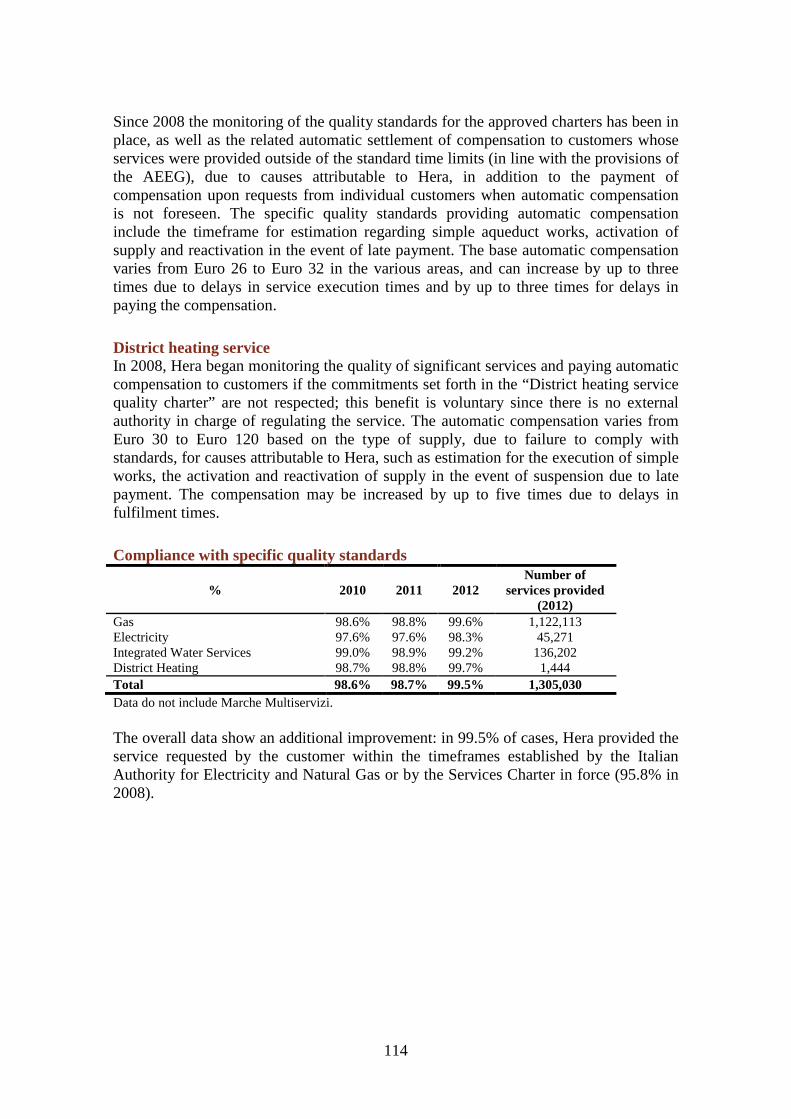
114
Since 2008 the monitoring of the quality standards for the approved charters has been in place, as well as the related automatic settlement of compensation to customers whose services were provided outside of the standard time limits (in line with the provisions of the AEEG), due to causes attributable to Hera, in addition to the payment of compensation upon requests from individual customers when automatic compensation is not foreseen. The specific quality standards providing automatic compensation include the timeframe for estimation regarding simple aqueduct works, activation of supply and reactivation in the event of late payment. The base automatic compensation varies from Euro 26 to Euro 32 in the various areas, and can increase by up to three times due to delays in service execution times and by up to three times for delays in paying the compensation.
District heating service In 2008, Hera began monitoring the quality of significant services and paying automatic compensation to customers if the commitments set forth in the “District heating service quality charter” are not respected; this benefit is voluntary since there is no external authority in charge of regulating the service. The automatic compensation varies from Euro 30 to Euro 120 based on the type of supply, due to failure to comply with standards, for causes attributable to Hera, such as estimation for the execution of simple works, the activation and reactivation of supply in the event of suspension due to late payment. The compensation may be increased by up to five times due to delays in fulfilment times.
Compliance with specific quality standards
% 2010 2011 2012 Number of
services provided (2012)
Gas 98.6% 98.8% 99.6% 1,122,113 Electricity 97.6% 97.6% 98.3% 45,271 Integrated Water Services 99.0% 98.9% 99.2% 136,202 District Heating 98.7% 98.8% 99.7% 1,444 Total 98.6% 98.7% 99.5% 1,305,030 Data do not include Marche Multiservizi. The overall data show an additional improvement: in 99.5% of cases, Hera provided the service requested by the customer within the timeframes established by the Italian Authority for Electricity and Natural Gas or by the Services Charter in force (95.8% in 2008).
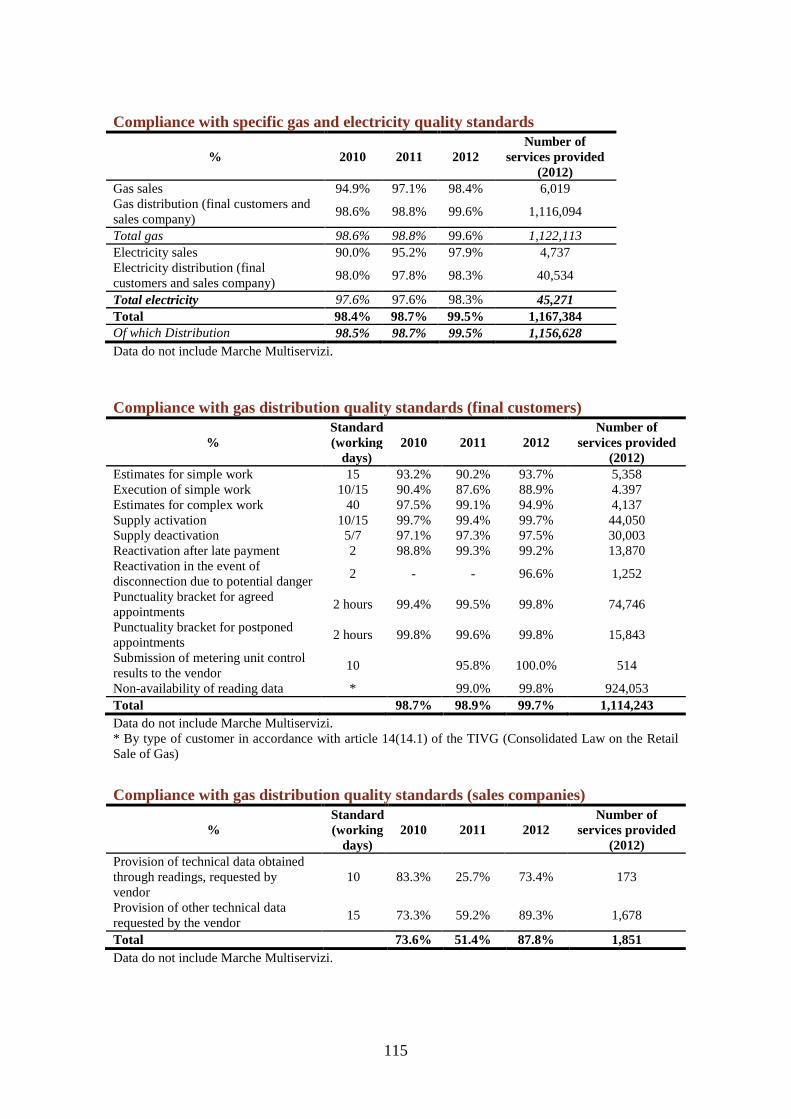
115
Compliance with specific gas and electricity quality standards
% 2010 2011 2012 Number of
services provided (2012)
Gas sales 94.9% 97.1% 98.4% 6,019 Gas distribution (final customers and sales company)
98.6% 98.8% 99.6% 1,116,094
Total gas 98.6% 98.8% 99.6% 1,122,113 Electricity sales 90.0% 95.2% 97.9% 4,737 Electricity distribution (final customers and sales company)
98.0% 97.8% 98.3% 40,534
Total electricity 97.6% 97.6% 98.3% 45,271 Total 98.4% 98.7% 99.5% 1,167,384 Of which Distribution 98.5% 98.7% 99.5% 1,156,628 Data do not include Marche Multiservizi.
Compliance with gas distribution quality standards (final customers)
% Standard (working
days) 2010 2011 2012
Number of services provided
(2012) Estimates for simple work 15 93.2% 90.2% 93.7% 5,358 Execution of simple work 10/15 90.4% 87.6% 88.9% 4.397 Estimates for complex work 40 97.5% 99.1% 94.9% 4,137 Supply activation 10/15 99.7% 99.4% 99.7% 44,050 Supply deactivation 5/7 97.1% 97.3% 97.5% 30,003 Reactivation after late payment 2 98.8% 99.3% 99.2% 13,870 Reactivation in the event of disconnection due to potential danger
2 - - 96.6% 1,252
Punctuality bracket for agreed appointments
2 hours 99.4% 99.5% 99.8% 74,746
Punctuality bracket for postponed appointments
2 hours 99.8% 99.6% 99.8% 15,843
Submission of metering unit control results to the vendor
10 95.8% 100.0% 514
Non-availability of reading data * 99.0% 99.8% 924,053 Total 98.7% 98.9% 99.7% 1,114,243 Data do not include Marche Multiservizi. * By type of customer in accordance with article 14(14.1) of the TIVG (Consolidated Law on the Retail Sale of Gas)
Compliance with gas distribution quality standards (sales companies)
% Standard (working
days) 2010 2011 2012
Number of services provided
(2012) Provision of technical data obtained through readings, requested by vendor
10 83.3% 25.7% 73.4% 173
Provision of other technical data requested by the vendor
15 73.3% 59.2% 89.3% 1,678
Total 73.6% 51.4% 87.8% 1,851 Data do not include Marche Multiservizi.

116
Compliance with electricity distribution quality standards (final customers)
% Standard (working
days) 2010 2011 2012
Number of services provided
(2012) Supply estimate 20 96.4% 95.9% 99.2% 1,595 Execution of simple work 15/30 96.4% 97.8% 98.9% 1,321 Supply activation 5 97.2% 96.9% 97.8% 10,013 Supply deactivation 5/7 98.2% 98.0% 98.6% 7,591 Control of metering unit 15 86.8% 87.2% 82.3% 62 Voltage control 30 100.0% 33.3% 16.7% 6 Supply reactivation following suspension due to late payment
1 97.5% 96.8% 97.3% 6,840
Punctuality bracket for agreed appointments
2 hours 98.9% 98.7% 99.3% 2,594
Punctuality bracket for postponed appointments
2 hours 99.1% 99.4% 99.4% 9,526
Supply recovery following metering unit malfunction
3/4 hours 98.2% 96.4% 99.2% 485
Total 98.0% 97.8% 98.4% 40,033 Data do not include Marche Multiservizi.
Compliance with specific electricity distribution quality standards
% Standard (working
days)
2010 2011 2012
Number of services provided
(2012) Provision of technical data obtained through readings, requested by vendor
10
- 80.6% 87.5% 24
Provision of other technical data requested by the vendor
15
62.5% 96.0% 96.2% 479
Total 62.5% 94.8% 95.7% 503 Data do not include Marche Multiservizi.
Compliance with specific gas and electricity sale quality standards
% Standard (working
days) 2010 2011 2012
Number of services provided
(2012) Response to claims 40 93.7% 96.8% 98.1% 9,368 Billing adjustments 90 93.1% 99.5% 98.6% 1,242 Double billing adjustments 20 60.2% 63.0% 89.7% 146 Total 93.0% 96.3% 98.2% 10,756 Data do not include Marche Multiservizi.
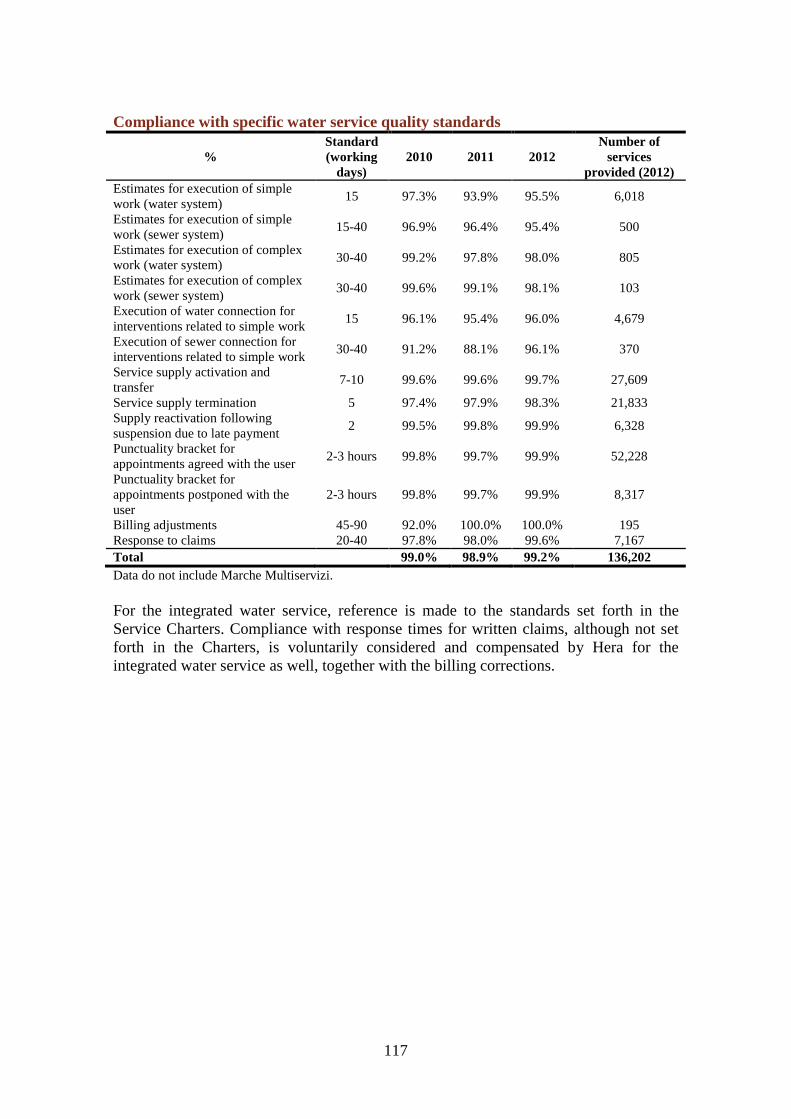
117
Compliance with specific water service quality standards
% Standard (working
days) 2010 2011 2012
Number of services
provided (2012) Estimates for execution of simple work (water system)
15 97.3% 93.9% 95.5% 6,018
Estimates for execution of simple work (sewer system)
15-40 96.9% 96.4% 95.4% 500
Estimates for execution of complex work (water system)
30-40 99.2% 97.8% 98.0% 805
Estimates for execution of complex work (sewer system)
30-40 99.6% 99.1% 98.1% 103
Execution of water connection for interventions related to simple work
15 96.1% 95.4% 96.0% 4,679
Execution of sewer connection for interventions related to simple work
30-40 91.2% 88.1% 96.1% 370
Service supply activation and transfer
7-10 99.6% 99.6% 99.7% 27,609
Service supply termination 5 97.4% 97.9% 98.3% 21,833 Supply reactivation following suspension due to late payment
2 99.5% 99.8% 99.9% 6,328
Punctuality bracket for appointments agreed with the user
2-3 hours 99.8% 99.7% 99.9% 52,228
Punctuality bracket for appointments postponed with the user
2-3 hours 99.8% 99.7% 99.9% 8,317
Billing adjustments 45-90 92.0% 100.0% 100.0% 195 Response to claims 20-40 97.8% 98.0% 99.6% 7,167 Total 99.0% 98.9% 99.2% 136,202 Data do not include Marche Multiservizi. For the integrated water service, reference is made to the standards set forth in the Service Charters. Compliance with response times for written claims, although not set forth in the Charters, is voluntarily considered and compensated by Hera for the integrated water service as well, together with the billing corrections.
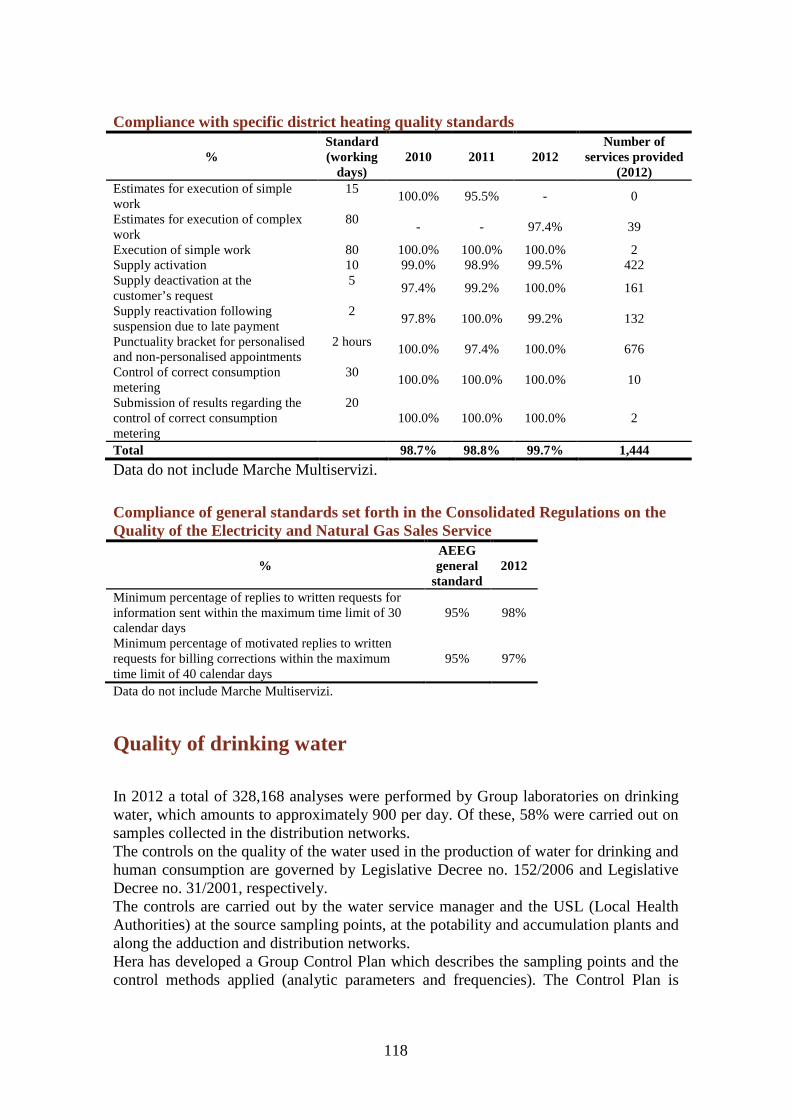
118
Compliance with specific district heating quality standards
% Standard (working
days) 2010 2011 2012
Number of services provided
(2012) Estimates for execution of simple work
15 100.0% 95.5% - 0
Estimates for execution of complex work
80 - - 97.4% 39
Execution of simple work 80 100.0% 100.0% 100.0% 2 Supply activation 10 99.0% 98.9% 99.5% 422 Supply deactivation at the customer’s request
5 97.4% 99.2% 100.0% 161
Supply reactivation following suspension due to late payment
2 97.8% 100.0% 99.2% 132
Punctuality bracket for personalised and non-personalised appointments
2 hours 100.0% 97.4% 100.0% 676
Control of correct consumption metering
30 100.0% 100.0% 100.0% 10
Submission of results regarding the control of correct consumption metering
20 100.0% 100.0% 100.0% 2
Total 98.7% 98.8% 99.7% 1,444
Data do not include Marche Multiservizi.
Compliance of general standards set forth in the Consolidated Regulations on the Quality of the Electricity and Natural Gas Sales Service
% AEEG general
standard 2012
Minimum percentage of replies to written requests for information sent within the maximum time limit of 30 calendar days
95% 98%
Minimum percentage of motivated replies to written requests for billing corrections within the maximum time limit of 40 calendar days
95% 97%
Data do not include Marche Multiservizi.
Quality of drinking water
In 2012 a total of 328,168 analyses were performed by Group laboratories on drinking water, which amounts to approximately 900 per day. Of these, 58% were carried out on samples collected in the distribution networks. The controls on the quality of the water used in the production of water for drinking and human consumption are governed by Legislative Decree no. 152/2006 and Legislative Decree no. 31/2001, respectively. The controls are carried out by the water service manager and the USL (Local Health Authorities) at the source sampling points, at the potability and accumulation plants and along the adduction and distribution networks. Hera has developed a Group Control Plan which describes the sampling points and the control methods applied (analytic parameters and frequencies). The Control Plan is
119
developed on the basis of guidelines focusing on the water’s chemical, physical and bacteriological characteristics, to protect full compliance with legal requirements and ensure an excellent quality product.
How much does water cost? Consuming tap water instead of mineral water, other than benefiting the environment, also provides economic savings: considering an average yearly consumption level of 1,000 litres for a family of three, and an average price in Italy of 35 cents per litre for certain commercially distributed mineral waters, the yearly expenditure for mineral water totals approx. Euro 350. By contrast, yearly expenditure for the same quantity of mains water comes to only Euro 1.7. Italy is at the first place in Europe with 188 litres of water consumed per capita in 2011 (Source: Beverfood 2011) ahead of Germany with 170 litres consumed per capita.
Water quality also means controlling the effectiveness of the treatment process. For example, chlorides and trihalomethanes are searched for, which result, respectively, from the use of chlorine dioxide and sodium hypochlorite as disinfectants. The concentration of chloride and trihalomethanes in the distribution network is constantly kept under control within the legal limits. Beginning in 2008, the average data recorded for the pH, total hardness, dry solids at 180°, chloride, fluoride, sodium, nitrate ion, nitrite and ammonium are made public every six months via publication on the Group’s website, listed by individual municipality. From the first half of 2012, this set of parameters has been extended to further four: calcium, magnesium, sulphates and total alkalinity. These parameters show the quality of the drinking water distributed and can be compared to the quality of the bottled water available for sale. Since January 2009, all of the drinking water production plants in Romagna have been managed by Romagna Acque - Società delle Fonti, the company established for this purpose by the local Romagna administrations. So, the water distributed in the areas of Forlì-Cesena, Ravenna and Rimini is purchased wholesale by that company, and Hera’s involvement in quality is limited to managing the supplementary disinfection stations along the distribution networks.
The quality of water now on the bill The tap water label will be available on Hera’s bill from 15 September 2012. Customers will find data (updated every 6 months) on the quality of the water distributed by Hera in their municipality directly on their bill. This service regards 170 municipalities (with the exclusion of those managed by Marche Multiservizi) in which Hera manages the water distribution service and includes the values of 13 water quality parameters compared with legally established limits (total alkalinity, ammonium, calcium, chlorides, pH, hardness, fluorides, magnesium, nitrates, nitrites, dry solids at 180°C, sodium and sulphates). Alongside the data, a message reminds customers that tap water is good, safe and better for the environment, and allows them to save Euro 300 per year.
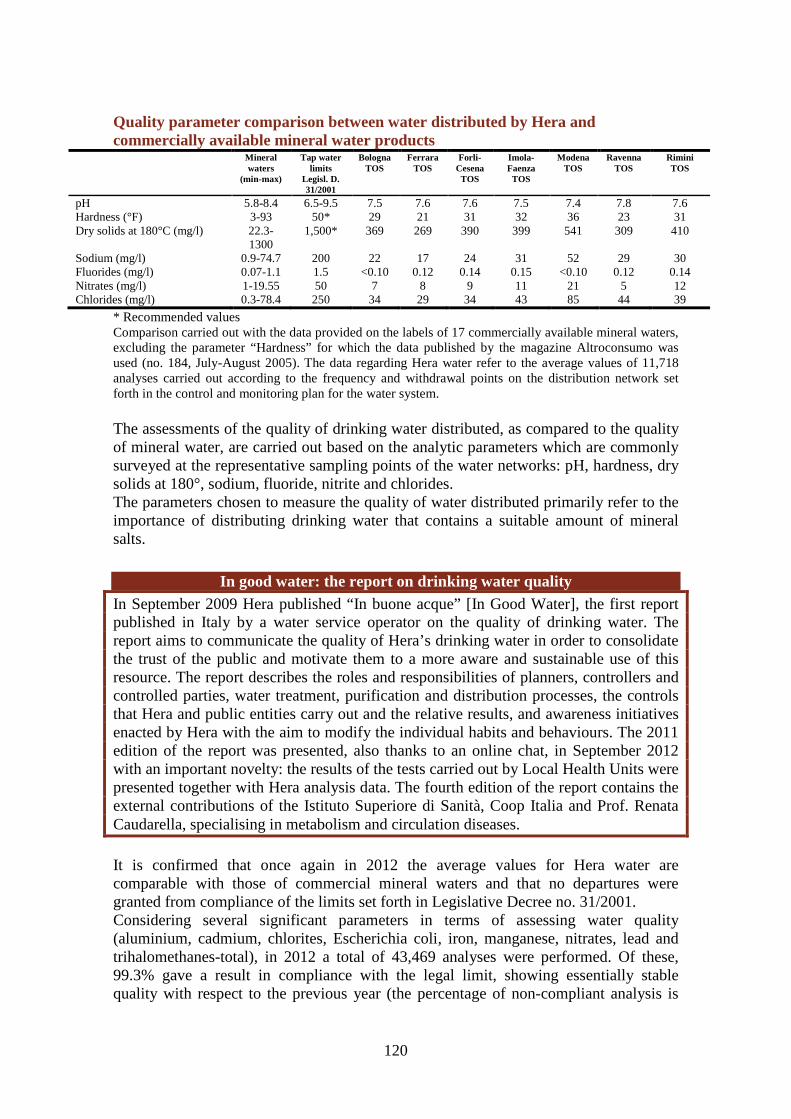
120
Quality parameter comparison between water distributed by Hera and commercially available mineral water products
Mineral waters
(min-max)
Tap water limits
Legisl. D. 31/2001
Bologna TOS
Ferrara TOS
Forli-Cesena TOS
Imola-Faenza TOS
Modena TOS
Ravenna TOS
Rimini TOS
pH 5.8-8.4 6.5-9.5 7.5 7.6 7.6 7.5 7.4 7.8 7.6 Hardness (°F) 3-93 50* 29 21 31 32 36 23 31 Dry solids at 180°C (mg/l) 22.3-
1300 1,500* 369 269 390 399 541 309 410
Sodium (mg/l) 0.9-74.7 200 22 17 24 31 52 29 30 Fluorides (mg/l) 0.07-1.1 1.5 <0.10 0.12 0.14 0.15 <0.10 0.12 0.14 Nitrates (mg/l) 1-19.55 50 7 8 9 11 21 5 12 Chlorides (mg/l) 0.3-78.4 250 34 29 34 43 85 44 39
* Recommended values Comparison carried out with the data provided on the labels of 17 commercially available mineral waters, excluding the parameter “Hardness” for which the data published by the magazine Altroconsumo was used (no. 184, July-August 2005). The data regarding Hera water refer to the average values of 11,718 analyses carried out according to the frequency and withdrawal points on the distribution network set forth in the control and monitoring plan for the water system. The assessments of the quality of drinking water distributed, as compared to the quality of mineral water, are carried out based on the analytic parameters which are commonly surveyed at the representative sampling points of the water networks: pH, hardness, dry solids at 180°, sodium, fluoride, nitrite and chlorides. The parameters chosen to measure the quality of water distributed primarily refer to the importance of distributing drinking water that contains a suitable amount of mineral salts.
In good water: the report on drinking water quality In September 2009 Hera published “In buone acque” [In Good Water], the first report published in Italy by a water service operator on the quality of drinking water. The report aims to communicate the quality of Hera’s drinking water in order to consolidate the trust of the public and motivate them to a more aware and sustainable use of this resource. The report describes the roles and responsibilities of planners, controllers and controlled parties, water treatment, purification and distribution processes, the controls that Hera and public entities carry out and the relative results, and awareness initiatives enacted by Hera with the aim to modify the individual habits and behaviours. The 2011 edition of the report was presented, also thanks to an online chat, in September 2012 with an important novelty: the results of the tests carried out by Local Health Units were presented together with Hera analysis data. The fourth edition of the report contains the external contributions of the Istituto Superiore di Sanità, Coop Italia and Prof. Renata Caudarella, specialising in metabolism and circulation diseases.
It is confirmed that once again in 2012 the average values for Hera water are comparable with those of commercial mineral waters and that no departures were granted from compliance of the limits set forth in Legislative Decree no. 31/2001. Considering several significant parameters in terms of assessing water quality (aluminium, cadmium, chlorites, Escherichia coli, iron, manganese, nitrates, lead and trihalomethanes-total), in 2012 a total of 43,469 analyses were performed. Of these, 99.3% gave a result in compliance with the legal limit, showing essentially stable quality with respect to the previous year (the percentage of non-compliant analysis is
121
calculated through the percentage ratio between the number of compliant analyses, that is, analyses with all parameters in compliance with the limits set forth in Legislative Decree no. 31/2001, and the total number of analyses). In cases where even one parameter falls within non-compliant levels, Hera immediately carries out interventions to return to compliant levels (washing of pipes, controlling disinfection, etc.) also based on the indications of the Local Health Authorities. Compared to 2011, a slight worsening of the aluminium indicator is reported in the Imola-Faenza area, related to the temporary plant adaptation phase of the aqueduct that collects water from the Bubano basins, aimed at improving the clariflocculation process. For hygienic, health and public safety reasons, the Municipality may issue an ordinance declaring that the water is not drinkable during specific periods of time, when the service will be interrupted. In these cases, it will be prohibited to use water for cooking and drinking, or particular precautions will need to be adopted (e.g., boiling), while as a rule the water can continue to be used for all other purposes. During 2012, 35 ordinances referring to unsuitable drinking water were issued by mayors, which referred to small networks servicing a very low number of users. Thirty of these regarded the municipalities of Alta Valmarecchia (Rimini) with causes attributable to the exceptional snowfall in February 2012 which deteriorated the quality of supply sources and made the functioning of the disinfection plants extremely difficult. Three ordinances (against five in 2011) regarded the municipality of Pievepelago (MO), for which the integrated water service was assigned to Hera in 2011; the inherited plant situation was rather precarious and structural work was carried out in order to guarantee a higher level of quality and reliability.
The Hera Group Laboratory System Analysis is carried out through the Hera Group Laboratory System which consists of two major laboratories, located in Bologna and Forlì, and seven logistics units for sampling that are located throughout the region and are in close contact with the water purification and waste water treatment plants. The Group Laboratory System covers 5,000 square metres of structures, while over 1 million 200 thousand calculations were carried out in 2012, which is approximately 3,000 per day, by 80 technicians. The two laboratories comprise an ACCREDIA accredited “multi-site” laboratory that complies with the UNI EN ISO/IEC 17025:2005 standard. The Bologna laboratory, dedicated to analysing drinking water, waste water and microbiological analyses is recognised by the Ministry of Education, Universities and Research as a research laboratory and is equipped with highly specialised equipment that is able to carry out research of micro pollutants such as endocrine interference agents: this is the first laboratory in Italy to have accredited those parameters, including PFOA and PFOS parameters. The Forlì laboratory, where analyses are carried out on solid waste, sludges, atmospheric emissions and organic micro pollutants, is one of the most advanced facilities in Europe: it is equipped with highly automated, sensitive and accurate equipment, including a mass spectrometer that uses a magnetic sector, an instrument with a very high resolution that is able to analyse organic micro-pollutants such as dioxins, furans and PCB.

122
As regards water analyses, the Group’s Laboratory System has set up a specific sample transport service, which is ISO 9001 certified and operates 7 days per week, in order to transport samples located throughout the area to the Bologna laboratory. The means of transport are extremely suitable to storing the samples withdrawn (refrigeration and recording of transport temperatures), demonstrating the fact that the amount and quality of controls do not depend on the physical place where the analysis is carried out if the correct sampling operations and transport of the samples is guaranteed. The results of the analyses are published by the operators of the purification plants on the same day as the sampling is carried out. The availability of the results of the microbiological analyses is guaranteed within 72 hours. Equipment is also available for analysing numerous parameters in real time, and emergency management services are set up, through which the operators of water purification, waste water treatment and waste treatment plants can obtain support for analyses and sampling 24 hours a day.
At Hera, we drink tap water The Hera2O project, which began in 2008, promotes the drinking of tap water by Hera employees. By drinking approximately 425,000 litres of tap water in 2012 thanks to the dispensers installed in the canteens and offices, Hera workers avoided the production of over 650,000 plastic bottles (0.50 litre bottles for canteens and individual use, and 1.50 litre bottles for offices and meeting rooms), resulting in energy savings of approximately 44 toe, 122 fewer metric tons of CO2 emissions and approximately 430 fewer bins of waste to be managed.
In 2012, the “case dell’acqua” (“water houses”) had a strong impact in the area Hera operates in. These structures are located in public areas and provide citizens with chilled, natural or sparkling network water. Hera participated in the creation of the “water houses” in the area it serves and defined its own format called “Sorgente Urbana” (“Urban Source”) which was diffused in the other provinces in which Hera manages the water service. At the end of 2012, 13 water houses (7 of which were activated in 2012) and 6 urban sources (all activated in 2012) provided 5.6 million litres of water in 2012. A qualifying aspect implemented by Adriatica Acque – Hera Group’s company specialising in the creation and management of these structures – regards the involvement, in cooperation with the Municipalities involved, of social cooperatives or non-profit associations for carrying out daily supervision and cleaning of the water houses. Taking into account the considerable concern over the presence of asbestos-cement pipes in Hera’s water network, for some time the company has carried out constant checks on the state of the pipes through a plan of controls to test for asbestos fibres in the water. The use of asbestos, a common practice in construction in other industrial sectors up to the end of the 1980’s, was definitively banned in 1992. While it has been recognised that the inhalation of asbestos fibres causes serious respiratory illnesses, there is no evidence of toxicity linked to the ingestion of asbestos. In fact, the current law in force regarding the quality of water destined for human consumption (Legislative Decree no. 31/2001) does not set limits regarding the presence of asbestos fibres: in particular, the ministerial decree of 14 May 1996, annex 3, cites a WHO (World Health Organization) document which states that “... There is no serious evidence that the ingestion of asbestos is hazardous to health.” The results of controls performed in 2012
123
show a general absence of asbestos fibres, with the exception of very a sampling point, where, in any event the number of fibres found was significantly below the limit of 7,000,000 fibres/litre indicated by the USEPA (US Environmental Protection Agency). Furthermore, the water has generally non-aggressive characteristics with respect to the cement framework.
Hera working with Coop for “Acqua di casa mia” (“My home’s water”) In 2012, labels on the quality of tap water arrived at the Coop Estense, Coop Adriatica and Coop Reno points of sale in the area served by Hera. Coop’s initiative is part of the “Acqua di casa mia” (“My home water”) campaign and is carried out with the contribution of Hera, which provided the data on water controls carried out throughout the area and organised information points in the main hypermarkets involved. The announcements with the tap water label were put up in the mineral water aisles at all points of sale. 145 points of sale in 77 municipalities in the area served by Hera are involved in the project.
Service safety and continuity
Electricity service safety and continuity In 2012, the electricity distribution grids managed by Hera S.p.A. served approximately 260,000 users, in twenty-four municipalities of the Emilia-Romagna region within the provinces of Bologna, Modena and Ravenna, distributing approximately 2,233 GWh of electricity. The total length of the electricity grids managed by Hera through the Territorial Operating Structures of Modena and Imola-Faenza amounts to 10,013 kilometres, 73.5% of which in low voltage, 26.2% in medium voltage, and 0.3% in high voltage. 41% of the lines are underground, and the rest are overground lines. The increase in the length of underground lines is a result of the improvement activities on the data available in the company information systems. Following work carried out throughout 2012, there was an increase of approximately 0.7% in the distribution network extension compared to 2011; the increase occurred on the low and medium voltage lines compared to 2011, while the high voltage grid remained unchanged. The physical and administrative losses recorded in the distribution grid stood at approximately 3.5% and no accidents involving citizens occurred in relation to the electricity grids managed by Hera. In 2012, there were 6,808 cases of service re-activation after it was cut off due to delays in payment. In 2012, supplies relative to electricity grid management and maintenance activities involved 9,010 days of work, particularly for activities related to new plants that were installed and grid maintenance. When suppliers sign the agreement, they are requested to train and inform their personnel on the specific risks that could arise when work is being carried out and on the protection and prevention measures to be implemented, and to provide their personnel involved in these activities with the proper clothing for the tasks they perform. The company has a procedure which specifies the criteria for identifying roles and responsibilities for emergencies, and defines general emergency management rules and procedures.
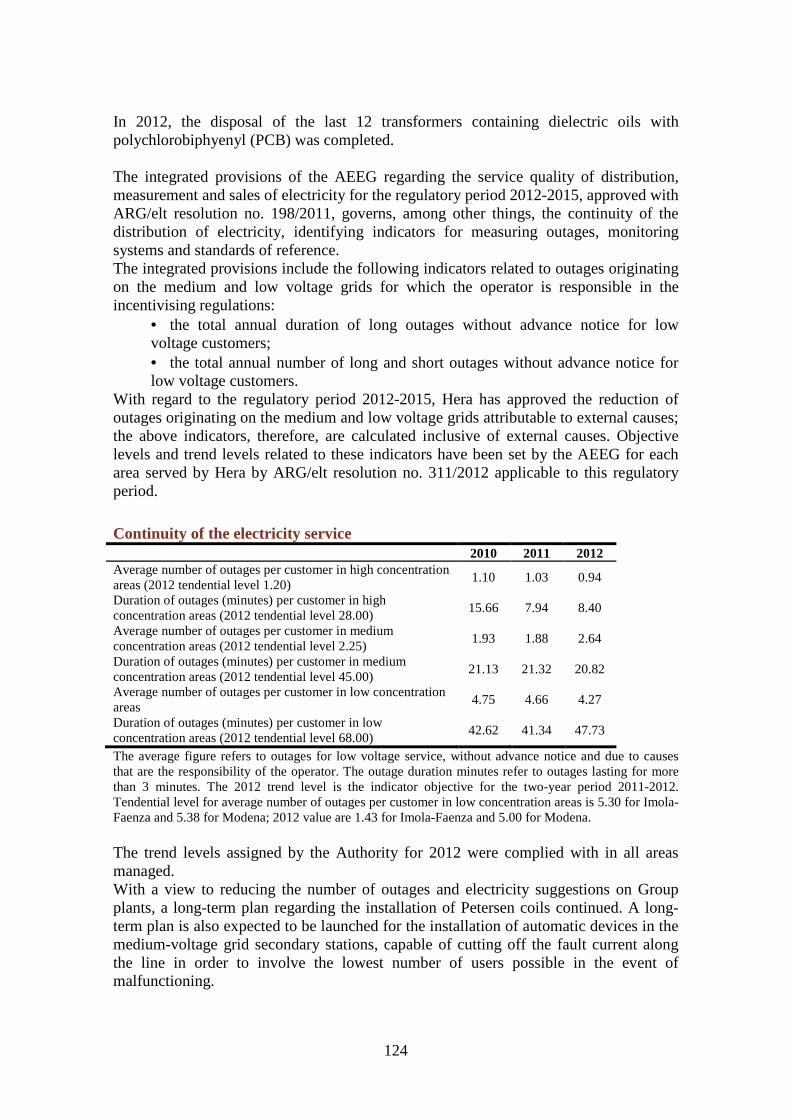
124
In 2012, the disposal of the last 12 transformers containing dielectric oils with polychlorobiphyenyl (PCB) was completed. The integrated provisions of the AEEG regarding the service quality of distribution, measurement and sales of electricity for the regulatory period 2012-2015, approved with ARG/elt resolution no. 198/2011, governs, among other things, the continuity of the distribution of electricity, identifying indicators for measuring outages, monitoring systems and standards of reference. The integrated provisions include the following indicators related to outages originating on the medium and low voltage grids for which the operator is responsible in the incentivising regulations:
• the total annual duration of long outages without advance notice for low voltage customers; • the total annual number of long and short outages without advance notice for low voltage customers.
With regard to the regulatory period 2012-2015, Hera has approved the reduction of outages originating on the medium and low voltage grids attributable to external causes; the above indicators, therefore, are calculated inclusive of external causes. Objective levels and trend levels related to these indicators have been set by the AEEG for each area served by Hera by ARG/elt resolution no. 311/2012 applicable to this regulatory period.
Continuity of the electricity service 2010 2011 2012
Average number of outages per customer in high concentration areas (2012 tendential level 1.20)
1.10 1.03 0.94
Duration of outages (minutes) per customer in high concentration areas (2012 tendential level 28.00)
15.66 7.94 8.40
Average number of outages per customer in medium concentration areas (2012 tendential level 2.25)
1.93 1.88 2.64
Duration of outages (minutes) per customer in medium concentration areas (2012 tendential level 45.00)
21.13 21.32 20.82
Average number of outages per customer in low concentration areas
4.75 4.66 4.27
Duration of outages (minutes) per customer in low concentration areas (2012 tendential level 68.00)
42.62 41.34 47.73
The average figure refers to outages for low voltage service, without advance notice and due to causes that are the responsibility of the operator. The outage duration minutes refer to outages lasting for more than 3 minutes. The 2012 trend level is the indicator objective for the two-year period 2011-2012. Tendential level for average number of outages per customer in low concentration areas is 5.30 for Imola-Faenza and 5.38 for Modena; 2012 value are 1.43 for Imola-Faenza and 5.00 for Modena. The trend levels assigned by the Authority for 2012 were complied with in all areas managed. With a view to reducing the number of outages and electricity suggestions on Group plants, a long-term plan regarding the installation of Petersen coils continued. A long-term plan is also expected to be launched for the installation of automatic devices in the medium-voltage grid secondary stations, capable of cutting off the fault current along the line in order to involve the lowest number of users possible in the event of malfunctioning.

125
Hera takes part in the incentive and penalty system for continuity recoveries related to the electricity distribution service, set forth in ARG/elt resolution no. 333/2007: in 2011, based on the number and duration of outages without advance notice, the entitlement to Euro 480 thousand (incentives) and Euro 232 thousand (penalties) was obtained. Within 30 November 2013, on the basis of the data provided in compliance with paragraph 16.1 (ARG/elt 198/11), the Authority will check and publish for each area the service continuity recoveries obtained by the distributing companies during 2012. The number of requests for active connections to the distribution grid managed by Hera has increased significantly since 2007: requests increased from 83 in 2007 to 386 in 2009, and reached 1,559 in 2012, on the rise compared to the previous year (1,179). The total input power requested for the connection of production plants was 45,320kW in 2012, a significant drop compared to 70,411 kW in 2011.
Gas distribution service safety and continuity Hera manages the gas distribution service with the objective of ensuring high safety and service continuity levels. In addition to the consolidated supervisory activities and technological upgrading of the networks and installation and in adherence to applicable provisions issued by the Italian Authority for Electricity and Natural Gas, the following activities took place in 2012:
• the quantity of planned studies on gas leaks remained at percentages well above the AEEG requirements, with particular focus on the highly critical sections of the grid; • controls were practically completed on the seismic vulnerability of the plants managed; • an original methodological model was defined for a pilot area which identifies the seismic vulnerability and susceptibility of the gas networks. Relevant controls were started based on the results of the model.
Since 2009, Hera has participated in the system providing incentives for safety improvements in the gas distribution service, defined by AEEG. Compliance with strict requirements allowed Hera to voluntarily participate in 2009, while Hera has been required to participate in said system since 2010, which assesses three elements:
• compliance with service obligations, lack of gas accidents due to the responsibility of the operator, lack of breaches on this topic linked to AEEG controls or inspections; • number of measurements of the level of gas odorization carried out compared to the regulatory minimum; • number of conventional leaks reported by third parties (two year moving average) compared to the objective set by AEEG for the same period.
The incentive accrued following the voluntary participation in the system in 2009 came to approximately Euro 13 thousand for the six provinces managed, while in 2010 a penalty (as set forth in ARG/gas resolution no. 368/2012) of Euro 420 thousand for the six provinces managed was recorded. In 2010, Hera achieved positive results for the gas odorization component in all provinces managed. The leaks reported by third parties component were positive in three provinces and negative in the other three. AEEG has not made the results of the following years official yet.
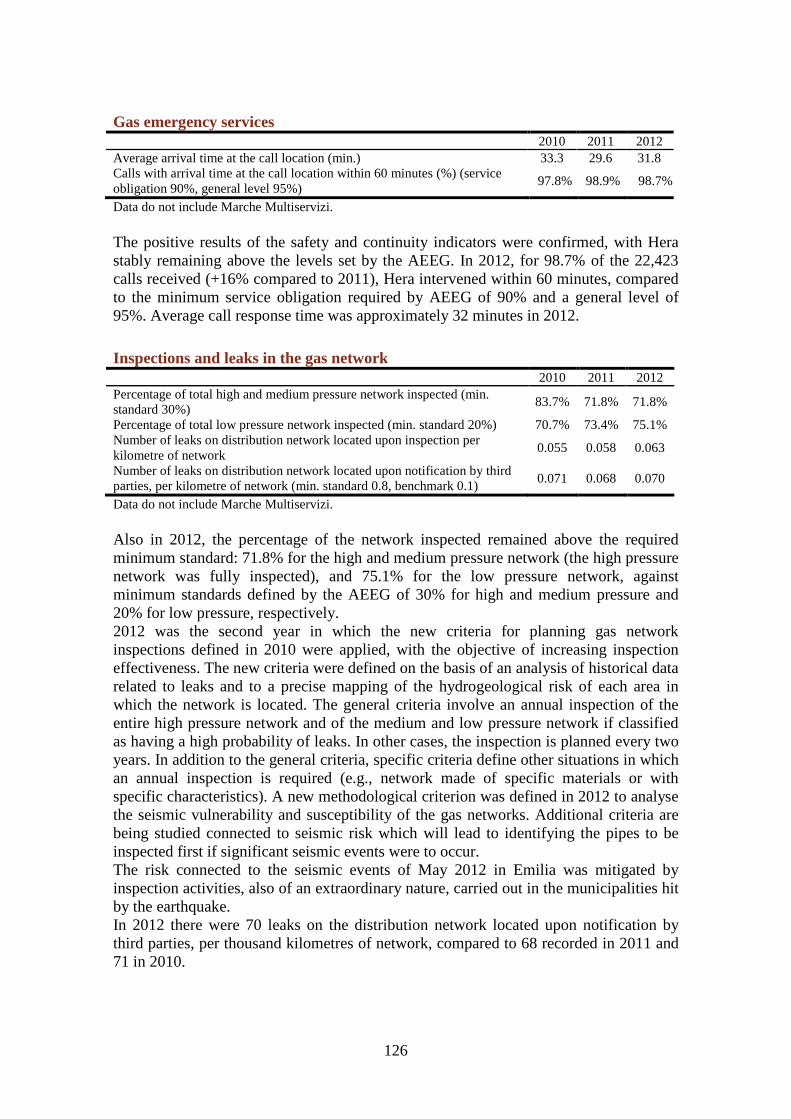
126
Gas emergency services 2010 2011 2012
Average arrival time at the call location (min.) 33.3 29.6 31.8 Calls with arrival time at the call location within 60 minutes (%) (service obligation 90%, general level 95%)
97.8% 98.9% 98.7%
Data do not include Marche Multiservizi. The positive results of the safety and continuity indicators were confirmed, with Hera stably remaining above the levels set by the AEEG. In 2012, for 98.7% of the 22,423 calls received (+16% compared to 2011), Hera intervened within 60 minutes, compared to the minimum service obligation required by AEEG of 90% and a general level of 95%. Average call response time was approximately 32 minutes in 2012.
Inspections and leaks in the gas network 2010 2011 2012
Percentage of total high and medium pressure network inspected (min. standard 30%)
83.7% 71.8% 71.8%
Percentage of total low pressure network inspected (min. standard 20%) 70.7% 73.4% 75.1% Number of leaks on distribution network located upon inspection per kilometre of network
0.055 0.058 0.063
Number of leaks on distribution network located upon notification by third parties, per kilometre of network (min. standard 0.8, benchmark 0.1)
0.071 0.068 0.070
Data do not include Marche Multiservizi. Also in 2012, the percentage of the network inspected remained above the required minimum standard: 71.8% for the high and medium pressure network (the high pressure network was fully inspected), and 75.1% for the low pressure network, against minimum standards defined by the AEEG of 30% for high and medium pressure and 20% for low pressure, respectively. 2012 was the second year in which the new criteria for planning gas network inspections defined in 2010 were applied, with the objective of increasing inspection effectiveness. The new criteria were defined on the basis of an analysis of historical data related to leaks and to a precise mapping of the hydrogeological risk of each area in which the network is located. The general criteria involve an annual inspection of the entire high pressure network and of the medium and low pressure network if classified as having a high probability of leaks. In other cases, the inspection is planned every two years. In addition to the general criteria, specific criteria define other situations in which an annual inspection is required (e.g., network made of specific materials or with specific characteristics). A new methodological criterion was defined in 2012 to analyse the seismic vulnerability and susceptibility of the gas networks. Additional criteria are being studied connected to seismic risk which will lead to identifying the pipes to be inspected first if significant seismic events were to occur. The risk connected to the seismic events of May 2012 in Emilia was mitigated by inspection activities, also of an extraordinary nature, carried out in the municipalities hit by the earthquake. In 2012 there were 70 leaks on the distribution network located upon notification by third parties, per thousand kilometres of network, compared to 68 recorded in 2011 and 71 in 2010.

127
The technical call centre The technical call centre receives and diagnoses telephone calls to the freephone numbers of the Hera Group emergency service. Each call received has the potential to become an effective report of service irregularity; but historical trends show that only around 50% of calls regard issues to be checked in the field and, in turn, only part of these is classified as actual emergency service. The Hera Group technical call centre has two freephone numbers for the emergency service, one dedicated exclusively to the gas service and the other to the integrated water service and district heating. The simplification of the emergency freephone numbers, in line with AEEG ARG/gas resolution no. 120/2008, did not lead to any substantial difference in the response performance envisaged for the gas service, although the number of calls handled rose (totalling over 63 thousand: +8% compared to 2011. 92.5% of calls made to the gas emergency service were responded to (or were abandoned) within 120 seconds (compared to a general level of 90% established by AEEG). This figure was negatively influenced by calls connected to the February snowfalls: excluding the month of February, the percentage rises to 95% which represents a 2013 objective level for Hera. The trend of the month of February negatively influenced the overall performance of the technical call centre, as reported in the following table.
Percentage of calls received by the technical call centre answered or abandoned within 120 seconds
2010 2011 2012 Gas 99.8% 99.8% 99.1% Other Services 99.6% 95.7% 88.2% Total 99.7% 96.8% 90.9% of which for gas emergencies (general level 90%) 90.5% 96.9% 92.5% Data do not include Marche Multiservizi. A call to the Hera Group emergency freephone numbers begins with an automatic responder which allows callers to choose the service related to their issue before speaking with an operator. In 2012, approximately 250 thousand calls were made to the Forlì technical call centre, for which the average hold time was 9.4 seconds for the gas service and 10 seconds for the other services, and the diagnosis made by the operator caused only 46% of those calls, approximately 114 thousand, to be classified as emergency requests.
Average waiting times at the technical call centre sec 2011 2012
Gas 10.0 9.4 Other Services 10.0 10.0 Number of calls 214,077 250,757 of which for the gas emergency service 58,699 63,407 of which for other emergency services 33,495 50,938 Data do not include Marche Multiservizi.
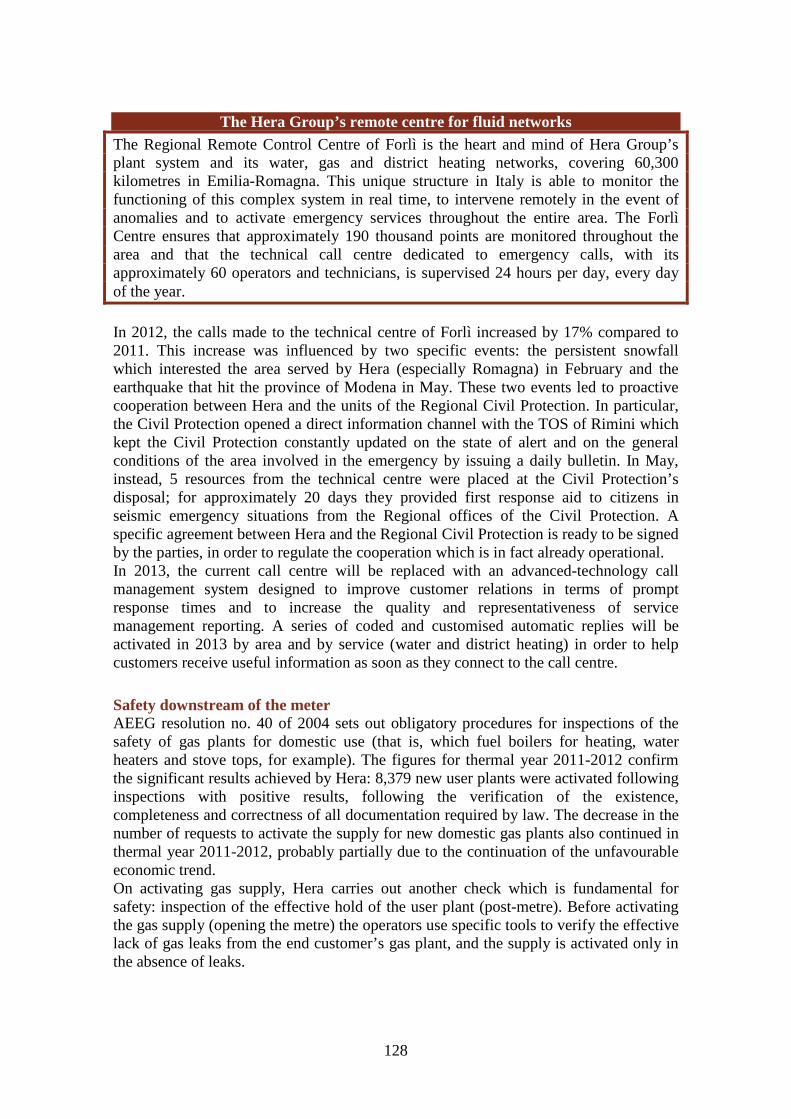
128
The Hera Group’s remote centre for fluid networks The Regional Remote Control Centre of Forlì is the heart and mind of Hera Group’s plant system and its water, gas and district heating networks, covering 60,300 kilometres in Emilia-Romagna. This unique structure in Italy is able to monitor the functioning of this complex system in real time, to intervene remotely in the event of anomalies and to activate emergency services throughout the entire area. The Forlì Centre ensures that approximately 190 thousand points are monitored throughout the area and that the technical call centre dedicated to emergency calls, with its approximately 60 operators and technicians, is supervised 24 hours per day, every day of the year.
In 2012, the calls made to the technical centre of Forlì increased by 17% compared to 2011. This increase was influenced by two specific events: the persistent snowfall which interested the area served by Hera (especially Romagna) in February and the earthquake that hit the province of Modena in May. These two events led to proactive cooperation between Hera and the units of the Regional Civil Protection. In particular, the Civil Protection opened a direct information channel with the TOS of Rimini which kept the Civil Protection constantly updated on the state of alert and on the general conditions of the area involved in the emergency by issuing a daily bulletin. In May, instead, 5 resources from the technical centre were placed at the Civil Protection’s disposal; for approximately 20 days they provided first response aid to citizens in seismic emergency situations from the Regional offices of the Civil Protection. A specific agreement between Hera and the Regional Civil Protection is ready to be signed by the parties, in order to regulate the cooperation which is in fact already operational. In 2013, the current call centre will be replaced with an advanced-technology call management system designed to improve customer relations in terms of prompt response times and to increase the quality and representativeness of service management reporting. A series of coded and customised automatic replies will be activated in 2013 by area and by service (water and district heating) in order to help customers receive useful information as soon as they connect to the call centre.
Safety downstream of the meter AEEG resolution no. 40 of 2004 sets out obligatory procedures for inspections of the safety of gas plants for domestic use (that is, which fuel boilers for heating, water heaters and stove tops, for example). The figures for thermal year 2011-2012 confirm the significant results achieved by Hera: 8,379 new user plants were activated following inspections with positive results, following the verification of the existence, completeness and correctness of all documentation required by law. The decrease in the number of requests to activate the supply for new domestic gas plants also continued in thermal year 2011-2012, probably partially due to the continuation of the unfavourable economic trend. On activating gas supply, Hera carries out another check which is fundamental for safety: inspection of the effective hold of the user plant (post-metre). Before activating the gas supply (opening the metre) the operators use specific tools to verify the effective lack of gas leaks from the end customer’s gas plant, and the supply is activated only in the absence of leaks.

129
Also in case of a fault downstream of the metre, when the Hera emergency services locate a gas leak in the plant of an end customer, it immediately suspends supply in order to eliminate the dangerous situation. The supply is then reactivated only after a qualified installer fixes the plant so it no longer leaks and issues the relative certification (Annex E to resolution no. 40/2004). Finally, it should be noted that in compliance with AEEG ARG/gas resolution no. 79/2010, the new insurance for accidents caused by gas leaks has been in force since October 2010. Domestic consumers can therefore benefit from new services which can be requested following accidents or damage caused by using gas supplied by a distribution network. The policy, informational documents and all information is available on the Italian Gas Committee website (www.cig.it) in the “Insurance” section; detailed information may be requested by calling the freephone number of the Single Buyer’s consumer branch.
Continuity of the integrated water services The water network control activity index is expressed as a percentage of the network inspected for leaks. On the whole, in 2012 over 4,100 kilometres of network were inspected, comprising 15% of the total water network, slightly lower than the activity of previous years. The index of the status of the water network is expressed as the number of breakages per kilometre of network and rose by 30% compared to last year, as a consequence of the long and severe freezing conditions of February 2012 and, to a lesser degree, the seismic events of May 2012.
Continuity of the integrated water services 2010 2011 2012
Percentage of network subject to active search for losses 18.5% 18.0% 15.3% Number of breaks in water system pipes and tanks per km of network
1.37 1.24 1.63
Data do not include Marche Multiservizi.
Aqueduct interruptions: Hera informs customers via text message As part of the objective to improve customer contacts and relations, the GeoSMS project was successfully tested in 2012 in a number of areas. The project informs customers in advance of any interruptions in the water service via text message. The message contains information about the place and duration of the interruption and is automatically sent to all customers who have subscribed to the automatic alert system, as well as to the technical call centre of Forlì and to the municipal authorities concerned. The 2013 objective is to extend this service to all the areas managed by Hera in order to improve the processes and methods for acquiring and managing customer data and to optimise the management of customers who have not subscribed to the service and of non-Hera customers who need to be alerted.

130
Information security In 2012, in compliance with the information security management model adopted by the Hera Group, the actions approved by the Information Security Management Committee were completed. The information risk status was assessed for information security purposes and the plan of the actions designed to reduce the risk level were presented and shared with the Risk Committee. Significant security-related projects in 2012 include:
• testing advanced mechanisms for the security of the communication networks;
• applying special techniques and methods to test security vulnerabilities in IT infrastructures dedicated to the remote control of plants;
• implementing an information security campaign focused on training and raising awareness in Hera Group personnel.
A winning team for the Rimini snow emergency In February 2012, two metres of snow fell on the municipalities of Alta Val Marecchia, leaving entire towns without water. The networks were covered by metres of snow, the affected areas were difficult to reach, operating points were inaccessible and the emergency lines were clogged up by calls from customers with broken meters or without water. Hera’s operators passed the test. Even the special vehicles provided by the Civil Protection were often not able to reach the areas so the only way to move was to wear snow shoes and follow the routes opened by the skiers of the Mountain Rescue Service. The emergency service was strengthened with an emergency telephone line and in order to deal with the lack of water, door-to-door deliveries were organised or the networks were supplied with water taken directly from the tanks.
Customer relations
In 2012, the Hera Group continued the policy of building up the channels through which customers can contact the company so as to render contact simpler and quicker. Hera has 5 different contact channels: the call centre for residential customers, the call centre for business customers, branches, the internet and mail.
Contact channels with customers (%) 2010 2011 2012
Branches 29.0% 29.0% 27.6% Call centres 58.0% 55.6% 56.5% Mail 6.5% 5.8% 5.2% Web 6.5% 9.5% 10.6% Total 100.0% 100.0% 100.0%
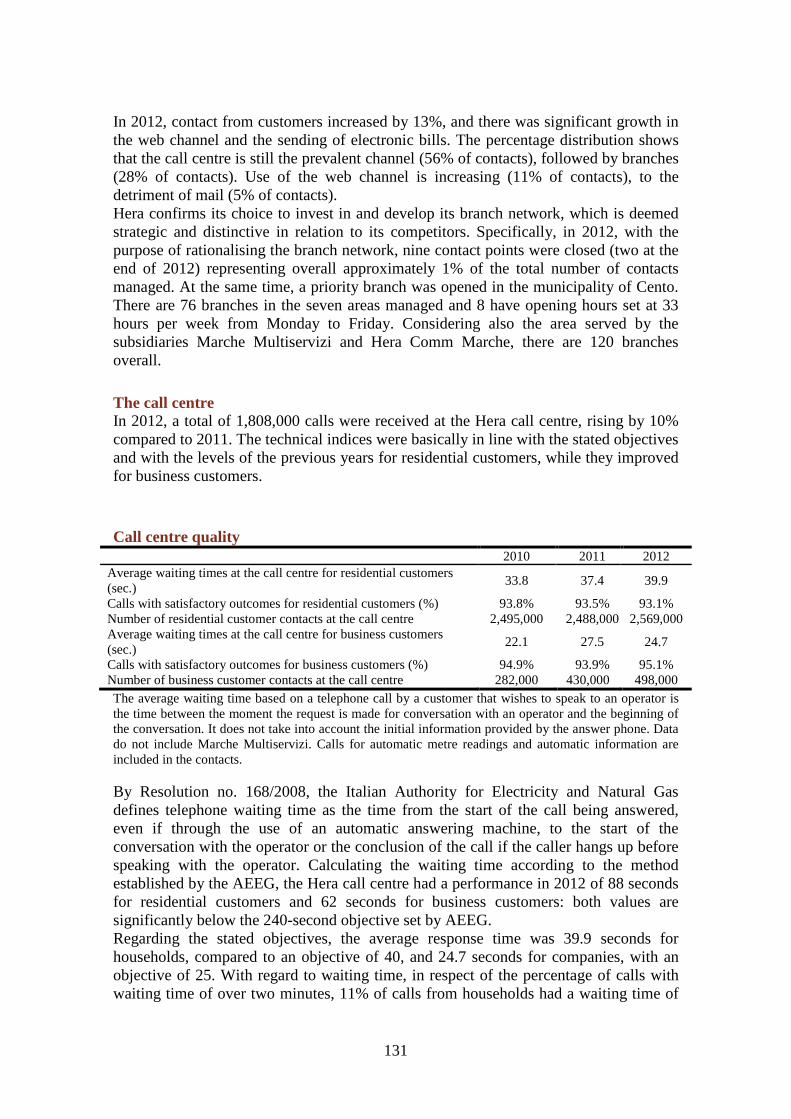
131
In 2012, contact from customers increased by 13%, and there was significant growth in the web channel and the sending of electronic bills. The percentage distribution shows that the call centre is still the prevalent channel (56% of contacts), followed by branches (28% of contacts). Use of the web channel is increasing (11% of contacts), to the detriment of mail (5% of contacts). Hera confirms its choice to invest in and develop its branch network, which is deemed strategic and distinctive in relation to its competitors. Specifically, in 2012, with the purpose of rationalising the branch network, nine contact points were closed (two at the end of 2012) representing overall approximately 1% of the total number of contacts managed. At the same time, a priority branch was opened in the municipality of Cento. There are 76 branches in the seven areas managed and 8 have opening hours set at 33 hours per week from Monday to Friday. Considering also the area served by the subsidiaries Marche Multiservizi and Hera Comm Marche, there are 120 branches overall.
The call centre In 2012, a total of 1,808,000 calls were received at the Hera call centre, rising by 10% compared to 2011. The technical indices were basically in line with the stated objectives and with the levels of the previous years for residential customers, while they improved for business customers.
Call centre quality 2010 2011 2012
Average waiting times at the call centre for residential customers (sec.)
33.8 37.4 39.9
Calls with satisfactory outcomes for residential customers (%) 93.8% 93.5% 93.1% Number of residential customer contacts at the call centre 2,495,000 2,488,000 2,569,000 Average waiting times at the call centre for business customers (sec.)
22.1 27.5 24.7
Calls with satisfactory outcomes for business customers (%) 94.9% 93.9% 95.1% Number of business customer contacts at the call centre 282,000 430,000 498,000 The average waiting time based on a telephone call by a customer that wishes to speak to an operator is the time between the moment the request is made for conversation with an operator and the beginning of the conversation. It does not take into account the initial information provided by the answer phone. Data do not include Marche Multiservizi. Calls for automatic metre readings and automatic information are included in the contacts. By Resolution no. 168/2008, the Italian Authority for Electricity and Natural Gas defines telephone waiting time as the time from the start of the call being answered, even if through the use of an automatic answering machine, to the start of the conversation with the operator or the conclusion of the call if the caller hangs up before speaking with the operator. Calculating the waiting time according to the method established by the AEEG, the Hera call centre had a performance in 2012 of 88 seconds for residential customers and 62 seconds for business customers: both values are significantly below the 240-second objective set by AEEG. Regarding the stated objectives, the average response time was 39.9 seconds for households, compared to an objective of 40, and 24.7 seconds for companies, with an objective of 25. With regard to waiting time, in respect of the percentage of calls with waiting time of over two minutes, 11% of calls from households had a waiting time of
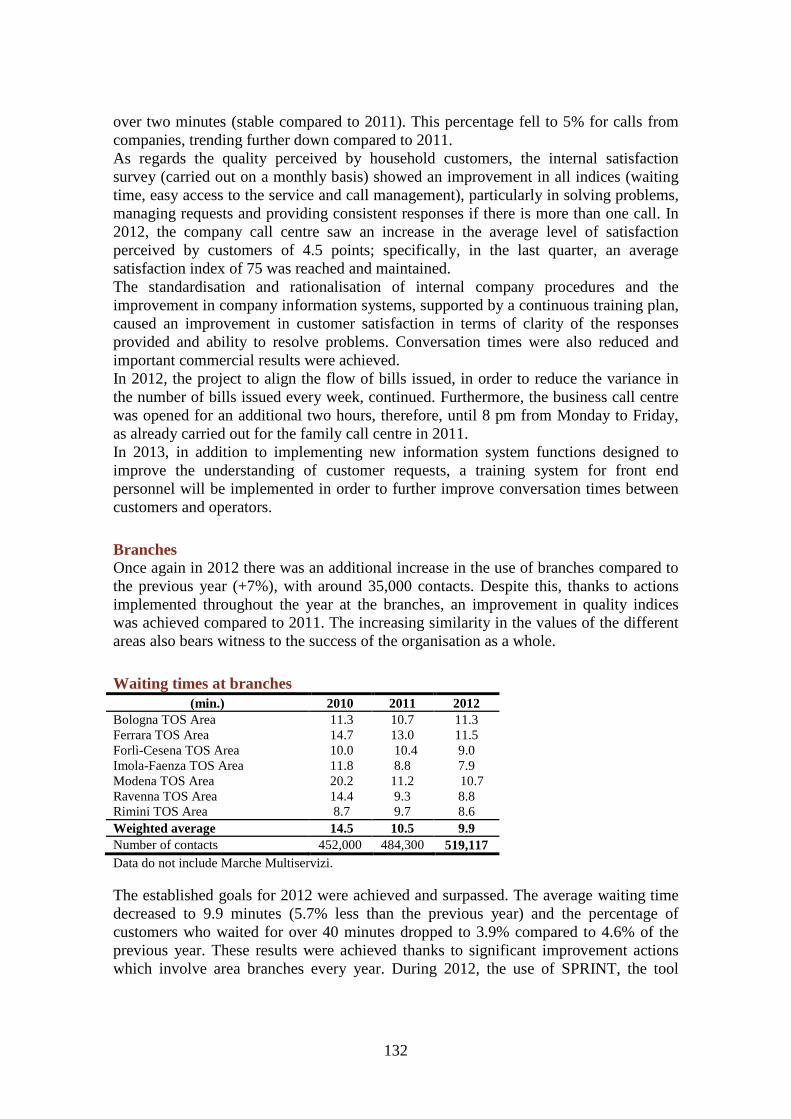
132
over two minutes (stable compared to 2011). This percentage fell to 5% for calls from companies, trending further down compared to 2011. As regards the quality perceived by household customers, the internal satisfaction survey (carried out on a monthly basis) showed an improvement in all indices (waiting time, easy access to the service and call management), particularly in solving problems, managing requests and providing consistent responses if there is more than one call. In 2012, the company call centre saw an increase in the average level of satisfaction perceived by customers of 4.5 points; specifically, in the last quarter, an average satisfaction index of 75 was reached and maintained. The standardisation and rationalisation of internal company procedures and the improvement in company information systems, supported by a continuous training plan, caused an improvement in customer satisfaction in terms of clarity of the responses provided and ability to resolve problems. Conversation times were also reduced and important commercial results were achieved. In 2012, the project to align the flow of bills issued, in order to reduce the variance in the number of bills issued every week, continued. Furthermore, the business call centre was opened for an additional two hours, therefore, until 8 pm from Monday to Friday, as already carried out for the family call centre in 2011. In 2013, in addition to implementing new information system functions designed to improve the understanding of customer requests, a training system for front end personnel will be implemented in order to further improve conversation times between customers and operators.
Branches Once again in 2012 there was an additional increase in the use of branches compared to the previous year (+7%), with around 35,000 contacts. Despite this, thanks to actions implemented throughout the year at the branches, an improvement in quality indices was achieved compared to 2011. The increasing similarity in the values of the different areas also bears witness to the success of the organisation as a whole.
Waiting times at branches (min.) 2010 2011 2012
Bologna TOS Area 11.3 10.7 11.3 Ferrara TOS Area 14.7 13.0 11.5 Forlì-Cesena TOS Area 10.0 10.4 9.0 Imola-Faenza TOS Area 11.8 8.8 7.9 Modena TOS Area 20.2 11.2 10.7 Ravenna TOS Area 14.4 9.3 8.8 Rimini TOS Area 8.7 9.7 8.6 Weighted average 14.5 10.5 9.9 Number of contacts 452,000 484,300 519,117 Data do not include Marche Multiservizi. The established goals for 2012 were achieved and surpassed. The average waiting time decreased to 9.9 minutes (5.7% less than the previous year) and the percentage of customers who waited for over 40 minutes dropped to 3.9% compared to 4.6% of the previous year. These results were achieved thanks to significant improvement actions which involve area branches every year. During 2012, the use of SPRINT, the tool
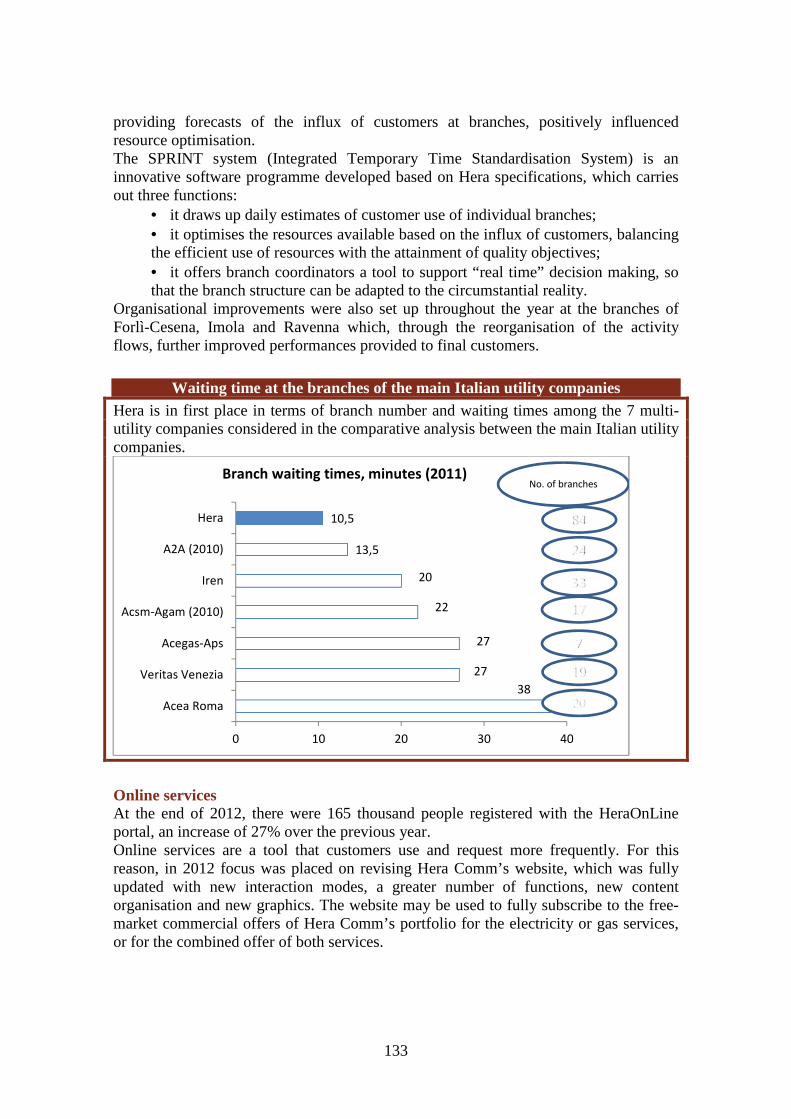
133
providing forecasts of the influx of customers at branches, positively influenced resource optimisation. The SPRINT system (Integrated Temporary Time Standardisation System) is an innovative software programme developed based on Hera specifications, which carries out three functions:
• it draws up daily estimates of customer use of individual branches; • it optimises the resources available based on the influx of customers, balancing the efficient use of resources with the attainment of quality objectives; • it offers branch coordinators a tool to support “real time” decision making, so that the branch structure can be adapted to the circumstantial reality.
Organisational improvements were also set up throughout the year at the branches of Forlì-Cesena, Imola and Ravenna which, through the reorganisation of the activity flows, further improved performances provided to final customers.
Waiting time at the branches of the main Italian utility companies Hera is in first place in terms of branch number and waiting times among the 7 multi-utility companies considered in the comparative analysis between the main Italian utility companies.
Online services At the end of 2012, there were 165 thousand people registered with the HeraOnLine portal, an increase of 27% over the previous year. Online services are a tool that customers use and request more frequently. For this reason, in 2012 focus was placed on revising Hera Comm’s website, which was fully updated with new interaction modes, a greater number of functions, new content organisation and new graphics. The website may be used to fully subscribe to the free-market commercial offers of Hera Comm’s portfolio for the electricity or gas services, or for the combined offer of both services.
38
27
27
22
20
13,5
10,5
0 10 20 30 40
Acea Roma
Veritas Venezia
Acegas-Aps
Acsm-Agam (2010)
Iren
A2A (2010)
Hera
Branch waiting times, minutes (2011)No. of branches
134
100,000 new subscriptions to the online bill = 2,000 more trees Opting for the online bill instead of the paper bill means taking an important environmental action. For this reason, Hera has decided to promote the use of the e-bill with a raising-awareness campaign which involves customers and Municipalities, and which will lead to 100,000 new subscriptions and to the planting of 2,000 new trees, thus contributing to the creation and development of green areas. 100,000 new subscriptions to the online bill will avoid the use of almost 2,400,000 sheets of paper every year. At the end of January 2013, over 20,000 families had decided to receive the e-bill. In just three months, 80% of the objective set for the entire year (25,000 subscriptions) has been reached. The online bill will lead to important benefits compared to traditional paper bills for which high amounts of paper are used, associated with emissions and consumption deriving from their production and transport. The impact related to their subsequent management as waste must also be considered. Trees create a further environmental benefit: a tree may absorb up to 3 tons of CO2 throughout its entire lifecycle (30 years) and significantly contributes to the absorption of pollutants in the air. The campaign involves 69 Municipalities in the area served by Hera which identified, on the basis of criteria determined by Hera itself and shared with the Municipalities (in agreement protocols), the 88 green areas where the trees will be planted. The areas are generally existing public parks in which tree planting will be increased, or green areas yet to be created. School gardens, tree-lined avenues and cycling lanes have also been included. Each Municipality will receive a number of trees proportionate to the residents: the trees will be around 3 metres high and, therefore, able to give a new and upgraded look to the urban environment chosen by the municipal authorities. The results will be monitored periodically to assess the overall increase of the subscriptions. Information about the campaign will be widely disseminated on the specifically created web channel (www.alberi.gruppohera.it). The web channel provides information about the initiative, the partner Municipalities, the interventions planned, the simulator of attainable objectives, with ensuing environmental benefits in terms of CO2 avoided and paper saved, and the number of subscriptions reached. Rapid access to on-line bill subscription is also available on the channel to help customers switch to electronic billing. In order to promote the sharing of the project among citizens and to pass the word on to others, it is possible to show satisfaction for the initiative on Facebook and Pinterest.
The company continued to promote electronic bills, also when new agreements are signed, by offering customers the option of immediately beginning to punctually receive bills directly by email, thereby avoiding printing and sending paper documents. In 2012, other than proposing the electronic bill when each new agreement was signed with Hera, this service was also promoted through the campaign “Give a tree to your city”. Over the last three years, the initiatives implemented to promote electronic billing subscription have led to an over 168% increase in customers who have activated the service, recording a 65% increase in the past year compared to the 40% objective set. Approximately 64 thousand customers were enrolled at the end of 2012, avoiding the printing and sending of approximately 400 thousand envelopes containing bills in the same year. In 2013 the Hera Group will continue to promote conduct aimed at reducing
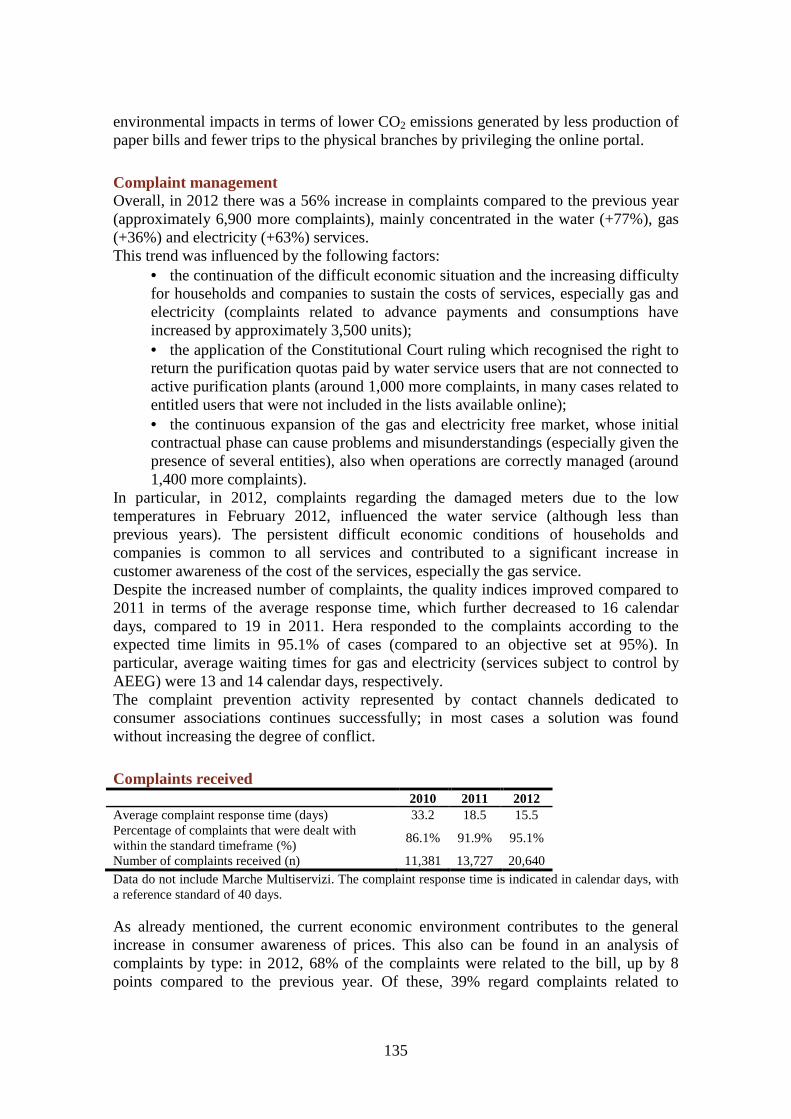
135
environmental impacts in terms of lower CO2 emissions generated by less production of paper bills and fewer trips to the physical branches by privileging the online portal.
Complaint management Overall, in 2012 there was a 56% increase in complaints compared to the previous year (approximately 6,900 more complaints), mainly concentrated in the water (+77%), gas (+36%) and electricity (+63%) services. This trend was influenced by the following factors:
• the continuation of the difficult economic situation and the increasing difficulty for households and companies to sustain the costs of services, especially gas and electricity (complaints related to advance payments and consumptions have increased by approximately 3,500 units); • the application of the Constitutional Court ruling which recognised the right to return the purification quotas paid by water service users that are not connected to active purification plants (around 1,000 more complaints, in many cases related to entitled users that were not included in the lists available online); • the continuous expansion of the gas and electricity free market, whose initial contractual phase can cause problems and misunderstandings (especially given the presence of several entities), also when operations are correctly managed (around 1,400 more complaints).
In particular, in 2012, complaints regarding the damaged meters due to the low temperatures in February 2012, influenced the water service (although less than previous years). The persistent difficult economic conditions of households and companies is common to all services and contributed to a significant increase in customer awareness of the cost of the services, especially the gas service. Despite the increased number of complaints, the quality indices improved compared to 2011 in terms of the average response time, which further decreased to 16 calendar days, compared to 19 in 2011. Hera responded to the complaints according to the expected time limits in 95.1% of cases (compared to an objective set at 95%). In particular, average waiting times for gas and electricity (services subject to control by AEEG) were 13 and 14 calendar days, respectively. The complaint prevention activity represented by contact channels dedicated to consumer associations continues successfully; in most cases a solution was found without increasing the degree of conflict.
Complaints received 2010 2011 2012
Average complaint response time (days) 33.2 18.5 15.5 Percentage of complaints that were dealt with within the standard timeframe (%)
86.1% 91.9% 95.1%
Number of complaints received (n) 11,381 13,727 20,640 Data do not include Marche Multiservizi. The complaint response time is indicated in calendar days, with a reference standard of 40 days. As already mentioned, the current economic environment contributes to the general increase in consumer awareness of prices. This also can be found in an analysis of complaints by type: in 2012, 68% of the complaints were related to the bill, up by 8 points compared to the previous year. Of these, 39% regard complaints related to

136
advance payments and consumption (30% in 2011), 14% is related to supply activations or deactivations (11% in 2011) and 15% refers to payment or collection issues, down by 4 percentage points compared to 2011 thanks to the consolidation of procedures and the company’s great willingness to help customers in economic difficulty. Furthermore, complaints regarding reactivation after late payment and appointments with customers for estimates, terminations and disconnections fell from 6% to 4%. Among the aspects detected when analysing the complaints and dissatisfied customers (the latter analysis was carried out using monthly satisfaction surveys), it is worth noting that customers often complained about the new method used for showing the gas service advance payments on the bill, which did not include any meter readings. This modification was subsequently cancelled by AEEG also following the high number of complaints received by Hera Comm regarding this issue. Further reorganisations were carried out in 2012 in order to create dedicated resources focused on quality and timeliness of responses. Flows were rationalised in order to balance workloads among the groups, which were brought down to two: households and companies.
Mediation Since February 2009, gas and electricity residential customers have been able to use joint mediation procedures for the out-of-court settlement of disputes, as set forth in the protocol signed in 2007 between Hera S.p.A., Confservizi and 12 consumer associations which aimed to establish, on an experimental basis, an instrument for the resolution of disputes before they result in lawsuits. As at 2012 a total of 81 requests for joint mediation (74 in 2011) were received: 28 regarding the gas service, 19 regarding the electricity service, 7 regarding both services and 27 which could not be accepted for various reasons. Requests for mediation primarily regard problems relating to objections to consumption totals and to alleged invoicing errors or delays, as well as to problems arising during stipulation of the contract outside the commercial premises. In terms of outcomes of the requests for mediation received in 2012 and considered acceptable, 24 were concluded through settlement and 7 with failure to reach a settlement. The remaining 23 cases are currently pending. Regarding the 27 requests which could not be accepted, there were:
• 11 requests for which the deadline for replying to the complaint had not yet passed, or for which a complaint had not been submitted; • 10 cases regarding services to which the mediation procedure does not apply (i.e. water service, district heating); • 5 cases regarding non-domestic customers, or customers which were not entitled to submit such request; • 1 request lacking other requisites, such as the simple request for paying by instalments.
Considering the three-year period 2010-2012, 162 requests for settlement were received and accepted, 81 of which were concluded through settlement, 43 with failure to reach a settlement and 4 with a waiver of the request, as the problem had been solved in the meantime. The remaining 34 cases are currently pending.
137
Disputes with customers At the close of 2012 there were 259 pending disputes with customers (of which 151 initiated during the year) mainly regarding the application of the tariff regime for the services provided and the recovery of payments. Of these 151 disputes, 89 refer to the gas, electricity and district heating service, 50 to the water service and 12 to the waste management service. The increase in disputes with customers compared to 2011 (rising from 64 to 151) mainly regards the energy sector, especially objection to the protective system to which customers are assigned by the competent distributor, disputes regarding billing and complaints aimed at reactivating the supply of electricity or gas suspended due to late payment. In the water sector, instead, there was a rise in disputes regarding objections by customers to injunctions.
Confidentiality During 2012, the procedure for managing the company’s privacy obligations was issued. The Group consolidated the personal data protection management system, with a view to increasing integration with the QSE integrated system. In addition to the adjustments resulting from the company’s reorganisation, the standardisation of a series of document templates, published on the corporate intranet with a view to standardising behaviour by the various data controllers, including suppliers’ data controllers, was completed. The activity of analysing the regulatory developments of the privacy and QSE Regulatory Oversight continued; in 2012 the “Privacy” thematic area was included in the regulatory impact analysis dedicated to Data Controllers, and in the QSE Regulatory Register. Specifically, 6 regulatory in-depth analyses were drawn up regarding the impacts determined either by the issuing of new regulations or by the adoption of new technologies that influence personal data handling. With a view to guaranteeing an objective evaluation of the performances of the privacy management system implemented, an important assessment was carried out in 2012 by a qualified third party, which identified the main development lines that must inspire the activity of the Oversight and of the Data Controllers. Regarding the control phase, a dashboard of indicators was drawn up in 2012 which, once implemented, will allow us to monitor the trend of the main privacy performance indicators. In order to enable greater transparency in the relations with employees, in the light of the new technologies adopted by the Group and with a view to balancing corporate needs in compliance with the inspiring principles of the privacy regulations, a “Procedure on the use of the Internet, e-mails and other e-tools in the employment relationship” was drawn up, which will be approved within the first half of 2013.
Customer satisfaction survey
In November 2012, for the seventh consecutive year, the satisfaction of the Group’s residential customers was surveyed; beginning from 2010, this survey also includes data regarding the satisfaction of free market customers.
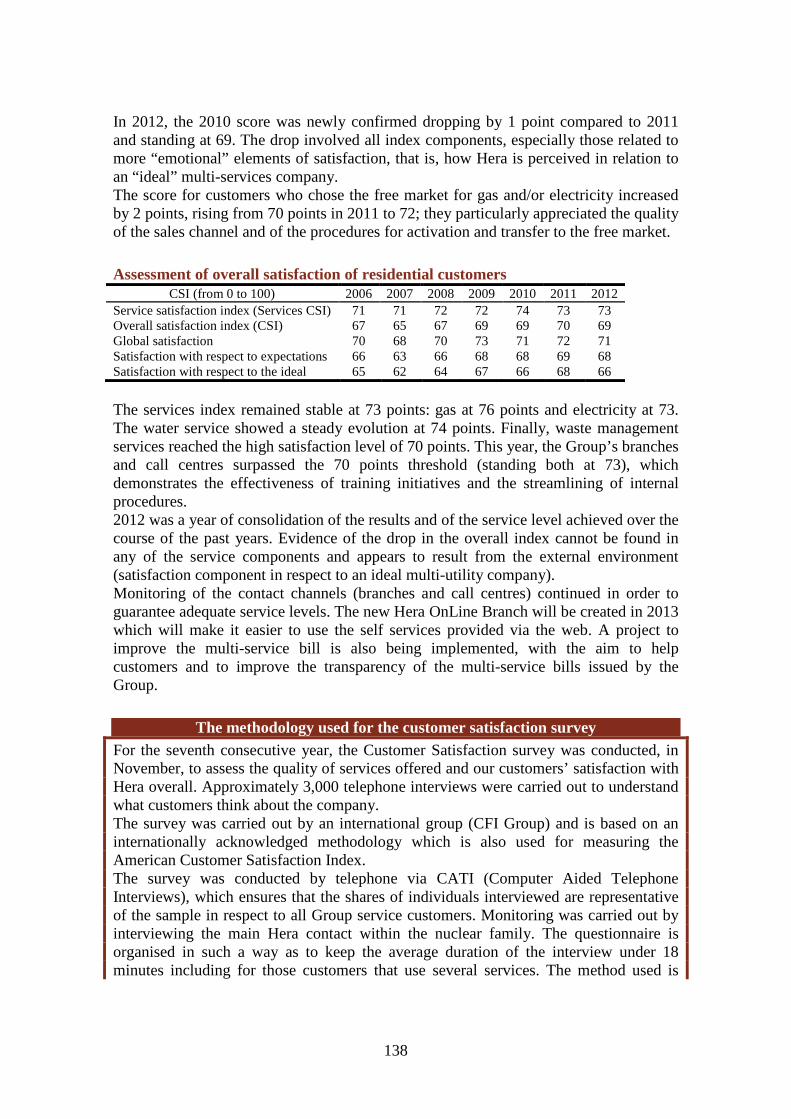
138
In 2012, the 2010 score was newly confirmed dropping by 1 point compared to 2011 and standing at 69. The drop involved all index components, especially those related to more “emotional” elements of satisfaction, that is, how Hera is perceived in relation to an “ideal” multi-services company. The score for customers who chose the free market for gas and/or electricity increased by 2 points, rising from 70 points in 2011 to 72; they particularly appreciated the quality of the sales channel and of the procedures for activation and transfer to the free market.
Assessment of overall satisfaction of residential customers CSI (from 0 to 100) 2006 2007 2008 2009 2010 2011 2012
Service satisfaction index (Services CSI) 71 71 72 72 74 73 73 Overall satisfaction index (CSI) 67 65 67 69 69 70 69 Global satisfaction 70 68 70 73 71 72 71 Satisfaction with respect to expectations 66 63 66 68 68 69 68 Satisfaction with respect to the ideal 65 62 64 67 66 68 66
The services index remained stable at 73 points: gas at 76 points and electricity at 73. The water service showed a steady evolution at 74 points. Finally, waste management services reached the high satisfaction level of 70 points. This year, the Group’s branches and call centres surpassed the 70 points threshold (standing both at 73), which demonstrates the effectiveness of training initiatives and the streamlining of internal procedures. 2012 was a year of consolidation of the results and of the service level achieved over the course of the past years. Evidence of the drop in the overall index cannot be found in any of the service components and appears to result from the external environment (satisfaction component in respect to an ideal multi-utility company). Monitoring of the contact channels (branches and call centres) continued in order to guarantee adequate service levels. The new Hera OnLine Branch will be created in 2013 which will make it easier to use the self services provided via the web. A project to improve the multi-service bill is also being implemented, with the aim to help customers and to improve the transparency of the multi-service bills issued by the Group.
The methodology used for the customer satisfaction survey For the seventh consecutive year, the Customer Satisfaction survey was conducted, in November, to assess the quality of services offered and our customers’ satisfaction with Hera overall. Approximately 3,000 telephone interviews were carried out to understand what customers think about the company. The survey was carried out by an international group (CFI Group) and is based on an internationally acknowledged methodology which is also used for measuring the American Customer Satisfaction Index. The survey was conducted by telephone via CATI (Computer Aided Telephone Interviews), which ensures that the shares of individuals interviewed are representative of the sample in respect to all Group service customers. Monitoring was carried out by interviewing the main Hera contact within the nuclear family. The questionnaire is organised in such a way as to keep the average duration of the interview under 18 minutes including for those customers that use several services. The method used is
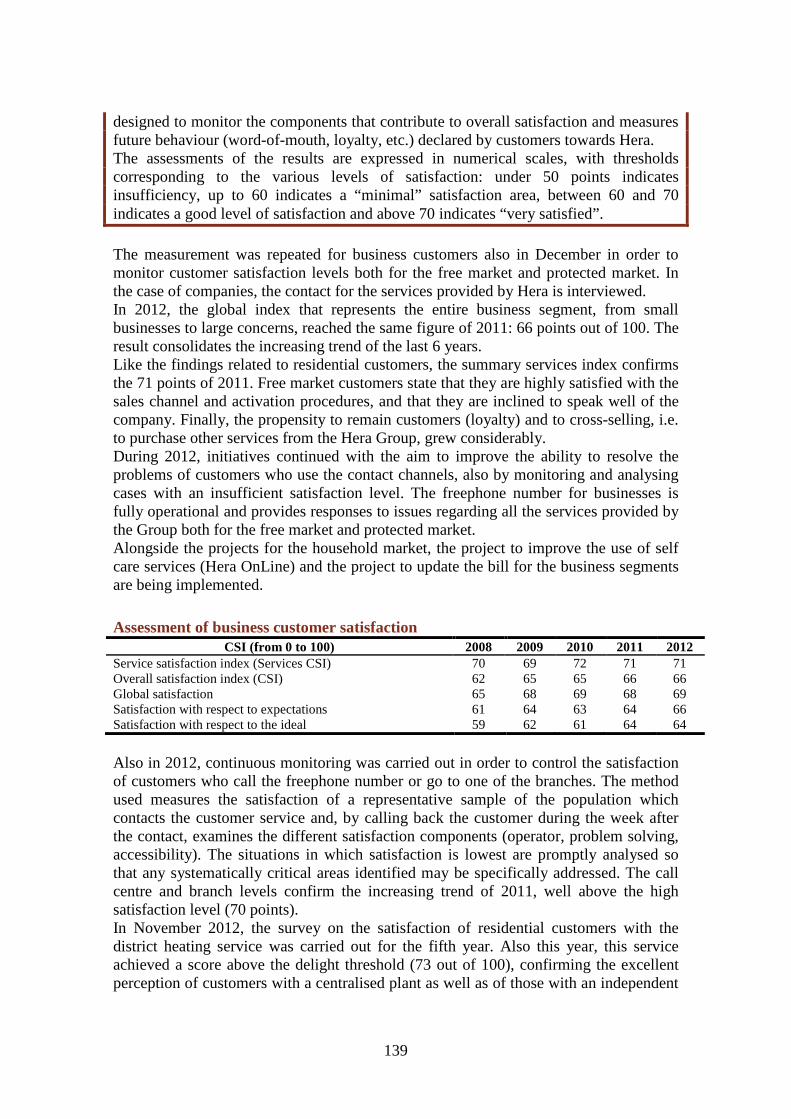
139
designed to monitor the components that contribute to overall satisfaction and measures future behaviour (word-of-mouth, loyalty, etc.) declared by customers towards Hera. The assessments of the results are expressed in numerical scales, with thresholds corresponding to the various levels of satisfaction: under 50 points indicates insufficiency, up to 60 indicates a “minimal” satisfaction area, between 60 and 70 indicates a good level of satisfaction and above 70 indicates “very satisfied”.
The measurement was repeated for business customers also in December in order to monitor customer satisfaction levels both for the free market and protected market. In the case of companies, the contact for the services provided by Hera is interviewed. In 2012, the global index that represents the entire business segment, from small businesses to large concerns, reached the same figure of 2011: 66 points out of 100. The result consolidates the increasing trend of the last 6 years. Like the findings related to residential customers, the summary services index confirms the 71 points of 2011. Free market customers state that they are highly satisfied with the sales channel and activation procedures, and that they are inclined to speak well of the company. Finally, the propensity to remain customers (loyalty) and to cross-selling, i.e. to purchase other services from the Hera Group, grew considerably. During 2012, initiatives continued with the aim to improve the ability to resolve the problems of customers who use the contact channels, also by monitoring and analysing cases with an insufficient satisfaction level. The freephone number for businesses is fully operational and provides responses to issues regarding all the services provided by the Group both for the free market and protected market. Alongside the projects for the household market, the project to improve the use of self care services (Hera OnLine) and the project to update the bill for the business segments are being implemented.
Assessment of business customer satisfaction CSI (from 0 to 100) 2008 2009 2010 2011 2012
Service satisfaction index (Services CSI) 70 69 72 71 71 Overall satisfaction index (CSI) 62 65 65 66 66 Global satisfaction 65 68 69 68 69 Satisfaction with respect to expectations 61 64 63 64 66 Satisfaction with respect to the ideal 59 62 61 64 64
Also in 2012, continuous monitoring was carried out in order to control the satisfaction of customers who call the freephone number or go to one of the branches. The method used measures the satisfaction of a representative sample of the population which contacts the customer service and, by calling back the customer during the week after the contact, examines the different satisfaction components (operator, problem solving, accessibility). The situations in which satisfaction is lowest are promptly analysed so that any systematically critical areas identified may be specifically addressed. The call centre and branch levels confirm the increasing trend of 2011, well above the high satisfaction level (70 points). In November 2012, the survey on the satisfaction of residential customers with the district heating service was carried out for the fifth year. Also this year, this service achieved a score above the delight threshold (73 out of 100), confirming the excellent perception of customers with a centralised plant as well as of those with an independent
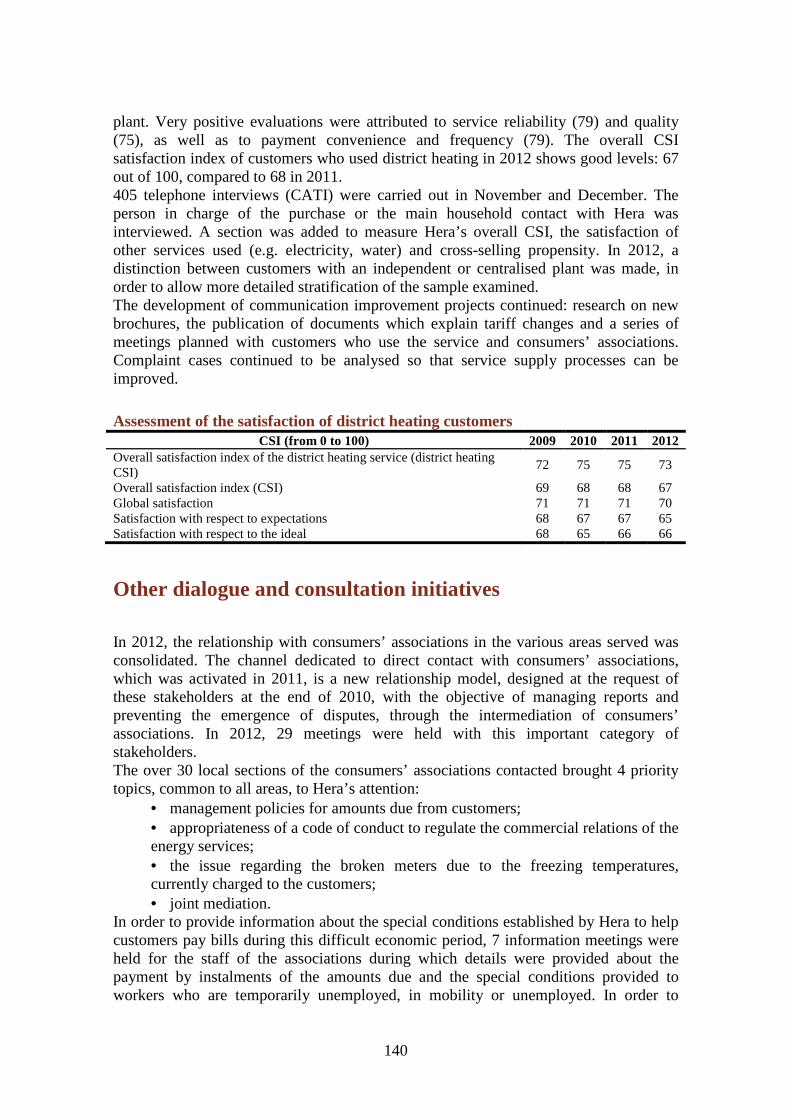
140
plant. Very positive evaluations were attributed to service reliability (79) and quality (75), as well as to payment convenience and frequency (79). The overall CSI satisfaction index of customers who used district heating in 2012 shows good levels: 67 out of 100, compared to 68 in 2011. 405 telephone interviews (CATI) were carried out in November and December. The person in charge of the purchase or the main household contact with Hera was interviewed. A section was added to measure Hera’s overall CSI, the satisfaction of other services used (e.g. electricity, water) and cross-selling propensity. In 2012, a distinction between customers with an independent or centralised plant was made, in order to allow more detailed stratification of the sample examined. The development of communication improvement projects continued: research on new brochures, the publication of documents which explain tariff changes and a series of meetings planned with customers who use the service and consumers’ associations. Complaint cases continued to be analysed so that service supply processes can be improved.
Assessment of the satisfaction of district heating customers CSI (from 0 to 100) 2009 2010 2011 2012
Overall satisfaction index of the district heating service (district heating CSI)
72 75 75 73
Overall satisfaction index (CSI) 69 68 68 67 Global satisfaction 71 71 71 70 Satisfaction with respect to expectations 68 67 67 65 Satisfaction with respect to the ideal 68 65 66 66
Other dialogue and consultation initiatives
In 2012, the relationship with consumers’ associations in the various areas served was consolidated. The channel dedicated to direct contact with consumers’ associations, which was activated in 2011, is a new relationship model, designed at the request of these stakeholders at the end of 2010, with the objective of managing reports and preventing the emergence of disputes, through the intermediation of consumers’ associations. In 2012, 29 meetings were held with this important category of stakeholders. The over 30 local sections of the consumers’ associations contacted brought 4 priority topics, common to all areas, to Hera’s attention:
• management policies for amounts due from customers; • appropriateness of a code of conduct to regulate the commercial relations of the energy services; • the issue regarding the broken meters due to the freezing temperatures, currently charged to the customers; • joint mediation.
In order to provide information about the special conditions established by Hera to help customers pay bills during this difficult economic period, 7 information meetings were held for the staff of the associations during which details were provided about the payment by instalments of the amounts due and the special conditions provided to workers who are temporarily unemployed, in mobility or unemployed. In order to

141
comply with the request for greater transparency in the commercial agreements regarding gas and electricity services, Hera Comm started to draw up a self-regulation code at the end of 2012, which will be presented and shared with all the consumers’ associations within the first half of 2013. In order to understand and effectively examine the associations’ needs and expectations with respect to mediation, the company will launch a series of specific meetings throughout all the area in 2013. Thanks to the highly qualified personnel identified and trained for this project by Hera customer management, in 2012 635 cases were managed through this channel, on the rise compared to the 365 cases managed in the previous year. 94% of the cases managed in 2012 were successful (88% in 2011) with average solving time for the case of 5 days. The request to improve communication on the Group’s website is among the requests received from the associations. The new website section dedicated to the consumers’ associations has been online since April 2013. By accessing this section, associations can easily find the nearest contact and directly submit any questions or requests in order to receive information about the cases of their associates. Associations may consult a selected press review regarding topics of interest to them and keep up-to-date on the press releases that the company sends to the press. By logging into the reserved area, managers and consumer contact persons may be informed in real time of new aspects and of the main regulations connected to the services provided. Hera continues to maintain a daily relationship with trade associations in the area it serves, undertaking concrete efforts to guide companies towards new opportunities and innovations in the energy field. This is realised in the communication channel that Hera has launched with over 250,000 small- and medium-sized companies through press activities, newsletters, video news and consulting for the purchase of energy services by client companies with main focus on the rational use of energy and the new opportunities that sustainable energy sources can provide to companies. The electric mobility projects such as the “io guido elettrico” (“I drive electric”) project and the development of a network for the distribution of electric-vehicle recharge stations, captured the interest of client companies. Agreement protocols regarding energy saving and the prevention and reduction of CO2 emissions were also entered into with client companies participating in the projects. Hera has a consolidated relationship with over 70 trade associations and 250,000 members, which fuels a climate of increasing trust and ongoing trust and cooperation.
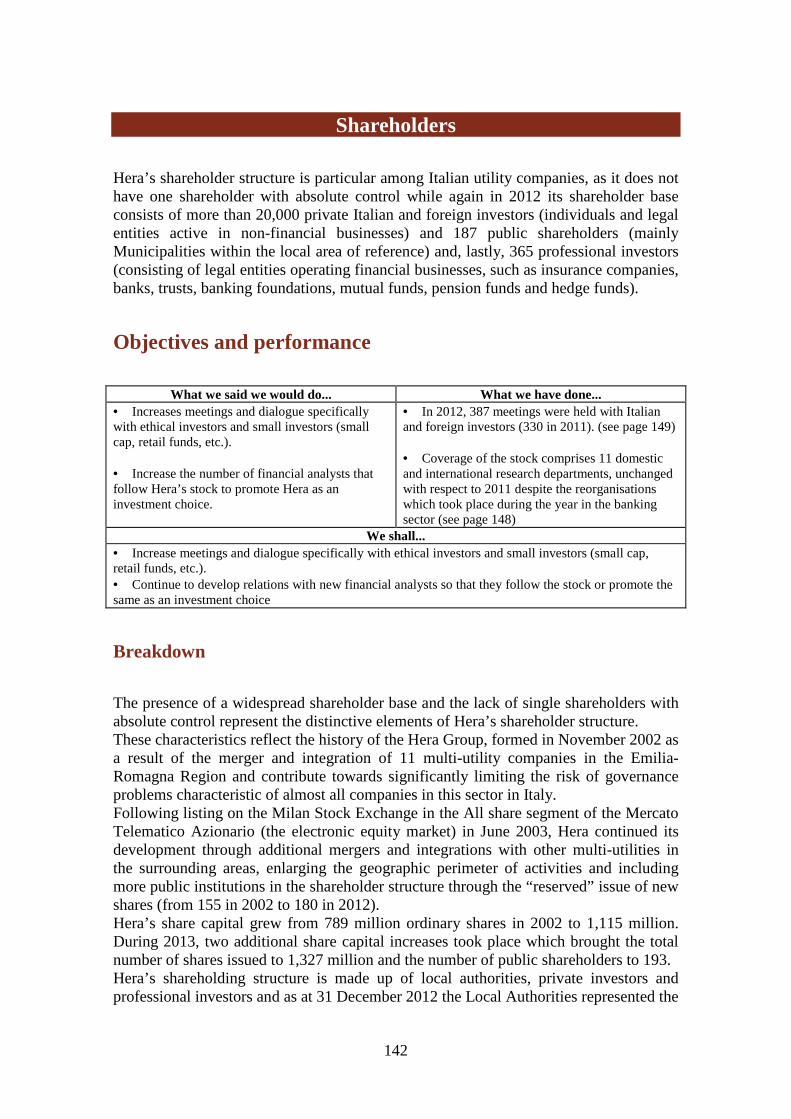
142
Shareholders
Hera’s shareholder structure is particular among Italian utility companies, as it does not have one shareholder with absolute control while again in 2012 its shareholder base consists of more than 20,000 private Italian and foreign investors (individuals and legal entities active in non-financial businesses) and 187 public shareholders (mainly Municipalities within the local area of reference) and, lastly, 365 professional investors (consisting of legal entities operating financial businesses, such as insurance companies, banks, trusts, banking foundations, mutual funds, pension funds and hedge funds).
Objectives and performance
What we said we would do... What we have done... • Increases meetings and dialogue specifically with ethical investors and small investors (small cap, retail funds, etc.). • Increase the number of financial analysts that follow Hera’s stock to promote Hera as an investment choice.
• In 2012, 387 meetings were held with Italian and foreign investors (330 in 2011). (see page 149) • Coverage of the stock comprises 11 domestic and international research departments, unchanged with respect to 2011 despite the reorganisations which took place during the year in the banking sector (see page 148)
We shall... • Increase meetings and dialogue specifically with ethical investors and small investors (small cap, retail funds, etc.). • Continue to develop relations with new financial analysts so that they follow the stock or promote the same as an investment choice
Breakdown
The presence of a widespread shareholder base and the lack of single shareholders with absolute control represent the distinctive elements of Hera’s shareholder structure. These characteristics reflect the history of the Hera Group, formed in November 2002 as a result of the merger and integration of 11 multi-utility companies in the Emilia- Romagna Region and contribute towards significantly limiting the risk of governance problems characteristic of almost all companies in this sector in Italy. Following listing on the Milan Stock Exchange in the All share segment of the Mercato Telematico Azionario (the electronic equity market) in June 2003, Hera continued its development through additional mergers and integrations with other multi-utilities in the surrounding areas, enlarging the geographic perimeter of activities and including more public institutions in the shareholder structure through the “reserved” issue of new shares (from 155 in 2002 to 180 in 2012). Hera’s share capital grew from 789 million ordinary shares in 2002 to 1,115 million. During 2013, two additional share capital increases took place which brought the total number of shares issued to 1,327 million and the number of public shareholders to 193. Hera’s shareholding structure is made up of local authorities, private investors and professional investors and as at 31 December 2012 the Local Authorities represented the

143
most sizable category among Hera’s investors, with 60.6% of the share capital, and they mainly comprise Municipalities of the Emilia-Romagna provinces in which the Group operates. Almost all local authorities holding shares signed the so-called “Shareholders’ Agreement”, which binds them to maintain equity investments representing 51% of Hera’s share capital, as stipulated in the company’s Articles of Association. The so-called “free float” of shares therefore comprises 49% of the share capital, and 80% of it is held by private and professional investors, both Italian and foreign and the rest by public shareholders. Over the years, also the private and public shareholders have been greatly diversified: on the dividend coupon date in June 2012, 28.6% of Hera’s shares were held by Italian and foreign professional investors such as insurance companies, banking institutions, banking foundations, pension funds, mainly Anglo-American mutual funds, whilst 9.5% of them were held mainly by Italian private investors. Since its listing, Hera has had thousands of residents of the areas served, who are therefore, also customers of the Group, among its shareholders. On the dividend coupon date in 2012, Hera held 11.4 million treasury shares in the portfolio, totalling 1% of the share capital. Since 2006, Hera has in fact adopted a treasury share buy-back plan providing for a maximum rotating limit of 24 million shares for a total amount of Euro 60 million. The purpose of the plan is to finance possible additional opportunities for integration of small companies and to normalise any anomalous price fluctuations compared to those of the main Italian securities. The Shareholders’ Meeting of 27 April 2012 renewed the treasury share buy-back plan for an additional 18-month period, for a total amount of Euro 40 million.
Shareholders no. 2010 2011 2012
Municipalities and other public Entities 187 187 187 Professional investors 369 401 365 Private investors 21,546 20,581 20,483 Total 22,102 21,169 21,035 Figures refer to the dividend payment date. Source: Hera processing of data from Servizio Titoli S.p.A.
Shares held (breakdown) % 2010 2011 2012
Municipalities and other public Entities 61.3% 60.1% 60.9% Professional investors 25.2% 29.6% 28.6% Private investors 13.0% 9.9% 9.5% Treasury shares 0.5% 0.5% 1.0% Total 100% 100% 100% Total shares (million) 1,115.0 1,115.0 1,115.0 Figures refer to the dividend payment date. Source: Hera processing of data from Servizio Titoli S.p.A.
The decrease in the share held by private investors coincides with the negative situation of most companies in the energy industry as a result of the macroeconomic recession. The Group maintained its policy of paying dividends stable, confirming the process adopted since its inception. This policy, which distinguished itself in the sector during 2012, was deemed sustainable by financial analysts for years to come as well, both in light of the results published in 2012 and the 2012-2016 Business Plan.
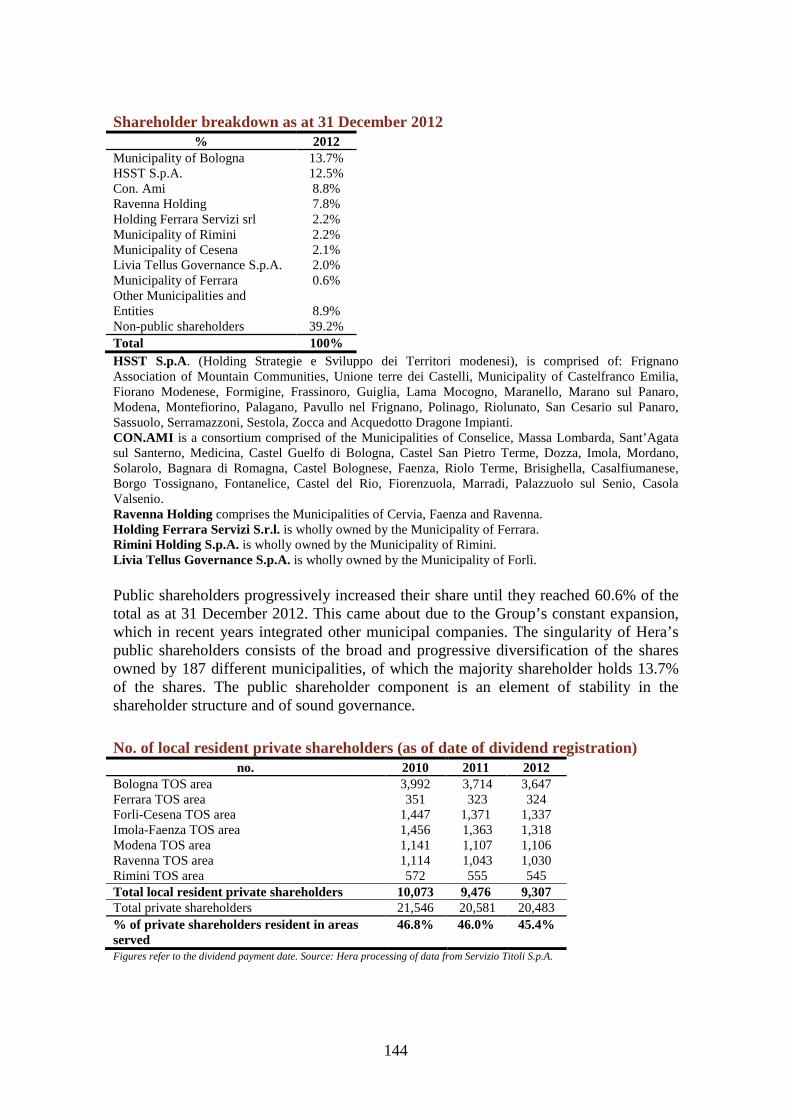
144
Shareholder breakdown as at 31 December 2012 % 2012
Municipality of Bologna 13.7% HSST S.p.A. 12.5% Con. Ami 8.8% Ravenna Holding 7.8% Holding Ferrara Servizi srl 2.2% Municipality of Rimini 2.2% Municipality of Cesena 2.1% Livia Tellus Governance S.p.A. 2.0% Municipality of Ferrara 0.6% Other Municipalities and Entities 8.9% Non-public shareholders 39.2% Total 100% HSST S.p.A. (Holding Strategie e Sviluppo dei Territori modenesi), is comprised of: Frignano Association of Mountain Communities, Unione terre dei Castelli, Municipality of Castelfranco Emilia, Fiorano Modenese, Formigine, Frassinoro, Guiglia, Lama Mocogno, Maranello, Marano sul Panaro, Modena, Montefiorino, Palagano, Pavullo nel Frignano, Polinago, Riolunato, San Cesario sul Panaro, Sassuolo, Serramazzoni, Sestola, Zocca and Acquedotto Dragone Impianti. CON.AMI is a consortium comprised of the Municipalities of Conselice, Massa Lombarda, Sant’Agata sul Santerno, Medicina, Castel Guelfo di Bologna, Castel San Pietro Terme, Dozza, Imola, Mordano, Solarolo, Bagnara di Romagna, Castel Bolognese, Faenza, Riolo Terme, Brisighella, Casalfiumanese, Borgo Tossignano, Fontanelice, Castel del Rio, Fiorenzuola, Marradi, Palazzuolo sul Senio, Casola Valsenio. Ravenna Holding comprises the Municipalities of Cervia, Faenza and Ravenna. Holding Ferrara Servizi S.r.l. is wholly owned by the Municipality of Ferrara. Rimini Holding S.p.A. is wholly owned by the Municipality of Rimini. Livia Tellus Governance S.p.A. is wholly owned by the Municipality of Forlì. Public shareholders progressively increased their share until they reached 60.6% of the total as at 31 December 2012. This came about due to the Group’s constant expansion, which in recent years integrated other municipal companies. The singularity of Hera’s public shareholders consists of the broad and progressive diversification of the shares owned by 187 different municipalities, of which the majority shareholder holds 13.7% of the shares. The public shareholder component is an element of stability in the shareholder structure and of sound governance.
No. of local resident private shareholders (as of date of dividend registration) no. 2010 2011 2012
Bologna TOS area 3,992 3,714 3,647 Ferrara TOS area 351 323 324 Forli-Cesena TOS area 1,447 1,371 1,337 Imola-Faenza TOS area 1,456 1,363 1,318 Modena TOS area 1,141 1,107 1,106 Ravenna TOS area 1,114 1,043 1,030 Rimini TOS area 572 555 545 Total local resident private shareholders 10,073 9,476 9,307 Total private shareholders 21,546 20,581 20,483 % of private shareholders resident in areas served
46.8% 46.0% 45.4%
Figures refer to the dividend payment date. Source: Hera processing of data from Servizio Titoli S.p.A.

145
Its characteristic as a company that is closely linked to the local area is particular evident in the analysis of Hera’s shareholder structure, which shows a significant historical presence of private “non professional” resident investors. Over 9,300 thousand private investors, i.e. 45% of this category (which includes citizens and private companies that are not professionally dedicated to management of savings, both Italian and foreign) resides in the areas served by Hera. In the past three years, the number of non professional investors has stably remained above 20 thousand individuals.
Corporate Governance and safeguards for shareholders
Since the inception, Hera has adopted a traditional Corporate Governance system based on a Board of Directors, in order to guarantee protection and return on capital for shareholders and fulfilment of stakeholder interests in line with the company mission. Hera’s activities are managed in compliance with the Group’s mission and Code of Ethics, and according to the provisions of the Code of Conduct promoted by Borsa Italiana S.p.A. For years, Hera has been committed to guaranteeing full transparency to shareholders and all other stakeholders by providing clear, complete and timely information about the decisions taken, the strategies adopted and the results achieved, so that investors may make investment decisions based on effective knowledge of the company, its future prospects, business performance and the forecasted levels of profitability with respect to the quantities of capital invested. The Investor Relations Department and External Relations Department report directly to the executive Chairman of the Board of Directors, while the Corporate Social Responsibility Department reports directly to the Chief Executive Officer; the direct relationship between these Departments and the top management attests to the importance assigned by the Group to control and dissemination of information to stakeholders. Price sensitive information is communicated in accordance with the procedures established by Consob resolutions and Internal Dealing regulations, and the principles of transparency, clarity, completeness and timeliness which are the foundation of the Group’s communications policy. The yearly publication of the calendar of corporate events for the year allows the company to announce in advance the most important dates for company life: All price sensitive communications such as approval and publication of financial statements, quarterly and interim reports, business plans and significant operations are published extremely promptly, on the Group’s internet site, in the Investor Relations section. Hera Shareholders’ Meetings are generally well attended by shareholders; at the last meeting held on 27 April 2012, for the approval of the 2011 financial statements, shareholders representing 73% of the capital were present. Diversification and fragmentation of the shareholder structure, transparent, clear governance supported by the Code of Ethics and the Code of Conduct, as well as advanced, timely, symmetrical financial communication are the distinctive foundations of Hera governance.
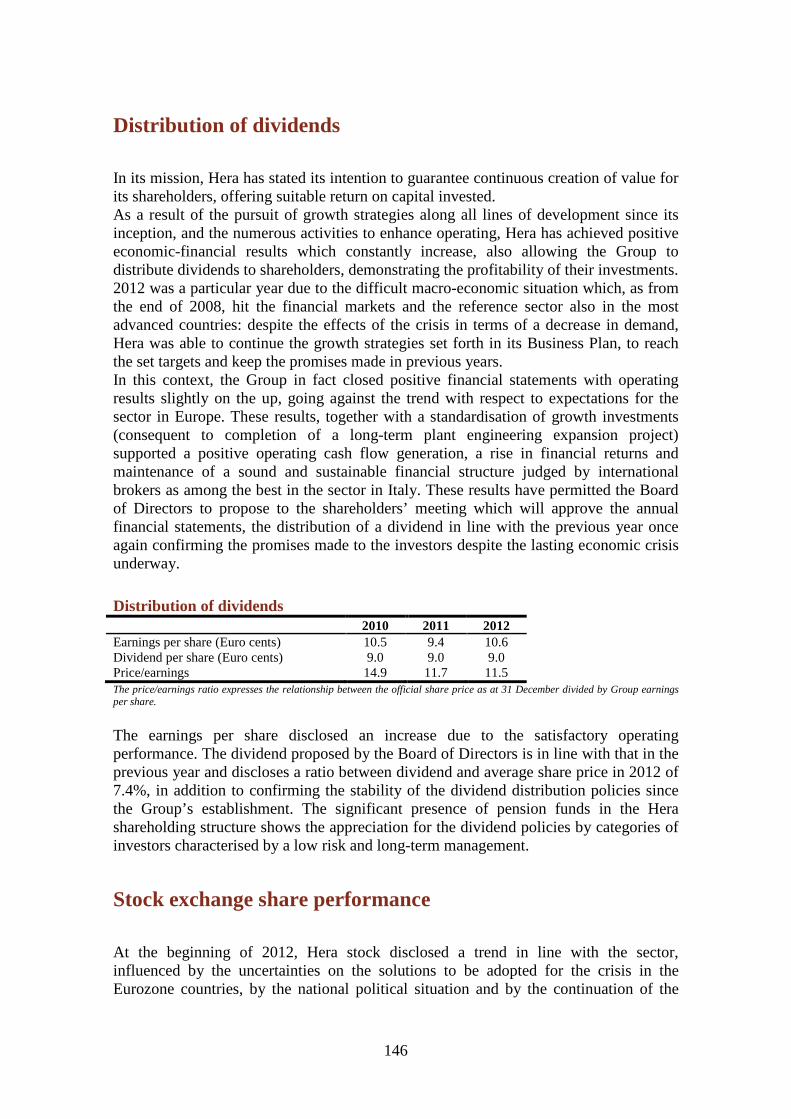
146
Distribution of dividends
In its mission, Hera has stated its intention to guarantee continuous creation of value for its shareholders, offering suitable return on capital invested. As a result of the pursuit of growth strategies along all lines of development since its inception, and the numerous activities to enhance operating, Hera has achieved positive economic-financial results which constantly increase, also allowing the Group to distribute dividends to shareholders, demonstrating the profitability of their investments. 2012 was a particular year due to the difficult macro-economic situation which, as from the end of 2008, hit the financial markets and the reference sector also in the most advanced countries: despite the effects of the crisis in terms of a decrease in demand, Hera was able to continue the growth strategies set forth in its Business Plan, to reach the set targets and keep the promises made in previous years. In this context, the Group in fact closed positive financial statements with operating results slightly on the up, going against the trend with respect to expectations for the sector in Europe. These results, together with a standardisation of growth investments (consequent to completion of a long-term plant engineering expansion project) supported a positive operating cash flow generation, a rise in financial returns and maintenance of a sound and sustainable financial structure judged by international brokers as among the best in the sector in Italy. These results have permitted the Board of Directors to propose to the shareholders’ meeting which will approve the annual financial statements, the distribution of a dividend in line with the previous year once again confirming the promises made to the investors despite the lasting economic crisis underway.
Distribution of dividends 2010 2011 2012
Earnings per share (Euro cents) 10.5 9.4 10.6 Dividend per share (Euro cents) 9.0 9.0 9.0 Price/earnings 14.9 11.7 11.5 The price/earnings ratio expresses the relationship between the official share price as at 31 December divided by Group earnings per share.
The earnings per share disclosed an increase due to the satisfactory operating performance. The dividend proposed by the Board of Directors is in line with that in the previous year and discloses a ratio between dividend and average share price in 2012 of 7.4%, in addition to confirming the stability of the dividend distribution policies since the Group’s establishment. The significant presence of pension funds in the Hera shareholding structure shows the appreciation for the dividend policies by categories of investors characterised by a low risk and long-term management.
Stock exchange share performance
At the beginning of 2012, Hera stock disclosed a trend in line with the sector, influenced by the uncertainties on the solutions to be adopted for the crisis in the Eurozone countries, by the national political situation and by the continuation of the
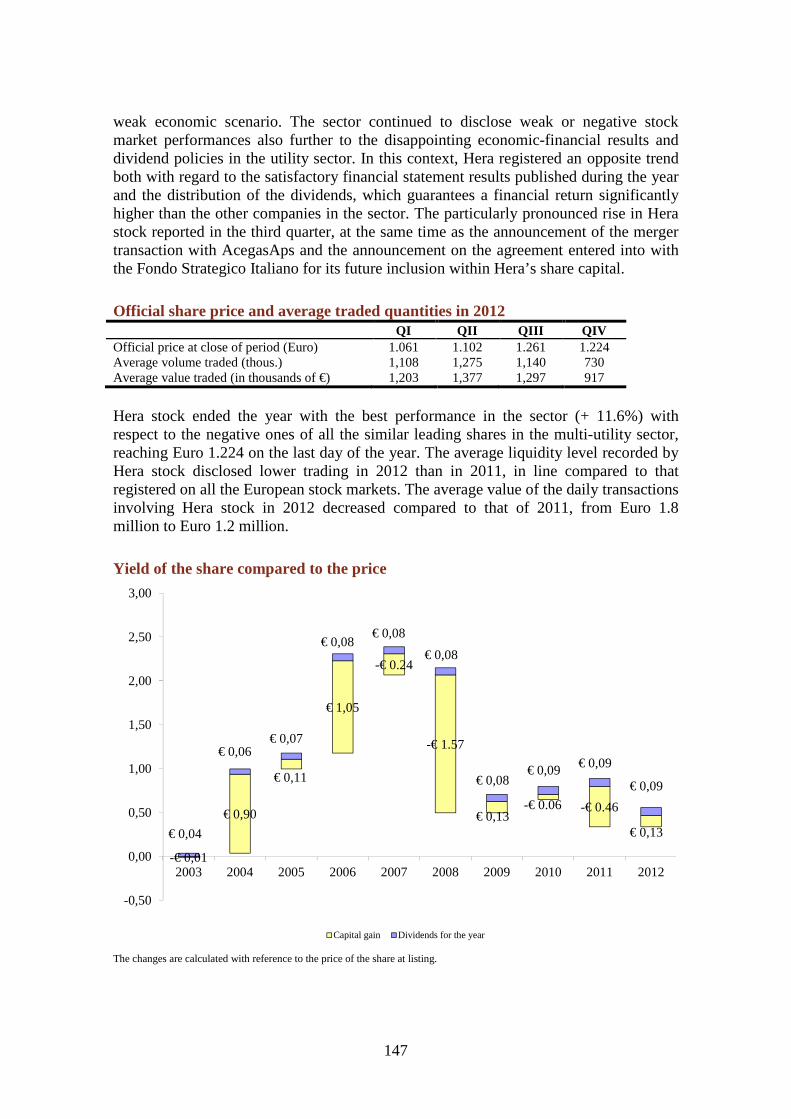
147
weak economic scenario. The sector continued to disclose weak or negative stock market performances also further to the disappointing economic-financial results and dividend policies in the utility sector. In this context, Hera registered an opposite trend both with regard to the satisfactory financial statement results published during the year and the distribution of the dividends, which guarantees a financial return significantly higher than the other companies in the sector. The particularly pronounced rise in Hera stock reported in the third quarter, at the same time as the announcement of the merger transaction with AcegasAps and the announcement on the agreement entered into with the Fondo Strategico Italiano for its future inclusion within Hera’s share capital.
Official share price and average traded quantities in 2012 QI QII QIII QIV Official price at close of period (Euro) 1.061 1.102 1.261 1.224 Average volume traded (thous.) 1,108 1,275 1,140 730 Average value traded (in thousands of €) 1,203 1,377 1,297 917
Hera stock ended the year with the best performance in the sector (+ 11.6%) with respect to the negative ones of all the similar leading shares in the multi-utility sector, reaching Euro 1.224 on the last day of the year. The average liquidity level recorded by Hera stock disclosed lower trading in 2012 than in 2011, in line compared to that registered on all the European stock markets. The average value of the daily transactions involving Hera stock in 2012 decreased compared to that of 2011, from Euro 1.8 million to Euro 1.2 million.
Yield of the share compared to the price
The changes are calculated with reference to the price of the share at listing.
-€ 0,01
€ 0,90
€ 0,11
€ 1,05
-€ 0.24
-€ 1.57
€ 0,13-€ 0.06 -€ 0.46
€ 0,13€ 0,04
€ 0,06€ 0,07
€ 0,08€ 0,08
€ 0,08
€ 0,08€ 0,09 € 0,09
€ 0,09
-0,50
0,00
0,50
1,00
1,50
2,00
2,50
3,00
2003 2004 2005 2006 2007 2008 2009 2010 2011 2012
Capital gain Dividends for the year
148
The graph illustrates the returns to a shareholder who owned Hera shares from the year they were listed (2003) to 31 December 2012, including the proposed dividend for 2012 (which will be distributed in 2013). Despite the effects of the economic and financial recession of recent years, the overall return from listing for shareholders remains positive, with an overall value of 60% in 10 years. This result was entirely attributable to the dividend growth policy pursued since the establishment of the Group, which represents confirmation of its soundness and ability to grow constantly, as well as of the attention reserved for the shareholders.
Ethical stock exchange indices As further proof of its sustainable profile, Hera stock has been included in many ethical indexes: in fact, for years it has been included in the “Kempen SNS Smaller Europe SRI Index” and since 2008 it has been included in the “ECPI Italy SMEs Equity” and the “ECPI Ethical Index EMU” ethical index, which consists of 150 listed companies in the European Economic and Monetary Union market which are considered ethical investments under the “ECPI SRI” methodology. This methodology was developed by ECPI, a company that has been researching social, environmental and governance aspects of companies, assigning ethical ratings and developing, calculating and publishing sustainability indices of the companies at global level since 1997. Furthermore, during 2011, “Oekom Research AG”, one of the leading world rating agencies in the sustainable investments segment, judged Hera to be a “Prime” investment, since it satisfies the environmental and social criteria established by the agency.
Share coverage The Investor Relations Department promotes awareness of Hera with Italian and foreign financial analysts to increase interest in and awareness of the company and raise the number of opinions and independent professional assessments on the business results. The dissemination of this information enables investors to make well informed decisions on the use of their resources. Despite the fact that the financial crisis in recent years has caused intense reorganisation in the banks, Hera still enjoys qualified coverage, balanced between national and international broker studies. Alpha Value, Banca Aletti, Banca Akros, Banca IMI, Centrobanca, Cheuvreux (being merged with Kepler), Citigroup, Deutsche Bank, Equita, Intermonte, Kepler. Furthermore, the analysts of Banca Akros, Cheuvreux, and Deutsche Bank included Hera stock among the best investment opportunities for 2012. At the end of 2012, Hera had a balance between “Buy”/”Outperform” appraisals and “Hold/Neutral” opinions and no negative rating. The average target price of the stock at 12-18 months, expressed by the appraisals of the analysts, came to around Euro 1.5 per share. In 2013, ICBPI launched research on Hera with a “Buy” recommendation. The average target price of the stock at 12-18 months, expressed by the appraisals of the analysts, came to Euro 1.49 per share.

149
Relations with investors and financial analysts
Since it is impossible to access all information necessary to assess an investment opportunity with full knowledge, the relationship between company and investors must necessarily be based on esteem and confidence in the management of the company. The Hera Group pays great attention to shareholders’ trust, because a fair evaluation by the market promotes growth development and value creation through growth via external acquisitions. For this reason, the Investor Relations Department was established at the time of listing, specifically dedicated to providing information to shareholders and financial operators. These activities have become particularly necessary in a period of crisis such as the current one, which features extremely volatile financial markets. Hera’s primary communication tool is its institutional website, easily accessed by all stakeholders (private and professional shareholders, bondholders and financial analysts). The Investor Relations section is continuously updated and contains detailed information and analyses on the main issues of interest to shareholders (financial statements, plans and strategies, financial analysts’ opinions). Again in 2012, communication to private investors was aimed at full disclosure with the quarterly publication of a newsletter on the Group website which illustrates the financial results, the significant initiatives carried out by the Group and containing an analysis both of the performance of the shares on the stock market and of the opinions expressed by independent financial analysts. Additionally, direct relations were maintained with the investors via the website and other on-line instruments, updated in real time. Web-based communications pursued the objective of increasing the usability of information also for private shareholders, via interactive tools such as the accessible version of the financial statements, (including the half-yearly report), the description of the company’s governance, and in conclusion simple analysis of the historical trend in the share price and the opinions of independent financial analysts. Dialogue with private investors during 2012 was more frequent than in past years, due to the instability of the financial markets, in particular the Italian one, which suffered a sharp adjustment due to the sovereign debt crisis. Intense relations with the market made it possible to contain concerns and permit investors to evaluate the investment choice with greater peace of mind. In light of the positive results achieved thanks to the relationships established with private investors, Hera decided to commit itself for actively furthering initiatives for meeting and dialogue, so as to extend the number of contacts and more fully support consensus with this category of investor.
Hera’s 2nd place in the Webranking standings by KWD Once again in 2012, as in the past three years, Hera’s on-line financial communication took its place on the podium, confirming disclosure quality in line with the leading Italian companies. With a score of 85.8 out of 100, Hera is in second place behind Telecom Italia (87.5 points) and in front of Eni (83.5 points). The research offered by the consulting firm KWD Webranking (formerly Hallvarsson&Halvarsson), has for sixteen years represented the best European appraisal in the web communication sector. The 2012 edition analysed 102 companies on the
150
basis of 100 criteria, organised in 10 sections, as defined further to a preliminary survey addressing professionals from financial circles.
In addition to organising specific meetings upon request of individual investors, Hera promotes meetings each year between the Group’s top management and Italian and international financial market operators. In 2012, Hera counted 387 contacts with investors, comprising direct meetings, company and plant visits, conference calls, and videoconferences (webcast) which involved Italian and foreign investors (mainly British, French, American, Swiss, German and Scandinavian). The intense relations maintained made it possible to fuel a constant exchange of information with shareholders and to respond to the growing sense of uncertainty perceived by stakeholders in the recessive environment. During the institutional road shows organised by Hera, around 10 ethical investors were also met, including the leaders in the category in Europe, for the purpose of making the most of the sustainable approach also care of the investors who have become increasingly more sensitive to these aspects.

151
Financial Institutions
The Group continues with its policy of providing financial institutions with fully transparent and correct information as part of its communication activities, with a balanced distribution of debt.
Major loans (breakdown) as at 31 December % 2010 2011 2012
European Investment Bank 42.8% 47.6% 51.8% Banca Popolare dell’Emilia Romagna - - 9.3% Mediobanca - - 8.5% Banca Intesa 17.0% 12.0% 6.1% Unicredit 8.6% 8.0% 4.9% Banca Credito Cooperativo Ravennate Imolese 1.5% 5.4% 2.9% Banca delle Marche 4.1% 4.2% 2.8% Cassa depositi e prestiti 4.1% 3.8% 2.0% Banca Popolare di Milano 3.4% 3.2% 1.9% Dexia Crediop 5.9% 4.7% 1.8% Other institutions 12.6% 11.1% 8.0% Total 100.0% 100.0% 100.0%
The goal of the Group’s financial management is to maintain an adequate current and prospective balance between capital expenditure and sources of funds, both in terms of duration and of type of rates.
Net financial indebtedness in millions of Euro 2011 2012
Cash on hand 415.2 424.2 Other current loans 42.9 47.3 Current financial indebtedness -122.1 -321.3 Net current financial indebtedness 336.0 150.2 Non-current loans 11.0 17.6 Non-current financial indebtedness -2,334.0 -2,384.4 Net non-current financial indebtedness -2,323.1 -2,366.8 Total net financial indebtedness -1,987.1 -2,216.6
During 2012, the financial markets were characterised by great uncertainty with regard to the solidity and stability of the economic-financial system in the Eurozone which led to elevated turbulence and volatility. Despite the flat-lining of the market curves, rapid growth was reported in the credit spreads along with an increase in the funding costs of the banks. What is more, 2012 closed with a positive performance for the financial markets, supported by an expansive monetary policy at global level and important decisions adopted by the international institutions to fuel economic growth and spread generalised confidence on the markets. In the last three months of the year, the spread saw a positive trend, and in particular the BTP-Bund differential fell under 300 points.

152
The financial trends which manifested during 2012 immediately overturned on the financial conditions of the Corporates and mainly on those which operate in countries whose sovereign risk is high. In this context, the Group operated in pursuit of the objective of maintaining an adequate balancing of the maturities of the asset and liability items, correlating the loans to consistent sources of funding in terms of duration and repayment method and taking into account the needs to refinance of the current debt structure and the corporate operating methods and, to identify the optimum mix of the sources of funding between fixed and floating rate, within the sphere of a prudent strategy towards rate fluctuation risk. The net financial position as at 31 December 2012 came to Euro 2,216.6 million compared with Euro 1,987.1 million in 2011. The increase in net indebtedness was due to the investments made (289 million), the dividends paid out (116.8 million), the increase of trade receivables due to the earthquake which hit the areas of the Emilia Romagna Region served by the Hera Group, and the extension of the scope of group consolidation with the acquisition of subsidiary companies with high capital intensity (Energonut). In order to strengthen the financial structure and support its business development, the Group took out new medium/long-term loans for a total of Euro 327.5 million used partly to restructure the RBS Put Loan of Euro 70 million and partly to suitably finance the investment plan. Specifically, an important contribution was provided by:
• the disbursement in June of an EIB loan (European Investment Bank) for Euro 125 million to support investment for the enhancement and expansion of gas and the electricity distribution networks with 15 year amortisation, regulated at a Euribor rate of 6 months plus a 1.46% spread.
• the bond issue for Euro 102.5 million which took place on 14 May 2012 and featured particularly long durations of 15 and 20 years at a fixed rate of 5.25%.
• new committed credit facilities for Euro 170 million with a duration of 2/3 years for the purpose of maintaining the liquidity risk indexes firm, given the current market context.
As at 31 December 2012, the Group had about Euro 424 million in cash, Euro 420 million in unused committed credit facilities, as well as ample space on uncommitted credit facilities (Euro 1 billion), for the purpose of guaranteeing sufficient liquidity to cover any financial commitments at least for the next two years. In January 2013, Hera SpA successfully placed a new bond issue for an amount of Euro 700 million maturing in January 2028, availing of the EMTN programme for Euro 1.5 billion, at a fixed rate of 5.2%, partly used to refinance the Puttable bonds. The transaction re-opened the market for Italian corporate issues on particularly long maturities; the last Italian 15-year issue was priced in September 2010.
153
Debt quality The Group aims to assure such a level of cash as to enable it to fulfil its own contractual obligations both under normal business conditions and in a recession, by maintaining available credit lines, cash and promptly starting negotiations on loans reaching maturity, optimising the cost of funding in relation to current and prospective market conditions. We note the balanced asset structure of the Group, which offsets the high level of fixed assets with a financial position mainly comprising medium/long-term debt, equal to 98% with respect to total financial debt. Credit lines and the related financial assets are not concentrated in any specific financial institution but are evenly distributed among the principal Italian and international banks with a use largely inferior to total availability. Average maturing is about 8 years, of which 58% comprises debts with maturity beyond five years. As at 31 December 2012, a significant part of the Group’s net financial position was represented by loan agreements which envisage a series of clauses, in line with international practice, which lay down a number of restrictions. Among these, the main ones are the “pari passu”, negative pledge and change of control clauses. Relating to the mandatory early repayment clauses, financial covenants are not envisaged on the debt, apart from the corporate rating limit by one rating agency only that is lower than “Investment Grade” level (BBB-).
Cost of Debt The Group uses external financial resources in the form of medium/long-term financial debt, bank credit facilities of various types and uses the liquidity available mainly in monetary market instruments which can be immediately unfrozen. The changes in the levels of the market interest rates influence both the financial charges associated with various technical forms of lending and the income of various forms of using liquidity, therefore affecting the cash flows and the net financial charges of the Group. As at 31 December 2012, the exposure to the risk of unfavourable fluctuations in interest rates, with a consequent negative impact on the cash flows, equates to 37% of the total gross financial indebtedness. The remaining 63% is made up of medium/long-term loans at a fixed rate, exposing the Group to Fair value change risk. The application of the rate risk management policy translates from time to time, on the basis of market conditions, into a given combination of fixed rate, floating rate financial instruments and those involving hedging using derivative products. The debts are perfectly consistent with the underlying debt and in compliance with IAS standards. The Group’s hedging policy does not provide for the use of financial instruments for speculative purposes and aims to achieve an optimal identification between the fixed rate and the variable rate as part of a prudent risk fluctuation strategy. The interest rate risk management essentially aims to stabilise the financial flows so as to ensure the revenue therefrom and the certitude of the cash flows from operations. During in 2012, even in the presence of a structure that is strongly characterised by long-term debt, the Group was able to maintain its cost at an overall average level around 4.4%. The portion of value added allocated to financial institutions in 2012 came to Euro 134.1 million.
154
Credit ratings The financial trends which manifested during 2012 are characterised by elevated uncertainty on the solidity and stability of the economic-financial system of the Eurozone which has led to greater turbulence and volatility and which has immediately overturned on the financial conditions of the Corporates and mainly on those which operate in countries whose sovereign risk is high. In this context, the Group has operated via continually balanced recourse to financial indebtedness, so as to permit a sound financial statement structure. Hera S.p.A. has a long term rating of “Baa1 Negative Outlook” for Moody’s and “BBB+ Stable Outlook” for Standard & Poor’s (S&P). During the first half of 2012 Standard & Poor’s rating of “BBB+ Outlook Stable”, was confirmed. On 26 November 2012, Moody’s confirmed the “Baa1 Negative Outlook” long-term rating, positioning the Hera Group a notch higher than the Italian country rating (Baa2 Negative Outlook). Given the current context of deterioration in the Italian macro-economic situation and the uncertainty with regard to the country’s prospects, action and Plan strategies aimed at ensuring the maintenance/improvement of adequate rating levels have been further enhanced. The Italy rating as at the date of publication of this Report is BBB+ negative outlook (S&P), Baa2 negative outlook (Moody’s) and BBB+ negative outlook (Fitch).
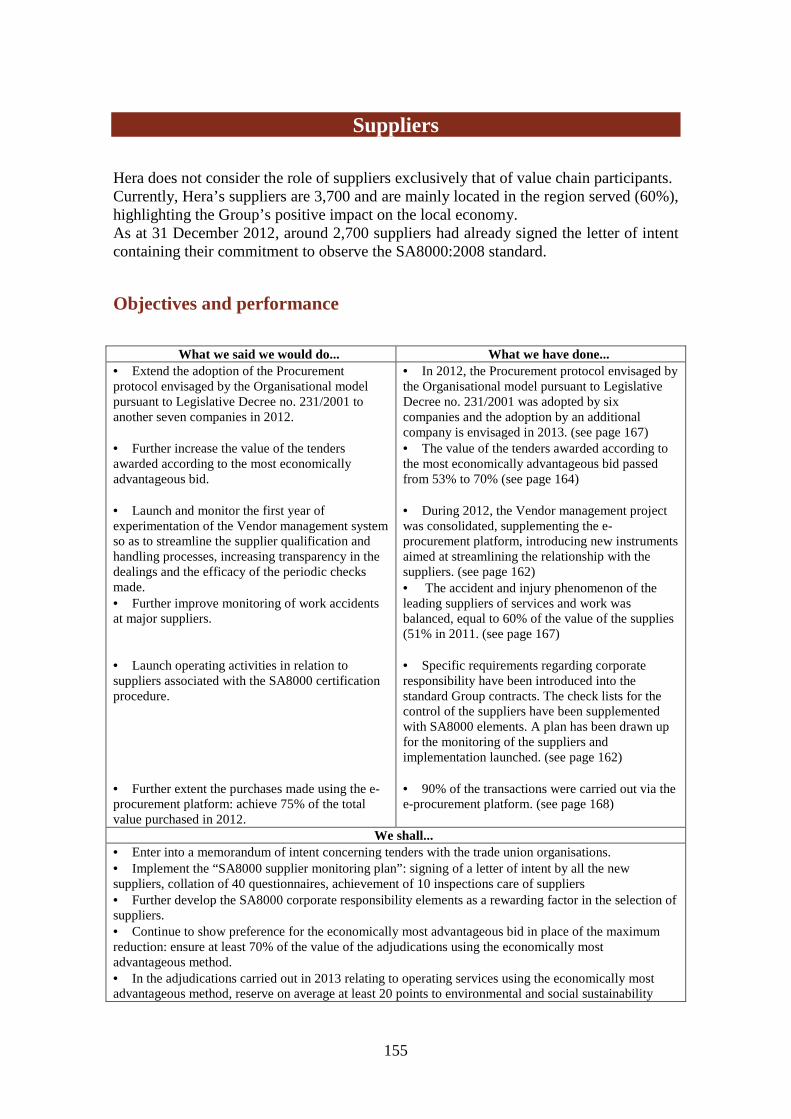
155
Suppliers
Hera does not consider the role of suppliers exclusively that of value chain participants. Currently, Hera’s suppliers are 3,700 and are mainly located in the region served (60%), highlighting the Group’s positive impact on the local economy. As at 31 December 2012, around 2,700 suppliers had already signed the letter of intent containing their commitment to observe the SA8000:2008 standard.
Objectives and performance
What we said we would do... What we have done... • Extend the adoption of the Procurement protocol envisaged by the Organisational model pursuant to Legislative Decree no. 231/2001 to another seven companies in 2012. • Further increase the value of the tenders awarded according to the most economically advantageous bid. • Launch and monitor the first year of experimentation of the Vendor management system so as to streamline the supplier qualification and handling processes, increasing transparency in the dealings and the efficacy of the periodic checks made. • Further improve monitoring of work accidents at major suppliers. • Launch operating activities in relation to suppliers associated with the SA8000 certification procedure. • Further extent the purchases made using the e-procurement platform: achieve 75% of the total value purchased in 2012.
• In 2012, the Procurement protocol envisaged by the Organisational model pursuant to Legislative Decree no. 231/2001 was adopted by six companies and the adoption by an additional company is envisaged in 2013. (see page 167) • The value of the tenders awarded according to the most economically advantageous bid passed from 53% to 70% (see page 164) • During 2012, the Vendor management project was consolidated, supplementing the e-procurement platform, introducing new instruments aimed at streamlining the relationship with the suppliers. (see page 162) • The accident and injury phenomenon of the leading suppliers of services and work was balanced, equal to 60% of the value of the supplies (51% in 2011. (see page 167) • Specific requirements regarding corporate responsibility have been introduced into the standard Group contracts. The check lists for the control of the suppliers have been supplemented with SA8000 elements. A plan has been drawn up for the monitoring of the suppliers and implementation launched. (see page 162) • 90% of the transactions were carried out via the e-procurement platform. (see page 168)
We shall... • Enter into a memorandum of intent concerning tenders with the trade union organisations. • Implement the “SA8000 supplier monitoring plan”: signing of a letter of intent by all the new suppliers, collation of 40 questionnaires, achievement of 10 inspections care of suppliers • Further develop the SA8000 corporate responsibility elements as a rewarding factor in the selection of suppliers. • Continue to show preference for the economically most advantageous bid in place of the maximum reduction: ensure at least 70% of the value of the adjudications using the economically most advantageous method. • In the adjudications carried out in 2013 relating to operating services using the economically most advantageous method, reserve on average at least 20 points to environmental and social sustainability
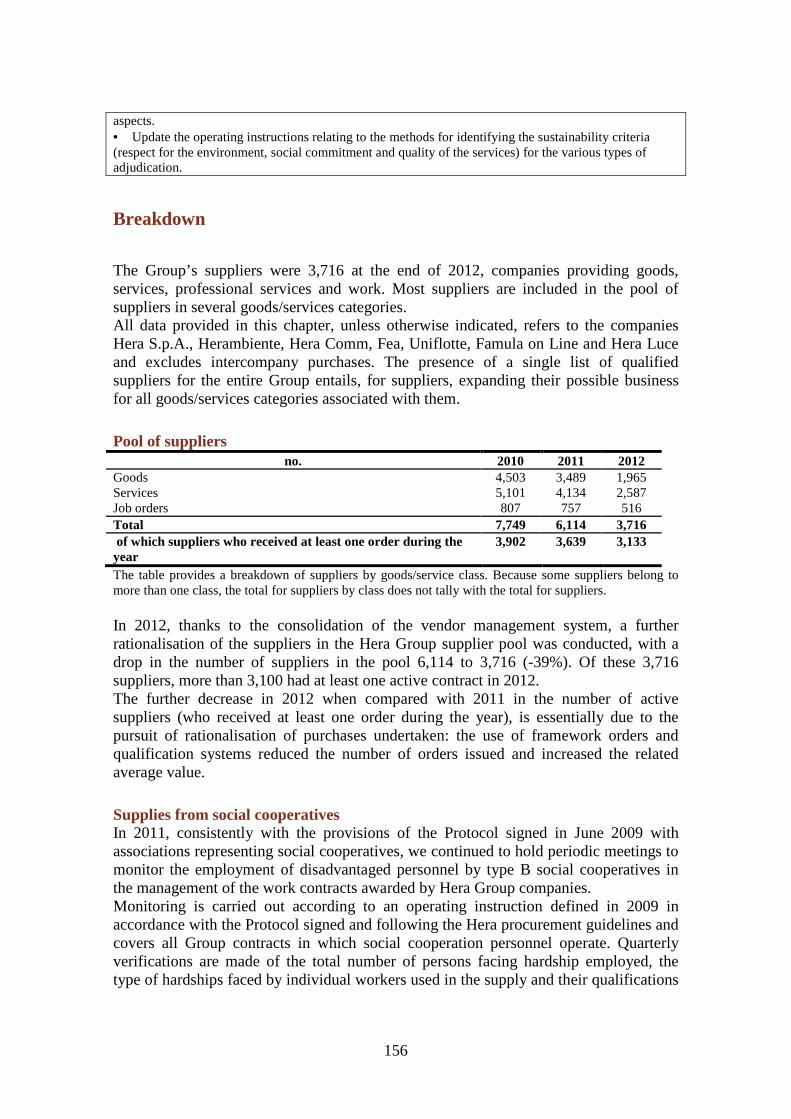
156
aspects. • Update the operating instructions relating to the methods for identifying the sustainability criteria (respect for the environment, social commitment and quality of the services) for the various types of adjudication.
Breakdown
The Group’s suppliers were 3,716 at the end of 2012, companies providing goods, services, professional services and work. Most suppliers are included in the pool of suppliers in several goods/services categories. All data provided in this chapter, unless otherwise indicated, refers to the companies Hera S.p.A., Herambiente, Hera Comm, Fea, Uniflotte, Famula on Line and Hera Luce and excludes intercompany purchases. The presence of a single list of qualified suppliers for the entire Group entails, for suppliers, expanding their possible business for all goods/services categories associated with them.
Pool of suppliers no. 2010 2011 2012
Goods 4,503 3,489 1,965 Services 5,101 4,134 2,587 Job orders 807 757 516 Total 7,749 6,114 3,716 of which suppliers who received at least one order during the year
3,902 3,639 3,133
The table provides a breakdown of suppliers by goods/service class. Because some suppliers belong to more than one class, the total for suppliers by class does not tally with the total for suppliers. In 2012, thanks to the consolidation of the vendor management system, a further rationalisation of the suppliers in the Hera Group supplier pool was conducted, with a drop in the number of suppliers in the pool 6,114 to 3,716 (-39%). Of these 3,716 suppliers, more than 3,100 had at least one active contract in 2012. The further decrease in 2012 when compared with 2011 in the number of active suppliers (who received at least one order during the year), is essentially due to the pursuit of rationalisation of purchases undertaken: the use of framework orders and qualification systems reduced the number of orders issued and increased the related average value.
Supplies from social cooperatives In 2011, consistently with the provisions of the Protocol signed in June 2009 with associations representing social cooperatives, we continued to hold periodic meetings to monitor the employment of disadvantaged personnel by type B social cooperatives in the management of the work contracts awarded by Hera Group companies. Monitoring is carried out according to an operating instruction defined in 2009 in accordance with the Protocol signed and following the Hera procurement guidelines and covers all Group contracts in which social cooperation personnel operate. Quarterly verifications are made of the total number of persons facing hardship employed, the type of hardships faced by individual workers used in the supply and their qualifications
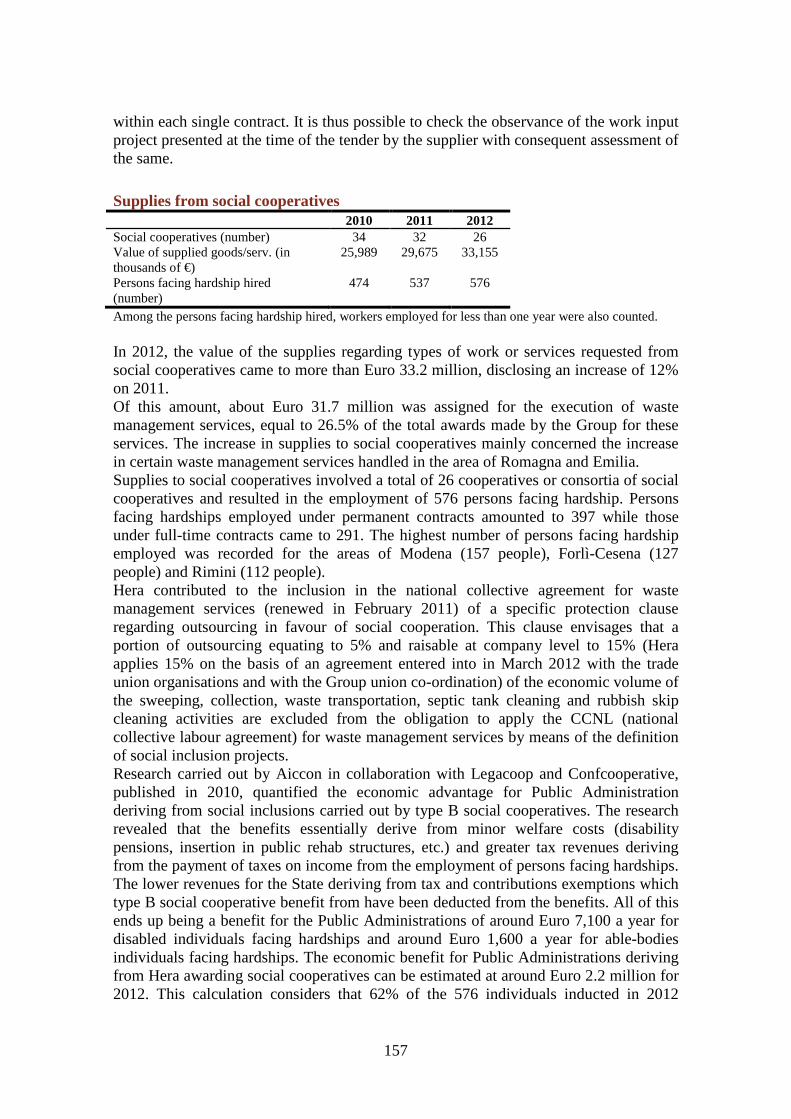
157
within each single contract. It is thus possible to check the observance of the work input project presented at the time of the tender by the supplier with consequent assessment of the same.
Supplies from social cooperatives 2010 2011 2012
Social cooperatives (number) 34 32 26 Value of supplied goods/serv. (in thousands of €)
25,989 29,675 33,155
Persons facing hardship hired (number)
474 537 576
Among the persons facing hardship hired, workers employed for less than one year were also counted. In 2012, the value of the supplies regarding types of work or services requested from social cooperatives came to more than Euro 33.2 million, disclosing an increase of 12% on 2011. Of this amount, about Euro 31.7 million was assigned for the execution of waste management services, equal to 26.5% of the total awards made by the Group for these services. The increase in supplies to social cooperatives mainly concerned the increase in certain waste management services handled in the area of Romagna and Emilia. Supplies to social cooperatives involved a total of 26 cooperatives or consortia of social cooperatives and resulted in the employment of 576 persons facing hardship. Persons facing hardships employed under permanent contracts amounted to 397 while those under full-time contracts came to 291. The highest number of persons facing hardship employed was recorded for the areas of Modena (157 people), Forlì-Cesena (127 people) and Rimini (112 people). Hera contributed to the inclusion in the national collective agreement for waste management services (renewed in February 2011) of a specific protection clause regarding outsourcing in favour of social cooperation. This clause envisages that a portion of outsourcing equating to 5% and raisable at company level to 15% (Hera applies 15% on the basis of an agreement entered into in March 2012 with the trade union organisations and with the Group union co-ordination) of the economic volume of the sweeping, collection, waste transportation, septic tank cleaning and rubbish skip cleaning activities are excluded from the obligation to apply the CCNL (national collective labour agreement) for waste management services by means of the definition of social inclusion projects. Research carried out by Aiccon in collaboration with Legacoop and Confcooperative, published in 2010, quantified the economic advantage for Public Administration deriving from social inclusions carried out by type B social cooperatives. The research revealed that the benefits essentially derive from minor welfare costs (disability pensions, insertion in public rehab structures, etc.) and greater tax revenues deriving from the payment of taxes on income from the employment of persons facing hardships. The lower revenues for the State deriving from tax and contributions exemptions which type B social cooperative benefit from have been deducted from the benefits. All of this ends up being a benefit for the Public Administrations of around Euro 7,100 a year for disabled individuals facing hardships and around Euro 1,600 a year for able-bodies individuals facing hardships. The economic benefit for Public Administrations deriving from Hera awarding social cooperatives can be estimated at around Euro 2.2 million for 2012. This calculation considers that 62% of the 576 individuals inducted in 2012

158
further to Hera Group supplies concern disabled individuals and takes into account part-time insertions.
Raw material supplies The natural gas sold by the Hera Group in 2012 was mainly purchased from Eni Gas & Power (32%). Approximately 9% was purchased from Edison, around 7% from Shell Italia, about 4% from Econgas Italia, roughly 3% from BP Italia, around 2% from other minor national operators and 43% via Hera Trading (which, in turn, mainly purchased gas from Eni, Edison and Econgas). With regard to the electricity market, 38% of sales to end customers on the eligible and protected market were covered by bilateral purchases from other operators, 58% was sourced on the electricity market and 4% by the Imola co-generation plant. The methods for trading electricity, both via sourcing on the electricity exchange and, more generally through bilateral agreements, do not allow for tracing the sources of energy in order to be able to certify the type of production upstream. With regard to generation from thermoelectric power stations in which Hera holds investments, green certificates for 113 GWh were acquired, so as to comply with the obligations set out in the Bersani Decree. During 2012, about 61% of water resource needs (water introduced onto the civil and industrial aqueduct networks) were covered by our own production (springs, rivers and lakes, water tables). The remaining 39% was covered through third party purchases. The major supplier of wholesale water is Romagna Acque - Società delle Fonti, which, since 1 January 2009, has managed all the main water production plants in the Romagna area.
Operations within local communities
Once again in 2012, the positive impact generated by the Hera Group on the local areas and communities where it operates, continued. An indication of this positive impact is that around 60% of Hera suppliers were made up of businesses with commercial headquarters in the area covered by Hera. The reduction in the total number of qualified suppliers with respect to 2011, is consequent to the rationalisation action associated with the new vendor management system as well as the verification of the effective use in the previous three years.
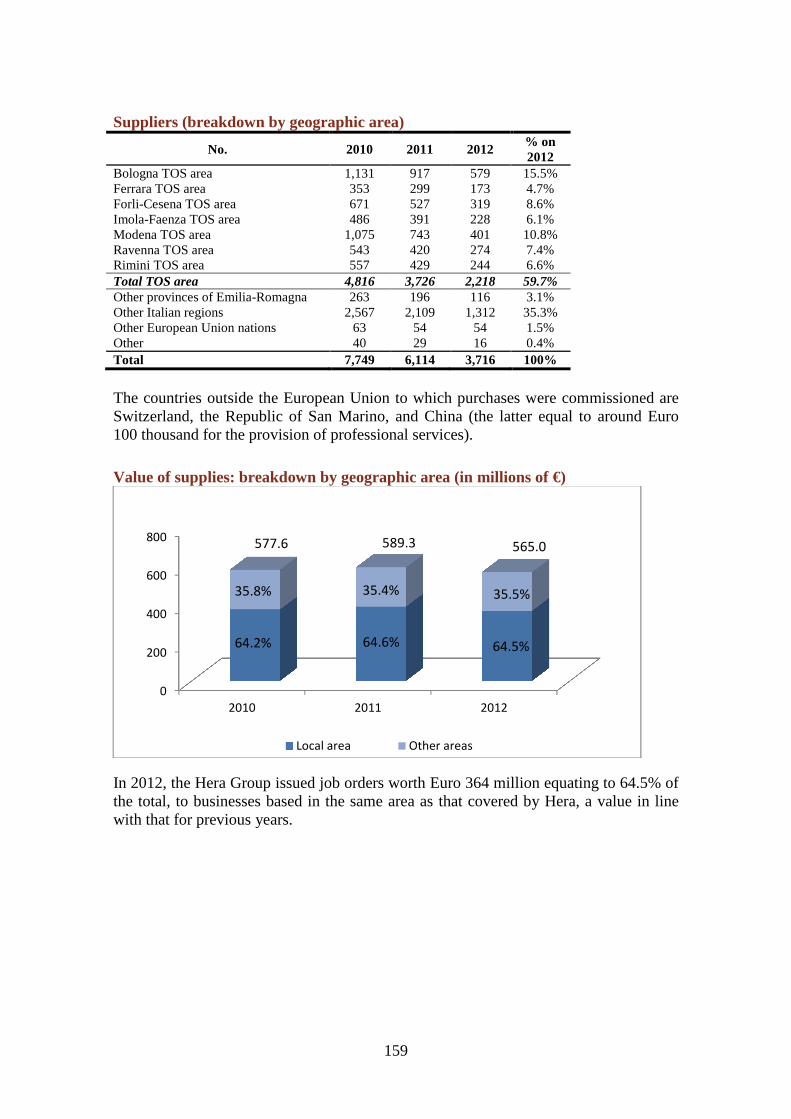
159
Suppliers (breakdown by geographic area)
No. 2010 2011 2012 % on 2012
Bologna TOS area 1,131 917 579 15.5% Ferrara TOS area 353 299 173 4.7% Forli-Cesena TOS area 671 527 319 8.6% Imola-Faenza TOS area 486 391 228 6.1% Modena TOS area 1,075 743 401 10.8% Ravenna TOS area 543 420 274 7.4% Rimini TOS area 557 429 244 6.6% Total TOS area 4,816 3,726 2,218 59.7% Other provinces of Emilia-Romagna 263 196 116 3.1% Other Italian regions 2,567 2,109 1,312 35.3% Other European Union nations 63 54 54 1.5% Other 40 29 16 0.4% Total 7,749 6,114 3,716 100%
The countries outside the European Union to which purchases were commissioned are Switzerland, the Republic of San Marino, and China (the latter equal to around Euro 100 thousand for the provision of professional services).
Value of supplies: breakdown by geographic area (in millions of €)
In 2012, the Hera Group issued job orders worth Euro 364 million equating to 64.5% of the total, to businesses based in the same area as that covered by Hera, a value in line with that for previous years.
0
200
400
600
800
2010 2011 2012
Local area Other areas
577.6 589.3 565.0
35.8% 35.4% 35.5%
64.2% 64.6% 64.5%
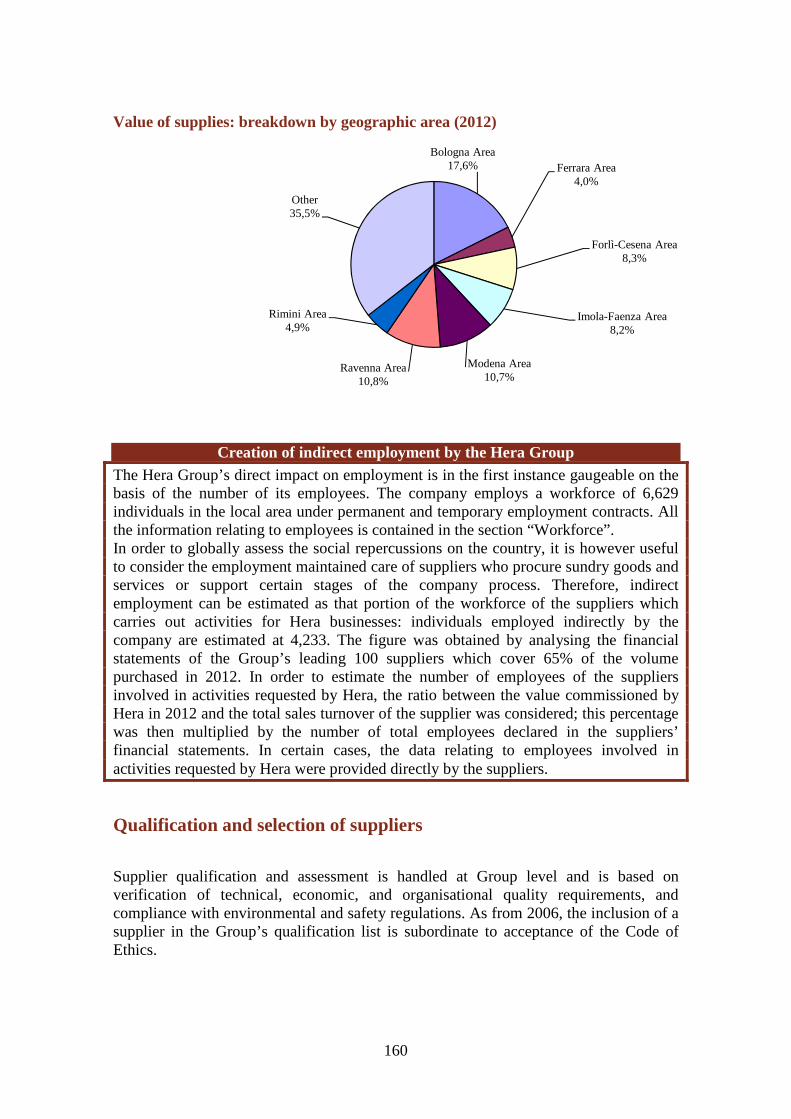
160
Value of supplies: breakdown by geographic area (2012)
Creation of indirect employment by the Hera Group The Hera Group’s direct impact on employment is in the first instance gaugeable on the basis of the number of its employees. The company employs a workforce of 6,629 individuals in the local area under permanent and temporary employment contracts. All the information relating to employees is contained in the section “Workforce”. In order to globally assess the social repercussions on the country, it is however useful to consider the employment maintained care of suppliers who procure sundry goods and services or support certain stages of the company process. Therefore, indirect employment can be estimated as that portion of the workforce of the suppliers which carries out activities for Hera businesses: individuals employed indirectly by the company are estimated at 4,233. The figure was obtained by analysing the financial statements of the Group’s leading 100 suppliers which cover 65% of the volume purchased in 2012. In order to estimate the number of employees of the suppliers involved in activities requested by Hera, the ratio between the value commissioned by Hera in 2012 and the total sales turnover of the supplier was considered; this percentage was then multiplied by the number of total employees declared in the suppliers’ financial statements. In certain cases, the data relating to employees involved in activities requested by Hera were provided directly by the suppliers.
Qualification and selection of suppliers
Supplier qualification and assessment is handled at Group level and is based on verification of technical, economic, and organisational quality requirements, and compliance with environmental and safety regulations. As from 2006, the inclusion of a supplier in the Group’s qualification list is subordinate to acceptance of the Code of Ethics.
Bologna Area17,6% Ferrara Area
4,0%
Forlì-Cesena Area8,3%
Imola-Faenza Area8,2%
Modena Area10,7%
Ravenna Area10,8%
Rimini Area4,9%
Other35,5%

161
Supplier assessment and checking With regard to supplier assessment, the monitoring model and the handling of the periodic assessment of the suppliers was improved in 2012 by means of the introduction of quarterly reporting developed last year which permits the company contact person to check the contractual performance of the suppliers in the three fundamental areas of quality, safety and the environment with the possibility of temporarily suspending the contractual relationship for 3 or 6 months in the event of serious or very serious non-compliance. The checks carried out by the company contact personnel take place for the deliveries of goods on receipt, while in relation to the provision of services and work the check takes place quarterly during the execution of the services by means of compiling and updating specific assessment check lists which take into account the elements concerning any sub-suppliers as well. The number of checks on services and work is defined on the basis of the contractual amount, the term of the order and the contract, and the impact on quality, safety and the environment of the services monitored. During the last quarter of 2012, all the check lists were updated concerning the services and work introducing within the same elements necessary for SA8000 social certification which is operative as from 1 January 2013. In the event that goods or services delivered are found to be non-compliant, the company contact must record and manage the event to guarantee its traceability and its impact on the periodic supplier assessment. In 2012, internal audits continued for checking the procedure adopted: the training plan for company contacts was developed on the elements noted during the encounters as well. In 2012, inspections were also continued at the facilities of suppliers of strategic goods, in some cases noting partially non-compliant behaviours which were promptly highlighted and corrected in a short space of time, with subsequent verification of the effectiveness of corrective actions. 10 inspections were carried out, care of qualified suppliers so as to assess the compliance of the production processes in line with the ISO 9001, ISO 14001 and OHSAS 18001 standards. With regard to Group suppliers, 953 cases of non-compliance were detected in 2012, of which 772 were closed by 31 December 2012.
SA8000 certification: the supplier monitoring plan During 2012, the monitoring of the supplier with respect to the principles and content of the SA8000 standard, was launched within the development process of the Hera S.p.A. SA8000 management system. In the first place, all the 3,700 qualified suppliers were asked to commit to being compliant with the corporate responsibility requirements included in the SA8000: as at 31 December around 2,700 suppliers had signed the letter of commitment as requested in October 2012. A questionnaire was then drawn up for surveying and appraising the commitment of the supplier to correctly apply the eight SA8000 requisites, sent in 2012 to 25 suppliers. A check list was also developed for the SA8000 inspections care of suppliers, partly experimented at the end of 2012 in view of use in the 10 visits scheduled for 2013 (3 inspections already carried out in 2012). Supporting the activities described above, in Autumn 2012 training activities were devised for those working in the Vendor rating and Assurance unit and for the 60 plus buyers of the Procurement and Tenders Division. Training is planned for 2013, for the 300 company contacts, executives and engineers in Hera who implement the daily

162
monitoring of the suppliers: also by means of the use of check lists specifically supplemented at the end of 2012 with reference to the SA8000 contents, these will have to ascertain the degree of observance of the standard’s requisites. In November 2012, a number of important suppliers of services and work were invited to a meeting in order to discuss the process undertaken by Hera for the application of the SA8000 standard.
The Vendor Management system During 2012, the vendor management system was consolidated (the new model for the self-registration and qualification of the suppliers) which for the Group is an important development in the relationship with its suppliers, supplementing the e-procurement platform, introducing new instruments aimed at streamlining the relationship with the suppliers making the supplier qualification and assessment process more central within the Group’s certified system. Within the supplier qualification area, it is possible to access the Hera Group’s procurement product categories, making it possible to use the following services:
• independently update the profiles of interest, putting oneself forward for any new commodity groups within the accredited suppliers system; • keep ones details up-to-date independently (in particular, contact person and e-mail address) as well as the schedule of the supplier qualification documents; • check one’s qualification and periodic assessment status; • gain the possibility of being called more frequently to present bids; • gain the possibility of receiving information relating to the awarding of a contract; • be updated on the Group’s initiatives of economic interest;
With regard to the suppliers who request that they be included in the Hera supplier qualification system managed using the e-procurement platform, an annual membership fee is envisaged in keeping with the number of commodity groups which the supplier shows interest in.
Qualified suppliers: breakdown by type of certification In 2012 there was a further increase in the percentage of supplies ordered from certified suppliers. This was the result of direct action taken by the company via systematic inclusion of quality certification as an obligatory requirement in the public invitations for tenders or the supplier approval stage. The increase was also the result of a greater awareness in the business system that improvement in these spheres is a component of competitiveness. The following is disclosed:
• the increase of almost 10% in purchases from suppliers in possession of ISO 14001-EMAS certification, an increase which takes the value of the supplies relating to 2012 from suppliers with this certification to 51%;
• the rise of 56% for those in possession of OHSAS 18001 certification: the value of the corresponding supplies passes from 15% in 2011 to 25% in 2012;
• the increase of more than 60% of the purchases from suppliers with SA8000 certification; around 9% of the value of the supplies comes from suppliers in possession of this certification (5% in 2011).

163
Procurement from qualified suppliers (value breakdown by type of certification) - % of total supplies)
% 2010 2011 2012 Quality certification (ISO 9001) 78.3% 78.7% 79.7% Environmental certification (ISO 14001-EMAS) 35.2% 44.4% 50.7% Certification of qualification for execution of public works (SOA)
38.5% 37.3% 46.5%
Occupational safety (OHSAS 18001) 11.3% 15.3% 24.9% Social certification (SA8000) 2.5% 5.1% 8.5% Lab analysis quality certification (SINAL) 2.5% 3.1% 3.9% Measurement instrument calibration quality certification (SIT) 0.2% 0.2% 0.4% Total supplies (in millions of €) 577.6 589.2 565.0
Tenders for contracts awarded on the basis of the most economically advantageous bid approach In the specific areas identified in the Hera Group’s Procurement guidelines, and in detail “social commitment”, “quality of services” and “economic value”, sustainability criteria have been identified which are the fruit of the experience acquired in managing calls for tenders according to the method of the most economically advantageous bid, based on doctrine and also on regulations on the matter, in line with Hera Group objectives. In the operating instruction “Identifying Sustainability Criteria by Goods/Services Purchasing Sub-Category” a minimum number of sustainability criteria for choosing suppliers were established, based on the amount and importance of the tender (if it is a tender with a significant impact on the environment, occupational safety, the quality of services provided to customers, the term or amount of the contract). Among the other criteria, mention is made of: the management of atmospheric emissions and sound, prevention, reuse and recyclability of waste; energy efficiency; reduction of the dangerousness of substances used and reduction of water consumption (for the environmental protection criterion), supplier’s adoption of their own Code of Ethics, hiring of persons with disabilities and persons facing hardship, accident prevention (for the social commitment criterion), quality of materials, equipment and instruments, professional qualifications and skills, technical services and performance (for the service quality criterion). The Procurement and Tender Management Departments are responsible for selecting the sustainability criteria. They chose the criteria to be used based on the type of tender, the importance of the sustainability criterion in relation to said tender, and assessments of previous tenders assigned and their results. For assistance in selecting the criteria and assessing bids in the tender phase, the Purchasing and Tender Management Departments can use the technical support of the Corporate Social Responsibility Department and the Quality, Safety and Environment Central Department. In 2013, the updating of the operating instructions relating to the methods for identifying the sustainability criteria was envisaged (respect for the environment, social commitment and quality of the services) for the various types of adjudication.
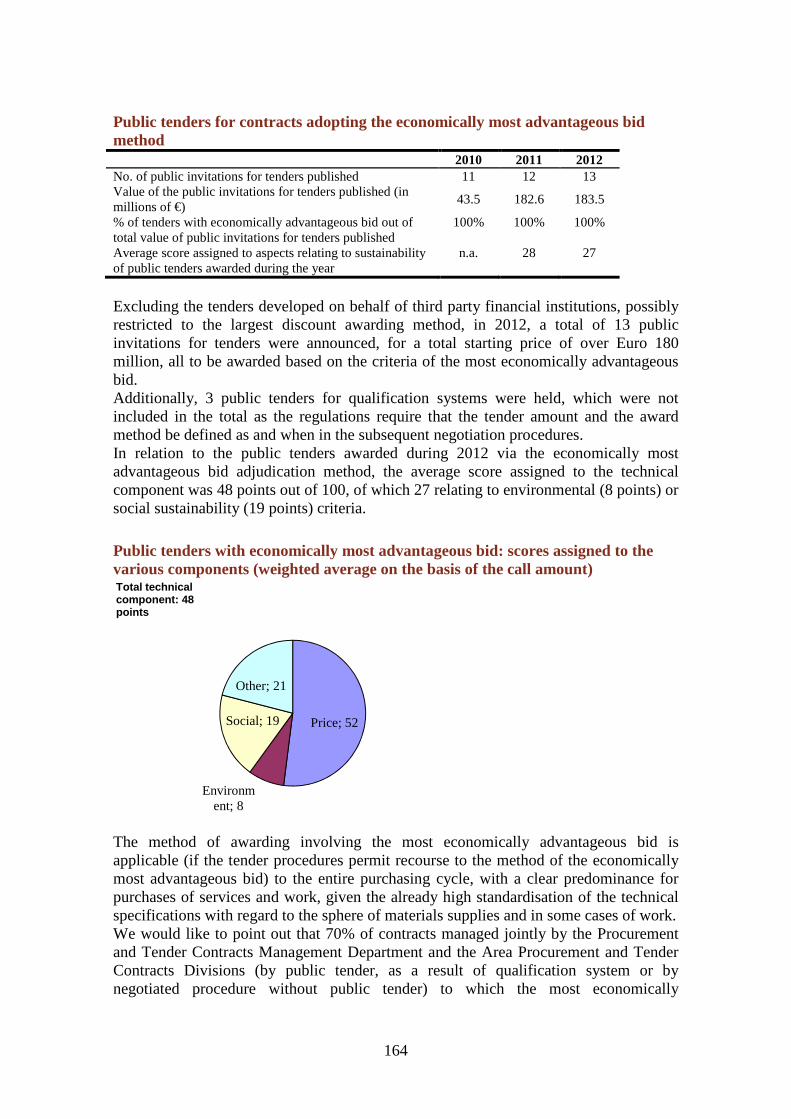
164
Public tenders for contracts adopting the economically most advantageous bid method
2010 2011 2012 No. of public invitations for tenders published 11 12 13 Value of the public invitations for tenders published (in millions of €)
43.5 182.6 183.5
% of tenders with economically advantageous bid out of total value of public invitations for tenders published
100% 100% 100%
Average score assigned to aspects relating to sustainability of public tenders awarded during the year
n.a. 28 27
Excluding the tenders developed on behalf of third party financial institutions, possibly restricted to the largest discount awarding method, in 2012, a total of 13 public invitations for tenders were announced, for a total starting price of over Euro 180 million, all to be awarded based on the criteria of the most economically advantageous bid. Additionally, 3 public tenders for qualification systems were held, which were not included in the total as the regulations require that the tender amount and the award method be defined as and when in the subsequent negotiation procedures. In relation to the public tenders awarded during 2012 via the economically most advantageous bid adjudication method, the average score assigned to the technical component was 48 points out of 100, of which 27 relating to environmental (8 points) or social sustainability (19 points) criteria.
Public tenders with economically most advantageous bid: scores assigned to the various components (weighted average on the basis of the call amount)
The method of awarding involving the most economically advantageous bid is applicable (if the tender procedures permit recourse to the method of the economically most advantageous bid) to the entire purchasing cycle, with a clear predominance for purchases of services and work, given the already high standardisation of the technical specifications with regard to the sphere of materials supplies and in some cases of work. We would like to point out that 70% of contracts managed jointly by the Procurement and Tender Contracts Management Department and the Area Procurement and Tender Contracts Divisions (by public tender, as a result of qualification system or by negotiated procedure without public tender) to which the most economically
Price; 52
Environment; 8
Social; 19
Other; 21
Total technical component: 48 points
165
advantageous bid criterion is applicable took place according to this method, in place of the largest discount (it was 53% in 2011).
Total adjudications adopting the economically most advantageous bid method 2010 2011 2012
Value of the total adjudications to which the economically most advantageous bid adjudication method is applicable (millions of €)
309.8 255.0 321.9
% of adjudications adopting the economically most advantageous bid method
44.6% 53.0% 70.2%
Among the public tenders awarded in 2012, the ones described below are particularly significant due to the importance of the tenders and the significance assigned to sustainability criteria when assessing the bids:
• In the restricted procedure for the awarding of the activities associated with the solid municipal and similar waste collection and transportation, separate waste collection, skip cleaning service, that for the running of the collection centres in the area of the provinces of Bologna, Modena and Ferrara for an amount of around Euro 38 million (around Euro 19 million during the year, of the 60 points reserved for the technical component 25 points have been reserved for social sustainability (development of the projects for the work induction of individuals facing social hardship) and 12 for environmental sustainability (age and impact of vehicles used). • In the restricted procedure for the awarding of the activities associated with the manual and mechanised sweeping service in the area of the provinces of Bologna, Modena and Ferrara for an amount of Euro 38 million (around Euro 19 million during the year), of the 60 points reserved for the technical component 30 points have been reserved for social sustainability (development of the projects for the work induction of individuals facing social hardship) and 8 for environmental sustainability (age and impact of vehicles used). • In the restricted procedure for the awarding of the activities associated with the beach cleaning service in the area of the provinces of Rimini and Ravenna for an amount of Euro 5 million (for a period of two and a half years), of the 60 points reserved for the technical component 22 points have been reserved for environmental sustainability (age and environmental impact of the vehicles used) and 12 for social sustainability (OHSAS18001 certification, accident severity and frequency indexes). • In the procedure negotiated by call for the entrusting of the ancillary activity services on gas, LPG, water, electricity and district heating meters relating to services provided by the Hera Group for an amount of Euro 3.9 million for a period of one year, of the 60 points reserved for the technical component 27 points have been reserved for social sustainability (10 points for safety training, 5 for the safety and/or OHSAS18001 certification procedures, 12 points for the accident severity/frequency indexes) and 15 for environmental sustainability (8 points for the environmental impact of the vehicles, 2 points for the projects for reducing the environmental impact such as for example the planning instruments for the procedures which limit fuel consumption, 5 for the environmental and/or ISO14001 certification procedures).
166
Furthermore, mention is made of the following public qualification systems: • In the procedures further to the public Qualification System for the entrusting of specialist electromechanical maintenance (Euro 3.3 million) and specialist electrical maintenance (Euro 2.8 million) care of the integrated water service plants for a period of one year, of the 60 points reserved for the technical component 27 points have been reserved for social sustainability (10 points for safety training, 5 for the safety and/or OHSAS18001 certification procedures, 12 points for the accident severity/frequency indexes) and 13 for environmental sustainability (8 points for the environmental impact of the vehicles and 5 points for the environmental and/or ISO14001 certification procedures). • In the procedure further to the public Qualification System for the entrusting of the refuse bin maintenance service (Euro 1.6 million for the period of one year), of the 60 points reserved for the technical component 18 points have been reserved for social sustainability (6 points for the accident severity/frequency indexes, 3 points for safety training, 3 for possession of health and safety in the workplace management systems and/or possession of OHSAS18001 certification, 3 points for possession of management systems pertaining to corporate social responsibility and/or possession of SA8000 certification, 3 points for employment of socially disadvantaged individuals) and 8 for environmental sustainability (3 points for possession of environmental procedures and/or ISO14001 certifications, 5 points for assessment of environmental impact of vehicles). • The procedures further to the public Qualification System for the entrusting of the Global Service which includes the availability, maintenance and handling of multifunctional devices (MFD–Multifunctional Devices) integrated with printers in the various premises and satellite offices for a period of three years (Euro 2.1 million), of the 60 points reserved for the technical component 10 points have been reserved for environmental sustainability (energy consumption, sound emissions, ozone emissions, volatile organic compounds and powders from equipment, absence of hazardous substances contained in toners and cartridges, possibility of stripping of equipment and possibility to recycle the plastic and metallic materials).
Contract management
Hera S.p.A.’s Purchases and Contracts Department handles purchases for Hera S.p.A. and those for the Group companies for which a purchasing service exists (Herambiente, Hera Comm, Fea, Uniflotte, Famula on Line and Hera Luce). In 2010, Procurement Protocol 231 was approved by Hera S.p.A.’s Board of Directors; it defines roles, responsibilities, behavioural principles and operating procedures which Group personnel involved in procurement activities must follow. The procurement guidelines, in line with the Group’s Code of Ethics, the organisational model as per Legislative Decree no. 231/2001 and the related Protocol, are the corporate references for supplier selection activities, determining the principles inspiring the Group’s procurement for the acquisition of goods, services and work, aimed both at activities carried out under free market conditions and subject to public works contracts. It is confirmed in the guidelines that the Hera Group favours the economically most
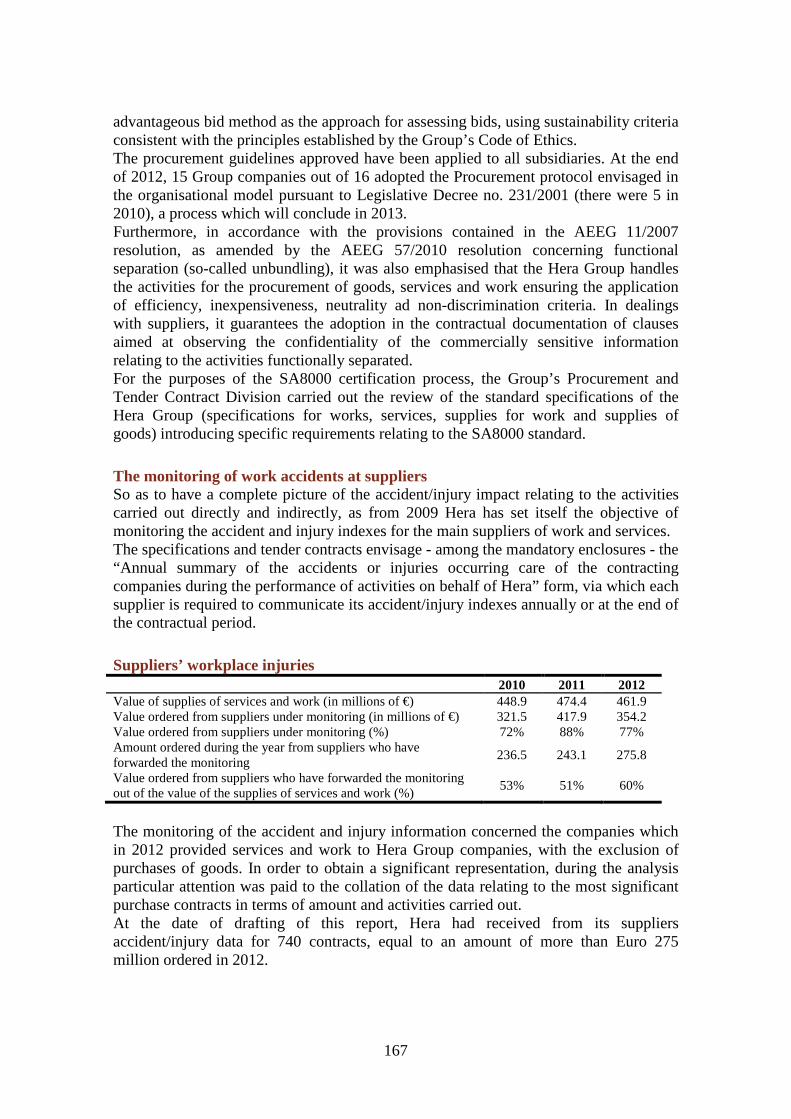
167
advantageous bid method as the approach for assessing bids, using sustainability criteria consistent with the principles established by the Group’s Code of Ethics. The procurement guidelines approved have been applied to all subsidiaries. At the end of 2012, 15 Group companies out of 16 adopted the Procurement protocol envisaged in the organisational model pursuant to Legislative Decree no. 231/2001 (there were 5 in 2010), a process which will conclude in 2013. Furthermore, in accordance with the provisions contained in the AEEG 11/2007 resolution, as amended by the AEEG 57/2010 resolution concerning functional separation (so-called unbundling), it was also emphasised that the Hera Group handles the activities for the procurement of goods, services and work ensuring the application of efficiency, inexpensiveness, neutrality ad non-discrimination criteria. In dealings with suppliers, it guarantees the adoption in the contractual documentation of clauses aimed at observing the confidentiality of the commercially sensitive information relating to the activities functionally separated. For the purposes of the SA8000 certification process, the Group’s Procurement and Tender Contract Division carried out the review of the standard specifications of the Hera Group (specifications for works, services, supplies for work and supplies of goods) introducing specific requirements relating to the SA8000 standard.
The monitoring of work accidents at suppliers So as to have a complete picture of the accident/injury impact relating to the activities carried out directly and indirectly, as from 2009 Hera has set itself the objective of monitoring the accident and injury indexes for the main suppliers of work and services. The specifications and tender contracts envisage - among the mandatory enclosures - the “Annual summary of the accidents or injuries occurring care of the contracting companies during the performance of activities on behalf of Hera” form, via which each supplier is required to communicate its accident/injury indexes annually or at the end of the contractual period.
Suppliers’ workplace injuries 2010 2011 2012
Value of supplies of services and work (in millions of €) 448.9 474.4 461.9 Value ordered from suppliers under monitoring (in millions of €) 321.5 417.9 354.2 Value ordered from suppliers under monitoring (%) 72% 88% 77% Amount ordered during the year from suppliers who have forwarded the monitoring
236.5 243.1 275.8
Value ordered from suppliers who have forwarded the monitoring out of the value of the supplies of services and work (%)
53% 51% 60%
The monitoring of the accident and injury information concerned the companies which in 2012 provided services and work to Hera Group companies, with the exclusion of purchases of goods. In order to obtain a significant representation, during the analysis particular attention was paid to the collation of the data relating to the most significant purchase contracts in terms of amount and activities carried out. At the date of drafting of this report, Hera had received from its suppliers accident/injury data for 740 contracts, equal to an amount of more than Euro 275 million ordered in 2012.
168
Calculations based on the data received identified a frequency index of 54.7 with a severity index of 1.1. These figures refer to 60% of the total value of the supplies of services and work ordered by Hera in 2012 (51% in 2011). Between December 2011 and May 2012, Hera organised extensive training activities for its in-house contract contacts, representing the fundamental point of contact with the suppliers. During the course of the 44 classroom sessions held, the topic of the collation of accident/injury data was looked at in-depth so that the contact individuals were in turn made aware and would press for the forwarding of the requested data by their suppliers. With regard to 2013, further training activities are envisaged, again intended for the in-house contract contacts, within the sphere of the activities envisaged for the adoption of the SA 8000 management system. The project envisages the involvement of more than 300 in-house contact individuals.
The E-procurement system 2010 2011 2012
Volumes handled via the e-procurement platform 39% 70% 90% Suppliers with access to the platform 89% 93% 93%
2012 saw further consolidation of the e-procurement platform which led to the achievement of 90% of the volumes negotiated on this platform (39% and 70% respectively in 2010 and 2011) and 93% of qualified suppliers with coded access to the electronic platform. The system was streamlined even further, improving stability and use. During 2012, other functions were introduced which make accrediting by the suppliers direct and access to the system even more transparent, via the new Vendor management system. Among these, the main one saw the creation of a new documental area shared on the e-procurement platform, the supplier dashboard, which permits the suppliers to view the tender documents and the contractual ones made available by the buyer, sign - by means of appropriate flag - the contract and view and check their supplier qualification status. Use of the platform was also extended to public tenders as from 2011.
Tender contract management manual During 2012, a review of the Tender Contract Management Manual was approved; this document contains confirmation of its purpose as an essential instrument supporting activities of parties tasked with the control of the contracting and subcontracting companies with particular attention paid to protection of the staff used in outsourced activities. The content of the Manual has been adapted to the provisions of the Decree on the simplifications no. 5/2012 regarding joint and several responsibility in tenders between customer and contractor establishing that, in tenders for work and services, the customer is jointly and severally obliged with the contractor and any sub-contractors during the two years as from termination of the contract, to pay the remuneration inclusive of the portions of leaving indemnity, social security contributions and insurance premiums due in relation to the period of execution of the tender contract, while any obligation for civil sanctions is excluded this being the responsibility of the party liable for the breach. Furthermore, steps were taken to update the manual with regard to the new legislative references, to adapt the definitions of Planning supervisor, Contract execution manager
169
and in-house Contact, aligning them with the matters envisaged in the Hera Group standard specifications. During the first few months of 2012, also as a consequence of the consolidation of the new vendor management system, several Training session were held for In-house Contacts (around 700 individuals involved) and their assistants, so as to go over the salient phases of the handling of the contractual relationship and the monitoring of the services provided together.
The use of sub-contracts The Hera Group makes the works directors and the company contacts - parties tasked with checking outside companies - responsible for the preliminary activities necessary for prior authorisation of the sub-contracts, as well as all the subsequent fulfilments necessary for monitoring the activities of sub-contractors on site. The company document which contains the fulfilments of both works directors and company contacts, and those of the contracting and sub-contracting firms regarding tenders, is the tender contract management manual, which specifies the matters envisaged by legislation on the topic of public work and service tenders. The Hera Group works directors and company contacts send reports each month on the sub-contracts authorised within the sphere of all the tender contracts, using a pre-drafted procedure form. The Purchases and Contracts Department reports quarterly regarding the related checks. 22.6 million was sub-contracted out in 2012, equal to 5.2% of the amount of work and services outsourced by the Group. Further to organisational changes which occurred within the Hera Procurement and Tender Contract Management Division, as from 2013 the Vendor Rating and Assurance structure will see to the supervision of the formalities for managing sub-contracting, also via the related reporting and in collaboration with the in-house contacts.
Times of payment as per contract Consistent with the financial stability objectives of the Hera Group as well as Group guidelines, the times of payment as per contract are set at least to 120 days, month-end invoice date. It is possible to depart from said limit, according to the matters envisaged by the guidelines, specific Group procedures and in accordance with the matters envisaged by current applicable legislation.
Supplier relations
The supplier portal is the main tool for communications with the market of suppliers, especially thanks to the consolidation of the activities for the handling of the qualified suppliers via the Vendor Management system and negotiation via the e-procurement platform which today can rightfully be defined as the only negotiation instrument adopted by the Hera Group Purchases and Contracts Department, with 90% of the total volumes handled via this e-procurement platform. Supplier telephone assistance activities continued via the Hera Group suppliers’ helpdesk: in 2012, almost 22,000 requests for assistance were received (around 10,000
170
last year), around 99% of which sorted out within the timescales envisaged by company procedures. The considerable increase in requests with respect to last year is mainly attributable to the request that the suppliers accept the new Vendor management regulations. The helpdesk also considerably increased and consolidated its professionalism, offering an increasingly efficient and effective service, acquiring what is more expertise in supporting suppliers at the time of public tenders. At the beginning of 2012, meetings with representatives of social cooperatives working in the areas served by the Hera Group were organised, to share the 2011 results and opportunities to work together in 2012. In early 2012, based on the analysis of the data collected, the work group confirmed the validity of the procedures defined for monitoring. The meetings held in 2012 also pertained to the ways to promote employment projects. During 2012, meeting were held for discussion with the representatives of the main trade associations in the areas of Forlì-Cesena, Ravenna and Ferrara, in particular so as to illustrate and share the innovations introduced by the new Vendor Management system. Furthermore, meetings were also held in 2012 for discussion with the representatives of the main trade union organisations, regarding Hera’s commitment for 2013 to update the memorandum of intent concerning tenders.
Litigation with suppliers At the end of December 2012, there were 22 pending disputes with suppliers (there were 31 at the end of December 2011), of which 1 initiated in 2011, mainly concerning tender issues.
171
Public Administration
Breakdown
The area Hera operates in is made up of 249 municipal authorities, most of which are company shareholders. Hera has close relations and collaboration with technicians and administrators of municipalities, provinces, regions as well as nationally, and their associations and local bodies. In the area managed by Hera, the organisation of the integrated water service and the municipal waste management service is regulated by the new Emilia-Romagna area agency, set up by Regional Law no. 23/2011. The energy sector (gas and electricity) is regulated by the Italian Authority for Electricity and Natural Gas (AEEG), an independent regulatory and control authority for the sector established by Law no. 481/1995. As from 2012, the AEEG undertook the functions for the regulation of the integrated water service as envisaged by Italian Law no. 214/2011. The research and development activities undertaken by the Group entail collaboration with various bodies (universities, research centres such as ENEA, public bodies and other companies). These activities are conducted via partnerships or quite simply through sponsorship.
We’re full of energy! During the 2011/12 academic year, the course “The energy system and sustainable development: growth, renewable sources and energy savings” was held, organised by Imola Open University in agreement with and with the contribution of Hera and CON.AMI. The course saw the participation of numerous individuals (84 applicants from the public). Speakers of excellence, managers and executives from Hera analysed aspects of the energy balance and its objectives, the strategies to be achieved for indispensable energy savings and the benefits and liabilities associated with renewable sources. The course was closed with a presentation by Professor Andrea Segrè on the subject of “How to plan the future with regard to economic development and wellbeing of the individual”.
Integrity in relationships with the Public Administ ration Hera is committed to guaranteeing the highest levels of integrity and honesty in relationships with public administration. For this reason, the Group has adopted, and keeps updated, a model for organisation, management and control designed to identify specific risks associated with the crimes identified in Legislative Decree no. 231/2001. Currently the organisation model includes 24 protocols that strive to ensure transparency and a sense of ownership in internal and external relationships. For each “high risk” process, the protocols identify principles, roles, and responsibilities which should be followed in managing the activities and define the periodic information flows for control. Each protocol ensures the constant monitoring of high risk activities for the Supervisory Body. The aspects dealt within included: relationship management with the

172
Authorities, public loans, sponsorships, donations and gifts and procurement, protection of the environment and health and safety in the workplace. In 2012 the review of the “Handling of laboratory activities” protocol was carried out. The procedures adopted conform to the principles of the Code of Ethics with the aim of guiding Group management based on the values and principles defined in the Charter of Values.
Relationships with municipalities and other local authorities
The administrators of the shareholder municipalities are major stakeholders in Hera since they are majority shareholders and constitute a link between Hera and the areas in which Hera is operational. Structured forms of dialogue exist with the Mayors: in 2012, in Bologna there was one meeting with the Bologna area Municipalities Committee and a series of encounters with the Intermunicipal Association and/or Associations of Mountain Communities. In Ferrara, a by now consolidated relationship with the Chairmen of the District Councils lies at the basis of an important venture aimed at improving the decor and developing separate waste collection. In Imola-Faenza, the meetings with CON.AMI were periodically attended, informing the Mayors of its local area on the investments made, the scheduled measures, the situation of the services and the information and promotion initiatives. A number of meetings were held with the citizens elected in the Imola “forums” and in the districts of Faenza with regard to separate refuse collection and development of the “door to door” system.
Hera and the Ferrara Prefecture together for legality The Hera Group and the Ferrara Prefecture signed the memorandum of intent for the prevention of infiltration of organised crime in the sector of tender contracts and concessions for public works, already agreed on with many public bodies in their capacity as contractors. Criminal organisations manifest a growing tendency to branch out also in areas such as Emilia-Romagna, traditionally extraneous to this phenomenon. At the centre of this agreement is the extension of the anti-mafia controls and the guarantee of accountability in the procedures for the entrusting of work to contracting companies. The memorandum envisages more decisive controls for suppliers and contracting companies, with the establishment of specific databases.
In Modena, the Mayors Panel was met with periodically, which includes the Mayors, or their delegates, from the pertinent local areas. In Ravenna, meetings were held with the municipal authorities and their decentralised offices in order to examine issues relating to the services managed in the area and participation took place in various meetings of the Council Committees so as to provide information and clarification on specific aspects of particular interest to the general public. The Rimini Area Local Shareholders’ Committee had two meetings during which, in particular, the subject of investments in water service plants, the new Separate Refuse Collection Centres for municipal waste, the organisational development of Hera and the new scenarios within the sphere of local public services, were dealt with. In Forlì-Cesena, besides the meetings with the local Mayors’ Committee, cognitive meetings were held with three new mayors elected in

173
2012 and active participation was seen with other local public services companies (local health authorities, ATR, Romagna Acque etc..), along with the meetings of the Users Advisory Committee for local public services in the Municipality of Cesena set up in 2011 and chaired by the Mayor, concerning: the definition of the efficiency, quality and quantity indicators of the services and the furthering of customer satisfaction surveys, the identification of the needs and problems of the service users. Hera has published a newsletter, sent to the Mayors of municipality shareholders via email, containing local area news as well as news of the entire Group. In 2012, 21 issues were published, around three a month.
Over 40 years of promotion of disability Mechanical meters come in and material to be sent for recovery goes out: disabled youngsters learn to strip the devices so as to recover recyclable elements, learning to safely use the tools and gaining experience for induction into future employment. This is the laboratory present in Modena in relation to which the agreement between the Local Health Authority and Hera, which dated back to 1987, was renewed in early 2012. The laboratory, located within the Via Razzaboni premises, where the company makes everything available which the youngsters need so as to work, each year recovers around 1,000 kg of wood, 300 kg of iron, 200 kg of copper, 150 kg of glass and 100 kg of aluminium.
Relations with regulatory and supervisory authorities
The relationship with local regulatory and supervisory authorities Water and waste management policies involve the participation of numerous local institutions, who are the protagonists of the various phases: regulation, planning, management and control. Regulation By defining guidelines and strategies, the Emilia-Romagna Regional Authority exercises the legal function of regulation of the water service and management of waste in harmony with the national regulation bodies if existing and in agreement with the Provincial, Municipal and Catchment Area Authorities. Regional Law no. 23/2011 established the Emilia-Romagna area agency for water and waste services (ATERSIR), a body endowed with administrative, accounting and technical autonomy, which performs the functions of the previous Water and Waste Regulatory Authorities. On 3 October 2012, in pursuance of Italian Law no. 214/2011 which laid down the transfer to the Gas and Electricity Authority of the functions for the regulation and control of the integrated water service, the Prime Minister’s Decree was published which establishes that the AEEG may fix the objectives of the service quality, arrange and periodically review the tariff methods and make proposals for the review of current legislation. Any act approved by the ATERSIR must therefore be compliant with the AEEG regulation. Planning
174
Regional strategies are set out and applied by the Provincial, Municipal Authorities and the area Agency. For the Integrated Water Service, the Water Protection Plan is the main document which sets forth both the qualitative and quantitative objectives pursued: • maintenance and re-balancing of the water balance between availability and
withdrawals, in order to define usage compatible with water resources, for the purpose of protecting said resources;
• assessment of the characteristics of water bodies through monitoring and the consequent definition of actions for the purpose of achieving quality objectives.
Alongside the Water Protection Plan, the planning instrument that each Water and Waste Regulatory Authority uses (under Regional Law no. 23/2011 the entire regional area is the water and waste regulatory authority) to define the measures necessary for meeting the requirements of the local area is the Authority Plan. In accordance with the planning ordered above, and on the basis of the recognition of the existing works, the Area Plan establishes the management and organisational model for the integrated water service, establishes the service levels to be guaranteed for customers, the priorities for the preparation of the programme of measures, the criteria for defining the related financial plan and the pertinent tariff proposals for the plan years, on a consistent basis with the matters laid down by the AEEG tariff method. The Municipal Authorities contribute to the regulation of the services by means of specific Regulations adopted in harmony with the Regulations authorised by the Area Authority. Decree Law no. 201/2011 transferred the functions pertaining to the regulation and supervision of the tariff for the water services to the Electricity and Gas Authority which will see to the same using the criteria and formalities currently defined for the 2012-2013 period and being defined for the coming years. Similarly, with respect to waste, the regional guidelines should be represented, as envisaged in Article 199 of Legislative Decree no. 152/2006, in the Regional Waste Management Plan. This should set forth measures aimed at favouring the reduction of waste production and the recovery of waste and the regulation of waste management activities through the promotion of integrated waste management, providing incentives for the use of suitable, modern technologies in order to provide the utmost guarantees of significant environmental protection, safeguarding of the health of residents and self-sufficiency in terms of the capacity of waste recovery and disposal. To-date, the Emilia Romagna Regional has not yet adopted the Plan, since the procedure for the drafting and subsequent approval of the same is underway and should be concluded in 2013. The planning of the waste system is completed by the Area Waste Plan which represents, as envisaged by Regional Law no. 23/2011, “the instrument for the governance of the management activities necessary for the performance of the municipal waste integrated management service and envisages the schedule of the measures, the operating and organisational model and the economic and financial plan”. The Provincial Authority, which is in any event responsible for the administrative functions concerning the planning and organisation of the recovery and disposal of waste at provincial level, takes part in the planning process with the Provincial waste management plan (PPGR) and the Provincial Coordination Area Plan (PTCP).
175
Management The organisation and regulation of the municipal waste management service and the integrated water service are seen to by the Emilia-Romagna Area Authority for the water and waste service which is responsible for representing the collective demand for the services and governing the production and supply of said services. The operators are the companies that materially provide the services to residents. The services are governed through service agreements, contractual documents which specify the standards and performance that must be guaranteed, the cost of the services, and the related financial plans, and penalties and sanctions in the event of breach of the provisions. Therefore, the operators and the Area Authority collaborate in their areas of operation in order to draw up the best services framework, with a view to optimising the system. Generally, operators are also in charge of the administrative activities, such as stipulating, amending and terminating supply contracts for the integrated water service or part of the service, measuring and recording the products supplied and services provided, invoicing and collecting payments for tariffs. The authorisation processes envisaged by national and regional regulations for various types of plants managed by Hera involve – in an integrated manner – the technicians from various local institutions in the Services Conference, a meeting point for the various skills required for a complete assessment of the different impacts on the environment of a new plant or the operation of an existing plant. Control Environmental management and control of water are exercised at local level, by numerous parties (Area Agencies, Local Health Authorities, Arpa and AEEG), each with specific duties. The Area Authority is specifically responsible for the control of the methods used for providing the services, their monitoring and assessment. With regard to product quality, environmental management and control of water are exercised at local level, by numerous parties, each with specific duties. For the purpose of protecting public health, the Regional Authorities are in charge of coordinating the activities of the Local Health Authorities, which mainly consists in issuing directives containing criteria for drawing up plans for control of water for human consumption. The Local Health Authorities carry out controls on water based on plans which take into account the regional directives, fixing the points representing the quality of the aqueducts. They also carry out inspections of the plants to assess the structural and functional conditions and identify any criticalities. In line with the duties assigned by the Area Authorities existing before Regional Law no. 23/2011, also Hera, in its role as an operator of the integrated water service, controls the quality of drinking water according to the provisions of current regulations and, specifically, according to Legislative Decree no. 31/2001 which states that the Operator must guarantee that water is suitable for drinking up to the point of delivery to users (meters). ARPA carries out controls on all waste management plants resulting from the Hera Group’s operations, with specific reference to verifying the limits defined in the authorisations. It draws up reports on specific issues for the purpose of providing a basis
176
for possible environmental reclamation and quality improvement policies. It also provides technical support for laboratory tests. In the Prime Minister’s Decree dated 3 October 2012 which implemented Italian Law 214/2011, it is envisaged that the AEEG controls and inspects the operators especially with reference to the quality of the service. It being understood that, by virtue of the same establishing law, the AEEG can carry out checks on the observance of all its regulations. During 2012, the Hera Group received 18 warnings, 36 less than in 2011. These warnings mainly concerned disputes raised by the supervisory bodies and refer to violations of provisions laid down by Legislative Decree no. 152/2006, the Consolidated Environmental Law, pertaining essentially to the integrated water service and the lack of observance of the regulations contained in the respective authorisation deeds. The fulfilments required by the supervisory bodies were met in relation to the receipt of these warnings and none was challenged before the competent authorities. In 2012, 115 administrative sanctions were inflicted, issued primarily for environmental violations, for a total of Euro 313,507. The majority of the disputes raised by the supervisory bodies refer to violations of provisions laid down by the afore-mentioned Legislative Decree no. 152/2006, the Consolidated Environmental Law, pertaining essentially to the integrated water service and in particular the running of the plants and the exceeding of the tabular limits. These violation disputes are administrative and defence briefs have been filed in relation to the same, with the principal aim of revoking the measures adopted by means of archiving the proceedings and, subordinately, the payment of the fine to the minimum extent envisaged by sector regulations. The increase in the sanctions paid in 2012 with respect to 2011 (89 for a total of Euro 184,239) is mainly attributable to the payment of the fines pertaining to Herambiente for the closure of the related criminal proceedings (in 2011 Herambiente paid sanctions for Euro 39,160 while in 2012 it paid sanctions for Euro 160,114).
Waste: incentives for prevention and reuse The Ferrara Water and Waste Regulatory Authority provided discounts on the TIA (Environmental Hygiene Tariff) for business concerns that donate food and other still usable products to aid associations rather than sending them for disposal as waste (a total of approximately 189 metric tons of products were donated in 2012). Also with a view to preventing waste, Hera promotes domestic composting, by means of the distribution of more than 26,000 composters to date. Further, in order to incentivise that activity, Hera recognises a discount on the bill in municipalities for which it is set forth in the TIA regulation. Domestic composting reduces the production of waste by transforming organic food waste, leaves and plant scraps into compost, a natural fertilizer.
Relationships with the Area Authority for water and waste services By means of Regional Law no. 23/2011, the Emilia-Romagna Area Authority for water and waste services (ATERSIR) was established, which replaced the previous Area Authorities and which carries out its functions with reference to water and waste services. The main responsibilities assigned to the Authority by the afore-mentioned Regional law concern the regulation of the services and specifically the reconnaissance of the infrastructures, the definition and approval of the economic-financial plans, the
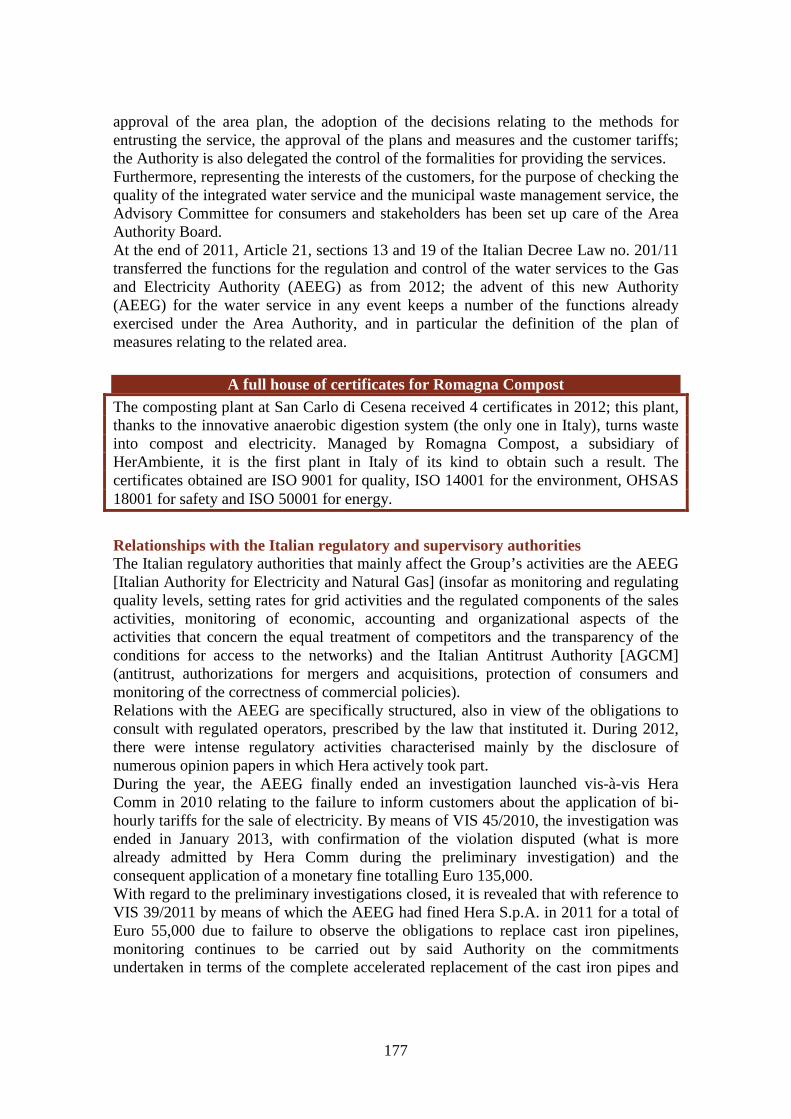
177
approval of the area plan, the adoption of the decisions relating to the methods for entrusting the service, the approval of the plans and measures and the customer tariffs; the Authority is also delegated the control of the formalities for providing the services. Furthermore, representing the interests of the customers, for the purpose of checking the quality of the integrated water service and the municipal waste management service, the Advisory Committee for consumers and stakeholders has been set up care of the Area Authority Board. At the end of 2011, Article 21, sections 13 and 19 of the Italian Decree Law no. 201/11 transferred the functions for the regulation and control of the water services to the Gas and Electricity Authority (AEEG) as from 2012; the advent of this new Authority (AEEG) for the water service in any event keeps a number of the functions already exercised under the Area Authority, and in particular the definition of the plan of measures relating to the related area.
A full house of certificates for Romagna Compost The composting plant at San Carlo di Cesena received 4 certificates in 2012; this plant, thanks to the innovative anaerobic digestion system (the only one in Italy), turns waste into compost and electricity. Managed by Romagna Compost, a subsidiary of HerAmbiente, it is the first plant in Italy of its kind to obtain such a result. The certificates obtained are ISO 9001 for quality, ISO 14001 for the environment, OHSAS 18001 for safety and ISO 50001 for energy.
Relationships with the Italian regulatory and supervisory authorities The Italian regulatory authorities that mainly affect the Group’s activities are the AEEG [Italian Authority for Electricity and Natural Gas] (insofar as monitoring and regulating quality levels, setting rates for grid activities and the regulated components of the sales activities, monitoring of economic, accounting and organizational aspects of the activities that concern the equal treatment of competitors and the transparency of the conditions for access to the networks) and the Italian Antitrust Authority [AGCM] (antitrust, authorizations for mergers and acquisitions, protection of consumers and monitoring of the correctness of commercial policies). Relations with the AEEG are specifically structured, also in view of the obligations to consult with regulated operators, prescribed by the law that instituted it. During 2012, there were intense regulatory activities characterised mainly by the disclosure of numerous opinion papers in which Hera actively took part. During the year, the AEEG finally ended an investigation launched vis-à-vis Hera Comm in 2010 relating to the failure to inform customers about the application of bi-hourly tariffs for the sale of electricity. By means of VIS 45/2010, the investigation was ended in January 2013, with confirmation of the violation disputed (what is more already admitted by Hera Comm during the preliminary investigation) and the consequent application of a monetary fine totalling Euro 135,000. With regard to the preliminary investigations closed, it is revealed that with reference to VIS 39/2011 by means of which the AEEG had fined Hera S.p.A. in 2011 for a total of Euro 55,000 due to failure to observe the obligations to replace cast iron pipelines, monitoring continues to be carried out by said Authority on the commitments undertaken in terms of the complete accelerated replacement of the cast iron pipes and

178
the inspection of the entire network classified as “hemp and lead joint” and “asbestos cement”, until the complete replacement of the same. With regard to the preliminary investigations launched in 2011 and still underway, it is hereby disclosed that Hera Comm was involved in a cognitive investigation launched by the AEEG by means of VIS 76/2011, regarding unrequested contracts for electricity or gas supplies, and that to-date this procedure has not yet been concluded. The appeal presented in 2011 by Hera against the sanction, totalling Euro 190,000, inflicted in 2010 by the Anti-trust Authority is still pending, in relation to the alleged improper or misleading commercial practices in the water services sector (late communication of tariff changes, acceptance of an insurance fund for leaks by means of tacit consent). The date for the first hearing is expected from the Lazio Regional Administrative Court. During 2012, Hera - together with other leading gas distribution operators - launched two appeals against the resolutions of the Italian Gas and Electricity Authority concerning, respectively, the obligations to replace traditional gas meters with electronic meters featuring remote-reading requisites, and the definition of the gas distribution tariffs for 2013. In the first case, recourse action was launched with regard to the premature nature, in relation to both technological evolution and the supply on the market of electronic meters, of the replacement obligations envisaged by resolution 28/2012/R/Gas, which in the case of the Hera Group would have led to the replacement of around 80% of the meter base by 2018. In the second case, the recourse was justified in relation to an essential amendment, by the Authority, of principles by now deemed to be consolidated with regard to the determination of the remuneration of capital invested in network services. In the specific resolution challenged, 436/12/R/Gas, it set a rate of remuneration for the gas distribution service for 2013 much lower than expectations, especially considering the current economic-financial situation, and also potentially placing the investment capacity for improvement measures on the quality and safety of the service at risk. During 2012, Hera underwent two inspections by the AEEG:
• the first concerning the verification of the electricity distribution continuity figures relating to 2011, which concluded with the assessment by the Authority of complete observance of the rules for registering and classifying the blackouts;
• the second relating to the verification of the correct application of the matters envisaged by the Consolidated Law on Active Connections, which concerned all the documentation inherent to the connection requests received between 1 January 2008 and 30 April 2012. To-date, the AEEG has not yet disclosed the outcome of this inspection.
With regard to dealings with the Italian Antitrust Authority (AGCM), it is hereby revealed that;
• during 2012, the Authority launched proceedings against Hera S.p.A., Herambiente and Akron hypothesising the offence of abuse of dominant position on the Emilia Romagna market of paper waste from separate collection activities;
• the Authority continued with activities for the monitoring of commitments undertaken by Hera within the sphere of the A411C proceedings (inherent to
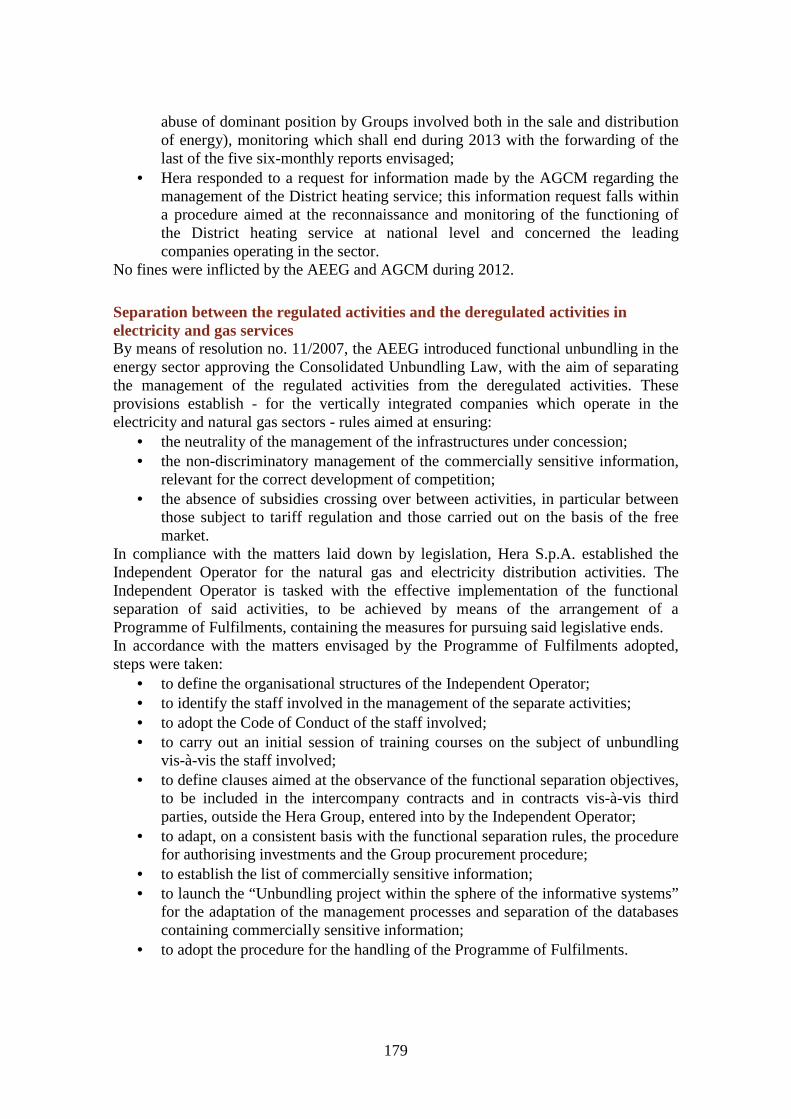
179
abuse of dominant position by Groups involved both in the sale and distribution of energy), monitoring which shall end during 2013 with the forwarding of the last of the five six-monthly reports envisaged;
• Hera responded to a request for information made by the AGCM regarding the management of the District heating service; this information request falls within a procedure aimed at the reconnaissance and monitoring of the functioning of the District heating service at national level and concerned the leading companies operating in the sector.
No fines were inflicted by the AEEG and AGCM during 2012.
Separation between the regulated activities and the deregulated activities in electricity and gas services By means of resolution no. 11/2007, the AEEG introduced functional unbundling in the energy sector approving the Consolidated Unbundling Law, with the aim of separating the management of the regulated activities from the deregulated activities. These provisions establish - for the vertically integrated companies which operate in the electricity and natural gas sectors - rules aimed at ensuring:
• the neutrality of the management of the infrastructures under concession; • the non-discriminatory management of the commercially sensitive information,
relevant for the correct development of competition; • the absence of subsidies crossing over between activities, in particular between
those subject to tariff regulation and those carried out on the basis of the free market.
In compliance with the matters laid down by legislation, Hera S.p.A. established the Independent Operator for the natural gas and electricity distribution activities. The Independent Operator is tasked with the effective implementation of the functional separation of said activities, to be achieved by means of the arrangement of a Programme of Fulfilments, containing the measures for pursuing said legislative ends. In accordance with the matters envisaged by the Programme of Fulfilments adopted, steps were taken:
• to define the organisational structures of the Independent Operator; • to identify the staff involved in the management of the separate activities; • to adopt the Code of Conduct of the staff involved; • to carry out an initial session of training courses on the subject of unbundling
vis-à-vis the staff involved; • to define clauses aimed at the observance of the functional separation objectives,
to be included in the intercompany contracts and in contracts vis-à-vis third parties, outside the Hera Group, entered into by the Independent Operator;
• to adapt, on a consistent basis with the functional separation rules, the procedure for authorising investments and the Group procurement procedure;
• to establish the list of commercially sensitive information; • to launch the “Unbundling project within the sphere of the informative systems”
for the adaptation of the management processes and separation of the databases containing commercially sensitive information;
• to adopt the procedure for the handling of the Programme of Fulfilments.
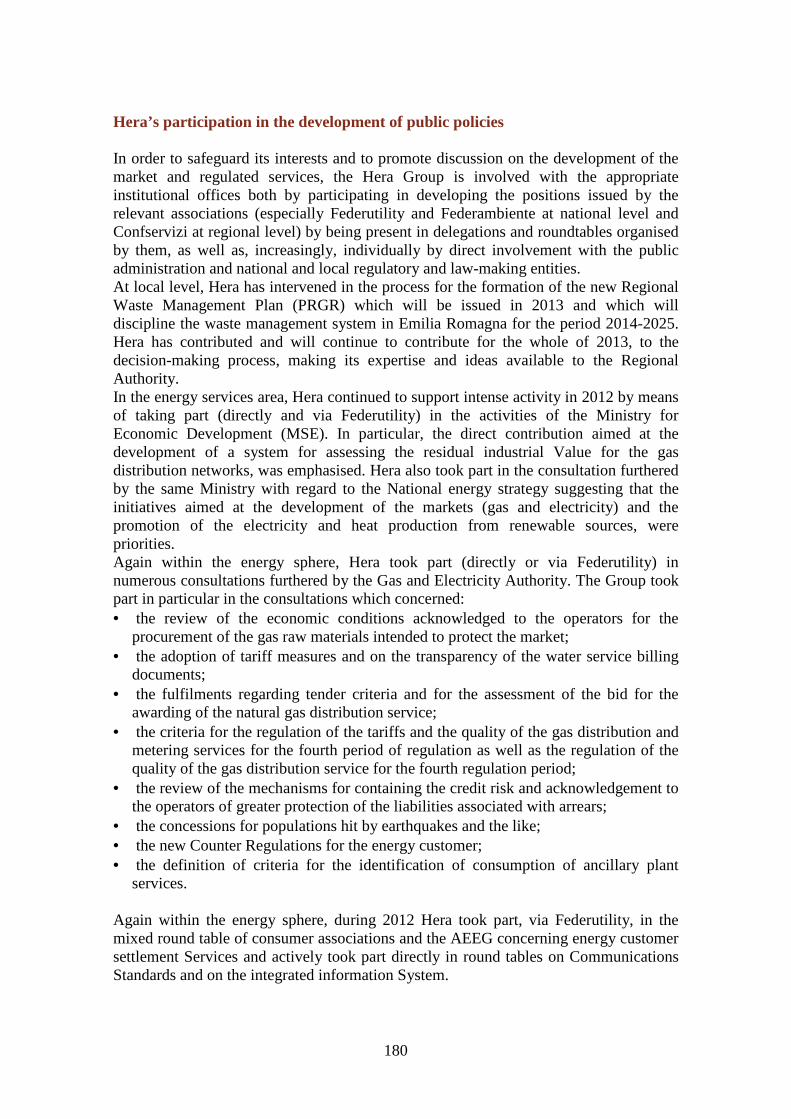
180
Hera’s participation in the development of public policies In order to safeguard its interests and to promote discussion on the development of the market and regulated services, the Hera Group is involved with the appropriate institutional offices both by participating in developing the positions issued by the relevant associations (especially Federutility and Federambiente at national level and Confservizi at regional level) by being present in delegations and roundtables organised by them, as well as, increasingly, individually by direct involvement with the public administration and national and local regulatory and law-making entities. At local level, Hera has intervened in the process for the formation of the new Regional Waste Management Plan (PRGR) which will be issued in 2013 and which will discipline the waste management system in Emilia Romagna for the period 2014-2025. Hera has contributed and will continue to contribute for the whole of 2013, to the decision-making process, making its expertise and ideas available to the Regional Authority. In the energy services area, Hera continued to support intense activity in 2012 by means of taking part (directly and via Federutility) in the activities of the Ministry for Economic Development (MSE). In particular, the direct contribution aimed at the development of a system for assessing the residual industrial Value for the gas distribution networks, was emphasised. Hera also took part in the consultation furthered by the same Ministry with regard to the National energy strategy suggesting that the initiatives aimed at the development of the markets (gas and electricity) and the promotion of the electricity and heat production from renewable sources, were priorities. Again within the energy sphere, Hera took part (directly or via Federutility) in numerous consultations furthered by the Gas and Electricity Authority. The Group took part in particular in the consultations which concerned: • the review of the economic conditions acknowledged to the operators for the
procurement of the gas raw materials intended to protect the market; • the adoption of tariff measures and on the transparency of the water service billing
documents; • the fulfilments regarding tender criteria and for the assessment of the bid for the
awarding of the natural gas distribution service; • the criteria for the regulation of the tariffs and the quality of the gas distribution and
metering services for the fourth period of regulation as well as the regulation of the quality of the gas distribution service for the fourth regulation period;
• the review of the mechanisms for containing the credit risk and acknowledgement to the operators of greater protection of the liabilities associated with arrears;
• the concessions for populations hit by earthquakes and the like; • the new Counter Regulations for the energy customer; • the definition of criteria for the identification of consumption of ancillary plant
services. Again within the energy sphere, during 2012 Hera took part, via Federutility, in the mixed round table of consumer associations and the AEEG concerning energy customer settlement Services and actively took part directly in round tables on Communications Standards and on the integrated information System.
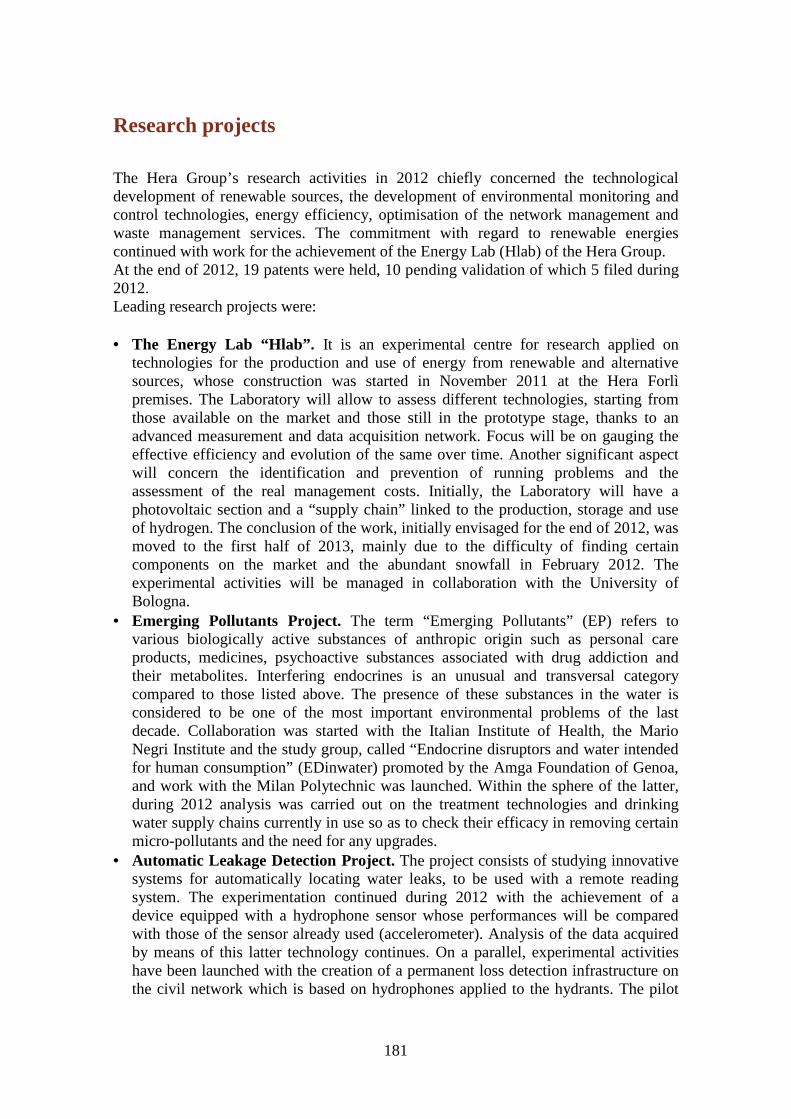
181
Research projects
The Hera Group’s research activities in 2012 chiefly concerned the technological development of renewable sources, the development of environmental monitoring and control technologies, energy efficiency, optimisation of the network management and waste management services. The commitment with regard to renewable energies continued with work for the achievement of the Energy Lab (Hlab) of the Hera Group. At the end of 2012, 19 patents were held, 10 pending validation of which 5 filed during 2012. Leading research projects were: • The Energy Lab “Hlab”. It is an experimental centre for research applied on
technologies for the production and use of energy from renewable and alternative sources, whose construction was started in November 2011 at the Hera Forlì premises. The Laboratory will allow to assess different technologies, starting from those available on the market and those still in the prototype stage, thanks to an advanced measurement and data acquisition network. Focus will be on gauging the effective efficiency and evolution of the same over time. Another significant aspect will concern the identification and prevention of running problems and the assessment of the real management costs. Initially, the Laboratory will have a photovoltaic section and a “supply chain” linked to the production, storage and use of hydrogen. The conclusion of the work, initially envisaged for the end of 2012, was moved to the first half of 2013, mainly due to the difficulty of finding certain components on the market and the abundant snowfall in February 2012. The experimental activities will be managed in collaboration with the University of Bologna.
• Emerging Pollutants Project. The term “Emerging Pollutants” (EP) refers to various biologically active substances of anthropic origin such as personal care products, medicines, psychoactive substances associated with drug addiction and their metabolites. Interfering endocrines is an unusual and transversal category compared to those listed above. The presence of these substances in the water is considered to be one of the most important environmental problems of the last decade. Collaboration was started with the Italian Institute of Health, the Mario Negri Institute and the study group, called “Endocrine disruptors and water intended for human consumption” (EDinwater) promoted by the Amga Foundation of Genoa, and work with the Milan Polytechnic was launched. Within the sphere of the latter, during 2012 analysis was carried out on the treatment technologies and drinking water supply chains currently in use so as to check their efficacy in removing certain micro-pollutants and the need for any upgrades.
• Automatic Leakage Detection Project. The project consists of studying innovative systems for automatically locating water leaks, to be used with a remote reading system. The experimentation continued during 2012 with the achievement of a device equipped with a hydrophone sensor whose performances will be compared with those of the sensor already used (accelerometer). Analysis of the data acquired by means of this latter technology continues. On a parallel, experimental activities have been launched with the creation of a permanent loss detection infrastructure on the civil network which is based on hydrophones applied to the hydrants. The pilot
182
plant was created in Riolo Terme (Ravenna) and was brought onto stream in December 2012.
• Bio-Hydro Project. This project aims to develop a cycle for the disposal of organic waste from the agricultural and livestock sector which consists of fermentation using hydrogen of at least one type of agricultural-livestock waste and the co-digestion using methane of the residue from this process with other agricultural and livestock waste and/or the organic portion of solid municipal waste. The project is carried out in collaboration with Herambiente and the Faculty of Engineering of the University of Bologna while it is co-financed by the Ministry for Agriculture and Forest Policy. During 2012, appraisals were carried out on the usability of hydrogen produced in traditional PEM (PolymerElectrolyte Membrane) fuel cells and the solid residual of bio-production combined with hydrogen and methane, as compost/fertilizers for agriculture, with the eventual pre-treatments necessary.
• Automatic Plant Operation Project. The project, developed in cooperation with ENEA, involves the development of a system for the automatic management of the main function parameters in the water supply service plants. The system shall maintain the process conditions of a specified plant within its maximum efficiency, based on the composition of the incoming wastewater (purifiers) or of the incoming raw water (potability treatment plants). In 2008 the works at the Calderara di Reno (Bologna) treatment plant, selected as the test site, were begun. In 2009, the analysis and control tools were installed at the site and field data acquisition was initiated. The data acquired during 2010 validates prior knowledge on continuous flow waste water treatment systems, and identifies the existence of new characteristic points in the signals related to the monitored quantities, with the possibility of identifying characteristic or anomalous operation in the plant. In general, the applicability of automatic control to full scale plants was demonstrated. The second stage of the project launched in 2011 led, in 2012, to the installation of a scaled prototype of a treatment plant at the Trebbo di Reno (BO) treatment plant, and the logics and control policies to be implemented in the system were identified.
• Modelling Project for Plants of the Water Cycle. The project provides for the development of mathematical models for the hydraulic and process simulation of treatment plants. The objective consists of acquiring the instruments and the know-how necessary to launch the coordination of the mathematical modelling of the water service plants for the Group. After the acquisition in 2010 of the software licences, the modelling activity within the Group commenced in 2011. Within the sphere of these activities, during 2012 the Group endowed itself with sophisticated instruments capable of carrying out specific laboratory analysis for the calculation of magnitudes and parameters useful for the modelling.
• Energy Recovery in Water Service Plants. During 2010, a number of appraisals were launched on the possibility and the technologies for achieving energy recovery in the water service plants. A first feasibility study was developed to perform energy recovery work within the Bologna purification plant through high performance volutes. During 2011, another two studies were launched: the first concerns energy recovery in aqueduct networks by means of “In Pipe Turbine” (IPT) or “Pump As Turbine” (PAT) systems; the second project concerns the recovery of thermal energy from aqueduct networks by means of systems with low enthalpy heat pumps. In the wake of these studies, further to additional data analysis and checks out in the field carried out in the first half of 2012, the decision was made to continue with the pre-
183
feasibility study for an application care of the reducer station of the aqueduct pressure in the municipality of Bologna, so as to optimise the possible energy recovery.
• Characterisation and Analysis of the Polyethylene Pipes During the Year. Polyethylene water pipes are characterised by a failure rate higher than that of pipes made of other materials. To study the causes of this situation in greater depth, a project was launched for a critical analysis of failures, with the goal of increasing know-how on such pipes, providing simple criteria to classify the different types of failures, identifying the main causes and defining improvement plans. The project is developed in collaboration with LyondellBasell, one of the world’s leading polyolefin manufacturers, and with the Plastic Material Testing Laboratory Foundation of the Chemistry, Materials and Chemical Engineering Department of Milan Polytechnic. In 2010, samples of portions of pipes on which breakage had occurred were collected and visually analysed and the laboratory and statistical analyses were begun. Laboratory analysis was carried out in 2011 for the accurate characterisation of the breakages, whose results will form the basis for the definition of improvement plans and action. The results of this study were presented during the WaterLossEurope 2012 event, the largest international event organised by the IWA on the subject of water losses. The activities will continue with the drafting and updating of specific technical documentation (such as field of use, supply specifications, laboratory analysis, etc.).
• Anti-freezing water meters. During 2011, the Hera Research & Development unit designed and carried out a series of tests for checking the possibility of identifying meters and devices which can reduce the case histories of breakages affecting water meters under unfavourable weather conditions. The study, which ended in 2012, has made it possible to identify the type of meters normally available on the market which are less vulnerable to freezing conditions than those usually installed. The efficacy of devices for the protection of the meter (jacket, anti-freezing value, etc.) has also been tested within the sphere of the project.
Hera invests in innovation and research In 2012, the studies concluded; they pertained to the agreement signed in September 2009 between Hera, the University of Modena and Reggio Emilia and the Alma Mater Foundation in Bologna, which envisages funding of Euro 248 thousand in 4 years by the Group. Through awards, a doctorate scholarship and funding for new research, education is promoted for the attainment of high levels of technical-scientific knowledge and the development of applied research within the Department of Engineering of Modena. In particular between 2010 and 2012, the study for the improvement of the quality and safety of the electricity distribution networks was achieved and implemented; along with the study for improving the operation of electrical and thermal generation plants and fume purification systems in waste-to-energy plants. With regard to the improvement of plant operation, the study aimed at identifying an innovative plant layout was completed for an electric and thermal energy generation plant, combining a waste-to-energy plant with a natural gas fuelled thermoelectric plant. During 2012, 12 simulations of certain thermodynamic cycles were carried out, identifying three sizes of gas turbine available on the market and comparing their
184
results. Following this, the plant engineering layout was identified along with the size of the gas turbine which more fully optimise the performances of this innovative cycle. With respect to the improvement of the treatment systems for the fumes of the waste-to-energy plants, the study was aimed at simulating the fume treatment process so as to optimise the consumption of chemical reactants emitted in said process. During 2010, the available techniques for reducing mercury were analysed, along with the techniques available for the reduction of acid gases and a model was created for simulating the performances of a dry fume treatment system. Steps were taken in 2011 to supplement the previous studies into mercury and acid gases. Specifically, estimates were made on the quantity of mercury present in the waste and a study was carried out on the impact on the emissions of objects which may be present in municipal waste as sources of mercury. With regard to acid gases, steps were taken to carry out analysis on the final data in the management of the Hera Group’s waste-to-energy plants so as to look in depth at the optimum technical/economic conditions relating to the two stages of dry reduction currently used in the plants. During 2012, the simulation model for reducing acid gases was looked at in further detail for the purpose of assessing the influence of the performances of other process parameters. Collaboration continued in 2012 with the Department of Industrial Engineering at Bologna University for the planning and supervision of the work for creating the Energy Lab in Forlì, which is expected to be brought onto stream in 2013. Collaboration exists with Milan Polytechnic, relating to a research project with the aim of assessing the technologies and processes for the removal of emerging contaminants in water intended for human consumption. An agreement is active with the same department of Milan Polytechnic, the University of Bologna and ENEA, for the development of automatic management systems for the treatment plants. The CIRI (Centro Interdipartimentale di Ricerca Industriale Edilizia e Costruzioni) and DICAM (Dipartimento di Ingegneria Civile, Ambientale e dei Materiali), at Bologna University, via specific agreements, have given their support for the study of advanced methods for the assessment and control of water losses and the energy efficiency of the networks and aqueduct plants. During 2012, a study launched in 2011 was continued with the Department of Biology and Evolution at Ferrara University – Tecnopolo Terra&Acqua Tech for the experimentation of an innovative system for the disinfection of water based on electrochemical techniques.
Disputes
With regard to waste-to-energy plants, some litigation proceedings are reported. With regard to the Ferrara plant, until the decision no. 7892/2010 was filed, 5 complaints were pending before the Regional Administrative Court of Emilia-Romagna. With the first three complaints, Hera S.p.A. had appealed against some deeds considered to infringe its rights; specifically:
• The Integrated Environmental Authorisation (IEA) issued by the Province of Ferrara in 2008, which confirmed the limiting quantity of 130,000 total metric tons of waste which could be disposed of in the plant (whereas in the EIA,
185
142,000 metric tonnes had been allowed), also limiting the disposal of special waste to 30,000 metric tons (within the aforesaid total limit);
• The modification to the Provincial Waste Management Plan (P.P.G.R.) adopted in April 2009, which established that, in view of a greater demand for the disposal of municipal waste, the waste-to-energy plant would assign top priority to the processing of municipal waste, still within the limit of 130,000 metric tons, so the possibility of processing 30,000 metric tons of special waste became merely residual and therefore of an incidental nature;
• A further IEA, issued in June 2009, as it completely implements the aforementioned contents of the modification to the Plan.
By means of the afore-mentioned sentence, the Regional Administrative Court of Emilia-Romagna had rejected the aforesaid claims, joined during the proceedings, proposed by Hera S.p.A., which, deeming the decision made by the first Judge objectionable, appealed against it before the Council of State, requesting that it be changed. Since in December 2012 Hera S.p.A. obtained the updating of the IEA from the Ferrara Provincial Authority, in compliance with the requests which converged in the administrative dispute, Hera S.p.A. itself on 21 December 2012 communicated its waiver of the claim which, accordingly, will be declared as dismissed by the Council of State. By means of a fourth appeal, made by the WWF before the Emilia Romagna Regional Administrative Court, together with and other environmental associations, the administrative court was requested to uphold the request for the complete cancellation of the IEA issued by the Ferrara Provincial Authority to Hera S.p.A.in 2007 and then replaced by the IEA of 2008. The appeal was rejected by the Regional Administrative Court by means of Sentence no. 21/2010. Subsequently, the WWF challenged the first level sentence before the Council of State and Hera S.p.A. duly appeared in the aforesaid appeal. The fixing of the pertinent hearing is pending. By means of appeal presented to the Regional Administrative Court of Emilia-Romagna, Herambiente S.p.A. challenged the decision of the Ferrara Provincial Council no. 251 dated 20 September 2011 concerning the “Decision regarding the screening procedure for the production of energy from biomass combustion at the waste incinerator” located in Ferrara. Herambiente presented the Ferrara Provincial Authority with an application for activation of the screening procedure as per Regional Law no. 9/1999. Despite the fact that the environmental compatibility study presented by Herambiente demonstrates that the project does not have negative effects on the environment (so the conditions for the IEA procedures would not apply), the Ferrara Provincial Authority, under resolution no. 251 dated 20 September 2011, established the project be subject to IEA. The fixing of the pertinent hearing is pending. In regard to the Rimini plant, an extraordinary appeal to the President of the Republic is pending, furthered by the WWF Italia association against the Province of Rimini and Hera S.p.A. for the cancellation, following suspension, of the resolution of the Regional Council of Rimini no. 13, of 28 January 2009, pertaining to the Integrated Environmental Authorization of the waste-to-energy plant of Coriano, deemed defective by the counterpart who objected to the illegitimacy since:
• the terms set by law for the duration of the proceeding were allegedly not complied with;
186
• the Province of Rimini allegedly allowed Hera S.p.A., without reason, not to treat healthcare waste in the new Line 4 and not to build the district heating line prescribed in the EIA;
• the IEA, as issued by the Province of Rimini, allegedly failed to specify the limits to atmospheric emissions with reference to each incineration line and is also allegedly in contrast with law provisions on mandatory percentages of separate waste collection.
Hera S.p.A. submitted its own deductions in which it requests that the application for interim relief and the appeal be rejected due to the groundlessness and inadmissibility of the reasons set forth. To date, the ruling has not been issued. Furthermore, mention is made of the important dispute due to the appeal furthered before the Emilia Romagna Regional Administrative Court against Intercent-ER and the Emilia-Romagna Region, by Hera S.p.A.: the call and related enclosures were challenged, containing the “Procedure opened for the awarding of the ordinary management services, assessment and support for the ordinary and forced direct collection of municipal taxes and dues”. Hera S.p.A. believes that the tender documents are illegitimate, and therefore merit cancellation, since they lack any clause concerning the taking over, by those awarded the tender lots, of the dealings with the staff of the outgoing operators in charge of the activities for assessing and collecting the withdrawals which will be replaced by the TARES in the Municipalities which comply with the agreements drawn up by INTERCENT-ER with said adjudicated parties. The proceedings before the Emilia Romagna Regional Administrative Court proposed in 2011 by Hera S.p.A. vis-à-vis the Municipality of Castello d’Argile, were concluded in 2012. Vis-à-vis the Municipality, which had announced public procedures for the awarding of the gas distribution service, Hera had challenged the tender documents deeming the procedures as not compliant with the matters envisaged by current legislation, which envisages that the awarding of the gas distribution service should take place no longer on a municipal basis but on the basis of minimum local areas. The Regional Administrative Court rejected Hera S.p.A.’s appeal, upholding the defence of the Municipal Authority.

187
Local Communities
Hera intends to take stock of the needs of the area in which it is operational. This commitment is expressed through listening to and involving the main associations, in particular consumer and trade, in an intense activity of dialogue on environmental issues and numerous other initiatives involving the raising of awareness in schools. In 2012, proving the transparency in the management of the Group’s plants, more than 2,900 visitors were involved in visits to waste-to-energy plants (around 1,900 students); this initiative joins the two consultative committees (RAB) of citizens residing near Hera plants.
Objectives and performance
What we said we would do... What we have done... • Implement the regular production of reports on the use of the waste collected separately, making the contents more extensive along with the sphere of the external audit. • Give continuity to environmental education activities in schools. • Promote additional corporate voluntary ventures throughout the local area via the “VolontariHeraPer” project. • Complete construction of the renewable energies laboratory in Forlì. • Complete the tour of the Rimini waste-to-energy plant and create the tour of the Ravenna sludge dehydration plant.
• In October 2012, the 3rd edition of “Tracking waste” was published. The divulgation of the document and the sphere of the external audit were extended. (see page 188) • The students involved in environmental education initiatives rose from 41,306 in 2010 to 51,906 in 2012. (see page 192) • During 2012, an initiative was furthered in all the areas: food collection day in favour of the Onlus Food Bank. (see page 90) • The conclusion of the work for creating the laboratory on renewable energies was postponed until the first half of 2013. (see page 181) • The tour of the Rimini waste-to-energy plant was opened in March 2012 while that related to the Ravenna sludge dehydration plant was opened in April 2012. (see page 189)
We shall... • Plan and launch in two areas during 2013 a new governance model for the involvement of the stakeholders in sustainability aspects aimed at strengthening the protection of the area: set up two local multi stakeholder committees by the end of the year. • “Gift a tree to your city” campaign: launch the first municipal replanting measures for the achievement of the objectives in terms of compliance with the on-line bill. • Open the renewable energies laboratory in Forlì during 2013. • Give continuity to environmental education activities in schools and continue to promote visits to the plants run by the Group. • Carry out a communications campaign against the abandonment of waste. • Launch the “Decoro urbano” project aimed at improving the quality of waste collection in the historic centres of the main towns and cities. • Define and implement disclosure and involvement initiatives for local communities in relation to the “Polo Energie Rinnovabili” project in Ferrara. • Design the new Group website in 2013 and launch the creation thereof.
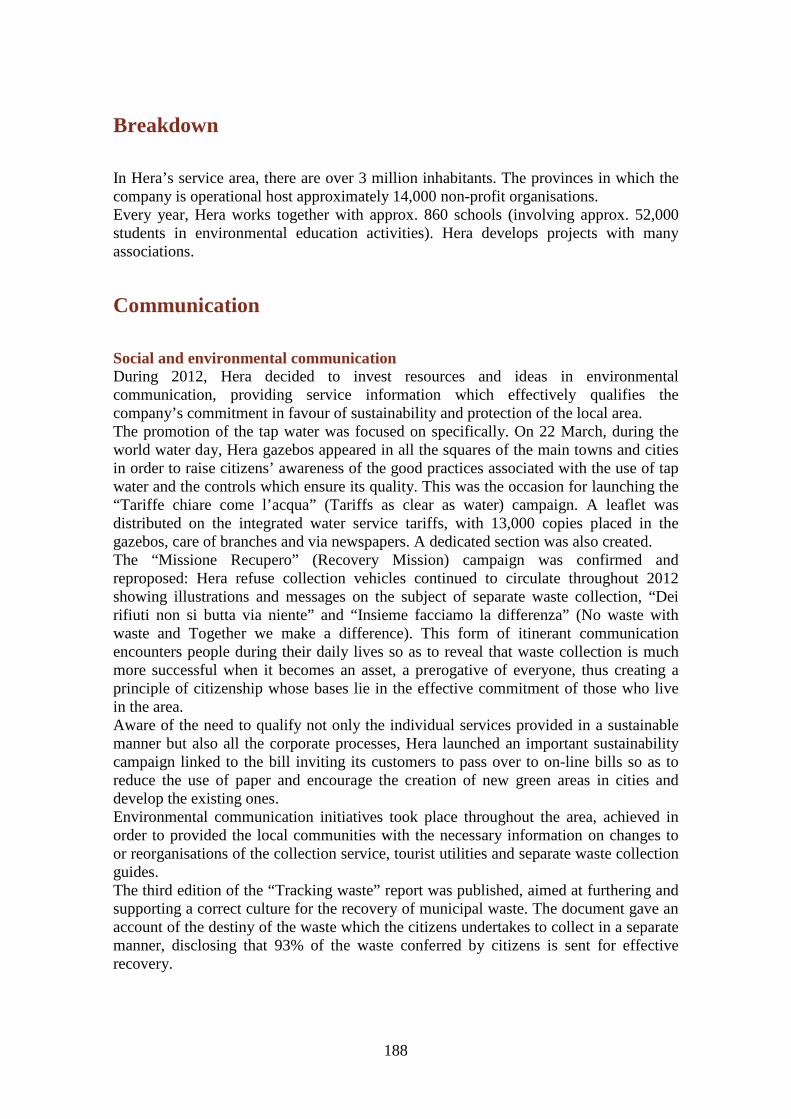
188
Breakdown
In Hera’s service area, there are over 3 million inhabitants. The provinces in which the company is operational host approximately 14,000 non-profit organisations. Every year, Hera works together with approx. 860 schools (involving approx. 52,000 students in environmental education activities). Hera develops projects with many associations.
Communication
Social and environmental communication During 2012, Hera decided to invest resources and ideas in environmental communication, providing service information which effectively qualifies the company’s commitment in favour of sustainability and protection of the local area. The promotion of the tap water was focused on specifically. On 22 March, during the world water day, Hera gazebos appeared in all the squares of the main towns and cities in order to raise citizens’ awareness of the good practices associated with the use of tap water and the controls which ensure its quality. This was the occasion for launching the “Tariffe chiare come l’acqua” (Tariffs as clear as water) campaign. A leaflet was distributed on the integrated water service tariffs, with 13,000 copies placed in the gazebos, care of branches and via newspapers. A dedicated section was also created. The “Missione Recupero” (Recovery Mission) campaign was confirmed and reproposed: Hera refuse collection vehicles continued to circulate throughout 2012 showing illustrations and messages on the subject of separate waste collection, “Dei rifiuti non si butta via niente” and “Insieme facciamo la differenza” (No waste with waste and Together we make a difference). This form of itinerant communication encounters people during their daily lives so as to reveal that waste collection is much more successful when it becomes an asset, a prerogative of everyone, thus creating a principle of citizenship whose bases lie in the effective commitment of those who live in the area. Aware of the need to qualify not only the individual services provided in a sustainable manner but also all the corporate processes, Hera launched an important sustainability campaign linked to the bill inviting its customers to pass over to on-line bills so as to reduce the use of paper and encourage the creation of new green areas in cities and develop the existing ones. Environmental communication initiatives took place throughout the area, achieved in order to provided the local communities with the necessary information on changes to or reorganisations of the collection service, tourist utilities and separate waste collection guides. The third edition of the “Tracking waste” report was published, aimed at furthering and supporting a correct culture for the recovery of municipal waste. The document gave an account of the destiny of the waste which the citizens undertakes to collect in a separate manner, disclosing that 93% of the waste conferred by citizens is sent for effective recovery.

189
The tour of the Rimini waste-to-energy plant was opened in March 2012 while that related to the Ravenna sludge dehydration plant was opened in April 2012.
Taking part in exhibitions and trade fairs Hera sees the trade and convention sector as an ideal sphere for communicating the results and prospects of its initiatives in favour of sustainability to a selected public. During 2012, the Hera Group was once again present at “Ravenna 2012. Rifiuti, acqua, energia. Economia ambientale” (“Ravenna 2012. Waste, water, energy. Environmental economics”), displaying, in the very central Piazza del Popolo, two prototypes of “intelligent” refuse bins for WEEE (waste from electrical and electronic appliances). Ravenna 2012 also offered conferences, workshops, labmeetings and cultural events which important Group representatives made their contribution to. The event concluded with the presentation of the 2012 edition of “Tracking waste”. This was joined by the presentation of the book “Il mestiere di trattare i rifiuti”, a didactic volume edited by Hera, containing 123 pages using simple language and a great deal of infographics and photographs, with the intention of informing the “uninitiated” of the salient aspects of waste management: from collection recovery, and then disposal. Once again in 2012, the Hera Group, together with Herambiente, took part in Ecomondo, the prestigious Rimini trade fair covering the recovery of material, energy and sustainable development.
Hera on the internet Hera’s commitment to ensure timely and updated information on line that is in line with the transparency expectations of the various interlocutors continues. The information style is customised according to the interests and particularities of the respective stakeholders: customers, shareholders, the area communities, students. With a view to innovation and on-going improvement of the use of the website by the user, once again in 2012 particular attention was paid to the Web 2.0 world and the enhanced implementation of new Apps for smartphones. Among the various events in 2012, mention is made of the development of the water channel with the new “Tariffe chiare come l’acqua” (Tariffs as clear as water)section which illustrates the mechanisms which discipline the tariff systems in the water service and which registered more than 14,000 visits and around 8,500 visitors. At the time of publication, in October 2012, of the 2011 edition of the report in the quality of tap water, “In buone acque” (In good water), an on-line chat was organised where the general public could dialogue directly with sector experts. For the waste management sector, ample space was given to separate waste collection with the on-line “Wasteologist” via which the user can select the type of waste so as to know which container to place it in or discover the nearest drop-off point. If they cannot find the information they are looking for, citizens can report this to Hera via the web; Hera will then take this report into account when updating the guide. The “Wasteologist” application has been installed by around 30,000 individuals. As a result of the appreciation shown for the instrument, experimentation was launched in Bologna and Modena of a new version of the App capable of permitting the user to directly report waste abandoned along the roads or any inefficiencies to the waste management operators. VedoHera, the four-monthly online newsletter on sustainability had around 100,000 members in 2012, with approximately 15,000 visits and 11,500 visitors.

190
Website hits No. 2010 2011 2012
Customers section 46,417 50,361 53,802 Suppliers section 5,027 5,611 12,556 Corporate Social Responsibility Section 2,854 2,836 2,212 Investor Relations Section 2,019 1,838 2,359 Other sections 54,148 48,523 68,875 Total average monthly visits 110,465 117,690 139,804 Total page views (monthly) 484,216 471,050 506,532 Total unique visits (monthly) 78,937 86,112 97,328
The success of the “Gift a tree to your city” campaign is also proven by the great flow to the website which reported around 55,000 visits in just the first two months. The transparency of the communication was also articulated, as in the past, by the real time publication of the Annual Financial Statements and the Sustainability Report in HTML format; the latter reported around 17,000 visitors. Once again in 2012, a channel of dialogue on the 2011 Sustainability Report was opened via chat. A particular effort was made in the implementation of two new sections, in particular that of Hera Comm relating to the electricity and gas offers and that of Herambiente conceived to respond in a targeted manner to the waste disposal needs of the businesses.
On-line chat to discuss sustainability and tap water On 19 April 2012, for the second year running, an on-line chat was activated so as to present the Sustainability Report: more than 100 messages from citizens in more than two and a half hours of link. Water, waste-to-energy plants, disclosure and communication of the report were the most avidly discussed topics, with an average of around 40 users linked up at the same time. Representatives of consumers’ associations, economic forces and individual citizens posed questions directly on the Sustainability Report to a pool of company managers and technicians brought together ad hoc. All the questions and answers provided were published and made available in the related section of the website. The positive experience was repeated on 2 October 2012 so as to open up discussion on the quality of the drinking water at the time of publication of the fourth editions of the In buone acque report: more than 150 messages with over 100 users linked up. The answers were not only provided by a pool of Hera executives and technicians, but also three outside experts, Renata Caudarella (professor specialised in inborn and acquired metabolic diseases), Leonella Rossi (Head of Arpa Emilia-Romagna’s Lab Activities Area), Cecilia Bergamini (Head of Arpa Emilia-Romagna’s Water and organic Contaminants Chemistry Area). Again in this case, all the questions and answers provided were published and made available in the water section of the website. The topics which raised the most interest included the average parameters and the quality of the water distributed by Hera, the state of the pipes and the In buone acque (In good water) report.
2012 was also the year of the restyling of the communications and media area in which the new Dossier-Hera section was created, which monographically and analytically deals with topics relating to water, smart city, waste and gas. This page offers in-depth insights and multimedia contents, leading to around 30,000 visits in 2012. The

191
effectiveness of the Hera Group’s online communication was emphasised once again in 2012 by the first place achieved in the Employer Branding and CSR Online Awards ranking devised by Lundquist and the second place gained in the Halvarsson&Halvarsson Webranking classification.
What is Hera’s reputation on the web? The on-line word of mouth grows and evolves each year. Hera’s analysis of the web develops on blogs, forums, social networks and Youtube, virtual places where the company desires to listen to the voice of the users, where the content is placed directly by users themselves. In 2012, a total of 4,051 posts that referred to Hera were analyzed, a figure on the up with respect to last year (+ 1,516 contents). The presence of references to the Group on social networks was very significant and clearly up (56%), a sign of the interest of the user. The number of posts on blogs was confirmed as stable and important, 36% of the total, a lower percentage with respect to last year by virtue of the increase in total posts which, in fact, doubled with respect to 2011. Presence on forums (8%) was significant, albeit more contained. In line with the increase in the number of posts, the visibility of Hera in 2012 rose on all channels analysed. Growth in visibility of the Corporate category was significant when compared with last year; the web presence of the other areas was satisfactory, among which the quality of the service and waste management services adopt moderate importance. Hera’s presence in the 2.0 web is very positive and creates a well-defined image profile: on blogs and the social networks references to environmental sensitivity and development strategies and growth objectives emerge as positive, along with the drawing up of the merger deed with AcegasAps. Within the service quality area, the conversation mainly concern the services provided to the customers: the success of the App for separate waste collection, the Wasteologist, and the chat with citizens on the quality of the water was very positive. The Net price offer, the door-to-door collection services, the S.PR.I.N.T project for the reduction of waiting time at customer counters, the measures on the water networks and on a more general note all the information useful to the customers disclosed by the Group, were also associated with positive opinions.
Environmental education
The Hera Group has promoted for several years, in the various provinces where it operates, numerous environmental education projects, in order to raise awareness in schools on issues related to services and to take part in the educational process, making its business experience available. Over the years, collaboration with schools has created a rich store of experience and has made it possible to reach significant goals in this direction. “La Grande Macchina del Mondo”, the environmental education project which the Group wished to achieve in the period 2010-2011, unique and standard for the entire area in which it operates, involved more than 100,000 student in its two year of existence.
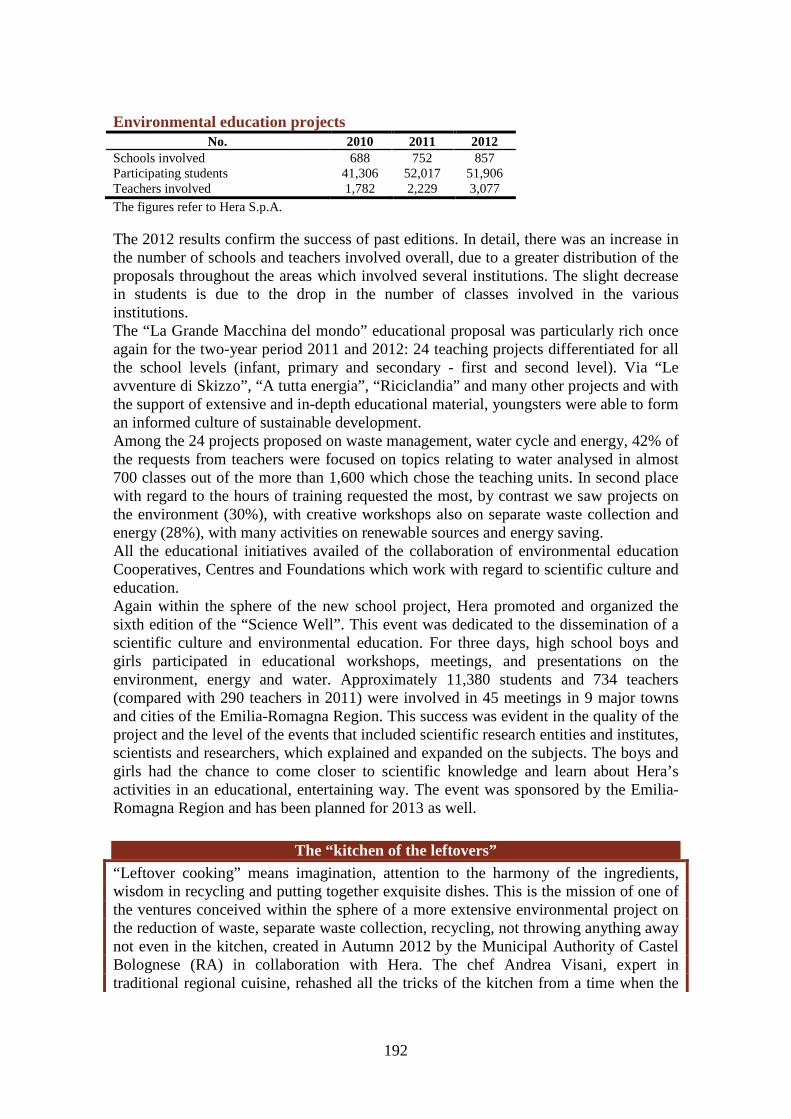
192
Environmental education projects No. 2010 2011 2012
Schools involved 688 752 857 Participating students 41,306 52,017 51,906 Teachers involved 1,782 2,229 3,077 The figures refer to Hera S.p.A. The 2012 results confirm the success of past editions. In detail, there was an increase in the number of schools and teachers involved overall, due to a greater distribution of the proposals throughout the areas which involved several institutions. The slight decrease in students is due to the drop in the number of classes involved in the various institutions. The “La Grande Macchina del mondo” educational proposal was particularly rich once again for the two-year period 2011 and 2012: 24 teaching projects differentiated for all the school levels (infant, primary and secondary - first and second level). Via “Le avventure di Skizzo”, “A tutta energia”, “Riciclandia” and many other projects and with the support of extensive and in-depth educational material, youngsters were able to form an informed culture of sustainable development. Among the 24 projects proposed on waste management, water cycle and energy, 42% of the requests from teachers were focused on topics relating to water analysed in almost 700 classes out of the more than 1,600 which chose the teaching units. In second place with regard to the hours of training requested the most, by contrast we saw projects on the environment (30%), with creative workshops also on separate waste collection and energy (28%), with many activities on renewable sources and energy saving. All the educational initiatives availed of the collaboration of environmental education Cooperatives, Centres and Foundations which work with regard to scientific culture and education. Again within the sphere of the new school project, Hera promoted and organized the sixth edition of the “Science Well”. This event was dedicated to the dissemination of a scientific culture and environmental education. For three days, high school boys and girls participated in educational workshops, meetings, and presentations on the environment, energy and water. Approximately 11,380 students and 734 teachers (compared with 290 teachers in 2011) were involved in 45 meetings in 9 major towns and cities of the Emilia-Romagna Region. This success was evident in the quality of the project and the level of the events that included scientific research entities and institutes, scientists and researchers, which explained and expanded on the subjects. The boys and girls had the chance to come closer to scientific knowledge and learn about Hera’s activities in an educational, entertaining way. The event was sponsored by the Emilia-Romagna Region and has been planned for 2013 as well.
The “kitchen of the leftovers” “Leftover cooking” means imagination, attention to the harmony of the ingredients, wisdom in recycling and putting together exquisite dishes. This is the mission of one of the ventures conceived within the sphere of a more extensive environmental project on the reduction of waste, separate waste collection, recycling, not throwing anything away not even in the kitchen, created in Autumn 2012 by the Municipal Authority of Castel Bolognese (RA) in collaboration with Hera. The chef Andrea Visani, expert in traditional regional cuisine, rehashed all the tricks of the kitchen from a time when the
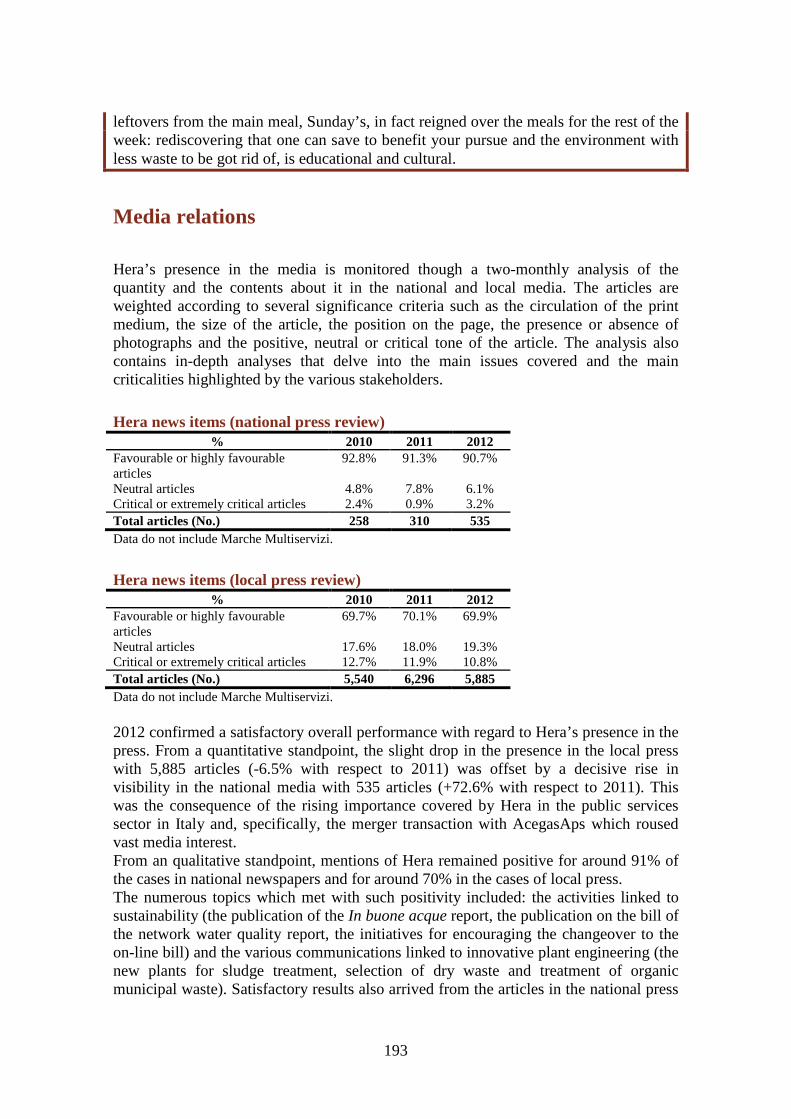
193
leftovers from the main meal, Sunday’s, in fact reigned over the meals for the rest of the week: rediscovering that one can save to benefit your pursue and the environment with less waste to be got rid of, is educational and cultural.
Media relations
Hera’s presence in the media is monitored though a two-monthly analysis of the quantity and the contents about it in the national and local media. The articles are weighted according to several significance criteria such as the circulation of the print medium, the size of the article, the position on the page, the presence or absence of photographs and the positive, neutral or critical tone of the article. The analysis also contains in-depth analyses that delve into the main issues covered and the main criticalities highlighted by the various stakeholders.
Hera news items (national press review) % 2010 2011 2012
Favourable or highly favourable articles
92.8% 91.3% 90.7%
Neutral articles 4.8% 7.8% 6.1% Critical or extremely critical articles 2.4% 0.9% 3.2% Total articles (No.) 258 310 535 Data do not include Marche Multiservizi.
Hera news items (local press review) % 2010 2011 2012
Favourable or highly favourable articles
69.7% 70.1% 69.9%
Neutral articles 17.6% 18.0% 19.3% Critical or extremely critical articles 12.7% 11.9% 10.8% Total articles (No.) 5,540 6,296 5,885 Data do not include Marche Multiservizi. 2012 confirmed a satisfactory overall performance with regard to Hera’s presence in the press. From a quantitative standpoint, the slight drop in the presence in the local press with 5,885 articles (-6.5% with respect to 2011) was offset by a decisive rise in visibility in the national media with 535 articles (+72.6% with respect to 2011). This was the consequence of the rising importance covered by Hera in the public services sector in Italy and, specifically, the merger transaction with AcegasAps which roused vast media interest. From an qualitative standpoint, mentions of Hera remained positive for around 91% of the cases in national newspapers and for around 70% in the cases of local press. The numerous topics which met with such positivity included: the activities linked to sustainability (the publication of the In buone acque report, the publication on the bill of the network water quality report, the initiatives for encouraging the changeover to the on-line bill) and the various communications linked to innovative plant engineering (the new plants for sludge treatment, selection of dry waste and treatment of organic municipal waste). Satisfactory results also arrived from the articles in the national press

194
both on the operating performance and on extraordinary transactions (especially that with AcegasAps). Among the negative mentions, an single article which appeared in a national newspaper was of particular importance, since Hera was mentioned together with other utility companies within the sphere of reflection on relations between utility companies and retail customers (households and small businesses).
Sponsorships and donations
The relations with the local areas, the closeness to residents and respect for the environment are the leading forces behind the sponsorships that Hera Group chooses to make. During the year of the earthquake which hit Emilia, Hera specifically wished to reserve special attention for the initiatives which have been dedicated to this matter. The multi-utility company therefore renewed its support for the Modena Festival of Philosophy, an event already sponsored in the past but which revealed itself to be of even greater interest in 2012 because it included in its scheduling moments for reflection of the subject of the earthquake. Hera also committed itself in favour of the benefit event held on 5 July in Piazza Maggiore, Bologna, during which numerous personalities from cultural and show biz circles performed in order to raise funds in favour of the populations affected by the earthquake. Hera also supported Cineteca in Bologna once again confirming in 2012 an absolutely strategic partnership for maintaining a quality cultural proposal in the Emilia Romagna capital. Among the main events were the festival of the “The Cinema Rediscovered” and “Under the Stars of the Cinema”, film reviews which were projected in July in Piazza Maggiore, Bologna and which this year treated all the people of the city to the full version of C’era una volta in America. Via “Piazze di Cinema”, Hera also wished to bring the cinema to the local square in Cesena as well. Within the sphere of the sponsorships which take place throughout the Bolognese area, an important role is played by the widespread commitment of the Group to allowing the Sala Borsa library to open on Sunday.
Civilized gestures for Bologna The third edition of the “Bologna – Civilised and Beautiful City” Award announced 12 winners and 6 special mentions and handed out 45 certificates. The small and not so small gestures of daily civility in classrooms, on the city streets, in the meetings places of the suburbs, in courtyards, were acknowledged by means of the award furthered by Hera, Il Resto del Carlino, Fondazione del Monte and Centro Antartide, awarded in mid April at the Sala Farnese, in Palazzo d’Accursio, in front of an important crowd.
In collaboration with Arte Fiera, Hera supported the Art White Night, during which museums and historic palazzos in Bologna stayed open until midnight to as to permit tourists and above all else residents to discover or rediscover the most beautiful and significant places in the city. Moreover, in 2012 the Hera Group renewed its commitment in favour of the Bologna Jazz Festival, a music festival which brought some of the most important artists on the international jazz scene to the stages of clubs of Bologna, in districts of the province of
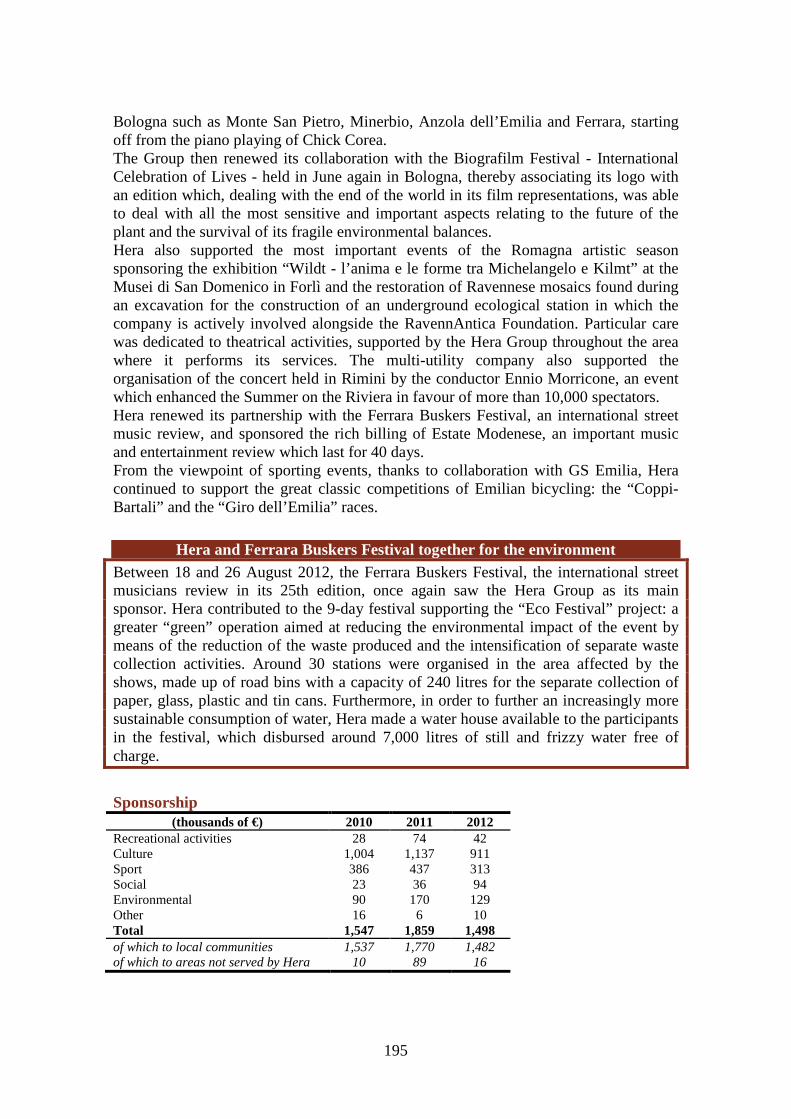
195
Bologna such as Monte San Pietro, Minerbio, Anzola dell’Emilia and Ferrara, starting off from the piano playing of Chick Corea. The Group then renewed its collaboration with the Biografilm Festival - International Celebration of Lives - held in June again in Bologna, thereby associating its logo with an edition which, dealing with the end of the world in its film representations, was able to deal with all the most sensitive and important aspects relating to the future of the plant and the survival of its fragile environmental balances. Hera also supported the most important events of the Romagna artistic season sponsoring the exhibition “Wildt - l’anima e le forme tra Michelangelo e Kilmt” at the Musei di San Domenico in Forlì and the restoration of Ravennese mosaics found during an excavation for the construction of an underground ecological station in which the company is actively involved alongside the RavennAntica Foundation. Particular care was dedicated to theatrical activities, supported by the Hera Group throughout the area where it performs its services. The multi-utility company also supported the organisation of the concert held in Rimini by the conductor Ennio Morricone, an event which enhanced the Summer on the Riviera in favour of more than 10,000 spectators. Hera renewed its partnership with the Ferrara Buskers Festival, an international street music review, and sponsored the rich billing of Estate Modenese, an important music and entertainment review which last for 40 days. From the viewpoint of sporting events, thanks to collaboration with GS Emilia, Hera continued to support the great classic competitions of Emilian bicycling: the “Coppi-Bartali” and the “Giro dell’Emilia” races.
Hera and Ferrara Buskers Festival together for the environment Between 18 and 26 August 2012, the Ferrara Buskers Festival, the international street musicians review in its 25th edition, once again saw the Hera Group as its main sponsor. Hera contributed to the 9-day festival supporting the “Eco Festival” project: a greater “green” operation aimed at reducing the environmental impact of the event by means of the reduction of the waste produced and the intensification of separate waste collection activities. Around 30 stations were organised in the area affected by the shows, made up of road bins with a capacity of 240 litres for the separate collection of paper, glass, plastic and tin cans. Furthermore, in order to further an increasingly more sustainable consumption of water, Hera made a water house available to the participants in the festival, which disbursed around 7,000 litres of still and frizzy water free of charge.
Sponsorship (thousands of €) 2010 2011 2012
Recreational activities 28 74 42 Culture 1,004 1,137 911 Sport 386 437 313 Social 23 36 94 Environmental 90 170 129 Other 16 6 10 Total 1,547 1,859 1,498 of which to local communities 1,537 1,770 1,482 of which to areas not served by Hera 10 89 16
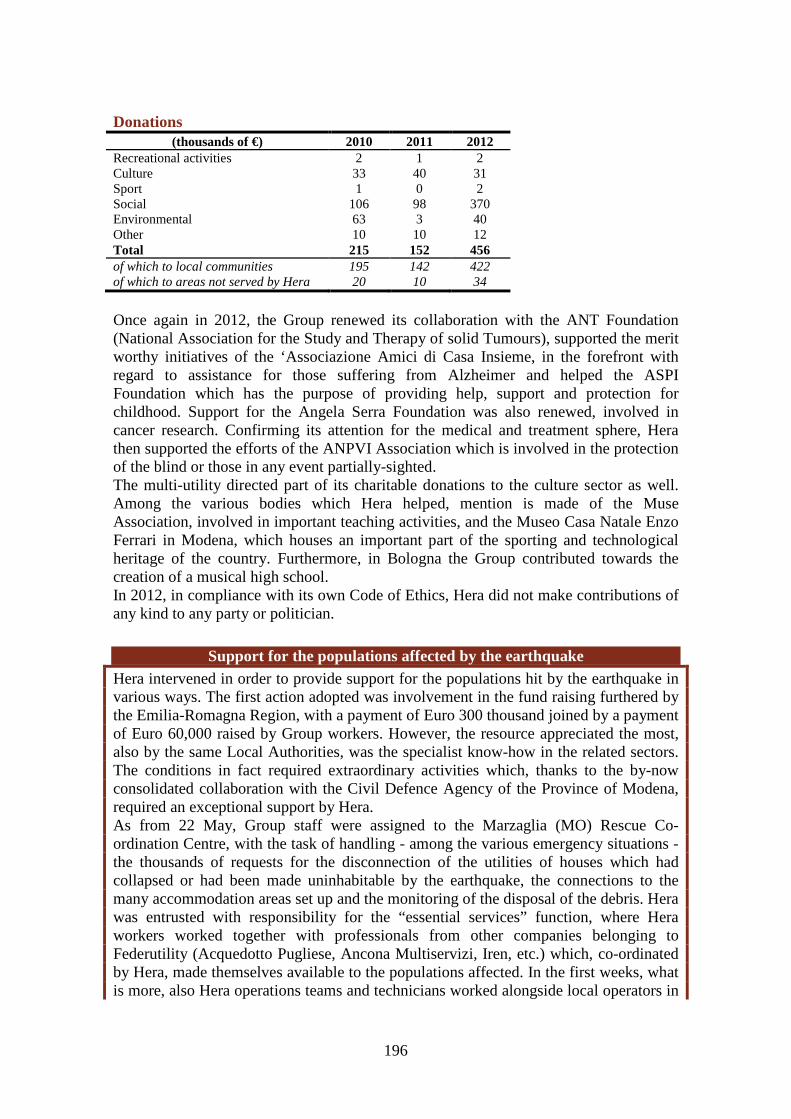
196
Donations
Once again in 2012, the Group renewed its collaboration with the ANT Foundation (National Association for the Study and Therapy of solid Tumours), supported the merit worthy initiatives of the ‘Associazione Amici di Casa Insieme, in the forefront with regard to assistance for those suffering from Alzheimer and helped the ASPI Foundation which has the purpose of providing help, support and protection for childhood. Support for the Angela Serra Foundation was also renewed, involved in cancer research. Confirming its attention for the medical and treatment sphere, Hera then supported the efforts of the ANPVI Association which is involved in the protection of the blind or those in any event partially-sighted. The multi-utility directed part of its charitable donations to the culture sector as well. Among the various bodies which Hera helped, mention is made of the Muse Association, involved in important teaching activities, and the Museo Casa Natale Enzo Ferrari in Modena, which houses an important part of the sporting and technological heritage of the country. Furthermore, in Bologna the Group contributed towards the creation of a musical high school. In 2012, in compliance with its own Code of Ethics, Hera did not make contributions of any kind to any party or politician.
Support for the populations affected by the earthquake Hera intervened in order to provide support for the populations hit by the earthquake in various ways. The first action adopted was involvement in the fund raising furthered by the Emilia-Romagna Region, with a payment of Euro 300 thousand joined by a payment of Euro 60,000 raised by Group workers. However, the resource appreciated the most, also by the same Local Authorities, was the specialist know-how in the related sectors. The conditions in fact required extraordinary activities which, thanks to the by-now consolidated collaboration with the Civil Defence Agency of the Province of Modena, required an exceptional support by Hera. As from 22 May, Group staff were assigned to the Marzaglia (MO) Rescue Co-ordination Centre, with the task of handling - among the various emergency situations - the thousands of requests for the disconnection of the utilities of houses which had collapsed or had been made uninhabitable by the earthquake, the connections to the many accommodation areas set up and the monitoring of the disposal of the debris. Hera was entrusted with responsibility for the “essential services” function, where Hera workers worked together with professionals from other companies belonging to Federutility (Acquedotto Pugliese, Ancona Multiservizi, Iren, etc.) which, co-ordinated by Hera, made themselves available to the populations affected. In the first weeks, what is more, also Hera operations teams and technicians worked alongside local operators in
(thousands of €) 2010 2011 2012 Recreational activities 2 1 2 Culture 33 40 31 Sport 1 0 2 Social 106 98 370 Environmental 63 3 40 Other 10 10 12 Total 215 152 456 of which to local communities 195 142 422 of which to areas not served by Hera 20 10 34
197
order to ensure the maximum efficacy of the emergency operations on the water and gas networks. The technical and specific sector-related skills of the multi-utility company were thus integrated within the Civil Defence Agency’s system for the handling the emergency. Hera’s support was appreciated as highlighted by the Province of Modena’s Civil Defence Agency: “The activities carried out at the provincial rescue co-ordination centre set up in relation to the immediacy of the event was made possible thanks to the spirit of service for the area which distinguished the Hera operators, who once again on this occasion were able to make technical and operating experience available to serve the local communities in complex situations. The Hera staff integrated with the co-ordination structures respecting roles, decisions and timescales also thanks to by-now consolidated collaboration with the Province of Modena’s Civil Defence Agency, which in its planning had identified Hera as head of the unit if the event affected the area of competence. The extraordinary nature and size of the event meant that the performance of a role also for an area not directly managed became necessary, making the co-ordinated operations all the more complex.” After the second series of tremors, it was then necessary to provide assistance to Aimag, the multi-utility company which manages the services in the area hit by the earthquake and which had to deal with problems of uninhabitable buildings housing the various premises. Just a few hours after the request, around one hundred work stations linked up to the Aimag company network were available at the Hera offices in Modena. The employees, temporarily transferred by the company operating in Carpi and Mirandola, thus worked at the Modena premises for several months before returning to their base. Acantho, the Hera Group telecommunications company has in conclusion also effectively supported the populations hit by the earthquake events by activating the wireless internet service free of charge in 5 tent cities set up in Mirandola, in which more than 1,500 individuals were temporary lodged. With regard to commercial activities, in May 2012 Hera decided to voluntarily suspend the payment of bills issued for all the services provided to the customer who had declared the premises where the utilities were installed as unfit, by means of declaration issued by the competent authorities. On a consistent basis with the legislative indications, in June and July Hera applied the suspension of the payment deadlines, for the period between 20 May and 20 November 2012, for bills relating to supplies of gas, electricity and the integrated water service. An AEEG resolution dated January 2013 envisaged various aid for the populations affected by the earthquake, including instalments without interest over a period of 24 months for electricity and gas and 12 months for water bills with payments terms which have already been suspended, a reduction in the components of the gas, electricity and water distribution tariffs and the system charges, writing off of the activation, disconnection, reactivation and transfer costs for connections under 6kW for the temporary housing units and for the requests by users whose residence is unfit for living purposes.

198
Environmental provisions and compensations relating to new Hera plants
Expansion of the waste-to-energy plant in Ferrara Memorandum of Understanding between the Province of Ferrara, Municipality of Ferrara, North-West District,
Hera (then Agea) of 25 June 2003 Integrated Environmental Authorization of the Ferrara Province of 11 March 2008, Ref. 21823
• Commissioning of only two new lines and decommissioning of Line 1.
• Monitoring of the environmental impact of the waste-to-energy plant through specific analyses of the air and ground and bio monitoring. In particular, heavy metals, dioxins and furans, IPA, PCB and fine dust will be searched for in the points that are most influenced by the emissions of the plant (defined through a model on the basis of the meteorological conditions of the site).
• Continuous mercury monitoring system • Continuous emissions sampling system for analysis,
over the long term (up to 30 days) of micro pollutants emitted (dioxins and furans)
• Establishment of an RAB to facilitate communication between the company and the citizens residing in the area surrounding the plant.
• Building of a 6 hectare wooded area • Extension of district heating to the outlying areas of
Cassana, Mezzana, Porotto and Arginone, with a discount of 25% on the connection price
• Line 1 was decommissioned in January 2009 and only the 2 new lines are operational.
• Three new measuring sets were installed; air quality monitoring was started in September 2010. Studies were launched and concluded in 2012 regarding analysis of the soil, mutagenesis, humid depositions and biomonitoring. The details of the activities were defined by ARPA, Ausl and the Ferrara Province in a specific Environmental and Health Monitoring Protocol, based on a technical procedure proposed by the CNR (National Research Council) of Rome, which handles the scientific coordination of the activities. A proposal for the updating of the Protocol is currently being appraised by the supervisory body, for the continuation of the monitoring activities for the period 2013-2015.
• Completed • Completed • Completed
• Completed • Since 2008, a total of 21 connections have been made.

199
Construction of the new waste-to-energy plant in Forlì Assessment of the Environmental Impact of the Forlì-Cesena Province no. 323 of 2 September 2004.
Authorisation by the Province of Forlì-Cesena no. 339 of 27 September 2005. Integrated Environmental Authorization of the Forlì-Cesena Province no. 237 of 29 April 2008 as amended.
DGP screening procedure no. 326 of 21 July 2009 • Construction of an 8 hectare wooded area, possibly
along the Ronco river. • Gradual replacement over time of the type of fuel
used for the waste collection vehicles in Forlì, with diesel or gas with a gasoil/biodiesel or methane mixture.
• Realization of a noise-reducing barrier for a
dwelling near the biological purification plant managed by the Forlì-Cesena TOS.
• Planning and implementation of a district heating
network for the use of the thermal energy generated by the combustion of waste.
• Decommissioning of lines 1 and 2 and operation of line 3 only.
• Construction of a monitoring detection device for the quality of the air around the waste-to-energy plant in the area defined by ARPA. The device must be transferred to ARPA in the form of a free of charge loan for use agreement once it is tested.
• Realization of two information points with the data
of the atmospheric emissions, one at the URP of the Province of Forlì-Cesena and the other at the URP of the Municipality of Forlì.
• Installation of a waste conveyor belt from the pre-selection plant to the waste-to-energy plant
• Construction of an auxiliary aspiration and
treatment system for polluted air aspirated from the new waste pit.
• Completed all landscaping work for the 8 wooded hectares, one of which was completed in 2010 and destined to be used as a public park (compliance notice to the Province of Forlì-Cesena on 27 January 2011).
• A fuel mixed with bio fuel is used on the entire Hera fleet, in compliance with the law that requires producers to use a minimum amount of bio fuel which for 2012 is 5%. There were 84 methane vehicles used by the Forlì-Cesena area as at 31 December 2012 (76 methane and 8 LPG) which correspond to 28% of the total (there were 67 in 2011, 63 in 2010, 57 in 2009, 53 in 2008).
• The procedure of rectifying the administrative acts
(EIA) was concluded with the confirmation that the construction of the sound absorbing barrier is not necessary.
• The first phase of construction of the TLR network
feeding plant was completed and the transfer of heat to the networks (10,008 MWh transferred in 2012) was carried out.
• Completed • Active since 2009, with continuously monitored
parameters (meteorological data, PM10 and PM2.5, NO2, CO and gaseous mercury) and with periodic sampling (heavy metals and micro pollutants on the PM10, ammonia, HF and HCl as gaseous pollutants). In April 2009, a gratuitous loan for use agreement was signed with Arpa. Since July 2009, continuous monitoring data has been published on the Arpa website, which then annually prepares a report with the results of the monitoring work performed. The reports from 2009 to 2011 are present on the website; the 2012 report is pending.
• Completed • In 2010, the authorisation procedures were completed
(DGP 77/2010) and the project was developed. Work, started in 2011, was concluded in January 2013.
• Completed
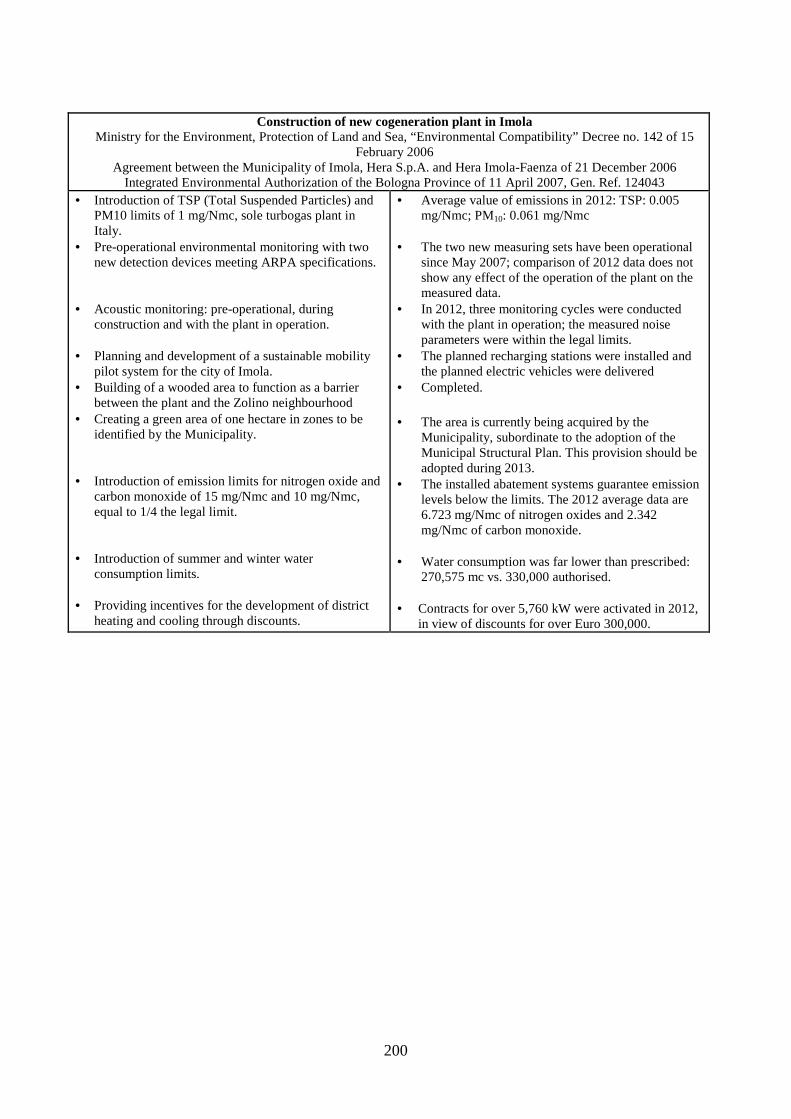
200
Construction of new cogeneration plant in Imola Ministry for the Environment, Protection of Land and Sea, “Environmental Compatibility” Decree no. 142 of 15
February 2006 Agreement between the Municipality of Imola, Hera S.p.A. and Hera Imola-Faenza of 21 December 2006
Integrated Environmental Authorization of the Bologna Province of 11 April 2007, Gen. Ref. 124043 • Introduction of TSP (Total Suspended Particles) and
PM10 limits of 1 mg/Nmc, sole turbogas plant in Italy.
• Pre-operational environmental monitoring with two new detection devices meeting ARPA specifications.
• Acoustic monitoring: pre-operational, during
construction and with the plant in operation. • Planning and development of a sustainable mobility
pilot system for the city of Imola. • Building of a wooded area to function as a barrier
between the plant and the Zolino neighbourhood • Creating a green area of one hectare in zones to be
identified by the Municipality. • Introduction of emission limits for nitrogen oxide and
carbon monoxide of 15 mg/Nmc and 10 mg/Nmc, equal to 1/4 the legal limit.
• Introduction of summer and winter water
consumption limits.
• Providing incentives for the development of district heating and cooling through discounts.
• Average value of emissions in 2012: TSP: 0.005 mg/Nmc; PM10: 0.061 mg/Nmc
• The two new measuring sets have been operational since May 2007; comparison of 2012 data does not show any effect of the operation of the plant on the measured data.
• In 2012, three monitoring cycles were conducted with the plant in operation; the measured noise parameters were within the legal limits.
• The planned recharging stations were installed and the planned electric vehicles were delivered
• Completed. • The area is currently being acquired by the
Municipality, subordinate to the adoption of the Municipal Structural Plan. This provision should be adopted during 2013.
• The installed abatement systems guarantee emission levels below the limits. The 2012 average data are 6.723 mg/Nmc of nitrogen oxides and 2.342 mg/Nmc of carbon monoxide.
• Water consumption was far lower than prescribed: 270,575 mc vs. 330,000 authorised.
• Contracts for over 5,760 kW were activated in 2012,
in view of discounts for over Euro 300,000.
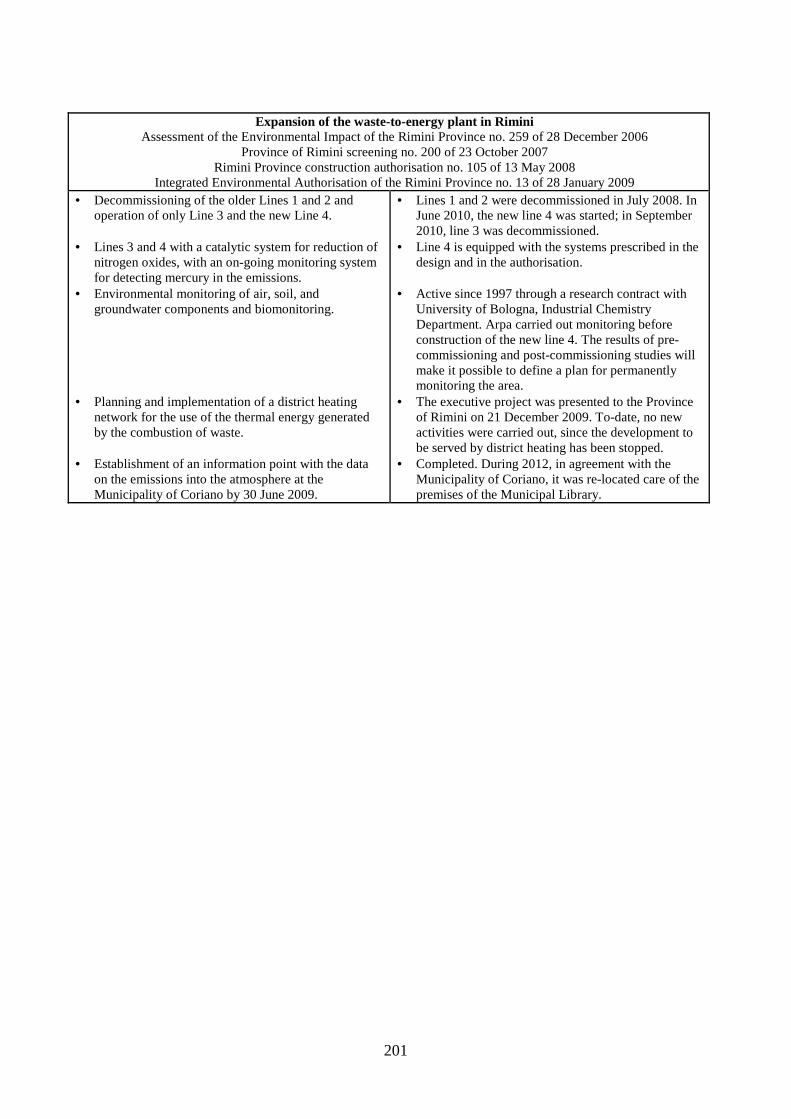
201
Expansion of the waste-to-energy plant in Rimini Assessment of the Environmental Impact of the Rimini Province no. 259 of 28 December 2006
Province of Rimini screening no. 200 of 23 October 2007 Rimini Province construction authorisation no. 105 of 13 May 2008
Integrated Environmental Authorisation of the Rimini Province no. 13 of 28 January 2009 • Decommissioning of the older Lines 1 and 2 and
operation of only Line 3 and the new Line 4. • Lines 3 and 4 with a catalytic system for reduction of
nitrogen oxides, with an on-going monitoring system for detecting mercury in the emissions.
• Environmental monitoring of air, soil, and groundwater components and biomonitoring.
• Planning and implementation of a district heating
network for the use of the thermal energy generated by the combustion of waste.
• Establishment of an information point with the data
on the emissions into the atmosphere at the Municipality of Coriano by 30 June 2009.
• Lines 1 and 2 were decommissioned in July 2008. In June 2010, the new line 4 was started; in September 2010, line 3 was decommissioned.
• Line 4 is equipped with the systems prescribed in the design and in the authorisation.
• Active since 1997 through a research contract with
University of Bologna, Industrial Chemistry Department. Arpa carried out monitoring before construction of the new line 4. The results of pre-commissioning and post-commissioning studies will make it possible to define a plan for permanently monitoring the area.
• The executive project was presented to the Province of Rimini on 21 December 2009. To-date, no new activities were carried out, since the development to be served by district heating has been stopped.
• Completed. During 2012, in agreement with the Municipality of Coriano, it was re-located care of the premises of the Municipal Library.
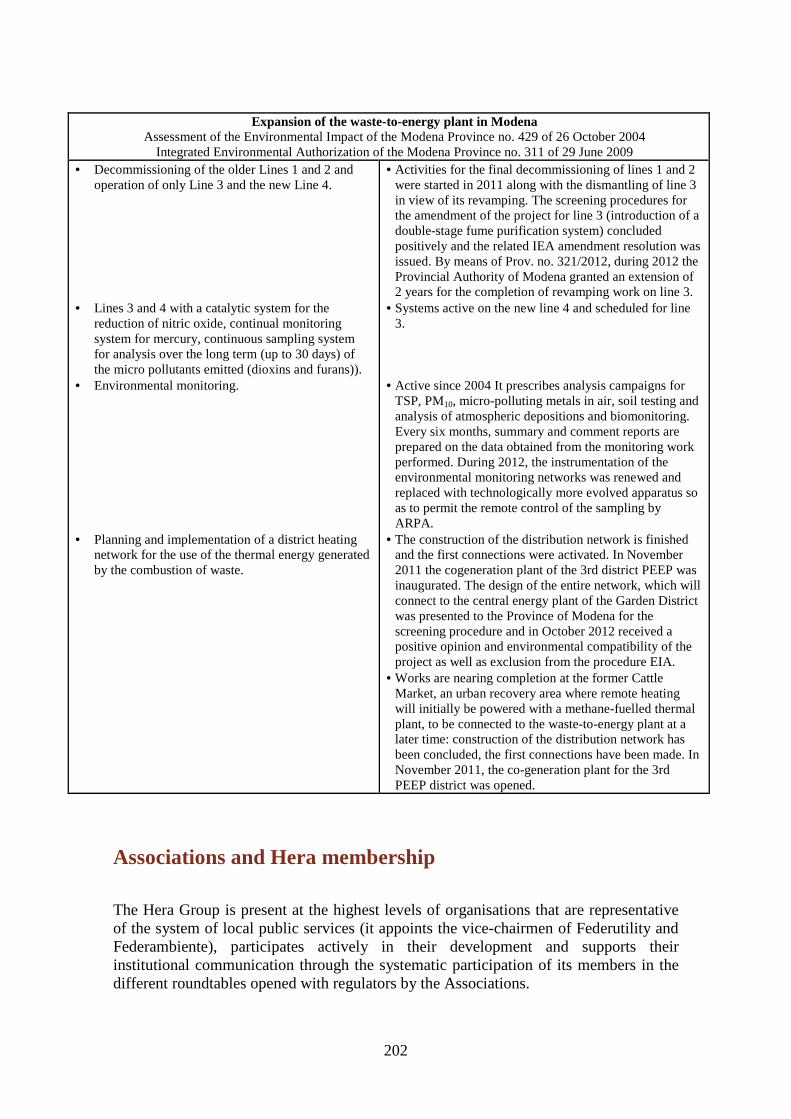
202
Expansion of the waste-to-energy plant in Modena Assessment of the Environmental Impact of the Modena Province no. 429 of 26 October 2004
Integrated Environmental Authorization of the Modena Province no. 311 of 29 June 2009 • Decommissioning of the older Lines 1 and 2 and
operation of only Line 3 and the new Line 4. • Lines 3 and 4 with a catalytic system for the
reduction of nitric oxide, continual monitoring system for mercury, continuous sampling system for analysis over the long term (up to 30 days) of the micro pollutants emitted (dioxins and furans)).
• Environmental monitoring. • Planning and implementation of a district heating
network for the use of the thermal energy generated by the combustion of waste.
• Activities for the final decommissioning of lines 1 and 2 were started in 2011 along with the dismantling of line 3 in view of its revamping. The screening procedures for the amendment of the project for line 3 (introduction of a double-stage fume purification system) concluded positively and the related IEA amendment resolution was issued. By means of Prov. no. 321/2012, during 2012 the Provincial Authority of Modena granted an extension of 2 years for the completion of revamping work on line 3.
• Systems active on the new line 4 and scheduled for line 3.
• Active since 2004 It prescribes analysis campaigns for
TSP, PM10, micro-polluting metals in air, soil testing and analysis of atmospheric depositions and biomonitoring. Every six months, summary and comment reports are prepared on the data obtained from the monitoring work performed. During 2012, the instrumentation of the environmental monitoring networks was renewed and replaced with technologically more evolved apparatus so as to permit the remote control of the sampling by ARPA.
• The construction of the distribution network is finished and the first connections were activated. In November 2011 the cogeneration plant of the 3rd district PEEP was inaugurated. The design of the entire network, which will connect to the central energy plant of the Garden District was presented to the Province of Modena for the screening procedure and in October 2012 received a positive opinion and environmental compatibility of the project as well as exclusion from the procedure EIA.
• Works are nearing completion at the former Cattle Market, an urban recovery area where remote heating will initially be powered with a methane-fuelled thermal plant, to be connected to the waste-to-energy plant at a later time: construction of the distribution network has been concluded, the first connections have been made. In November 2011, the co-generation plant for the 3rd PEEP district was opened.
Associations and Hera membership
The Hera Group is present at the highest levels of organisations that are representative of the system of local public services (it appoints the vice-chairmen of Federutility and Federambiente), participates actively in their development and supports their institutional communication through the systematic participation of its members in the different roundtables opened with regulators by the Associations.

203
The Group is also a member of AIRU (the Italian association for Municipal Heating), CIG (Italian Gas Committee), FIRE (Italian Federation for the Rational use of Energy. It contributes to research activities regarding the public services sector conducted by leading institutions, both as a customer for specific research, and participating in the scientific debate proposed by them with contributions published in the record (AREL - Research and Legislation Agency, AGICI Business Finance) and direct participation in top level bodies (such as the IEFE board, Institute of energy and environment politics and economics at L. Bocconi University). Hera is also a member of the ASPHI (promotion and integration of the disabled via the use of Information and Communication Technology) association and Impronta Etica, a business association for the promotion of social responsibility.
Dialogue with local communities
In article 58 of its Code of Ethics, “Hera commits to giving due regard to the suggestions deriving from the communities in which it operates and to this end sets up consultation, information and participatory initiatives. This is particularly true for communities located near the plants.” The Group’s commitment is more significant in the territories in which it builds or expands waste treatment or electricity production plants. In 2012, the activity of the RABs of Ferrara and Imola continued.
What is a RAB? RABs (Residential Advisory Boards) are a way companies and the public at large can get together and exchange information and monitor environmental indicators. A RAB facilitates communication, the exchange of information and interactions between a company and the citizens residing in the urban areas surrounding the plants belonging to the company, these being areas in which environmental impacts or risk situations can easily develop, with direct repercussions on the urban environment. This mechanism was tested for the first time in 1998 in the Netherlands on the outskirts of Rotterdam, hosting a petrochemical complex managed by Shell.
The RAB at Ferrara The first RAB (Residential Advisory Board) which the Hera Group participated in started up in Ferrara in 2005, in relation to the upgrading of the waste-to-energy plant managed by Hera. Currently, it comprises four members elected by citizens of the neighbourhoods in question, the President of the District where the plant is located and two Hera representatives. The planned model has introduced many innovative elements in the relations between Hera and the local community insofar as the presence and environmental impact of the waste to energy plant. The distinctive features that the RAB of Ferrara has created in its role are as follows:
204
• RAB members can freely access the Hera plants in Ferrara, in order to personally check on operations and view the main documents (analysis of atmospheric emissions, waste products records etc.);
• intense data collection and documentation activities: in the first six and a half years of its activity (from May 2005 to December 2012), the RAB met approximately 140 times, around twice a month on average, much more often than the 3 annual meetings envisaged by the Articles of Association;
• the organisation of public meetings, involving technicians and specialists who illustrate and discuss the issues identified. Specific attention was paid to health aspects linked to waste management and separate waste collection; on this last aspect, the RAB was several times the leading party during meetings in the various areas adjacent to the plant;
• control of compliance with commitments undertaken, such as local offsets, meaning the creation of a new roadway link, the diffusion of district heating (connected to the recovery of heat from waste-to-energy plants), and the realisation of a new wooded area in the area between the plant and the nearby inhabited area of Porotto: six hectares with native plants belonging to a reference phytoclimatic framework.
In 2012, periodic checks continued on the data pertaining to the operation and atmospheric emissions of the waste-to-energy plant according to the procedure defined by the RAB together with the Hera technical personnel responsible for the plant, with reporting on the waste disposed of (with indication of the type and origin of the same) and the atmospheric emissions detected (compared with the legal limits and those established by the IEA). The reports are available on the RAB site, www.rab-fe.org. In 2012, the RAB planned several meetings for in-depth discussions open to the general public for the purpose of more fully disclosing information on the area; among the most significant issues it tackled:
• the environmental performances of the waste-to-energy plant and production; • waste disposal at the waste-to-energy plant; • the results of the separate waste collection in the Municipality of Ferrara (2011)
and development projects for 2012; • the presentation of the “Tracking waste” project, created by Hera and jointly
financed by the Emilia-Romagna Region, to discover where the separated waste collected goes;
• new Akron waste recovery and selection plant in Ferrara. The meeting with the Province of Ferrara’s Councillor for the Environment and Herambiente technicians was particularly significant, with regard to the request by the latter for a non-essential amendment of the IEA aimed at eliminating the maximum limit relating to the conferral of special waste, without exceeding the total limit of 130 tons, and eliminating the limit of origin of the same. As a result of this project that promoted the establishment and development of the Ferrara RAB, in 2006 the Hera Group was awarded the Sodalitas Social Award in the category “Internal Social Responsibility Processes.”
Transparency in Hera waste-to-energy plant emissions On the Group’s website, since 2008, the average values of the emissions from the Group’s waste-to-energy plants from the previous day and the “half-hourly averages”

205
can be consulted (every half hour the on-line data is updated with the average value recorded over the past 30 minutes). The data are automatically sent from the detection systems, operational on a 24/7 basis in all plants (the Group’s waste-to-energy plants are located in the provinces of Bologna, Ferrara, Forlì-Cesena, Modena, Ravenna and Rimini). As a further guarantee of transparency, Hera commits to: - daily or weekly reporting of the half-hour and daily averages to the control agency (ARPA); - yearly reporting on the plant’s operations, by 30 April every year, to the competent authorities (Provinces) and control agency (ARPA); - if the plant is EMAS certified, the control results are published upon formalisation of the “Environmental Declaration”; - for the Ferrara plant, make periodic reports available to RAB; - publishing annual data in comparison with legally established limits and Integrated Environmental Authorisation limits in the Group’s Sustainability Report.
The RAB at Imola Linked to the Hera cogeneration plant in Imola, the RAB is composed of 12 members: 3 representatives of Hera and 9 residents, 3 of which were appointed by two forums (district boards), one by a Residents Committee, and 6 elected on 12 April 2007 through public elections in which over 2,700 residents voted. From its inception to the end of 2012, the RAB met publicly 47 times. The main objectives of the Board include the supervision of the plant by means of analysis of all the regulations linked to the running of the plant so as to check Hera’s accurate observance. It is a benchmark for the citizens with regard to the transparency of the information on the plant and its impact on the town. The activities for monitoring the plant were flanked in 2011 by a project, still underway, for the study of the air quality and the relative impact on the health of the population of Imola, on which Hera, the Municipal Authority, Arpa and the local health authority worked together. During 2010, the Municipal Authority of Imola was awarded the Pimby Prize, in the energy category, for the Hera cogeneration plant: this is an acknowledgement which rewards the local authorities which complete work in their areas, coupling compliance with the rules and citizens’ consensus.
Pending legal proceedings In addition to the lawsuits involving customers, suppliers and public administration which are discussed in the relative sections of this report, at the end of 2012 there were another 131 pending legal proceedings involving various issues concerning claims for compensation connected to the management of the services provided by Hera. At the end of 2012, there were 82 criminal proceedings pending (70 against the company and 12 taken out by the company), of which 30 initiated in 2012. The proceedings against the company mainly regard non-compliance with environmental requirements or regulations, without significant damage to the environment. In 2012, 45 criminal proceedings against the company were closed, mostly with dismissal of the charges or not-guilty verdicts, along with 5 cases of criminal proceedings brought by the company.
206
With regard to the explosion caused by a gas leak from an underground third series pipe laid in the roadway, which occurred on 23 December 2006, in San Benedetto del Querceto, a village in Apennines near Bologna, which resulted in a building collapse and the death of five people, on 14 February 2013 the Bologna Court issued the sentence for the four employees, of which two executives from the Hera Group (one of which no longer a Group employee in 2012). With reference to the criminal proceedings pending before the Forlì Court, involving Herambiente in its capacity as owner of the Forlì waste-to-energy plant, after the positive conclusion in July 2011 of the appeal to the Supreme Court of Cassation furthered by the Public Prosecutor related to the attachment of the plant requested since it was deemed dangerous, the proceedings continued during 2012 against a number of Herambiente executives with regard to the alleged “technical problems” concerning the incineration plant or rather the aspects of potential pollution and suspected administrative violations. 27 civil parties had brought action in the proceedings, private citizens, environmentalist associations and public Bodies. Furthermore, summons for the civil liability of Hera S.p.A. and Herambiente S.p.A. has been served. On 22 October 2012, Hera S.p.A. and Herambiente S.p.A. were excluded from the proceedings and consequently any liability. On 6 December 2012, the Judge acquitted all those charged with the offences respectively ascribed to the same, on the grounds that there was no case to answer. By means of petition brought before the Emilia Romagna Regional Administrative Court against ATO-Bologna, ATERSIR and vis-à-vis Hera S.p.A. and the Ministry for the Environment and the Protection of the Territory and the Sea, Federconsumatori Nazionale requested the cancellation, subject to suspension of the efficacy, of the resolution of the ATO-Bologna no. 16 dated 22 December 2011 which concerned the “Integrated water service: new regulatory period 2011 - 2015 for the operator Hera S.p.A. and 2012 tariff structure” and of any other preordained, associated, alleged and/or consequential act. The main reasons for censure concerned:
• the alleged violation of the repealing referendum effect concerning the matter of the adequacy of the remuneration of the invested capital; • the application, by the challenged resolution, of the Regional Tariff Method which, according to the counterpart, would not be applicable given the alleged lack of legitimation of the Emilia-Romagna Regional Authority with regard to its approval; • the arbitrary introduction, by the challenged resolution, of the item “Financial charges”, which is not event contemplated by the Regional Tariff Method.
Hera S.p.A. appeared before the court disputing the afore-mentioned reasons for censure and, by means of Order filed on 8 June 2012 the Regional Administrative Court rejected the application for interim relief presented by the plaintiff. To-date, the fixing of the pertinent hearing is pending.

207
The environment and future generations
The area in which Hera is operational is not merely a geographic entity. Above all else, it is a primary source of social and environmental wealth, to be respected and protected for the future. Accordingly, Hera is committed to responsibly managing natural resources, improving its results and adopting increasingly efficient technologies with low environmental impact.
Objectives and performance
What we said we would do... What we have done... • Further reduce the use of landfills as a means of disposal for urban waste, while increasing separate waste collection. The objective is to reduce the share of urban waste disposed of via landfills, including pre-treated waste, to 21% in 2012. • Further increase separate waste collection, reaching 52.6% in 2012. • Develop new initiatives in the areas of industrial co-generation, photovoltaic energy and anaerobic digestion, reaching a quantity of energy deriving from renewable and similar sources in 2012 that is equal to 74% of the electricity and thermal energy generated. • Begin the ISO 14001 certification process for the activities carried out by the Large Plant Engineering Department and the company Romagna Compost. • Extend district heating via the full use of energy deriving from waste-to-energy as well as the use of other renewable sources and similar: increase the volume served by 5% in 2012 compared to 2011, and continue the Renewable Energies Hub project in Ferrara, aimed at further exploiting geothermal sources. • Continue the process of upgrading and modernising the wastewater treatment plants: finish the work at 9 wastewater treatment plants in 2012 with a potential of 748,000 inhabitant equivalents. Start adjustment works in 3 other wastewater treatment plants with a potential of 460,000 inhabitant equivalents. • The “Biodigester” project: develop and launch 2 dry anaerobic digestion plants and complete the planning of an additional plant by 2012. • “Mi muovo elettrico” (“Driving electric”)
• In 2012, municipal waste treated via landfills, including that which had been pre-treated, amounted to 21.4%, compared to 23.1% in 2011. The quantity of waste-to-energy plant urban waste was stable compared to 2011. (see page 254) • In 2012, separate waste collection came to 51.9% compared with the 2011 figure of 50.5% (see page 258) • In 2012, the quantity of energy deriving from renewable and similar sources was equal to 72% of the electricity and thermal energy generated. Two anaerobic digestion plants and an industrial cogeneration plant were opened in 2012, and four photovoltaic plants were purchased (see page Errore. Il segnalibro non è definito.) • Romagna Compost was granted ISO 14001 certification while the certification process for the activities carried out by the Large Plant Engineering Department was put back. (see page 33) • In 2012, the volume served increased by 3% compared to 2011. Renewable Energies Hub Project: in June 2012 the Region was presented with the “screening” request for the authorisation to research geothermal energy sources (see page Errore. Il segnalibro non è definito.) • 2012 saw the completion of the adjustment works at 6 plants with a potential of 729,000 inhabitant equivalents; the works at the remaining 3 plants will conclude in 2013. 2013 will also see the start of the works that were scheduled to take place at 3 wastewater treatment plants in 2012. (see page 232) • In 2012 two anaerobic digestion plants were opened in Rimini and Lugo (Ravenna), and the final planning of the Modena plant was concluded.
208
project: promoting electric mobility through the activation of additional recharge points.
(see page Errore. Il segnalibro non è definito.) • Three commercial offers relating to the recharging of electric vehicles were drawn up in 2012. The project was presented during European Mobility Week (see page 207)
We shall... • Further reduce the use of landfills as a means of disposal for urban waste, while increasing separate waste collection. The objective is to reduce the share of urban waste disposed of via landfills, including pre-treated waste, to 17% in 2013. • Further increase separate waste collection, reaching 54% in 2013. • Define an energy management system and begin the process for attaining ISO 50001 certification for Hera S.p.A.. • Establish and implement a new way of collecting bulky waste involving local “recycling markets” and not-for-profit associations in order to intercept reusable materials and reduce waste. • Carry out activities aimed at increasing the amount of materials taken to Collection centres. • Extend district heating via the full use of energy deriving from waste-to-energy as well as the use of other renewable sources and similar: increase the volume served by 4% in 2013 compared to 2012, and continue the Renewable Energies Hub project in Ferrara, aimed at further exploiting geothermal sources. • Complete the works and open the new waste sorting plants in Ferrara and Bologna. • Finish the sewage and purification adjustment works in 8 additional urban areas for a total of 220,000 inhabitant equivalents (also through the conclusion of works at 4 wastewater treatment plants with a potential of 28,000 inhabitant equivalents) in 2013.
• Launch 5 of the 11 actions from the Rimini Seawater Protection Plan aimed at restructuring the city’s sewage and purification system. Continue the work begun in 2012.
Environmental aspects of the activities managed by Hera
The main environmental issues related to our operations are described in this section, along with the results achieved thanks to the development of the environmental management system. For the energy services, the main environmental issues are:
• the efficiency of the gas, electricity and district heating distribution networks; • the production of electricity and thermal energy from renewable sources (photovoltaic energy, use of landfill biogas, wastewater treatment and digestion of organic waste), from similar sources (cogeneration plants and turboexpanders) and from waste-to-energy transformation.
For the water services, the main environmental issues are: • limiting subsidence; • the efficiency of the water network and of drinking water purification plants; • the reintroduction of water into the environment following collection by sewage systems and required purification.
With regard to subsidence, Hera applies the water supply policy defined by local authorities, and works toward reducing groundwater collection by using plants fed by surface water as frequently as possible. To limit the environmental impact of wastewater, the sewage network in coastal areas is equipped with mechanisms regulating discharge into the sea in the event of heavy rainfall. Tanks are also being built to collect runoff water to be transferred to treatment plants.

209
The main purification plants are equipped with odour treatment systems using bio filters. All plants are equipped with 24-hour a day staffing, supported by a remote-control system, and inspections on a daily basis or 2-3 times per week, depending on the plant size. Wastewater is controlled before being reintroduced into the environment according to a plan specifying the number, frequency and type of analysis.
Main environmental issues
Use of natural resources (input)
Production process phases
Environmental emissions (output)
Methane gasOdorantsEnergy consumption
GroundwaterSurface waterEnergyReagents
Energy consumptionReagents
Energy servicesDistribution and sale ofmethane gasProduction, distributionand sale of electricityDistrict heating
Water servicesWithdrawalTreatmentDistributionSewagePurification
EnvironmentalservicesStreet sweepingWaste collectionWaste treatment
Network leaksAtmospheric emissionsWaste production
Network leaksEmissionsSewage (treated)Purification sludge
Emissions from plants (combustion fumes, biogases, odours …)Vehicle emissionsEnergy recoveredMaterial recovered
With regard to waste management services, the main issues concern:
• promoting and applying initiatives for waste prevention and the reuse of products; • increasing separate waste collection and the consequent recovery of materials; • reducing waste sent to landfills, consistent with European and Italian regulations; • recovering energy from waste (via waste-to-energy transformation processes and biogas recovery).
The prevention of waste limits the waste of resources and reduces the quantity of waste to be managed. Increased separate waste collection enhances the efficiency of downstream waste treatment and the recovery of material and energy, as well as reducing landfill volumes. The applicable environmental regulations, continuously evolving, require that all equipment containing substances damaging to the ozone layer or greenhouse gases undergoes review and frequent checks in order to detect any leaks. A specific instruction which the Hera Group has implemented identifies in detail the activities required and the frequency of checks which are mandatory in order to guarantee full compliance.
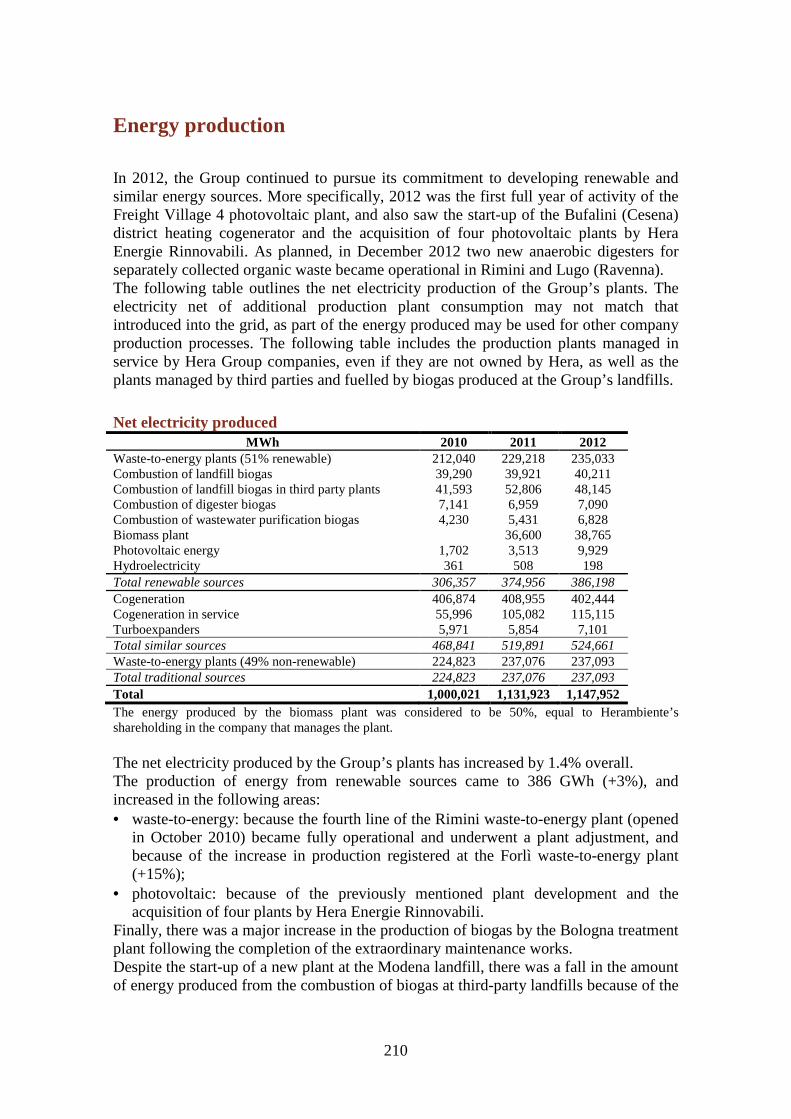
210
Energy production
In 2012, the Group continued to pursue its commitment to developing renewable and similar energy sources. More specifically, 2012 was the first full year of activity of the Freight Village 4 photovoltaic plant, and also saw the start-up of the Bufalini (Cesena) district heating cogenerator and the acquisition of four photovoltaic plants by Hera Energie Rinnovabili. As planned, in December 2012 two new anaerobic digesters for separately collected organic waste became operational in Rimini and Lugo (Ravenna). The following table outlines the net electricity production of the Group’s plants. The electricity net of additional production plant consumption may not match that introduced into the grid, as part of the energy produced may be used for other company production processes. The following table includes the production plants managed in service by Hera Group companies, even if they are not owned by Hera, as well as the plants managed by third parties and fuelled by biogas produced at the Group’s landfills.
Net electricity produced MWh 2010 2011 2012
Waste-to-energy plants (51% renewable) 212,040 229,218 235,033 Combustion of landfill biogas 39,290 39,921 40,211 Combustion of landfill biogas in third party plants 41,593 52,806 48,145 Combustion of digester biogas 7,141 6,959 7,090 Combustion of wastewater purification biogas 4,230 5,431 6,828 Biomass plant 36,600 38,765 Photovoltaic energy 1,702 3,513 9,929 Hydroelectricity 361 508 198 Total renewable sources 306,357 374,956 386,198 Cogeneration 406,874 408,955 402,444 Cogeneration in service 55,996 105,082 115,115 Turboexpanders 5,971 5,854 7,101 Total similar sources 468,841 519,891 524,661 Waste-to-energy plants (49% non-renewable) 224,823 237,076 237,093 Total traditional sources 224,823 237,076 237,093 Total 1,000,021 1,131,923 1,147,952 The energy produced by the biomass plant was considered to be 50%, equal to Herambiente’s shareholding in the company that manages the plant. The net electricity produced by the Group’s plants has increased by 1.4% overall. The production of energy from renewable sources came to 386 GWh (+3%), and increased in the following areas: • waste-to-energy: because the fourth line of the Rimini waste-to-energy plant (opened
in October 2010) became fully operational and underwent a plant adjustment, and because of the increase in production registered at the Forlì waste-to-energy plant (+15%);
• photovoltaic: because of the previously mentioned plant development and the acquisition of four plants by Hera Energie Rinnovabili.
Finally, there was a major increase in the production of biogas by the Bologna treatment plant following the completion of the extraordinary maintenance works. Despite the start-up of a new plant at the Modena landfill, there was a fall in the amount of energy produced from the combustion of biogas at third-party landfills because of the
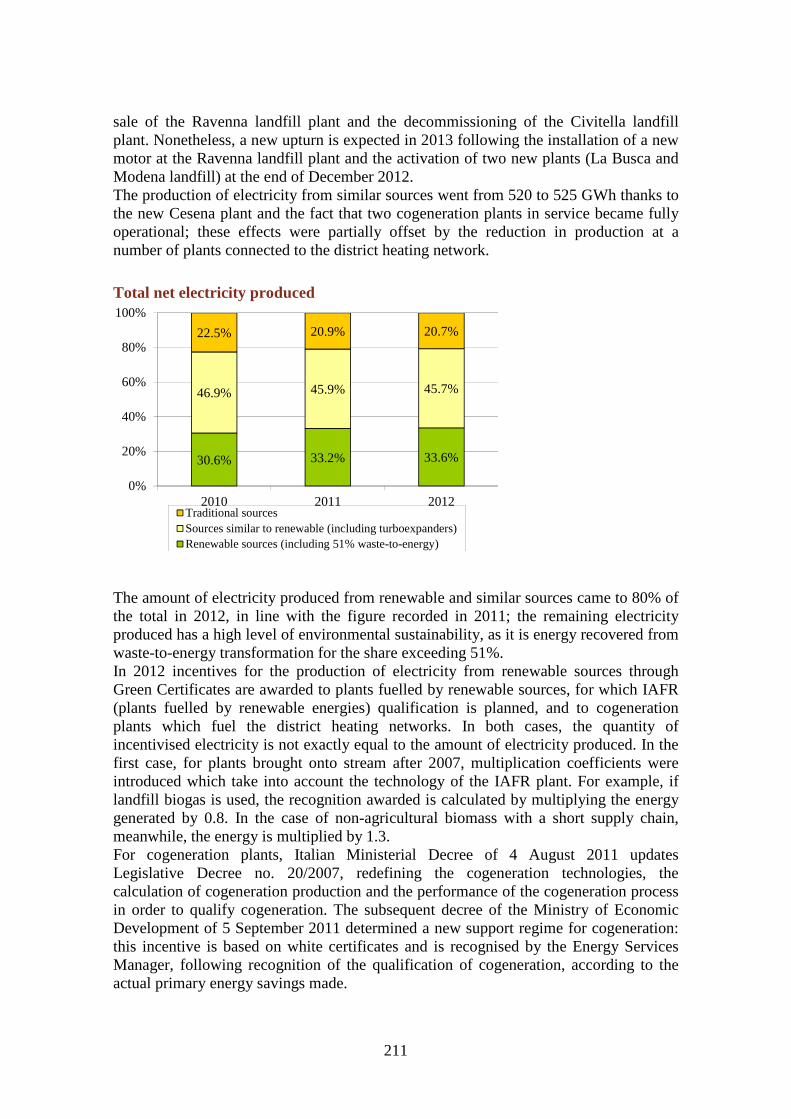
211
sale of the Ravenna landfill plant and the decommissioning of the Civitella landfill plant. Nonetheless, a new upturn is expected in 2013 following the installation of a new motor at the Ravenna landfill plant and the activation of two new plants (La Busca and Modena landfill) at the end of December 2012. The production of electricity from similar sources went from 520 to 525 GWh thanks to the new Cesena plant and the fact that two cogeneration plants in service became fully operational; these effects were partially offset by the reduction in production at a number of plants connected to the district heating network.
Total net electricity produced
The amount of electricity produced from renewable and similar sources came to 80% of the total in 2012, in line with the figure recorded in 2011; the remaining electricity produced has a high level of environmental sustainability, as it is energy recovered from waste-to-energy transformation for the share exceeding 51%. In 2012 incentives for the production of electricity from renewable sources through Green Certificates are awarded to plants fuelled by renewable sources, for which IAFR (plants fuelled by renewable energies) qualification is planned, and to cogeneration plants which fuel the district heating networks. In both cases, the quantity of incentivised electricity is not exactly equal to the amount of electricity produced. In the first case, for plants brought onto stream after 2007, multiplication coefficients were introduced which take into account the technology of the IAFR plant. For example, if landfill biogas is used, the recognition awarded is calculated by multiplying the energy generated by 0.8. In the case of non-agricultural biomass with a short supply chain, meanwhile, the energy is multiplied by 1.3. For cogeneration plants, Italian Ministerial Decree of 4 August 2011 updates Legislative Decree no. 20/2007, redefining the cogeneration technologies, the calculation of cogeneration production and the performance of the cogeneration process in order to qualify cogeneration. The subsequent decree of the Ministry of Economic Development of 5 September 2011 determined a new support regime for cogeneration: this incentive is based on white certificates and is recognised by the Energy Services Manager, following recognition of the qualification of cogeneration, according to the actual primary energy savings made.
30.6% 33.2% 33.6%
46.9% 45.9% 45.7%
22.5% 20.9% 20.7%
0%
20%
40%
60%
80%
100%
2010 2011 2012Traditional sourcesSources similar to renewable (including turboexpanders)Renewable sources (including 51% waste-to-energy)
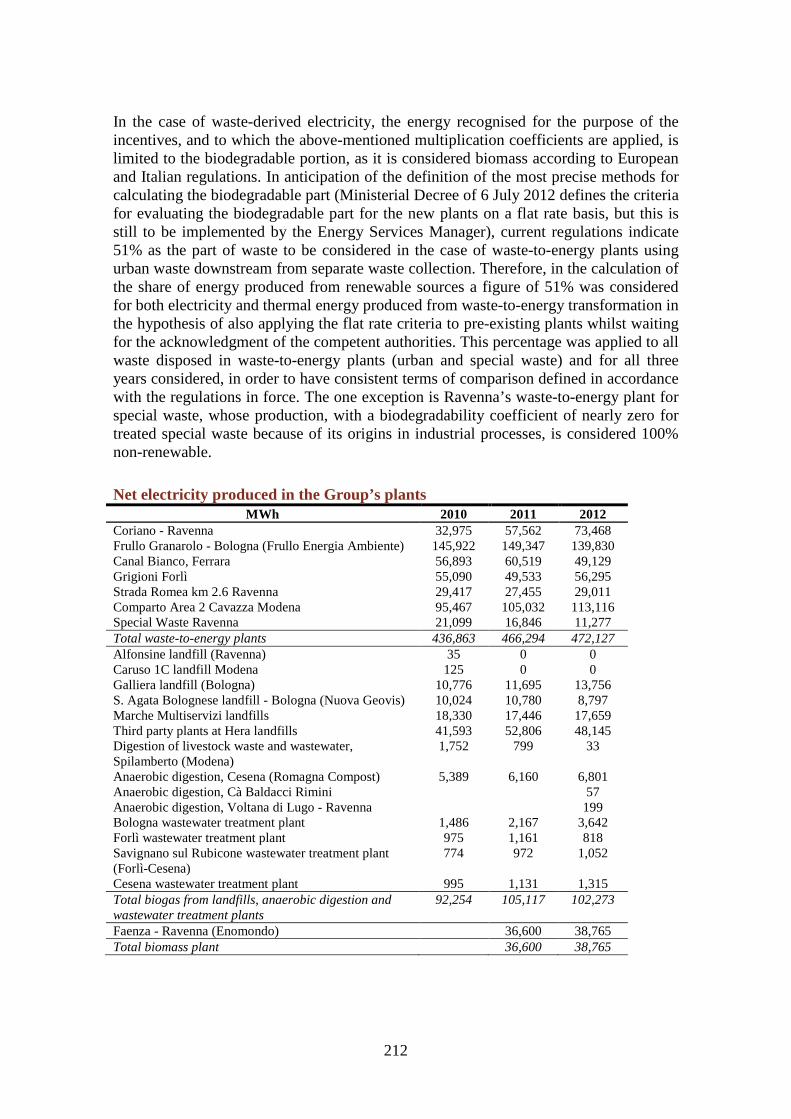
212
In the case of waste-derived electricity, the energy recognised for the purpose of the incentives, and to which the above-mentioned multiplication coefficients are applied, is limited to the biodegradable portion, as it is considered biomass according to European and Italian regulations. In anticipation of the definition of the most precise methods for calculating the biodegradable part (Ministerial Decree of 6 July 2012 defines the criteria for evaluating the biodegradable part for the new plants on a flat rate basis, but this is still to be implemented by the Energy Services Manager), current regulations indicate 51% as the part of waste to be considered in the case of waste-to-energy plants using urban waste downstream from separate waste collection. Therefore, in the calculation of the share of energy produced from renewable sources a figure of 51% was considered for both electricity and thermal energy produced from waste-to-energy transformation in the hypothesis of also applying the flat rate criteria to pre-existing plants whilst waiting for the acknowledgment of the competent authorities. This percentage was applied to all waste disposed in waste-to-energy plants (urban and special waste) and for all three years considered, in order to have consistent terms of comparison defined in accordance with the regulations in force. The one exception is Ravenna’s waste-to-energy plant for special waste, whose production, with a biodegradability coefficient of nearly zero for treated special waste because of its origins in industrial processes, is considered 100% non-renewable.
Net electricity produced in the Group’s plants MWh 2010 2011 2012
Coriano - Ravenna 32,975 57,562 73,468 Frullo Granarolo - Bologna (Frullo Energia Ambiente) 145,922 149,347 139,830 Canal Bianco, Ferrara 56,893 60,519 49,129 Grigioni Forlì 55,090 49,533 56,295 Strada Romea km 2.6 Ravenna 29,417 27,455 29,011 Comparto Area 2 Cavazza Modena 95,467 105,032 113,116 Special Waste Ravenna 21,099 16,846 11,277 Total waste-to-energy plants 436,863 466,294 472,127 Alfonsine landfill (Ravenna) 35 0 0 Caruso 1C landfill Modena 125 0 0 Galliera landfill (Bologna) 10,776 11,695 13,756 S. Agata Bolognese landfill - Bologna (Nuova Geovis) 10,024 10,780 8,797 Marche Multiservizi landfills 18,330 17,446 17,659 Third party plants at Hera landfills 41,593 52,806 48,145 Digestion of livestock waste and wastewater, Spilamberto (Modena)
1,752 799 33
Anaerobic digestion, Cesena (Romagna Compost) 5,389 6,160 6,801 Anaerobic digestion, Cà Baldacci Rimini 57 Anaerobic digestion, Voltana di Lugo - Ravenna 199 Bologna wastewater treatment plant 1,486 2,167 3,642 Forlì wastewater treatment plant 975 1,161 818 Savignano sul Rubicone wastewater treatment plant (Forlì-Cesena)
774 972 1,052
Cesena wastewater treatment plant 995 1,131 1,315 Total biogas from landfills, anaerobic digestion and wastewater treatment plants
92,254 105,117 102,273
Faenza - Ravenna (Enomondo) 36,600 38,765 Total biomass plant 36,600 38,765

213
MWh 2010 2011 2012 Bologna Freight Village 1 (Hera Energie Rinnovabili) 226 264 243 Bologna Freight Village 2 (Hera Energie Rinnovabili) 594 1,294 1,208 Bologna Freight Village 3 (Hera Energie Rinnovabili) 623 1,259 1,160 Bologna Freight Village 4 (Hera Energie Rinnovabili) 450 1,190 Petriolo – Macerata (Hera Energie Rinnovabili) 1,410 Alfianello – Brescia (Hera Energie Rinnovabili) 1,186 Copparo – Ferrara (Hera Energie Rinnovabili) 1,328 Faenza – Ravenna (Hera Energie Rinnovabili) 1,394 Mordano – Bologna (Akron) 232 Voltana di Lugo – Ravenna (Akron) 356 Ravenna Site 122 141 111 Photovoltaic with peak capacity below 50 kW 137 105 111 Total photovoltaic 1,702 3,513 9,929 Cavaticcio Bologna 0 303 0 Para 1 Verghereto - Forlì-Cesena (Hera Energie Rinnovabili)
361 205 197
Total hydroelectric 361 508 197 Casalegno Imola (Bologna) 338,284 333,534 332,372 Castelbolognese (Ravenna) 896 863 514 Ecocity Casalecchio di Reno (Bologna) 10,711 9,926 8,508 Fossolo Bologna 572 927 592 Acer Barca Bologna 24,214 22,206 10,660 Bologna Site 14,993 16,679 17,169 Monterenzio (Bologna) 238 192 160 S. Biagio Casalecchio di Reno (Bologna) 762 1,327 1,333 Ipermercato Fiera Forlì cogeneration plant 661 733 0 Ippodromo Cesena 5,960 2,518 3,688 Bufalini Cesena 6,560 Aranova Ferrara 748 397 268 Giardino Modena 8,234 16,079 16,550 3rd PEEP Modena 2,764 3,674 Molino Rosso Imola (Bologna) 601 810 396 Cogeneration in service 55,996 105,082 115,115 Total Cogeneration 462,870 514,037 517,559 Bologna 3,785 3,301 2,640 Ferrara 0 0 0 Forlì 2,186 499 1,785 Ravenna 0 2,054 2,677 Total turboexpanders 5,971 5,854 7,101 Total 1,000,021 1,131,923 1,147,952 The energy produced by the biomass plant was considered to be 50%, equal to Herambiente’s shareholding in the company that manages the plant. The average efficiency of the electricity and thermal energy production plants (meaning the ratio of incoming primary energy and net outgoing energy of the plant) is around 30% for the waste-to-energy plants that power district heating networks and 20-24% for new waste-to-energy plants, and between 60% and 83% for the cogeneration plants. As regards the latter, the best performances are recorded where there is a greater annual heat load. The total installed electricity capacity of the Group’s plants is equal to 263 MW. The electricity produced in 2012 by companies in which the Group holds investments pertaining to Hera, came to around 939 GWh (share acquired by Hera). The companies involved are SET, Tirreno Power and Calenia Energia, in which Hera has an equity investment. SET and Calenia Energia respectively run two power stations in Teverola
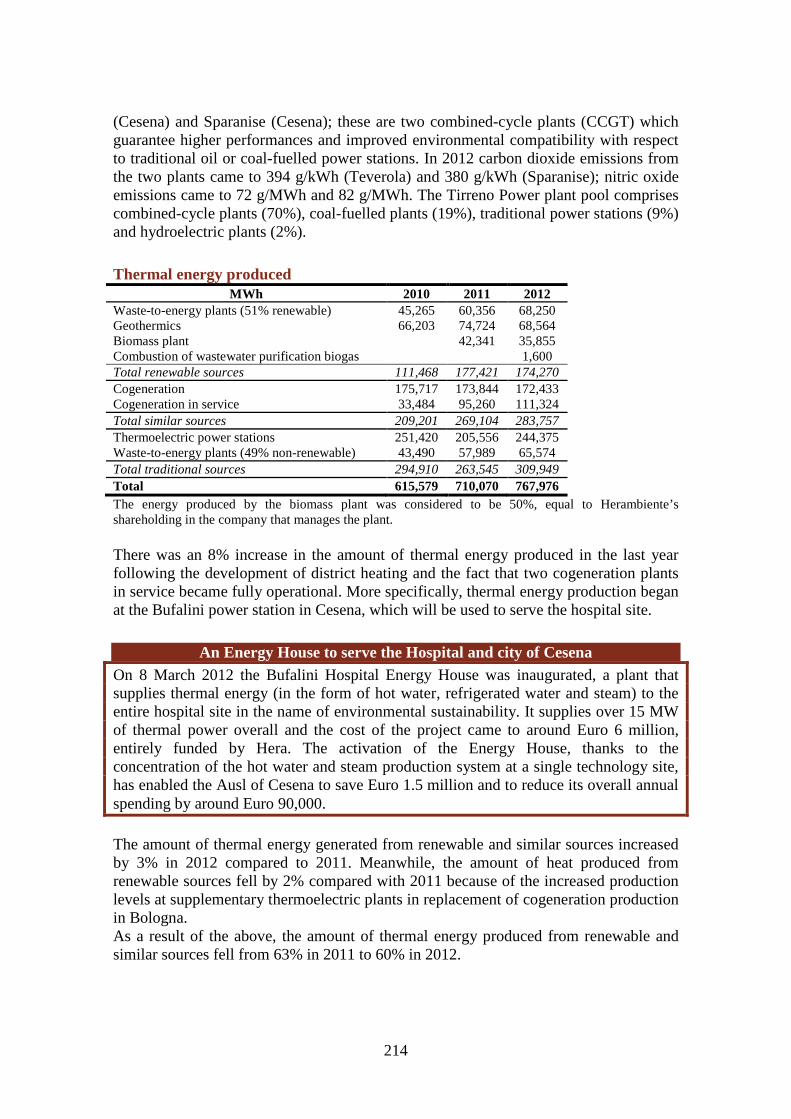
214
(Cesena) and Sparanise (Cesena); these are two combined-cycle plants (CCGT) which guarantee higher performances and improved environmental compatibility with respect to traditional oil or coal-fuelled power stations. In 2012 carbon dioxide emissions from the two plants came to 394 g/kWh (Teverola) and 380 g/kWh (Sparanise); nitric oxide emissions came to 72 g/MWh and 82 g/MWh. The Tirreno Power plant pool comprises combined-cycle plants (70%), coal-fuelled plants (19%), traditional power stations (9%) and hydroelectric plants (2%).
Thermal energy produced MWh 2010 2011 2012
Waste-to-energy plants (51% renewable) 45,265 60,356 68,250 Geothermics 66,203 74,724 68,564 Biomass plant 42,341 35,855 Combustion of wastewater purification biogas 1,600 Total renewable sources 111,468 177,421 174,270 Cogeneration 175,717 173,844 172,433 Cogeneration in service 33,484 95,260 111,324 Total similar sources 209,201 269,104 283,757 Thermoelectric power stations 251,420 205,556 244,375 Waste-to-energy plants (49% non-renewable) 43,490 57,989 65,574 Total traditional sources 294,910 263,545 309,949 Total 615,579 710,070 767,976 The energy produced by the biomass plant was considered to be 50%, equal to Herambiente’s shareholding in the company that manages the plant. There was an 8% increase in the amount of thermal energy produced in the last year following the development of district heating and the fact that two cogeneration plants in service became fully operational. More specifically, thermal energy production began at the Bufalini power station in Cesena, which will be used to serve the hospital site.
An Energy House to serve the Hospital and city of Cesena On 8 March 2012 the Bufalini Hospital Energy House was inaugurated, a plant that supplies thermal energy (in the form of hot water, refrigerated water and steam) to the entire hospital site in the name of environmental sustainability. It supplies over 15 MW of thermal power overall and the cost of the project came to around Euro 6 million, entirely funded by Hera. The activation of the Energy House, thanks to the concentration of the hot water and steam production system at a single technology site, has enabled the Ausl of Cesena to save Euro 1.5 million and to reduce its overall annual spending by around Euro 90,000.
The amount of thermal energy generated from renewable and similar sources increased by 3% in 2012 compared to 2011. Meanwhile, the amount of heat produced from renewable sources fell by 2% compared with 2011 because of the increased production levels at supplementary thermoelectric plants in replacement of cogeneration production in Bologna. As a result of the above, the amount of thermal energy produced from renewable and similar sources fell from 63% in 2011 to 60% in 2012.

215
Total thermal energy produced
Thermal energy produced in the Group’s plants MWh 2010 2011 2012
Bologna (Frullo Energia Ambiente) 36,148 42,241 46,233 Ferrara 52,607 73,210 77,583 Forlì 2,894 10,008 Total waste-to-energy plants 88,755 118,345 133,824 Faenza - Ravenna (Enomondo) 42,341 35,855 Total biomass plant 42,341 35,855 Ferrara geothermics 66,203 74,724 68,564 Total geothermics 66,203 74,724 68,564 Casalegno Imola – Bologna 106,990 99,607 103,946 Castelbolognese - Ravenna 1,190 1,062 654 Ecocity Casalecchio di Reno - Bologna 10,653 9,399 8,431 Fossolo Bologna 655 1,400 900 Acer Barca Bologna 28,938 30,653 16x,197 Bologna Site 8,832 8,748 9,410 Monterenzio - Bologna 468 300 191 S. Biagio Casalecchio di Reno - Bologna 613 1,347 1,448 Ipermercato Fiera Forlì 932 895 0 Ippodromo Cesena 7,577 3,178 4,524 Bufalini Cesena 8,964 Aranova Ferrara 1,094 495 244 Giardino Modena 6,925 14,103 14,003 3rd PEEP Modena 1,584 3,030 Molino Rosso Imola - Bologna 850 1,073 492 Cogeneration in service 33,484 95,260 111,324 Total cogeneration 209,201 269,104 283,758 Thermoelectric powers stations Bologna 122,584 106,287 118,377 Thermoelectric power stations Ferrara 69,581 31,231 43,769 Thermoelectric power stations Forlì-Cesena 16,444 20,294 35,882 Thermoelectric power stations Imola-Faenza 6,761 20,769 22,817 Thermoelectric power stations Modena 31,491 22,584 19,096 Thermoelectric power stations Ravenna 4,559 4,391 4,434 Total thermoelectric power stations 251,420 205,556 244,375 Total 615,579 710,070 767,976 The energy produced by the biomass plant was considered to be 50%, equal to Herambiente’s shareholding in the company that manages the plant.
18.1% 25.0% 22.7%
34.0%37.9% 36.9%
47.9%37.1% 40.4%
0%
20%
40%
60%
80%
100%
2010 2011 2012Traditional sourcesSources similar to renewableRenewable sources (including 51% waste-to-energy)

216
Total energy produced
The share of total energy produced from renewable and similar sources fell slightly in the last year, from 72.8% to 71.5%. An additional 18% of the total energy produced in any case has a high level of environmental sustainability as it is energy recovered from waste-to-energy transformation for the share exceeding 51%.
Total energy produced (2012)
Hera and renewable sources In 2012 the Hera Group confirmed its commitment to the production of energy from renewable sources and with low environmental impact, which once again this year represented over 70% of the Group’s total production. This commitment relates to all of the Group’s business segments, beginning with Hera Energie Rinnovabili, the company launched in 2008 with a specific focus on so-called “pure renewables”. Then there is Herambiente, the Group company active in waste treatment, disposal and energy exploitation, and Hera S.p.A., which applies the same principles of maximising energy efficiency and seeking to reduce environmental impact in gas distribution, district heating and water services. As regards new developments, in 2012 four photovoltaic plants of an overall capacity of 4 MW were purchased in the provinces of Brescia, Ferrara, Macerata and Ravenna. This capacity is joined by the plants installed at Bologna Freight Village (3.2 MW), at the
25.8% 30.0% 29.2%
42.0%42.8% 42.2%
32.2% 27.2% 28.5%
0%
20%
40%
60%
80%
100%
2010 2011 2012Traditional sourcesSources similar to renewable (including turboexpanders)Renewable sources (including 51% waste-to-energy)
Waste-to-energy31.6% Plant and
biomass3.9%
Geothermics
3.6%Biogas combustion
5.4%
Photovoltaic and
hydroelectric
0.5%
Cogeneration and
turboexpansion
42.2%
Thermal powerplants
12.8%
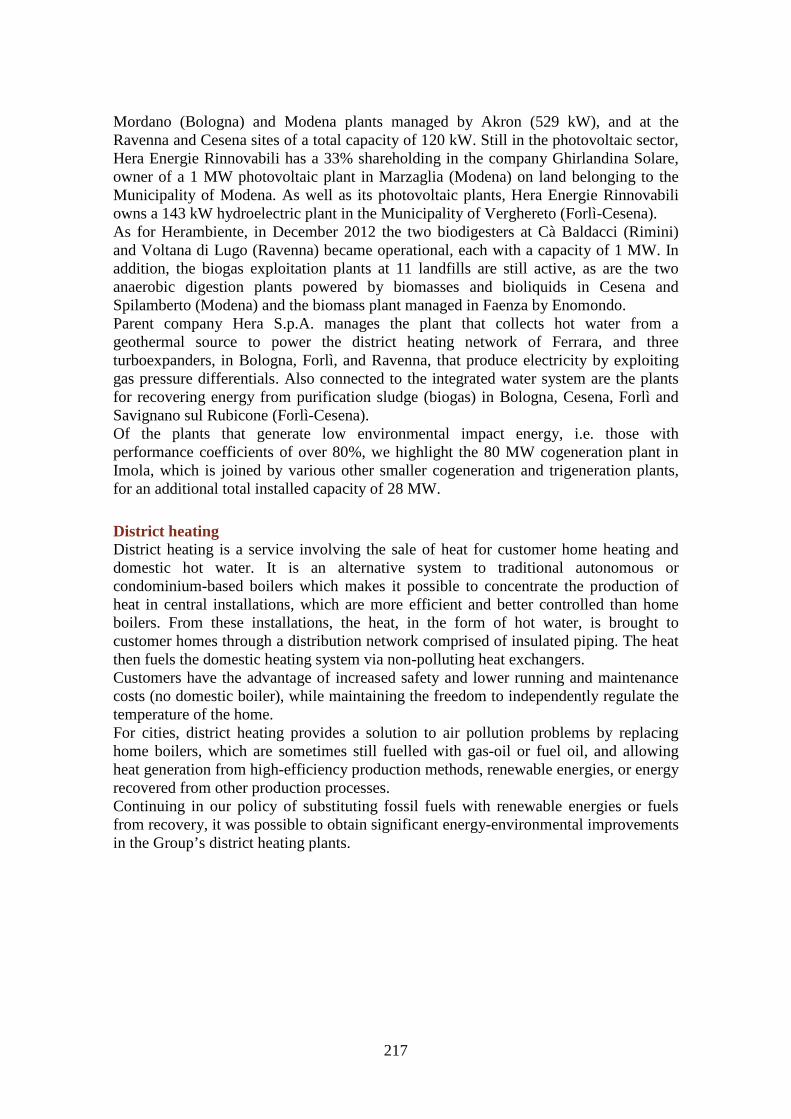
217
Mordano (Bologna) and Modena plants managed by Akron (529 kW), and at the Ravenna and Cesena sites of a total capacity of 120 kW. Still in the photovoltaic sector, Hera Energie Rinnovabili has a 33% shareholding in the company Ghirlandina Solare, owner of a 1 MW photovoltaic plant in Marzaglia (Modena) on land belonging to the Municipality of Modena. As well as its photovoltaic plants, Hera Energie Rinnovabili owns a 143 kW hydroelectric plant in the Municipality of Verghereto (Forlì-Cesena). As for Herambiente, in December 2012 the two biodigesters at Cà Baldacci (Rimini) and Voltana di Lugo (Ravenna) became operational, each with a capacity of 1 MW. In addition, the biogas exploitation plants at 11 landfills are still active, as are the two anaerobic digestion plants powered by biomasses and bioliquids in Cesena and Spilamberto (Modena) and the biomass plant managed in Faenza by Enomondo. Parent company Hera S.p.A. manages the plant that collects hot water from a geothermal source to power the district heating network of Ferrara, and three turboexpanders, in Bologna, Forlì, and Ravenna, that produce electricity by exploiting gas pressure differentials. Also connected to the integrated water system are the plants for recovering energy from purification sludge (biogas) in Bologna, Cesena, Forlì and Savignano sul Rubicone (Forlì-Cesena). Of the plants that generate low environmental impact energy, i.e. those with performance coefficients of over 80%, we highlight the 80 MW cogeneration plant in Imola, which is joined by various other smaller cogeneration and trigeneration plants, for an additional total installed capacity of 28 MW.
District heating District heating is a service involving the sale of heat for customer home heating and domestic hot water. It is an alternative system to traditional autonomous or condominium-based boilers which makes it possible to concentrate the production of heat in central installations, which are more efficient and better controlled than home boilers. From these installations, the heat, in the form of hot water, is brought to customer homes through a distribution network comprised of insulated piping. The heat then fuels the domestic heating system via non-polluting heat exchangers. Customers have the advantage of increased safety and lower running and maintenance costs (no domestic boiler), while maintaining the freedom to independently regulate the temperature of the home. For cities, district heating provides a solution to air pollution problems by replacing home boilers, which are sometimes still fuelled with gas-oil or fuel oil, and allowing heat generation from high-efficiency production methods, renewable energies, or energy recovered from other production processes. Continuing in our policy of substituting fossil fuels with renewable energies or fuels from recovery, it was possible to obtain significant energy-environmental improvements in the Group’s district heating plants.

218
Environmental advantages of district heating 2010 2011 2012
Primary energy saved (toe) 29,464 29,352 34,827 Nitric oxide avoided (t) 333.5 336.4 350.1 Carbon dioxide avoided (t) 156,341 154,023 168,767 Sulphur oxide avoided (t) 317.7 307.4 317.8 Calculated as the difference between a traditional system (existing boiler parks comprising 65% methane-powered boilers and 35% diesel boilers with an average seasonal yield of 75% (source: Comitato Termotecnico Italiano, 2009), and the national electricity grid) and Hera’s district heating systems for the quantity of energy (thermal and electric) produced by Hera. In 2012 the plants managed by Hera recorded primary energy savings of 34,827 tonnes of oil equivalent, an increase of 19% compared to the savings in 2011, equal to a fall of around 5,500 toe.
Sources used for district heating (2005-2012)
As for the sources used for district heating, the percentage of thermal energy produced with gas boilers has fallen from 58% in 2005 to 38% in 2012. Compared with 2011 there has been a fall in the use of geothermal sources and an increase in the use of thermoelectric power stations following problems with a geothermal well in Ferrara and the fall in cogeneration production, which has been replaced by the production of heat from heater boilers, particularly at the Cogen Barca plant in Bologna.
An award for the environmental performance of district heating in Ferrara Efficient use of resources, low CO2 emissions, and a use of renewable energy that coincides with European goals: these were the three criteria evaluated in the EU-financed “Ecoheat4cities” project which saw the Ferrara district heating system awarded the prestigious European certification issued by Ecolabel, the European brand that acknowledges the best environmental performances, certifying their reduced impact on the environment. The amount of renewable energy used by the Ferrara district heating system amounts to 78%, in comparison with a national objective of 17%, while CO2 emissions came to 69 kg for every thermal MWh produced, a particularly relevant figure if compared with the 222 MWh emitted by a regular methane-powered boiler.
15% 14% 13% 13% 14% 11% 13% 11%
7% 10% 9% 12% 13% 15%20% 21%
11% 20%20% 19%
17%22% 20% 17%
14%10%
12% 11%
58% 52% 57% 58%48% 44%
35% 38%
3% 2% 1%
0%
20%
40%
60%
80%
100%
2005 2006 2007 2008 2009 2010 2011 2012Combustible oil in heater boilersMethane gas in heater boilersMethane gas for cogeneration

219
Sources used for district heating (2012)
District heating data 2010 2011 2012
Thermal energy sold (MWh) 534,808 499,350 530,326 Volumes served (thousand of m3) 17,775 18,803 19,386 Housing unit equivalents served (no.) 74,064 78,347 80,744 Housing unit equivalents served were calculated on the basis of an average apartment volume of 240 m3. The amount of thermal energy sold rose by 6.2%, partly because of seasonal effects and partly because of the 3% increase in the volumes served. The most significant increases took place in Cesena, Ferrara and Imola. In 2013 the company will continue to strive for improvements, prioritising the development of district heating with increasing quantities of renewable and similar sources, with specific reference to the development projects in Forlì and the process of authorising the Renewable Energies Hub project in Ferrara.
Thermal energy produced
622,461MWh
District heating network
Geothermics
(in
Ferrara)
Waste-to-energy plants
(in Bologna, Ferrara and Forlì)
Methane gas for cogeneration
(in Bologna, Imola, Forlì-Cesena and Modena)
Methane gas in heater
boilers
(in Bologna, Cesena, Ferrara,
Imola
,
Modena and Ravenna)
1 1 %
21%
11%
38%
Increase according to forecast
Decrease according to forecast
Production of
electricity
(in Imola)
19%
Turbogas

220
Housing unit equivalents served per territory (2012)
Cogeneration for district heating The term cogeneration indicates the combined production of electricity and thermal energy starting from a single source, whether fossil fuel or renewable, implemented in a single integrated system. This takes place in special thermoelectric plants which recover the heat from the exhaust fumes produced by an engine fuelled by any type of fuel: significant energy savings are therefore achieved (approximately 40%) compared with the separate generation of electricity and thermal energy. The Hera Group cogeneration plants, thanks to the connection with district heating networks, also contribute to improving the quality of air in the urban centres in which they are located: their construction resulted in the closing of numerous obsolete boilers, and allowed the local authorities to develop new residential developments featuring a modern and more efficient system for heating and supplying hot water to the buildings. Through district heating, the production of heat is centralised in plants which are more efficient and better controlled than home boilers: controls are continuous, both in terms of the combustion processes and atmospheric emissions. The Group manages 14 co-generation plants, for a total installed capacity of 113 MW.
Bologna34%
Ferrara28%
Forlì-Cesena10%
Imola-Faenza22%
Modena5%
Ravenna1%
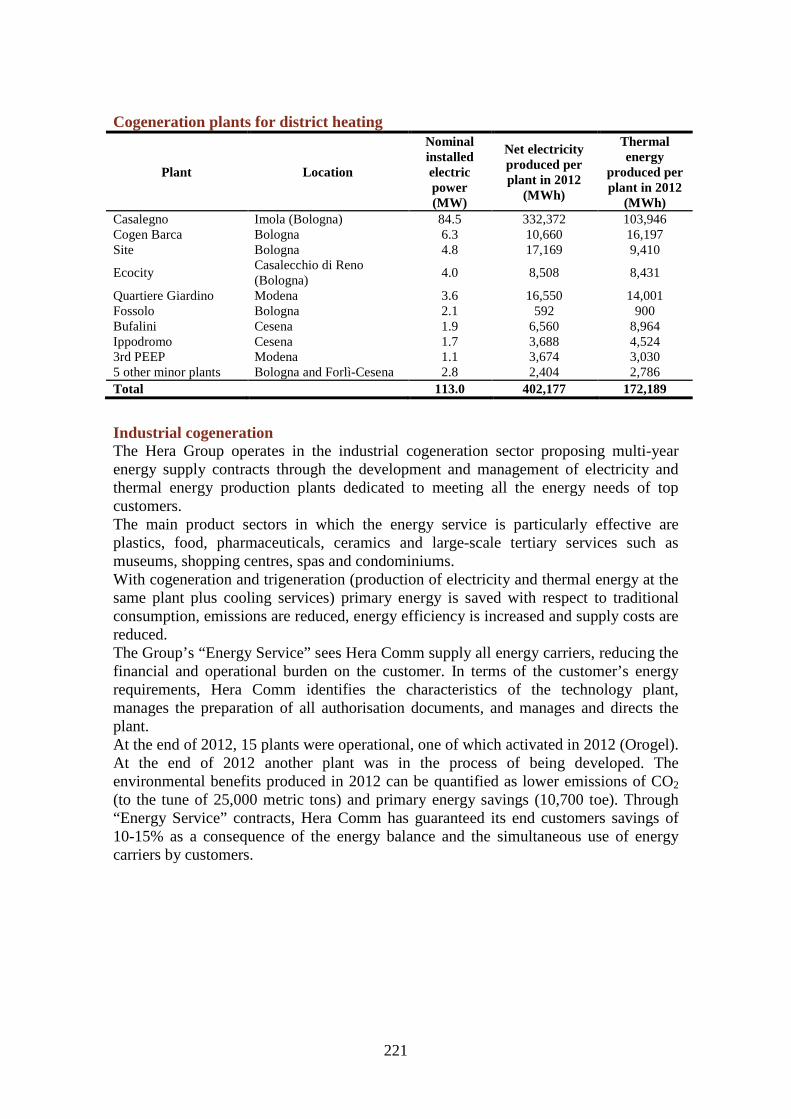
221
Cogeneration plants for district heating
Plant Location
Nominal installed electric power (MW)
Net electricity produced per plant in 2012
(MWh)
Thermal energy
produced per plant in 2012
(MWh) Casalegno Imola (Bologna) 84.5 332,372 103,946 Cogen Barca Bologna 6.3 10,660 16,197 Site Bologna 4.8 17,169 9,410
Ecocity Casalecchio di Reno (Bologna)
4.0 8,508 8,431
Quartiere Giardino Modena 3.6 16,550 14,001 Fossolo Bologna 2.1 592 900 Bufalini Cesena 1.9 6,560 8,964 Ippodromo Cesena 1.7 3,688 4,524 3rd PEEP Modena 1.1 3,674 3,030 5 other minor plants Bologna and Forlì-Cesena 2.8 2,404 2,786 Total 113.0 402,177 172,189
Industrial cogeneration The Hera Group operates in the industrial cogeneration sector proposing multi-year energy supply contracts through the development and management of electricity and thermal energy production plants dedicated to meeting all the energy needs of top customers. The main product sectors in which the energy service is particularly effective are plastics, food, pharmaceuticals, ceramics and large-scale tertiary services such as museums, shopping centres, spas and condominiums. With cogeneration and trigeneration (production of electricity and thermal energy at the same plant plus cooling services) primary energy is saved with respect to traditional consumption, emissions are reduced, energy efficiency is increased and supply costs are reduced. The Group’s “Energy Service” sees Hera Comm supply all energy carriers, reducing the financial and operational burden on the customer. In terms of the customer’s energy requirements, Hera Comm identifies the characteristics of the technology plant, manages the preparation of all authorisation documents, and manages and directs the plant. At the end of 2012, 15 plants were operational, one of which activated in 2012 (Orogel). At the end of 2012 another plant was in the process of being developed. The environmental benefits produced in 2012 can be quantified as lower emissions of CO2
(to the tune of 25,000 metric tons) and primary energy savings (10,700 toe). Through “Energy Service” contracts, Hera Comm has guaranteed its end customers savings of 10-15% as a consequence of the energy balance and the simultaneous use of energy carriers by customers.

222
Cogeneration plants managed in service
Plant Location
Nominal installed electric power (MW)
Net electricity produced per plant in 2012
(MWh)
Thermal energy
produced per plant in 2012
(MWh) Safta Piacenza 7.3 34,177 18,223 Ceramiche CCV Castelvetro (Modena) 4.3 22,053 48,883 Orogel Cesena 4.0 - - Cerindustries Castelbolognese (Ravenna) 3.6 15,027 8,178 Granarolo Granarolo (Bologna) 2.4 14,471 8,044 Magema S.Zaccaria (Ravenna) 2.0 10,122 8,763 Covalpa Celano (L’Aquila) 1.6 5,915 4,611 Centroplast Meldola (Forlì-Cesena) 1.2 5,235 2,859 Cafar Gatteo (Forlì-Cesena) 0.8 4,913 3,556 Fox Bompani Ostellato (Ferrara) 0.7 1,422 814 Aldini Bologna 0.6 447 5,941 Palazzo Pepoli Bologna 0.4 169 186 Le fonti di Matilde Reggio Emilia 0.2 0 0 Filomarket Imola (Bologna) 0.2 419 456 Terme di Riolo Riolo Terme (Ravenna) 0.1 746 811 Total 29.4 115,116 111,325
Energy consumption
Hera’s energy consumption reflects the multi-business nature of the Group (energy, water, environment, and other services such as public lighting and telecommunications). The balanced portfolio of activities creates synergies that increase productivity in multiple sectors while limiting energy consumption. Hera manages cogeneration plants for district heating with the aim of producing thermal energy and electricity to sell to its clients, and cogeneration plants that are mainly designed to satisfy internal consumption requirements. It also manages waste-to-energy plants that meet waste disposal needs while achieving significant energy recovery, turboexpanders that evaluate pressure differentials in the natural gas distribution stations in the local managed networks, and the recovery of low enthalpy geothermic heat at the district heating plant in Ferrara. Implementing measures on its own production systems and at end customer sites in the communities it serves wherever possible, Hera pursues a policy aimed at increasing energy efficiency in all of its activities.
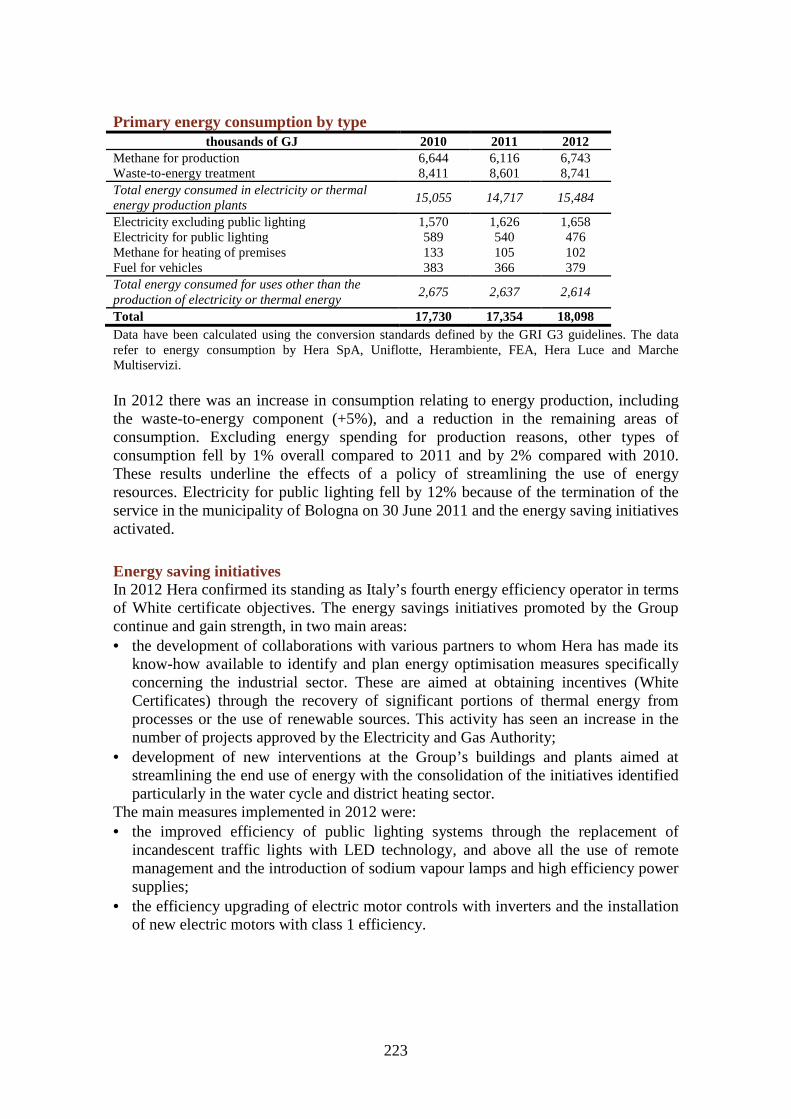
223
Primary energy consumption by type thousands of GJ 2010 2011 2012
Methane for production 6,644 6,116 6,743 Waste-to-energy treatment 8,411 8,601 8,741 Total energy consumed in electricity or thermal energy production plants
15,055 14,717 15,484
Electricity excluding public lighting 1,570 1,626 1,658 Electricity for public lighting 589 540 476 Methane for heating of premises 133 105 102 Fuel for vehicles 383 366 379 Total energy consumed for uses other than the production of electricity or thermal energy
2,675 2,637 2,614
Total 17,730 17,354 18,098 Data have been calculated using the conversion standards defined by the GRI G3 guidelines. The data refer to energy consumption by Hera SpA, Uniflotte, Herambiente, FEA, Hera Luce and Marche Multiservizi. In 2012 there was an increase in consumption relating to energy production, including the waste-to-energy component (+5%), and a reduction in the remaining areas of consumption. Excluding energy spending for production reasons, other types of consumption fell by 1% overall compared to 2011 and by 2% compared with 2010. These results underline the effects of a policy of streamlining the use of energy resources. Electricity for public lighting fell by 12% because of the termination of the service in the municipality of Bologna on 30 June 2011 and the energy saving initiatives activated.
Energy saving initiatives In 2012 Hera confirmed its standing as Italy’s fourth energy efficiency operator in terms of White certificate objectives. The energy savings initiatives promoted by the Group continue and gain strength, in two main areas: • the development of collaborations with various partners to whom Hera has made its
know-how available to identify and plan energy optimisation measures specifically concerning the industrial sector. These are aimed at obtaining incentives (White Certificates) through the recovery of significant portions of thermal energy from processes or the use of renewable sources. This activity has seen an increase in the number of projects approved by the Electricity and Gas Authority;
• development of new interventions at the Group’s buildings and plants aimed at streamlining the end use of energy with the consolidation of the initiatives identified particularly in the water cycle and district heating sector.
The main measures implemented in 2012 were: • the improved efficiency of public lighting systems through the replacement of
incandescent traffic lights with LED technology, and above all the use of remote management and the introduction of sodium vapour lamps and high efficiency power supplies;
• the efficiency upgrading of electric motor controls with inverters and the installation of new electric motors with class 1 efficiency.
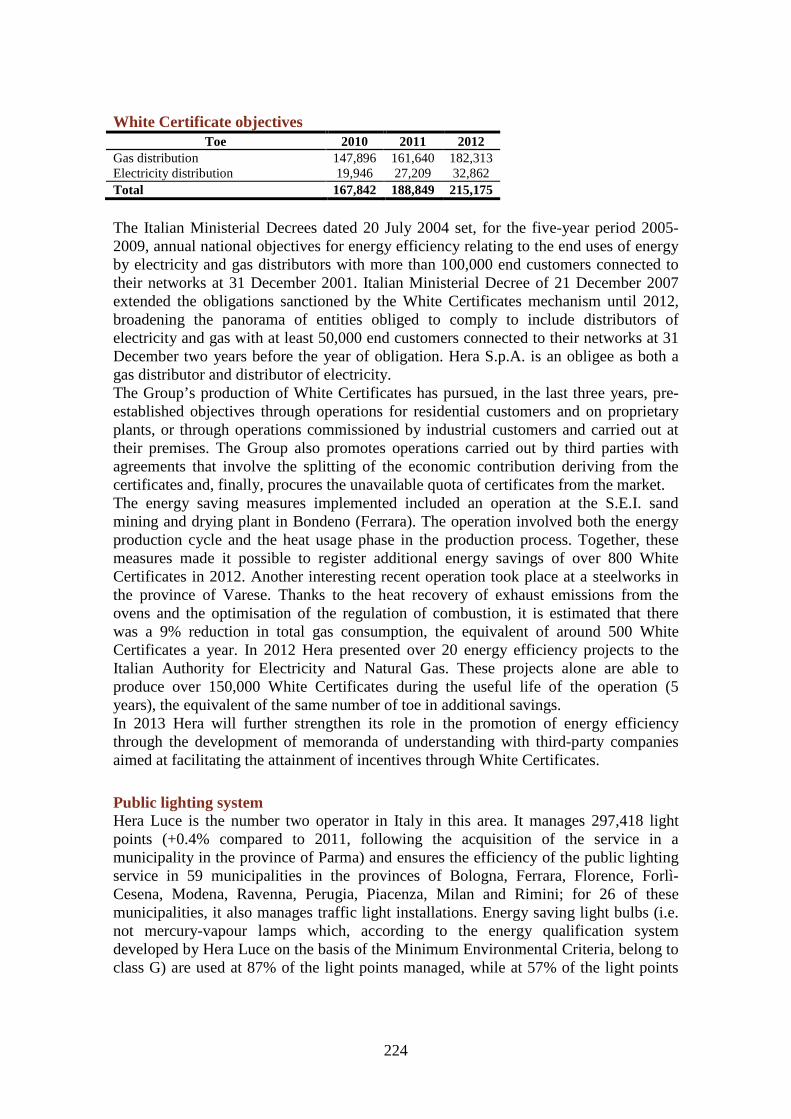
224
White Certificate objectives Toe 2010 2011 2012
Gas distribution 147,896 161,640 182,313 Electricity distribution 19,946 27,209 32,862 Total 167,842 188,849 215,175
The Italian Ministerial Decrees dated 20 July 2004 set, for the five-year period 2005-2009, annual national objectives for energy efficiency relating to the end uses of energy by electricity and gas distributors with more than 100,000 end customers connected to their networks at 31 December 2001. Italian Ministerial Decree of 21 December 2007 extended the obligations sanctioned by the White Certificates mechanism until 2012, broadening the panorama of entities obliged to comply to include distributors of electricity and gas with at least 50,000 end customers connected to their networks at 31 December two years before the year of obligation. Hera S.p.A. is an obligee as both a gas distributor and distributor of electricity. The Group’s production of White Certificates has pursued, in the last three years, pre-established objectives through operations for residential customers and on proprietary plants, or through operations commissioned by industrial customers and carried out at their premises. The Group also promotes operations carried out by third parties with agreements that involve the splitting of the economic contribution deriving from the certificates and, finally, procures the unavailable quota of certificates from the market. The energy saving measures implemented included an operation at the S.E.I. sand mining and drying plant in Bondeno (Ferrara). The operation involved both the energy production cycle and the heat usage phase in the production process. Together, these measures made it possible to register additional energy savings of over 800 White Certificates in 2012. Another interesting recent operation took place at a steelworks in the province of Varese. Thanks to the heat recovery of exhaust emissions from the ovens and the optimisation of the regulation of combustion, it is estimated that there was a 9% reduction in total gas consumption, the equivalent of around 500 White Certificates a year. In 2012 Hera presented over 20 energy efficiency projects to the Italian Authority for Electricity and Natural Gas. These projects alone are able to produce over 150,000 White Certificates during the useful life of the operation (5 years), the equivalent of the same number of toe in additional savings. In 2013 Hera will further strengthen its role in the promotion of energy efficiency through the development of memoranda of understanding with third-party companies aimed at facilitating the attainment of incentives through White Certificates.
Public lighting system Hera Luce is the number two operator in Italy in this area. It manages 297,418 light points (+0.4% compared to 2011, following the acquisition of the service in a municipality in the province of Parma) and ensures the efficiency of the public lighting service in 59 municipalities in the provinces of Bologna, Ferrara, Florence, Forlì-Cesena, Modena, Ravenna, Perugia, Piacenza, Milan and Rimini; for 26 of these municipalities, it also manages traffic light installations. Energy saving light bulbs (i.e. not mercury-vapour lamps which, according to the energy qualification system developed by Hera Luce on the basis of the Minimum Environmental Criteria, belong to class G) are used at 87% of the light points managed, while at 57% of the light points
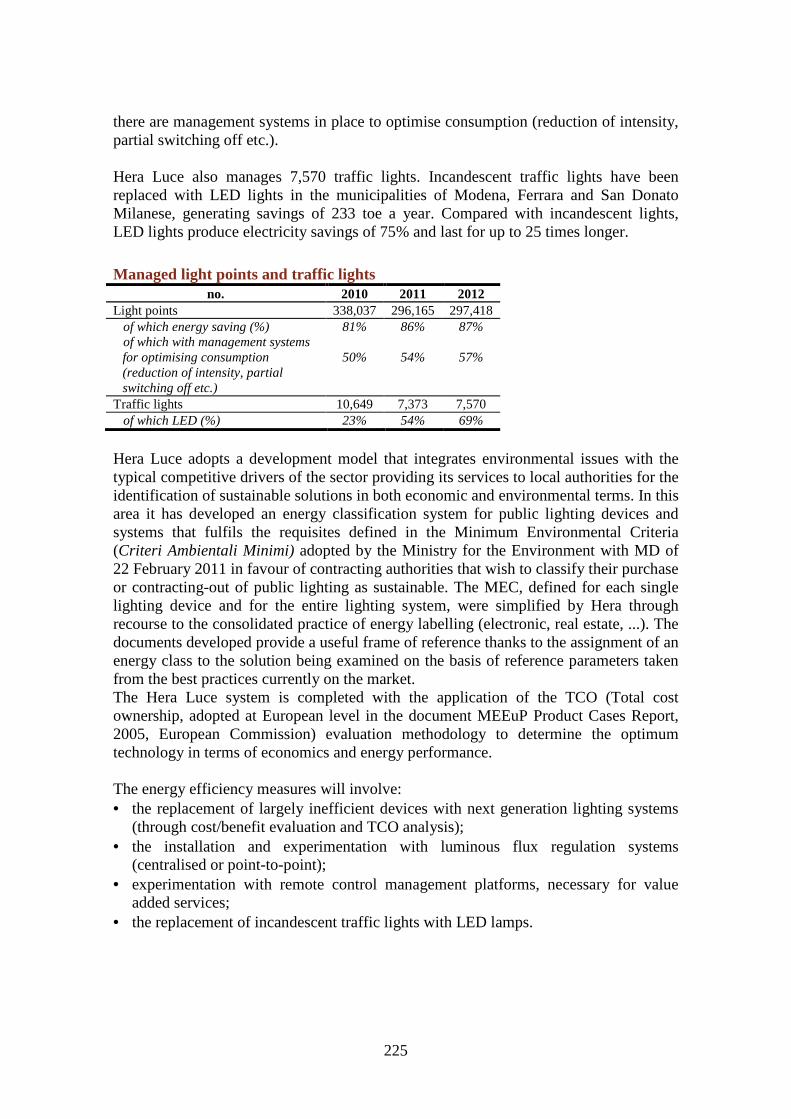
225
there are management systems in place to optimise consumption (reduction of intensity, partial switching off etc.). Hera Luce also manages 7,570 traffic lights. Incandescent traffic lights have been replaced with LED lights in the municipalities of Modena, Ferrara and San Donato Milanese, generating savings of 233 toe a year. Compared with incandescent lights, LED lights produce electricity savings of 75% and last for up to 25 times longer.
Managed light points and traffic lights no. 2010 2011 2012
Light points 338,037 296,165 297,418 of which energy saving (%) 81% 86% 87% of which with management systems
for optimising consumption (reduction of intensity, partial switching off etc.)
50%
54%
57%
Traffic lights 10,649 7,373 7,570 of which LED (%) 23% 54% 69%
Hera Luce adopts a development model that integrates environmental issues with the typical competitive drivers of the sector providing its services to local authorities for the identification of sustainable solutions in both economic and environmental terms. In this area it has developed an energy classification system for public lighting devices and systems that fulfils the requisites defined in the Minimum Environmental Criteria (Criteri Ambientali Minimi) adopted by the Ministry for the Environment with MD of 22 February 2011 in favour of contracting authorities that wish to classify their purchase or contracting-out of public lighting as sustainable. The MEC, defined for each single lighting device and for the entire lighting system, were simplified by Hera through recourse to the consolidated practice of energy labelling (electronic, real estate, ...). The documents developed provide a useful frame of reference thanks to the assignment of an energy class to the solution being examined on the basis of reference parameters taken from the best practices currently on the market. The Hera Luce system is completed with the application of the TCO (Total cost ownership, adopted at European level in the document MEEuP Product Cases Report, 2005, European Commission) evaluation methodology to determine the optimum technology in terms of economics and energy performance. The energy efficiency measures will involve: • the replacement of largely inefficient devices with next generation lighting systems
(through cost/benefit evaluation and TCO analysis); • the installation and experimentation with luminous flux regulation systems
(centralised or point-to-point); • experimentation with remote control management platforms, necessary for value
added services; • the replacement of incandescent traffic lights with LED lamps.

226
Production and distribution of water
The Hera Group’s water supply sources comprise underground water, surface water and, to a lesser extent, springs. In Romagna the distributed water is purchased wholesale from Romagna Acque – Società delle Fonti, which manages the water production plants and the adduction networks in the provinces of Forlì-Cesena, Ravenna and Rimini. The only exception is a group of small Apennine springs in the provinces of Forlì-Cesena and Rimini. The purification processes vary in complexity depending on the quality of the source water: processes include chemical and physical water drive, usually adopted for surface water, as well as simpler filtration and disinfection treatments (in some cases, only disinfection) applied to water coming from deep wells and springs that is already of a good quality when collected. The treatments carried out guarantee that the distributed product has suitable chemical physical and microbiological features for human consumption, in constant observance of the limits laid down by current legislation.
Water introduced onto the network (breakdown by source) 2010 2011 2012 thousands
of m3 % thousands
of m3 % thousands
of m3 %
Groundwater 135,806 39.8% 147,917 42.9% 150,030 43.2% Surface water 178,414 52.2% 171,487 49.8% 175,498 50.5% Springs and minor sources 27,259 8.0% 25,069 7.3% 21,892 6.3% Total 341,479 100.0% 344,473 100.0% 347,421 100.0% Figures include both the civil and industrial aqueducts (the latter being part of the Territorial Operating Structures of Forlì-Cesena, Imola-Faenza, Modena and Ravenna and comprising around 3% of the total). The data show a slight increase in the total volume of water introduced into the network (just under 1% compared to 2011). The most pronounced increases are in Ferrara (+5.7%) and Ravenna (+2.2%). Considering just the civil aqueduct, the water introduced onto the network in the civil aqueducts managed by the Group (excluding Marche Multiservizi) in 2012 was the same as in 2008: 305.4 million m3 in 2012 compared with 305.5 million m3 in 2008, a year in which there was a 1.5% reduction (on a like-for-like basis) compared with the previous year (equivalent to around 4 million m3).

227
Water introduced onto the network in the civil aqueduct (millions of cubic metres)
Data do not include Marche Multiservizi. The distribution network (including Marche Multiservizi) extends for over 31,000 kilometres and, where possible, is interconnected and linked in order to guarantee supply continuity also in cases of temporary service interruptions regarding one or more pipes.
Water network components % 2010 2011 2012
Plastic 53.5% 53.8% 54.2% Asbestos-cement 21.6% 21.3% 21.1% Steel 17.3% 17.1% 17.0% Cast iron 6.6% 6.6% 6.7% Other materials 1.1% 1.1% 1.0% Total 100.0% 100.0% 100.0%
The composition of the water network in terms of material components shows a slight decrease in asbestos cement because of the use of different materials in the networks subject to extraordinary maintenance and in the new networks.
What is meant by non-invoiced water The percentage of non-invoiced water compared to water introduced onto the network is related to physical or real losses (due to breakage of pipes or hydraulic equipment, etc.) or procedural or apparent losses (meter errors, errors in estimated presumed consumption as at 31 December, unrecorded internal consumption, illicit consumption). The latter losses result in water which is effectively delivered to the final customer but is not recorded or billed.
Until 2006, network losses were calculated as the difference between water introduced into the water system during the year and the water accounted for as supplied to customers during the same period: the latter figure was estimated at 31 December of each year based on customers’ historical consumption, as it is not possible to carry out a single reading of all meters as at 31 December. This estimate was then supplemented so
305.5304.1
299.9
304.0305.4
290
295
300
305
310
2008 2009 2010 2011 2012
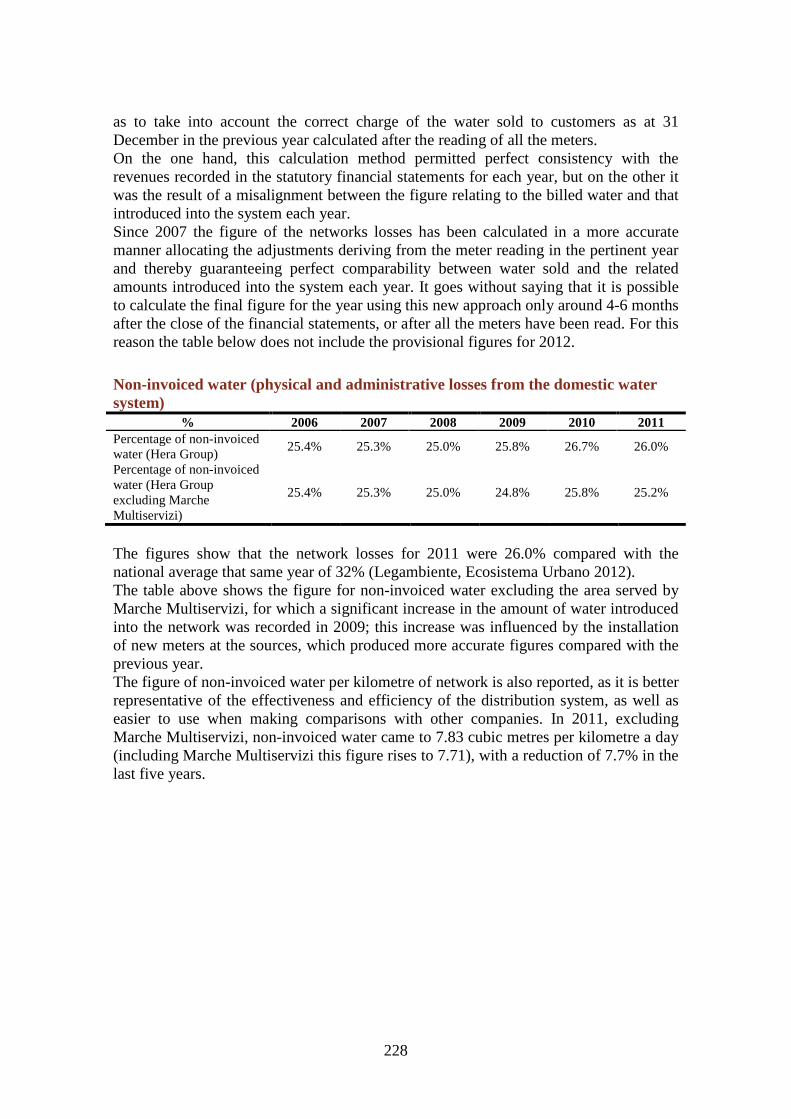
228
as to take into account the correct charge of the water sold to customers as at 31 December in the previous year calculated after the reading of all the meters. On the one hand, this calculation method permitted perfect consistency with the revenues recorded in the statutory financial statements for each year, but on the other it was the result of a misalignment between the figure relating to the billed water and that introduced into the system each year. Since 2007 the figure of the networks losses has been calculated in a more accurate manner allocating the adjustments deriving from the meter reading in the pertinent year and thereby guaranteeing perfect comparability between water sold and the related amounts introduced into the system each year. It goes without saying that it is possible to calculate the final figure for the year using this new approach only around 4-6 months after the close of the financial statements, or after all the meters have been read. For this reason the table below does not include the provisional figures for 2012.
Non-invoiced water (physical and administrative losses from the domestic water system)
% 2006 2007 2008 2009 2010 2011 Percentage of non-invoiced water (Hera Group)
25.4% 25.3% 25.0% 25.8% 26.7% 26.0%
Percentage of non-invoiced water (Hera Group excluding Marche Multiservizi)
25.4% 25.3% 25.0% 24.8% 25.8% 25.2%
The figures show that the network losses for 2011 were 26.0% compared with the national average that same year of 32% (Legambiente, Ecosistema Urbano 2012). The table above shows the figure for non-invoiced water excluding the area served by Marche Multiservizi, for which a significant increase in the amount of water introduced into the network was recorded in 2009; this increase was influenced by the installation of new meters at the sources, which produced more accurate figures compared with the previous year. The figure of non-invoiced water per kilometre of network is also reported, as it is better representative of the effectiveness and efficiency of the distribution system, as well as easier to use when making comparisons with other companies. In 2011, excluding Marche Multiservizi, non-invoiced water came to 7.83 cubic metres per kilometre a day (including Marche Multiservizi this figure rises to 7.71), with a reduction of 7.7% in the last five years.

229
Non-invoiced water per kilometre of network managed (m3/km/day)
Data do not include Marche Multiservizi. In 2011 an applied research project was launched with the aim of fine-tuning the water leak measurement and appraisal systems in the water service networks managed by Hera and testing the application of the methodologies for the evaluation and control of water leaks proposed by the International Water Association (IWA). This activity is carried out with the support of the Interdepartmental Centre for Industrial Building Research and Constructions (Fluid Dynamics for Energy and Environmental Applications department) of the University of Bologna. The IWA methodology for estimating the concise leakage indicators is currently being applied. More specifically, three districts of Bologna (north, south and west districts) were chosen for the first application of the methodology. If the conclusions are positive, the possibility of applying this methodology, at least for the principal water systems managed by the Group, will be evaluated.
Non-invoiced water in the main Italian utility companies This table compares the main Italian utility companies in terms of non-invoiced water by kilometre of network in 2011. The longer the network managed, the more difficult it is to control physical losses. Therefore, to compare different companies, the network length should be taken into consideration. Thanks to its contained losses and the vast network it manages, Hera came first among the ten companies in the study (7.83 cubic metres per kilometre per day).
8.488.33
8.007.87 7.99
7.83
7,0
7,5
8,0
8,5
9,0
2006 2007 2008 2009 2010 2011
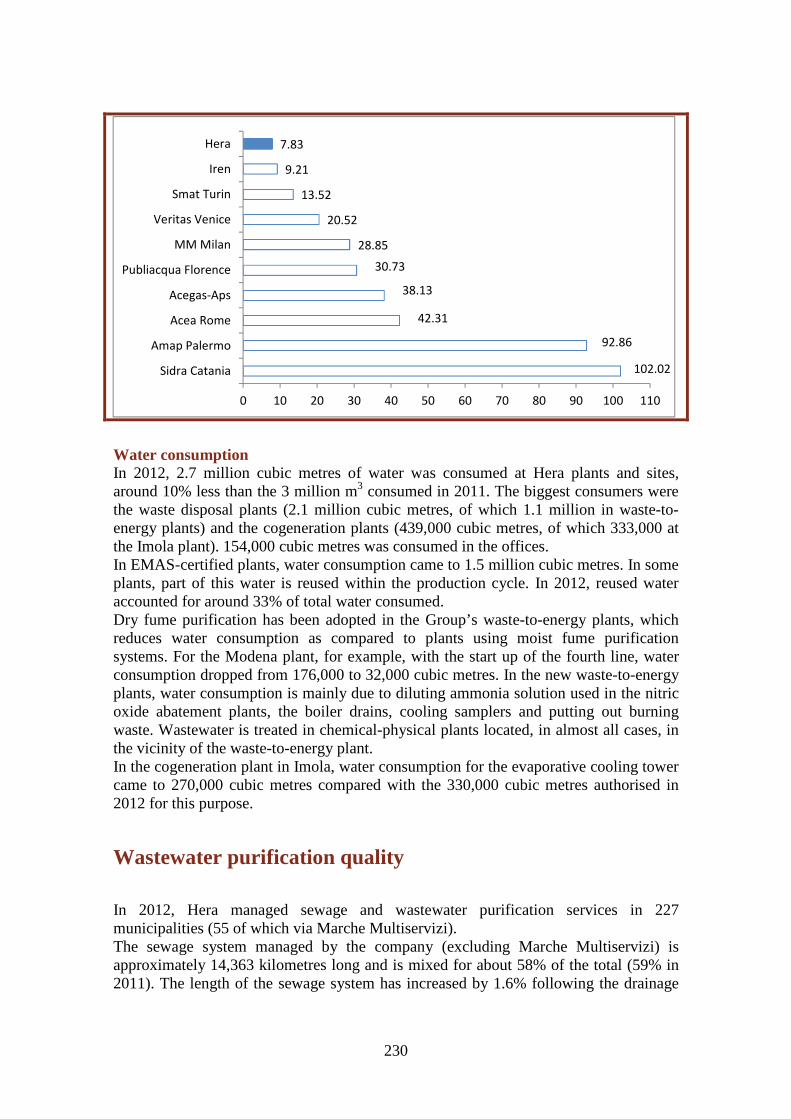
230
Water consumption In 2012, 2.7 million cubic metres of water was consumed at Hera plants and sites, around 10% less than the 3 million m3 consumed in 2011. The biggest consumers were the waste disposal plants (2.1 million cubic metres, of which 1.1 million in waste-to-energy plants) and the cogeneration plants (439,000 cubic metres, of which 333,000 at the Imola plant). 154,000 cubic metres was consumed in the offices. In EMAS-certified plants, water consumption came to 1.5 million cubic metres. In some plants, part of this water is reused within the production cycle. In 2012, reused water accounted for around 33% of total water consumed. Dry fume purification has been adopted in the Group’s waste-to-energy plants, which reduces water consumption as compared to plants using moist fume purification systems. For the Modena plant, for example, with the start up of the fourth line, water consumption dropped from 176,000 to 32,000 cubic metres. In the new waste-to-energy plants, water consumption is mainly due to diluting ammonia solution used in the nitric oxide abatement plants, the boiler drains, cooling samplers and putting out burning waste. Wastewater is treated in chemical-physical plants located, in almost all cases, in the vicinity of the waste-to-energy plant. In the cogeneration plant in Imola, water consumption for the evaporative cooling tower came to 270,000 cubic metres compared with the 330,000 cubic metres authorised in 2012 for this purpose.
Wastewater purification quality
In 2012, Hera managed sewage and wastewater purification services in 227 municipalities (55 of which via Marche Multiservizi). The sewage system managed by the company (excluding Marche Multiservizi) is approximately 14,363 kilometres long and is mixed for about 58% of the total (59% in 2011). The length of the sewage system has increased by 1.6% following the drainage
102.02
92.86
42.31
38.13
30.73
28.85
20.52
13.52
9.21
7.83
0 10 20 30 40 50 60 70 80 90 100 110
Sidra Catania
Amap Palermo
Acea Rome
Acegas-Aps
Publiacqua Florence
MM Milan
Veritas Venice
Smat Turin
Iren
Hera

231
operations carried out (in 2012, 27,000 inhabitant equivalents were connected to the sewage system). It is interesting to note that over 80% of the extensions and reconstructions carried out in 2012 were separate in nature. Once again excluding Marche Multiservizi, in 2012 the sewage system for all areas covered 95% of the requirements in the territories (expressed as inhabitant equivalents, meaning the sum of resident inhabitants, production users transformed into inhabitant equivalents and presence due to tourism). This value rises to 99% if we only consider areas with a nominal capacity of over 2,000 inhabitant equivalents. Wastewater purification is carried out through 852 wastewater treatment plants, 15 of which have a capacity of over 100,000 inhabitant equivalents and 37 of which have a capacity of between 10,000 and 100,000 inhabitant equivalents. Excluding Marche Multiservizi, the purification service covers 94% of inhabitant equivalents in the area. This value rises to 99% if we only consider areas with a nominal capacity of over 2,000 inhabitant equivalents. These coverage values are decidedly higher than the national values: according to the 2009 Utilitatis Blue Book Report, in 2007 85% of Italians were served by the sewage network and 70% by a purification plant. The Hera Group treated a total of approximately 288 million cubic metres of wastewater in 2012 compared to 293 million in 2011, a decrease of 2%.
Compliance of treated water with legally established limits (optimal values <100%)
The indicator relates to the plants with more than 10,000 inhabitant equivalents (the volumes treated in these plants equate to 75% of the total wastewater treated) and is calculated on the basis of the ratio between the concentration gauged for BOD5, COD, TSS, ammonia nitrogen, phosphorus and total nitrogen and the related maximum concentrations permitted by Legislative Decree no. 152/2006 as amended. Bologna’s plant limits are different from the regulation: ammonia nitrogen 25 mg/l; BOD5 40 mg/l; COD 160 mg/l; TSS 80 mg/l. For the Imola plant, where there is a final lagoon, the TSS limit is 150 mg/l.
42%
26%31%
25%
44%
37%
45%
38%
56%
27%30%
24%
40% 40%44%
41%
0%
20%
40%
60%
80%
100%
BolognaArea
FerraraArea
Forlì-CesenaArea
Imola-FaenzaArea
ModenaArea
RavennaArea
RiminiArea
Weightedaverage
20112012
Legal limit = 100%
232
The efficiency in removing pollutants in compliance with the legal limits, as expressed by the indicator in the graphic, is related to the purification capacity of the plant and the technologies adopted. The graphic shows that there was a significant degree of continuity with the values of the previous year with improvements in the areas of Forlì-Cesena, Modena and Rimini and downturns in Bologna and Ravenna, where the values nonetheless remain below the legal limits. These variations are compatible with the variability of the incoming quantities, the operating conditions and the structural condition of the plants. In 2012 a number of events influenced the performances of some plants including the maintenance work on the membrane system at the Calderara treatment plant (Bologna), the revamping work on the Lugo treatment plant (Ravenna), which reduced its functionality by 40%, and the adjustment work on the Marina di Ravenna treatment plant.
Renovation of Riccione treatment plant The Riccione treatment plant was renovated in order to guarantee respect for the new nitrogen emission limits. The plant was equipped with a modern system for treating liquid waste arriving from Imhof tanks and storm drains and makes it possible to recover sand thanks to a careful washing and classification process. The new plant was also designed to reduce noise pollution in the local urban area. The renovation also involved the sludge dehydration system, which now makes it possible to reduce the amount produced. The public sewage network in Cantelli in the Municipality of Verucchio was also renovated. Around 800 metres of sewage pipes leading to the plant were constructed to complete the project.
2012 saw the completion of the adjustment works at 6 of the 9 plants where they were scheduled: Argenta (Ferrara), Casola Canina – Imola (Bologna), Forlì, San Giorgio di Piano (Bologna), Lugo (Ravenna) and Riccione (Rimini). Work began at the other 3 plants (San Martino in Gattara (Ravenna), Granarolo (Bologna) and San Matteo della Decima (Bologna)) and will be completed in 2013, when the work to bring the Molinella treatment plant (Bologna) into line with regulations will also be completed. These operations, together with the scheduled drainage operations, will bring another 8 areas into line with the regulations for a total of 220,000 inhabitant equivalents. 2013 will also see the start of adjustment work on the treatment plants in Cesenatico (Forlì-Cesena) and Cattolica (Rimini) and improvement work on the plant in Rimini Santa Giustina. Below are details on some of the environmental benefits attained following work carried out in 2011-2012.
• At the Bologna treatment plant (900,000 IE) the works regarding the denitrification section, aimed mainly at improving the removal of nitrogen, were concluded at the end of 2011. Comparing the performances of the plant before and after the operation (July-September 2012 and 2011), the quality of outgoing water has improved by 68% in terms of ammonia nitrogen, 59% in terms of BOD5, 40% as regards total phosphorus and 21% for total nitrogen. • The adjustment works on the Bondeno (Ferrara) treatment plant (10,000 IE) concluded at the end of 2011. Comparing the performances of the plant before and

233
after the operation (October-December 2012 and 2011), the quality of outgoing water has improved by 16% in terms of COD, 41% in terms of BOD5, 14% as regards TSS and 12% for total phosphorus. Electricity consumption fell by 46%. • Comparing the performances of the Argenta (Ferrara) plant (18,000 IE) before and after the operation (October-December 2012 and 2011), the quality of outgoing water has improved by 27% in terms of TSS, 35% in terms of total nitrogen and 32% for total phosphorus. Electricity consumption fell by 41%. • At the Forlì plant (140,000 IE) the quality of outgoing water has improved by 34% in terms of TSS, 11% in terms of total nitrogen and 25% for total phosphorus. Electricity consumption fell by 20%. • At the Lugo (Ravenna) plant (270,000 IE) the quality of outgoing water has improved with regard to all of the pollutants considered with percentage improvements ranging from 14% for COD to 89% for ammonia nitrogen. • At the San Giorgio di Piano plant in Bologna (9,950 IE) the quality of outgoing water has improved by 56% in terms of COD, 62% as regards BOD5, 77% in terms of TSS and 88% for ammonia nitrogen.
Numerous plant improvement operations are scheduled for 2013 including:
• the installation of an automation system for the management of the nitrogen cycle at the Lugo treatment plant (Ravenna);
• the replacement of the ventilation system at the Lido di Classe treatment plant (Ravenna),
• the revamping of the Bagnacavallo treatment plant (Ravenna) and the Marina di Ravenna treatment plant.
Other important works, some of which will be started and others of which will be completed, include: the completion of the anaerobic digesters and the replacement of the oxygen production plant at the Bologna treatment plant; work for the reuse of water at the Cesena plant; the start of the transformation of Rimini Marecchiese into a balancing tank and drainage in Santa Giustina; extension of the Ozzano Ponte Rizzoli (Bologna) treatment plant and the decommissioning of the Via dell’Ambiente plant; discharge and purification in the Sabbioni district of the municipality of Loiano (Bologna); extension of the Malalbergo (Bologna) purification plant; development of a purification plant in Cà de Fabbri in the municipality of Castello di Serravalle (Bologna). Other adjustment/improvement works are scheduled to take place in the Modena, Vignola (Modena), and Riccione (Rimini) wastewater plants.
Average annual concentrations at the main plants (2012)
mg/l Body of water receiving the purified wastewater
COD (limit:
125 mg/l)
BOD5 (limit:
25 mg/l)
TSS (limit: 35 mg/l)
Ammonia nitrogen (limit: 15
mg/l)
Volumes treated
(thousands of m3)
Bologna IDAR Navile canal 40.8 13.4 13.6 10.8 39,427
Anzola (Bologna) Scolo Sanguinettola Bassa or Scolo Lavinello
24.1 10.3 8.8 4.8 1,207
Calderara (Bologna) Scolo Dosolo 26.0 9.7 9.7 0.8 1,027 Ozzano (Bologna) Rio Marzano 26.5 10.3 10.8 1.4 515 S. S. Giovanni (Bologna) River Reno and San Giovanni Canal 32.1 12.5 10.8 4.4 177 Ferrara Gramicia Po di Volano 38.3 11.9 14.9 1.9 17,555 Cesena Rio Granarolo 17.0 5.0 5.4 0.7 5,937 Cesenatico (Forlì-Cesena) Scolo Madonnina 38.5 5.7 10.7 1.3 3,851 Forlì Scolo Cerchia 23.5 5.2 7.0 1.9 12,555 Savignano (Forlì-Cesena) River Rubicone 30.1 5.0 8.5 4.8 5,795 Faenza Formellino River Lamone 33.3 5.5 8.4 1.8 4,353
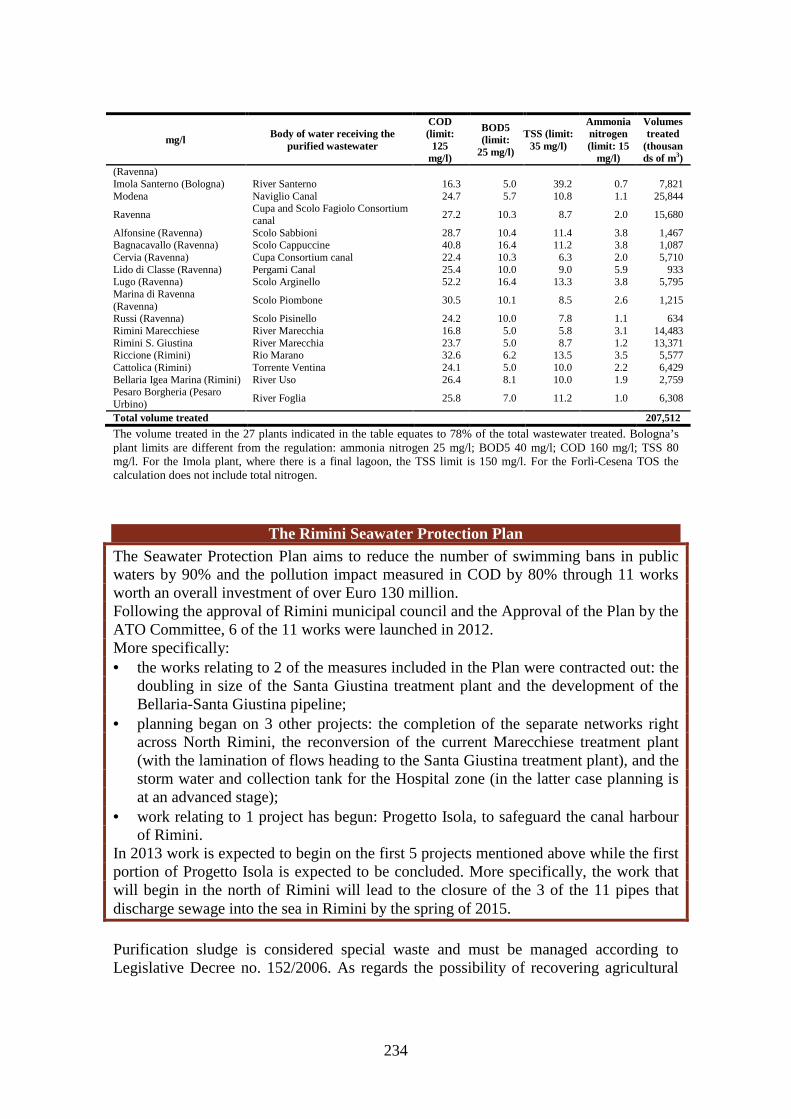
234
mg/l Body of water receiving the purified wastewater
COD (limit:
125 mg/l)
BOD5 (limit:
25 mg/l)
TSS (limit: 35 mg/l)
Ammonia nitrogen (limit: 15
mg/l)
Volumes treated
(thousands of m3)
(Ravenna) Imola Santerno (Bologna) River Santerno 16.3 5.0 39.2 0.7 7,821 Modena Naviglio Canal 24.7 5.7 10.8 1.1 25,844
Ravenna Cupa and Scolo Fagiolo Consortium canal
27.2 10.3 8.7 2.0 15,680
Alfonsine (Ravenna) Scolo Sabbioni 28.7 10.4 11.4 3.8 1,467 Bagnacavallo (Ravenna) Scolo Cappuccine 40.8 16.4 11.2 3.8 1,087 Cervia (Ravenna) Cupa Consortium canal 22.4 10.3 6.3 2.0 5,710 Lido di Classe (Ravenna) Pergami Canal 25.4 10.0 9.0 5.9 933 Lugo (Ravenna) Scolo Arginello 52.2 16.4 13.3 3.8 5,795 Marina di Ravenna (Ravenna)
Scolo Piombone 30.5 10.1 8.5 2.6 1,215
Russi (Ravenna) Scolo Pisinello 24.2 10.0 7.8 1.1 634 Rimini Marecchiese River Marecchia 16.8 5.0 5.8 3.1 14,483 Rimini S. Giustina River Marecchia 23.7 5.0 8.7 1.2 13,371 Riccione (Rimini) Rio Marano 32.6 6.2 13.5 3.5 5,577 Cattolica (Rimini) Torrente Ventina 24.1 5.0 10.0 2.2 6,429 Bellaria Igea Marina (Rimini) River Uso 26.4 8.1 10.0 1.9 2,759 Pesaro Borgheria (Pesaro Urbino)
River Foglia 25.8 7.0 11.2 1.0 6,308
Total volume treated 207,512
The volume treated in the 27 plants indicated in the table equates to 78% of the total wastewater treated. Bologna’s plant limits are different from the regulation: ammonia nitrogen 25 mg/l; BOD5 40 mg/l; COD 160 mg/l; TSS 80 mg/l. For the Imola plant, where there is a final lagoon, the TSS limit is 150 mg/l. For the Forlì-Cesena TOS the calculation does not include total nitrogen.
The Rimini Seawater Protection Plan The Seawater Protection Plan aims to reduce the number of swimming bans in public waters by 90% and the pollution impact measured in COD by 80% through 11 works worth an overall investment of over Euro 130 million. Following the approval of Rimini municipal council and the Approval of the Plan by the ATO Committee, 6 of the 11 works were launched in 2012. More specifically: • the works relating to 2 of the measures included in the Plan were contracted out: the
doubling in size of the Santa Giustina treatment plant and the development of the Bellaria-Santa Giustina pipeline;
• planning began on 3 other projects: the completion of the separate networks right across North Rimini, the reconversion of the current Marecchiese treatment plant (with the lamination of flows heading to the Santa Giustina treatment plant), and the storm water and collection tank for the Hospital zone (in the latter case planning is at an advanced stage);
• work relating to 1 project has begun: Progetto Isola, to safeguard the canal harbour of Rimini.
In 2013 work is expected to begin on the first 5 projects mentioned above while the first portion of Progetto Isola is expected to be concluded. More specifically, the work that will begin in the north of Rimini will lead to the closure of the 3 of the 11 pipes that discharge sewage into the sea in Rimini by the spring of 2015.
Purification sludge is considered special waste and must be managed according to Legislative Decree no. 152/2006. As regards the possibility of recovering agricultural
235
sludge, the reference regulation is Legislative Decree no. 99/1992; specific regulations for the Emilia-Romagna Region are contained in resolution no. 2773/2004. In 2012, the purification process produced about 37 kg of sludge per inhabitant equivalent served (this figure refers to the quantity of sludge disposed with an average dryness grade on the order of 18-25% and relates to all areas served). The sludge reused directly in agriculture was almost 2% of the total, in line with 2011, with characteristics and management methods that complied with relevant national and regional legislation. The remaining sludge produced was managed through dedicated incineration (approx. 32,600 metric tons), transfer to landfills (approx. 54,400 metric tons) and indirect agronomic reuse, following composting (64,000 metric tons).
Constructed wetlands Hera manages fifteen constructed wetlands plants of small or medium-small capacity in the provinces of Bologna, Ferrara, Florence, Forlì-Cesena, Rimini and Ravenna: some are secondary biological treatment plants downstream of primary sedimentation, others are third party treatments used for final refinement. The constructed wetlands process is a natural process for the treatment of polluted waters based on the exploitation of the soil-vegetation system as a natural filter for the purification of water, and is made up of a system of biological ponds and of macrophytic vegetation. This kind of treatment also contributes to the reclamation of borderline areas, creating natural environments and landscapes that are pleasing to the eye, and often chosen as refuges for various species of bird, amphibian and reptile. In these areas, it is therefore also possible to organise educational tours to observe specific animal and vegetable species typical of wetlands.
The treatment plant that uses plants The Molino di Sotto constructed wetlands plant in Portico di Romagna, in the province of Forlì-Cesena, has been operational since April 2012. This plant is one-of-a-kind in terms of its size and reduced environmental impact, and is able to treat the sewers of the entire inhabited area thanks to its plants. It is a kind of large gravel filter in which suitable plants for treating the sewage water that previously drained into River Montone have been planted, thus ensuring that the river’s water is clean. The constructed wetlands plant, which represented an investment of Euro 410,000, was entirely developed by Hera and has an overall surface area of 2,175 m2.
Atmospheric emissions
Atmospheric emissions generated by waste-to-energy plants Every Hera Group waste-to-energy plant is equipped with fume purification and process and emission control systems, designed and produced in order to attain: • elevated fume purification performances in all process conditions; • elevated management versatility; • elevated reliability of emission control systems. In order to meet these goals, new plants and plants undergoing renovation are equipped with the following systems:

236
• double reaction and filtration system to lower the concentrations of dust, hydrochloric acid, hydrofluoric acid, sulphurous dioxide, heavy metals, dioxins and furans and aromatic polycyclic hydrocarbons (the Modena plant has a bag filter and an electrostatic precipitator);
• double reaction system (catalytic and non-catalytic) to reduce concentrations of nitric oxides;
• double fume monitoring system for process control (SMP): the two systems measure the concentrations of the main pollutants emanating from the oven and downstream of the first reaction and filtration phase, on the basis of which a calculation is made of the volume of reactants required to ensure purification levels that guarantee respect for legal emission limits and which are, on average, 80-90% inferior to these;
• continuous double monitoring system for chimney emissions: one as a reserve for the other in order to guarantee the continuity of the analysis of concentrations in atmospheric emissions.
The possibility of using double purification and monitoring systems in series (in parallel as regards chimney monitoring) allows the above objectives to be successfully pursued. In addition to the aforementioned activities, as regards the monitoring of emissions and environmental impact, the following operations are carried out on an annual basis: • timely controls of the chimneys, at a frequency fixed by the Integrated
Environmental Authorisation, for those parameters which cannot be continuously monitored, resorting to certified workshops;
• controls on soil fallout of the pollutants: through external monitoring programmes in collaboration with the University and research agencies, deposition analyses are performed on soil, ground and vegetation etc., in order to ascertain that the emissions, in addition to being within the legally established limits, does not have any significant impact on the surrounding environment.
Environmental supervision and air quality monitoring projects According to the Authorisations regarding the waste-to-energy plants in Ferrara, Modena and Forlì, Hera must carry out studies on the impact that its plants have on the surrounding environment. In the industrial area in which the Forlì plant is located, Hera has installed a station for monitoring air quality that is managed by Arpa Forlì. Operational since 2009, it provides a continuous stream of data that are validated by Arpa and published on their website. Periodical campaigns are also carried out at the station to search for micropollutants and metals in the particulate matter. Until now, the results have shown that the air quality in the area surrounding the plant is similar to that at the urban traffic stations. For a decade now environmental monitoring tests have been conducted at the Modena plant on various matrices: air and soil quality, biomonitoring, total depositions. Since 2013 the monitoring network has been managed by Arpa territoriale to whom all of the analyses established by the waste-to-energy plant IEA are therefore entrusted. In addition, in accordance with the EIA, a health supervision study has been ongoing since 2003 which seeks to evaluate the health risk regarding the population that lives in the proximity of the incinerator and the working population at industrial sites close to the incinerator. Two reproduction indicators are analysed, teratogenic risk, i.e. congenital malformations, and spontaneous abortion risk. The ongoing study does not appear to
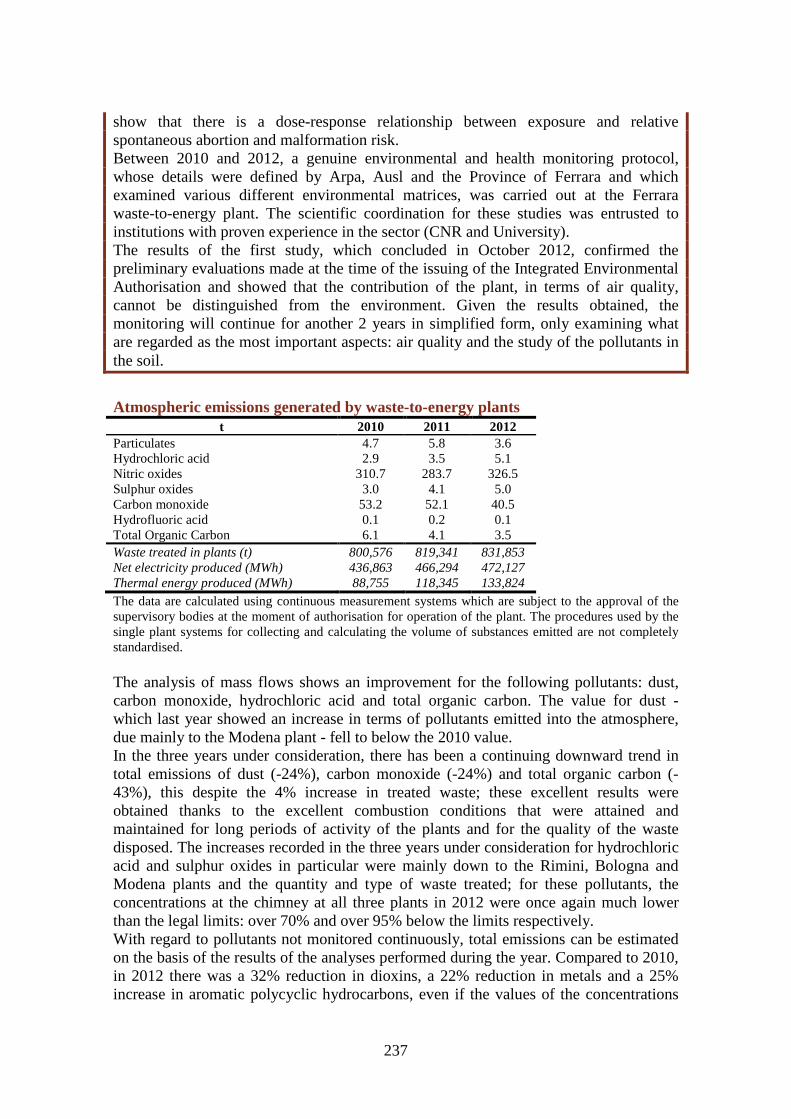
237
show that there is a dose-response relationship between exposure and relative spontaneous abortion and malformation risk. Between 2010 and 2012, a genuine environmental and health monitoring protocol, whose details were defined by Arpa, Ausl and the Province of Ferrara and which examined various different environmental matrices, was carried out at the Ferrara waste-to-energy plant. The scientific coordination for these studies was entrusted to institutions with proven experience in the sector (CNR and University). The results of the first study, which concluded in October 2012, confirmed the preliminary evaluations made at the time of the issuing of the Integrated Environmental Authorisation and showed that the contribution of the plant, in terms of air quality, cannot be distinguished from the environment. Given the results obtained, the monitoring will continue for another 2 years in simplified form, only examining what are regarded as the most important aspects: air quality and the study of the pollutants in the soil.
Atmospheric emissions generated by waste-to-energy plants t 2010 2011 2012
Particulates 4.7 5.8 3.6 Hydrochloric acid 2.9 3.5 5.1 Nitric oxides 310.7 283.7 326.5 Sulphur oxides 3.0 4.1 5.0 Carbon monoxide 53.2 52.1 40.5 Hydrofluoric acid 0.1 0.2 0.1 Total Organic Carbon 6.1 4.1 3.5 Waste treated in plants (t) 800,576 819,341 831,853 Net electricity produced (MWh) 436,863 466,294 472,127 Thermal energy produced (MWh) 88,755 118,345 133,824 The data are calculated using continuous measurement systems which are subject to the approval of the supervisory bodies at the moment of authorisation for operation of the plant. The procedures used by the single plant systems for collecting and calculating the volume of substances emitted are not completely standardised. The analysis of mass flows shows an improvement for the following pollutants: dust, carbon monoxide, hydrochloric acid and total organic carbon. The value for dust - which last year showed an increase in terms of pollutants emitted into the atmosphere, due mainly to the Modena plant - fell to below the 2010 value. In the three years under consideration, there has been a continuing downward trend in total emissions of dust (-24%), carbon monoxide (-24%) and total organic carbon (-43%), this despite the 4% increase in treated waste; these excellent results were obtained thanks to the excellent combustion conditions that were attained and maintained for long periods of activity of the plants and for the quality of the waste disposed. The increases recorded in the three years under consideration for hydrochloric acid and sulphur oxides in particular were mainly down to the Rimini, Bologna and Modena plants and the quantity and type of waste treated; for these pollutants, the concentrations at the chimney at all three plants in 2012 were once again much lower than the legal limits: over 70% and over 95% below the limits respectively. With regard to pollutants not monitored continuously, total emissions can be estimated on the basis of the results of the analyses performed during the year. Compared to 2010, in 2012 there was a 32% reduction in dioxins, a 22% reduction in metals and a 25% increase in aromatic polycyclic hydrocarbons, even if the values of the concentrations
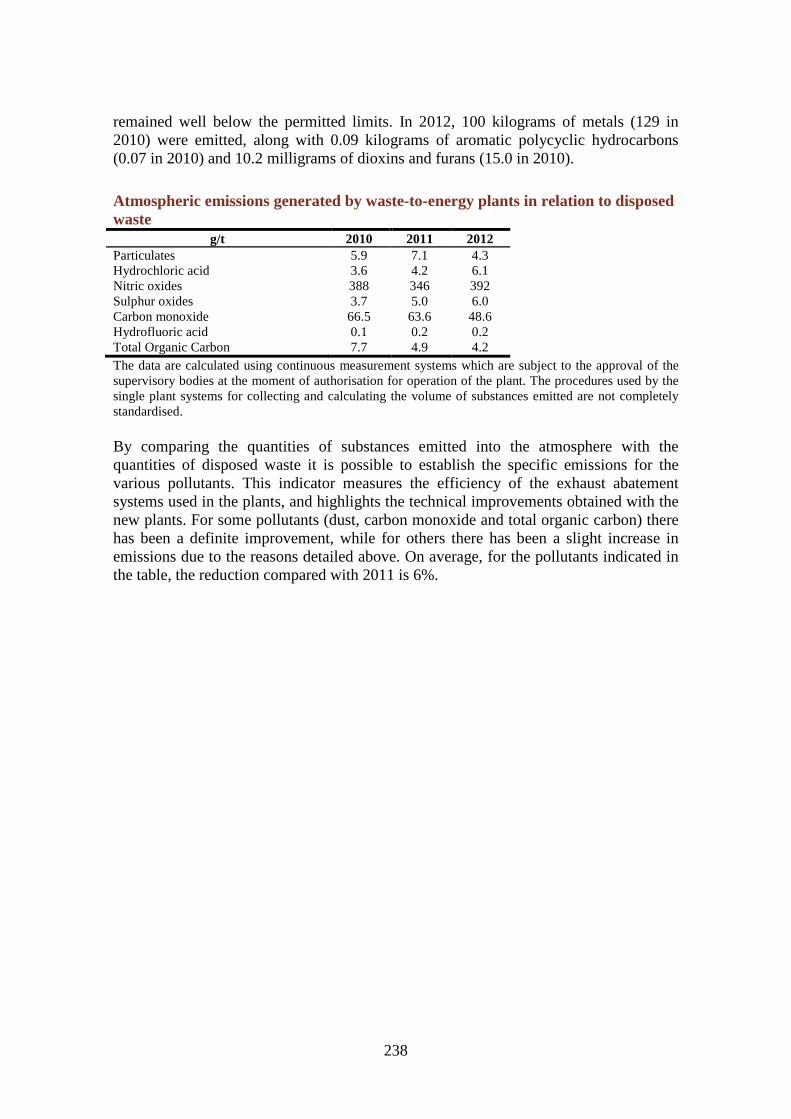
238
remained well below the permitted limits. In 2012, 100 kilograms of metals (129 in 2010) were emitted, along with 0.09 kilograms of aromatic polycyclic hydrocarbons (0.07 in 2010) and 10.2 milligrams of dioxins and furans (15.0 in 2010).
Atmospheric emissions generated by waste-to-energy plants in relation to disposed waste
g/t 2010 2011 2012 Particulates 5.9 7.1 4.3 Hydrochloric acid 3.6 4.2 6.1 Nitric oxides 388 346 392 Sulphur oxides 3.7 5.0 6.0 Carbon monoxide 66.5 63.6 48.6 Hydrofluoric acid 0.1 0.2 0.2 Total Organic Carbon 7.7 4.9 4.2 The data are calculated using continuous measurement systems which are subject to the approval of the supervisory bodies at the moment of authorisation for operation of the plant. The procedures used by the single plant systems for collecting and calculating the volume of substances emitted are not completely standardised. By comparing the quantities of substances emitted into the atmosphere with the quantities of disposed waste it is possible to establish the specific emissions for the various pollutants. This indicator measures the efficiency of the exhaust abatement systems used in the plants, and highlights the technical improvements obtained with the new plants. For some pollutants (dust, carbon monoxide and total organic carbon) there has been a definite improvement, while for others there has been a slight increase in emissions due to the reasons detailed above. On average, for the pollutants indicated in the table, the reduction compared with 2011 is 6%.
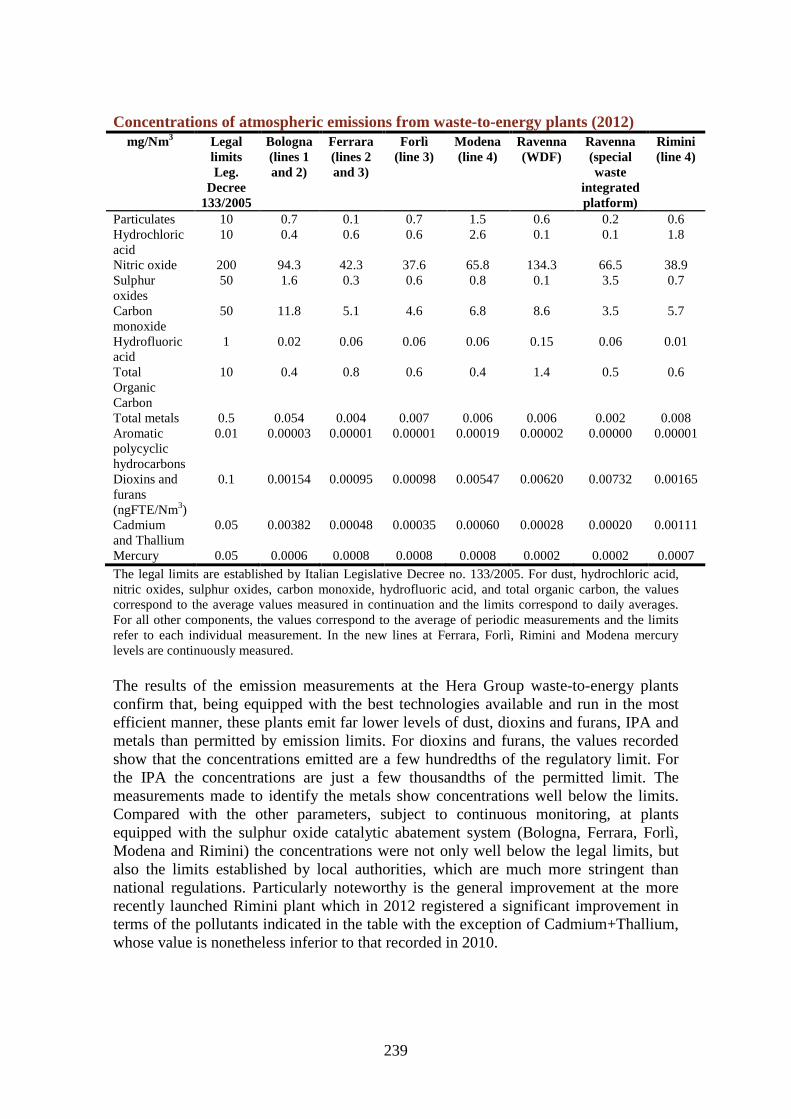
239
Concentrations of atmospheric emissions from waste-to-energy plants (2012) mg/Nm3 Legal
limits Leg.
Decree 133/2005
Bologna (lines 1 and 2)
Ferrara (lines 2 and 3)
Forlì (line 3)
Modena (line 4)
Ravenna (WDF)
Ravenna (special waste
integrated platform)
Rimini (line 4)
Particulates 10 0.7 0.1 0.7 1.5 0.6 0.2 0.6 Hydrochloric acid
10 0.4 0.6 0.6 2.6 0.1 0.1 1.8
Nitric oxide 200 94.3 42.3 37.6 65.8 134.3 66.5 38.9 Sulphur oxides
50 1.6 0.3 0.6 0.8 0.1 3.5 0.7
Carbon monoxide
50 11.8 5.1 4.6 6.8 8.6 3.5 5.7
Hydrofluoric acid
1 0.02 0.06 0.06 0.06 0.15 0.06 0.01
Total Organic Carbon
10 0.4 0.8 0.6 0.4 1.4 0.5 0.6
Total metals 0.5 0.054 0.004 0.007 0.006 0.006 0.002 0.008 Aromatic polycyclic hydrocarbons
0.01 0.00003 0.00001 0.00001 0.00019 0.00002 0.00000 0.00001
Dioxins and furans (ngFTE/Nm3)
0.1 0.00154 0.00095 0.00098 0.00547 0.00620 0.00732 0.00165
Cadmium and Thallium
0.05 0.00382 0.00048 0.00035 0.00060 0.00028 0.00020 0.00111
Mercury 0.05 0.0006 0.0008 0.0008 0.0008 0.0002 0.0002 0.0007 The legal limits are established by Italian Legislative Decree no. 133/2005. For dust, hydrochloric acid, nitric oxides, sulphur oxides, carbon monoxide, hydrofluoric acid, and total organic carbon, the values correspond to the average values measured in continuation and the limits correspond to daily averages. For all other components, the values correspond to the average of periodic measurements and the limits refer to each individual measurement. In the new lines at Ferrara, Forlì, Rimini and Modena mercury levels are continuously measured. The results of the emission measurements at the Hera Group waste-to-energy plants confirm that, being equipped with the best technologies available and run in the most efficient manner, these plants emit far lower levels of dust, dioxins and furans, IPA and metals than permitted by emission limits. For dioxins and furans, the values recorded show that the concentrations emitted are a few hundredths of the regulatory limit. For the IPA the concentrations are just a few thousandths of the permitted limit. The measurements made to identify the metals show concentrations well below the limits. Compared with the other parameters, subject to continuous monitoring, at plants equipped with the sulphur oxide catalytic abatement system (Bologna, Ferrara, Forlì, Modena and Rimini) the concentrations were not only well below the legal limits, but also the limits established by local authorities, which are much more stringent than national regulations. Particularly noteworthy is the general improvement at the more recently launched Rimini plant which in 2012 registered a significant improvement in terms of the pollutants indicated in the table with the exception of Cadmium+Thallium, whose value is nonetheless inferior to that recorded in 2010.
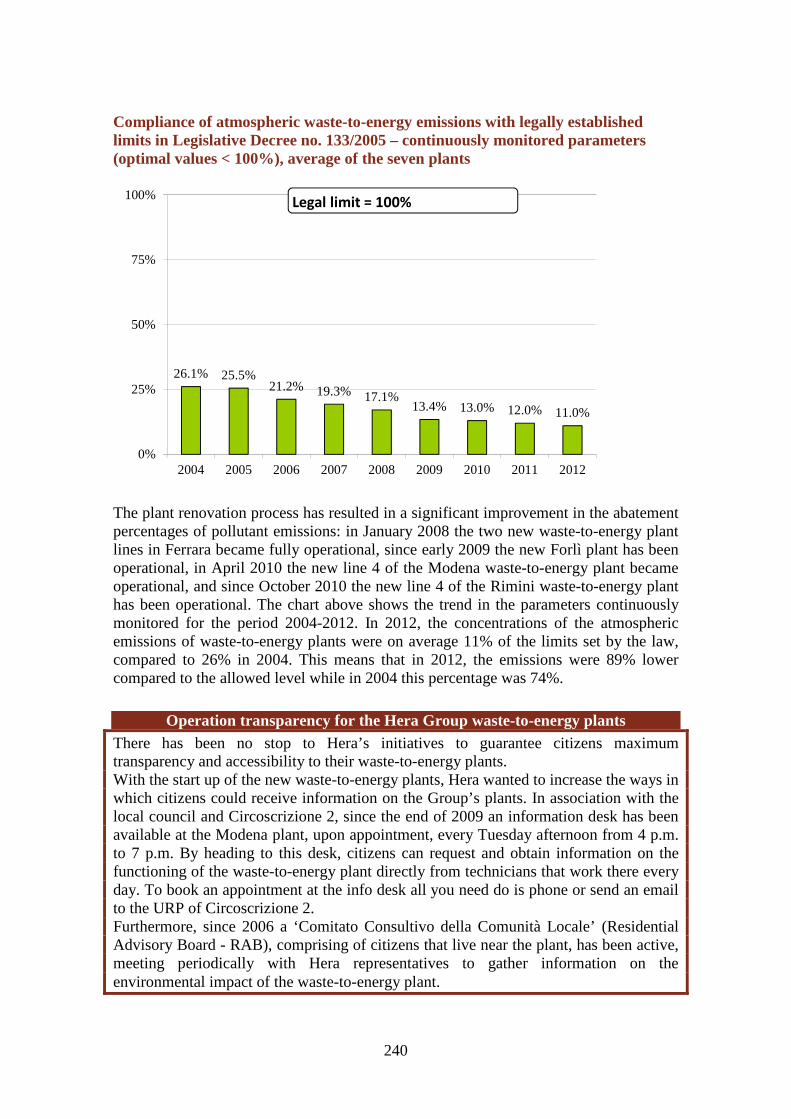
240
Compliance of atmospheric waste-to-energy emissions with legally established limits in Legislative Decree no. 133/2005 – continuously monitored parameters (optimal values < 100%), average of the seven plants
The plant renovation process has resulted in a significant improvement in the abatement percentages of pollutant emissions: in January 2008 the two new waste-to-energy plant lines in Ferrara became fully operational, since early 2009 the new Forlì plant has been operational, in April 2010 the new line 4 of the Modena waste-to-energy plant became operational, and since October 2010 the new line 4 of the Rimini waste-to-energy plant has been operational. The chart above shows the trend in the parameters continuously monitored for the period 2004-2012. In 2012, the concentrations of the atmospheric emissions of waste-to-energy plants were on average 11% of the limits set by the law, compared to 26% in 2004. This means that in 2012, the emissions were 89% lower compared to the allowed level while in 2004 this percentage was 74%.
Operation transparency for the Hera Group waste-to-energy plants There has been no stop to Hera’s initiatives to guarantee citizens maximum transparency and accessibility to their waste-to-energy plants. With the start up of the new waste-to-energy plants, Hera wanted to increase the ways in which citizens could receive information on the Group’s plants. In association with the local council and Circoscrizione 2, since the end of 2009 an information desk has been available at the Modena plant, upon appointment, every Tuesday afternoon from 4 p.m. to 7 p.m. By heading to this desk, citizens can request and obtain information on the functioning of the waste-to-energy plant directly from technicians that work there every day. To book an appointment at the info desk all you need do is phone or send an email to the URP of Circoscrizione 2. Furthermore, since 2006 a ‘Comitato Consultivo della Comunità Locale’ (Residential Advisory Board - RAB), comprising of citizens that live near the plant, has been active, meeting periodically with Hera representatives to gather information on the environmental impact of the waste-to-energy plant.
26.1% 25.5%21.2% 19.3% 17.1%
13.4% 13.0% 12.0% 11.0%
0%
25%
50%
75%
100%
2004 2005 2006 2007 2008 2009 2010 2011 2012
Legal limit = 100%

241
In addition, since January 2011 it has been enough to log on to the Hera site to request to visit the plants. In 2102 the development of special visitor routes at the Group waste-to-energy plants was completed. Thanks to a series of explanatory signs at the heart of the plant, these will illustrate how the plant functions. In 2012 the Group’s waste-to-Energy plants were visited by over 2,900 people, 1,900 of whom students, for a total of 98 visit days.
Compliance of atmospheric waste-to-energy emissions with legally established limits in Legislative Decree no. 133/2005 – continuously monitored parameters (optimal values < 100%), details per plant
Significant improvements in these results were obtained with the completion of new plants: in fact, the Ferrara and Forlì plants, started up in 2008 and 2009 respectively, and the Rimini plant in October 2011 following the definitive shutdown of the old lines, recorded the best results. There was a significant improvement at the Modena plant compared with last year, mainly the result of the improvement in combustion, which made it possible to reduce carbon monoxide emissions. Since 2011 the biomass plant developed in partnership with leading Italian wine producer Caviro has been operative. This plant, with a capacity of 12 MW, is mainly powered by prunings, grape processing waste and other combustible organic matrix materials. The plant is managed by Enomondo, in which Herambiente holds a 50% shareholding, and in 2012 treated 98,000 metric tons of waste. The plant came on stream in the second half of September: between October and December 2012 the concentrations of atmospheric emissions at the plant came to 11.1% of the legal limits and 14.3% of the limits defined by the IEA.
16.5% 7.3%10.2%
15.6%
19.1%9.1%
13.1%
14.0%
7.4%
7.9% 16.2%
22.1%
8.4% 7.8%12.9%
7.6%7.7%
14.2% 17.2% 8.7% 9.0%
0%
25%
50%
75%
100%
Bologna Ferrara Forlì Modena Ravenna(WDF)
Ravenna(special waste)
Rimini
2010 2011 2012
Legal limit = 100%

242
Atmospheric emissions from waste-to-energy treatment plants compared to authorisation limits – continuously monitored parameters (optimal values < 100%)
% 2010 2011 2012 Bologna (FEA) waste-to-energy plant 22.0% 19.5% 18.5% Ferrara waste-to-energy plant 8.2% 8.4% 15.1% Forlì waste-to-energy plant 19.9% 16.4% 16.4% Modena waste-to-energy plant 17.8% 17.7% 19.0% Ravenna waste-to-energy plant (special waste) 10.9% 10.0% 10.3% Arithmetical average 15.8% 14.4% 15.9% The Integrated Environmental Authorisations relating to the plants in Ferrara, Forlì and Modena also provide for the continuous monitoring of mercury. The same indicator was calculated for the six plants with authorisation limits that are more stringent than Italian regulations for 2012 (for the eight parameters monitored in continuation on average the limits established by the authorisations correspond to 71% of the limits laid down in Legislative Decree no. 133/2005); the data is displayed in the table above. The results are also excellent in this case: the concentrations are, on average, around 84% lower than the most restrictive limits. It is notable that the limits established by the individual authorisations are different depending on the plant, meaning that it is not possible to compare the performances of the single plants. For the Ferrara and Modena plants, the authorisations reduced the levels relating to some pollutants in 2012. Relative to the parameters for which Legislative Decree no. 133/2005 does not require continual monitoring (total metals, aromatic polycyclic hydrocarbons, dioxins and furans, cadmium and thallium, and mercury), in 2012 the Hera Group carried out a total of 501 samples, a considerably higher number than the 105 provided for in national regulations, the 335 established by the IEA and the 432 carried out in 2010. In 2012, as in previous years, Hera plants complied with the authorisation limits relative to amounts of waste treated, their type and, where present, their geographical derivation. With regard to the Ferrara plant, in 2012 the Province of Ferrara eliminated the limits regarding the quantity and derivation of special waste arriving at the waste-to-energy plant.
Plant thermal power saturation percentage % 2011 2012
Bologna (FEA) waste-to-energy plant 100% 100% Ferrara waste-to-energy plant 83% 81% Forlì waste-to-energy plant 78% 83% Modena waste-to-energy plant 94% 90% Ravenna waste-to-energy plant 100% 100% Rimini waste-to-energy plant 100% 100% Average 93% 93%
Given that in 2012 the Hera Group waste-to-energy plants treated quantities of waste substantially in line with the authorised quantities, and given the calorific value of this waste, the saturation percentage of the thermal power was equal to 93%. This means that in 2012 the plants were used to 93% of their potential.

243
At the waste-to-energy plants methane is used in the start-up and shutdown phases and to support combustion if the calorific value of the treated waste is low: overall consumption in 2012 came to around 9 million m3, in line with last year even if the Ferrara and Modena plants consumed greater quantities of methane because of the heavy snowfall in February that slowed down the disposal of waste. These increases were offset by the strong reduction in the consumption of the Rimini waste-to-energy plant which, thanks to its greater reliability, halved its methane consumption the previous year. Containing methane consumption is one of the improvement goals of the Group’s plants.
Atmospheric emissions generated by district heating
Atmospheric emissions generated by district heating t 2010 2011 2012
Nitric oxides 125.1 106.4 114.6 Carbon dioxide 98,031 83,920 85,041 The data refer to the thermoelectric power and cogeneration stations that power district heating. In 2012, nitric oxide and carbon dioxide emissions fell by 7.5% and 1.3% respectively compared with 2011 because of the greater use of thermoelectric power stations, which went from 35% in 2011 to 38% in 2012 (it was 61% in 2005). In 2012, the district heating plants produced a total of 666 GWh of electricity and thermal energy. The ratio between emissions and the energy produced provides a measure of specific emissions. 172 grams of nitric oxides were emitted in 2012 for each megawatt-hour of energy produced and 128 grams of carbon dioxide for every kilowatt-hour. Considering the concentrations of nitric oxides, carbon monoxide and dust, the concentrations of the atmospheric emissions of the cogeneration plants for district heating came to 33% of the legal limits and 41% of the limits established by the plant authorisations.
Atmospheric emissions generated by district heating (2012) t Nitric
oxides Carbon dioxide
Bologna 69.2 51,698 Ferrara 13.1 10,447 Forlì-Cesena 21.9 14,727 Imola-Faenza 3.7 2,839 Modena 5.5 4,352 Ravenna 1.2 978 Total 114.6 85,041
Increasingly green district heating in Ferrara Make the Ferrara district heating system one of the greenest on the planet thanks mainly to geothermics, i.e. the exploitation of the hot water naturally present in the subsoil. This is one of the main goals of the “Renewable Energies Hub” project launched by Hera.
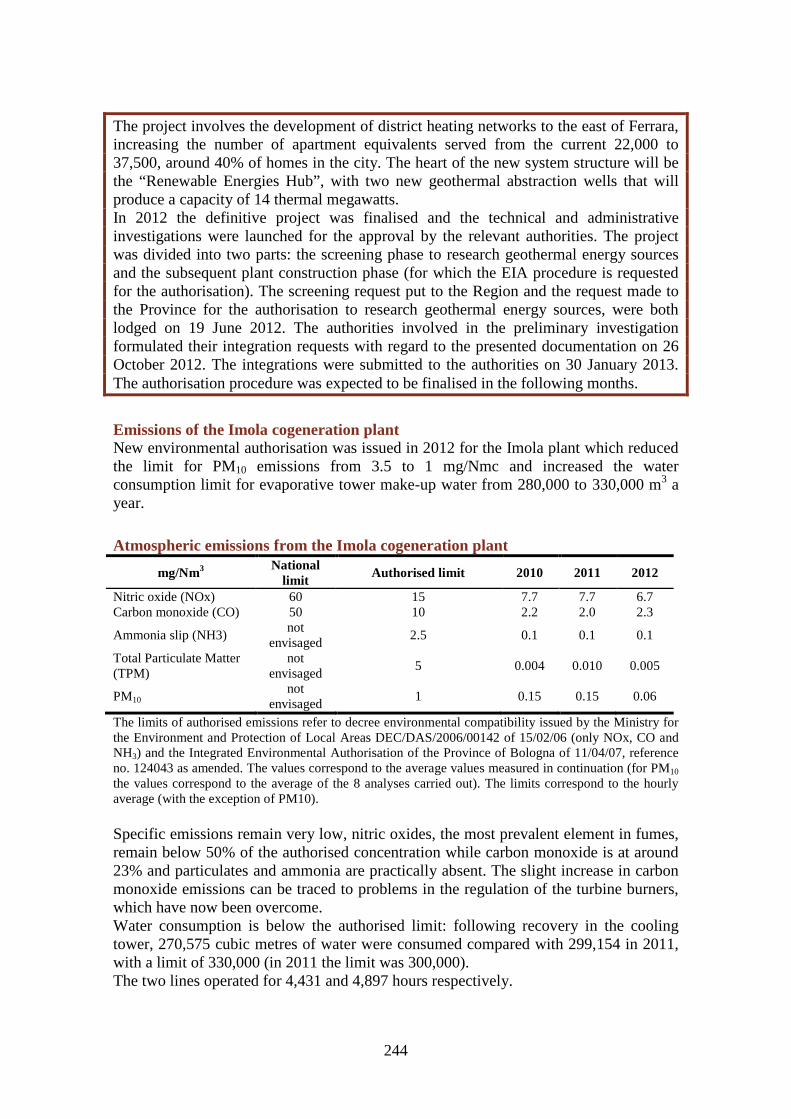
244
The project involves the development of district heating networks to the east of Ferrara, increasing the number of apartment equivalents served from the current 22,000 to 37,500, around 40% of homes in the city. The heart of the new system structure will be the “Renewable Energies Hub”, with two new geothermal abstraction wells that will produce a capacity of 14 thermal megawatts. In 2012 the definitive project was finalised and the technical and administrative investigations were launched for the approval by the relevant authorities. The project was divided into two parts: the screening phase to research geothermal energy sources and the subsequent plant construction phase (for which the EIA procedure is requested for the authorisation). The screening request put to the Region and the request made to the Province for the authorisation to research geothermal energy sources, were both lodged on 19 June 2012. The authorities involved in the preliminary investigation formulated their integration requests with regard to the presented documentation on 26 October 2012. The integrations were submitted to the authorities on 30 January 2013. The authorisation procedure was expected to be finalised in the following months.
Emissions of the Imola cogeneration plant New environmental authorisation was issued in 2012 for the Imola plant which reduced the limit for PM10 emissions from 3.5 to 1 mg/Nmc and increased the water consumption limit for evaporative tower make-up water from 280,000 to 330,000 m3 a year.
Atmospheric emissions from the Imola cogeneration plant
mg/Nm3 National
limit Authorised limit 2010 2011 2012
Nitric oxide (NOx) 60 15 7.7 7.7 6.7 Carbon monoxide (CO) 50 10 2.2 2.0 2.3
Ammonia slip (NH3) not
envisaged 2.5 0.1 0.1 0.1
Total Particulate Matter (TPM)
not envisaged
5 0.004 0.010 0.005
PM10 not
envisaged 1 0.15 0.15 0.06
The limits of authorised emissions refer to decree environmental compatibility issued by the Ministry for the Environment and Protection of Local Areas DEC/DAS/2006/00142 of 15/02/06 (only NOx, CO and NH3) and the Integrated Environmental Authorisation of the Province of Bologna of 11/04/07, reference no. 124043 as amended. The values correspond to the average values measured in continuation (for PM10 the values correspond to the average of the 8 analyses carried out). The limits correspond to the hourly average (with the exception of PM10). Specific emissions remain very low, nitric oxides, the most prevalent element in fumes, remain below 50% of the authorised concentration while carbon monoxide is at around 23% and particulates and ammonia are practically absent. The slight increase in carbon monoxide emissions can be traced to problems in the regulation of the turbine burners, which have now been overcome. Water consumption is below the authorised limit: following recovery in the cooling tower, 270,575 cubic metres of water were consumed compared with 299,154 in 2011, with a limit of 330,000 (in 2011 the limit was 300,000). The two lines operated for 4,431 and 4,897 hours respectively.

245
Corporate vehicle fleet
Fleet (No. of vehicles) no. 2010 2011 2012
Diesel 1,884 1,904 2,006 Petrol 777 698 592 Methane 538 539 539 LPG 17 41 46 Electric powered 44 40 37 Total 3,260 3,222 3,220 Non-circulating vehicles being disposed of were not included. The Group confirmed its established strategy of streamlining the use of the vehicles, beginning with the purchase of technologically advanced vehicles powered with fuels with less environmental impact, to replace obsolete vehicles. Excluding Marche Multiservizi, in 2012, 210 vehicles were sold and 118 diesel vehicles, 1 LGP vehicle, 1 methane vehicle and 3 electric vehicles were registered, all of which compliant with the most recent legislation as regards emissions. Currently, the Hera Group uses 14 methane automatic waste compactors out of an overall total of 172. Excluding Marche Multiservizi, the average age of Hera S.p.A.’s fleet is 8.5 years.
Fuel consumed by vehicles
A comparison between the various types of fuel was made considering the primary energy present in the single fuels calculated using the GRI method. In 2012, there was a 3.7% increase in fuel consumption compared with 2011 mainly because of the increased consumption of gas-oil and petrol in vehicles managed by Marche Multiservizi due to the increase in the area it serves. Meanwhile, there was a reduction in petrol consumption, which fell from 5.9% in 2011 to 5.1% in 2012.
85.8%
85.8%
87.6%
6.2% 5.9%5.1%
0.0%
8.0% 8.2% 7.2%
0.1% 0.1% 0.1%
60%
80%
100%
2010 2011 2012
Diesel Petrol Biodiesel 25% - diesel 75% Methane and LPG Electric
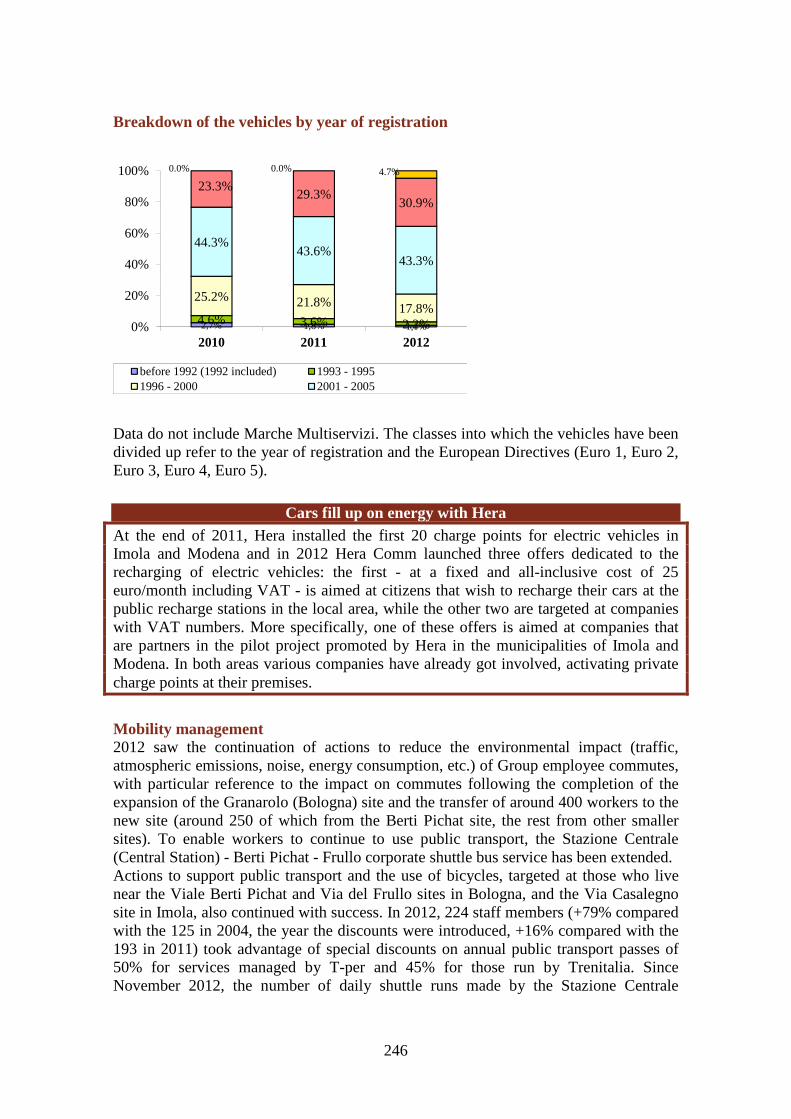
246
Breakdown of the vehicles by year of registration
Data do not include Marche Multiservizi. The classes into which the vehicles have been divided up refer to the year of registration and the European Directives (Euro 1, Euro 2, Euro 3, Euro 4, Euro 5).
Cars fill up on energy with Hera At the end of 2011, Hera installed the first 20 charge points for electric vehicles in Imola and Modena and in 2012 Hera Comm launched three offers dedicated to the recharging of electric vehicles: the first - at a fixed and all-inclusive cost of 25 euro/month including VAT - is aimed at citizens that wish to recharge their cars at the public recharge stations in the local area, while the other two are targeted at companies with VAT numbers. More specifically, one of these offers is aimed at companies that are partners in the pilot project promoted by Hera in the municipalities of Imola and Modena. In both areas various companies have already got involved, activating private charge points at their premises.
Mobility management 2012 saw the continuation of actions to reduce the environmental impact (traffic, atmospheric emissions, noise, energy consumption, etc.) of Group employee commutes, with particular reference to the impact on commutes following the completion of the expansion of the Granarolo (Bologna) site and the transfer of around 400 workers to the new site (around 250 of which from the Berti Pichat site, the rest from other smaller sites). To enable workers to continue to use public transport, the Stazione Centrale (Central Station) - Berti Pichat - Frullo corporate shuttle bus service has been extended. Actions to support public transport and the use of bicycles, targeted at those who live near the Viale Berti Pichat and Via del Frullo sites in Bologna, and the Via Casalegno site in Imola, also continued with success. In 2012, 224 staff members (+79% compared with the 125 in 2004, the year the discounts were introduced, +16% compared with the 193 in 2011) took advantage of special discounts on annual public transport passes of 50% for services managed by T-per and 45% for those run by Trenitalia. Since November 2012, the number of daily shuttle runs made by the Stazione Centrale
2,7% 1,8% 1,1%4.6% 3.6% 2.2%
25.2% 21.8% 17.8%
44.3%43.6%
43.3%
23.3%29.3%
30.9%
0.0% 0.0% 4.7%
0%
20%
40%
60%
80%
100%
2010 2011 2012
before 1992 (1992 included) 1993 - 19951996 - 2000 2001 - 2005
247
(Central Station) - Berti Pichat - Frullo corporate shuttle bus which, thanks to a specific agreement between the Hera Group and the Emilbanca Group, can be used by the employees of all companies belonging to the two Groups and maintains its “inter-company” dimension, has risen from six to seven whilst remaining free for all workers. This move was designed to serve those that work at the Frullo site following the completion of the new premises and the transfer of workers at the end of October: in the final weeks of 2012 the average number of users of the shuttle rose from around thirteen to over twenty people a day. For the use of bicycles, 10 special conditions were offered (up to a maximum payment of 50 Euro per person for the purchase of a bicycle and accessories or for maintenance). The yearly monitoring data recorded at the Hera headquarters in Viale Berti Pichat reveal that, between 2003 and 2012, the number of cars used for commuting per 100 employees has fallen from 74 to 63.8, a reduction of 14%, and a decrease estimated at around 430,000 km travelled per year. In the offices in via Casalegno in Imola, the proposal to make an annual contribution to reimburse expenses for purchasing or maintaining a bicycle, for employees that make at least 80 bicycle commutes a year, was maintained. In 2012, 11 workers were eligible for the refund, which has a maximum ceiling of Euro 50 a year.
Increasing usage of telepresence The telepresence service connects up all of the main company premises with video and audio technology via a highly reliable network infrastructure. Thanks to this service, which respects all safety and reliability standards, meetings between people at different sites have been optimised. A saving in time, energy, stress and the cost of transfers deriving from such journeys. The increase compared to 2010 is highly significant, almost an order of magnitude. The number of rooms equipped for telepresence went from 17 to 18, and these rooms were used 2010 times for a total of 3,342 hours (in 2011 they were used 1,076 times for a total of 1,632 hours).
Greenhouse gas emissions
Greenhouse gas emissions of plants subject to the Emissions Trading scheme The primary and most common gas responsible for the greenhouse effect is carbon dioxide, which is produced during combustion processes. Starting with the Kyoto Protocol, over the last 25 years, numerous international agreements have been signed for the purpose of regulating and controlling greenhouse gas emissions. The 2008-2012 period is the “first commitment period” to the Kyoto Protocol objectives of reducing greenhouse gas emissions, to be achieved in Europe with the EU-ETS (European Union Emission Trading System), a cap & trade type mechanism used to define the maximum greenhouse gas atmospheric emissions permitted in Member States, even if, for now, only carbon dioxide (CO2) has been considered. Member States have assigned the maximum emission quotas to operators with plants that fall within the field of application. The Hera Group plants involved are combustion plants with a maximum overall thermal furnace power of 20 MWt: waste to energy plants fuelled by waste are excluded from the mechanism. The Ministry for the Environment assigns maximum annual quotas for carbon dioxide emissions, expressed in metric tons of CO2, to each of the plants. Every year it is then necessary to quantify and submit the

248
emissions produced to inspection, comparing them to the assigned quotas. If the emissions are below the authorised levels, the excess quotas constitute an asset with an economic value that can be realised in a special dedicated market; vice versa, if emissions are too high, the missing quotas must be purchased from the market. As a result all operators have an incentive to contain the greenhouse gas emissions of their plants as far as possible and through a mechanism that gradually reduces the annual overall cap it is possible to comply with the Kyoto Protocol global policy and targets in order to contain environmental impact.
Kyoto Protocol compliance ratings Plant Power (MW) Type 2010 2011 2012
ACER Barca (Bologna) 28.8 Thermal power 208% 130% 282% ACER Pilastro (Bologna)
32.8 Thermal power 906% 449% 411%
Berti Pichat plant (Bologna)
25.7 Cogeneration plant 49% 53% 53%
COGEN (Bologna) 26.9 Thermoelectricity cogeneration and thermal power 87% 91% 52%
Ecocity (Bologna) 33.8 Thermoelectricity cogeneration and thermal power 186% 178% 170%
San Giacomo (Bologna) 21.7 Thermal power 176% 171% 161% Canal Bianco (Ferrara) 92.3 Thermal power 91% 35% 43% Casalegno (Imola) 216.4 Cogeneration plant 59% 61% 50%
Montericco (Imola) 20.2 Thermoelectricity cogeneration and thermal power 0% 1% 6%
Giardino (Modena) 33.4 Cogeneration plant 58% 59% 60% SAFTA (Piacenza) 41.3 Cogeneration plant 48% 50% 53% Weighted average 57% 56% 54% The Kyoto protocol compliance rating (%) indicates real emissions divided by assigned quantities. A value over 100% indicates that the level of authorised emissions has been exceeded. The quotas referring to the Casalegno plant (Imola) are recognised as those of a “new entry” plant. The quotas referring to the Giardino di Modena plant are estimates, as these are still to be assigned. There are 11 Hera Group plants authorised to emit greenhouse gases on the basis of Emissions Trading legislation, involving total installed furnace power of 579.6 MW; there are no variations with respect to the previous year. The carbon dioxide emissions recorded in 2012, equating to 232,104 metric tonnes, were lower than those recorded in 2011 (240,359). This reduction is mainly due to variations in the district heating service as a result of seasonal factors. The exceeding of authorised quotas at some plants is a consequence of a level of quotas authorised on the basis of historic consumption patterns pre-2005, a year in which district heating was less developed. Finally, it is worth noting that the Montericcio cogeneration plant in Imola was decommissioned in 2010.
Overall greenhouse gas emissions The Group plants produced total greenhouse gas emissions of 546,824 metric tons of CO2 equivalent. In the last year there was a reduction of 4%, which corresponds to a 2% increase in the amount of energy produced by these plants in the same period.
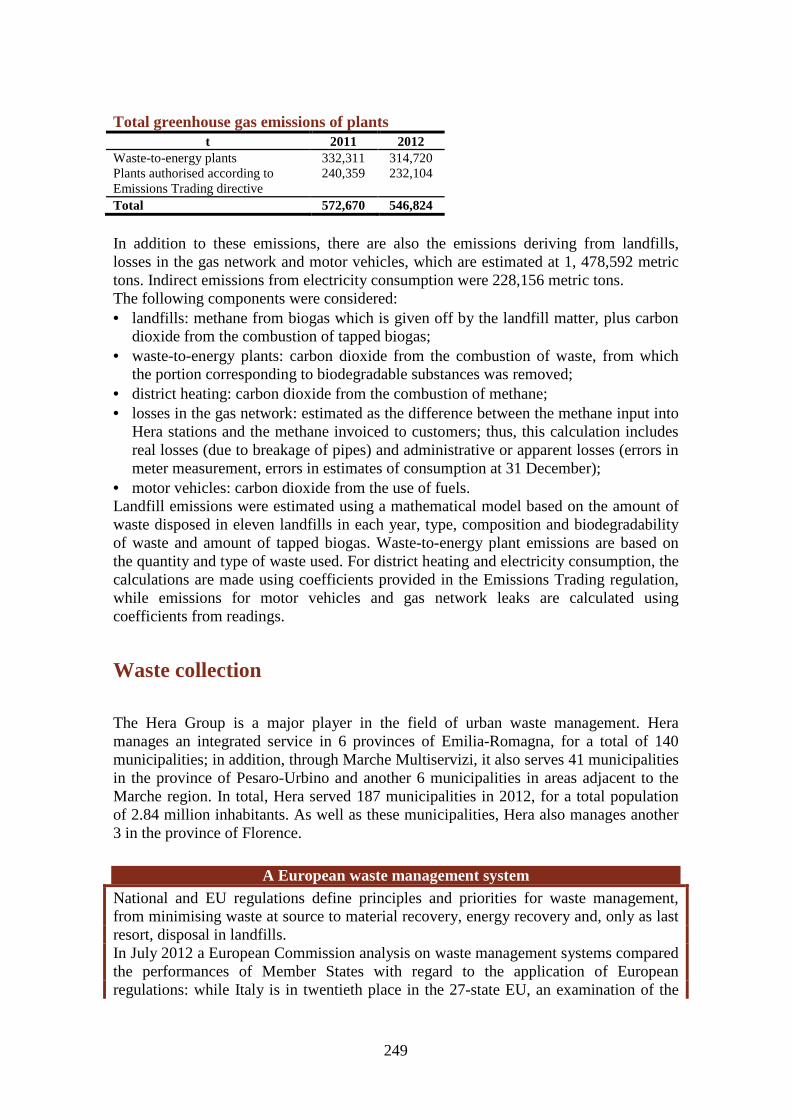
249
Total greenhouse gas emissions of plants t 2011 2012
Waste-to-energy plants 332,311 314,720 Plants authorised according to Emissions Trading directive
240,359 232,104
Total 572,670 546,824
In addition to these emissions, there are also the emissions deriving from landfills, losses in the gas network and motor vehicles, which are estimated at 1, 478,592 metric tons. Indirect emissions from electricity consumption were 228,156 metric tons. The following components were considered: • landfills: methane from biogas which is given off by the landfill matter, plus carbon
dioxide from the combustion of tapped biogas; • waste-to-energy plants: carbon dioxide from the combustion of waste, from which
the portion corresponding to biodegradable substances was removed; • district heating: carbon dioxide from the combustion of methane; • losses in the gas network: estimated as the difference between the methane input into
Hera stations and the methane invoiced to customers; thus, this calculation includes real losses (due to breakage of pipes) and administrative or apparent losses (errors in meter measurement, errors in estimates of consumption at 31 December);
• motor vehicles: carbon dioxide from the use of fuels. Landfill emissions were estimated using a mathematical model based on the amount of waste disposed in eleven landfills in each year, type, composition and biodegradability of waste and amount of tapped biogas. Waste-to-energy plant emissions are based on the quantity and type of waste used. For district heating and electricity consumption, the calculations are made using coefficients provided in the Emissions Trading regulation, while emissions for motor vehicles and gas network leaks are calculated using coefficients from readings.
Waste collection
The Hera Group is a major player in the field of urban waste management. Hera manages an integrated service in 6 provinces of Emilia-Romagna, for a total of 140 municipalities; in addition, through Marche Multiservizi, it also serves 41 municipalities in the province of Pesaro-Urbino and another 6 municipalities in areas adjacent to the Marche region. In total, Hera served 187 municipalities in 2012, for a total population of 2.84 million inhabitants. As well as these municipalities, Hera also manages another 3 in the province of Florence.
A European waste management system National and EU regulations define principles and priorities for waste management, from minimising waste at source to material recovery, energy recovery and, only as last resort, disposal in landfills. In July 2012 a European Commission analysis on waste management systems compared the performances of Member States with regard to the application of European regulations: while Italy is in twentieth place in the 27-state EU, an examination of the
250
statistical data puts the Emilia Romagna region seventh, and if we limit the application to the area in which the Group operates, Hera comes in fifth.
Hera has developed an organisational model for the separate and non-separate collection of urban waste which is based on the management experience of one of its local founding companies: the study and analysis of best management practices made it possible to base the new organisational model on the consolidated wealth of knowledge and experience we have acquired over the decades.
The Hera integrated waste management system (WMS) Hera’s Waste Management System (WMS) is characterised by three main systems: • local collection: for domestic and small non-domestic users, carried out according to
methods that fit best with the context served (mainly basic drop-off points with the IEB model also with closure systems, domestic systems);
• “target user” residential collection: aimed at non-domestic users that produce specific waste similar to urban waste (cardboard in shops, glass or tins in bars, organic waste in canteens or restaurants, etc.);
• Separated waste collection centres: also known as Equipped Drop-Off Points, these are infrastructures that complete the range of services offered to residents for dropping off all types of separated urban waste, including dangerous waste.
The system is also integrated with the domestic collection of bulky waste (free of charge, by phone call or by appointment), the collection of green waste, and the collection of other types of dangerous waste at specific businesses (e.g. batteries at pharmacies).
Rimini Riutilizza! At the end of October 2012 the “Rimini Riutilizza!” (“Rimini Reuses!”) initiative was launched. The aim is to encourage a reduction in the production of waste through the reuse and repair of products. It is a partnership between Hera, the Province and the Municipality of Rimini, Arpa and a number of local associations. “Rimini Riutilizza!” is part of the Cerrec Project (financed by the Central Europe - European Development Fund programme) in which the Province of Rimini is a partner together with 8 other institutions from 6 Central European countries. Every Saturday morning the general public can bring both materials for disposal and hand over functioning but unused products to representatives of the associations present at an area close to the drop-off point in Via Nataloni. All collected items are taken to the second-hand markets managed by the associations and sold at affordable prices to people in financial difficulty.
As regards local collection, the IEB (Basic Drop-Off Points) model involves the distribution of the various bins at a single collection point where it is possible to drop off the main types of materials: non-separated waste, paper, plastic, glass, tins, organic waste, green waste (some materials can also be dropped off in combined form); the aim is to increase the efficiency of separated waste collection and improve its urban impact. The IEB model reduces the number of bins for non-separated waste, in favour of those for separated waste collection.

251
With the aim of providing the most effective possible service in accordance with the features of the community, the collection services are differentiated according to standardised area types (historic centres, residential areas, tourist areas, extra-urban areas, industrial zones). For each local community a collection system is chosen that fits best with the urban (population density, configuration of roads, availability of space..), environmental (noise limits, street furniture..) and territorial features of the area (tourist presence, historic centre...) in a bid to maximise the percentage of separate waste and its quality through a service that is technically and economically sustainable. The collection system boasts a highly structured organisational model and in all municipalities includes local collection, “target” collections and collections at collection points. As regards the local collections (which take place across the area served), which account for the greatest volumes, these can be performed according to the following systems: • roadside collection, i.e. carried out using bins that are permanently located on public
land (roads, pavements, drop-off areas etc.); • roadside collection using “intelligent” containers, i.e. devices for electronic tracking
and disposal control mechanisms (e.g. lids, opening with electronic card or key); • door to door: collection system with waste stored in containers at user premises and
collection limited to specific days and times. In many municipalities there are mixed local collection systems (e.g. roadside collection for some materials and door-to-door for others; roadside collection in some areas, door-to-door in others): in order to simplify things, in the tables below the local collection services in each municipality are reclassified according to the most prevalent model.
Main forms of waste collection used in the community number municipalities served 2010 2011 2012
Roadside collection 121 115 111 Roadside collection with special disposal control mechanisms 15 20 22 Door to door 6 7 7 Total 142 142 140 Data do not include Marche Multiservizi. In the 140 municipalities served by Hera in 2012, 111 municipalities, around 84% of the population, were mainly served via roadside collection. With regard to waste collection with disposal control mechanisms, the 20 municipalities served in 2011 became 22 in 2012, with the extension of innovative experimental projects - involving the closure of containers with electronic devices and the registration of disposals - to 2 more municipalities (Spilamberto and San Mauro Pascoli, in which the latter Hera is part owner of the patent). As such, the overall population served by Hera using collection systems with electronic controls has gone from 3% in 2010 to 13% in 2012. 7 municipalities (over 72,000 inhabitants - around 3% of the population served) were served door-to-door in 2012.
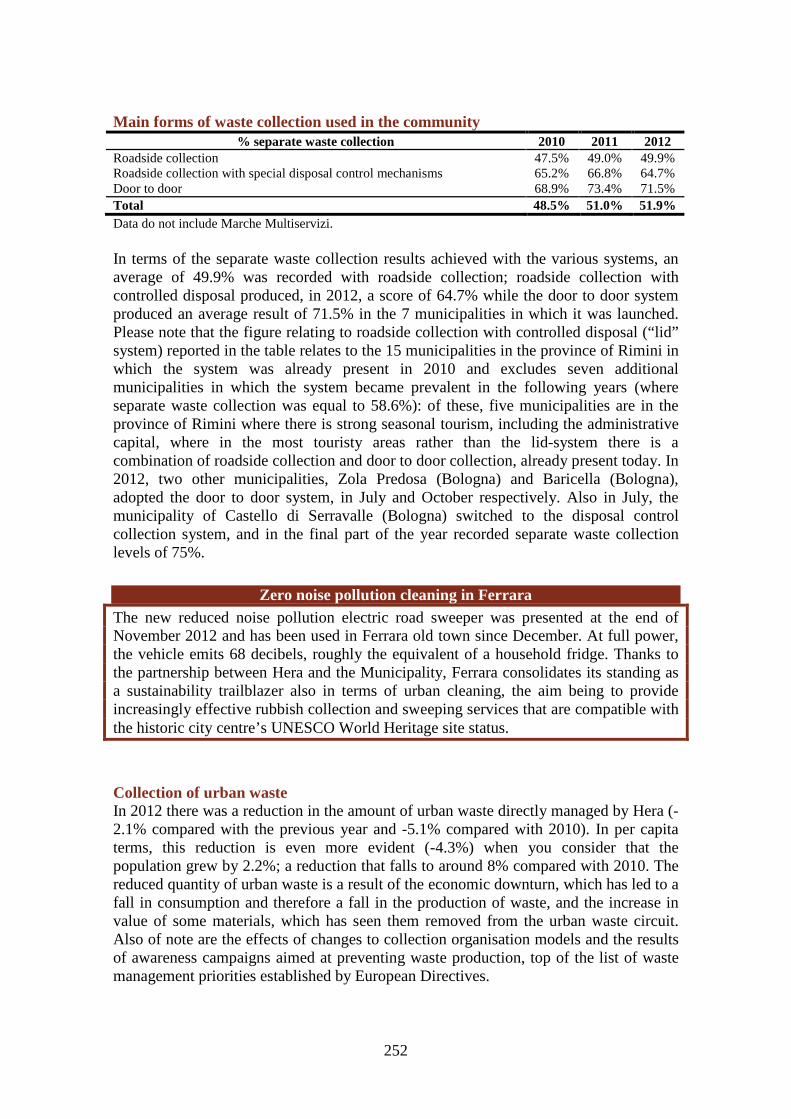
252
Main forms of waste collection used in the community % separate waste collection 2010 2011 2012
Roadside collection 47.5% 49.0% 49.9% Roadside collection with special disposal control mechanisms 65.2% 66.8% 64.7% Door to door 68.9% 73.4% 71.5% Total 48.5% 51.0% 51.9% Data do not include Marche Multiservizi. In terms of the separate waste collection results achieved with the various systems, an average of 49.9% was recorded with roadside collection; roadside collection with controlled disposal produced, in 2012, a score of 64.7% while the door to door system produced an average result of 71.5% in the 7 municipalities in which it was launched. Please note that the figure relating to roadside collection with controlled disposal (“lid” system) reported in the table relates to the 15 municipalities in the province of Rimini in which the system was already present in 2010 and excludes seven additional municipalities in which the system became prevalent in the following years (where separate waste collection was equal to 58.6%): of these, five municipalities are in the province of Rimini where there is strong seasonal tourism, including the administrative capital, where in the most touristy areas rather than the lid-system there is a combination of roadside collection and door to door collection, already present today. In 2012, two other municipalities, Zola Predosa (Bologna) and Baricella (Bologna), adopted the door to door system, in July and October respectively. Also in July, the municipality of Castello di Serravalle (Bologna) switched to the disposal control collection system, and in the final part of the year recorded separate waste collection levels of 75%.
Zero noise pollution cleaning in Ferrara The new reduced noise pollution electric road sweeper was presented at the end of November 2012 and has been used in Ferrara old town since December. At full power, the vehicle emits 68 decibels, roughly the equivalent of a household fridge. Thanks to the partnership between Hera and the Municipality, Ferrara consolidates its standing as a sustainability trailblazer also in terms of urban cleaning, the aim being to provide increasingly effective rubbish collection and sweeping services that are compatible with the historic city centre’s UNESCO World Heritage site status.
Collection of urban waste In 2012 there was a reduction in the amount of urban waste directly managed by Hera (-2.1% compared with the previous year and -5.1% compared with 2010). In per capita terms, this reduction is even more evident (-4.3%) when you consider that the population grew by 2.2%; a reduction that falls to around 8% compared with 2010. The reduced quantity of urban waste is a result of the economic downturn, which has led to a fall in consumption and therefore a fall in the production of waste, and the increase in value of some materials, which has seen them removed from the urban waste circuit. Also of note are the effects of changes to collection organisation models and the results of awareness campaigns aimed at preventing waste production, top of the list of waste management priorities established by European Directives.
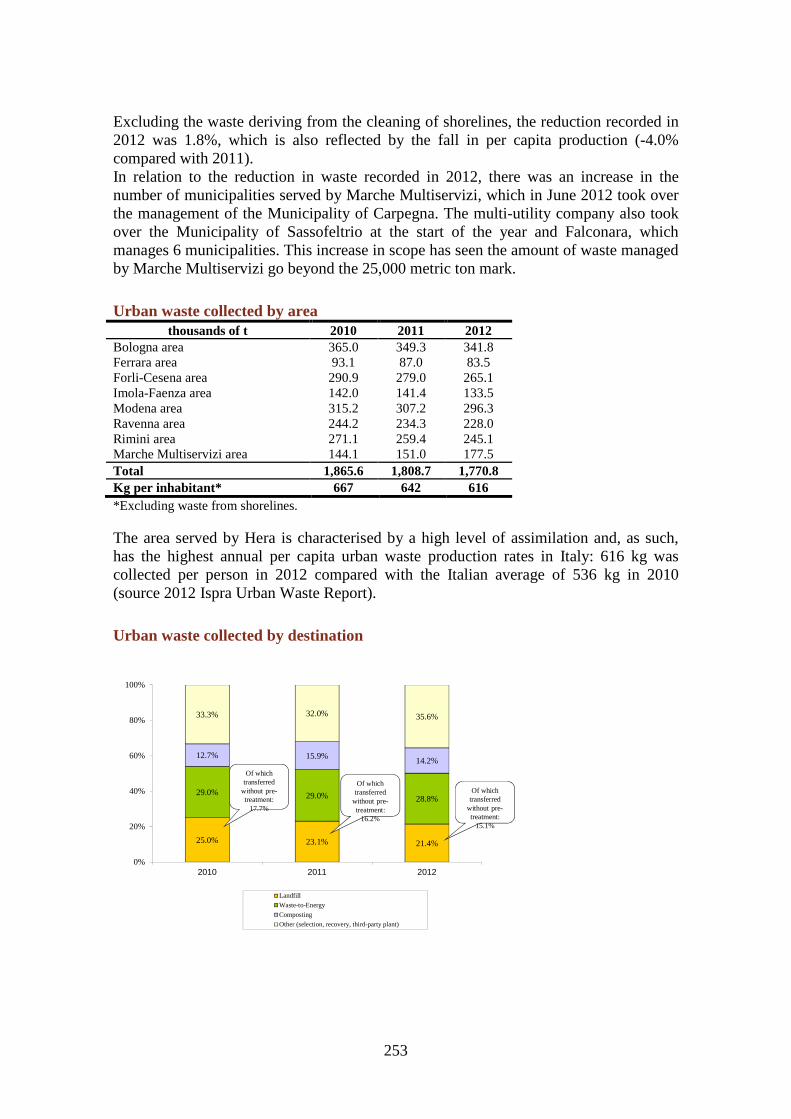
253
Excluding the waste deriving from the cleaning of shorelines, the reduction recorded in 2012 was 1.8%, which is also reflected by the fall in per capita production (-4.0% compared with 2011). In relation to the reduction in waste recorded in 2012, there was an increase in the number of municipalities served by Marche Multiservizi, which in June 2012 took over the management of the Municipality of Carpegna. The multi-utility company also took over the Municipality of Sassofeltrio at the start of the year and Falconara, which manages 6 municipalities. This increase in scope has seen the amount of waste managed by Marche Multiservizi go beyond the 25,000 metric ton mark.
Urban waste collected by area thousands of t 2010 2011 2012
Bologna area 365.0 349.3 341.8 Ferrara area 93.1 87.0 83.5 Forli-Cesena area 290.9 279.0 265.1 Imola-Faenza area 142.0 141.4 133.5 Modena area 315.2 307.2 296.3 Ravenna area 244.2 234.3 228.0 Rimini area 271.1 259.4 245.1 Marche Multiservizi area 144.1 151.0 177.5 Total 1,865.6 1,808.7 1,770.8 Kg per inhabitant* 667 642 616 *Excluding waste from shorelines. The area served by Hera is characterised by a high level of assimilation and, as such, has the highest annual per capita urban waste production rates in Italy: 616 kg was collected per person in 2012 compared with the Italian average of 536 kg in 2010 (source 2012 Ispra Urban Waste Report).
Urban waste collected by destination
25.0% 23.1% 21.4%
29.0% 29.0% 28.8%
12.7% 15.9%14.2%
33.3% 32.0% 35.6%
0%
20%
40%
60%
80%
100%
2010 2011 2012
Landfill
Waste-to-Energy
Composting
Other (selection, recovery, third-party plant)
Of which transferred
without pre-treatment:
17.7%
Of which transferred
without pre-treatment:
16.2%
Of which transferred
without pre-treatment:
15.1%
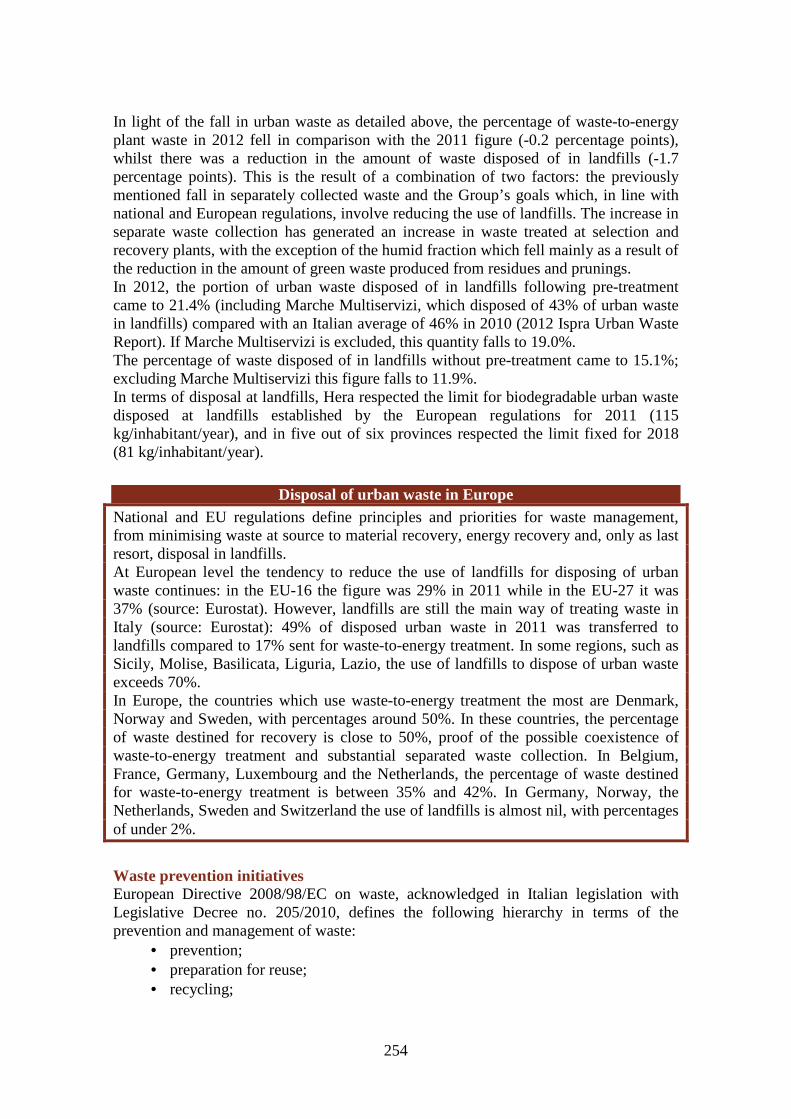
254
In light of the fall in urban waste as detailed above, the percentage of waste-to-energy plant waste in 2012 fell in comparison with the 2011 figure (-0.2 percentage points), whilst there was a reduction in the amount of waste disposed of in landfills (-1.7 percentage points). This is the result of a combination of two factors: the previously mentioned fall in separately collected waste and the Group’s goals which, in line with national and European regulations, involve reducing the use of landfills. The increase in separate waste collection has generated an increase in waste treated at selection and recovery plants, with the exception of the humid fraction which fell mainly as a result of the reduction in the amount of green waste produced from residues and prunings. In 2012, the portion of urban waste disposed of in landfills following pre-treatment came to 21.4% (including Marche Multiservizi, which disposed of 43% of urban waste in landfills) compared with an Italian average of 46% in 2010 (2012 Ispra Urban Waste Report). If Marche Multiservizi is excluded, this quantity falls to 19.0%. The percentage of waste disposed of in landfills without pre-treatment came to 15.1%; excluding Marche Multiservizi this figure falls to 11.9%. In terms of disposal at landfills, Hera respected the limit for biodegradable urban waste disposed at landfills established by the European regulations for 2011 (115 kg/inhabitant/year), and in five out of six provinces respected the limit fixed for 2018 (81 kg/inhabitant/year).
Disposal of urban waste in Europe National and EU regulations define principles and priorities for waste management, from minimising waste at source to material recovery, energy recovery and, only as last resort, disposal in landfills. At European level the tendency to reduce the use of landfills for disposing of urban waste continues: in the EU-16 the figure was 29% in 2011 while in the EU-27 it was 37% (source: Eurostat). However, landfills are still the main way of treating waste in Italy (source: Eurostat): 49% of disposed urban waste in 2011 was transferred to landfills compared to 17% sent for waste-to-energy treatment. In some regions, such as Sicily, Molise, Basilicata, Liguria, Lazio, the use of landfills to dispose of urban waste exceeds 70%. In Europe, the countries which use waste-to-energy treatment the most are Denmark, Norway and Sweden, with percentages around 50%. In these countries, the percentage of waste destined for recovery is close to 50%, proof of the possible coexistence of waste-to-energy treatment and substantial separated waste collection. In Belgium, France, Germany, Luxembourg and the Netherlands, the percentage of waste destined for waste-to-energy treatment is between 35% and 42%. In Germany, Norway, the Netherlands, Sweden and Switzerland the use of landfills is almost nil, with percentages of under 2%.
Waste prevention initiatives European Directive 2008/98/EC on waste, acknowledged in Italian legislation with Legislative Decree no. 205/2010, defines the following hierarchy in terms of the prevention and management of waste:
• prevention; • preparation for reuse; • recycling;
255
• other types of recovery, such as energy recovery; • disposal.
Hera, while operating as waste management manager, and therefore in full respect of the prerogatives of those responsible for waste planning, has developed and participated in numerous initiatives aimed at encouraging waste prevention: in 2012 it was involved in around 20 active waste reduction initiatives.
CiboAmico brings solidarity to canteens and helps the environment In 2012, CiboAmico, the initiative launched in 2009 aimed at recovering unused foodstuffs in the Group canteens and distributing them to local associations that assist people in difficulty, donated 10,400 full meals to the 5 non-profit associations involved (Opera di Padre Marella, Papa Giovanni XXIII, Arca-Comunità Arcobaleno, Il Piccolo Principe and Viale K), which host around 270 people in the 7 structures involved in the project, some of which participate directly in the recovery operations. The project is continuously monitored with the support of Last Minute Market, a University of Bologna spin-off that encourages actions to prevent waste. 4,443 kg of cooked and raw products were recovered in 2012, the equivalent of 42 full meals a day. As part of an agreement designed to improve the waste management services at two production sites, Hera proposed CiboAmico to its client CNH with regard to two company canteens (Modena and San Matteo): the company accepted the proposal, recouping around 10,000 meals for the Porta Aperta association in 2012.
The most significant initiatives included: • Life “Lowaste” , a project coordinated by the Municipality of Ferrara, on waste
prevention and reuse initiatives for the development of at least four waste management cycles that make it possible to reuse the materials and reintroduce them to the market, acting on both the supply and demand side;
• “Second Life”, the new reuse area launched in September 2011 together with the Municipality of Bologna, in the immediate vicinity of a new Separate Waste Collection Centre. This is the only case in Italy in which social cooperatives manage the structure (“Fare Mondi” and “La Strada”). By the end of 2012 almost 89% of the items that have passed through the Second Life site have been given new life: in its 15 months of activity, 58,524 items have arrived at the site and 51,994 have left, with a stock numbering 6,530 objects. Clothes are the most commonly exchanged items, accounting for 38% of incoming and outgoing goods, followed by books (13%), toys (9%), kitchenware (9%), furniture (7%) and audio/video equipment (7%). Over 1,100 people have used the structure.
• “Edy”, is the new creative reuse site that was opened in November 2012 in Modena to give new life to clothes, shoes and other objects that go on sale again at the charity market. Edy was developed by Hera thanks to the contribution of the Region of Emilia-Romagna and is managed by the San Francesco Onlus association.
• “Trashware”: with 223 computers supplied to schools, associations and private users, the Cesena project completed its first year of activity, a year focused on recycling and assisting young university students. Developed by student association S.P.R.I.Te. in partnership with the Municipality of Cesena, Hera and the Cesena Campus of the University of Bologna, the project has become a reference point for

256
those that wish to get rid of dated but functioning computer equipment and for all entities that require reconditioned computers for basic computer activities.
After “Still of Use”, “FarmacoAmico” comes to Ravenna, Imola and Bologna After “Still of Use” in Ferrara, the “FarmacoAmico” (“MedicineFriend”) project for the separate collection and reuse of medicines that have not yet expired was launched in Imola and Ravenna in 2012 and in Bologna in February 2013. Promoted by the municipal authorities of Ravenna, Imola and Bologna together with the Hera Group, Con.Ami, Ausl Imola, voluntary associations, Last Minute Market and a number of pharmaceutical trade associations, FarmacoAmico will support Caritas Ravenna-Cervia, Caritas Imola and the Bologna ANT in assisting their beneficiaries. The goal of the initiative is to collect appropriately conserved medicines which do not expire for at least another 6 months. Special containers were set up in participating pharmacies to collect the medicines. Preventing waste and helping the most needy are the main objectives of FarmacoAmico.
Among the other initiatives launched, Hera2O (promotion of tap water at Hera sites) and CiboAmico (donation of unused food in Hera canteens to associations within the local areas) stand out because they are targeted at employees and contribute towards reducing plastic packaging, in the former case, and organic waste in the latter. Last but not least, there were also: • the actions designed to promote “Domestic composting”, through the free supply of
composters by Hera with associated discounts on bills in some ATO or individual municipalities;
• “Toner and mobile phone Eco-boxes”, containers for sending used toner cartridges and mobile phones for recycling, mainly distributed in schools in the areas served by the Hera Group.
Separate waste collection
The area served by the Hera Group has a very well-structured collection system that makes it possible to separately collect numerous different types of urban waste, reconciling the needs of the Municipalities with management efficiency and effectiveness. The main types of separately collected waste are:
• packaging and similar: paper and cardboard, plastic, glass, aluminium and steel cans, wood; • durable goods: iron, waste from electrical and electronic appliances (WEEE) and bulky waste; • compostable waste: kitchen organic waste and “green” waste from prunings and residues. • other waste: inert materials from small demolition materials, mineral oil and used cooking oil, batteries and accumulators, medicines and other dangerous urban waste.

257
The Hera Group system involves collection via both roadside rubbish skips and door-to-door collection; the latter comprises both “community”-level collection, mainly focused on domestic users, and “targeted” collection, dedicated to specific non-residential users. The 160 Separated Waste Collection Centres (or Equipped Drop-Off Points to use their previous official name) in the served area, used for the direct disposal of waste by the public, have an increasingly important functional and strategic role. 19 of these Centres are located in the Marche region. Many Collection Centres are equipped with weighing and user-recognition systems: in addition to tracking waste drop off, these systems make it possible to apply discounts on rates.
Separated waste collection bins and Collection Centres 2010 2011 2012
Number of bins (no.) 162,511 175,793 193,382 Bin volume (m3) 196,197 210,261 221,706 Separated Waste Collection Centres (no.) 148 151 160
The implementation of projects to develop separate waste collection resulted in a marked increase both in terms of number of roadside skips (bins, “igloo” bins, drums) available to residents and in terms of the total volume of the skips, and a concurrent reduction in the number of skips for non-separated waste. Compared to 2010, there were increases in both the number of bins for separate waste collection (+19%) and their volume (+13%). The increases mainly regarded the areas of Ferrara, Modena and Pesaro-Urbino. In order to improve the efficiency of its services, the Group has also reduced the number and volume of bins for non-separate waste collection (the overall volume has fallen by 3% in the last three years).
“Identis Wee” intelligent bins launched in Ravenna Hera is playing a leading role in the European Union project Identis Weee (Identification DEterminatioN Traceability Integrated System for Weee), together with partners such as the Ecolight Consortium (Italy) and Fundación Ecolum (Spain). The aim of the project is to increase the collection of small-sized domestic appliances and other goods and, at the same time, guarantee the traceability of the waste. In September 2012 Ravenna became the first municipality to employ two prototype intelligent bins, which will also be installed in Bologna, Castenaso and Lugo in 2013. The first tool is a genuine mobile station for the domestic and local collection of electronic waste, while the second is a roadside bin for small-sized electronic waste that can be opened using a magnetic card that is issued to citizens.
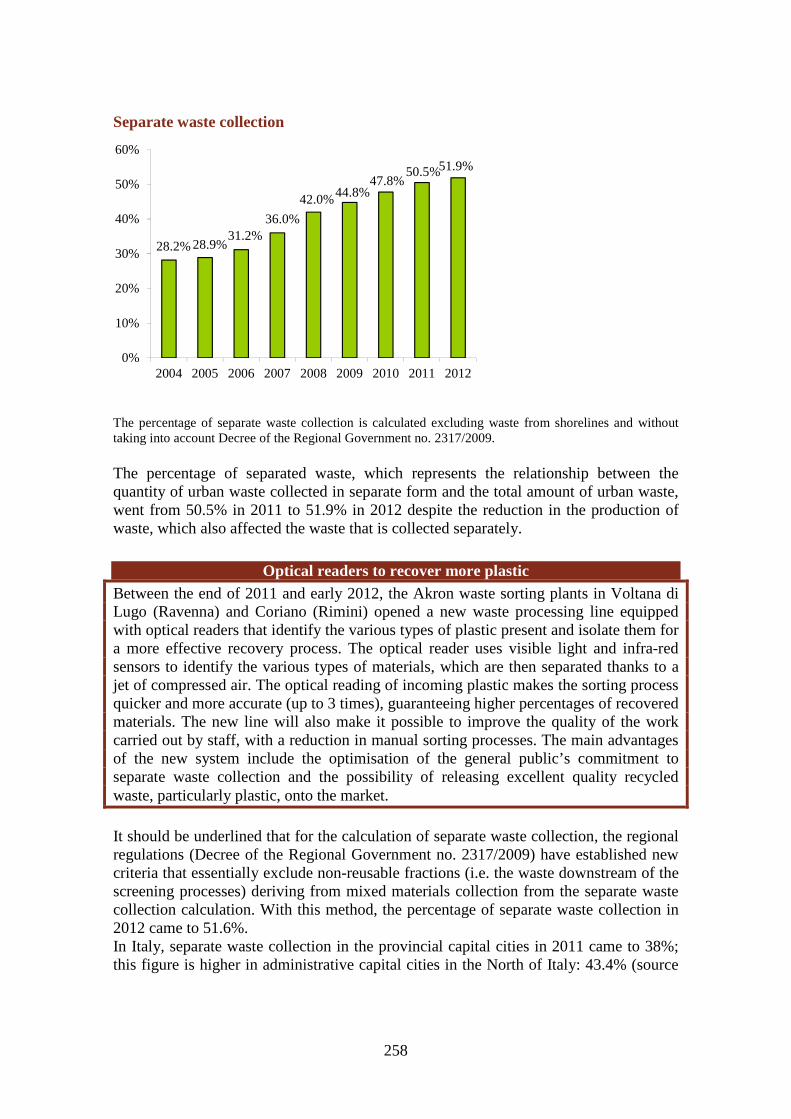
258
Separate waste collection
The percentage of separate waste collection is calculated excluding waste from shorelines and without taking into account Decree of the Regional Government no. 2317/2009. The percentage of separated waste, which represents the relationship between the quantity of urban waste collected in separate form and the total amount of urban waste, went from 50.5% in 2011 to 51.9% in 2012 despite the reduction in the production of waste, which also affected the waste that is collected separately.
Optical readers to recover more plastic Between the end of 2011 and early 2012, the Akron waste sorting plants in Voltana di Lugo (Ravenna) and Coriano (Rimini) opened a new waste processing line equipped with optical readers that identify the various types of plastic present and isolate them for a more effective recovery process. The optical reader uses visible light and infra-red sensors to identify the various types of materials, which are then separated thanks to a jet of compressed air. The optical reading of incoming plastic makes the sorting process quicker and more accurate (up to 3 times), guaranteeing higher percentages of recovered materials. The new line will also make it possible to improve the quality of the work carried out by staff, with a reduction in manual sorting processes. The main advantages of the new system include the optimisation of the general public’s commitment to separate waste collection and the possibility of releasing excellent quality recycled waste, particularly plastic, onto the market.
It should be underlined that for the calculation of separate waste collection, the regional regulations (Decree of the Regional Government no. 2317/2009) have established new criteria that essentially exclude non-reusable fractions (i.e. the waste downstream of the screening processes) deriving from mixed materials collection from the separate waste collection calculation. With this method, the percentage of separate waste collection in 2012 came to 51.6%. In Italy, separate waste collection in the provincial capital cities in 2011 came to 38%; this figure is higher in administrative capital cities in the North of Italy: 43.4% (source
28.2%28.9%31.2%
36.0%
42.0%44.8%47.8%
50.5%51.9%
0%
10%
20%
30%
40%
50%
60%
2004 2005 2006 2007 2008 2009 2010 2011 2012
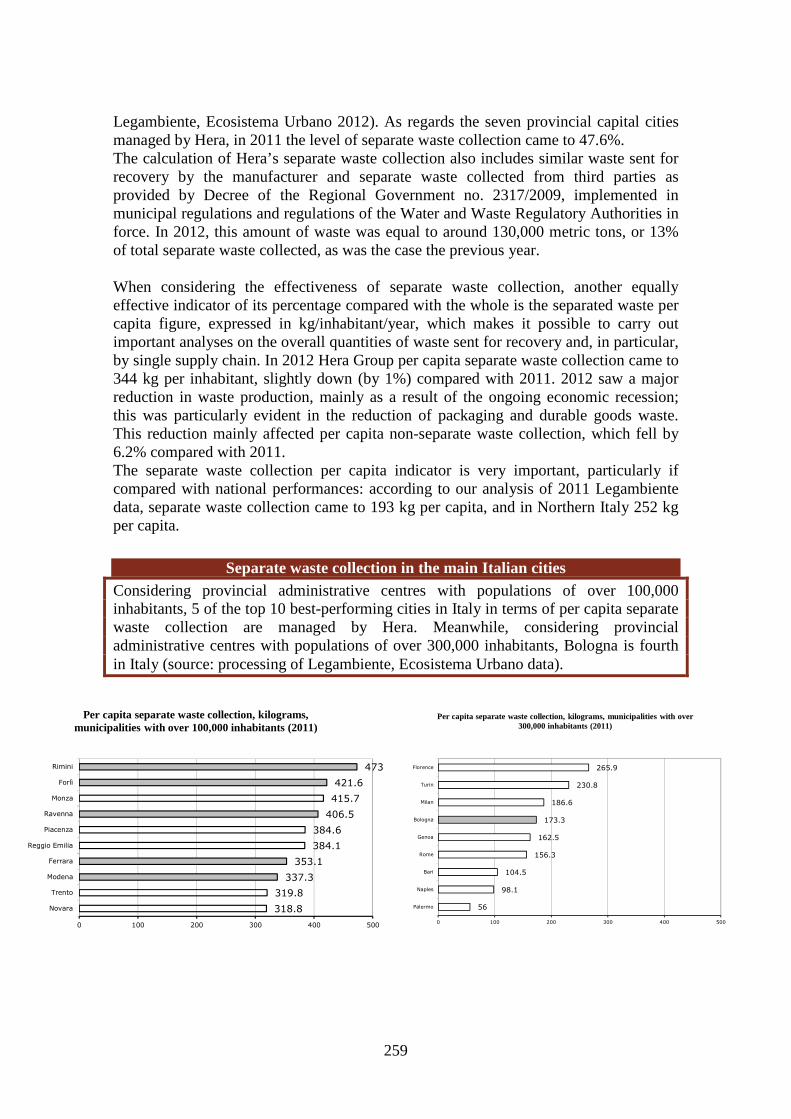
259
Legambiente, Ecosistema Urbano 2012). As regards the seven provincial capital cities managed by Hera, in 2011 the level of separate waste collection came to 47.6%. The calculation of Hera’s separate waste collection also includes similar waste sent for recovery by the manufacturer and separate waste collected from third parties as provided by Decree of the Regional Government no. 2317/2009, implemented in municipal regulations and regulations of the Water and Waste Regulatory Authorities in force. In 2012, this amount of waste was equal to around 130,000 metric tons, or 13% of total separate waste collected, as was the case the previous year. When considering the effectiveness of separate waste collection, another equally effective indicator of its percentage compared with the whole is the separated waste per capita figure, expressed in kg/inhabitant/year, which makes it possible to carry out important analyses on the overall quantities of waste sent for recovery and, in particular, by single supply chain. In 2012 Hera Group per capita separate waste collection came to 344 kg per inhabitant, slightly down (by 1%) compared with 2011. 2012 saw a major reduction in waste production, mainly as a result of the ongoing economic recession; this was particularly evident in the reduction of packaging and durable goods waste. This reduction mainly affected per capita non-separate waste collection, which fell by 6.2% compared with 2011. The separate waste collection per capita indicator is very important, particularly if compared with national performances: according to our analysis of 2011 Legambiente data, separate waste collection came to 193 kg per capita, and in Northern Italy 252 kg per capita.
Separate waste collection in the main Italian cities Considering provincial administrative centres with populations of over 100,000 inhabitants, 5 of the top 10 best-performing cities in Italy in terms of per capita separate waste collection are managed by Hera. Meanwhile, considering provincial administrative centres with populations of over 300,000 inhabitants, Bologna is fourth in Italy (source: processing of Legambiente, Ecosistema Urbano data).
473
421.6
415.7
406.5
384.6
384.1
353.1
337.3
319.8
318.8
0 100 200 300 400 500
Rimini
Forlì
Monza
Ravenna
Piacenza
Reggio Emilia
Ferrara
Modena
Trento
Novara
Per capita separate waste collection, kilograms, municipalities with over 100,000 inhabitants (2011)
265.9
230.8
186.6
173.3
162.5
156.3
104.5
98.1
56
0 100 200 300 400 500
Florence
Turin
Milan
Bologna
Genoa
Rome
Bari
Naples
Palermo
Per capita separate waste collection, kilograms, municipalities with over 300,000 inhabitants (2011)
260
In 2012 separate waste collection came to 971.5 thousand metric tons (+1.4% compared with 2011). In 2012 there was a significant re-planning of the services designed to increase the efficacy of separate waste collection, improve its integration in the urban context and make these services more accessible to the public. All communities were involved in projects to convert the traditional roadside system into the more modern Basic Drop-Off Point (IEB) model which involves the optimisation of collection points and a reduction in the number of unseparated waste bins. More specifically, in some municipalities (Castello di Serravalle, part of the municipality of Pianoro) electronic systems for the monitoring of unseparated waste using the ‘lid’ system were introduced; this system became fully operational across the province of Rimini in 2012. In San Mauro Pascoli and Spilamberto experimental projects for the electronic traceability of waste were developed further. In various municipalities in the province of Modena, the IEB model was integrated by a simple system that only permits the disposal of unseparated waste of a certain size (openings). In the “walled” area of the municipality of Ferrara, the IEB model was streamlined with the simultaneous suspension of the door-to-door waste paper collection service in favour of a roadside bin system, generating an overall increase in collection levels. The door-to-door collection service underwent major development in entire municipalities (Baricella, Zola Predosa), various smaller inhabited areas, and industrial/artisanal areas (particularly in Imola/Faenza, the province of Bologna and the municipality of Ferrara, the latter seeing a change from mixed materials to single materials collection). The door-to-door collection of some materials, paper/cardboard and plastic in particular, was widely augmented for specific users (target users) and in some town centres (Bologna, Ferrara). The targeted collection of glass and organic materials was also further expanded. Strong impetus was given to the collection of the “green” fraction (prunings and residues) via specific roadside bins (Imola-Faenza and Ravenna areas). New Separated Waste Collection Centres were also opened (in Firenzuola, Ferrara and two in the province of Pesaro-Urbino) as was an innovative self-service SWCC in Sesto Imolese. Numerous already-operational Centres have been extended and made more accessible.
Separate waste collection in Bologna city centre In 2012 Hera reorganised the collection of paper and plastic in the city centre. Since May there have been services for the domestic collection of bags of paper waste, the collection of cardboard, also from businesses, and targeted collection at major manufacturers and over 70 university sites. Since October bags of plastic waste have been collected, as have boxes from supermarkets and foodstuffs. The results of these changes, introduced in close association with the municipal authorities and the relevant local areas, have been very positive: the amount of paper collected has quadrupled, there has been a 16% rise in cardboard from business activities, and the amount of plastic collected in the town centre comes to 10 kg/inhabitant/year (close to the city’s average of 17). The services for the collection of bulky waste were also reorganised and the Basic Drop-Off Points extended to the entire suburban area. The improvements to the service will continue in 2013 with the opening of mini underground drop-off points for the collection of glass and organic material (the project
261
involves a total of 140 sites in the town centre) and the creation of a new Separate Waste Collection Centre at CAAB.
With regard to the individual areas, the growth in those in which Marche Multiservizi operates (province of Pesaro-Urbino plus six municipalities in the province of Ancona) has been particularly significant. The growth of separate waste collection continues in all areas with the most positive results coming in Ferrara and Modena. Rimini and Ravenna are now close to the 60% mark while Bologna has gone beyond 40%.
Separate waste collection % 2010 2011 2012
Bologna Area 39.0% 39.7% 40.4% Ferrara Area 49.0% 51.2% 52.7% Forlì-Cesena Area 48.4% 50.1% 50.2% Imola-Faenza Area 46.2% 49.2% 49.4% Modena Area 51.3% 53.6% 55.7% Ravenna Area 56.0% 58.1% 58.7% Rimini Area 52.8% 59.2% 59.9% Marche Multiservizi 39.7% 44.3% 52.0% The percentage of separate waste collection is calculated including the quantities of waste deriving from road sweeping, excluding the waste from the shore, and without taking account of Decree of the Regional Government no. 2317/2009. The calculation of separately collected waste also includes similar waste transferred by manufacturers for recovery and separately collected waste from third parties or directly from municipalities. The differing criteria for assimilation laid down by ATERSIR, the Water and Waste Regulatory Authorities and municipalities may be responsible for quota differences from one area to the next.
Separate waste collection: excellent results in Forlì Excellent separate waste collection results as regards domestic collection in Forlì in 2012, with average percentages of 70% as opposed to the previous level of 50%. There was a door-to-door collection service in two areas of Forlì for a total of over 13,000 users and 28,339 inhabitants - around a quarter of all Forlì’s citizens. Hera’s structure enabled it to provide excellent services and to increase employment levels with new jobs given to 25 people, particularly persons facing hardship, in the cooperatives that manage the service.
In terms of the various waste materials that Hera collected separately in 2012, in comparison with 2011: • there was an increase in plastic (+19%), growing and not regarded as fully mature
yet, glass (+18%) and organic waste (+8%), because of the various improvement actions carried out;
• paper waste collection was stable and there was a slight fall in green waste collection (-1%) due to the particular climatic conditions in 2012;
• there was a major reduction in the durable goods fractions as a result of the recession: bulky waste (-2%), iron (-10%), WEEE (-21%). As well as the economic climate, this latter fraction in particular has also been affected by the sales network’s recovery of domestic appliances (e.g. through returns), the increase in the market value of waste, and the end of the phase that saw many TVs replaced so people could switch over to digital terrestrial.
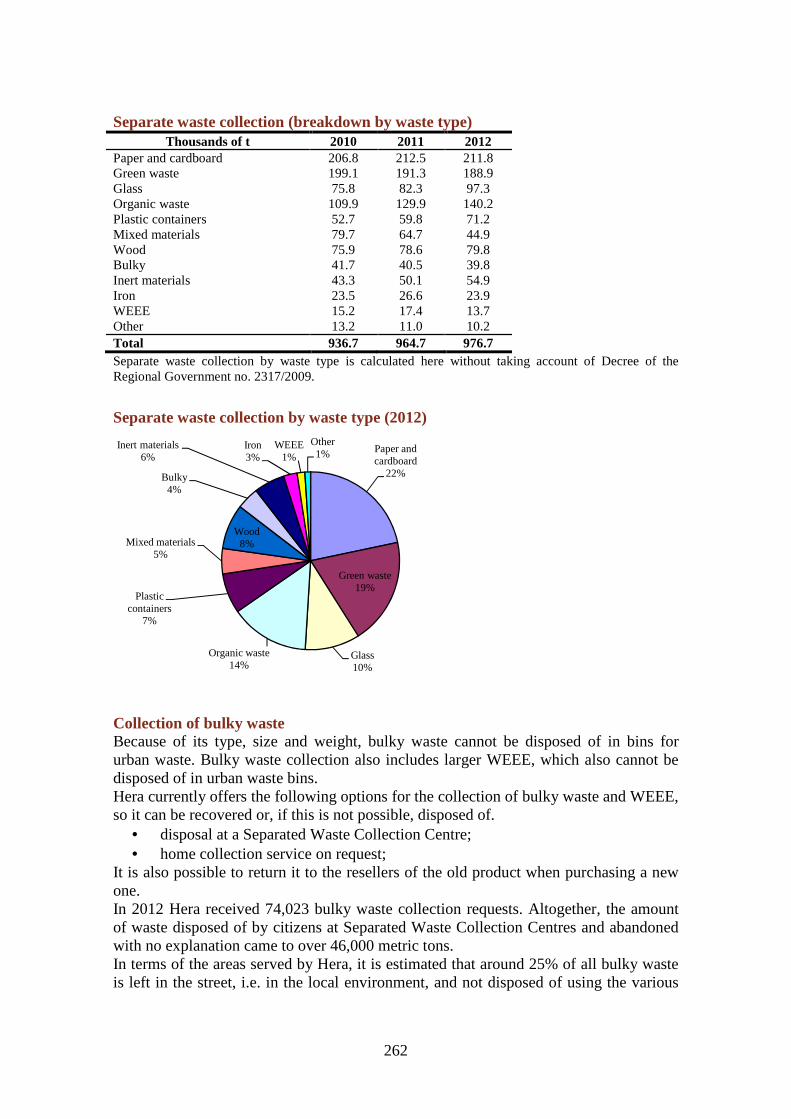
262
Separate waste collection (breakdown by waste type) Thousands of t 2010 2011 2012
Paper and cardboard 206.8 212.5 211.8 Green waste 199.1 191.3 188.9 Glass 75.8 82.3 97.3 Organic waste 109.9 129.9 140.2 Plastic containers 52.7 59.8 71.2 Mixed materials 79.7 64.7 44.9 Wood 75.9 78.6 79.8 Bulky 41.7 40.5 39.8 Inert materials 43.3 50.1 54.9 Iron 23.5 26.6 23.9 WEEE 15.2 17.4 13.7 Other 13.2 11.0 10.2 Total 936.7 964.7 976.7 Separate waste collection by waste type is calculated here without taking account of Decree of the Regional Government no. 2317/2009.
Separate waste collection by waste type (2012)
Collection of bulky waste Because of its type, size and weight, bulky waste cannot be disposed of in bins for urban waste. Bulky waste collection also includes larger WEEE, which also cannot be disposed of in urban waste bins. Hera currently offers the following options for the collection of bulky waste and WEEE, so it can be recovered or, if this is not possible, disposed of.
• disposal at a Separated Waste Collection Centre; • home collection service on request;
It is also possible to return it to the resellers of the old product when purchasing a new one. In 2012 Hera received 74,023 bulky waste collection requests. Altogether, the amount of waste disposed of by citizens at Separated Waste Collection Centres and abandoned with no explanation came to over 46,000 metric tons. In terms of the areas served by Hera, it is estimated that around 25% of all bulky waste is left in the street, i.e. in the local environment, and not disposed of using the various
Paper and cardboard
22%
Green waste19%
Glass10%
Organic waste14%
Plastic containers
7%
Mixed materials5%
Wood8%
Bulky4%
Inert materials6%
Iron3%
WEEE1%
Other1%
263
channels available. This despite the fact that the average time taken to meet home collection requests is very good (just over 7 days from when the request is made) and that there is an extensive network of Separated Waste Collection Centres where it is possible to leave such rubbish, obviously free of charge. This practice of dumping rubbish on public land has a significant environmental impact and contributes greatly to urban decay. For this reason, in 2012 Hera put together a project to improve the collection of bulky waste, the aim being to increase the quality and the range of its services and to inform and raise the awareness of the public. Launched in 2013, the project will comprise the following main activities:
• operational/managerial: standardise type and quantities of collected waste, improve the quality and methods of managing the service, expanding the range of available services;
• innovations and cultural changes: increase the incentives for direct disposal at Separated Waste Collection Centres, promote the reuse, regeneration and recycling of bulky waste;
• communications: events, advertising and specific messages, promoting the service etc.;
• service monitoring: periodic measurement of quality and, therefore, improvements;
• corporate: greater control, also through environmental volunteering and associations.
Tracking waste: where does the separated waste collected go? In 2012 Hera published the third “Tracking Waste” report on the destination of separately collected waste. The 44 first destination waste plants were identified in 2011 and, by involving the managers of these plants, the percentage of waste transformed into “second raw materials” (replacing raw materials of natural origins) was determined and the production plants that utilise the materials deriving from separate waste collection identified. The initiative regarded the main materials collected separately: paper, green waste (residues, prunings), organic waste, glass, wood, plastic, iron and metals (steel, aluminium and tinplate packaging). In 2011 the overall percentage effectively recovered was 93.4%: 92.4% paper, 92.0% organic, 96.9% green, 95.4% glass, 86.4% plastic, 94.1% metal, 92% wood and 100% iron. The results were presented in a leaflet distributed at the main customer branches, at schools and public events, and at the URPs in the local municipalities. These data can also be consulted in a special section of the Group website. The report was audited by Det Norske Veritas Italia which verified that it is immediately legible and clear and that the data and information contained therein respond to the truth, and are correct and consistent with the other corporate instruments used to manage sustainability. The initiative, repeated every year, is one of the tools that the company uses to report on the progress it is making in terms of sustainable development.
As well as the portion of separately collected waste that is effectively recovered, part of the undifferentiated waste collected is sent for recovery via processing at mechanical

264
screening plants. In 2012, around 141,000 metric tons of undifferentiated waste was sent to these plants, equal to 15.2% of all undifferentiated urban waste collected. Ferrous metals (approx. 131 metric tons in 2012 sent for recovery) and the humid fraction of waste (50,000 metric tons sent to composting plants for the production of biostabilised compost for landfill capping) are separated from these materials.
Waste disposal
The Hera Group, through its subsidiary Herambiente, manages its treatment plant system, through operations to recover and dispose of urban and special waste, with a portfolio of 80 plants. This plant system represents a unique integrated and complete model in Italy that allows the Group to effectively and appropriately respond to EU and Italian legislation regarding waste management. The system involves various types of plants: storage and initial pre-treatment plants, plants for the selection and recovery of dry material (paper, cardboard, glass, plastic and tins), composting and anaerobic digestion of the organic fraction with energy recovery, waste-to-energy plants with high energy recovery, landfills, chemical-physical treatment of liquid waste, treatment, pre-treatment and reconditioning of muddy waste and pulverulents. It therefore covers all treatment requirements relating to the urban waste collected by Hera S.p.A. in the target area and a wide range of hazardous and non-hazardous waste from the industrial and service industries sector within the national customer base.
The industrial sludge treatment plant that “gives new life” to waste Attaining “value” from sludge, at the same time contributing to the safeguarding of the environment: this is the goal of the industrial sludge treatment plant (Disidrat), opened in Ravenna in April 2012, which will replace a similar plant that is smaller in size and whose environmental performance is not as effective. Managed by Herambiente, the plant will treat around 150,000 metric tons of special waste, hazardous and non-hazardous, liquids and solids, classified as “sludge”. Thanks to the sophisticated technologies used, it will be possible to recover and reuse the majority of the incoming material to cap landfills in place of top soil, or as a consolidation material for mines. The process will seek to recover around 50% of the incoming material, thus reducing the amount disposed of at landfills. The plant was completed in 24 months, with an investment of Euro 13 million. The industrial site where the plant is located already boasts ISO 14001 environmental certification, OSHAS 18001 safety certification and EMAS certification, which in 2013 will also be extended to the new plant.
Herambiente carried out the following operations in 2012: • it improved the efficiency of its waste-to-energy plants: having reached the
performance levels required by the regulations, the Ferrara and Bologna plants were recognised as recovery plants rather than disposal plants. Work is also underway to bring the Rimini and Modena plants up to the same level, and after these work will begin at the Forlì plant. In 2012 Herambiente acquired Energonut, owners of a WDF energy recovery plant in the Molise region;

265
• it extended the size of various existing landfills (Tre Monti, Zocca, Pago). It carried out operations for the definitive capping of decommissioned landfills and their reintegration into the landscape and environment (Legislative Decree no. 36/2003). In 2012 the landfills of Modena and Finale Emilia were used for the storage, treatment and reuse of earthquake debris as a substitute for natural gravel to cap decommissioned landfills;
• with regard to special waste plants, the “disidrat” plant that treats muddy waste and pulverulents in the province of Ravenna became operational at industrial level; the adjustment work on the ITFI Bologna chemical-physical plant was completed and the work to modernise the hazardous and non-hazardous special waste plants at the Via Baiona site in Ravenna continued;
• a number of innovative projects were launched: “landfillmining”, or rather the removal of waste from a decommissioned landfill for hazardous waste to a more suitable location with the possibility of developing a new landfill with a capacity 4-5 times greater than the pre-existing one; an indirect thermal desorption plant for the treatment of contaminated land, mainly due to hydrocarbons, for ex-situ decontamination and the recovery of decontaminated land to relocate at the redeveloped site; presentation of the project for the environmental renovation of a decommissioned landfill using non-hazardous recovered waste in place of virgin raw materials (location at km 3.8 of the SS 309 road in Ravenna);
• as part of the “biodigesters” project, two new organic waste anaerobic digestion plants for the production of renewable electricity and quality compost were developed in Rimini and Ravenna.
The Hera “biodigester” project: + renewable energy and – greenhouse gases The project involves the recovery of biomass of various types, both as an agricultural fertiliser as well as a raw material in energy production, thereby avoiding its disposal in landfills and the consequent production of greenhouse gases. In 2012 two new plants were developed and the final design of a third plant was completed. The Cà Baldacci (Rimini) and Voltana di Lugo plants each have a capacity of 40,000 metric tons a year with the production of around 6,500 MWh/year of electricity (the equivalent consumption of 2,400 families). The Rimini worksite was opened in March and the first parallel connection with electricity transfer took place on 14 December, while the Voltana worksite was opened in February and the first parallel connection with electricity transfer took place on 11 December. When fully operational, the two plants will guarantee savings of around 4,000 metric tons of greenhouse gases a year. The final design of a plant in Modena with a dry digestion section and a composting section was also completed. Given the substantial reduction in the incentive for energy production, technological solutions will be examined to guarantee the economic sustainability of this investment.
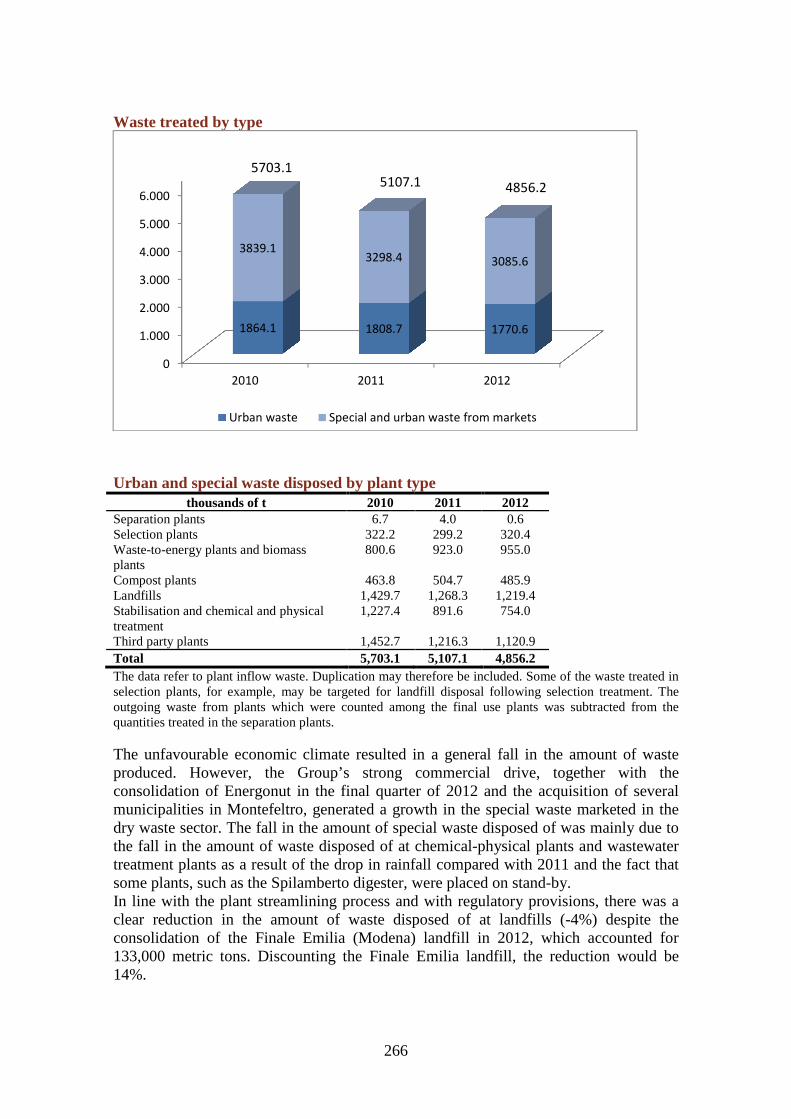
266
Waste treated by type
Urban and special waste disposed by plant type thousands of t 2010 2011 2012
Separation plants 6.7 4.0 0.6 Selection plants 322.2 299.2 320.4 Waste-to-energy plants and biomass plants
800.6 923.0 955.0
Compost plants 463.8 504.7 485.9 Landfills 1,429.7 1,268.3 1,219.4 Stabilisation and chemical and physical treatment
1,227.4 891.6 754.0
Third party plants 1,452.7 1,216.3 1,120.9 Total 5,703.1 5,107.1 4,856.2 The data refer to plant inflow waste. Duplication may therefore be included. Some of the waste treated in selection plants, for example, may be targeted for landfill disposal following selection treatment. The outgoing waste from plants which were counted among the final use plants was subtracted from the quantities treated in the separation plants. The unfavourable economic climate resulted in a general fall in the amount of waste produced. However, the Group’s strong commercial drive, together with the consolidation of Energonut in the final quarter of 2012 and the acquisition of several municipalities in Montefeltro, generated a growth in the special waste marketed in the dry waste sector. The fall in the amount of special waste disposed of was mainly due to the fall in the amount of waste disposed of at chemical-physical plants and wastewater treatment plants as a result of the drop in rainfall compared with 2011 and the fact that some plants, such as the Spilamberto digester, were placed on stand-by. In line with the plant streamlining process and with regulatory provisions, there was a clear reduction in the amount of waste disposed of at landfills (-4%) despite the consolidation of the Finale Emilia (Modena) landfill in 2012, which accounted for 133,000 metric tons. Discounting the Finale Emilia landfill, the reduction would be 14%.
0
1.000
2.000
3.000
4.000
5.000
6.000
2010 2011 2012
1864.1 1808.7 1770.6
3839.13298.4 3085.6
Urban waste Special and urban waste from markets
5703.15107.1 4856.2
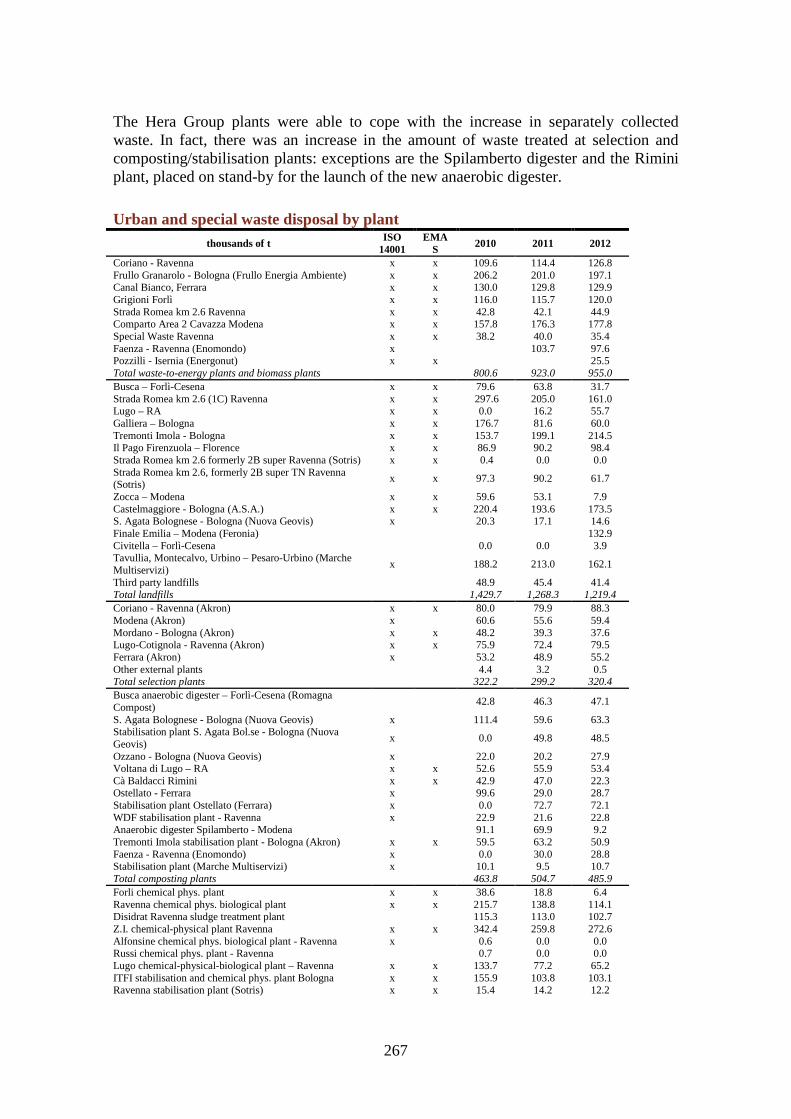
267
The Hera Group plants were able to cope with the increase in separately collected waste. In fact, there was an increase in the amount of waste treated at selection and composting/stabilisation plants: exceptions are the Spilamberto digester and the Rimini plant, placed on stand-by for the launch of the new anaerobic digester.
Urban and special waste disposal by plant thousands of t
ISO 14001
EMAS 2010 2011 2012
Coriano - Ravenna x x 109.6 114.4 126.8 Frullo Granarolo - Bologna (Frullo Energia Ambiente) x x 206.2 201.0 197.1 Canal Bianco, Ferrara x x 130.0 129.8 129.9 Grigioni Forlì x x 116.0 115.7 120.0 Strada Romea km 2.6 Ravenna x x 42.8 42.1 44.9 Comparto Area 2 Cavazza Modena x x 157.8 176.3 177.8 Special Waste Ravenna x x 38.2 40.0 35.4 Faenza - Ravenna (Enomondo) x 103.7 97.6 Pozzilli - Isernia (Energonut) x x 25.5 Total waste-to-energy plants and biomass plants 800.6 923.0 955.0 Busca – Forlì-Cesena x x 79.6 63.8 31.7 Strada Romea km 2.6 (1C) Ravenna x x 297.6 205.0 161.0 Lugo – RA x x 0.0 16.2 55.7 Galliera – Bologna x x 176.7 81.6 60.0 Tremonti Imola - Bologna x x 153.7 199.1 214.5 Il Pago Firenzuola – Florence x x 86.9 90.2 98.4 Strada Romea km 2.6 formerly 2B super Ravenna (Sotris) x x 0.4 0.0 0.0 Strada Romea km 2.6, formerly 2B super TN Ravenna (Sotris)
x x 97.3 90.2 61.7
Zocca – Modena x x 59.6 53.1 7.9 Castelmaggiore - Bologna (A.S.A.) x x 220.4 193.6 173.5 S. Agata Bolognese - Bologna (Nuova Geovis) x 20.3 17.1 14.6 Finale Emilia – Modena (Feronia) 132.9 Civitella – Forlì-Cesena 0.0 0.0 3.9 Tavullia, Montecalvo, Urbino – Pesaro-Urbino (Marche Multiservizi)
x 188.2 213.0 162.1
Third party landfills 48.9 45.4 41.4 Total landfills 1,429.7 1,268.3 1,219.4 Coriano - Ravenna (Akron) x x 80.0 79.9 88.3 Modena (Akron) x 60.6 55.6 59.4 Mordano - Bologna (Akron) x x 48.2 39.3 37.6 Lugo-Cotignola - Ravenna (Akron) x x 75.9 72.4 79.5 Ferrara (Akron) x 53.2 48.9 55.2 Other external plants 4.4 3.2 0.5 Total selection plants 322.2 299.2 320.4 Busca anaerobic digester – Forlì-Cesena (Romagna Compost)
42.8 46.3 47.1
S. Agata Bolognese - Bologna (Nuova Geovis) x 111.4 59.6 63.3 Stabilisation plant S. Agata Bol.se - Bologna (Nuova Geovis)
x 0.0 49.8 48.5
Ozzano - Bologna (Nuova Geovis) x 22.0 20.2 27.9 Voltana di Lugo – RA x x 52.6 55.9 53.4 Cà Baldacci Rimini x x 42.9 47.0 22.3 Ostellato - Ferrara x 99.6 29.0 28.7 Stabilisation plant Ostellato (Ferrara) x 0.0 72.7 72.1 WDF stabilisation plant - Ravenna x 22.9 21.6 22.8 Anaerobic digester Spilamberto - Modena 91.1 69.9 9.2 Tremonti Imola stabilisation plant - Bologna (Akron) x x 59.5 63.2 50.9 Faenza - Ravenna (Enomondo) x 0.0 30.0 28.8 Stabilisation plant (Marche Multiservizi) x 10.1 9.5 10.7 Total composting plants 463.8 504.7 485.9 Forli chemical phys. plant x x 38.6 18.8 6.4 Ravenna chemical phys. biological plant x x 215.7 138.8 114.1 Disidrat Ravenna sludge treatment plant 115.3 113.0 102.7 Z.I. chemical-physical plant Ravenna x x 342.4 259.8 272.6 Alfonsine chemical phys. biological plant - Ravenna x 0.6 0.0 0.0 Russi chemical phys. plant - Ravenna 0.7 0.0 0.0 Lugo chemical-physical-biological plant – Ravenna x x 133.7 77.2 65.2 ITFI stabilisation and chemical phys. plant Bologna x x 155.9 103.8 103.1 Ravenna stabilisation plant (Sotris) x x 15.4 14.2 12.2
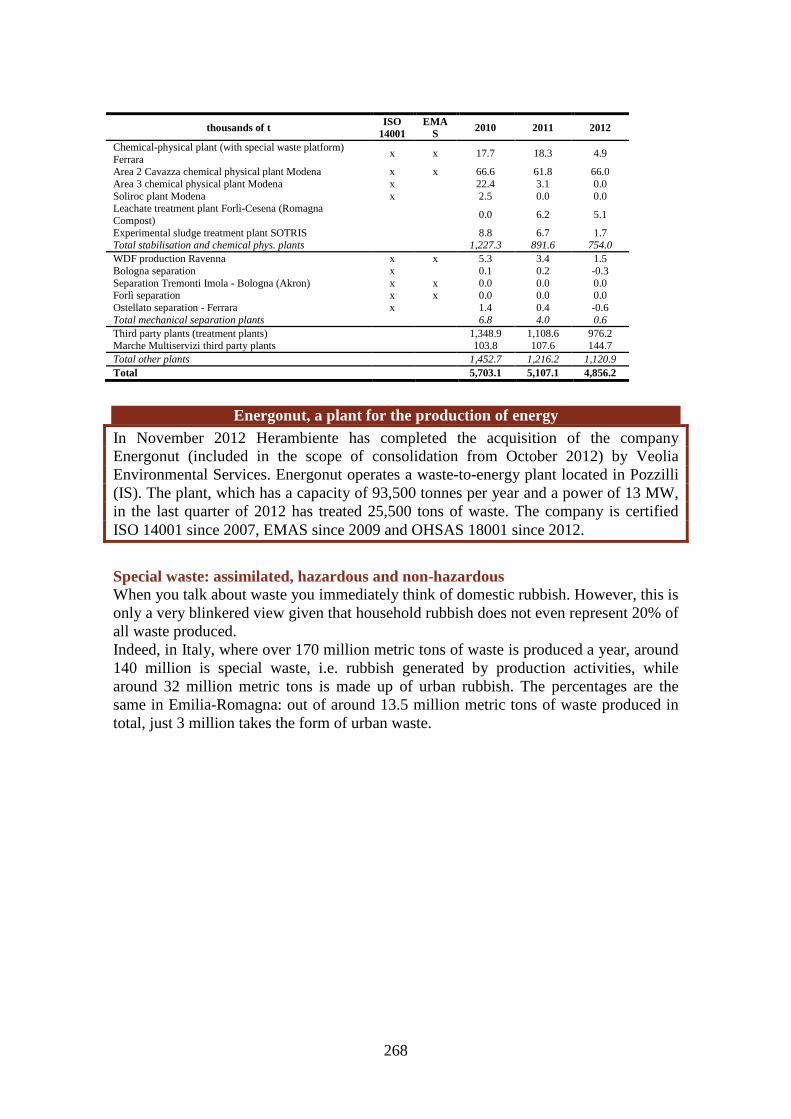
268
thousands of t ISO 14001
EMAS 2010 2011 2012
Chemical-physical plant (with special waste platform) Ferrara
x x 17.7 18.3 4.9
Area 2 Cavazza chemical physical plant Modena x x 66.6 61.8 66.0 Area 3 chemical physical plant Modena x 22.4 3.1 0.0 Soliroc plant Modena x 2.5 0.0 0.0 Leachate treatment plant Forlì-Cesena (Romagna Compost)
0.0 6.2 5.1
Experimental sludge treatment plant SOTRIS 8.8 6.7 1.7 Total stabilisation and chemical phys. plants 1,227.3 891.6 754.0 WDF production Ravenna x x 5.3 3.4 1.5 Bologna separation x 0.1 0.2 -0.3 Separation Tremonti Imola - Bologna (Akron) x x 0.0 0.0 0.0 Forlì separation x x 0.0 0.0 0.0 Ostellato separation - Ferrara x 1.4 0.4 -0.6 Total mechanical separation plants 6.8 4.0 0.6 Third party plants (treatment plants) 1,348.9 1,108.6 976.2 Marche Multiservizi third party plants 103.8 107.6 144.7 Total other plants 1,452.7 1,216.2 1,120.9 Total 5,703.1 5,107.1 4,856.2
Energonut, a plant for the production of energy In November 2012 Herambiente has completed the acquisition of the company Energonut (included in the scope of consolidation from October 2012) by Veolia Environmental Services. Energonut operates a waste-to-energy plant located in Pozzilli (IS). The plant, which has a capacity of 93,500 tonnes per year and a power of 13 MW, in the last quarter of 2012 has treated 25,500 tons of waste. The company is certified ISO 14001 since 2007, EMAS since 2009 and OHSAS 18001 since 2012.
Special waste: assimilated, hazardous and non-hazardous When you talk about waste you immediately think of domestic rubbish. However, this is only a very blinkered view given that household rubbish does not even represent 20% of all waste produced. Indeed, in Italy, where over 170 million metric tons of waste is produced a year, around 140 million is special waste, i.e. rubbish generated by production activities, while around 32 million metric tons is made up of urban rubbish. The percentages are the same in Emilia-Romagna: out of around 13.5 million metric tons of waste produced in total, just 3 million takes the form of urban waste.
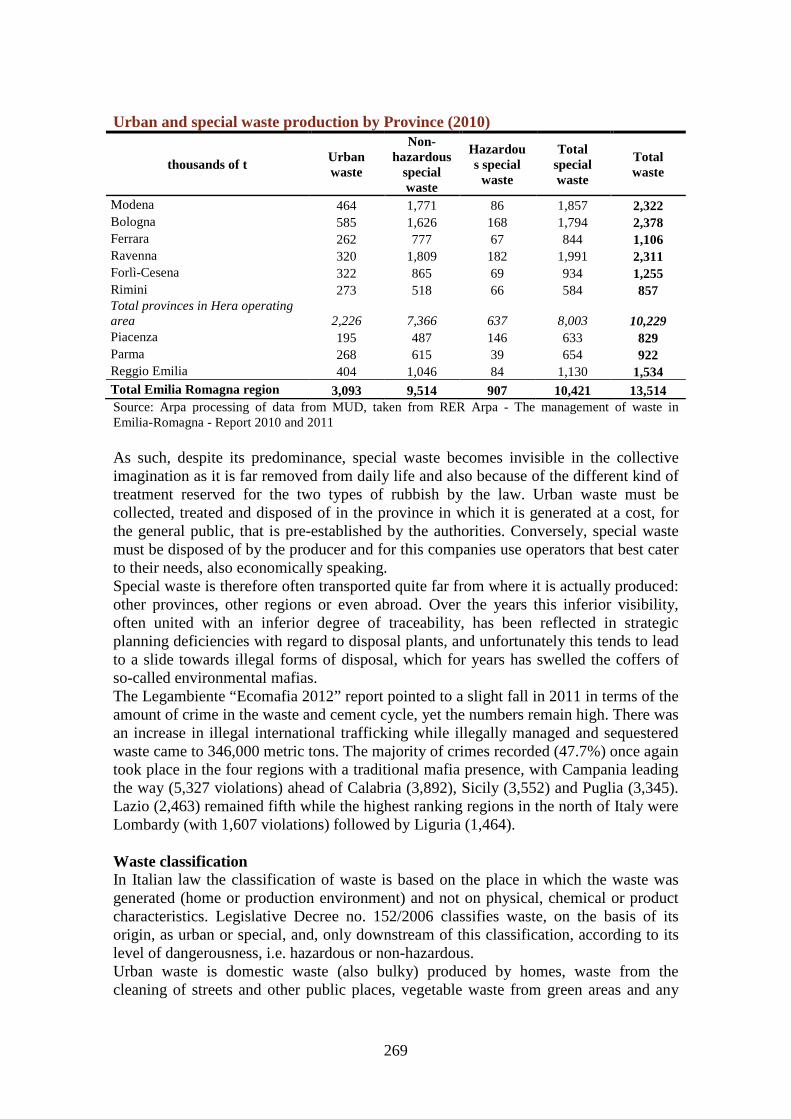
269
Urban and special waste production by Province (2010)
thousands of t Urban waste
Non-hazardous
special waste
Hazardous special
waste
Total special waste
Total waste
Modena 464 1,771 86 1,857 2,322 Bologna 585 1,626 168 1,794 2,378 Ferrara 262 777 67 844 1,106 Ravenna 320 1,809 182 1,991 2,311 Forlì-Cesena 322 865 69 934 1,255 Rimini 273 518 66 584 857 Total provinces in Hera operating area 2,226 7,366 637 8,003 10,229 Piacenza 195 487 146 633 829 Parma 268 615 39 654 922 Reggio Emilia 404 1,046 84 1,130 1,534 Total Emilia Romagna region 3,093 9,514 907 10,421 13,514 Source: Arpa processing of data from MUD, taken from RER Arpa - The management of waste in Emilia-Romagna - Report 2010 and 2011 As such, despite its predominance, special waste becomes invisible in the collective imagination as it is far removed from daily life and also because of the different kind of treatment reserved for the two types of rubbish by the law. Urban waste must be collected, treated and disposed of in the province in which it is generated at a cost, for the general public, that is pre-established by the authorities. Conversely, special waste must be disposed of by the producer and for this companies use operators that best cater to their needs, also economically speaking. Special waste is therefore often transported quite far from where it is actually produced: other provinces, other regions or even abroad. Over the years this inferior visibility, often united with an inferior degree of traceability, has been reflected in strategic planning deficiencies with regard to disposal plants, and unfortunately this tends to lead to a slide towards illegal forms of disposal, which for years has swelled the coffers of so-called environmental mafias. The Legambiente “Ecomafia 2012” report pointed to a slight fall in 2011 in terms of the amount of crime in the waste and cement cycle, yet the numbers remain high. There was an increase in illegal international trafficking while illegally managed and sequestered waste came to 346,000 metric tons. The majority of crimes recorded (47.7%) once again took place in the four regions with a traditional mafia presence, with Campania leading the way (5,327 violations) ahead of Calabria (3,892), Sicily (3,552) and Puglia (3,345). Lazio (2,463) remained fifth while the highest ranking regions in the north of Italy were Lombardy (with 1,607 violations) followed by Liguria (1,464). Waste classification In Italian law the classification of waste is based on the place in which the waste was generated (home or production environment) and not on physical, chemical or product characteristics. Legislative Decree no. 152/2006 classifies waste, on the basis of its origin, as urban or special, and, only downstream of this classification, according to its level of dangerousness, i.e. hazardous or non-hazardous. Urban waste is domestic waste (also bulky) produced by homes, waste from the cleaning of streets and other public places, vegetable waste from green areas and any
270
type of waste dumped or present in public areas, including beaches and riverbanks, whose production cannot be traced to a specific source. Also classed as urban waste is non-hazardous special waste originating in premises and places not used for dwelling, assimilated to urban waste in terms of quality and quantity by the Municipal Regulations (or supra-municipal authorities) on the basis of the general guidelines dictated by the State; this waste is special in terms of origin but, once assimilated, is managed (collected or disposed of) together with domestic urban waste and subject to levies or taxes. Special waste is waste from agricultural, construction, artisanal, industrial, sanitary, commercial and services activities, waste deriving from waste recovery and disposal activities, water treatment sludge, mining or decontamination. Waste is classified as hazardous or non-hazardous depending on the substances it contains. Hazardous urban waste is made up of domestic waste that contains pollutants or toxic substances in such measures that they have to be disposed of in special plants (e.g. medicines and batteries). Hazardous special waste is generated by production activities and contains the aforementioned pollutants or toxic substances. The line between urban waste and special waste is therefore established by the assimilation regulations defined by national law and applied at local level. Every municipality can apply the criteria for assimilating waste deriving from production, commercial and tertiary activities in a different way, acting in particular on quantitative thresholds. The more waste that is assimilated to urban waste, the less special waste is left to be managed by the private sector with the risk of inferior controls and traceability. In the areas managed by the Hera Group and Emilia-Romagna in general, there is a high level of assimilation: it is estimated that the waste managed as part of the public service comprises 50% waste of domestic origin and 50% waste of non-domestic origin, i.e. assimilated special waste. It is also estimated that there is around 1.5 million metric tons of special waste that could be assimilated for its characteristics (i.e. non-hazardous) but which is not assimilated because it is produced by a single production business in quantities above the established limit. Unlike in Italy, in Europe the classification of waste is more directly related to its level of dangerousness and the type of treatment it undergoes.
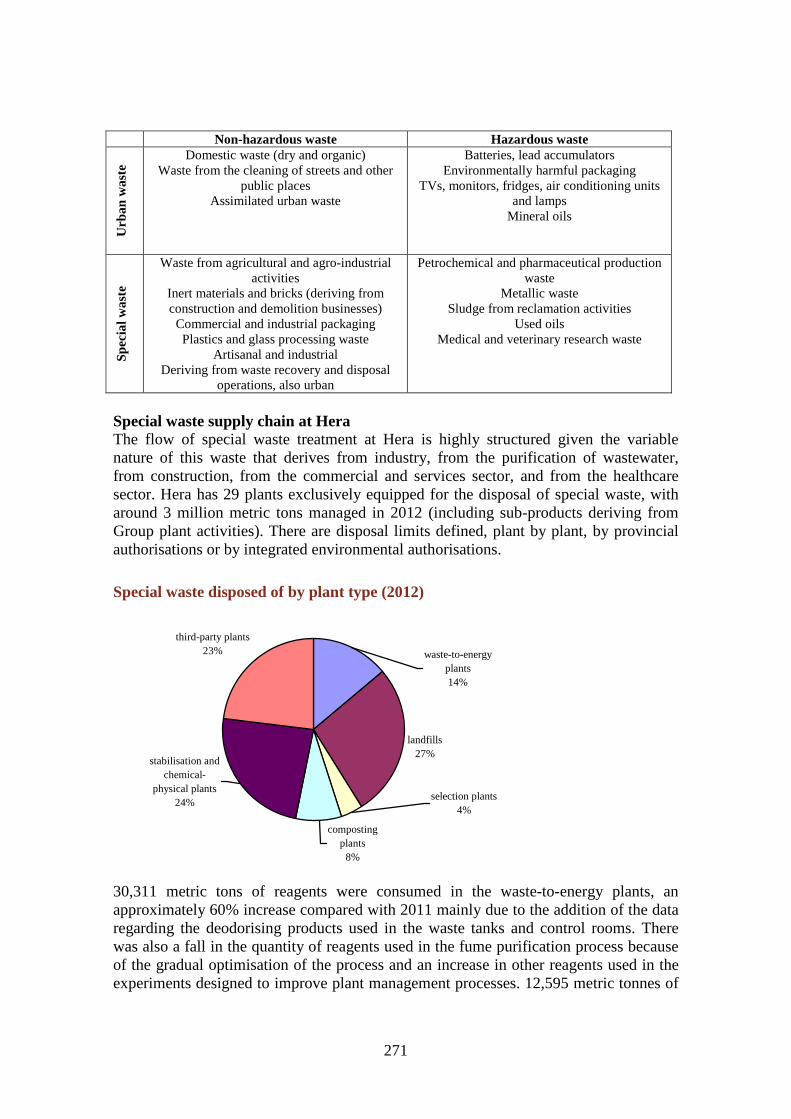
271
Non-hazardous waste Hazardous waste
Urb
an w
aste
Domestic waste (dry and organic) Waste from the cleaning of streets and other
public places Assimilated urban waste
Batteries, lead accumulators Environmentally harmful packaging
TVs, monitors, fridges, air conditioning units and lamps
Mineral oils
Spe
cial
was
te
Waste from agricultural and agro-industrial activities
Inert materials and bricks (deriving from construction and demolition businesses) Commercial and industrial packaging Plastics and glass processing waste
Artisanal and industrial Deriving from waste recovery and disposal
operations, also urban
Petrochemical and pharmaceutical production waste
Metallic waste Sludge from reclamation activities
Used oils Medical and veterinary research waste
Special waste supply chain at Hera The flow of special waste treatment at Hera is highly structured given the variable nature of this waste that derives from industry, from the purification of wastewater, from construction, from the commercial and services sector, and from the healthcare sector. Hera has 29 plants exclusively equipped for the disposal of special waste, with around 3 million metric tons managed in 2012 (including sub-products deriving from Group plant activities). There are disposal limits defined, plant by plant, by provincial authorisations or by integrated environmental authorisations.
Special waste disposed of by plant type (2012)
landfills27%
third-party plants23%
stabilisation and chemical-
physical plants24%
waste-to-energy plants14%
selection plants4%
composting plants8%
30,311 metric tons of reagents were consumed in the waste-to-energy plants, an approximately 60% increase compared with 2011 mainly due to the addition of the data regarding the deodorising products used in the waste tanks and control rooms. There was also a fall in the quantity of reagents used in the fume purification process because of the gradual optimisation of the process and an increase in other reagents used in the experiments designed to improve plant management processes. 12,595 metric tonnes of
272
chemical reagents were consumed in the stabilisation and chemical-physical treatment plants, 37.6% more than in 2011: this increase is mainly due to the consumption of the new “disidrat” plant.
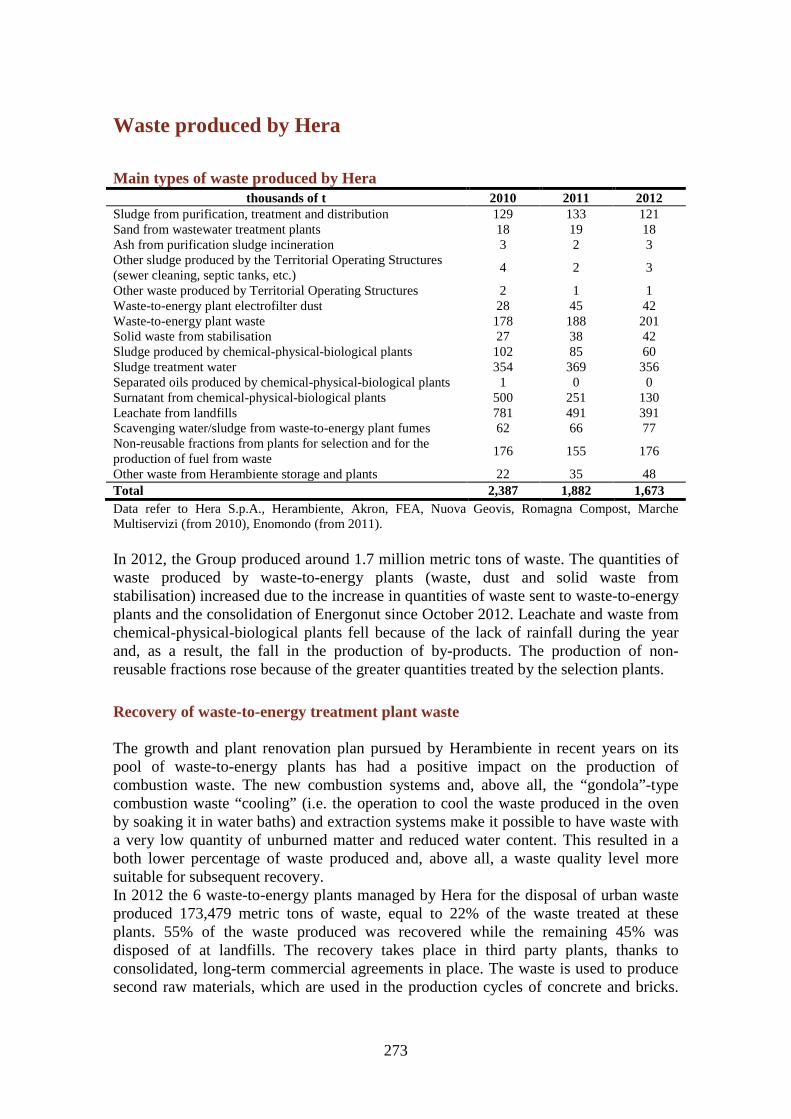
273
Waste produced by Hera
Main types of waste produced by Hera thousands of t 2010 2011 2012
Sludge from purification, treatment and distribution 129 133 121 Sand from wastewater treatment plants 18 19 18 Ash from purification sludge incineration 3 2 3 Other sludge produced by the Territorial Operating Structures (sewer cleaning, septic tanks, etc.)
4 2 3
Other waste produced by Territorial Operating Structures 2 1 1 Waste-to-energy plant electrofilter dust 28 45 42 Waste-to-energy plant waste 178 188 201 Solid waste from stabilisation 27 38 42 Sludge produced by chemical-physical-biological plants 102 85 60 Sludge treatment water 354 369 356 Separated oils produced by chemical-physical-biological plants 1 0 0 Surnatant from chemical-physical-biological plants 500 251 130 Leachate from landfills 781 491 391 Scavenging water/sludge from waste-to-energy plant fumes 62 66 77 Non-reusable fractions from plants for selection and for the production of fuel from waste
176 155 176
Other waste from Herambiente storage and plants 22 35 48 Total 2,387 1,882 1,673 Data refer to Hera S.p.A., Herambiente, Akron, FEA, Nuova Geovis, Romagna Compost, Marche Multiservizi (from 2010), Enomondo (from 2011). In 2012, the Group produced around 1.7 million metric tons of waste. The quantities of waste produced by waste-to-energy plants (waste, dust and solid waste from stabilisation) increased due to the increase in quantities of waste sent to waste-to-energy plants and the consolidation of Energonut since October 2012. Leachate and waste from chemical-physical-biological plants fell because of the lack of rainfall during the year and, as a result, the fall in the production of by-products. The production of non-reusable fractions rose because of the greater quantities treated by the selection plants.
Recovery of waste-to-energy treatment plant waste The growth and plant renovation plan pursued by Herambiente in recent years on its pool of waste-to-energy plants has had a positive impact on the production of combustion waste. The new combustion systems and, above all, the “gondola”-type combustion waste “cooling” (i.e. the operation to cool the waste produced in the oven by soaking it in water baths) and extraction systems make it possible to have waste with a very low quantity of unburned matter and reduced water content. This resulted in a both lower percentage of waste produced and, above all, a waste quality level more suitable for subsequent recovery. In 2012 the 6 waste-to-energy plants managed by Hera for the disposal of urban waste produced 173,479 metric tons of waste, equal to 22% of the waste treated at these plants. 55% of the waste produced was recovered while the remaining 45% was disposed of at landfills. The recovery takes place in third party plants, thanks to consolidated, long-term commercial agreements in place. The waste is used to produce second raw materials, which are used in the production cycles of concrete and bricks.

274
During the process, ferrous and non-ferrous metals are recovered and then reused in the metallurgical industry.
Biodiversity
From the 1970’s onwards, with the spread of “environmental culture” and the gradual impoverishment of the planet’s natural resources, we realised that we needed to protect the ecosystem in a more effective way. With this in mind the biggest global institutions have signed agreements to reduce the environmental impact deriving from human activities. One of the key issues of these agreements is the concept of biodiversity and the reasons behind the gradual reduction in the variety of animal and vegetable species. In 1992 all member states of the EC signed the Convention on Biological Diversity in Rio, recognising the in situ conservation of ecosystems and natural habitats as a priority to pursue, and setting themselves the goal of “anticipating, preventing and attacking the causes of significant reduction or loss of biological diversity at source because of its intrinsic value and because of its ecological, genetic, social, economic, scientific, educational, cultural, recreational and aesthetic value”. As tangible proof of the commitments undertaken, the EU issued two directives, Directive no. 409/79, adopted in April 1979, regarding the conservation of wild birds (the “Birds Directive”) and Council Directive no. 43/92, adopted in May 1992, regarding the conservation of natural habitats and wild flora and fauna (“Habitats Directive”). These two Directives constitute the legislative basis for the protection and conservation of habitats and wild species in Europe. Another of the key initiatives adopted was the creation of a consistent ecological network of protected areas in the European Union, known as NATURA 2000. The natural areas protected are portions of land or water areas where alterations generated by mankind are very low or nil. These areas are subject to special projection and management regimes, as they are intended for the conservation of the biological diversity, cultural heritage and natural resources. In the province of Ferrara, the two largest water collection plants (Pontelagoscuro and Stellata, on the Po River) are located within the Special Protection Area called “Fiume Po da Stellata a Mesola e Cavo napoleonico”. In the province of Ravenna, the Marina di Ravenna treatment plant is located within the EU Conservation Area “Piallassa Piombone”, while the Ravenna city treatment plant disposes of the wastewater treated within the SPA “Piallassa Baiona”. Within these two plants, in order to protect biodiversity, Hera carries out acute toxicity tests. In the period 2005-2012, these tests demonstrated that the water disposed of was not toxic. Hera’s waste disposal plants, which are being upgraded and newly built, are subject to the Environmental Impact Assessment (EIA) procedure. For plants located near protected areas (generally within 5 km distance and when specific conditions exist that may result in even a limited impact), Hera performs a Incidence Assessment, which is a sort of evaluation of specific environmental impact for the peculiarities and natural abundance in the protected areas. The Councillor for Cultural Heritage, the Parks Department and the Region of Emilia-Romagna analyse these assessments, prescribing
275
mitigation measures aimed at containing any impact and protecting the biodiversity of the indigenous plant and animal species (i.e. planting of species of trees and bushes, adoption of measures to avoid attracting animals which are excessively sythropic or opportunistically trophic). In 2012, impact evaluations were carried out as part of projects for the environmental renovation of the Civitella landfill plant and the plant area located at km 3.8 of the SS Romea Nord in Ravenna, the project to expand the landfill for non-hazardous waste in Ravenna, and the project to develop a waste-to-energy plant in Florence. These studies showed that the works being developed and under management were “low impact”. In some cases there were however indications to follow at the worksite in order to reduce the impact on the pre-existing trophic environment. For example, in some cases the plan of action for the development of the work was revised in order to reduce noisier activities (e.g. excavations and the movement of earth) in the spring months so as not to interfere with the mating seasons of the animal species present and in particular the nest-building of protected birds. These evaluations analyse the possible interference of the planned work on the environment and, in particular, the specific biotic (flora, fauna and ecosystems) and abiotic components (air, soil, subsoil, surface water and underground water) in the protected area; also examined are aspects related to ecological connections, i.e. the presence of waterways, rows of trees, hedges etc., that make it possible to install ecological networks between the most natural ecosystems and the plant department subject to the work. The projects to expand/develop landfills or other waste treatment plants contain a specific section dedicated to environmental renovation, renaturalisation and the visual mitigation of the areas surrounding the intervention location, which describe the specific actions aimed at creating and strengthening ecological networks in a manner consistent with existing networks.
276
Appendices
Glossary
Inhabitant equivalent The concept of inhabitant equivalent was introduced to enable the comparison of various types of sewage (urban, household, industrial) in terms of organic pollution. Using conversion factors, an estimation is made of how many inhabitants would be required to produce (with normal domestic sewage) the same amount of pollution. Generally, one inhabitant equivalent corresponds to 60g of BOD5 per day. Authority for Electrical Energy and Gas (AEEG) Formally independent authority established by Law 481/1995 which has the goal of promoting the development of competitive markets in the electricity and natural gas sectors, mainly through the regulation of rates, access to the networks, the functioning of the market and the protection of end users. In 2012 the AEEG was assigned with functions in the area of the quality, rates and costs of integrated water services. Water and Waste Regulatory Authorities (ATO) In accordance with Law no. 36/1994, the ATO water and waste regulatory authorities define the local level of organisation of the integrated water services in order to overcome the fragmentation of management and to reach suitable sizes for the areas managed. Ammonia nitrogen The term ammonia nitrogen (NH4) refers to the concentration of ammonia ions in water. It provides an index of biodegradation of nitrogenous organic substances. It is expressed in mg/l. Biogas Term used to refer to a mixture of types of gas (mainly methane) produced by natural bacterial fermentation (in anaerobic conditions, i.e. in the absence of oxygen) of organic residues from waste. BOD The term BOD (biochemical oxygen demand) is used to define the amount of oxygen consumed during a specific time period (5 days for BOD5), at a given temperature, to biodegrade the organic matter present in the water via bacterial action (uptake of oxygen by micro-organisms). High biochemical oxygen demand indicates intense biodegradation of organic matter, and may highlight the presence of organic pollution. It is therefore an indirect measure of pollution levels. Its value is expressed in mg/l. Bonds Stock loan issued by a company. These are long-term loans: investors are guaranteed the right to annual interest payments at a fixed rate, with return of the capital on a set date. Services Charter The Services Charter is the document that any entity that supplies a public service uses to outline its performance standards, declaring its goals and recognising specific rights to the public/users/consumers, and therefore to pledge to respect specific levels of quality and quantity, with the intention of monitoring and improving its supply and management methods. It was established by law 273/95, which stated that all suppliers of public services must adopt their own Services Charters on the basis of the general guidelines issued for specific sectors. CCGT A Combined Cycle Gas Turbine is an electricity generation plant that functions thanks to the combined presence of a gas turbine and a steam turbine. CCGT technology is one of the most advanced available today and guarantees elevated performances and greater environmental compatibility. Green certificates (GC) GCs offer incentives for the production of electricity from renewable sources. As established by law 244/07, GCs are issued by the Energy Services Manager (ESM) and regard the production of electricity from renewable sources the previous year or the expected production levels during the current year or the following year. They represent 1 MWh of electricity. In 2012, all producers or importers must introduce into the grid a 7.55% quota of electricity produced from plants fuelled by renewable sources: this quota gradually falls as of 2013, dropping to zero by 2015. It is also possible to meet this obligation by purchasing GCs from other entities. RECO certification RECO certification is issued by the Energy Services Manager (ESM) and guarantees the renewable origin of the sources used for the production of electricity. Every RECO certificate is equal to 1 MWh and is
277
issued on the basis of the electricity introduced into the network. RECO certificates can be transferred by producers to sales companies. CIPE Interministerial Committee for Economic Planning, responsible for laying down the framework for economic and financial policies. COD The term COD (chemical oxygen demand) refers to the amount of oxygen required for the complete oxidation of organic and inorganic compounds present in a water sample. Thus, this is an index for measuring the degree of pollution, mainly organic, in the water from substances which can be oxidized. It is expressed in mg/l. Code of Ethics Document setting forth a number of principles and specifying conduct, commitments and ethical responsibilities to be put into practice by members of the Board of Directors, staff and collaborators of the company. The Code may be described as a “Constitutional Charter” of a company, a charter of moral rights and duties that establishes the ethical and social responsibilities of all those who work within the organisation. Cogeneration Simultaneous production of electricity and thermal energy (in the form of steam). Composting Aerobic treatment (in the presence of oxygen) of biodegradable organic waste, whose final product is compost, a soil improver, which can be used in vegetable cultivation. Social cooperatives Cooperatives regulated by Law no. 381 of 8 November 1991. This law breaks these cooperatives down into two types: - type A = cooperatives providing social, health and educational services; - type B = cooperatives operational within the production and labour sectors which have, among their members, a level of at least 30% who are differently-abled or otherwise face hardship. Corporate governance The processes, policies, habitual practices, laws and institutions which influence the manner in which a company is managed and controlled. Corporate Governance also covers the relations between the various players involved (stakeholders, those who have a vested interest of any type in the company). Warning A warning is a deed issued by the Public Administration and/or supervisory bodies in cases where, in exercising their inspection and control activities, they detect existing or possible future deviations from regulations and provisions of national and regional law: the warning sets a term by which breaches must be eliminated. Dispatching (electricity sector) Activities aimed at providing instructions for the use and the coordinated operation of production plants, the transmission grid and auxiliary services (Bersani Decree). Dispatching (gas sector) Activities aimed at providing instructions for the use and the coordinated operation of extraction and storage plants, the transport and distribution network and auxiliary services (Letta Decree). EMAS EU Regulation no. 761/2001 which provides for the adoption by business concerns of environmental management systems based on policies, programmes, procedures and objectives aimed at improving the environment, and the publication of an Environmental Statement, to be validated by the Ecoaudit Committee. Primary energy Primary energy is the energy potential presented by energy carriers in their natural form, for example oil, natural gas, coal, natural uranium, water and other renewable energy sources. In the majority of the cases, the primary energy must be transformed into secondary energy in electricity power stations, refineries, etc. Focus group A surveying technique based on discussions between members of a group of persons. The main aim is to conduct an in-depth study of a specific issue in relation to given targets. Interaction between focus group members provides the basis for the surveying action. Ethical funds
278
This term is used to describe mutual investment funds whose choice of shares, bonds and government securities is inspired by ethical selection criteria. These parameters are defined as exclusion/inclusion. Renewable energy sources Renewable energy sources are: wind, solar, geothermal, wave motion, tidal, hydraulic, biomass, landfill gas, treatment process gas and biogas. Biomass means the biodegradable part of products, waste and residues generated by farming (including vegetable and animal substances), forestry and associated industries, as well as the biodegradable part of industrial and urban waste. Greenhouse gas These gases are transparent with respect to solar radiation, and prevent the dispersion of heat from the Earth, thus leading to the overheating of the atmosphere. Over and above greenhouse gases of natural origin, the main greenhouse gases produced by mankind are carbon dioxide, methane, chlorofluorocarbons and nitric oxides. Geothermics The science dedicated to problems relating to the internal energy of the Earth and to the practical applications of this energy source. IAFR IAFR (“Plant Fuelled by Renewable Energies”) qualification is a prerequisite for obtaining some of the most important incentives for the production of electricity from renewable sources (issuing of Green Certificates and access to the feed-in tariff). The Energy Services Manager has the task of qualifying production plants fuelled by renewable sources once possession of the necessary requisites has been verified. IAFR qualification can be attained both by plants that are already operational and plants that are at the planning stage at the time of the request. KPI Key Performance Indicators are specific indicators selected on the basis of corporate information needs They are used to carry out corporate monitoring. KPIs may be financial, production-oriented, commercial, environmental or social in nature, or may regard multiple aspects. Mobility Management Refers to an internal corporate department in charge of managing staff commuting. Nm3
Normal cubic metre, volume of gas at 0°C and 0.1 Mpa OHSAS 18001: 2007 The OHSAS 18001 (Occupational Health & Safety Assessment Series) standard is an internationally recognised benchmark for the certification of workplace health and safety management systems. Nitric oxides Nitric oxides (mainly NO and NO2), gases produced by the combustion of fossil materials. Nitric oxides contribute to the formation of ozone in the lower atmosphere and acid rain. PCB (polychlorinated biphenyls) Highly toxic organic compounds used in a wide range of applications e.g. as fluids for capacitors and transformers. When managing and disposing of them careful attention must be paid to ensure they are not released into the environment, in accordance with laws in force. Leachate Substance deriving from the filtration of water and other liquid mixtures through waste. PM10 Particulate matter, or dust, of a diameter of less than 10 microns from various sources (natural or generated by mankind). PM10 includes a variety of solid or liquid particles of differing characteristics. Given their smallness, they tend to remain suspended in the air. Heat pump This is a device capable of transferring heat from a body at a lower temperature to a body at a higher temperature, using electricity. Waste Legislative Decree no. 22/1997 defines waste as “any substance or object which the holder disposes of or has decided or is required to dispose of”. This decree classified waste based on its origin, as urban or industrial, and, according to the level of dangerousness, as hazardous or non-hazardous. SA8000 International certification standard regarding respect for human rights, respect for workers’ rights, safeguards against exploitation of minors, and guarantees with respect to workplace health and safety conditions.
279
TSS The term TSS (total suspended solids), which are the cause of the turbidity of liquids, means the total amount of suspended solids and filterable solids. This represents the total amount of substances present in the sample following drying, at 105°C. Its value is expressed in mg/l. Stakeholders Stakeholders are persons with vested interests. They may or may not belong to the company of which they are a stakeholder, and they may have a bearing on the decisions, conduct or success of a company. Subsidence Sinking of the soil caused by the lowering of the underground water table, in turn caused by withdrawal of groundwater at a faster rate than the natural recharging time. Sustainable development “Development that meets the needs of the present without compromising the ability of future generations to meet their own needs” (Bruntland Report, World Commission for Economic Development, 1987). District Heating Transfer over distances of heat from thermoelectric power stations, cogeneration plants or waste-to-energy plants through an energy vector (hot water, superheated water, steam). Toe Tonnes of oil equivalent. Conventional unit of measurement of sources of energy equivalent to 10,000 Mcal (= the energy obtained from combustion of a tonne of oil). Waste-to-energy plant Plants using waste as a fuel to produce heat or energy. Turboexpander Machine that transforms energy of a given kind (e.g. potential energy) into mechanical energy, made available for use via a rotating axis. The resulting energy may in turn be used for the production of other energy (e.g. by coupling an alternator to the turbine to enable the alternator to exploit the mechanical energy to produce electricity). UNI EN ISO 9001:2008 International technical standard for the certification of quality management systems. UNI EN ISO 14001: 2004 International technical standard for the certification of environmental management systems.
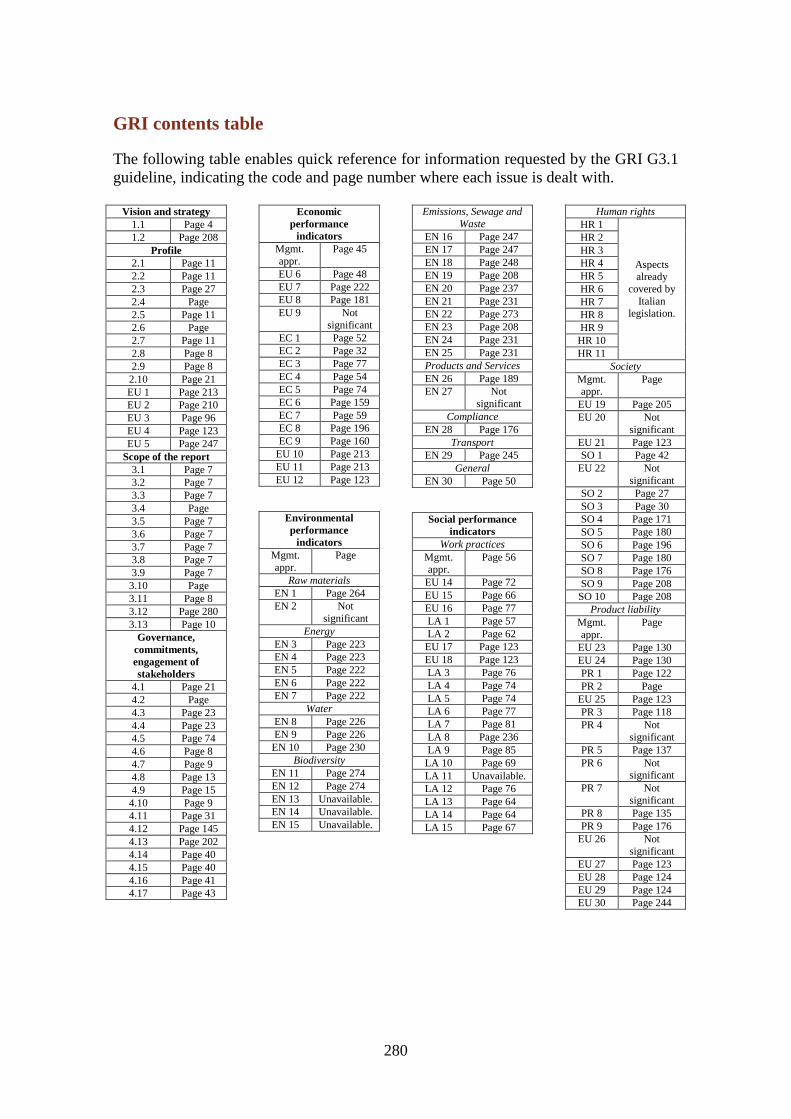
280
GRI contents table
The following table enables quick reference for information requested by the GRI G3.1 guideline, indicating the code and page number where each issue is dealt with.
Vision and strategy 1.1 Page 4 1.2 Page 208
Profile 2.1 Page 11 2.2 Page 11 2.3 Page 27 2.4 Page 2.5 Page 11 2.6 Page 2.7 Page 11 2.8 Page 8 2.9 Page 8 2.10 Page 21 EU 1 Page 213 EU 2 Page 210 EU 3 Page 96 EU 4 Page 123 EU 5 Page 247
Scope of the report 3.1 Page 7 3.2 Page 7 3.3 Page 7 3.4 Page 3.5 Page 7 3.6 Page 7 3.7 Page 7 3.8 Page 7 3.9 Page 7 3.10 Page 3.11 Page 8 3.12 Page 280 3.13 Page 10
Governance, commitments, engagement of stakeholders
4.1 Page 21 4.2 Page 4.3 Page 23 4.4 Page 23 4.5 Page 74 4.6 Page 8 4.7 Page 9 4.8 Page 13 4.9 Page 15 4.10 Page 9 4.11 Page 31 4.12 Page 145 4.13 Page 202 4.14 Page 40 4.15 Page 40 4.16 Page 41 4.17 Page 43
Economic performance
indicators Mgmt. appr.
Page 45
EU 6 Page 48 EU 7 Page 222 EU 8 Page 181 EU 9 Not
significant EC 1 Page 52 EC 2 Page 32 EC 3 Page 77 EC 4 Page 54 EC 5 Page 74 EC 6 Page 159 EC 7 Page 59 EC 8 Page 196 EC 9 Page 160
EU 10 Page 213 EU 11 Page 213 EU 12 Page 123
Environmental performance
indicators Mgmt. appr.
Page
Raw materials EN 1 Page 264 EN 2 Not
significant Energy
EN 3 Page 223 EN 4 Page 223 EN 5 Page 222 EN 6 Page 222 EN 7 Page 222
Water EN 8 Page 226 EN 9 Page 226 EN 10 Page 230
Biodiversity EN 11 Page 274 EN 12 Page 274 EN 13 Unavailable. EN 14 Unavailable. EN 15 Unavailable.
Emissions, Sewage and Waste
EN 16 Page 247 EN 17 Page 247 EN 18 Page 248 EN 19 Page 208 EN 20 Page 237 EN 21 Page 231 EN 22 Page 273 EN 23 Page 208 EN 24 Page 231 EN 25 Page 231 Products and Services EN 26 Page 189 EN 27 Not
significant Compliance
EN 28 Page 176 Transport
EN 29 Page 245 General
EN 30 Page 50
Social performance indicators
Work practices Mgmt. appr.
Page 56
EU 14 Page 72 EU 15 Page 66 EU 16 Page 77 LA 1 Page 57 LA 2 Page 62 EU 17 Page 123 EU 18 Page 123 LA 3 Page 76 LA 4 Page 74 LA 5 Page 74 LA 6 Page 77 LA 7 Page 81 LA 8 Page 236 LA 9 Page 85 LA 10 Page 69 LA 11 Unavailable. LA 12 Page 76 LA 13 Page 64 LA 14 Page 64 LA 15 Page 67
Human rights HR 1
Aspects already
covered by Italian
legislation.
HR 2 HR 3 HR 4 HR 5 HR 6 HR 7 HR 8 HR 9 HR 10 HR 11
Society Mgmt. appr.
Page
EU 19 Page 205 EU 20 Not
significant EU 21 Page 123 SO 1 Page 42
EU 22 Not significant
SO 2 Page 27 SO 3 Page 30 SO 4 Page 171 SO 5 Page 180 SO 6 Page 196 SO 7 Page 180 SO 8 Page 176 SO 9 Page 208 SO 10 Page 208
Product liability Mgmt. appr.
Page
EU 23 Page 130 EU 24 Page 130 PR 1 Page 122 PR 2 Page
EU 25 Page 123 PR 3 Page 118 PR 4 Not
significant PR 5 Page 137 PR 6 Not
significant PR 7 Not
significant PR 8 Page 135 PR 9 Page 176
EU 26 Not significant
EU 27 Page 123 EU 28 Page 124 EU 29 Page 124 EU 30 Page 244