Embed Size (px)
Citation preview

your state-wide property research guide suburb by suburb
REIQ
QU
EENS
LAN
D M
AR
KET
MO
NIT
OR
ISS
UE 28
SEP QTR 2015
>p2
QMM STATE-WIDE COMMENTARY
Proudly supported by REIQ member
Linda DeBello
STEADY GROWTH CONTINUES IN SEQ The Brisbane local government area (LGA) median house price has pushed to a new high of $615,000 as consistent steady growth continues.
While predictions have been prolific that the slowing conditions in Sydney would flow through to Brisbane, the Queensland capital city has clearly defied predictions, helped by southern investors eyeing off bargains in the sunshine state.
According to data from the Australian Bureau of Statistics, investor activity increased 1.4 per cent in Queensland over the month of September.
Regional centres once reliant on the mining industry are still stabilising, with the bottom of the market likely having now been met in most areas.
Ongoing employment issues are the largest hindrance on these regions entering a recovery phase.
In light of this, a number of local councils are implementing initiatives that will diversify their region’s economy in an effort to create new industries and new jobs.
2 QUEENSLAND MARKET MONITOR
REIQ RESEARCH EXPLANATORY NOTESSALES MARKET DATA
All figures for the most recent quarterly and yearly periods are preliminary only and subject to further revision as additional sales records become available (see Research Methodology online at reiq.com).
As of the June quarter 2013, all sales data includes "Recent Sales" as advised by real estate agents as well as official records as advised by DNRM. As such comparisons with figures published prior to the June quarter 2013 should be done with caution.
A median sale price is derived by arranging a set of sale prices from lowest to highest and then selecting the middle value within this set (ie the 50th percentile, where half of recorded sales were less and half were higher than the median). Only suburbs and regions to record sufficient sales numbers
at the time of reporting are published.
N/ADue to insufficient sales numbers (as at the time of data extraction) no median sale price has been calculated
(LGA) Local Government Area
Brisbane (SD)
Brisbane Statistical Division comprising the LGA’s of Brisbane City, Ipswich City, Logan City, Moreton Bay Regional and Redland City
Sunshine Coast (SD)
Sunshine Coast Region comprising the LGA's of Sunshine Coast Regional and Noosa.
# Figures based upon the new council boundaries
^Indicates acreage sales only (with land size greater than 2400m2). All other data is based upon sales with a land size of less than 2400 m2
~Median price changes influenced by varying quality of stock sold
*Median price changes influenced by varying quantities of new properties sold
fMedian price changes influenced by varying quantities of waterfront properties sold
tMedians affected by varying quantities of townhouses sold
Y Median affected by high yielding property sales
1
Median price changes influenced by the varying volumes of sales between the Mainland and Bay Islands areas
ON THE MARKET INDICATORS
At the time of publication, latest information available was for the 12 months ending the month prior to the current period.
"Days on Market" is calculated as the average number of days it has taken to sell those properties sold by private treaty sale during the 12 month period. The calculation excludes auction listings and listings where an asking price is not advertised. The days on market calculation uses the contract date on the property compared with the first advertised date.
"Vendor Discount" is the average difference between the contract price on a property and the first advertised price. The figure is expressed as a percentage and is an average of all private treaty sales which sold for less than their initial asking price during the last 12 months. Auction listings, listings without an advertised asking price and properties sold at or above list price are excluded from the calculation.
"Total Listings" is the total unique number of properties that have been advertised for sale and captured by RP Data over the 12 month period. To be included in the count, the listings have to be matched to an actual address.
"% Stock on Market" is the percentage of dwellings within the suburb or local government area that have been listed for sale over the past year.
Source: REIQ, data supplied by CoreLogic RP Data (www.corelogic.com.au)
PRICE POINT GRAPHS
All data contained within these graphs represent preliminary sales numbers and are subject to revision as additional sales records become available.
The data excludes any recent sales transactions where the contract sale price was not disclosed.
The intention of these graphs is to gauge trends in sales activity between periods in lieu of actual final sales results.Source: REIQ, data obtained from CoreLogic RPData
Data report date: 11 Nov 2015 Published date: 14 Dec 2015
GROSS RENTAL YIELDS
House yields are based upon REIQ median house prices and RTA median weekly rent for three bedroom houses.
Unit yields are based upon REIQ median unit & townhouse sale prices and RTA median weekly rent for two bedroom units and townhouses.
VACANCY RATES
All figures are based upon all residential rentals as at the end of each quarterly period, as submitted by REIQ accredited agents.
Only LGAs with a minimum sample size of 10 per cent (based upon number of bonds held by the RTA) are reported on.
N/ADue to insufficient information received no vacancy rate has been calculated
Source: REIQ Residential Rental Survey
RENTAL MARKET DATA
All median weekly rents are published on a postcode basis, as calculated by the Residential Tenancies Authority, where sufficient data is available.
Caution should be exercised when interpreting any median rental price data based upon a relatively small number of new bond lodgements.
Figures for the new LGA's available for the current quarter only.
LListed localities (or suburbs) represent one of potentially several that fall within that postcode.
N.A.Due to insufficient new bond lodgements, no median rental price has been calculated
Source: Residential Tenancies Authority, Rental Bond lodgements (www.rta.qld.gov.au)
3
STATE-WIDE SUMMARY
SEPTEMBER QUARTER 2015
FALLING
STABILISINGRECOVERING
RISING
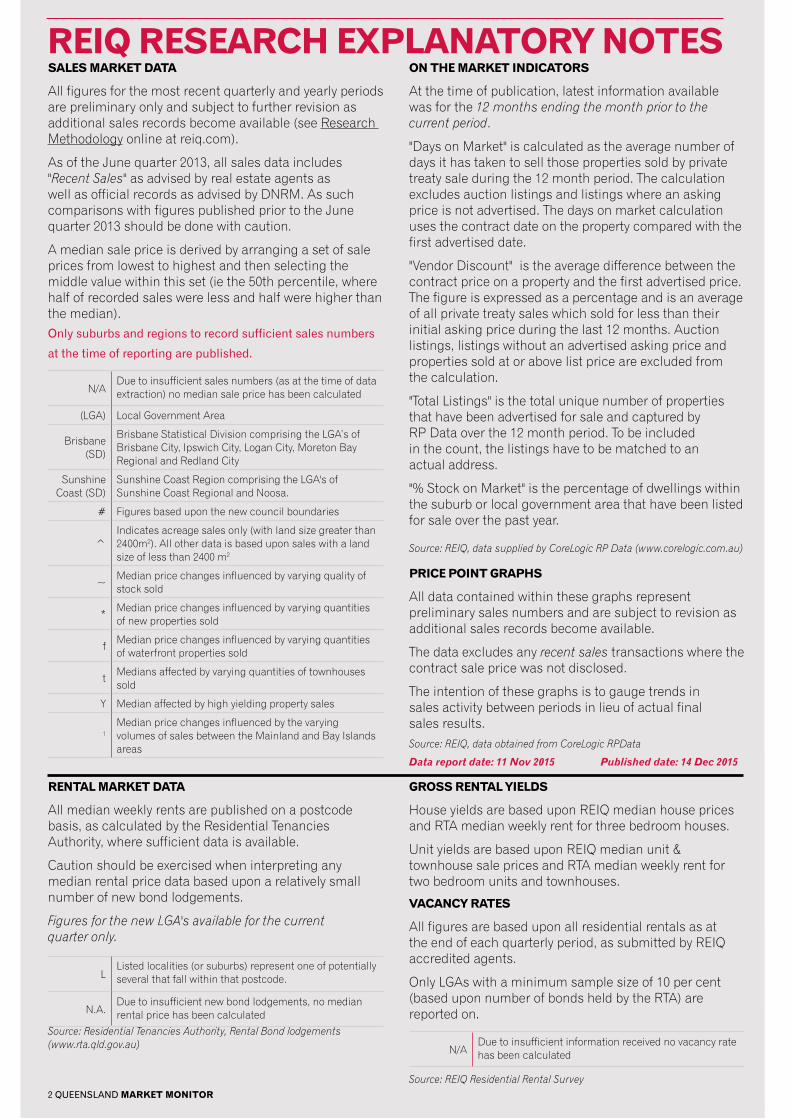
BRISBANE HOUSE MARKETSSeptember Quarter 2015
Source: REIQ
Brisbane↑ Moreton Bay
↑ LoganRedlandIpswich
FALLING
STABILISINGRECOVERING
RISING
QUEENSLAND HOUSE MARKETSSeptember Quarter 2015
Source: REIQ
Brisbane SDCairns
Gold CoastSunsine Coast
Fraser Coast
MackayBundaberg Gladstone
Rockhampton Townsville
↑ Toowoomba
The Real Estate Institute of Queensland Ltd. Copyright 2014 21 Turbo Drive, Coorparoo, PO Box 1555, Coorparoo DC Q 4151Ph: (07) 3249 7347 Fax: (07) 3249 6211 Email: [email protected]
3 QUEENSLAND MARKET MONITOR
Queensland market update 1
REIQ Explanatory notes 2
Brisbane market updates
Brisbane City 6
Greater Brisbane 11
Regional market updates
Gold Coast 16
Toowoomba 19
Sunshine Coast 21
Fraser Coast 23
Bundaberg 25
Gladstone 27
Rockhampton 28
Mackay 30
Townsville 32
Cairns 34
Other Regional 36
On The Market Indicators 37
Total Listings
% Stock on Market
Average Vendor Discount
Average Days on Market
Rental Market Indicators 39
Gross rental yields
Residential vacancy rates
TABLE OF CONTENTS
REIQ
The tourism centres showed significant improvement to house sales markets
STATE-WIDE SUMMARY CONTINUED
HOUSE MARKET
Over the September quarter, the Brisbane house market led the way, with preliminary house sales reaching levels not seen in more than five years. New listings helped the market maintain equilibrium, fostering sustainable property price growth.
Sales activity was also up across the southeast and the tourism centres, with Ipswich the stand-out performer. Ipswich also recorded the highest quarterly increase for the Greater Brisbane region with the median house price lifting 1.6 per cent to $320,000.
The tourism centres also continued to improve, with the Gold Coast's median house price recording the highest quarterly increase of all the major centres.
Cairns performed well over the quarter, recording a new median house price of $400,000, up 2.6 per cent. With house sales activity and listings up, the state’s far north tourism destination moved into stronger market conditions.
After easing sales activity over the first half of 2015, Toowoomba house sales activity bounced back, up 13 per cent over the quarter. Following a strong 2014, local agents say Toowoomba is likely to stick to the established long-term trend of conservative yet consistent property price growth.
On the Fraser Coast, sales market conditions remained steady with little change.
Average days on market and average vendor discounting remained relatively unchanged, while listings increased slightly heading into spring.
In other regional centres, market conditions remained weak, although, September quarter data shows Gladstone may be turning a corner.
The major east coast cities of Rockhampton and Townsville, along with Bundaberg also recorded relatively stable house sales activity over the quarter, however improvements in days on market and vendor discounting have yet to be seen.

4 QUEENSLAND MARKET MONITOR
STATE-WIDE SUMMARY
HOUSES (<2400) UNITS & TOWNHOUSES VACANT LAND (<2400)
LGA MEDIAN SALE PRICE
QTRLY CHANGE
SALES ACTIVITY CHANGE
MEDIAN SALE PRICE
QTRLY CHANGE
SALES ACTIVITY CHANGE
MEDIAN SALE PRICE
QTRLY CHANGE
SALES ACTIVITY CHANGE
GREATER BRISBANE
BRISBANE SD $480,000 0.2% 5% $397,500 1.9% 7% $207,750 -3.3% 4%
BRISBANE $615,000 0.8% 5% $430,000 1.2% 13% $342,500 0.4% 25%
IPSWICH $320,000 1.6% 12% $258,000 3.2% 15% $176,250 0.2% 18%
LOGAN $359,000 0.4% 5% $238,000 3.9% -15% $179,870 -0.8% -18%
MORETON BAY $406,000 1.2% 3% $330,000 3.9% -6% $240,000 1.9% -8%
REDLAND $485,000 1.0% 2% $390,000 6.1% ~ t -1% $28,000 -88.8% * b 16%
TOURISM CENTRES
GOLD COAST $545,000 3.8% 6% $345,000 -1.4% 27% $240,000 0.0% 9%
SUNSHINE COAST SD $496,500 0.3% 5% $366,500 -0.9% 2% $257,000 3.8% 4%
SUNSHINE COAST $492,500 0.5% 6% $358,000 -0.6% -3% $257,000 4.7% ~ -1%
NOOSA $520,000 -3.7% ~ -5% $434,000 3.2% 23% $310,000 N/A * f 67%"
FRASER COAST $300,000 0.2% 0% $216,250 -15.9% ~ f -13% $151,000 -8.5% ~ 36%"
CAIRNS $400,000 2.6% 12% $225,000 2.5% 10% $192,500 -3.5% ~ -22%
REGIONAL CENTRES
BUNDABERG $269,000 -2.6% 0% $271,000 27.8% ~ -35%" $142,500 0.4% 8%
GLADSTONE $342,000 -9.4% ~ -5% N/A N/A -52%" N/A N/A -44%"
MACKAY $345,000 -2.8% 9% $227,500 -18.8% ~ -29%" $156,000 -25.0% ~ 9%
ROCKHAMPTON $275,000 -7.4% ~ -5% $347,500 N/A 14%" $154,500 -2.8% 21%"
TOOWOOMBA $353,000 0.6% 13% $310,000 10.7% * t 23% $170,800 -7.2% ~ * 23%
TOWNSVILLE $342,000 0.3% -1% $250,000 -19.5% ~ -3% $150,000 -8.5% 57%
ON THE MARKET" HOUSES (ALL) UNITS (ALL)
LGASTOCK
ON MARKET
DAYS ON MARKET
VENDOR DISCOUNT
STOCK ON
MARKET
DAYS ON MARKET
VENDOR DISCOUNT
GREATER BRISBANE
BRISBANE SD 7.2% 68 -5.6% 7.6% 78 -5.3%
BRISBANE 6.6% 59 -5.6% 6.9% 69 -4.8%
IPSWICH 7.9% 84 -6.6% 9.7% 117 -7.4%LOGAN 7.7% 75 -5.4% 10.7% 93 -6.3%MORETON BAY 7.6% 73 -5.3% 9.3% 104 -6.1%REDLAND 8.5% 75 -5.7% 9.8% 91 -5.2%TOURISM CENTRESGOLD COAST 8.3% 72 -5.6% 9.7% 93 -6.1%SUNSHINE COAST SD 9.4% 88 -5.8% 10.1% 106 -6.3%SUNSHINE COAST 9.2% 85 -5.6% 10.1% 103 -6.2%NOOSA 10.5% 104 -6.5% 10.4% 116 -6.9%FRASER COAST 10.1% 110 -7.7% 13.5% 111 -6.3%CAIRNS 7.7% 67 -6.4% 9.1% 87 -7.1%REGIONAL QLDBUNDABERG 8.8% 107 -8.1% 10.8% 140 -8.2%GLADSTONE 7.3% 100 -9.4% 6.7% 121 -11.8%MACKAY 6.9% 110 -11.4% 7.5% 133 -12.9%ROCKHAMPTON 7.8% 103 -9.1% 7.6% 118 -7.4%TOOWOOMBA 8.4% 67 -5.3% 7.8% 77 -4.2%TOWNSVILLE 7.2% 94 -8.9% 9.8% 119 -9.1%
"All figures are for the 12months ending August 2015
SD - Statistical Division: Brisbane SD (Brisbane, Ipswich, Logan, Moreton Bay & Redland); Sunshine Coast SD (Sunshine Coast & Noosa)
"Due to low volume of sales, % changes should be used with caution.N/A - not available due to insufficient sales numbersb The median sale price for vacant land in the Redland City LGA is significantly impacted by shifts in the number of property sales on the bay islands versus the number on the mainland in high quality subdivisions.
Mackay’s house market was patchy, with some market indicators in decline despite sales numbers increasing nine per cent over the quarter. The region’s median house price softened 2.8 per cent to $345,000 over the September quarter.
UNIT MARKET
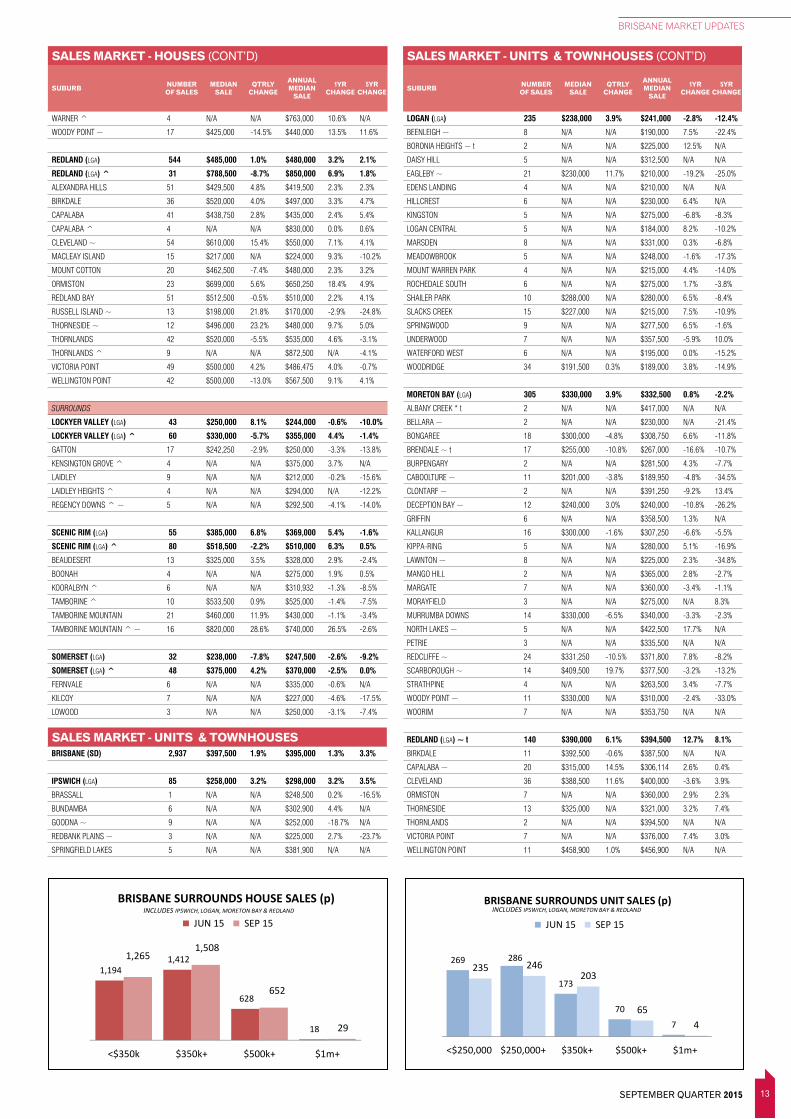
Broadly speaking, the unit and townhouse markets across the state followed the sales trends set by the housing markets.
Greater Brisbane and the tourism centres were the standout performers with the Gold Coast recording the highest lift in preliminary sales activity.
Median sale prices in Greater Brisbane were up across all council areas, while the tourism centres recorded relatively steady results on the back of strong sales at the affordable end of the market.
Data reveals that investor interest is picking up with Gold Coast agents saying interstate investors are beginning to turn their attention to the sunshine state.
Toowoomba’s unit and townhouse market rebounded over the quarter, with sales up 23 per cent. News of major infrastructure projects proceeding is keeping the momentum in the market.
In other regional centres, sales turnover in the unit market eased. Investor interest outside the southeast corner is extremely limited and there is little or no new development activity on the cards, softening local economies.

5
STATE-WIDE SUMMARY
SEPTEMBER QUARTER 2015
FOR FULL ON THE MARKET AND RENTAL MARKET STATISTICS BY LOCAL GOVERNMENT AREA, SEE PAGE 37-39
VACANCY RATES
LGA/REGION SEP-15 TRENDGREATER BRISBANEBRISBANE SD 2.3% STEADYBRISBANE 2.8% STEADYIPSWICH 1.3% DOWNLOGAN 1.9% DOWNMORETON BAY 1.6% STEADYREDLAND 2.5% STEADYTOURISM CENTRESGOLD COAST 1.7% DOWNSUNSHINE COAST SD 1.3% DOWNSUNSHINE COAST 1.4% STEADYNOOSA 0.9% DOWNFRASER COAST 3.3% DOWNCAIRNS 2.6% STEADYREGIONAL QLDBUNDABERG 4.6% STEADYGLADSTONE 7.1% UPMACKAY 9.1% STEADYROCKHAMPTON 4.5% DOWNTOOWOOMBA 2.7% DOWNTOWNSVILLE 5.6% STEADY
See page 39 for full vacancy rate data
* change greater than $20 (rents) or 0.5 pts (yields)
RENTAL TRENDS^ MEDIAN WEEKLY RENT GROSS RENTAL YIELDS
LGA 3-BED HOUSE 2-BED FLAT 3-BED TOWNHOUSE HOUSES UNITS
GREATER BRISBANEBRISBANE $420 STEADY $400 STEADY $415 STEADY 3.6% STEADY 4.8% STEADYIPSWICH $300 STEADY $255 STEADY $315 STEADY 4.9% STEADY 5.1% DOWNLOGAN $350 STEADY $270 UP $340 STEADY 5.1% STEADY 5.9% STEADYMORETON BAY $350 STEADY $280 STEADY $340 STEADY 4.5% STEADY 4.4% STEADYREDLAND $390 STEADY $330 UP $395 STEADY 4.2% STEADY 4.4% STEADYTOURISM CENTRESGOLD COAST $450 STEADY $380 STEADY $400 STEADY 4.3% STEADY 5.7% STEADYSUNSHINE COAST $420 STEADY $340 STEADY $410 UP 4.4% STEADY 4.9% STEADYNOOSA $430 DOWN $360 STEADY $480 STEADY 4.3% STEADY 4.3% STEADYFRASER COAST $360 STEADY $285 STEADY $375 UP* 5.0% UP* 5.9% UPCAIRNS $290 STEADY $245 UP $310 DOWN 4.7% DOWN* 6.6% UP*REGIONAL QLDBUNDABERG $285 STEADY $220 STEADY $275 DOWN 5.5% STEADY 4.2% DOWN*GLADSTONE $290 DOWN $220 DOWN* $300 DOWN* 4.4% UP N/A N/AMACKAY $295 STEADY $220 STEADY $290 DOWN 4.4% STEADY 5.0% UP*ROCKHAMPTON $290 STEADY $220 DOWN N.A. UP* 5.5% UP 3.3% N/ATOOWOOMBA $300 STEADY $250 STEADY $300 DOWN* 4.4% STEADY 4.2% DOWNTOWNSVILLE $305 STEADY $255 STEADY $330 STEADY 4.6% STEADY 5.3% UP*
RENTAL MARKET
Vacancy levels in the southeast corner are healthy to tight, with many suburbs either tightening slightly over the quarter or remaining in the healthy range.
However, as the sales market improves local agents anticipate that the rental market will ease over the coming quarters. Ongoing low interest rates mean that for many renters - especially those in the inner city - the cost of living is actually cheaper with a mortgage than in a rental property. This will impact on rental vacancy rates as renters move into home ownership.
In regional areas vacancy rates remained relatively unchanged with weak rental market conditions prevailing.
Gladstone’s vacancy rate was the exception as it returned to above seven per cent with more ex-mining company owned properties coming into the private rental pool.
Subscribe to REIQ's research report & media releases: Keep up to date with the latest market information from the best source for real estate news in
Queensland, the REIQ. Email Yvette Burton to subscribe: [email protected].

6 QUEENSLAND MARKET MONITOR
BRISBANE MARKET UPDATES
BRISBANE CITYIn line with historical September quarters, Brisbane’s house market recorded a healthy rise in residential sales activity for the 2015 September quarter.
While predictions have been prolific that the slowing conditions in Sydney would flow through to other major capital cities, Brisbane has clearly defied expectations.
On the market indicators of average days on market and average vendor discounting have remained relatively unchanged since the end of June, proving that the Brisbane property market is growing at a healthy and sustainable level.
Listing numbers continue to increase with more vendors recognising the good selling conditions. This trend in listings is encouraging and will ensure there is enough supply to meet the growing demand. With more listings coming onto the market to meet the growth in buyer numbers, conditions are ripe for property prices to grow at a steady rate.
HOUSE MARKET
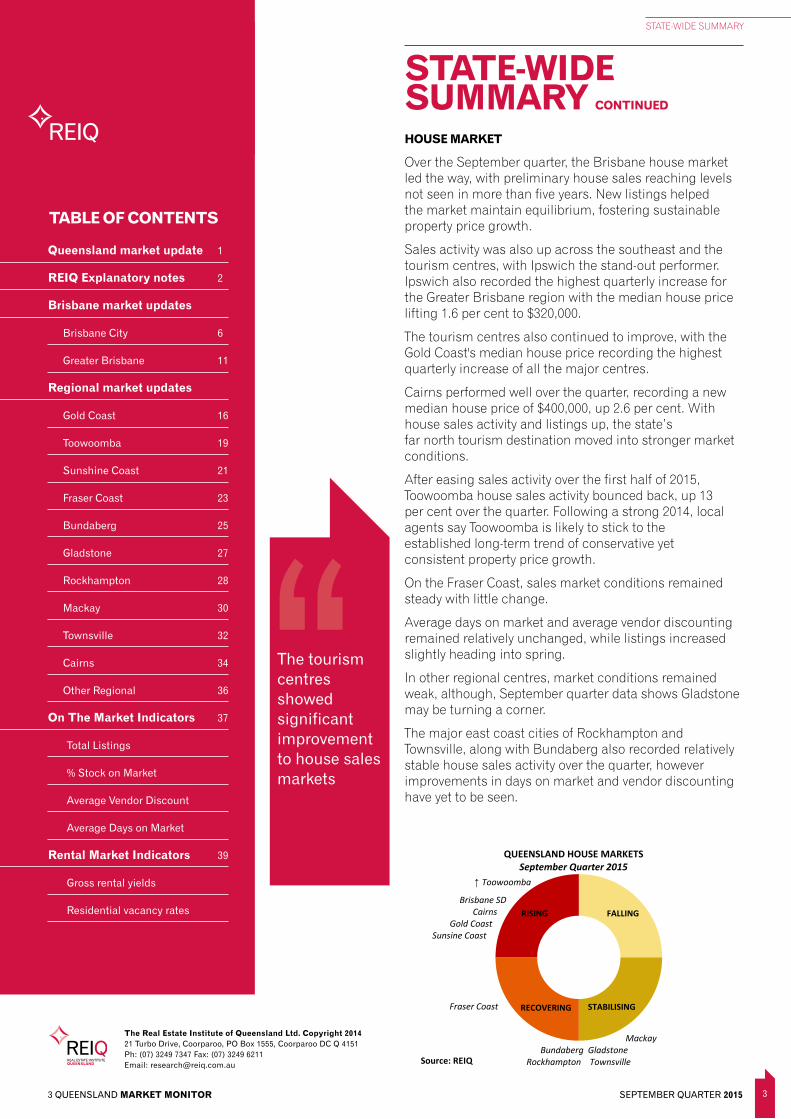
Over the September quarter, Brisbane preliminary house sales were up five per cent on the June quarter, taking the city’s sales turnover to a level not seen in more than five years.
With growing confidence and activity across all price points, the overall median was up marginally, by 0.8 per cent, to $615,000 – setting yet another record median sale price.
Demand for houses in the $500 000-plus bracket grew significantly, with 129 more sales this quarter compared with the previous quarter.
The growth in listings across all price points is meeting growing buyer demand with average days on market and average vendor discounting rates at levels consistent since the start of the year.
Standout suburbs over the quarter were typically middle to outer-ring suburbs with Eight Mile Plains, Mount Gravatt East and Manly West recording some of the strongest increases in preliminary sales numbers.
The prestige market performed well this quarter. Two new suburbs entered the million-dollar median price group, with Grange and Robertson joining blue-chip suburbs such as Bulimba, Chelmer, Hamilton, New Farm, Teneriffe and St Lucia.
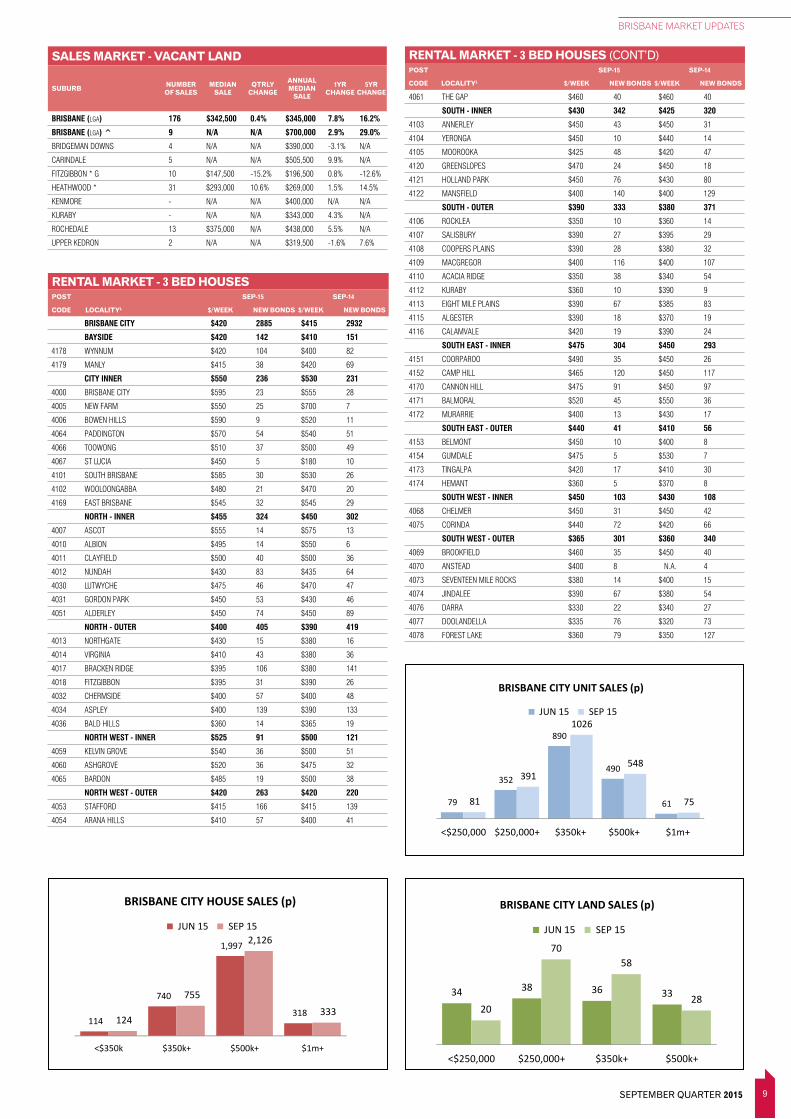
UNIT MARKET
Brisbane’s unit and townhouse market also performed strongly with preliminary unit and townhouse sales up 13 per cent compared with the June quarter.
Increased activity was not confined to any one area with the top increases in activity occurring in inner, middle and outer ring suburbs.
Activity also increased across all price points with the $350,000-plus price point recording the largest increase.
Sales in the prestige unit market lifted, with 14 more sales in the million-dollar-plus category compared with the June quarter.
Brisbane's median unit sale price was up 1.2 per cent to $430,000 this quarter.
The median has hovered around this level since the September quarter last year, indicating that real price growth is yet to occur in this section of Brisbane’s residential market.
With new apartments coming onto the market, listing numbers were up 13 per cent on the previous year. As a result, average days on market increased to 69 days while average vendor discounting remained relatively stable, up just 0.1 percentage points to 4.8 per cent over the year to August.
RENTAL MARKET
Brisbane City vacancy rates increased marginally by 0.1 percentage points to 2.8 per cent, largely due to easing conditions for the city’s inner ring.
Increased supply levels are starting to impact on the inner city, with the vacancy rate easing to 3.3 per cent at the end of September.
Local agents reported that asking rents were easing and rental incentives were being used to help secure tenants. Easing tenant demand was also reported.
However, even though demand is easing, generally speaking median rents have not yet softened, with the exception of the inner-north where rents dropped slightly by $10 over the quarter.
In the middle to outer ring local agents reported that despite low vacancy levels, listings were taking longer to rent. Increased investor activity was also adding to current supply levels.
Listing numbers continue to increase with more vendors recognising the good selling conditions.
7 SEPTEMBER QUARTER 2015
BRISBANE MARKET UPDATES
SALES MARKET - HOUSES
SUBURB NUMBER OF SALES
MEDIAN SALE
QTRLY CHANGE
ANNUAL MEDIAN
SALE
1YR CHANGE
5YR CHANGE
SALES MARKET - HOUSES (CONT’D)
SUBURB NUMBER OF SALES
MEDIAN SALE
QTRLY CHANGE
ANNUAL MEDIAN
SALE
1YR CHANGE
5YR CHANGE
BRISBANE (LGA) 3,481 $615,000 0.8% $608,000 6.6% 13.1%
BRISBANE (LGA) ^ ~ 94 $960,000 -6.1% $1,000,000 12.0% -0.5%
ACACIA RIDGE 20 $362,050 2.7% $356,100 7.9% 6.3%
ALBION 4 N/A N/A $717,750 7.1% 10.4%
ALDERLEY 22 $680,000 -6.7% $704,000 7.5% 14.5%
ALGESTER 30 $500,000 4.4% $470,000 5.6% 12.3%
ANNERLEY 23 $675,000 7.1% $650,000 0.0% 8.3%
ASCOT ~ 10 $1,700,000 32.9% $1,330,000 2.3% 8.6%
ASHGROVE 39 $752,500 -9.2% $820,000 4.8% 21.4%
ASPLEY 41 $540,000 -4.4% $536,000 3.1% 15.3%
AUCHENFLOWER 22 $850,000 -6.0% $850,000 -4.8% 7.3%
BALD HILLS 21 $440,000 10.8% $401,000 5.5% 2.8%
BALMORAL 16 $890,000 -8.0% $930,000 6.1% 19.2%
BANYO 22 $470,000 -0.7% $450,000 4.7% 5.1%
BARDON 24 $870,000 2.5% $830,000 0.2% 4.4%
BELLBOWRIE 16 $442,500 -8.5% $475,000 2.2% -1.6%
BELMONT 7 N/A N/A $593,500 4.6% 0.8%
BOONDALL 30 $457,000 2.1% $441,750 4.6% 4.7%
BRACKEN RIDGE 58 $441,000 -3.5% $440,000 5.3% 5.3%
BRIDGEMAN DOWNS 25 $725,500 0.1% $728,000 3.6% 4.0%
BRIGHTON ~ 35 $435,000 -14.6% $450,050 2.3% 8.4%
BROOKFIELD ^ ~ 4 N/A N/A $1,319,000 N/A N/A
BULIMBA 24 $1,260,000 14.5% $1,135,000 3.2% 26.1%
CALAMVALE 50 $610,000 2.0% $592,000 6.7% 12.8%
CAMP HILL ~ 39 $875,000 19.0% $762,000 6.4% 14.4%
CANNON HILL 15 $797,500 11.8% $703,500 5.5% 24.0%
CARINA 29 $603,750 -2.6% $588,750 7.2% 15.4%
CARINA HEIGHTS 14 $659,500 11.3% $600,500 3.5% 14.2%
CARINDALE 39 $765,000 -0.6% $750,444 5.9% 8.0%
CARSELDINE 22 $602,500 12.6% $571,000 5.7% 1.3%
CHAPEL HILL 28 $725,000 -1.8% $700,000 4.5% 7.7%
CHELMER ~ f 11 $1,160,500 29.3% $1,009,000 26.1% 13.4%
CHERMSIDE 14 $571,500 7.0% $531,500 2.2% 14.9%
CHERMSIDE WEST 18 $495,000 -1.0% $515,000 6.2% 9.6%
CLAYFIELD ~ 14 $810,000 -17.3% $970,000 9.3% 3.5%
COOPERS PLAINS 18 $480,000 -5.0% $500,000 7.5% 14.9%
COORPAROO 36 $800,000 6.3% $762,000 9.1% 12.7%
CORINDA ~ 9 N/A N/A $691,000 24.3% 11.9%
DARRA 10 $435,500 N/A $357,500 2.7% 0.7%
DEAGON 12 $429,000 3.4% $425,000 10.4% 4.7%
DOOLANDELLA 16 $460,000 N/A $430,000 7.5% 6.2%
DREWVALE 19 $502,500 -10.3% $525,000 10.4% 7.6%
DURACK 16 $375,325 -11.7% $397,500 8.0% 8.9%
EAST BRISBANE ~ 22 $745,000 -24.0% $785,000 8.3% 15.4%
EIGHT MILE PLAINS 36 $755,000 8.2% $700,000 7.7% 12.9%
ENOGGERA 13 $637,500 11.0% $637,500 9.9% 20.3%
EVERTON PARK 12 $523,750 -4.0% $530,000 3.3% 10.4%
FAIRFIELD 9 N/A N/A $660,000 1.5% 11.8%
FERNY GROVE 18 $500,000 -7.4% $522,500 -0.5% 4.7%
FIG TREE POCKET 9 N/A N/A $851,000 -2.2% 15.8%
FITZGIBBON 8 N/A N/A $430,000 3.4% 0.6%
FOREST LAKE 107 $415,000 6.4% $400,000 0.5% -1.7%
GAYTHORNE 8 N/A N/A $639,000 11.1% 20.6%
GEEBUNG 6 N/A N/A $465,000 -2.2% 2.2%
GORDON PARK 13 $720,000 N/A $720,000 -3.5% 25.2%
GRACEVILLE 14 $762,500 6.5% $720,000 5.8% 2.9%
GRANGE 16 $1,047,250 14.8% $810,000 6.9% 19.3%
GREENSLOPES 24 $740,000 12.5% $698,000 13.8% 12.8%
HAMILTON ~ 20 $1,068,500 -22.4% $1,197,500 21.6% 19.8%
HAWTHORNE ~ 23 $965,000 -20.2% $1,100,000 11.1% 29.4%
HEATHWOOD 6 N/A N/A $550,000 3.9% 0.1%
HEMMANT 7 N/A N/A $425,000 2.8% -1.2%
HENDRA ~ 15 $811,000 -22.8% $850,000 4.7% 5.0%
HIGHGATE HILL ~ 4 N/A N/A $1,052,500 23.8% 31.2%
HOLLAND PARK 30 $675,000 10.1% $645,000 9.3% 18.3%
HOLLAND PARK WEST 25 $710,000 6.3% $625,000 8.7% 12.2%
INALA 44 $330,000 3.1% $316,000 8.1% 6.4%
INDOOROOPILLY ~ 26 $755,000 -14.0% $799,000 8.0% 19.4%
JAMBOREE HEIGHTS 11 $449,000 3.5% $426,250 -3.1% -1.3%
JINDALEE ~ 24 $556,500 22.3% $510,000 5.3% 2.1%
KANGAROO POINT ~ f 11 $951,000 N/A $951,000 25.4% 42.6%
KARANA DOWNS 7 N/A N/A $399,000 6.1% 1.0%
KARANA DOWNS ^ 7 N/A N/A $524,500 14.0% 1.4%
KEDRON 29 $595,000 -2.1% $605,000 -3.2% 12.2%
KELVIN GROVE 10 $700,694 -8.7% $730,000 6.6% 15.0%
KENMORE 38 $610,000 -0.2% $597,500 4.2% 6.7%
KENMORE HILLS 6 N/A N/A $743,500 14.4% 8.4%
KEPERRA 13 $460,000 5.1% $462,750 4.9% 5.9%
KURABY ~ 24 $479,500 -24.2% $603,000 4.6% 9.6%
LOTA ~ 12 $500,000 -14.5% $555,000 7.1% 19.1%
LUTWYCHE 6 N/A N/A $746,666 3.7% 27.6%
MACGREGOR ~ 12 $755,250 2.1% $695,000 12.6% 31.1%
MACKENZIE 6 N/A N/A $730,000 9.4% 17.7%
MANLY 17 $765,000 3.4% $748,000 10.2% 5.6%
MANLY WEST 44 $537,500 -4.9% $538,500 10.1% 8.6%
MANSFIELD 26 $590,000 0.0% $560,000 2.8% 10.2%
MCDOWALL 22 $586,250 -3.1% $600,000 3.3% 8.1%
MIDDLE PARK 8 N/A N/A $568,000 8.2% 6.3%
MITCHELTON 20 $618,000 4.3% $586,250 7.6% 14.6%
MOGGILL 20 $544,000 0.3% $508,000 -0.1% 4.7%
MOOROOKA 39 $580,000 -3.3% $560,000 5.2% 14.3%
MORNINGSIDE 32 $758,000 14.0% $699,500 9.5% 18.0%
MOUNT GRAVATT 8 N/A N/A $630,750 13.1% 28.7%
MOUNT GRAVATT EAST 55 $565,000 0.9% $560,000 0.9% 17.6%
MURARRIE 18 $620,000 4.2% $600,000 9.8% 11.1%
NEW FARM 11 $1,363,000 6.5% $1,328,750 6.3% 20.8%
NEWMARKET 12 $700,000 -12.2% $756,000 3.4% 4.4%
NORMAN PARK 21 $765,000 7.7% $785,000 -0.6% 18.0%
NORTHGATE ~ 15 $560,000 -16.4% $625,000 9.2% 32.7%
NUDGEE 12 $601,000 8.3% $557,750 0.2% 17.4%
NUNDAH 21 $675,000 13.6% $720,000 10.8% 24.6%
OXLEY 29 $472,000 -9.0% $500,500 6.8% 10.2%
PADDINGTON 23 $845,000 -12.4% $880,000 -5.4% 8.6%
PARKINSON 33 $600,000 0.4% $585,000 3.1% 11.4%
PULLENVALE ^ ~ 4 N/A N/A $932,500 0.9% -12.9%
RED HILL 21 $817,500 1.6% $802,500 7.7% 16.3%
RICHLANDS 5 N/A N/A $415,000 N/A N/A
RIVERHILLS 16 $425,000 -8.8% $449,500 3.7% 3.3%
ROBERTSON ~ 11 $1,088,000 44.3% $803,500 8.3% 12.8%
ROCHEDALE 4 N/A N/A $918,000 N/A N/A
ROCKLEA 6 N/A N/A $380,000 6.4% 5.9%
RUNCORN 35 $515,000 -7.5% $505,000 7.7% 18.0%
SALISBURY 26 $521,500 0.4% $513,000 5.2% 14.0%
SANDGATE ~ 15 $660,000 19.5% $535,000 -6.6% -2.9%
SEVEN HILLS 10 $735,500 N/A $740,000 17.3% 26.5%
SEVENTEEN MILE ROCKS 9 N/A N/A $619,000 -5.5% 13.6%
SHERWOOD 9 N/A N/A $805,000 13.5% 17.8%
SHORNCLIFFE 5 N/A N/A $675,000 N/A 2.9%
SINNAMON PARK 26 $587,750 -9.2% $630,000 7.6% -1.3%
SPRING HILL 6 N/A N/A $893,000 -3.2% 17.7%
ST LUCIA 10 $1,150,000 4.5% $1,100,000 10.0% 11.1%
STAFFORD 26 $565,000 2.7% $551,000 4.0% 16.0%
STAFFORD HEIGHTS 24 $510,000 -3.3% $529,000 3.7% 11.4%
STRETTON ~ 17 $860,000 -4.7% $843,400 17.2% 36.3%
SUNNYBANK 27 $680,000 -6.3% $680,000 13.3% 26.2%
SUNNYBANK HILLS 42 $650,000 -2.2% $610,000 5.2% 19.6%
TAIGUM 11 $469,500 N/A $484,500 6.5% 7.4%
TARINGA 13 $890,000 0.6% $830,000 1.2% 9.2%
TARRAGINDI 37 $709,500 9.2% $680,000 13.3% 15.3%
TENERIFFE 8 N/A N/A $1,475,000 N/A N/A
THE GAP 60 $628,500 5.3% $611,750 7.3% 9.0%
TINGALPA 29 $449,500 -2.3% $462,000 0.4% 5.0%
TOOWONG 16 $900,000 9.1% $755,000 2.4% 7.1%
UPPER KEDRON 10 $611,750 N/A $600,750 11.3% 11.3%
UPPER MOUNT GRAVATT 36 $575,000 -5.7% $580,800 8.6% 22.9%
VIRGINIA 12 $550,000 7.3% $528,000 6.7% 22.8%
WAKERLEY 37 $713,500 3.0% $710,000 8.4% 17.4%
WAVELL HEIGHTS 44 $638,000 2.2% $628,750 9.8% 21.7%

8 QUEENSLAND MARKET MONITOR
BRISBANE MARKET UPDATES
SALES MARKET - UNITS & TOWNHOUSES
SALES MARKET - UNITS & TOWNHOUSES (CONT’D)
SUBURB NUMBER OF SALES
MEDIAN SALE
QTRLY CHANGE
ANNUAL MEDIAN
SALE
1YR CHANGE
5YR CHANGE
SALES MARKET - HOUSES (CONT’D)
SUBURB NUMBER OF SALES
MEDIAN SALE
QTRLY CHANGE
ANNUAL MEDIAN
SALE
1YR CHANGE
5YR CHANGE
BRISBANE (LGA) 2,172 $430,000 1.2% $430,000 2.4% 4.1%
ACACIA RIDGE 16 $348,000 N/A $348,000 0.0% N/A
ALBION ~ * 10 $410,000 -13.7% $419,000 -5.8% -4.6%
ALDERLEY 8 N/A N/A $435,000 -0.6% 10.1%
ANNERLEY ~ 34 $380,000 4.3% $389,000 -9.5% 3.2%
ASCOT ~ 14 $476,000 25.3% $428,000 -0.5% 5.5%
ASHGROVE 9 N/A N/A $440,000 -4.3% 7.3%
ASPLEY 12 $369,000 N/A $366,000 -5.7% -3.4%
AUCHENFLOWER ~ 26 $429,000 -13.3% $439,000 -7.0% 0.9%
BALMORAL 9 N/A N/A $526,000 13.7% 4.8%
BOWEN HILLS ~ * 17 $365,000 -24.0% $419,250 -7.1% -0.2%
BRACKEN RIDGE 4 N/A N/A $322,000 N/A -9.3%
BRIDGEMAN DOWNS 3 N/A N/A $345,000 N/A -6.6%
BRISBANE CITY 119 $481,250 -5.2% $497,500 -0.5% 8.2%
BULIMBA * 32 $625,000 11.1% $589,288 4.1% 14.9%
CALAMVALE 26 $397,888 10.5% $380,000 4.1% 5.8%
CAMP HILL 4 N/A N/A $407,000 N/A -5.3%
CARINA 21 $450,000 4.7% $450,000 4.8% 3.7%
CARINA HEIGHTS 12 $460,000 -6.1% $477,500 4.3% 3.8%
CARINDALE ~ t 7 N/A N/A $520,000 23.8% 2.5%
CARSELDINE 9 N/A N/A $380,000 -3.1% 2.4%
CHERMSIDE 33 $427,500 7.7% $405,000 1.3% -5.6%
CLAYFIELD 52 $367,500 -7.0% $375,100 -3.8% 3.0%
COOPERS PLAINS 2 N/A N/A $377,953 -1.6% N/A
COORPAROO ~ 41 $369,000 -11.1% $400,000 3.4% 4.4%
DARRA 8 N/A N/A $325,500 N/A N/A
DOOLANDELLA 1 N/A N/A $339,000 -2.7% 0.4%
EAST BRISBANE 18 $402,500 -10.6% $420,000 3.1% -5.8%
EIGHT MILE PLAINS 18 $400,000 -1.2% $405,000 5.2% 8.0%
ENOGGERA 5 N/A N/A $410,000 2.5% N/A
EVERTON PARK 19 $350,000 -8.4% $412,000 -0.1% 3.8%
FITZGIBBON 8 N/A N/A $358,000 N/A N/A
FORTITUDE VALLEY 52 $460,000 3.4% $450,500 1.2% 7.3%
GAYTHORNE 10 $424,500 4.4% $432,500 5.5% 1.8%
GORDON PARK 8 N/A N/A $400,250 10.0% 12.7%
GREENSLOPES 24 $381,000 -6.5% $376,500 0.7% -0.3%
HAMILTON ~ 43 $566,250 19.0% $567,500 11.1% 22.7%
HAWTHORNE ~ 14 $526,900 N/A $550,000 8.9% 31.0%
HIGHGATE HILL ~ 15 $520,000 -20.9% $534,000 4.7% 17.1%
WEST END 20 $977,500 -9.7% $990,000 1.0% 26.1%
WESTLAKE 11 $616,000 6.2% $610,000 -3.9% -1.2%
WILSTON 12 $877,500 7.6% $871,000 5.6% 2.3%
WINDSOR 21 $850,000 14.5% $767,500 12.0% 14.6%
WISHART 18 $659,250 -3.8% $630,000 12.1% 12.6%
WOOLLOONGABBA 7 N/A N/A $747,000 12.3% 10.2%
WOOLOOWIN 28 $835,000 10.5% $803,000 3.5% 16.4%
WYNNUM 50 $605,000 0.7% $616,000 16.8% 15.0%
WYNNUM WEST 50 $487,500 5.4% $465,000 -1.1% 4.5%
YERONGA ~ 15 $755,000 -15.2% $757,500 12.1% 12.2%
ZILLMERE 28 $443,250 0.2% $439,000 8.4% 10.0%
HOLLAND PARK WEST * 10 $413,201 -3.7% $431,250 14.2% 20.0%
INDOOROOPILLY 36 $464,750 -0.1% $462,500 -1.6% 0.0%
KANGAROO POINT 40 $526,250 3.2% $502,500 2.6% -3.4%
KEDRON ~ 12 $458,750 5.5% $432,500 21.8% 26.7%
KELVIN GROVE 24 $492,000 2.4% $452,450 -4.3% 8.5%
LUTWYCHE 14 $442,750 -3.8% $459,158 12.0% 17.7%
MANLY 8 N/A N/A $420,000 N/A N/A
MANLY WEST 8 N/A N/A $368,000 3.7% -3.8%
MCDOWALL 3 N/A N/A $468,750 15.7% N/A
MILTON * 3 N/A N/A $544,350 22.9% N/A
MITCHELTON 6 N/A N/A $420,000 N/A 6.5%
MOOROOKA 23 $400,000 -7.4% $407,500 10.1% -3.0%
MORNINGSIDE * 47 $485,000 -3.0% $480,000 1.9% 9.1%
MOUNT GRAVATT 2 N/A N/A $453,000 N/A N/A
MOUNT GRAVATT EAST * t 29 $430,000 -6.3% $447,000 13.2% 17.6%
MURARRIE 1 N/A N/A $440,000 -3.2% -4.3%
NEW FARM 46 $552,500 -7.9% $570,000 1.8% 7.5%
NEWMARKET 5 N/A N/A $430,000 -5.2% -8.5%
NEWSTEAD ~ 17 $723,500 -6.6% $715,000 -6.8% 4.9%
NORMAN PARK 13 $430,000 N/A $487,000 -4.0% 1.5%
NORTHGATE 11 $365,000 N/A $399,900 6.6% 14.3%
NUDGEE - N/A N/A $448,000 N/A N/A
NUNDAH ~ 67 $445,000 15.6% $413,500 -3.6% 3.9%
OXLEY 9 N/A N/A $363,000 N/A 0.8%
PADDINGTON 7 N/A N/A $515,000 6.1% 15.6%
RED HILL 14 $420,000 1.2% $445,000 9.3% N/A
RICHLANDS 8 N/A N/A $346,900 2.8% 2.6%
RUNCORN 21 $340,000 1.0% $332,000 -1.5% -2.1%
SHERWOOD * 21 $440,000 18.6% $445,000 0.0% 7.2%
SOUTH BRISBANE ~ 29 $494,500 1.0% $472,750 -8.2% -0.1%
SPRING HILL 38 $436,500 3.9% $435,400 12.4% 14.6%
ST LUCIA 35 $455,000 -10.3% $496,500 5.6% 12.3%
STAFFORD * 21 $407,500 -7.9% $440,500 11.5% 14.4%
SUNNYBANK HILLS 18 $360,000 N/A $350,000 1.4% -4.4%
TAIGUM ~ 17 $323,250 2.6% $346,000 -10.1% -3.9%
TARINGA 27 $395,000 -9.7% $435,000 4.3% 2.4%
TENERIFFE ~ 37 $590,000 18.5% $559,000 -9.8% 1.6%
THE GAP ~ t 13 $565,000 22.2% $465,000 3.4% 12.0%
TINGALPA 8 N/A N/A $365,000 10.8% 2.4%
TOOWONG ~ 44 $419,000 -8.3% $423,750 -7.4% -3.7%
UPPER MOUNT GRAVATT ~ t 21 $325,000 -14.9% $384,750 -14.7% -7.3%
WAKERLEY 4 N/A N/A $400,000 -3.1% -5.7%
WEST END ~ * 27 $565,000 -16.4% $585,000 13.8% 4.9%
WINDSOR ~ 10 $475,000 15.9% $460,000 16.5% 24.3%
WISHART 8 N/A N/A $385,000 2.4% 6.4%
WOOLLOONGABBA 16 $439,000 4.5% $418,000 4.8% -1.6%
WYNNUM * 20 $390,000 -4.8% $435,000 17.6% 13.0%
WYNNUM WEST ~ t 13 $360,000 15.8% $345,000 -3.9% 2.1%
YERONGA 11 $493,000 8.4% $466,250 7.1% 12.3%
ZILLMERE ~ 10 $312,250 -12.9% $353,750 4.0% -3.1%
Direct Connect makes moving easy for your customers by arranging their utility connections and other moving solutions. We invite you to experience the difference with us today.
CALL US ON 1300 664 715or visit agents.directconnect.com.au
9 SEPTEMBER QUARTER 2015
BRISBANE MARKET UPDATES
RENTAL MARKET - 3 BED HOUSES (CONT’D)POST SEP-15 SEP-14
CODE LOCALITYL $/WEEK NEW BONDS $/WEEK NEW BONDS
RENTAL MARKET - 3 BED HOUSESPOST SEP-15 SEP-14
CODE LOCALITYL $/WEEK NEW BONDS $/WEEK NEW BONDS
SALES MARKET - VACANT LAND
SUBURB NUMBER OF SALES
MEDIAN SALE
QTRLY CHANGE
ANNUAL MEDIAN
SALE
1YR CHANGE
5YR CHANGE
BRISBANE (LGA) 176 $342,500 0.4% $345,000 7.8% 16.2%
BRISBANE (LGA) ^ 9 N/A N/A $700,000 2.9% 29.0%
BRIDGEMAN DOWNS 4 N/A N/A $390,000 -3.1% N/A
CARINDALE 5 N/A N/A $505,500 9.9% N/A
FITZGIBBON * G 10 $147,500 -15.2% $196,500 0.8% -12.6%
HEATHWOOD * 31 $293,000 10.6% $269,000 1.5% 14.5%
KENMORE - N/A N/A $400,000 N/A N/A
KURABY - N/A N/A $343,000 4.3% N/A
ROCHEDALE 13 $375,000 N/A $438,000 5.5% N/A
UPPER KEDRON 2 N/A N/A $319,500 -1.6% 7.6%
BRISBANE CITY $420 2885 $415 2932
BAYSIDE $420 142 $410 151
4178 WYNNUM $420 104 $400 82
4179 MANLY $415 38 $420 69
CITY INNER $550 236 $530 231
4000 BRISBANE CITY $595 23 $555 28
4005 NEW FARM $550 25 $700 7
4006 BOWEN HILLS $590 9 $520 11
4064 PADDINGTON $570 54 $540 51
4066 TOOWONG $510 37 $500 49
4067 ST LUCIA $450 5 $180 10
4101 SOUTH BRISBANE $585 30 $530 26
4102 WOOLOONGABBA $480 21 $470 20
4169 EAST BRISBANE $545 32 $545 29
NORTH - INNER $455 324 $450 302
4007 ASCOT $555 14 $575 13
4010 ALBION $495 14 $550 6
4011 CLAYFIELD $500 40 $500 36
4012 NUNDAH $430 83 $435 64
4030 LUTWYCHE $475 46 $470 47
4031 GORDON PARK $450 53 $430 46
4051 ALDERLEY $450 74 $450 89
NORTH - OUTER $400 405 $390 419
4013 NORTHGATE $430 15 $380 16
4014 VIRGINIA $410 43 $380 36
4017 BRACKEN RIDGE $395 106 $380 141
4018 FITZGIBBON $395 31 $390 26
4032 CHERMSIDE $400 57 $400 48
4034 ASPLEY $400 139 $390 133
4036 BALD HILLS $360 14 $365 19
NORTH WEST - INNER $525 91 $500 121
4059 KELVIN GROVE $540 36 $500 51
4060 ASHGROVE $520 36 $475 32
4065 BARDON $485 19 $500 38
NORTH WEST - OUTER $420 263 $420 220
4053 STAFFORD $415 166 $415 139
4054 ARANA HILLS $410 57 $400 41
4061 THE GAP $460 40 $460 40
SOUTH - INNER $430 342 $425 320
4103 ANNERLEY $450 43 $450 31
4104 YERONGA $450 10 $440 14
4105 MOOROOKA $425 48 $420 47
4120 GREENSLOPES $470 24 $450 18
4121 HOLLAND PARK $450 76 $430 80
4122 MANSFIELD $400 140 $400 129
SOUTH - OUTER $390 333 $380 371
4106 ROCKLEA $350 10 $360 14
4107 SALISBURY $390 27 $395 29
4108 COOPERS PLAINS $390 28 $380 32
4109 MACGREGOR $400 116 $400 107
4110 ACACIA RIDGE $350 38 $340 54
4112 KURABY $360 10 $390 9
4113 EIGHT MILE PLAINS $390 67 $385 83
4115 ALGESTER $390 18 $370 19
4116 CALAMVALE $420 19 $390 24
SOUTH EAST - INNER $475 304 $450 293
4151 COORPAROO $490 35 $450 26
4152 CAMP HILL $465 120 $450 117
4170 CANNON HILL $475 91 $450 97
4171 BALMORAL $520 45 $550 36
4172 MURARRIE $400 13 $430 17
SOUTH EAST - OUTER $440 41 $410 56
4153 BELMONT $450 10 $400 8
4154 GUMDALE $475 5 $530 7
4173 TINGALPA $420 17 $410 30
4174 HEMANT $360 5 $370 8
SOUTH WEST - INNER $450 103 $430 108
4068 CHELMER $450 31 $450 42
4075 CORINDA $440 72 $420 66
SOUTH WEST - OUTER $365 301 $360 340
4069 BROOKFIELD $460 35 $450 40
4070 ANSTEAD $400 8 N.A. 4
4073 SEVENTEEN MILE ROCKS $380 14 $400 15
4074 JINDALEE $390 67 $380 54
4076 DARRA $330 22 $340 27
4077 DOOLANDELLA $335 76 $320 73
4078 FOREST LAKE $360 79 $350 127
LAND PRICEPOINTS
(p) Preliminary. See explanatory notes for further information. Source: REIQ, data provided by CoreLogic RP Data.
34 38 36 33
20
7058
28
<$250,000 $250,000+ $350k+ $500k+
BRISBANE CITY LAND SALES (p)
JUN 15 SEP 15
449
10044
8
464
10029 3
<$250,000 $250,000+ $350k+ $500k+
BRISBANE SURROUNDS LAND SALES (p)
JUN 15 SEP 15Includes IPSWICH, LOGAN, MORETON BAY & REDLAND
98
38
617
111
36
13 14
<$250,000 $250,000+ $350k+ $500k+
GOLD COAST LAND SALES (p)
JUN 15 SEP 15
70
36
21
7
6155
149
<$250,000 $250,000+ $350k+ $500k+
SUNSHINE COAST & NOOSA LAND SALES (p)
JUN 15 SEP 1581
124
56
115
<$250,000 $250,000+ $350k+
CAIRNS & DOUGLAS LAND SALES (p)
JUN 15 SEP 15
53
5 1
78
1 1
<$250,000 $250,000+ $350k+
FRASER COAST LAND SALES (p)
JUN 15 SEP 15
22
2 1
10
31
<$250,000 $250,000+ $350k+
GLADSTONE LAND SALES (p)
JUN 15 SEP 15
53
1 0
43
3 0
<$250,000 $250,000+ $350k+
ROCKHAMPTON & LIVINGSTONE LAND SALES (p)
JUN 15 SEP 15
46
2 0
54
4 1
<$250,000 $250,000+ $350k+
TOOWOOMBA LAND SALES (p)
JUN 15 SEP 15
46
2 3
72
71
<$250,000 $250,000+ $350k+
TOWNSVILLE LAND SALES (p)
JUN 15 SEP 15
15
4 4
22
30
<$250,000 $250,000+ $350k+
MACKAY LAND SALES (p)
JUN 15 SEP 15
36
1 1
41
0 0
<$250,000 $250,000+ $350k+
BUNDABERG LAND SALES (p)
JUN 15 SEP 15
UNIT PRICEPOINTS
79
352
890
490
6181
391
1026
548
75
<$250,000 $250,000+ $350k+ $500k+ $1m+
BRISBANE CITY UNIT SALES (p)
JUN 15 SEP 15
269 286
173
70
7
235 246203
65 4
<$250,000 $250,000+ $350k+ $500k+ $1m+
BRISBANE SURROUNDS UNIT SALES (p)
JUN 15 SEP 15
INCLUDES IPSWICH, LOGAN, MORETON BAY & REDLAND
195
542471
234
33
265
678
555
337
55
<$250,000 $250,000+ $350k+ $500k+ $1m+
GOLD COAST UNIT SALES (p)
JUN 15 SEP 15
74
209 221
127
28
76
220 217
137
22
<$250,000 $250,000+ $350k+ $500k+ $1m+
SUNSHINE COAST & NOOSA UNIT SALES (p)
JUN 15 SEP 15
27
12
62
1315
2 1
<$250,000 $250,000+ $350k+ $500k+
BUNDABERG UNIT SALES (p)
JUN 15 SEP 15
206
5930 27
3
219
6343 34
6
<$250,000 $250,000+ $350k+ $500k+ $1m+
CAIRNS & DOUGLAS UNIT SALES (p)
JUN 15 SEP 15
3228
93
43
15
3 3
<$250,000 $250,000+ $350k+ $500k+
FRASER COAST UNIT SALES (p)
JUN 15 SEP 15
89
3
1
34
3
0
<$250,000 $250,000+ $350k+ $500k+
GLADSTONE UNIT SALES (p)
JUN 15 SEP 15
34
24 21 18
1
48
24
149
2
<$250,000 $250,000+ $350k+ $500k+ $1m+
TOWNSVILLE UNIT SALES (p)
JUN 15 SEP 15
13
7 64
12
7
3
0
<$250,000 $250,000+ $350k+ $500k+
MACKAY UNIT SALES (p)
JUN 15 SEP 15
12
68
3
7 78
5
<$250,000 $250,000+ $350k+ $500k+
ROCKHAMPTON & LIVINGSTONE UNIT SALES (p)
JUN 15 SEP 15
31
44
144
31
60
187
<$250,000 $250,000+ $350k+ $500k+
TOOWOOMBA UNIT SALES (p)
JUN 15 SEP 15
HOUSE PRICEPOINTS
1,194 1,412
628
18
1,265 1,508
652
29
<$350k $350k+ $500k+ $1m+
BRISBANE SURROUNDS HOUSE SALES (p)
JUN 15 SEP 15INCLUDES IPSWICH, LOGAN, MORETON BAY & REDLAND
55
557 698
119 44
567
776
139
<$350k $350k+ $500k+ $1m+
GOLD COAST HOUSE SALES (p)
JUN 15 SEP 15
163
43
8
166
42
7
<$350k $350k+ $500k+
BUNDABERG HOUSE SALES (p)
JUN 15 SEP 15
153
213
90
3
160
247
114
4
<$350k $350k+ $500k+ $1m+
CAIRNS & DOUGLAS HOUSE SALES (p)
JUN 15 SEP 15
211
71
14
203
78
13
<$350k $350k+ $500k+
FRASER COAST HOUSE SALES (p)
JUN 15 SEP 15
48 52
14
57
45
8
<$350k $350k+ $500k+
GLADSTONE HOUSE SALES (p)
JUN 15 SEP 15
227
156
46
222
149
50
<$350k $350k+ $500k+
TOWNSVILLE HOUSE SALES (p)
JUN 15 SEP 15
75 63
21
89
69
16
<$350k $350k+ $500k+
MACKAY HOUSE SALES (p)
JUN 15 SEP 15
133
72
22
146
57
26
<$350k $350k+ $500k+
ROCKHAMPTON & LIVINGSTONE HOUSE SALES (p)
MAR 15 JUN 15
114
740
1,997
318 124
755
2,126
333
<$350k $350k+ $500k+ $1m+
BRISBANE CITY HOUSE SALES (p)
JUN 15 SEP 15215
163
56
233 200
59
<$350k $350k+ $500k+
TOOWOOMBA HOUSE SALES (p)
JUN 15 SEP 15
70
431 427
58 92
437 477
42
<$350k $350k+ $500k+ $1m+
SUNSHINE COAST & NOOSA HOUSE SALES (p)
JUN 15 SEP 15

10 QUEENSLAND MARKET MONITOR
BRISBANE MARKET UPDATES
RENTAL MARKET - 2 BED UNITSPOST SEP-15 SEP-14
CODE LOCALITYL $/WEEK NEW BONDS $/WEEK NEW BONDS
RENTAL MARKET - 3 BED TOWNHOUSESPOST SEP-15 SEP-14
CODE LOCALITYL $/WEEK NEW BONDS $/WEEK NEW BONDS
DID YOU KNOW?YOU CAN GET MEDIAN WEEKLY RENTS FOR OTHER PROPERTY TYPES ONLINE ATWWW.RTA.QLD.GOV.AU
BRISBANE CITY $415 1715 $405 1653
BAYSIDE $400 144 $400 91
4178 WYNNUM $410 103 $400 53
4179 MANLY $395 41 $390 38
CITY INNER $610 65 $600 66
4000 BRISBANE CITY $600 7 N.A. 2
4005 NEW FARM $690 9 N.A. 2
4006 BOWEN HILLS $490 11 $625 13
4064 PADDINGTON $595 7 $600 14
4066 TOOWONG $640 5 $550 11
4067 ST LUCIA $610 10 $575 9
4169 EAST BRISBANE $620 9 $550 8
NORTH - INNER $490 114 $470 96
4007 ASCOT $550 13 $550 9
4011 CLAYFIELD $520 13 $500 12
4012 NUNDAH $470 20 $450 18
4030 LUTWYCHE $490 13 $495 8
4031 GORDON PARK $460 27 $450 19
4051 ALDERLEY $490 24 $450 28
NORTH - OUTER $390 196 $380 236
4013 NORTHGATE $430 11 $410 12
4014 VIRGINIA $450 7 $0 0
4017 BRACKEN RIDGE $370 42 $365 34
4018 FITZGIBBON $370 32 $296 66
4032 CHERMSIDE $425 28 $430 22
4034 ASPLEY $400 67 $395 93
4036 BALD HILLS $365 9 $294 9
NORTH WEST - INNER $510 16 $500 20
4059 KELVIN GROVE $570 7 $500 13
4060 ASHGROVE $450 6 N.A. 4
NORTH WEST - OUTER $420 46 $425 51
4053 STAFFORD $420 37 $425 41
4054 ARANA HILLS $400 7 $400 7
SOUTH - INNER $450 155 $440 155
4103 ANNERLEY $480 29 $490 27
4104 YERONGA $500 11 $480 17
4105 MOOROOKA $420 12 $450 23
4120 GREENSLOPES $465 18 $495 15
4121 HOLLAND PARK $430 9 $460 7
4122 MANSFIELD $430 75 $420 66
SOUTH - OUTER $400 395 $390 396
4107 SALISBURY $505 6 $495 7
4109 MACGREGOR $415 75 $405 63
4110 ACACIA RIDGE $350 8 $340 41
4112 KURABY $385 18 $380 18
4113 EIGHT MILE PLAINS $410 145 $400 149
4115 ALGESTER $375 27 $380 31
4116 CALAMVALE $385 112 $385 85
SOUTH EAST - INNER $480 241 $485 209
4151 COORPAROO $500 21 $495 8
4152 CAMP HILL $450 114 $450 96
4170 CANNON HILL $500 61 $500 69
4171 BALMORAL $595 38 $540 30
4172 MURARRIE $530 7 $475 6
SOUTH EAST - OUTER $415 59 $410 55
4153 BELMONT $430 10 $420 7
4154 GUMDALE $410 33 $410 30
4173 TINGALPA $399 16 $385 17
SOUTH WEST - INNER $400 62 $420 76
4068 CHELMER $510 11 $485 25
4075 CORINDA $400 51 $400 51
SOUTH WEST - OUTER $360 222 $360 202
4073 SEVENTEEN MILE ROCKS $400 14 $400 11
4074 JINDALEE $480 19 $435 19
4076 DARRA $375 15 $375 28
4077 DOOLANDELLA $355 130 $355 103
4078 FOREST LAKE $365 39 $355 38
BRISBANE CITY $400 4716 $400 4474
BAYSIDE $320 51 $340 37
4178 WYNNUM $310 36 $330 26
4179 MANLY $370 15 $430 11
CITY INNER $495 1924 $495 1925
4000 BRISBANE CITY $580 365 $590 358
4005 NEW FARM $500 359 $495 300
4006 BOWEN HILLS $495 254 $495 279
4064 PADDINGTON $410 64 $405 64
4066 TOOWONG $390 183 $415 248
4067 ST LUCIA $430 125 $430 110
4101 SOUTH BRISBANE $500 284 $500 289
4102 WOOLOONGABBA $450 84 $460 101
4169 EAST BRISBANE $490 206 $465 176
NORTH - INNER $360 924 $360 855
4007 ASCOT $420 172 $395 136
4010 ALBION $375 28 $390 29
4011 CLAYFIELD $345 128 $355 131
4012 NUNDAH $390 237 $375 220
4030 LUTWYCHE $340 140 $340 125
4031 GORDON PARK $325 77 $330 74
4051 ALDERLEY $350 142 $340 140
NORTH - OUTER $350 263 $350 241
4013 NORTHGATE $310 25 $300 27
4017 BRACKEN RIDGE $305 25 $300 22
4018 FITZGIBBON $350 13 $330 5
4032 CHERMSIDE $350 103 $375 102
4034 ASPLEY $350 92 $350 77
NORTH WEST - INNER $435 187 $400 156
4059 KELVIN GROVE $485 134 $430 106
4060 ASHGROVE $360 40 $380 40
4065 BARDON $300 13 $300 10
NORTH WEST - OUTER $375 110 $370 95
4053 STAFFORD $375 107 $370 91
SOUTH - INNER $365 403 $365 444
4103 ANNERLEY $350 105 $350 113
4104 YERONGA $370 26 $370 37
4105 MOOROOKA $350 67 $350 69
4120 GREENSLOPES $360 86 $370 104
4121 HOLLAND PARK $350 42 $340 35
4122 MANSFIELD $410 73 $390 84
SOUTH - OUTER $335 60 $320 58
4106 ROCKLEA $300 5 $250 6
4107 SALISBURY $306 7 N.A. 4
4108 COOPERS PLAINS $400 20 $250 6
4109 MACGREGOR $390 14 $390 24
4113 EIGHT MILE PLAINS $375 5 $340 5
4115 ALGESTER $290 8 $300 6
SOUTH EAST - INNER $390 490 $380 387
4151 COORPAROO $360 177 $360 152
4152 CAMP HILL $360 43 $360 30
4170 CANNON HILL $390 105 $395 88
4171 BALMORAL $450 149 $435 114
4172 MURARRIE $410 16 N.A. 3
SOUTH EAST - OUTER N/A 6 N/A 2
SOUTH WEST - INNER $385 270 $370 251
4068 CHELMER $390 214 $375 212
4075 CORINDA $364 56 $335 39
SOUTH WEST - OUTER $320 28 $325 23
4076 DARRA $240 6 $250 6
4077 DOOLANDELLA $290 8 N.A. 1
4078 FOREST LAKE $330 10 $335 10
11 SEPTEMBER QUARTER 2015
BRISBANE MARKET UPDATES
GREATER BRISBANE
FALLING
STABILISINGRECOVERING
RISING
BRISBANE HOUSE MARKETSSeptember Quarter 2015
Source: REIQ
Brisbane↑ Moreton Bay
↑ LoganRedlandIpswich
FALLING
STABILISINGRECOVERING
RISING
QUEENSLAND HOUSE MARKETSSeptember Quarter 2015
Source: REIQ
Brisbane SDCairns
Gold CoastSunsine Coast
Fraser Coast
MackayBundaberg Gladstone
Rockhampton Townsville
↑ Toowoomba
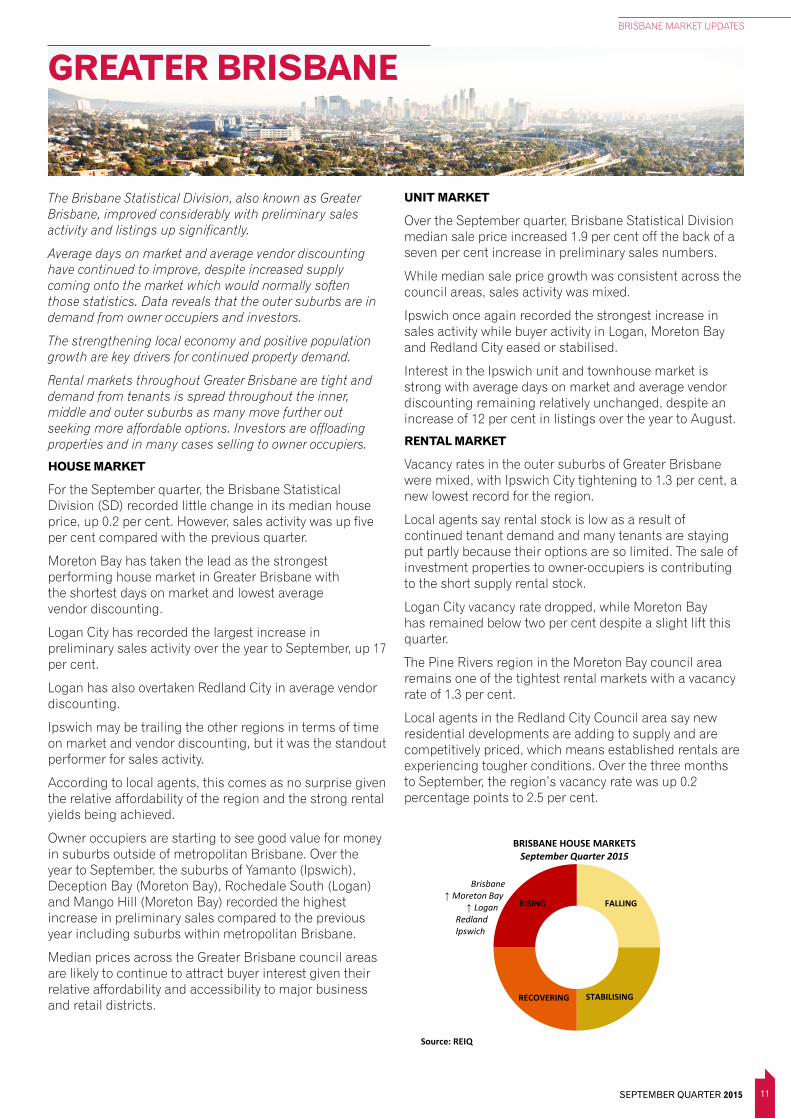
The Brisbane Statistical Division, also known as Greater Brisbane, improved considerably with preliminary sales activity and listings up significantly.
Average days on market and average vendor discounting have continued to improve, despite increased supply coming onto the market which would normally soften those statistics. Data reveals that the outer suburbs are in demand from owner occupiers and investors.
The strengthening local economy and positive population growth are key drivers for continued property demand.
Rental markets throughout Greater Brisbane are tight and demand from tenants is spread throughout the inner, middle and outer suburbs as many move further out seeking more affordable options. Investors are offloading properties and in many cases selling to owner occupiers.
HOUSE MARKET
For the September quarter, the Brisbane Statistical Division (SD) recorded little change in its median house price, up 0.2 per cent. However, sales activity was up five per cent compared with the previous quarter.
Moreton Bay has taken the lead as the strongest performing house market in Greater Brisbane with the shortest days on market and lowest average vendor discounting.
Logan City has recorded the largest increase in preliminary sales activity over the year to September, up 17 per cent.
Logan has also overtaken Redland City in average vendor discounting.
Ipswich may be trailing the other regions in terms of time on market and vendor discounting, but it was the standout performer for sales activity.
According to local agents, this comes as no surprise given the relative affordability of the region and the strong rental yields being achieved.
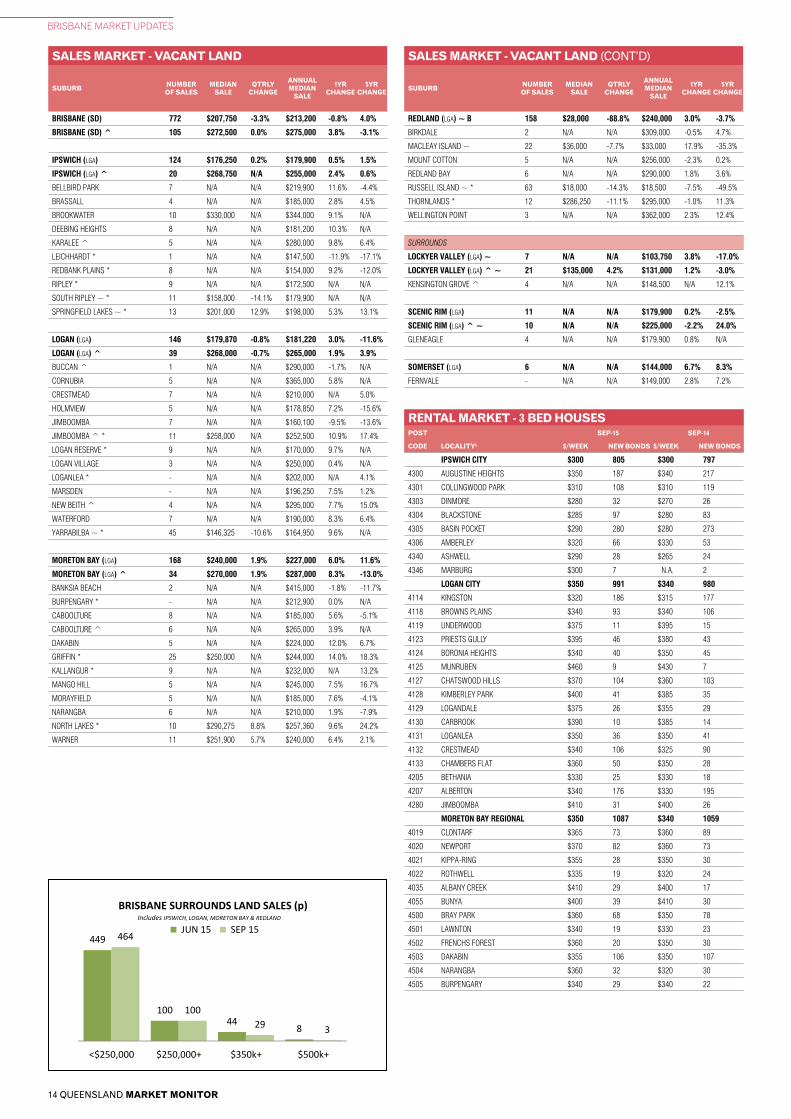
Owner occupiers are starting to see good value for money in suburbs outside of metropolitan Brisbane. Over the year to September, the suburbs of Yamanto (Ipswich), Deception Bay (Moreton Bay), Rochedale South (Logan) and Mango Hill (Moreton Bay) recorded the highest increase in preliminary sales compared to the previous year including suburbs within metropolitan Brisbane.
Median prices across the Greater Brisbane council areas are likely to continue to attract buyer interest given their relative affordability and accessibility to major business and retail districts.
UNIT MARKET
Over the September quarter, Brisbane Statistical Division median sale price increased 1.9 per cent off the back of a seven per cent increase in preliminary sales numbers.
While median sale price growth was consistent across the council areas, sales activity was mixed.
Ipswich once again recorded the strongest increase in sales activity while buyer activity in Logan, Moreton Bay and Redland City eased or stabilised.
Interest in the Ipswich unit and townhouse market is strong with average days on market and average vendor discounting remaining relatively unchanged, despite an increase of 12 per cent in listings over the year to August.
RENTAL MARKET
Vacancy rates in the outer suburbs of Greater Brisbane were mixed, with Ipswich City tightening to 1.3 per cent, a new lowest record for the region.
Local agents say rental stock is low as a result of continued tenant demand and many tenants are staying put partly because their options are so limited. The sale of investment properties to owner-occupiers is contributing to the short supply rental stock.
Logan City vacancy rate dropped, while Moreton Bay has remained below two per cent despite a slight lift this quarter.
The Pine Rivers region in the Moreton Bay council area remains one of the tightest rental markets with a vacancy rate of 1.3 per cent.
Local agents in the Redland City Council area say new residential developments are adding to supply and are competitively priced, which means established rentals are experiencing tougher conditions. Over the three months to September, the region’s vacancy rate was up 0.2 percentage points to 2.5 per cent.

12 QUEENSLAND MARKET MONITOR
BRISBANE MARKET UPDATES
MUNRUBEN ^ 7 N/A N/A $516,000 0.2% 1.2%
NEW BEITH ^ 10 $562,750 N/A $550,000 -0.9% 4.0%
REGENTS PARK 53 $360,000 -4.5% $355,278 0.4% -2.7%
ROCHEDALE SOUTH 59 $464,000 3.1% $453,000 6.6% 8.1%
SHAILER PARK 42 $527,250 1.4% $510,000 6.6% 8.5%
SLACKS CREEK 29 $320,000 4.6% $315,000 6.8% 5.0%
SPRINGWOOD 23 $435,000 -3.9% $443,500 1.3% 5.5%
TANAH MERAH 19 $410,000 -1.9% $410,000 3.8% 4.6%
UNDERWOOD 24 $500,000 0.9% $500,000 4.5% 11.7%
WATERFORD 15 $358,000 -5.8% $380,000 7.0% -6.2%
WATERFORD WEST 15 $314,000 -6.3% $311,000 -1.0% -2.8%
WINDAROO 16 $397,000 -8.3% $420,000 0.7% -1.2%
WOODRIDGE 27 $298,000 3.7% $280,000 7.7% 3.3%
YARRABILBA 14 $395,000 5.9% $381,950 -3.7% N/A
MORETON BAY (LGA) 1,349 $406,000 1.2% $401,000 2.8% 0.3%
MORETON BAY (LGA) ^ 219 $582,000 0.8% $590,000 5.4% -1.6%
ALBANY CREEK 38 $571,500 -1.1% $540,000 8.0% 2.5%
ARANA HILLS 22 $482,500 2.5% $487,330 6.9% 7.1%
BANKSIA BEACH ~ f 30 $580,000 28.9% $490,000 5.2% 1.0%
BEACHMERE 7 N/A N/A $320,000 0.8% -11.1%
BELLARA 12 $352,500 12.4% $325,000 -0.9% -4.4%
BELLMERE 21 $350,000 7.7% $335,000 3.1% -7.7%
BONGAREE 21 $367,500 -11.4% $389,000 -2.1% -7.4%
BRAY PARK 37 $387,000 -0.8% $385,000 5.5% 4.6%
BUNYA ^ 7 N/A N/A $802,500 10.5% N/A
BURPENGARY 24 $406,000 5.5% $382,000 7.0% 1.9%
BURPENGARY ^ 9 N/A N/A $543,750 2.6% 2.3%
BURPENGARY EAST 4 N/A N/A $410,500 3.4% N/A
BURPENGARY EAST ^ 6 N/A N/A $525,000 -0.9% -6.3%
CABOOLTURE 57 $290,250 3.8% $295,000 2.8% -7.8%
CABOOLTURE ^ 21 $517,500 5.6% $500,000 10.9% 6.4%
CABOOLTURE SOUTH 23 $279,000 5.9% $266,000 -3.3% -9.2%
CASHMERE ~ 13 $684,500 16.8% $653,750 5.9% 21.1%
CLONTARF 40 $415,000 0.0% $395,000 5.3% 9.1%
DAKABIN 7 N/A N/A $450,000 5.9% 4.7%
DECEPTION BAY 80 $330,000 4.6% $320,000 6.7% 0.0%
EATONS HILL 16 $546,000 3.9% $540,000 1.1% 5.2%
ELIMBAH ^ 12 $505,000 -1.9% $510,000 6.3% -1.1%
EVERTON HILLS 10 $527,000 5.0% $512,000 5.6% 10.7%
FERNY HILLS 23 $512,500 2.5% $486,250 4.9% 5.7%
GRIFFIN 29 $455,000 8.1% $438,250 1.3% 5.6%
JOYNER 6 N/A N/A $533,000 N/A 14.6%
KALLANGUR 57 $370,000 4.8% $355,000 4.1% -0.6%
KIPPA-RING 25 $385,000 0.0% $375,000 0.0% 1.4%
LAWNTON 13 $365,000 3.9% $362,500 7.1% 3.9%
MANGO HILL ~ 24 $515,000 17.6% $455,000 4.5% 0.7%
MARGATE 24 $410,000 -8.9% $417,000 11.2% 8.3%
MORAYFIELD 57 $335,000 4.7% $325,000 4.8% -3.0%
MORAYFIELD ^ 12 $558,000 4.3% $550,000 5.8% 0.0%
MURRUMBA DOWNS 24 $463,000 -7.4% $481,500 7.0% 9.4%
NARANGBA 61 $447,500 2.9% $440,000 4.8% 1.4%
NARANGBA ^ 5 N/A N/A $650,000 N/A N/A
NEWPORT 13 $799,000 N/A $799,000 -1.4% -6.0%
NINGI 7 N/A N/A $360,000 2.3% N/A
NINGI ^ 14 $442,250 N/A $508,750 6.0% -1.2%
NORTH LAKES 81 $445,000 -1.1% $449,750 0.1% -1.2%
PETRIE 33 $372,000 -3.1% $392,000 5.9% 1.1%
REDCLIFFE 33 $397,500 -0.4% $390,000 3.4% 2.6%
ROTHWELL 18 $404,250 2.9% $397,000 3.1% 3.7%
SAMFORD VALLEY ^ 16 $880,000 N/A $875,000 1.6% 5.7%
SANDSTONE POINT 14 $379,500 -3.9% $380,000 2.7% -5.0%
SCARBOROUGH ~ f 33 $415,000 -22.3% $465,000 -3.0% -3.1%
STRATHPINE 40 $350,500 -1.3% $355,000 0.0% 1.4%
TOORBUL 6 N/A N/A $275,000 N/A N/A
UPPER CABOOLTURE 7 N/A N/A $335,000 6.3% -3.1%
UPPER CABOOLTURE ^ 6 N/A N/A $530,000 4.4% -3.2%
WAMURAN ^ 12 $522,500 N/A $532,500 9.0% N/A
WARNER 44 $485,000 4.3% $482,500 2.7% 0.7%
SALES MARKET - HOUSES (CONT’D)
SUBURB NUMBER OF SALES
MEDIAN SALE
QTRLY CHANGE
ANNUAL MEDIAN
SALE
1YR CHANGE
5YR CHANGE
SALES MARKET - HOUSES
SUBURB NUMBER OF SALES
MEDIAN SALE
QTRLY CHANGE
ANNUAL MEDIAN
SALE
1YR CHANGE
5YR CHANGE
BRISBANE (SD) 7,002 $480,000 0.2% $480,000 2.1% 5.5%
BRISBANE (SD) ^ 582 $585,000 1.7% $580,000 3.6% -0.6%
IPSWICH (LGA) 718 $320,000 1.6% $320,000 4.6% 0.0%
IPSWICH (LGA) ^ 58 $500,000 2.8% $480,000 5.5% -2.0%
AUGUSTINE HEIGHTS 19 $445,000 -3.1% $499,500 2.7% -11.6%
BELLBIRD PARK 16 $315,000 3.9% $325,000 4.4% 1.9%
BOOVAL 11 $289,500 8.2% $279,500 7.5% -2.6%
BRASSALL 36 $335,000 6.3% $322,000 2.2% -3.9%
BROOKWATER ~ * 13 $730,000 N/A $700,000 -2.8% N/A
BUNDAMBA 24 $271,000 0.7% $280,000 1.8% 2.4%
CAMIRA 20 $355,500 0.1% $349,500 5.2% -0.4%
COALFALLS 10 $290,000 N/A $290,000 N/A N/A
COLLINGWOOD PARK 34 $329,500 6.3% $313,000 2.6% -2.0%
DEEBING HEIGHTS 14 $369,000 N/A $380,000 N/A N/A
EAST IPSWICH ~ 10 $250,000 -29.8% $270,000 12.5% -1.8%
EASTERN HEIGHTS 12 $256,000 -1.5% $265,000 -2.8% -5.9%
FLINDERS VIEW ~ 16 $305,500 -16.8% $337,000 -5.7% -15.2%
GAILES 7 N/A N/A $235,250 N/A N/A
GOODNA 27 $285,000 0.9% $285,000 1.8% -3.4%
IPSWICH ~ 14 $315,000 -4.5% $343,500 30.6% 3.5%
KARALEE ^ 11 $560,000 8.7% $515,000 1.0% -2.4%
LEICHHARDT 8 N/A N/A $222,000 3.3% -11.2%
NEWTOWN 6 N/A N/A $325,000 3.7% -5.8%
NORTH BOOVAL 9 N/A N/A $275,000 19.6% -3.1%
NORTH IPSWICH 17 $265,000 -1.9% $264,000 4.3% -10.1%
ONE MILE 9 N/A N/A $245,000 6.5% -4.3%
RACEVIEW 37 $306,000 1.2% $307,000 1.3% -5.5%
REDBANK 8 N/A N/A $292,500 N/A N/A
REDBANK PLAINS 69 $310,000 1.5% $310,000 5.1% 2.3%
RIVERVIEW 9 N/A N/A $223,750 -4.8% -11.6%
ROSEWOOD 5 N/A N/A $274,750 5.7% 3.3%
SADLIERS CROSSING 9 N/A N/A $321,000 N/A 1.6%
SILKSTONE 13 $287,000 7.1% $262,500 -0.9% -7.0%
SPRINGFIELD 32 $405,000 5.2% $390,000 3.2% 4.3%
SPRINGFIELD LAKES 54 $410,000 -1.3% $414,936 5.0% 2.3%
YAMANTO 32 $420,000 2.4% $415,000 18.6% 18.6%
LOGAN (LGA) 910 $359,000 0.4% $358,000 3.8% -0.6%
LOGAN (LGA) ^ 180 $537,500 1.4% $526,750 3.3% 2.3%
BEENLEIGH 34 $300,000 -4.3% $305,500 5.3% -7.4%
BETHANIA 9 N/A N/A $302,000 7.0% -4.1%
BORONIA HEIGHTS 24 $318,000 3.2% $315,000 0.0% -0.3%
BROWNS PLAINS 21 $320,000 1.6% $315,000 3.4% -3.7%
CEDAR GROVE ^ 7 N/A N/A $419,000 -1.4% -0.2%
CEDAR VALE ^ 9 N/A N/A $460,000 7.0% 5.1%
CHAMBERS FLAT ^ 5 N/A N/A $508,000 N/A N/A
CORNUBIA ^ 6 N/A N/A $745,000 N/A N/A
CORNUBIA ~ 20 $505,000 26.3% $495,000 5.3% 5.4%
CRESTMEAD 51 $302,000 -2.6% $302,000 4.1% -3.2%
DAISY HILL 32 $430,000 2.4% $450,000 4.3% 7.1%
EAGLEBY 43 $281,000 3.3% $271,500 6.5% -6.4%
EDENS LANDING 16 $344,000 10.3% $339,000 -0.3% -6.1%
FORESTDALE ^ 5 N/A N/A $720,000 11.6% 7.1%
GREENBANK ^ 25 $560,000 7.7% $526,500 1.7% 0.3%
HERITAGE PARK 16 $436,000 -2.4% $417,500 2.7% -0.6%
HILLCREST 14 $336,000 0.0% $335,000 4.7% -1.5%
HOLMVIEW 11 $353,500 -1.3% $358,000 N/A N/A
JIMBOOMBA 13 $385,250 -1.2% $377,750 4.6% 0.7%
JIMBOOMBA ^ 22 $472,000 2.6% $465,000 1.1% -5.0%
KINGSTON 39 $300,000 5.8% $285,000 7.5% -0.8%
LOGAN CENTRAL 14 $295,000 0.0% $289,145 9.5% 4.0%
LOGAN RESERVE 14 $360,000 -12.6% $374,806 10.6% N/A
LOGAN VILLAGE ^ 5 N/A N/A $492,000 -0.6% -8.3%
LOGANHOLME 20 $385,000 8.1% $380,000 6.1% 1.3%
LOGANLEA 24 $325,000 -8.1% $331,250 7.4% 1.9%
MARSDEN 43 $326,000 0.3% $334,500 7.2% 3.6%
MEADOWBROOK 8 N/A N/A $389,500 5.3% -2.4%
MOUNT WARREN PARK 28 $329,000 -7.5% $335,500 -1.3% -11.2%
13 SEPTEMBER QUARTER 2015
BRISBANE MARKET UPDATES
WARNER ^ 4 N/A N/A $763,000 10.6% N/A
WOODY POINT ~ 17 $425,000 -14.5% $440,000 13.5% 11.6%
REDLAND (LGA) 544 $485,000 1.0% $480,000 3.2% 2.1%
REDLAND (LGA) ^ 31 $788,500 -8.7% $850,000 6.9% 1.8%
ALEXANDRA HILLS 51 $429,500 4.8% $419,500 2.3% 2.3%
BIRKDALE 36 $520,000 4.0% $497,000 3.3% 4.7%
CAPALABA 41 $438,750 2.8% $435,000 2.4% 5.4%
CAPALABA ^ 4 N/A N/A $830,000 0.0% 0.6%
CLEVELAND ~ 54 $610,000 15.4% $550,000 7.1% 4.1%
MACLEAY ISLAND 15 $217,000 N/A $224,000 9.3% -10.2%
MOUNT COTTON 20 $462,500 -7.4% $480,000 2.3% 3.2%
ORMISTON 23 $699,000 5.6% $650,250 18.4% 4.9%
REDLAND BAY 51 $512,500 -0.5% $510,000 2.2% 4.1%
RUSSELL ISLAND ~ 13 $198,000 21.8% $170,000 -2.9% -24.8%
THORNESIDE ~ 12 $496,000 23.2% $480,000 9.7% 5.0%
THORNLANDS 42 $520,000 -5.5% $535,000 4.6% -3.1%
THORNLANDS ^ 9 N/A N/A $872,500 N/A -4.1%
VICTORIA POINT 49 $500,000 4.2% $486,475 4.0% -0.7%
WELLINGTON POINT 42 $500,000 -13.0% $567,500 9.1% 4.1%
SURROUNDS
LOCKYER VALLEY (LGA) 43 $250,000 8.1% $244,000 -0.6% -10.0%
LOCKYER VALLEY (LGA) ^ 60 $330,000 -5.7% $355,000 4.4% -1.4%
GATTON 17 $242,250 -2.9% $250,000 -3.3% -13.8%
KENSINGTON GROVE ^ 4 N/A N/A $375,000 3.7% N/A
LAIDLEY 9 N/A N/A $212,000 -0.2% -15.6%
LAIDLEY HEIGHTS ^ 4 N/A N/A $294,000 N/A -12.2%
REGENCY DOWNS ^ ~ 5 N/A N/A $292,500 -4.1% -14.0%
SCENIC RIM (LGA) 55 $385,000 6.8% $369,000 5.4% -1.6%
SCENIC RIM (LGA) ^ 80 $518,500 -2.2% $510,000 6.3% 0.5%
BEAUDESERT 13 $325,000 3.5% $328,000 2.9% -2.4%
BOONAH 4 N/A N/A $275,000 1.9% 0.5%
KOORALBYN ^ 6 N/A N/A $310,932 -1.3% -8.5%
TAMBORINE ^ 10 $533,500 0.9% $525,000 -1.4% -7.5%
TAMBORINE MOUNTAIN 21 $460,000 11.9% $430,000 -1.1% -3.4%
TAMBORINE MOUNTAIN ^ ~ 16 $820,000 28.6% $740,000 26.5% -2.6%
SOMERSET (LGA) 32 $238,000 -7.8% $247,500 -2.6% -9.2%
SOMERSET (LGA) ^ 48 $375,000 4.2% $370,000 -2.5% 0.0%
FERNVALE 6 N/A N/A $335,000 -0.6% N/A
KILCOY 7 N/A N/A $227,000 -4.6% -17.5%
LOWOOD 3 N/A N/A $250,000 -3.1% -7.4%
SALES MARKET - HOUSES (CONT’D)
SUBURB NUMBER OF SALES
MEDIAN SALE
QTRLY CHANGE
ANNUAL MEDIAN
SALE
1YR CHANGE
5YR CHANGE
UNIT PRICEPOINTS
79
352
890
490
6181
391
1026
548
75
<$250,000 $250,000+ $350k+ $500k+ $1m+
BRISBANE CITY UNIT SALES (p)
JUN 15 SEP 15
269 286
173
70
7
235 246203
65 4
<$250,000 $250,000+ $350k+ $500k+ $1m+
BRISBANE SURROUNDS UNIT SALES (p)
JUN 15 SEP 15
INCLUDES IPSWICH, LOGAN, MORETON BAY & REDLAND
195
542471
234
33
265
678
555
337
55
<$250,000 $250,000+ $350k+ $500k+ $1m+
GOLD COAST UNIT SALES (p)
JUN 15 SEP 15
74
209 221
127
28
76
220 217
137
22
<$250,000 $250,000+ $350k+ $500k+ $1m+
SUNSHINE COAST & NOOSA UNIT SALES (p)
JUN 15 SEP 15
27
12
62
1315
2 1
<$250,000 $250,000+ $350k+ $500k+
BUNDABERG UNIT SALES (p)
JUN 15 SEP 15
206
5930 27
3
219
6343 34
6
<$250,000 $250,000+ $350k+ $500k+ $1m+
CAIRNS & DOUGLAS UNIT SALES (p)
JUN 15 SEP 15
3228
93
43
15
3 3
<$250,000 $250,000+ $350k+ $500k+
FRASER COAST UNIT SALES (p)
JUN 15 SEP 15
89
3
1
34
3
0
<$250,000 $250,000+ $350k+ $500k+
GLADSTONE UNIT SALES (p)
JUN 15 SEP 15
34
24 21 18
1
48
24
149
2
<$250,000 $250,000+ $350k+ $500k+ $1m+
TOWNSVILLE UNIT SALES (p)
JUN 15 SEP 15
13
7 64
12
7
3
0
<$250,000 $250,000+ $350k+ $500k+
MACKAY UNIT SALES (p)
JUN 15 SEP 15
12
68
3
7 78
5
<$250,000 $250,000+ $350k+ $500k+
ROCKHAMPTON & LIVINGSTONE UNIT SALES (p)
JUN 15 SEP 15
31
44
144
31
60
187
<$250,000 $250,000+ $350k+ $500k+
TOOWOOMBA UNIT SALES (p)
JUN 15 SEP 15
SALES MARKET - UNITS & TOWNHOUSES (CONT’D)
SUBURB NUMBER OF SALES
MEDIAN SALE
QTRLY CHANGE
ANNUAL MEDIAN
SALE
1YR CHANGE
5YR CHANGE
BRISBANE (SD) 2,937 $397,500 1.9% $395,000 1.3% 3.3%
IPSWICH (LGA) 85 $258,000 3.2% $298,000 3.2% 3.5%
BRASSALL 1 N/A N/A $248,500 0.2% -16.5%
BUNDAMBA 6 N/A N/A $302,900 4.4% N/A
GOODNA ~ 9 N/A N/A $252,000 -18.7% N/A
REDBANK PLAINS ~ 3 N/A N/A $225,000 2.7% -23.7%
SPRINGFIELD LAKES 5 N/A N/A $381,900 N/A N/A
SALES MARKET - UNITS & TOWNHOUSES
LOGAN (LGA) 235 $238,000 3.9% $241,000 -2.8% -12.4%
BEENLEIGH ~ 8 N/A N/A $190,000 7.5% -22.4%
BORONIA HEIGHTS ~ t 2 N/A N/A $225,000 12.5% N/A
DAISY HILL 5 N/A N/A $312,500 N/A N/A
EAGLEBY ~ 21 $230,000 11.7% $210,000 -19.2% -25.0%
EDENS LANDING 4 N/A N/A $210,000 N/A N/A
HILLCREST 6 N/A N/A $230,000 6.4% N/A
KINGSTON 5 N/A N/A $275,000 -6.8% -8.3%
LOGAN CENTRAL 5 N/A N/A $184,000 8.2% -10.2%
MARSDEN 8 N/A N/A $331,000 0.3% -6.8%
MEADOWBROOK 5 N/A N/A $248,000 -1.6% -17.3%
MOUNT WARREN PARK 4 N/A N/A $215,000 4.4% -14.0%
ROCHEDALE SOUTH 6 N/A N/A $275,000 1.7% -3.8%
SHAILER PARK 10 $288,000 N/A $280,000 6.5% -8.4%
SLACKS CREEK 15 $227,000 N/A $215,000 7.5% -10.9%
SPRINGWOOD 9 N/A N/A $277,500 6.5% -1.6%
UNDERWOOD 7 N/A N/A $357,500 -5.9% 10.0%
WATERFORD WEST 6 N/A N/A $195,000 0.0% -15.2%
WOODRIDGE 34 $191,500 0.3% $189,000 3.8% -14.9%
MORETON BAY (LGA) 305 $330,000 3.9% $332,500 0.8% -2.2%
ALBANY CREEK * t 2 N/A N/A $417,000 N/A N/A
BELLARA ~ 2 N/A N/A $230,000 N/A -21.4%
BONGAREE 18 $300,000 -4.8% $308,750 6.6% -11.8%
BRENDALE ~ t 17 $255,000 -10.8% $267,000 -16.6% -10.7%
BURPENGARY 2 N/A N/A $281,500 4.3% -7.7%
CABOOLTURE ~ 11 $201,000 -3.8% $189,950 -4.8% -34.5%
CLONTARF ~ 2 N/A N/A $391,250 -9.2% 13.4%
DECEPTION BAY ~ 12 $240,000 3.0% $240,000 -10.8% -26.2%
GRIFFIN 6 N/A N/A $358,500 1.3% N/A
KALLANGUR 16 $300,000 -1.6% $307,250 -6.6% -5.5%
KIPPA-RING 5 N/A N/A $280,000 5.1% -16.9%
LAWNTON ~ 8 N/A N/A $225,000 2.3% -34.8%
MANGO HILL 2 N/A N/A $365,000 2.8% -2.7%
MARGATE 7 N/A N/A $360,000 -3.4% -1.1%
MORAYFIELD 3 N/A N/A $275,000 N/A 8.3%
MURRUMBA DOWNS 14 $330,000 -6.5% $340,000 -3.3% -2.3%
NORTH LAKES ~ 5 N/A N/A $422,500 17.7% N/A
PETRIE 3 N/A N/A $335,500 N/A N/A
REDCLIFFE ~ 24 $331,250 -10.5% $371,800 7.8% -8.2%
SCARBOROUGH ~ 14 $409,500 19.7% $377,500 -3.2% -13.2%
STRATHPINE 4 N/A N/A $263,500 3.4% -7.7%
WOODY POINT ~ 11 $330,000 N/A $310,000 -2.4% -33.0%
WOORIM 7 N/A N/A $353,750 N/A N/A
REDLAND (LGA) ~ t 140 $390,000 6.1% $394,500 12.7% 8.1%
BIRKDALE 11 $392,500 -0.6% $387,500 N/A N/A
CAPALABA ~ 20 $315,000 14.5% $306,114 2.6% 0.4%
CLEVELAND 36 $388,500 11.6% $400,000 -3.6% 3.9%
ORMISTON 7 N/A N/A $360,000 2.9% 2.3%
THORNESIDE 13 $325,000 N/A $321,000 3.2% 7.4%
THORNLANDS 2 N/A N/A $394,500 N/A N/A
VICTORIA POINT 7 N/A N/A $376,000 7.4% 3.0%
WELLINGTON POINT 11 $458,900 1.0% $456,900 N/A N/A
HOUSE PRICEPOINTS
1,194 1,412
628
18
1,265 1,508
652
29
<$350k $350k+ $500k+ $1m+
BRISBANE SURROUNDS HOUSE SALES (p)
JUN 15 SEP 15INCLUDES IPSWICH, LOGAN, MORETON BAY & REDLAND
55
557 698
119 44
567
776
139
<$350k $350k+ $500k+ $1m+
GOLD COAST HOUSE SALES (p)
JUN 15 SEP 15
163
43
8
166
42
7
<$350k $350k+ $500k+
BUNDABERG HOUSE SALES (p)
JUN 15 SEP 15
153
213
90
3
160
247
114
4
<$350k $350k+ $500k+ $1m+
CAIRNS & DOUGLAS HOUSE SALES (p)
JUN 15 SEP 15
211
71
14
203
78
13
<$350k $350k+ $500k+
FRASER COAST HOUSE SALES (p)
JUN 15 SEP 15
48 52
14
57
45
8
<$350k $350k+ $500k+
GLADSTONE HOUSE SALES (p)
JUN 15 SEP 15
227
156
46
222
149
50
<$350k $350k+ $500k+
TOWNSVILLE HOUSE SALES (p)
JUN 15 SEP 15
75 63
21
89
69
16
<$350k $350k+ $500k+
MACKAY HOUSE SALES (p)
JUN 15 SEP 15
133
72
22
146
57
26
<$350k $350k+ $500k+
ROCKHAMPTON & LIVINGSTONE HOUSE SALES (p)
MAR 15 JUN 15
114
740
1,997
318 124
755
2,126
333
<$350k $350k+ $500k+ $1m+
BRISBANE CITY HOUSE SALES (p)
JUN 15 SEP 15215
163
56
233 200
59
<$350k $350k+ $500k+
TOOWOOMBA HOUSE SALES (p)
JUN 15 SEP 15
70
431 427
58 92
437 477
42
<$350k $350k+ $500k+ $1m+
SUNSHINE COAST & NOOSA HOUSE SALES (p)
JUN 15 SEP 15
14 QUEENSLAND MARKET MONITOR
BRISBANE MARKET UPDATES
REDLAND (LGA) ~ B 158 $28,000 -88.8% $240,000 3.0% -3.7%
BIRKDALE 2 N/A N/A $309,000 -0.5% 4.7%
MACLEAY ISLAND ~ 22 $36,000 -7.7% $33,000 17.9% -35.3%
MOUNT COTTON 5 N/A N/A $256,000 -2.3% 0.2%
REDLAND BAY 6 N/A N/A $290,000 1.8% 3.6%
RUSSELL ISLAND ~ * 63 $18,000 -14.3% $18,500 -7.5% -49.5%
THORNLANDS * 12 $286,250 -11.1% $295,000 -1.0% 11.3%
WELLINGTON POINT 3 N/A N/A $362,000 2.3% 12.4%
SURROUNDS
LOCKYER VALLEY (LGA) ~ 7 N/A N/A $103,750 3.8% -17.0%
LOCKYER VALLEY (LGA) ^ ~ 21 $135,000 4.2% $131,000 1.2% -3.0%
KENSINGTON GROVE ^ 4 N/A N/A $148,500 N/A 12.1%
SCENIC RIM (LGA) 11 N/A N/A $179,900 0.2% -2.5%
SCENIC RIM (LGA) ^ ~ 10 N/A N/A $225,000 -2.2% 24.0%
GLENEAGLE 4 N/A N/A $179,900 0.8% N/A
SOMERSET (LGA) 6 N/A N/A $144,000 6.7% 8.3%
FERNVALE - N/A N/A $149,000 2.8% 7.2%
SALES MARKET - VACANT LAND (CONT’D)
SUBURB NUMBER OF SALES
MEDIAN SALE
QTRLY CHANGE
ANNUAL MEDIAN
SALE
1YR CHANGE
5YR CHANGE
RENTAL MARKET - 3 BED HOUSESPOST SEP-15 SEP-14
CODE LOCALITYL $/WEEK NEW BONDS $/WEEK NEW BONDS
BRISBANE (SD) 772 $207,750 -3.3% $213,200 -0.8% 4.0%
BRISBANE (SD) ^ 105 $272,500 0.0% $275,000 3.8% -3.1%
IPSWICH (LGA) 124 $176,250 0.2% $179,900 0.5% 1.5%
IPSWICH (LGA) ^ 20 $268,750 N/A $255,000 2.4% 0.6%
BELLBIRD PARK 7 N/A N/A $219,900 11.6% -4.4%
BRASSALL 4 N/A N/A $185,000 2.8% 4.5%
BROOKWATER 10 $330,000 N/A $344,000 9.1% N/A
DEEBING HEIGHTS 8 N/A N/A $181,200 10.3% N/A
KARALEE ^ 5 N/A N/A $280,000 9.8% 6.4%
LEICHHARDT * 1 N/A N/A $147,500 -11.9% -17.1%
REDBANK PLAINS * 8 N/A N/A $154,000 9.2% -12.0%
RIPLEY * 9 N/A N/A $172,500 N/A N/A
SOUTH RIPLEY ~ * 11 $158,000 -14.1% $179,900 N/A N/A
SPRINGFIELD LAKES ~ * 13 $201,000 12.9% $198,000 5.3% 13.1%
LOGAN (LGA) 146 $179,870 -0.8% $181,220 3.0% -11.6%
LOGAN (LGA) ^ 39 $268,000 -0.7% $265,000 1.9% 3.9%
BUCCAN ^ 1 N/A N/A $290,000 -1.7% N/A
CORNUBIA 5 N/A N/A $365,000 5.8% N/A
CRESTMEAD 7 N/A N/A $210,000 N/A 5.0%
HOLMVIEW 5 N/A N/A $178,850 7.2% -15.6%
JIMBOOMBA 7 N/A N/A $160,100 -9.5% -13.6%
JIMBOOMBA ^ * 11 $258,000 N/A $252,500 10.9% 17.4%
LOGAN RESERVE * 9 N/A N/A $170,000 9.7% N/A
LOGAN VILLAGE 3 N/A N/A $250,000 0.4% N/A
LOGANLEA * - N/A N/A $202,000 N/A 4.1%
MARSDEN - N/A N/A $196,250 7.5% 1.2%
NEW BEITH ^ 4 N/A N/A $295,000 7.7% 15.0%
WATERFORD 7 N/A N/A $190,000 8.3% 6.4%
YARRABILBA ~ * 45 $146,325 -10.6% $164,950 9.6% N/A
MORETON BAY (LGA) 168 $240,000 1.9% $227,000 6.0% 11.6%
MORETON BAY (LGA) ^ 34 $270,000 1.9% $287,000 8.3% -13.0%
BANKSIA BEACH 2 N/A N/A $415,000 -1.8% -11.7%
BURPENGARY * - N/A N/A $212,900 0.0% N/A
CABOOLTURE 8 N/A N/A $185,000 5.6% -5.1%
CABOOLTURE ^ 6 N/A N/A $265,000 3.9% N/A
DAKABIN 5 N/A N/A $224,000 12.0% 6.7%
GRIFFIN * 25 $250,000 N/A $244,000 14.0% 18.3%
KALLANGUR * 9 N/A N/A $232,000 N/A 13.2%
MANGO HILL 5 N/A N/A $245,000 7.5% 16.7%
MORAYFIELD 5 N/A N/A $185,000 7.6% -4.1%
NARANGBA 6 N/A N/A $210,000 1.9% -7.9%
NORTH LAKES * 10 $290,275 8.8% $257,360 9.6% 24.2%
WARNER 11 $251,900 5.7% $240,000 6.4% 2.1%
IPSWICH CITY $300 805 $300 797
4300 AUGUSTINE HEIGHTS $350 187 $340 217
4301 COLLINGWOOD PARK $310 108 $310 119
4303 DINMORE $280 32 $270 26
4304 BLACKSTONE $285 97 $280 83
4305 BASIN POCKET $290 280 $280 273
4306 AMBERLEY $320 66 $330 53
4340 ASHWELL $290 28 $265 24
4346 MARBURG $300 7 N.A. 2
LOGAN CITY $350 991 $340 980
4114 KINGSTON $320 186 $315 177
4118 BROWNS PLAINS $340 93 $340 106
4119 UNDERWOOD $375 11 $395 15
4123 PRIESTS GULLY $395 46 $380 43
4124 BORONIA HEIGHTS $340 40 $350 45
4125 MUNRUBEN $460 9 $430 7
4127 CHATSWOOD HILLS $370 104 $360 103
4128 KIMBERLEY PARK $400 41 $385 35
4129 LOGANDALE $375 26 $355 29
4130 CARBROOK $390 10 $385 14
4131 LOGANLEA $350 36 $350 41
4132 CRESTMEAD $340 106 $325 90
4133 CHAMBERS FLAT $360 50 $350 28
4205 BETHANIA $330 25 $330 18
4207 ALBERTON $340 176 $330 195
4280 JIMBOOMBA $410 31 $400 26
MORETON BAY REGIONAL $350 1087 $340 1059
4019 CLONTARF $365 73 $360 89
4020 NEWPORT $370 82 $360 73
4021 KIPPA-RING $355 28 $350 30
4022 ROTHWELL $335 19 $320 24
4035 ALBANY CREEK $410 29 $400 17
4055 BUNYA $400 39 $410 30
4500 BRAY PARK $360 68 $350 78
4501 LAWNTON $340 19 $330 23
4502 FRENCHS FOREST $360 20 $350 30
4503 DAKABIN $355 106 $350 107
4504 NARANGBA $360 32 $320 30
4505 BURPENGARY $340 29 $340 22
SALES MARKET - VACANT LAND
SUBURB NUMBER OF SALES
MEDIAN SALE
QTRLY CHANGE
ANNUAL MEDIAN
SALE
1YR CHANGE
5YR CHANGE
LAND PRICEPOINTS
(p) Preliminary. See explanatory notes for further information. Source: REIQ, data provided by CoreLogic RP Data.
34 38 36 33
20
7058
28
<$250,000 $250,000+ $350k+ $500k+
BRISBANE CITY LAND SALES (p)
JUN 15 SEP 15
449
10044
8
464
10029 3
<$250,000 $250,000+ $350k+ $500k+
BRISBANE SURROUNDS LAND SALES (p)
JUN 15 SEP 15Includes IPSWICH, LOGAN, MORETON BAY & REDLAND
98
38
617
111
36
13 14
<$250,000 $250,000+ $350k+ $500k+
GOLD COAST LAND SALES (p)
JUN 15 SEP 15
70
36
21
7
6155
149
<$250,000 $250,000+ $350k+ $500k+
SUNSHINE COAST & NOOSA LAND SALES (p)
JUN 15 SEP 1581
124
56
115
<$250,000 $250,000+ $350k+
CAIRNS & DOUGLAS LAND SALES (p)
JUN 15 SEP 15
53
5 1
78
1 1
<$250,000 $250,000+ $350k+
FRASER COAST LAND SALES (p)
JUN 15 SEP 15
22
2 1
10
31
<$250,000 $250,000+ $350k+
GLADSTONE LAND SALES (p)
JUN 15 SEP 15
53
1 0
43
3 0
<$250,000 $250,000+ $350k+
ROCKHAMPTON & LIVINGSTONE LAND SALES (p)
JUN 15 SEP 15
46
2 0
54
4 1
<$250,000 $250,000+ $350k+
TOOWOOMBA LAND SALES (p)
JUN 15 SEP 15
46
2 3
72
71
<$250,000 $250,000+ $350k+
TOWNSVILLE LAND SALES (p)
JUN 15 SEP 15
15
4 4
22
30
<$250,000 $250,000+ $350k+
MACKAY LAND SALES (p)
JUN 15 SEP 15
36
1 1
41
0 0
<$250,000 $250,000+ $350k+
BUNDABERG LAND SALES (p)
JUN 15 SEP 15

15 SEPTEMBER QUARTER 2015
BRISBANE MARKET UPDATES
4506 MOORINA $305 66 $295 54
4507 BANKSIA BEACH $350 41 $335 44
4508 DECEPTION BAY $320 92 $305 106
4509 MANGO HILL $380 102 $380 78
4510 BALINGOOL $300 173 $285 162
4511 GODWIN BEACH $345 23 $335 28
4514 BELLTHORPE $330 9 $300 12
4520 ARMSTRONG CREEK $435 14 $450 8
4521 CAMPBELLS POCKET $370 14 $410 7
REDLAND CITY $390 343 $380 361
4157 CAPALABA $395 22 $400 30
4158 THORNESIDE $385 14 $360 9
4159 AQUATIC PARADISE $395 23 $395 25
4160 EROBIN $420 31 $390 39
4161 ALEXANDRA HILLS $400 43 $390 47
4163 CLEVELAND $415 39 $420 50
4164 PINKLANDS $410 20 $395 21
4165 MOUNT COTTON $410 59 $395 61
4183 AMITY $360 7 $310 6
4184 COOCHIEMUDLO ISLAND $250 85 $245 73
LOCKYER VALLEY REGIONAL $280 103 $270 116
4341 BLENHEIM $280 49 $270 41
4342 CROWLEY VALE $280 10 $270 18
4343 ADARE $280 38 $275 49
SOMERSET REGIONAL $275 67 $280 63
4311 ATKINSONS DAM $265 28 $260 27
4312 BRYDEN $280 7 $280 13
4313 BIARRA $230 17 N.A. 3
4515 GLENFERN $310 15 $300 20
RENTAL MARKET - 3 BED HOUSES (CONT’D)POST SEP-15 SEP-14
CODE LOCALITYL $/WEEK NEW BONDS $/WEEK NEW BONDS
RENTAL MARKET - 2 BED UNITS
RENTAL MARKET - 3 BED TOWNHOUSESPOST SEP-15 SEP-14
CODE LOCALITYL $/WEEK NEW BONDS $/WEEK NEW BONDS
IPSWICH CITY $255 183 $250 171
4300 AUGUSTINE HEIGHTS $260 39 $250 35
4301 COLLINGWOOD PARK $265 18 $270 30
4304 BLACKSTONE $250 30 $245 29
4305 BASIN POCKET $250 91 $240 64
4306 AMBERLEY $265 5 $225 12
LOGAN CITY $270 216 $260 200
4114 KINGSTON $265 76 $260 58
4123 PRIESTS GULLY $310 7 N.A. 3
4127 CHATSWOOD HILLS $280 22 $300 18
4131 LOGANLEA $285 8 N.A. 3
4132 CRESTMEAD $295 7 $260 8
4133 CHAMBERS FLAT $285 13 $250 11
4207 ALBERTON $260 64 $250 76
4280 JIMBOOMBA $280 9 $270 8
MORETON BAY REGIONAL $280 486 $270 527
4019 CLONTARF $270 55 $270 81
4020 NEWPORT $300 89 $290 80
4500 BRAY PARK $290 32 $300 44
4501 LAWNTON $285 11 $280 17
4502 FRENCHS FOREST $250 6 N.A. 3
4503 DAKABIN $280 60 $280 53
4505 BURPENGARY $270 19 $230 9
4506 MOORINA $275 16 $250 13
4507 BANKSIA BEACH $280 48 $280 56
4508 DECEPTION BAY $270 15 $264 20
4509 MANGO HILL $300 24 $315 15
4510 BALINGOOL $260 98 $250 102
REDLAND CITY $330 60 $330 71
4157 CAPALABA $325 8 $325 13
4160 EROBIN $335 8 N.A. 4
4161 ALEXANDRA HILLS $158 5 N.A. 3
4163 CLEVELAND $376 28 $368 34
4165 MOUNT COTTON $330 6 N.A. 1
LOCKYER VALLEY REGIONAL $225 18 $200 16
4343 ADARE $235 15 $225 11
IPSWICH CITY $315 164 $310 142
4300 AUGUSTINE HEIGHTS $365 65 $310 51
4301 COLLINGWOOD PARK $310 26 $310 25
4304 BLACKSTONE $305 39 $305 37
4305 BASIN POCKET $300 32 $305 28
LOGAN CITY $340 462 $335 432
4114 KINGSTON $310 55 $315 49
4118 BROWNS PLAINS $345 70 $350 47
4119 UNDERWOOD $345 22 $410 36
4123 PRIESTS GULLY $340 7 $340 8
4127 CHATSWOOD HILLS $340 32 $315 38
4128 KIMBERLEY PARK $325 18 $340 15
4131 LOGANLEA $350 49 $350 23
4132 CRESTMEAD $340 66 $345 50
4133 CHAMBERS FLAT $325 27 $315 22
4205 BETHANIA $340 12 $340 31
4207 ALBERTON $320 95 $320 105
MORETON BAY REGIONAL $340 616 $335 513
4019 CLONTARF $335 9 $350 12
4020 NEWPORT $350 13 $340 12
4021 KIPPA-RING $325 47 $330 38
4035 ALBANY CREEK $385 15 $385 8
4500 BRAY PARK $350 67 $335 29
4501 LAWNTON $340 13 $330 11
4502 FRENCHS FOREST $335 19 $330 15
4503 DAKABIN $340 197 $340 174
4504 NARANGBA $350 10 $345 6
4505 BURPENGARY $305 26 $310 20
4506 MOORINA $315 13 $310 17
4507 BANKSIA BEACH $320 5 N.A. 4
4508 DECEPTION BAY $310 60 $310 56
4509 MANGO HILL $350 103 $350 89
4510 BALINGOOL $300 11 $295 10
REDLAND CITY $395 190 $390 92
4157 CAPALABA $380 19 $360 19
4158 THORNESIDE $370 13 $390 12
4160 EROBIN $385 63 $395 8
4163 CLEVELAND $410 32 $435 32
4164 PINKLANDS $395 45 N.A. 1
4165 MOUNT COTTON $395 11 $395 13
... Moreton Bay has taken the lead as the strongest performing house market

16 QUEENSLAND MARKET MONITOR
REGIONAL MARKET UPDATES
GOLD COAST
HOUSE PRICEPOINTS
1,194 1,412
628
18
1,265 1,508
652
29
<$350k $350k+ $500k+ $1m+
BRISBANE SURROUNDS HOUSE SALES (p)
JUN 15 SEP 15INCLUDES IPSWICH, LOGAN, MORETON BAY & REDLAND
55
557 698
119 44
567
776
139
<$350k $350k+ $500k+ $1m+
GOLD COAST HOUSE SALES (p)
JUN 15 SEP 15
163
43
8
166
42
7
<$350k $350k+ $500k+
BUNDABERG HOUSE SALES (p)
JUN 15 SEP 15
153
213
90
3
160
247
114
4
<$350k $350k+ $500k+ $1m+
CAIRNS & DOUGLAS HOUSE SALES (p)
JUN 15 SEP 15
211
71
14
203
78
13
<$350k $350k+ $500k+
FRASER COAST HOUSE SALES (p)
JUN 15 SEP 15
48 52
14
57
45
8
<$350k $350k+ $500k+
GLADSTONE HOUSE SALES (p)
JUN 15 SEP 15
227
156
46
222
149
50
<$350k $350k+ $500k+
TOWNSVILLE HOUSE SALES (p)
JUN 15 SEP 15
75 63
21
89
69
16
<$350k $350k+ $500k+
MACKAY HOUSE SALES (p)
JUN 15 SEP 15
133
72
22
146
57
26
<$350k $350k+ $500k+
ROCKHAMPTON & LIVINGSTONE HOUSE SALES (p)
MAR 15 JUN 15
114
740
1,997
318 124
755
2,126
333
<$350k $350k+ $500k+ $1m+
BRISBANE CITY HOUSE SALES (p)
JUN 15 SEP 15215
163
56
233 200
59
<$350k $350k+ $500k+
TOOWOOMBA HOUSE SALES (p)
JUN 15 SEP 15
70
431 427
58 92
437 477
42
<$350k $350k+ $500k+ $1m+
SUNSHINE COAST & NOOSA HOUSE SALES (p)
JUN 15 SEP 15
This quarter the Gold Coast has continued to improve with solid growth in sales activity across all residential markets.
Key to the Gold Coast’s strengthening property market has been growing employment opportunities, and in this regard the Gold Coast is leading the charge in Queensland.
Both infrastructure and residential developments have boosted jobs in the construction industry which is resulting in an influx of residents to the region. The strengthening tourism industry is also paving the way for further job opportunities.
As Sydney and Melbourne potentially reach the peaks of their respective markets it’s anticipated that more buyers will be looking to the southeast corner for purchasing opportunities.
The Brisbane to Gold Coast corridor continues to grow and is creating pressure for infrastructure to keep pace, including roads, water and sewerage lines. Traffic congestion is a significant issue, with many commuters travelling daily between Brisbane and the Gold Coast.
Upgrades to this arterial road network remain a priority, with a $74.7 million interchange upgrade at Coomera just one example of the local council’s efforts to improve safety and traffic flow.
HOUSE MARKET
The Gold Coast house market performed strongly this quarter, with preliminary house sales numbers up six per cent over the quarter and 14 per cent over the year to September 2015.
Similar to other strengthening house markets in Queensland, this increased activity isn’t translating to significant price growth. However, the Gold Coast recorded the largest change in its median house price for both the quarter and the year ending September, up 3.8 and seven per cent respectively.
Local agents reported that buyers were still somewhat price sensitive and were not rushing to purchase.
With the influx of new residents to the region, local agents say affordably priced properties are in highest demand. Outer suburbs in particular, such as Upper Coomera and Pacific Pines remain in strong demand, recording the largest increase in house sales over the year to September for the Gold Coast region.
The prestige market is also performing strongly with well-located properties in highest demand.
Average days on market have remained steady at 72 days, however average vendor discounting continues to trend downwards and at 5.6 per cent, is now almost half the peak of around 10 per cent recorded in mid-2012.
UNIT MARKET
The unit and townhouse market claims the lion's share of the Gold Coast residential sales market with sales up 27 per cent over the quarter.
According to local agents, investors as well as owner occupiers are looking to the apartment market more – driven by the accessibility to the inner city, infrastructure and beaches.
Affordable stock is in highest demand and despite strong sales in the prestige end of the market, units in the sub-$350,000 price point recorded the largest increase in sales activity for the quarter.
As a result, the median unit sale price was down slightly by 1.4 per cent to $345,000.
RENTAL MARKET
In the REIQ residential rental survey for September, Gold Coast agents reported strong tenant demand and low supply levels.
As a result the vacancy rate tightened to 1.7 per cent. The region has remained below 2.5 per cent (considered the lower end of the healthy range) for two years.
Despite this consistently limited vacancy rate, median rental prices have remained in check. According to the RTA’s September quarter figures, median weekly rents remained relatively unchanged.

17
REGIONAL MARKET UPDATES
SEPTEMBER QUARTER 2015
GOLD COAST (LGA) 1,579 $545,000 3.8% $535,000 7.0% 4.9%
GOLD COAST (LGA) ^ 179 $710,000 -2.1% $712,500 6.3% 0.4%
ARUNDEL 31 $566,000 6.8% $530,000 12.8% 12.8%
ASHMORE 30 $500,000 0.0% $508,750 6.0% 6.0%
BENOWA 43 $825,000 10.0% $780,000 11.4% 1.6%
BIGGERA WATERS 9 N/A N/A $660,000 18.9% 14.3%
BONOGIN ^ 15 $665,000 1.5% $655,000 11.0% -1.9%
BROADBEACH WATERS 31 $840,000 6.5% $819,750 1.2% 0.0%
BUNDALL 23 $755,500 -8.4% $822,500 6.1% -12.0%
BURLEIGH HEADS 16 $670,000 -10.7% $641,000 4.6% 8.6%
BURLEIGH WATERS 60 $695,000 1.5% $667,500 15.1% 17.1%
CARRARA 43 $474,750 -6.9% $465,500 1.2% 4.9%
CLEAR ISLAND WATERS 10 $905,000 -5.5% $951,000 13.7% 4.5%
COOLANGATTA 8 N/A N/A $750,000 N/A N/A
COOMBABAH 26 $432,500 -4.3% $435,000 8.9% -1.1%
COOMERA ~ f 48 $479,500 -13.6% $465,000 30.3% -18.4%
CURRUMBIN ~ f 6 N/A N/A $900,000 21.2% 48.7%
CURRUMBIN VALLEY ^ 8 N/A N/A $750,000 N/A N/A
CURRUMBIN WATERS 32 $600,000 12.1% $550,000 9.3% 10.0%
ELANORA 44 $580,000 10.5% $545,000 5.8% 3.3%
GILSTON 7 N/A N/A $498,500 6.3% N/A
HELENSVALE 50 $517,500 -1.4% $525,000 9.4% 8.2%
HIGHLAND PARK 20 $444,000 0.7% $437,500 2.9% 2.2%
HOLLYWELL 13 $618,500 -10.4% $630,000 16.7% 8.8%
HOPE ISLAND ~ f 69 $850,000 0.9% $813,750 9.1% -22.5%
JACOBS WELL 10 $362,500 N/A $385,000 N/A N/A
LABRADOR 36 $460,000 2.2% $457,500 6.4% 4.2%
LOWER BEECHMONT 2 N/A N/A $350,000 N/A -8.5%
MAUDSLAND 22 $483,250 10.2% $487,000 5.9% 10.2%
MERMAID BEACH 10 $1,212,500 -0.9% $1,037,500 11.0% -17.7%
MERMAID WATERS ~ f 44 $846,000 17.5% $750,000 13.6% 15.2%
MERRIMAC 22 $468,000 -1.7% $467,000 11.2% 9.6%
MIAMI 10 $675,000 3.8% $620,000 6.9% 11.7%
MOLENDINAR 21 $568,000 6.4% $549,500 9.9% 9.5%
MUDGEERABA 35 $477,000 1.5% $498,750 6.1% 2.8%
MUDGEERABA ^ 14 $706,000 N/A $670,000 6.3% -8.2%
NERANG 39 $400,000 -3.9% $390,000 5.1% 2.0%
NERANG ^ 16 $852,500 N/A $845,000 18.2% N/A
ORMEAU 43 $430,000 0.9% $434,500 3.9% -2.4%
ORMEAU HILLS 11 $515,000 9.9% $476,500 6.8% -6.0%
OXENFORD 53 $466,500 8.1% $455,000 4.9% -0.5%
PACIFIC PINES 78 $458,500 -2.4% $465,000 1.8% 0.0%
PALM BEACH 54 $676,250 5.3% $630,000 12.5% 12.7%
PARADISE POINT ~ f 23 $765,000 -15.0% $884,000 9.7% 0.5%
PARKWOOD 23 $545,000 1.9% $530,000 9.1% 7.1%
PIMPAMA ~ 17 $392,000 -15.8% $423,500 8.6% 5.9%
REEDY CREEK 17 $665,000 3.7% $655,000 6.2% -1.1%
ROBINA ~ 65 $622,500 17.9% $585,000 11.4% 7.9%
RUNAWAY BAY 25 $825,250 10.8% $875,000 8.2% 18.6%
SOUTHPORT 61 $506,500 -1.9% $504,000 11.4% 6.1%
SURFERS PARADISE 32 $1,105,000 6.8% $1,225,000 10.4% -5.3%
TALLAI ^ ~ 11 $855,000 N/A $783,750 16.1% 2.8%
TALLEBUDGERA ^ ~ 10 $702,500 -8.9% $735,000 8.9% 2.1%
TALLEBUDGERA VALLEY ^ 2 N/A N/A $750,000 0.0% N/A
TUGUN 15 $502,550 5.5% $495,000 4.0% 8.3%
UPPER COOMERA 103 $430,000 2.9% $423,000 6.3% -1.2%
VARSITY LAKES 27 $490,000 -10.9% $532,500 10.4% 7.6%
WONGAWALLAN ^ 8 N/A N/A $628,000 N/A N/A
WORONGARY 8 N/A N/A $420,000 2.7% 3.7%
WORONGARY ^ 6 N/A N/A $677,500 5.4% -6.9%
SALES MARKET - UNITS & TOWNHOUSES
SUBURB NUMBER OF SALES
MEDIAN SALE
QTRLY CHANGE
ANNUAL MEDIAN
SALE
1YR CHANGE
5YR CHANGE
SALES MARKET - HOUSES
SUBURB NUMBER OF SALES
MEDIAN SALE
QTRLY CHANGE
ANNUAL MEDIAN
SALE
1YR CHANGE
5YR CHANGE
GOLD COAST (LGA) 1,919 $345,000 -1.4% $350,000 -1.4% -8.6%
ARUNDEL 18 $317,500 0.8% $320,000 4.0% -1.5%
ASHMORE 18 $269,000 -11.2% $303,000 8.2% -2.3%
BENOWA * t 22 $438,750 -14.1% $519,000 -0.2% 18.7%
BIGGERA WATERS ~ 43 $299,250 0.6% $295,000 -23.6% -25.3%
BILINGA ~ 14 $525,000 1.9% $502,500 -8.6% -5.2%
BROADBEACH 89 $378,000 -11.1% $420,000 -4.0% -13.2%
BROADBEACH WATERS 7 N/A N/A $425,000 14.9% -6.6%
BUNDALL 13 $325,900 9.4% $329,900 10.0% -7.1%
BURLEIGH HEADS 67 $421,770 4.1% $410,000 5.1% 0.0%
BURLEIGH WATERS 22 $360,000 -5.9% $370,000 9.5% 1.4%
CARRARA ~ t 48 $415,000 27.7% $426,040 9.2% -1.5%
CLEAR ISLAND WATERS ~ f 11 $409,000 -19.8% $452,500 -6.7% -8.6%
COOLANGATTA 61 $406,250 -8.6% $425,000 9.0% -16.3%
COOMBABAH 30 $320,000 3.2% $331,500 5.2% -4.7%
COOMERA ~ f 30 $270,000 -1.8% $281,200 -19.1% -17.3%
CURRUMBIN 9 N/A N/A $438,750 9.7% 8.2%
CURRUMBIN WATERS 12 $330,000 -5.2% $338,750 12.9% -4.2%
ELANORA 20 $360,000 19.0% $309,500 4.4% -8.0%
HELENSVALE ~ t 18 $250,000 -23.9% $300,000 -3.2% 0.0%
HIGHLAND PARK ~ t 7 N/A N/A $292,000 18.2% N/A
HOLLYWELL ~ 4 N/A N/A $605,000 N/A -34.9%
HOPE ISLAND * f 36 $462,500 14.8% $445,000 7.2% 8.5%
LABRADOR 113 $305,500 -5.7% $321,500 1.1% -1.1%
MAIN BEACH 40 $575,000 0.9% $571,250 2.9% -18.7%
MERMAID BEACH 34 $327,500 -9.8% $349,500 -0.9% -9.2%
MERMAID WATERS 32 $315,000 -2.2% $322,000 2.2% -0.6%
MERRIMAC 12 $385,000 24.2% $342,500 -4.3% -17.7%
MIAMI 42 $429,500 15.6% $395,000 12.9% 5.1%
MUDGEERABA 24 $300,000 -10.2% $331,500 4.4% -2.5%
NERANG 32 $278,500 -5.9% $299,000 9.6% -1.6%
ORMEAU 11 $370,000 24.2% $347,001 8.4% -6.2%
OXENFORD 21 $287,000 3.2% $281,000 2.2% -3.1%
PACIFIC PINES 22 $338,000 -3.4% $349,000 -2.9% -10.5%
PALM BEACH 64 $354,000 2.6% $345,000 -1.4% -5.5%
PARADISE POINT ~ f 18 $577,500 -2.1% $594,500 22.5% 13.8%
PARKWOOD 5 N/A N/A $317,500 N/A N/A
PIMPAMA 4 N/A N/A $340,000 -4.2% -8.1%
REEDY CREEK 13 $297,000 6.5% $285,000 -1.7% -9.1%
ROBINA 55 $402,000 -4.3% $420,000 4.0% -8.1%
RUNAWAY BAY 31 $540,000 17.4% $422,500 -1.7% 5.8%
SOUTHPORT 126 $324,000 -0.5% $325,000 -0.9% -4.4%
SURFERS PARADISE 281 $345,000 3.8% $345,000 1.5% -11.3%
TUGUN 20 $350,000 -10.3% $376,000 -0.1% -12.5%
UPPER COOMERA 26 $325,000 -3.0% $321,175 8.9% -9.5%
VARSITY LAKES 63 $384,669 -5.0% $390,000 0.5% -0.4%
UNIT PRICEPOINTS
79
352
890
490
6181
391
1026
548
75
<$250,000 $250,000+ $350k+ $500k+ $1m+
BRISBANE CITY UNIT SALES (p)
JUN 15 SEP 15
269 286
173
70
7
235 246203
65 4
<$250,000 $250,000+ $350k+ $500k+ $1m+
BRISBANE SURROUNDS UNIT SALES (p)
JUN 15 SEP 15
INCLUDES IPSWICH, LOGAN, MORETON BAY & REDLAND
195
542471
234
33
265
678
555
337
55
<$250,000 $250,000+ $350k+ $500k+ $1m+
GOLD COAST UNIT SALES (p)
JUN 15 SEP 15
74
209 221
127
28
76
220 217
137
22
<$250,000 $250,000+ $350k+ $500k+ $1m+
SUNSHINE COAST & NOOSA UNIT SALES (p)
JUN 15 SEP 15
27
12
62
1315
2 1
<$250,000 $250,000+ $350k+ $500k+
BUNDABERG UNIT SALES (p)
JUN 15 SEP 15
206
5930 27
3
219
6343 34
6
<$250,000 $250,000+ $350k+ $500k+ $1m+
CAIRNS & DOUGLAS UNIT SALES (p)
JUN 15 SEP 15
3228
93
43
15
3 3
<$250,000 $250,000+ $350k+ $500k+
FRASER COAST UNIT SALES (p)
JUN 15 SEP 15
89
3
1
34
3
0
<$250,000 $250,000+ $350k+ $500k+
GLADSTONE UNIT SALES (p)
JUN 15 SEP 15
34
24 21 18
1
48
24
149
2
<$250,000 $250,000+ $350k+ $500k+ $1m+
TOWNSVILLE UNIT SALES (p)
JUN 15 SEP 15
13
7 64
12
7
3
0
<$250,000 $250,000+ $350k+ $500k+
MACKAY UNIT SALES (p)
JUN 15 SEP 15
12
68
3
7 78
5
<$250,000 $250,000+ $350k+ $500k+
ROCKHAMPTON & LIVINGSTONE UNIT SALES (p)
JUN 15 SEP 15
31
44
144
31
60
187
<$250,000 $250,000+ $350k+ $500k+
TOOWOOMBA UNIT SALES (p)
JUN 15 SEP 15
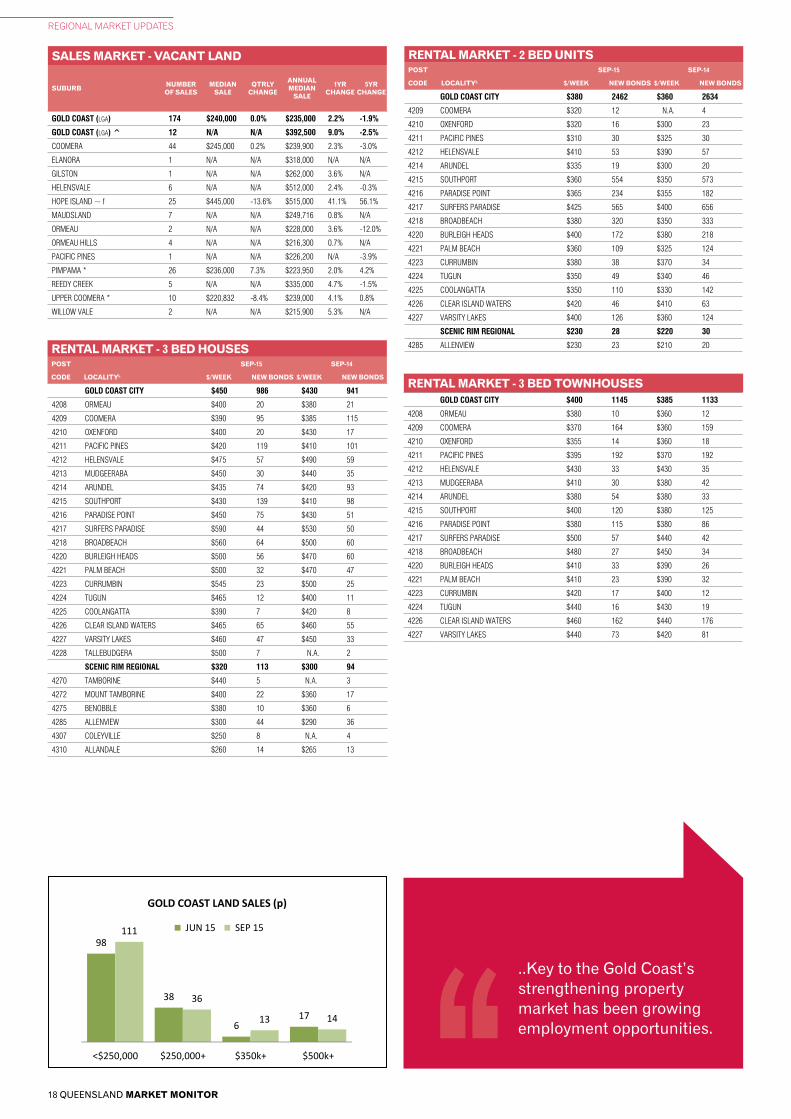
18 QUEENSLAND MARKET MONITOR
REGIONAL MARKET UPDATES
GOLD COAST CITY $380 2462 $360 2634
4209 COOMERA $320 12 N.A. 4
4210 OXENFORD $320 16 $300 23
4211 PACIFIC PINES $310 30 $325 30
4212 HELENSVALE $410 53 $390 57
4214 ARUNDEL $335 19 $300 20
4215 SOUTHPORT $360 554 $350 573
4216 PARADISE POINT $365 234 $355 182
4217 SURFERS PARADISE $425 565 $400 656
4218 BROADBEACH $380 320 $350 333
4220 BURLEIGH HEADS $400 172 $380 218
4221 PALM BEACH $360 109 $325 124
4223 CURRUMBIN $380 38 $370 34
4224 TUGUN $350 49 $340 46
4225 COOLANGATTA $350 110 $330 142
4226 CLEAR ISLAND WATERS $420 46 $410 63
4227 VARSITY LAKES $400 126 $360 124
SCENIC RIM REGIONAL $230 28 $220 30
4285 ALLENVIEW $230 23 $210 20
LAND PRICEPOINTS
(p) Preliminary. See explanatory notes for further information. Source: REIQ, data provided by CoreLogic RP Data.
34 38 36 33
20
7058
28
<$250,000 $250,000+ $350k+ $500k+
BRISBANE CITY LAND SALES (p)
JUN 15 SEP 15
449
10044
8
464
10029 3
<$250,000 $250,000+ $350k+ $500k+
BRISBANE SURROUNDS LAND SALES (p)
JUN 15 SEP 15Includes IPSWICH, LOGAN, MORETON BAY & REDLAND
98
38
617
111
36
13 14
<$250,000 $250,000+ $350k+ $500k+
GOLD COAST LAND SALES (p)
JUN 15 SEP 15
70
36
21
7
6155
149
<$250,000 $250,000+ $350k+ $500k+
SUNSHINE COAST & NOOSA LAND SALES (p)
JUN 15 SEP 1581
124
56
115
<$250,000 $250,000+ $350k+
CAIRNS & DOUGLAS LAND SALES (p)
JUN 15 SEP 15
53
5 1
78
1 1
<$250,000 $250,000+ $350k+
FRASER COAST LAND SALES (p)
JUN 15 SEP 15
22
2 1
10
31
<$250,000 $250,000+ $350k+
GLADSTONE LAND SALES (p)
JUN 15 SEP 15
53
1 0
43
3 0
<$250,000 $250,000+ $350k+
ROCKHAMPTON & LIVINGSTONE LAND SALES (p)
JUN 15 SEP 15
46
2 0
54
4 1
<$250,000 $250,000+ $350k+
TOOWOOMBA LAND SALES (p)
JUN 15 SEP 15
46
2 3
72
71
<$250,000 $250,000+ $350k+
TOWNSVILLE LAND SALES (p)
JUN 15 SEP 15
15
4 4
22
30
<$250,000 $250,000+ $350k+
MACKAY LAND SALES (p)
JUN 15 SEP 15
36
1 1
41
0 0
<$250,000 $250,000+ $350k+
BUNDABERG LAND SALES (p)
JUN 15 SEP 15
RENTAL MARKET - 3 BED HOUSESPOST SEP-15 SEP-14
CODE LOCALITYL $/WEEK NEW BONDS $/WEEK NEW BONDS
RENTAL MARKET - 2 BED UNITSPOST SEP-15 SEP-14
CODE LOCALITYL $/WEEK NEW BONDS $/WEEK NEW BONDS
RENTAL MARKET - 3 BED TOWNHOUSES
SALES MARKET - VACANT LAND
SUBURB NUMBER OF SALES
MEDIAN SALE
QTRLY CHANGE
ANNUAL MEDIAN
SALE
1YR CHANGE
5YR CHANGE
GOLD COAST (LGA) 174 $240,000 0.0% $235,000 2.2% -1.9%
GOLD COAST (LGA) ^ 12 N/A N/A $392,500 9.0% -2.5%
COOMERA 44 $245,000 0.2% $239,900 2.3% -3.0%
ELANORA 1 N/A N/A $318,000 N/A N/A
GILSTON 1 N/A N/A $262,000 3.6% N/A
HELENSVALE 6 N/A N/A $512,000 2.4% -0.3%
HOPE ISLAND ~ f 25 $445,000 -13.6% $515,000 41.1% 56.1%
MAUDSLAND 7 N/A N/A $249,716 0.8% N/A
ORMEAU 2 N/A N/A $228,000 3.6% -12.0%
ORMEAU HILLS 4 N/A N/A $216,300 0.7% N/A
PACIFIC PINES 1 N/A N/A $226,200 N/A -3.9%
PIMPAMA * 26 $236,000 7.3% $223,950 2.0% 4.2%
REEDY CREEK 5 N/A N/A $335,000 4.7% -1.5%
UPPER COOMERA * 10 $220,832 -8.4% $239,000 4.1% 0.8%
WILLOW VALE 2 N/A N/A $215,900 5.3% N/A
GOLD COAST CITY $450 986 $430 941
4208 ORMEAU $400 20 $380 21
4209 COOMERA $390 95 $385 115
4210 OXENFORD $400 20 $430 17
4211 PACIFIC PINES $420 119 $410 101
4212 HELENSVALE $475 57 $490 59
4213 MUDGEERABA $450 30 $440 35
4214 ARUNDEL $435 74 $420 93
4215 SOUTHPORT $430 139 $410 98
4216 PARADISE POINT $450 75 $430 51
4217 SURFERS PARADISE $590 44 $530 50
4218 BROADBEACH $560 64 $500 60
4220 BURLEIGH HEADS $500 56 $470 60
4221 PALM BEACH $500 32 $470 47
4223 CURRUMBIN $545 23 $500 25
4224 TUGUN $465 12 $400 11
4225 COOLANGATTA $390 7 $420 8
4226 CLEAR ISLAND WATERS $465 65 $460 55
4227 VARSITY LAKES $460 47 $450 33
4228 TALLEBUDGERA $500 7 N.A. 2
SCENIC RIM REGIONAL $320 113 $300 94
4270 TAMBORINE $440 5 N.A. 3
4272 MOUNT TAMBORINE $400 22 $360 17
4275 BENOBBLE $380 10 $360 6
4285 ALLENVIEW $300 44 $290 36
4307 COLEYVILLE $250 8 N.A. 4
4310 ALLANDALE $260 14 $265 13
GOLD COAST CITY $400 1145 $385 1133
4208 ORMEAU $380 10 $360 12
4209 COOMERA $370 164 $360 159
4210 OXENFORD $355 14 $360 18
4211 PACIFIC PINES $395 192 $370 192
4212 HELENSVALE $430 33 $430 35
4213 MUDGEERABA $410 30 $380 42
4214 ARUNDEL $380 54 $380 33
4215 SOUTHPORT $400 120 $380 125
4216 PARADISE POINT $380 115 $380 86
4217 SURFERS PARADISE $500 57 $440 42
4218 BROADBEACH $480 27 $450 34
4220 BURLEIGH HEADS $410 33 $390 26
4221 PALM BEACH $410 23 $390 32
4223 CURRUMBIN $420 17 $400 12
4224 TUGUN $440 16 $430 19
4226 CLEAR ISLAND WATERS $460 162 $440 176
4227 VARSITY LAKES $440 73 $420 81
..Key to the Gold Coast’s strengthening property market has been growing employment opportunities.
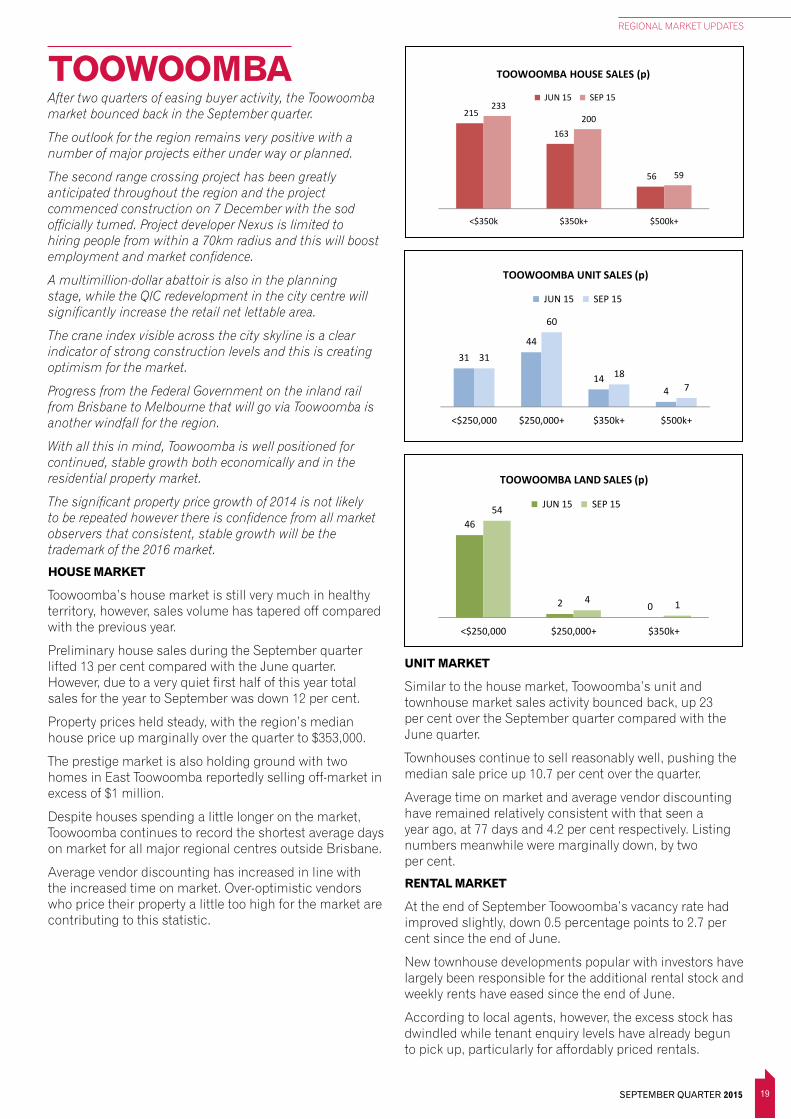
19
REGIONAL MARKET UPDATES
SEPTEMBER QUARTER 2015
TOOWOOMBAHOUSE PRICEPOINTS
1,194 1,412
628
18
1,265 1,508
652
29
<$350k $350k+ $500k+ $1m+
BRISBANE SURROUNDS HOUSE SALES (p)
JUN 15 SEP 15INCLUDES IPSWICH, LOGAN, MORETON BAY & REDLAND
55
557 698
119 44
567
776
139
<$350k $350k+ $500k+ $1m+
GOLD COAST HOUSE SALES (p)
JUN 15 SEP 15
163
43
8
166
42
7
<$350k $350k+ $500k+
BUNDABERG HOUSE SALES (p)
JUN 15 SEP 15
153
213
90
3
160
247
114
4
<$350k $350k+ $500k+ $1m+
CAIRNS & DOUGLAS HOUSE SALES (p)
JUN 15 SEP 15
211
71
14
203
78
13
<$350k $350k+ $500k+
FRASER COAST HOUSE SALES (p)
JUN 15 SEP 15
48 52
14
57
45
8
<$350k $350k+ $500k+
GLADSTONE HOUSE SALES (p)
JUN 15 SEP 15
227
156
46
222
149
50
<$350k $350k+ $500k+
TOWNSVILLE HOUSE SALES (p)
JUN 15 SEP 15
75 63
21
89
69
16
<$350k $350k+ $500k+
MACKAY HOUSE SALES (p)
JUN 15 SEP 15
133
72
22
146
57
26
<$350k $350k+ $500k+
ROCKHAMPTON & LIVINGSTONE HOUSE SALES (p)
MAR 15 JUN 15
114
740
1,997
318 124
755
2,126
333
<$350k $350k+ $500k+ $1m+
BRISBANE CITY HOUSE SALES (p)
JUN 15 SEP 15215
163
56
233 200
59
<$350k $350k+ $500k+
TOOWOOMBA HOUSE SALES (p)
JUN 15 SEP 15
70
431 427
58 92
437 477
42
<$350k $350k+ $500k+ $1m+
SUNSHINE COAST & NOOSA HOUSE SALES (p)
JUN 15 SEP 15
UNIT PRICEPOINTS
79
352
890
490
6181
391
1026
548
75
<$250,000 $250,000+ $350k+ $500k+ $1m+
BRISBANE CITY UNIT SALES (p)
JUN 15 SEP 15
269 286
173
70
7
235 246203
65 4
<$250,000 $250,000+ $350k+ $500k+ $1m+
BRISBANE SURROUNDS UNIT SALES (p)
JUN 15 SEP 15
INCLUDES IPSWICH, LOGAN, MORETON BAY & REDLAND
195
542471
234
33
265
678
555
337
55
<$250,000 $250,000+ $350k+ $500k+ $1m+
GOLD COAST UNIT SALES (p)
JUN 15 SEP 15
74
209 221
127
28
76
220 217
137
22
<$250,000 $250,000+ $350k+ $500k+ $1m+
SUNSHINE COAST & NOOSA UNIT SALES (p)
JUN 15 SEP 15
27
12
62
1315
2 1
<$250,000 $250,000+ $350k+ $500k+
BUNDABERG UNIT SALES (p)
JUN 15 SEP 15
206
5930 27
3
219
6343 34
6
<$250,000 $250,000+ $350k+ $500k+ $1m+
CAIRNS & DOUGLAS UNIT SALES (p)
JUN 15 SEP 15
3228
93
43
15
3 3
<$250,000 $250,000+ $350k+ $500k+
FRASER COAST UNIT SALES (p)
JUN 15 SEP 15
89
3
1
34
3
0
<$250,000 $250,000+ $350k+ $500k+
GLADSTONE UNIT SALES (p)
JUN 15 SEP 15
34
24 21 18
1
48
24
149
2
<$250,000 $250,000+ $350k+ $500k+ $1m+
TOWNSVILLE UNIT SALES (p)
JUN 15 SEP 15
13
7 64
12
7
3
0
<$250,000 $250,000+ $350k+ $500k+
MACKAY UNIT SALES (p)
JUN 15 SEP 15
12
68
3
7 78
5
<$250,000 $250,000+ $350k+ $500k+
ROCKHAMPTON & LIVINGSTONE UNIT SALES (p)
JUN 15 SEP 15
31
44
144
31
60
187
<$250,000 $250,000+ $350k+ $500k+
TOOWOOMBA UNIT SALES (p)
JUN 15 SEP 15
LAND PRICEPOINTS
(p) Preliminary. See explanatory notes for further information. Source: REIQ, data provided by CoreLogic RP Data.
34 38 36 33
20
7058
28
<$250,000 $250,000+ $350k+ $500k+
BRISBANE CITY LAND SALES (p)
JUN 15 SEP 15
449
10044
8
464
10029 3
<$250,000 $250,000+ $350k+ $500k+
BRISBANE SURROUNDS LAND SALES (p)
JUN 15 SEP 15Includes IPSWICH, LOGAN, MORETON BAY & REDLAND
98
38
617
111
36
13 14
<$250,000 $250,000+ $350k+ $500k+
GOLD COAST LAND SALES (p)
JUN 15 SEP 15
70
36
21
7
6155
149
<$250,000 $250,000+ $350k+ $500k+
SUNSHINE COAST & NOOSA LAND SALES (p)
JUN 15 SEP 1581
124
56
115
<$250,000 $250,000+ $350k+
CAIRNS & DOUGLAS LAND SALES (p)
JUN 15 SEP 15
53
5 1
78
1 1
<$250,000 $250,000+ $350k+
FRASER COAST LAND SALES (p)
JUN 15 SEP 15
22
2 1
10
31
<$250,000 $250,000+ $350k+
GLADSTONE LAND SALES (p)
JUN 15 SEP 15
53
1 0
43
3 0
<$250,000 $250,000+ $350k+
ROCKHAMPTON & LIVINGSTONE LAND SALES (p)
JUN 15 SEP 15
46
2 0
54
4 1
<$250,000 $250,000+ $350k+
TOOWOOMBA LAND SALES (p)
JUN 15 SEP 15
46
2 3
72
71
<$250,000 $250,000+ $350k+
TOWNSVILLE LAND SALES (p)
JUN 15 SEP 15
15
4 4
22
30
<$250,000 $250,000+ $350k+
MACKAY LAND SALES (p)
JUN 15 SEP 15
36
1 1
41
0 0
<$250,000 $250,000+ $350k+
BUNDABERG LAND SALES (p)
JUN 15 SEP 15
After two quarters of easing buyer activity, the Toowoomba market bounced back in the September quarter.
The outlook for the region remains very positive with a number of major projects either under way or planned.
The second range crossing project has been greatly anticipated throughout the region and the project commenced construction on 7 December with the sod officially turned. Project developer Nexus is limited to hiring people from within a 70km radius and this will boost employment and market confidence.
A multimillion-dollar abattoir is also in the planning stage, while the QIC redevelopment in the city centre will significantly increase the retail net lettable area.
The crane index visible across the city skyline is a clear indicator of strong construction levels and this is creating optimism for the market.
Progress from the Federal Government on the inland rail from Brisbane to Melbourne that will go via Toowoomba is another windfall for the region.
With all this in mind, Toowoomba is well positioned for continued, stable growth both economically and in the residential property market.
The significant property price growth of 2014 is not likely to be repeated however there is confidence from all market observers that consistent, stable growth will be the trademark of the 2016 market.
HOUSE MARKET
Toowoomba’s house market is still very much in healthy territory, however, sales volume has tapered off compared with the previous year.
Preliminary house sales during the September quarter lifted 13 per cent compared with the June quarter. However, due to a very quiet first half of this year total sales for the year to September was down 12 per cent.
Property prices held steady, with the region’s median house price up marginally over the quarter to $353,000.
The prestige market is also holding ground with two homes in East Toowoomba reportedly selling off-market in excess of $1 million.
Despite houses spending a little longer on the market, Toowoomba continues to record the shortest average days on market for all major regional centres outside Brisbane.
Average vendor discounting has increased in line with the increased time on market. Over-optimistic vendors who price their property a little too high for the market are contributing to this statistic.
UNIT MARKET
Similar to the house market, Toowoomba’s unit and townhouse market sales activity bounced back, up 23 per cent over the September quarter compared with the June quarter.
Townhouses continue to sell reasonably well, pushing the median sale price up 10.7 per cent over the quarter.
Average time on market and average vendor discounting have remained relatively consistent with that seen a year ago, at 77 days and 4.2 per cent respectively. Listing numbers meanwhile were marginally down, by two per cent.
RENTAL MARKET
At the end of September Toowoomba’s vacancy rate had improved slightly, down 0.5 percentage points to 2.7 per cent since the end of June.
New townhouse developments popular with investors have largely been responsible for the additional rental stock and weekly rents have eased since the end of June.
According to local agents, however, the excess stock has dwindled while tenant enquiry levels have already begun to pick up, particularly for affordably priced rentals.
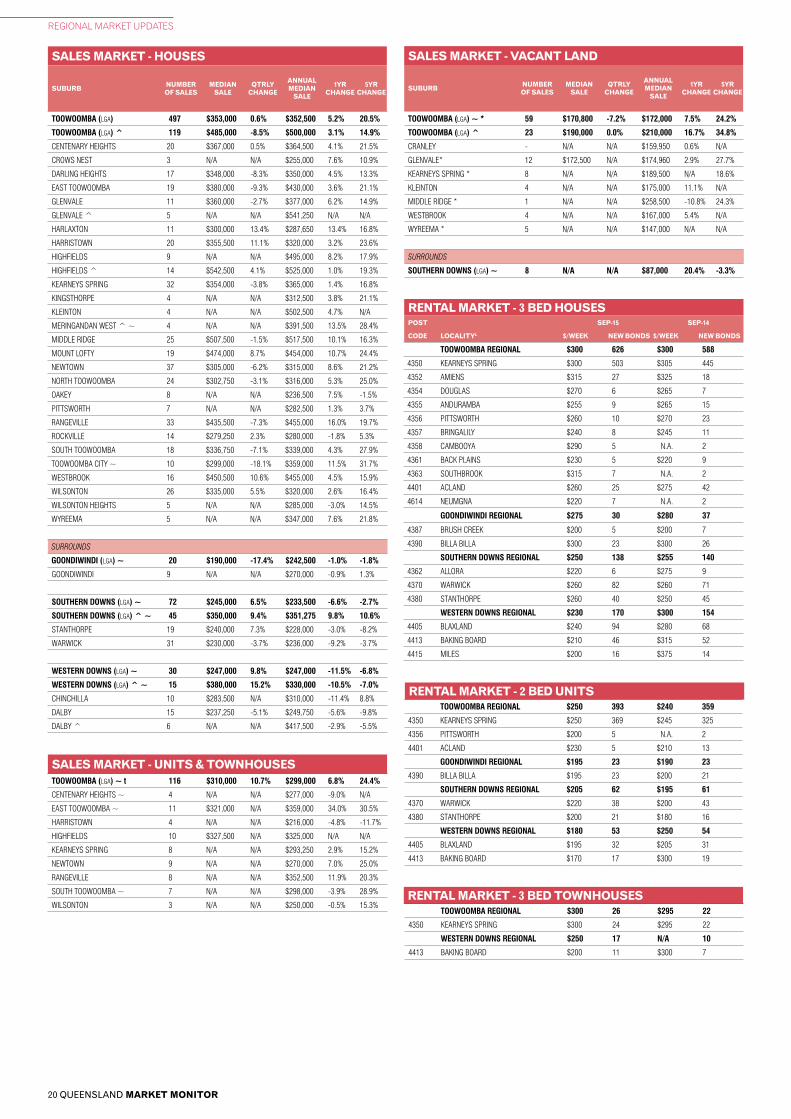
20 QUEENSLAND MARKET MONITOR
REGIONAL MARKET UPDATES
TOOWOOMBA (LGA) ~ * 59 $170,800 -7.2% $172,000 7.5% 24.2%
TOOWOOMBA (LGA) ^ 23 $190,000 0.0% $210,000 16.7% 34.8%
CRANLEY - N/A N/A $159,950 0.6% N/A
GLENVALE* 12 $172,500 N/A $174,960 2.9% 27.7%
KEARNEYS SPRING * 8 N/A N/A $189,500 N/A 18.6%
KLEINTON 4 N/A N/A $175,000 11.1% N/A
MIDDLE RIDGE * 1 N/A N/A $258,500 -10.8% 24.3%
WESTBROOK 4 N/A N/A $167,000 5.4% N/A
WYREEMA * 5 N/A N/A $147,000 N/A N/A
SURROUNDS
SOUTHERN DOWNS (LGA) ~ 8 N/A N/A $87,000 20.4% -3.3%
SALES MARKET - UNITS & TOWNHOUSES
RENTAL MARKET - 3 BED TOWNHOUSES
RENTAL MARKET - 2 BED UNITS
SALES MARKET - VACANT LAND
SUBURB NUMBER OF SALES
MEDIAN SALE
QTRLY CHANGE
ANNUAL MEDIAN
SALE
1YR CHANGE
5YR CHANGE
SALES MARKET - HOUSES
SUBURB NUMBER OF SALES
MEDIAN SALE
QTRLY CHANGE
ANNUAL MEDIAN
SALE
1YR CHANGE
5YR CHANGE
RENTAL MARKET - 3 BED HOUSESPOST SEP-15 SEP-14
CODE LOCALITYL $/WEEK NEW BONDS $/WEEK NEW BONDS
TOOWOOMBA (LGA) 497 $353,000 0.6% $352,500 5.2% 20.5%
TOOWOOMBA (LGA) ^ 119 $485,000 -8.5% $500,000 3.1% 14.9%
CENTENARY HEIGHTS 20 $367,000 0.5% $364,500 4.1% 21.5%
CROWS NEST 3 N/A N/A $255,000 7.6% 10.9%
DARLING HEIGHTS 17 $348,000 -8.3% $350,000 4.5% 13.3%
EAST TOOWOOMBA 19 $380,000 -9.3% $430,000 3.6% 21.1%
GLENVALE 11 $360,000 -2.7% $377,000 6.2% 14.9%
GLENVALE ^ 5 N/A N/A $541,250 N/A N/A
HARLAXTON 11 $300,000 13.4% $287,650 13.4% 16.8%
HARRISTOWN 20 $355,500 11.1% $320,000 3.2% 23.6%
HIGHFIELDS 9 N/A N/A $495,000 8.2% 17.9%
HIGHFIELDS ^ 14 $542,500 4.1% $525,000 1.0% 19.3%
KEARNEYS SPRING 32 $354,000 -3.8% $365,000 1.4% 16.8%
KINGSTHORPE 4 N/A N/A $312,500 3.8% 21.1%
KLEINTON 4 N/A N/A $502,500 4.7% N/A
MERINGANDAN WEST ^ ~ 4 N/A N/A $391,500 13.5% 28.4%
MIDDLE RIDGE 25 $507,500 -1.5% $517,500 10.1% 16.3%
MOUNT LOFTY 19 $474,000 8.7% $454,000 10.7% 24.4%
NEWTOWN 37 $305,000 -6.2% $315,000 8.6% 21.2%
NORTH TOOWOOMBA 24 $302,750 -3.1% $316,000 5.3% 25.0%
OAKEY 8 N/A N/A $236,500 7.5% -1.5%
PITTSWORTH 7 N/A N/A $282,500 1.3% 3.7%
RANGEVILLE 33 $435,500 -7.3% $455,000 16.0% 19.7%
ROCKVILLE 14 $279,250 2.3% $280,000 -1.8% 5.3%
SOUTH TOOWOOMBA 18 $336,750 -7.1% $339,000 4.3% 27.9%
TOOWOOMBA CITY ~ 10 $299,000 -18.1% $359,000 11.5% 31.7%
WESTBROOK 16 $450,500 10.6% $455,000 4.5% 15.9%
WILSONTON 26 $335,000 5.5% $320,000 2.6% 16.4%
WILSONTON HEIGHTS 5 N/A N/A $285,000 -3.0% 14.5%
WYREEMA 5 N/A N/A $347,000 7.6% 21.8%
SURROUNDS
GOONDIWINDI (LGA) ~ 20 $190,000 -17.4% $242,500 -1.0% -1.8%
GOONDIWINDI 9 N/A N/A $270,000 -0.9% 1.3%
SOUTHERN DOWNS (LGA) ~ 72 $245,000 6.5% $233,500 -6.6% -2.7%
SOUTHERN DOWNS (LGA) ^ ~ 45 $350,000 9.4% $351,275 9.8% 10.6%
STANTHORPE 19 $240,000 7.3% $228,000 -3.0% -8.2%
WARWICK 31 $230,000 -3.7% $236,000 -9.2% -3.7%
WESTERN DOWNS (LGA) ~ 30 $247,000 9.8% $247,000 -11.5% -6.8%
WESTERN DOWNS (LGA) ^ ~ 15 $380,000 15.2% $330,000 -10.5% -7.0%
CHINCHILLA 10 $283,500 N/A $310,000 -11.4% 8.8%
DALBY 15 $237,250 -5.1% $249,750 -5.6% -9.8%
DALBY ^ 6 N/A N/A $417,500 -2.9% -5.5%
TOOWOOMBA (LGA) ~ t 116 $310,000 10.7% $299,000 6.8% 24.4%
CENTENARY HEIGHTS ~ 4 N/A N/A $277,000 -9.0% N/A
EAST TOOWOOMBA ~ 11 $321,000 N/A $359,000 34.0% 30.5%
HARRISTOWN 4 N/A N/A $216,000 -4.8% -11.7%
HIGHFIELDS 10 $327,500 N/A $325,000 N/A N/A
KEARNEYS SPRING 8 N/A N/A $293,250 2.9% 15.2%
NEWTOWN 9 N/A N/A $270,000 7.0% 25.0%
RANGEVILLE 8 N/A N/A $352,500 11.9% 20.3%
SOUTH TOOWOOMBA ~ 7 N/A N/A $298,000 -3.9% 28.9%
WILSONTON 3 N/A N/A $250,000 -0.5% 15.3%
TOOWOOMBA REGIONAL $300 626 $300 588
4350 KEARNEYS SPRING $300 503 $305 445
4352 AMIENS $315 27 $325 18
4354 DOUGLAS $270 6 $265 7
4355 ANDURAMBA $255 9 $265 15
4356 PITTSWORTH $260 10 $270 23
4357 BRINGALILY $240 8 $245 11
4358 CAMBOOYA $290 5 N.A. 2
4361 BACK PLAINS $230 5 $220 9
4363 SOUTHBROOK $315 7 N.A. 2
4401 ACLAND $260 25 $275 42
4614 NEUMGNA $220 7 N.A. 2
GOONDIWINDI REGIONAL $275 30 $280 37
4387 BRUSH CREEK $200 5 $200 7
4390 BILLA BILLA $300 23 $300 26
SOUTHERN DOWNS REGIONAL $250 138 $255 140
4362 ALLORA $220 6 $275 9
4370 WARWICK $260 82 $260 71
4380 STANTHORPE $260 40 $250 45
WESTERN DOWNS REGIONAL $230 170 $300 154
4405 BLAXLAND $240 94 $280 68
4413 BAKING BOARD $210 46 $315 52
4415 MILES $200 16 $375 14
TOOWOOMBA REGIONAL $250 393 $240 359
4350 KEARNEYS SPRING $250 369 $245 325
4356 PITTSWORTH $200 5 N.A. 2
4401 ACLAND $230 5 $210 13
GOONDIWINDI REGIONAL $195 23 $190 23
4390 BILLA BILLA $195 23 $200 21
SOUTHERN DOWNS REGIONAL $205 62 $195 61
4370 WARWICK $220 38 $200 43
4380 STANTHORPE $200 21 $180 16
WESTERN DOWNS REGIONAL $180 53 $250 54
4405 BLAXLAND $195 32 $205 31
4413 BAKING BOARD $170 17 $300 19
TOOWOOMBA REGIONAL $300 26 $295 22
4350 KEARNEYS SPRING $300 24 $295 22
WESTERN DOWNS REGIONAL $250 17 N/A 10
4413 BAKING BOARD $200 11 $300 7

21
REGIONAL MARKET UPDATES
SEPTEMBER QUARTER 2015
SUNSHINE COASTThe Sunshine Coast market conditions are flourishing at the moment, with sales activity growing steadily across most parts of the region for the quarter.
The strength of buyer activity varies according to the position, property type and price bracket, however confidence in the market overall remains buoyant.
The growth in sales activity and residential property prices is at sustainable levels, with buyer demand at healthy levels. Local agents also feel that there is a good balance between levels of supply and demand.
Even with the stronger market conditions local agents report that vendors do still need to correctly market their properties in order to create strong buyer interest and achieve a good sales result.
Investor numbers aren’t growing significantly, which is surprising considering the tight rental market and healthy rental returns on offer. It’s likely the tightening of banking lending criteria may have something to do with the low level of investor activity.
The Sunshine Coast population is growing, attracting new residents from interstate and overseas and local agents believe the outlook for the region is very positive.
The region is going from strength to strength with a multitude of developments, both infrastructure and property, providing a boost to local employment.
HOUSE MARKET
Over the September quarter the Sunshine Coast statistical division (SD) continued on its trajectory of growth with sales activity up five per cent. This increase was largely seen in the Sunshine Coast council area while Noosa recorded a slight fall.
Property price growth has been consistent, with the prestige end also achieving positive results. Over the September quarter, the highest increase in buyer activity was recorded in the $500,000-plus price point.
The median house price however remained relatively stable over the quarter with a lift in sales in the sub-$350,000 price point also recorded.
Well-presented and well-priced properties are selling quickly. However, vendors who are choosing to test the market and not present their property to its potential are seeing their property spend longer days on market.
UNIT MARKET
The unit market performed strongly with solid interest reported in lower-level units and townhouse complexes. Those with low body corporate fees are also said to be of a main priority for many buyers in this segment of the market.
Noosa preliminary sales increase 23 per cent while the Sunshine Coast (SD) preliminary sales numbers increased just two per cent.
Average days on market and average vendor discounting rates remained relatively unchanged over the year. With increased listings, these figures indicated that buyer demand in the unit market remained healthy.
RENTAL MARKET
At the end of September, the REIQ residential rental survey found rental conditions on the Sunshine Coast were very tight. The Sunshine Coast SD vacancy rate tightened further to 1.3 per cent with the Noosa council area and Caloundra coastal area recording the tightest vacancy in the state with 0.9 per cent.
According to local agents, it is common for new residents to rent before they buy when they first move to the region, which provides the rental market with a steady influx of new tenants.
Investors are not present in the market in significant numbers and this hampers the supply of rental stock to the market.
Local agents also reported a pick-up in tenant enquiry for executive and prestige level rentals, a sector that hadn’t been strong before now.
Although vacancy levels have been below two per cent for some time now, median rents have not yet significantly increased. As a result, gross rental yields have also remained steady at 4.4 and 4.9 per cent for houses and units respectively over the quarter.
HOUSE PRICEPOINTS
1,194 1,412
628
18
1,265 1,508
652
29
<$350k $350k+ $500k+ $1m+
BRISBANE SURROUNDS HOUSE SALES (p)
JUN 15 SEP 15INCLUDES IPSWICH, LOGAN, MORETON BAY & REDLAND
55
557 698
119 44
567
776
139
<$350k $350k+ $500k+ $1m+
GOLD COAST HOUSE SALES (p)
JUN 15 SEP 15
163
43
8
166
42
7
<$350k $350k+ $500k+
BUNDABERG HOUSE SALES (p)
JUN 15 SEP 15
153
213
90
3
160
247
114
4
<$350k $350k+ $500k+ $1m+
CAIRNS & DOUGLAS HOUSE SALES (p)
JUN 15 SEP 15
211
71
14
203
78
13
<$350k $350k+ $500k+
FRASER COAST HOUSE SALES (p)
JUN 15 SEP 15
48 52
14
57
45
8
<$350k $350k+ $500k+
GLADSTONE HOUSE SALES (p)
JUN 15 SEP 15
227
156
46
222
149
50
<$350k $350k+ $500k+
TOWNSVILLE HOUSE SALES (p)
JUN 15 SEP 15
75 63
21
89
69
16
<$350k $350k+ $500k+
MACKAY HOUSE SALES (p)
JUN 15 SEP 15
133
72
22
146
57
26
<$350k $350k+ $500k+
ROCKHAMPTON & LIVINGSTONE HOUSE SALES (p)
MAR 15 JUN 15
114
740
1,997
318 124
755
2,126
333
<$350k $350k+ $500k+ $1m+
BRISBANE CITY HOUSE SALES (p)
JUN 15 SEP 15215
163
56
233 200
59
<$350k $350k+ $500k+
TOOWOOMBA HOUSE SALES (p)
JUN 15 SEP 15
70
431 427
58 92
437 477
42
<$350k $350k+ $500k+ $1m+
SUNSHINE COAST & NOOSA HOUSE SALES (p)
JUN 15 SEP 15
UNIT PRICEPOINTS
79
352
890
490
6181
391
1026
548
75
<$250,000 $250,000+ $350k+ $500k+ $1m+
BRISBANE CITY UNIT SALES (p)
JUN 15 SEP 15
269 286
173
70
7
235 246203
65 4
<$250,000 $250,000+ $350k+ $500k+ $1m+
BRISBANE SURROUNDS UNIT SALES (p)
JUN 15 SEP 15
INCLUDES IPSWICH, LOGAN, MORETON BAY & REDLAND
195
542471
234
33
265
678
555
337
55
<$250,000 $250,000+ $350k+ $500k+ $1m+
GOLD COAST UNIT SALES (p)
JUN 15 SEP 15
74
209 221
127
28
76
220 217
137
22
<$250,000 $250,000+ $350k+ $500k+ $1m+
SUNSHINE COAST & NOOSA UNIT SALES (p)
JUN 15 SEP 15
27
12
62
1315
2 1
<$250,000 $250,000+ $350k+ $500k+
BUNDABERG UNIT SALES (p)
JUN 15 SEP 15
206
5930 27
3
219
6343 34
6
<$250,000 $250,000+ $350k+ $500k+ $1m+
CAIRNS & DOUGLAS UNIT SALES (p)
JUN 15 SEP 15
3228
93
43
15
3 3
<$250,000 $250,000+ $350k+ $500k+
FRASER COAST UNIT SALES (p)
JUN 15 SEP 15
89
3
1
34
3
0
<$250,000 $250,000+ $350k+ $500k+
GLADSTONE UNIT SALES (p)
JUN 15 SEP 15
34
24 21 18
1
48
24
149
2
<$250,000 $250,000+ $350k+ $500k+ $1m+
TOWNSVILLE UNIT SALES (p)
JUN 15 SEP 15
13
7 64
12
7
3
0
<$250,000 $250,000+ $350k+ $500k+
MACKAY UNIT SALES (p)
JUN 15 SEP 15
12
68
3
7 78
5
<$250,000 $250,000+ $350k+ $500k+
ROCKHAMPTON & LIVINGSTONE UNIT SALES (p)
JUN 15 SEP 15
31
44
144
31
60
187
<$250,000 $250,000+ $350k+ $500k+
TOOWOOMBA UNIT SALES (p)
JUN 15 SEP 15
LAND PRICEPOINTS
(p) Preliminary. See explanatory notes for further information. Source: REIQ, data provided by CoreLogic RP Data.
34 38 36 33
20
7058
28
<$250,000 $250,000+ $350k+ $500k+
BRISBANE CITY LAND SALES (p)
JUN 15 SEP 15
449
10044
8
464
10029 3
<$250,000 $250,000+ $350k+ $500k+
BRISBANE SURROUNDS LAND SALES (p)
JUN 15 SEP 15Includes IPSWICH, LOGAN, MORETON BAY & REDLAND
98
38
617
111
36
13 14
<$250,000 $250,000+ $350k+ $500k+
GOLD COAST LAND SALES (p)
JUN 15 SEP 15
70
36
21
7
6155
149
<$250,000 $250,000+ $350k+ $500k+
SUNSHINE COAST & NOOSA LAND SALES (p)
JUN 15 SEP 1581
124
56
115
<$250,000 $250,000+ $350k+
CAIRNS & DOUGLAS LAND SALES (p)
JUN 15 SEP 15
53
5 1
78
1 1
<$250,000 $250,000+ $350k+
FRASER COAST LAND SALES (p)
JUN 15 SEP 15
22
2 1
10
31
<$250,000 $250,000+ $350k+
GLADSTONE LAND SALES (p)
JUN 15 SEP 15
53
1 0
43
3 0
<$250,000 $250,000+ $350k+
ROCKHAMPTON & LIVINGSTONE LAND SALES (p)
JUN 15 SEP 15
46
2 0
54
4 1
<$250,000 $250,000+ $350k+
TOOWOOMBA LAND SALES (p)
JUN 15 SEP 15
46
2 3
72
71
<$250,000 $250,000+ $350k+
TOWNSVILLE LAND SALES (p)
JUN 15 SEP 15
15
4 4
22
30
<$250,000 $250,000+ $350k+
MACKAY LAND SALES (p)
JUN 15 SEP 15
36
1 1
41
0 0
<$250,000 $250,000+ $350k+
BUNDABERG LAND SALES (p)
JUN 15 SEP 15

22 QUEENSLAND MARKET MONITOR
REGIONAL MARKET UPDATES
TEWANTIN 49 $475,000 8.7% $465,000 6.3% 3.3%
SALES MARKET - VACANT LAND
SALES MARKET - HOUSES
SUBURB NUMBER OF SALES
MEDIAN SALE
QTRLY CHANGE
ANNUAL MEDIAN
SALE
1YR CHANGE
5YR CHANGE
SALES MARKET - HOUSES (CONT’D)
SUBURB NUMBER OF SALES
MEDIAN SALE
QTRLY CHANGE
ANNUAL MEDIAN
SALE
1YR CHANGE
5YR CHANGE
SALES MARKET - UNITS & TOWNHOUSES
SUNSHINE COAST (SD) 1,076 $496,500 0.3% $495,000 4.2% 4.2%
SUNSHINE COAST (SD) ^ 235 $590,000 -1.7% $590,000 6.1% 2.6%
SUNSHINE COAST (LGA) 921 $492,500 0.5% $490,000 4.8% 4.3%
SUNSHINE COAST (LGA) ^ 164 $607,500 1.3% $600,000 5.5% 4.3%
ALEXANDRA HEADLAND ~ f 12 $875,000 41.2% $800,000 -0.6% 14.3%
AROONA ~ 14 $445,000 -16.0% $455,000 3.3% 7.3%
BATTERY HILL ~ 11 $495,000 18.6% $441,000 1.8% 7.6%
BEERWAH 24 $390,000 -2.0% $390,000 2.9% -4.9%
BLI BLI 23 $425,000 -3.8% $435,000 0.6% 7.1%
BUDDINA 14 $560,000 -5.9% $595,000 14.4% -11.7%
BUDERIM 101 $570,000 6.5% $550,000 3.8% 0.2%
BUDERIM ^ ~ 6 N/A N/A $815,000 -7.4% -11.2%
BURNSIDE 13 $430,000 N/A $400,000 7.1% 2.8%
CALOUNDRA WEST 21 $454,666 2.9% $437,000 5.3% 1.6%
COES CREEK 6 N/A N/A $355,000 -3.5% -12.2%
COOLUM BEACH 23 $515,000 -1.0% $520,500 7.3% 5.2%
CURRIMUNDI 26 $477,500 4.7% $460,000 5.0% 5.7%
DICKY BEACH ~ f 5 N/A N/A $745,000 30.9% N/A
EUMUNDI ^ 4 N/A N/A $680,000 4.6% N/A
GLASS HOUSE MOUNTAINS 15 $427,500 5.6% $415,000 0.7% -4.0%
GLASS HOUSE MOUNTAINS ^ 5 N/A N/A $487,000 12.9% N/A
GOLDEN BEACH 16 $467,500 0.5% $464,500 5.0% 1.0%
KULUIN 10 $442,500 N/A $415,000 -1.2% 6.4%
LANDSBOROUGH 8 N/A N/A $354,000 1.9% -6.7%
LITTLE MOUNTAIN 32 $524,500 6.0% $505,000 8.6% 7.4%
MALENY 15 $425,000 0.6% $425,000 -0.7% -8.1%
MALENY ^ 1 N/A N/A $595,000 8.7% N/A
MARCOOLA 4 N/A N/A $528,500 10.1% 10.4%
MAROOCHYDORE 35 $487,000 -6.3% $500,000 8.7% 5.5%
MERIDAN PLAINS 12 $417,200 4.3% $429,750 -9.5% 0.1%
MINYAMA 6 N/A N/A $738,750 10.3% -11.5%
MOFFAT BEACH 8 N/A N/A $623,500 2.2% 10.0%
MOOLOOLABA 19 $570,000 -13.6% $660,000 10.9% 8.6%
MOOLOOLAH VALLEY 15 $442,500 N/A $420,000 5.0% N/A
MOOLOOLAH VALLEY ^ 5 N/A N/A $537,500 0.9% 8.6%
MOUNT COOLUM 7 N/A N/A $497,000 2.3% 6.9%
MOUNTAIN CREEK 36 $544,000 -3.2% $535,750 5.0% 9.3%
MUDJIMBA 3 N/A N/A $562,500 1.7% N/A
NAMBOUR 39 $355,000 0.4% $349,500 6.3% 1.3%
NINDERRY ^ 5 N/A N/A $615,000 N/A N/A
PACIFIC PARADISE 7 N/A N/A $400,000 3.2% 1.3%
PALMWOODS 19 $430,000 7.4% $440,000 4.8% 1.0%
PARREARRA 12 $610,000 -1.1% $580,000 3.6% 8.9%
PELICAN WATERS 27 $620,000 -8.1% $660,000 1.5% 3.4%
PEREGIAN SPRINGS 36 $558,250 4.3% $550,000 -3.5% 7.8%
SIPPY DOWNS 36 $445,000 -2.2% $446,500 3.8% 0.3%
TANAWHA ^ ~ 4 N/A N/A $890,000 21.1% N/A
TWIN WATERS 15 $770,000 7.7% $712,500 6.7% 4.8%
WARANA 10 $562,500 4.2% $545,000 9.2% 13.4%
WOOMBYE ~ 15 $392,000 -20.6% $393,500 -2.8% -5.6%
WURTULLA 21 $485,000 -13.9% $485,000 7.2% 1.6%
YANDINA 3 N/A N/A $375,000 N/A N/A
YAROOMBA ~ * 7 N/A N/A $590,000 22.3% 7.3%
SURROUNDS
NOOSA (LGA) ~ 155 $520,000 -3.7% $558,000 5.3% 2.4%
NOOSA (LGA) ^ ~ 71 $587,250 -5.3% $580,000 10.9% -1.3%
BLACK MOUNTAIN ^ 7 N/A N/A $548,750 13.0% 7.0%
COORAN ^ 3 N/A N/A $415,000 N/A N/A
COOROIBAH ^ 8 N/A N/A $580,000 7.4% N/A
COOROY 15 $390,000 N/A $415,000 1.8% -3.5%
DOONAN ^ 13 $690,000 -3.3% $650,000 3.2% -7.8%
NOOSA HEADS 6 N/A N/A $722,500 7.8% 11.8%
NOOSAVILLE 17 $775,000 8.4% $770,000 10.8% 6.6%
PEREGIAN BEACH ~ 8 N/A N/A $710,000 20.7% 14.5%
POMONA 5 N/A N/A $380,000 15.2% N/A
POMONA ^ 6 N/A N/A $487,500 6.0% -9.7%
SUNRISE BEACH 16 $642,500 N/A $600,000 -3.2% -0.8%
SUNSHINE BEACH 6 N/A N/A $1,100,000 7.1% 25.7%
SUNSHINE COAST (SD) 691 $366,500 -0.9% $365,000 2.8% -3.9%
SUNSHINE COAST (LGA) 532 $358,000 -0.6% $360,000 2.9% -2.7%
ALEXANDRA HEADLAND ~ 33 $340,000 -13.9% $345,000 6.5% 3.0%
BATTERY HILL 4 N/A N/A $262,500 15.4% N/A
BIRTINYA 2 N/A N/A $420,000 3.7% N/A
BUDDINA 4 N/A N/A $420,000 10.4% 4.3%
BUDERIM 31 $394,500 5.9% $365,000 -5.2% -6.8%
CALOUNDRA 21 $360,000 -7.1% $390,000 10.5% -13.3%
CALOUNDRA WEST 7 N/A N/A $315,000 3.3% -3.4%
COOLUM BEACH 20 $352,300 1.4% $355,000 2.9% -6.1%
CURRIMUNDI 6 N/A N/A $359,750 3.7% -1.2%
GOLDEN BEACH 9 N/A N/A $368,000 -1.9% -3.2%
KINGS BEACH 27 $418,500 5.9% $392,000 8.9% -11.7%
LITTLE MOUNTAIN 4 N/A N/A $399,000 N/A N/A
MARCOOLA 8 N/A N/A $318,750 4.5% -11.2%
MAROOCHYDORE 96 $330,750 -5.5% $350,000 -0.1% -7.5%
MINYAMA 9 N/A N/A $305,000 4.8% N/A
MOFFAT BEACH 6 N/A N/A $500,000 N/A N/A
MOOLOOLABA ~ 55 $380,000 13.4% $363,750 2.5% -5.5%
MOUNT COOLUM ~ 10 $297,500 -2.5% $350,000 22.8% -1.4%
MOUNTAIN CREEK 6 N/A N/A $367,250 -3.1% N/A
NAMBOUR ~ 11 $220,000 -3.3% $235,000 11.1% -20.3%
PARREARRA ~ 11 $480,000 19.3% $439,500 10.3% -18.6%
PELICAN WATERS 8 N/A N/A $466,000 2.9% -0.3%
PEREGIAN SPRINGS ~ t 2 $515,000 N/A $289,500 -22.8% -28.5%
TWIN WATERS 2 N/A N/A $510,000 7.1% -9.7%
WARANA 7 N/A N/A $342,500 8.2% 8.7%
WURTULLA * 7 N/A N/A $372,500 N/A N/A
SURROUNDS
NOOSA (LGA) 159 $434,000 3.2% $405,000 5.2% -10.0%
COOROY 7 N/A N/A $300,000 N/A N/A
NOOSA HEADS ~ 50 $550,000 -6.0% $537,500 7.9% -2.3%
NOOSAVILLE 45 $395,000 -1.0% $395,000 9.7% 2.3%
PEREGIAN BEACH ~ 6 N/A N/A $322,500 -14.5% -18.4%
SUNRISE BEACH 9 N/A N/A $342,000 0.0% -7.6%
SUNSHINE BEACH ~ 12 $562,000 -9.4% $527,500 -9.8% 2.4%
TEWANTIN 5 N/A N/A $295,000 5.2% -1.7%
SUNSHINE COAST (SD) 139 $257,000 3.8% $247,000 4.4% -2.8%
SUNSHINE COAST (SD) ^ 41 $304,000 -0.3% $305,000 1.7% -3.2%
SUNSHINE COAST (LGA) ~ 124 $257,000 4.7% $245,000 4.3% -2.4%
SUNSHINE COAST (LGA) ^ 35 $305,000 0.0% $310,000 5.1% -0.8%
BEERWAH 7 N/A N/A $209,625 N/A 10.5%
BIRTINYA 1 N/A N/A $275,500 2.4% -15.0%
BLI BLI 7 N/A N/A $250,000 6.4% 1.0%
CALOUNDRA WEST * 5 N/A N/A $214,250 10.4% N/A
FOREST GLEN * 4 N/A N/A $259,000 N/A N/A
GLASS HOUSE MOUNTAINS 5 N/A N/A $198,000 N/A N/A
LITTLE MOUNTAIN 4 N/A N/A $248,000 6.3% -1.6%
MALENY 2 N/A N/A $232,875 9.3% 5.6%
MAROOCHYDORE * 3 N/A N/A $263,125 17.9% 29.9%
MERIDAN PLAINS 1 N/A N/A $199,900 -1.0% -17.4%
MOUNTAIN CREEK ~ * 1 N/A N/A $297,500 19.7% 14.4%
NAMBOUR 2 N/A N/A $175,950 N/A N/A
PALMVIEW ^ * 3 N/A N/A $310,000 N/A N/A
PELICAN WATERS ~ * 12 $266,500 2.1% $263,000 -28.9% -22.6%
PERIGIAN SPRINGS * 5 N/A N/A $288,750 25.5% 9.5%
SIPPY DOWNS 1 N/A N/A $192,000 N/A -15.8%
YAROOMBA * 5 N/A N/A $362,500 N/A N/A
SURROUNDS
NOOSA (LGA) 15 $310,000 N/A $260,000 -1.5% -13.3%
NOOSAVILLE * f - N/A N/A $388,000 41.1% 25.2%
PEREGIAN BEACH 3 N/A N/A $235,000 N/A N/A
23
REGIONAL MARKET UPDATES
SEPTEMBER QUARTER 2015
RENTAL MARKET - 3 BED TOWNHOUSES
RENTAL MARKET - 3 BED HOUSESPOST SEP-15 SEP-14
CODE LOCALITYL $/WEEK NEW BONDS $/WEEK NEW BONDS
RENTAL MARKET - 2 BED UNITSPOST SEP-15 SEP-14
CODE LOCALITYL $/WEEK NEW BONDS $/WEEK NEW BONDS
SUNSHINE COAST REGIONAL $420 806 $400 782
4518 GLASS HOUSE MOUNTAINS $360 9 $355 7
4519 BEERWAH $365 14 $340 21
4550 LANDSBOROUGH $390 17 $310 12
4551 CALOUNDRA $415 189 $400 155
4552 MALENY $330 17 $350 26
4553 PALMVIEW $350 7 $400 13
4555 PALMWOODS $395 13 $380 14
4556 BUDERIM $445 76 $420 82
4557 MOOLOOLABA $450 45 $436 63
4558 MAROOCHYDORE $440 53 $400 53
4559 WOOMBYE $380 9 $405 8
4560 NAMBOUR $380 89 $360 83
4561 YANDINA $370 11 $375 16
4562 BELLI PARK $450 12 $450 12
4564 MARCOOLA $420 40 $380 36
4573 COOLUM BEACH $450 86 $420 91
4575 BIRTINYA $440 107 $430 81
NOOSA SHIRE $430 145 $420 141
4565 TEWANTIN $440 47 $400 43
4566 NOOSAVILLE $430 13 $460 20
4567 NOOSA HEADS $500 40 $500 45
4563 COOROY $390 16 $380 10
4568 FEDERAL $375 20 $350 13
4569 COORAN $310 8 $320 8
SUNSHINE COAST REGIONAL $340 819 $320 823
4519 BEERWAH $300 11 N.A. 1
4551 CALOUNDRA $330 158 $320 147
4552 MALENY $280 6 N.A. 4
4556 BUDERIM $330 59 $320 41
4557 MOOLOOLABA $340 84 $320 124
4558 MAROOCHYDORE $350 154 $320 165
4559 WOOMBYE $280 11 $280 9
4560 NAMBOUR $250 44 $245 42
4564 MARCOOLA $350 55 $350 52
4572 ALEXANDRA HEADLAND $360 64 $360 58
4573 COOLUM BEACH $350 65 $335 73
4575 BIRTINYA $400 100 $400 97
NOOSA SHIRE $360 116 $360 95
4565 TEWANTIN $315 8 $300 9
4566 NOOSAVILLE $375 45 $365 27
4567 NOOSA HEADS $380 60 $360 57
SUNSHINE COAST REGIONAL $410 233 $370 186
4551 CALOUNDRA $415 41 $365 18
4556 BUDERIM $400 45 $395 25
4557 MOOLOOLABA $420 52 $400 52
4558 MAROOCHYDORE $400 27 $350 30
4560 NAMBOUR $370 9 $330 11
4564 MARCOOLA $395 15 $385 17
4573 COOLUM BEACH $440 30 $360 18
4575 BIRTINYA $420 6 N.A. 4
NOOSA SHIRE $480 27 $490 34
4565 TEWANTIN $520 5 N.A. 1
4566 NOOSAVILLE $465 6 $550 11
4567 NOOSA HEADS $480 15 $490 21
FRASER COASTOn the Fraser Coast sales turnover was relatively stable over the quarter; however compared to a year ago, house and unit preliminary sales numbers were up signalling improving market conditions might be around the corner.
Local agents say the Fraser Coast residential property market is the most stable they’ve seen in some time. Confidence is up across the board with agents, buyers and vendors recognising the market's many opportunities.
As a result, listing numbers were up for the house and unit markets over the year to August. Sellers were more pragmatic this quarter and prepared to accept where property prices were, with many buyers taking advantage.
Local agents reported that families upgrading their homes were the most active – taking the place of investors. With property prices still down on five years ago, many were taking the opportunity to upgrade to a larger home.
On the economic front, the manufacturing industry on the Fraser Coast may get a boost with the Federal Government’s $50 billion Navy-fleet upgrade benefiting Maryborough businesses. With long-term contracts likely, this would be a significant windfall creating local employment opportunities for the region.
HOUSE MARKET
The steady recovery in sales activity being seen in the house market is much welcomed by local agents who say the Fraser Coast has always seen cycles of boom and bust.
Average days on market are relatively unchanged compared to a year ago, with the region consistently around 110 days for six consecutive quarters.
Average vendor discounting has also remained relatively unchanged at around 7.5 to eight per cent.
This stability is welcome after a number of years of weak market conditions.
The house market, however, still has some way to go to complete its recovery from the GFC. The region’s median house price for the year ending September was down 3.2 per cent compared to five years ago.
Local agents say those who bought in the years leading up to the GFC are struggling to sell for higher than what they originally paid.

24 QUEENSLAND MARKET MONITOR
REGIONAL MARKET UPDATES
FRASER COAST CONTINUED
UNIT PRICEPOINTS
79
352
890
490
6181
391
1026
548
75
<$250,000 $250,000+ $350k+ $500k+ $1m+
BRISBANE CITY UNIT SALES (p)
JUN 15 SEP 15
269 286
173
70
7
235 246203
65 4
<$250,000 $250,000+ $350k+ $500k+ $1m+
BRISBANE SURROUNDS UNIT SALES (p)
JUN 15 SEP 15
INCLUDES IPSWICH, LOGAN, MORETON BAY & REDLAND
195
542471
234
33
265
678
555
337
55
<$250,000 $250,000+ $350k+ $500k+ $1m+
GOLD COAST UNIT SALES (p)
JUN 15 SEP 15
74
209 221
127
28
76
220 217
137
22
<$250,000 $250,000+ $350k+ $500k+ $1m+
SUNSHINE COAST & NOOSA UNIT SALES (p)
JUN 15 SEP 15
27
12
62
1315
2 1
<$250,000 $250,000+ $350k+ $500k+
BUNDABERG UNIT SALES (p)
JUN 15 SEP 15
206
5930 27
3
219
6343 34
6
<$250,000 $250,000+ $350k+ $500k+ $1m+
CAIRNS & DOUGLAS UNIT SALES (p)
JUN 15 SEP 15
3228
93
43
15
3 3
<$250,000 $250,000+ $350k+ $500k+
FRASER COAST UNIT SALES (p)
JUN 15 SEP 15
89
3
1
34
3
0
<$250,000 $250,000+ $350k+ $500k+
GLADSTONE UNIT SALES (p)
JUN 15 SEP 15
34
24 21 18
1
48
24
149
2
<$250,000 $250,000+ $350k+ $500k+ $1m+
TOWNSVILLE UNIT SALES (p)
JUN 15 SEP 15
13
7 64
12
7
3
0
<$250,000 $250,000+ $350k+ $500k+
MACKAY UNIT SALES (p)
JUN 15 SEP 15
12
68
3
7 78
5
<$250,000 $250,000+ $350k+ $500k+
ROCKHAMPTON & LIVINGSTONE UNIT SALES (p)
JUN 15 SEP 15
31
44
144
31
60
187
<$250,000 $250,000+ $350k+ $500k+
TOOWOOMBA UNIT SALES (p)
JUN 15 SEP 15
LAND PRICEPOINTS
(p) Preliminary. See explanatory notes for further information. Source: REIQ, data provided by CoreLogic RP Data.
34 38 36 33
20
7058
28
<$250,000 $250,000+ $350k+ $500k+
BRISBANE CITY LAND SALES (p)
JUN 15 SEP 15
449
10044
8
464
10029 3
<$250,000 $250,000+ $350k+ $500k+
BRISBANE SURROUNDS LAND SALES (p)
JUN 15 SEP 15Includes IPSWICH, LOGAN, MORETON BAY & REDLAND
98
38
617
111
36
13 14
<$250,000 $250,000+ $350k+ $500k+
GOLD COAST LAND SALES (p)
JUN 15 SEP 15
70
36
21
7
6155
149
<$250,000 $250,000+ $350k+ $500k+
SUNSHINE COAST & NOOSA LAND SALES (p)
JUN 15 SEP 1581
124
56
115
<$250,000 $250,000+ $350k+
CAIRNS & DOUGLAS LAND SALES (p)
JUN 15 SEP 15
53
5 1
78
1 1
<$250,000 $250,000+ $350k+
FRASER COAST LAND SALES (p)
JUN 15 SEP 15
22
2 1
10
31
<$250,000 $250,000+ $350k+
GLADSTONE LAND SALES (p)
JUN 15 SEP 15
53
1 0
43
3 0
<$250,000 $250,000+ $350k+
ROCKHAMPTON & LIVINGSTONE LAND SALES (p)
JUN 15 SEP 15
46
2 0
54
4 1
<$250,000 $250,000+ $350k+
TOOWOOMBA LAND SALES (p)
JUN 15 SEP 15
46
2 3
72
71
<$250,000 $250,000+ $350k+
TOWNSVILLE LAND SALES (p)
JUN 15 SEP 15
15
4 4
22
30
<$250,000 $250,000+ $350k+
MACKAY LAND SALES (p)
JUN 15 SEP 15
36
1 1
41
0 0
<$250,000 $250,000+ $350k+
BUNDABERG LAND SALES (p)
JUN 15 SEP 15
SALES MARKET - HOUSES
SUBURB NUMBER OF SALES
MEDIAN SALE
QTRLY CHANGE
ANNUAL MEDIAN
SALE
1YR CHANGE
5YR CHANGE
SALES MARKET - UNITS & TOWNHOUSESFRASER COAST (LGA) ~ 65 $216,250 -15.9% $250,000 -3.8% -12.0%
PIALBA ~ 9 N/A N/A $240,000 -23.2% -24.3%
SCARNESS 4 N/A N/A $267,500 8.3% 7.0%
TORQUAY 8 N/A N/A $212,000 -12.1% -14.3%
URANGAN 21 $235,000 -11.7% $275,000 5.8% -16.7%
SURROUNDS
GYMPIE (LGA) 8 N/A N/A $260,000 -4.1% N/A
UNIT MARKET
Fraser Coast’s unit and townhouse market has also shown small signs of recovery with sales activity increasing 20 per cent over the past 12 months.
While no new stock has come onto the market, listing numbers are up with more vendors making the decision to offload their investment properties. And given current prices, many are being snapped up by buyers on the lookout for a bargain.
Return on investment is slowly coming back to the Fraser Coast unit market and this is encouraging more investors back into the market.
RENTAL MARKET
On the Fraser Coast, vacancy rates have returned to healthier levels, down 0.4 percentage points over the three months to September.
This was largely off the back of an improvement in Maryborough’s rental market. Hervey Bay vacancy rate eased to 3.3 per cent but remained in healthy territory.
Median weekly rents remained relatively steady except for three bedroom townhouses which were up $25 to $375 compared to the September quarter last year.
Meanwhile gross rental yields for both houses and units sit at or above five per cent.
FRASER COAST (LGA) 300 $300,000 0.2% $300,000 1.7% -3.2%
FRASER COAST (LGA) ^ 75 $372,000 0.8% $365,000 -1.4% -7.6%
BOORAL ^ 4 N/A N/A $366,000 -1.6% N/A
BURRUM HEADS 9 N/A N/A $370,000 -3.9% N/A
DUNDOWRAN BEACH ^ 6 N/A N/A $540,000 N/A N/A
ELI WATERS 13 $336,000 -2.6% $325,500 1.2% -1.2%
GLENWOOD ^ ~ 7 N/A N/A $180,000 N/A -20.0%
GRANVILLE 4 N/A N/A $200,000 N/A -9.9%
KAWUNGAN 19 $330,000 -2.9% $335,000 1.7% 2.6%
MARYBOROUGH 50 $192,500 -2.8% $197,000 -4.1% -14.3%
PIALBA 16 $286,500 10.4% $269,500 -10.2% -15.3%
POINT VERNON ~ 23 $290,000 -14.1% $302,000 0.7% -5.3%
RIVER HEADS 5 N/A N/A $300,000 12.1% N/A
SCARNESS 15 $275,000 0.0% $273,000 -0.9% -8.4%
TINANA 3 N/A N/A $272,500 -2.7% -12.1%
TOOGOOM 17 $310,000 N/A $304,327 1.2% -2.3%
TORQUAY 15 $308,000 6.6% $300,000 -8.0% -7.0%
URANGAN 26 $325,000 8.3% $310,000 0.0% -5.0%
URRAWEEN 27 $353,000 -1.1% $350,000 3.6% 3.0%
SURROUNDS
GYMPIE (LGA) 108 $272,500 0.9% $265,500 3.7% -8.4%
GYMPIE (LGA) ^ ~ 78 $355,000 -5.3% $345,000 5.8% -4.4%
CHATSWORTH ^ 7 N/A N/A $360,000 N/A N/A
COOLOOLA COVE 17 $285,000 N/A $280,000 6.7% -6.5%
CURRA ^ 7 N/A N/A $266,500 3.7% -12.3%
GYMPIE 38 $232,500 1.6% $240,000 2.1% -9.4%
SOUTHSIDE 18 $350,000 9.5% $320,000 4.4% -4.5%
TIN CAN BAY 8 N/A N/A $291,000 0.3% -13.8%
SOUTH BURNETT (LGA) ~ 49 $182,000 -5.5% $187,250 -6.4% -20.3%
SOUTH BURNETT (LGA) ^ ~ 38 $265,000 14.0% $260,000 6.1% -7.8%
KINGAROY 21 $212,000 -7.8% $230,000 0.0% -16.4%
KINGAROY ^ ~ 3 N/A N/A $365,500 N/A -13.0%
MURGON 8 N/A N/A $140,000 0.0% -9.7%
NANANGO 7 N/A N/A $170,000 -6.8% -24.4%
HOUSE PRICEPOINTS
1,194 1,412
628
18
1,265 1,508
652
29
<$350k $350k+ $500k+ $1m+
BRISBANE SURROUNDS HOUSE SALES (p)
JUN 15 SEP 15INCLUDES IPSWICH, LOGAN, MORETON BAY & REDLAND
55
557 698
119 44
567
776
139
<$350k $350k+ $500k+ $1m+
GOLD COAST HOUSE SALES (p)
JUN 15 SEP 15
163
43
8
166
42
7
<$350k $350k+ $500k+
BUNDABERG HOUSE SALES (p)
JUN 15 SEP 15
153
213
90
3
160
247
114
4
<$350k $350k+ $500k+ $1m+
CAIRNS & DOUGLAS HOUSE SALES (p)
JUN 15 SEP 15
211
71
14
203
78
13
<$350k $350k+ $500k+
FRASER COAST HOUSE SALES (p)
JUN 15 SEP 15
48 52
14
57
45
8
<$350k $350k+ $500k+
GLADSTONE HOUSE SALES (p)
JUN 15 SEP 15
227
156
46
222
149
50
<$350k $350k+ $500k+
TOWNSVILLE HOUSE SALES (p)
JUN 15 SEP 15
75 63
21
89
69
16
<$350k $350k+ $500k+
MACKAY HOUSE SALES (p)
JUN 15 SEP 15
133
72
22
146
57
26
<$350k $350k+ $500k+
ROCKHAMPTON & LIVINGSTONE HOUSE SALES (p)
MAR 15 JUN 15
114
740
1,997
318 124
755
2,126
333
<$350k $350k+ $500k+ $1m+
BRISBANE CITY HOUSE SALES (p)
JUN 15 SEP 15215
163
56
233 200
59
<$350k $350k+ $500k+
TOOWOOMBA HOUSE SALES (p)
JUN 15 SEP 15
70
431 427
58 92
437 477
42
<$350k $350k+ $500k+ $1m+
SUNSHINE COAST & NOOSA HOUSE SALES (p)
JUN 15 SEP 15
25
REGIONAL MARKET UPDATES
SEPTEMBER QUARTER 2015
FRASER COAST (LGA) 80 $151,000 -8.5% $149,500 1.5% -3.5%
FRASER COAST (LGA) ^ ~ 30 $67,500 -19.2% $75,000 -11.8% -21.1%
BURRUM HEADS 3 N/A N/A $105,000 N/A -30.8%
GLENWOOD ^ ~ 11 $60,000 -9.8% $65,000 -7.1% -18.8%
RIVER HEADS ~ 6 N/A N/A $102,500 4.6% -31.7%
TOOGOOM 8 N/A N/A $115,000 17.9% -25.8%
WONDUNNA 12 $154,500 N/A $157,000 -0.6% -10.3%
SURROUNDS
GYMPIE (LGA) ~ 29 $135,000 15.4% $120,000 2.6% -4.0%
GYMPIE (LGA) ^ 35 $120,000 4.3% $120,000 0.0% -5.1%
GYMPIE 3 N/A N/A $125,000 -3.8% 2.7%
FRASER COAST REGIONAL $245 164 $235 173
4650 ALDERSHOT $190 36 $190 44
4655 BOORAL $260 128 $250 125
GYMPIE REGIONAL $204 46 $204 69
4570 AMAMOOR $200 29 $200 50
4580 COOLOOLA $200 8 $210 6
4581 EURONG $230 8 $250 13
SOUTH BURNETT REGIONAL $180 57 $185 54
4610 ALICE CREEK $190 50 $200 36
RENTAL MARKET - 3 BED TOWNHOUSES
BUNDABERG
RENTAL MARKET - 3 BED HOUSESPOST SEP-15 SEP-14
CODE LOCALITYL $/WEEK NEW BONDS $/WEEK NEW BONDS
RENTAL MARKET - 3 BED HOUSES (CONT'D)POST SEP-15 SEP-14
CODE LOCALITYL $/WEEK NEW BONDS $/WEEK NEW BONDS
FRASER COAST REGIONAL $290 310 $280 323
4650 ALDERSHOT $250 99 $260 103
4655 BOORAL $310 185 $290 200
4659 BEELBI CREEK $300 25 $280 19
GYMPIE REGIONAL $260 180 $260 191
4570 AMAMOOR $260 143 $253 142
4580 COOLOOLA $275 27 $270 29
FRASER COAST REGIONAL $310 50 $325 51
4655 BOORAL $320 47 $325 49
GYMPIE REGIONAL N/A 10 N/A 10
4570 AMAMOOR $440 9 $270 7
The Bundaberg residential market steadied over the September quarter. Sales activity and other market indicators have remained relatively unchanged since the end of June.
Overall confidence remains subdued, however upcoming developments will likely deliver a boost to optimism and market confidence.
The Bundaberg Regional Council said there were 12 major projects in the pipeline, including commercial and residential developments, the Council’s $90 million wastewater treatment plant and a new proposed plasterboard manufacturing plant set to provide 500 local jobs.
Other significant developments in the area include infrastructure projects at the Port of Bundaberg and planned expansion of the Bundaberg airport.
The gas pipeline project for the Port of Bundaberg is under way and it is expected to significantly improve energy operating costs for the industrial sector. In October the State Government announced it would increase funding for the project by $8.8 million to a total $19.8 million. The Port may also become a State Development Area given the scale of the project and its economic significance for the region.
Bundaberg Regional Council is planning to expand the Bundaberg Airport to accommodate an industrial and commercial subdivision as part of the airport’s aviation and aerospace precinct. A growing industry for the region, aviation is helping to diversify the region’s economy.
Once these projects come online and construction is visible, it will serve as evidence that the region is moving forward and optimism is expected to grow.
Local agents are hopeful 2016 will be very promising as employment opportunities encourage more people to move to the area.
HOUSE MARKET
Bundaberg’s house sales market activity was consistent with the previous quarter. The market is tracking along a very stable trajectory, with quarterly sales volumes remaining relatively consistent since mid-2013.
The median sale price has similarly remained consistent, with no change over the past year.
Even without a boost in sales volumes, local agents reported confidence in the region was gathering momentum. House listings increased six per cent over the year to August indicating vendor confidence was growing.
With increased supply, average days on market increased slightly to 107 days. Average vendor discounting was likewise up compared to a year ago, however since the start of the year has levelled off at 8.1 per cent.
UNIT MARKET
Bundaberg’s unit and townhouse market remains somewhat patchy with sales activity easing over the September quarter. With this drop in activity occurring among the affordable stock, the median sale price for the quarter was up 27.8 per cent compared to the previous quarter.
Unit listings over the year were up marginally, and the region continued to record the longest days on market for all major regions at 140 days.
The region’s average vendor discounting rate also increased marginally over the year to 8.2 per cent.
RENTAL MARKET - 2 BED UNITS
SOUTH BURNETT REGIONAL $240 144 $230 148
4605 BARLIL $195 22 $200 24
4606 CHARLESTOWN $230 9 $220 14
4608 CHARLESTOWN $210 5 $225 6
4610 ALICE CREEK $250 77 $250 62
4615 BARKER CREEK FLAT $240 30 $230 39
SALES MARKET - VACANT LAND
SUBURB NUMBER OF SALES
MEDIAN SALE
QTRLY CHANGE
ANNUAL MEDIAN
SALE
1YR CHANGE
5YR CHANGE
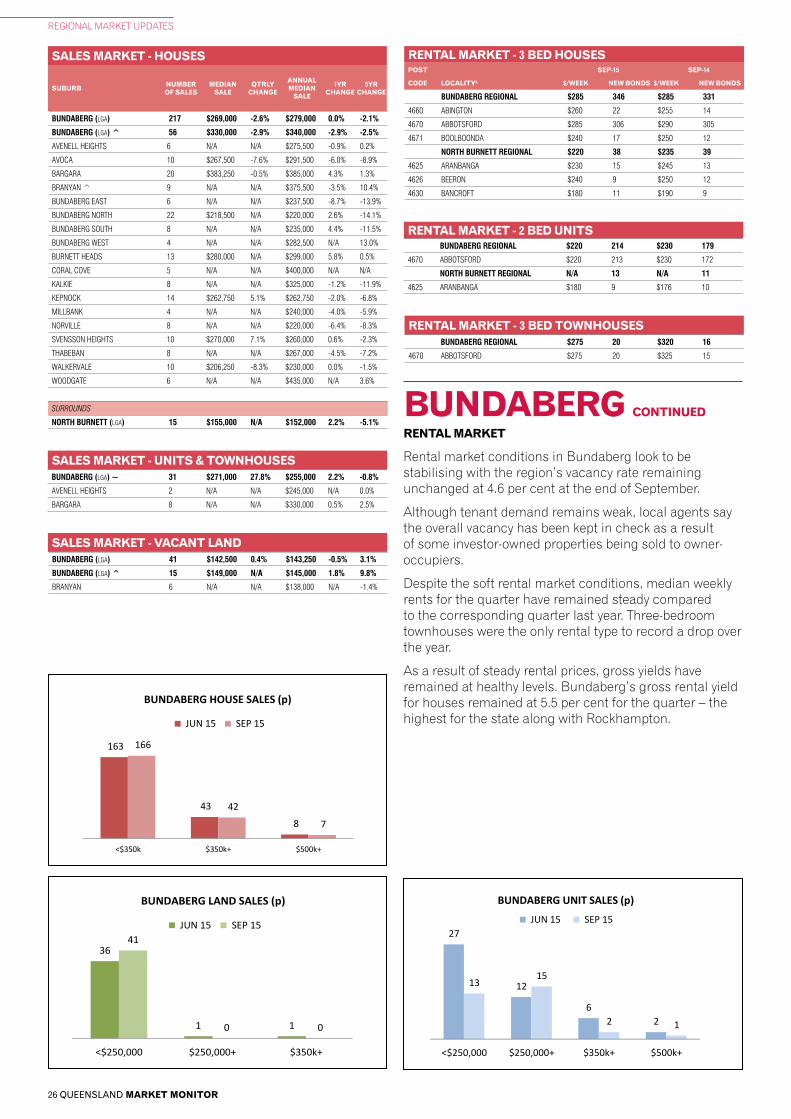
26 QUEENSLAND MARKET MONITOR
REGIONAL MARKET UPDATES
BUNDABERG REGIONAL $285 346 $285 331
4660 ABINGTON $260 22 $255 14
4670 ABBOTSFORD $285 306 $290 305
4671 BOOLBOONDA $240 17 $250 12
NORTH BURNETT REGIONAL $220 38 $235 39
4625 ARANBANGA $230 15 $245 13
4626 BEERON $240 9 $250 12
4630 BANCROFT $180 11 $190 9
UNIT PRICEPOINTS
79
352
890
490
6181
391
1026
548
75
<$250,000 $250,000+ $350k+ $500k+ $1m+
BRISBANE CITY UNIT SALES (p)
JUN 15 SEP 15
269 286
173
70
7
235 246203
65 4
<$250,000 $250,000+ $350k+ $500k+ $1m+
BRISBANE SURROUNDS UNIT SALES (p)
JUN 15 SEP 15
INCLUDES IPSWICH, LOGAN, MORETON BAY & REDLAND
195
542471
234
33
265
678
555
337
55
<$250,000 $250,000+ $350k+ $500k+ $1m+
GOLD COAST UNIT SALES (p)
JUN 15 SEP 15
74
209 221
127
28
76
220 217
137
22
<$250,000 $250,000+ $350k+ $500k+ $1m+
SUNSHINE COAST & NOOSA UNIT SALES (p)
JUN 15 SEP 15
27
12
62
1315
2 1
<$250,000 $250,000+ $350k+ $500k+
BUNDABERG UNIT SALES (p)
JUN 15 SEP 15
206
5930 27
3
219
6343 34
6
<$250,000 $250,000+ $350k+ $500k+ $1m+
CAIRNS & DOUGLAS UNIT SALES (p)
JUN 15 SEP 15
3228
93
43
15
3 3
<$250,000 $250,000+ $350k+ $500k+
FRASER COAST UNIT SALES (p)
JUN 15 SEP 15
89
3
1
34
3
0
<$250,000 $250,000+ $350k+ $500k+
GLADSTONE UNIT SALES (p)
JUN 15 SEP 15
34
24 21 18
1
48
24
149
2
<$250,000 $250,000+ $350k+ $500k+ $1m+
TOWNSVILLE UNIT SALES (p)
JUN 15 SEP 15
13
7 64
12
7
3
0
<$250,000 $250,000+ $350k+ $500k+
MACKAY UNIT SALES (p)
JUN 15 SEP 15
12
68
3
7 78
5
<$250,000 $250,000+ $350k+ $500k+
ROCKHAMPTON & LIVINGSTONE UNIT SALES (p)
JUN 15 SEP 15
31
44
144
31
60
187
<$250,000 $250,000+ $350k+ $500k+
TOOWOOMBA UNIT SALES (p)
JUN 15 SEP 15
LAND PRICEPOINTS
(p) Preliminary. See explanatory notes for further information. Source: REIQ, data provided by CoreLogic RP Data.
34 38 36 33
20
7058
28
<$250,000 $250,000+ $350k+ $500k+
BRISBANE CITY LAND SALES (p)
JUN 15 SEP 15
449
10044
8
464
10029 3
<$250,000 $250,000+ $350k+ $500k+
BRISBANE SURROUNDS LAND SALES (p)
JUN 15 SEP 15Includes IPSWICH, LOGAN, MORETON BAY & REDLAND
98
38
617
111
36
13 14
<$250,000 $250,000+ $350k+ $500k+
GOLD COAST LAND SALES (p)
JUN 15 SEP 15
70
36
21
7
6155
149
<$250,000 $250,000+ $350k+ $500k+
SUNSHINE COAST & NOOSA LAND SALES (p)
JUN 15 SEP 1581
124
56
115
<$250,000 $250,000+ $350k+
CAIRNS & DOUGLAS LAND SALES (p)
JUN 15 SEP 15
53
5 1
78
1 1
<$250,000 $250,000+ $350k+
FRASER COAST LAND SALES (p)
JUN 15 SEP 15
22
2 1
10
31
<$250,000 $250,000+ $350k+
GLADSTONE LAND SALES (p)
JUN 15 SEP 15
53
1 0
43
3 0
<$250,000 $250,000+ $350k+
ROCKHAMPTON & LIVINGSTONE LAND SALES (p)
JUN 15 SEP 15
46
2 0
54
4 1
<$250,000 $250,000+ $350k+
TOOWOOMBA LAND SALES (p)
JUN 15 SEP 15
46
2 3
72
71
<$250,000 $250,000+ $350k+
TOWNSVILLE LAND SALES (p)
JUN 15 SEP 15
15
4 4
22
30
<$250,000 $250,000+ $350k+
MACKAY LAND SALES (p)
JUN 15 SEP 15
36
1 1
41
0 0
<$250,000 $250,000+ $350k+
BUNDABERG LAND SALES (p)
JUN 15 SEP 15
RENTAL MARKET - 3 BED TOWNHOUSES
SALES MARKET - VACANT LAND
SALES MARKET - UNITS & TOWNHOUSES
RENTAL MARKET - 2 BED UNITS
SALES MARKET - HOUSES
SUBURB NUMBER OF SALES
MEDIAN SALE
QTRLY CHANGE
ANNUAL MEDIAN
SALE
1YR CHANGE
5YR CHANGE
RENTAL MARKET - 3 BED HOUSESPOST SEP-15 SEP-14
CODE LOCALITYL $/WEEK NEW BONDS $/WEEK NEW BONDS
BUNDABERG REGIONAL $220 214 $230 179
4670 ABBOTSFORD $220 213 $230 172
NORTH BURNETT REGIONAL N/A 13 N/A 11
4625 ARANBANGA $180 9 $176 10
BUNDABERG (LGA) 217 $269,000 -2.6% $279,000 0.0% -2.1%
BUNDABERG (LGA) ^ 56 $330,000 -2.9% $340,000 -2.9% -2.5%
AVENELL HEIGHTS 6 N/A N/A $275,500 -0.9% 0.2%
AVOCA 10 $267,500 -7.6% $291,500 -6.0% -8.9%
BARGARA 20 $383,250 -0.5% $385,000 4.3% 1.3%
BRANYAN ^ 9 N/A N/A $375,500 -3.5% 10.4%
BUNDABERG EAST 6 N/A N/A $237,500 -8.7% -13.9%
BUNDABERG NORTH 22 $218,500 N/A $220,000 2.6% -14.1%
BUNDABERG SOUTH 8 N/A N/A $235,000 4.4% -11.5%
BUNDABERG WEST 4 N/A N/A $282,500 N/A 13.0%
BURNETT HEADS 13 $280,000 N/A $299,000 5.8% 0.5%
CORAL COVE 5 N/A N/A $400,000 N/A N/A
KALKIE 8 N/A N/A $325,000 -1.2% -11.9%
KEPNOCK 14 $262,750 5.1% $262,750 -2.0% -6.8%
MILLBANK 4 N/A N/A $240,000 -4.0% -5.9%
NORVILLE 8 N/A N/A $220,000 -6.4% -8.3%
SVENSSON HEIGHTS 10 $270,000 7.1% $260,000 0.6% -2.3%
THABEBAN 8 N/A N/A $267,000 -4.5% -7.2%
WALKERVALE 10 $206,250 -8.3% $230,000 0.0% -1.5%
WOODGATE 6 N/A N/A $435,000 N/A 3.6%
SURROUNDS
NORTH BURNETT (LGA) 15 $155,000 N/A $152,000 2.2% -5.1%
BUNDABERG (LGA) ~ 31 $271,000 27.8% $255,000 2.2% -0.8%
AVENELL HEIGHTS 2 N/A N/A $245,000 N/A 0.0%
BARGARA 8 N/A N/A $330,000 0.5% 2.5%
BUNDABERG (LGA) 41 $142,500 0.4% $143,250 -0.5% 3.1%
BUNDABERG (LGA) ^ 15 $149,000 N/A $145,000 1.8% 9.8%
BRANYAN 6 N/A N/A $138,000 N/A -1.4%
BUNDABERG REGIONAL $275 20 $320 16
4670 ABBOTSFORD $275 20 $325 15
RENTAL MARKET
Rental market conditions in Bundaberg look to be stabilising with the region’s vacancy rate remaining unchanged at 4.6 per cent at the end of September.
Although tenant demand remains weak, local agents say the overall vacancy has been kept in check as a result of some investor-owned properties being sold to owner-occupiers.
Despite the soft rental market conditions, median weekly rents for the quarter have remained steady compared to the corresponding quarter last year. Three-bedroom townhouses were the only rental type to record a drop over the year.
As a result of steady rental prices, gross yields have remained at healthy levels. Bundaberg’s gross rental yield for houses remained at 5.5 per cent for the quarter – the highest for the state along with Rockhampton.
HOUSE PRICEPOINTS
1,194 1,412
628
18
1,265 1,508
652
29
<$350k $350k+ $500k+ $1m+
BRISBANE SURROUNDS HOUSE SALES (p)
JUN 15 SEP 15INCLUDES IPSWICH, LOGAN, MORETON BAY & REDLAND
55
557 698
119 44
567
776
139
<$350k $350k+ $500k+ $1m+
GOLD COAST HOUSE SALES (p)
JUN 15 SEP 15
163
43
8
166
42
7
<$350k $350k+ $500k+
BUNDABERG HOUSE SALES (p)
JUN 15 SEP 15
153
213
90
3
160
247
114
4
<$350k $350k+ $500k+ $1m+
CAIRNS & DOUGLAS HOUSE SALES (p)
JUN 15 SEP 15
211
71
14
203
78
13
<$350k $350k+ $500k+
FRASER COAST HOUSE SALES (p)
JUN 15 SEP 15
48 52
14
57
45
8
<$350k $350k+ $500k+
GLADSTONE HOUSE SALES (p)
JUN 15 SEP 15
227
156
46
222
149
50
<$350k $350k+ $500k+
TOWNSVILLE HOUSE SALES (p)
JUN 15 SEP 15
75 63
21
89
69
16
<$350k $350k+ $500k+
MACKAY HOUSE SALES (p)
JUN 15 SEP 15
133
72
22
146
57
26
<$350k $350k+ $500k+
ROCKHAMPTON & LIVINGSTONE HOUSE SALES (p)
MAR 15 JUN 15
114
740
1,997
318 124
755
2,126
333
<$350k $350k+ $500k+ $1m+
BRISBANE CITY HOUSE SALES (p)
JUN 15 SEP 15215
163
56
233 200
59
<$350k $350k+ $500k+
TOOWOOMBA HOUSE SALES (p)
JUN 15 SEP 15
70
431 427
58 92
437 477
42
<$350k $350k+ $500k+ $1m+
SUNSHINE COAST & NOOSA HOUSE SALES (p)
JUN 15 SEP 15
BUNDABERG CONTINUED
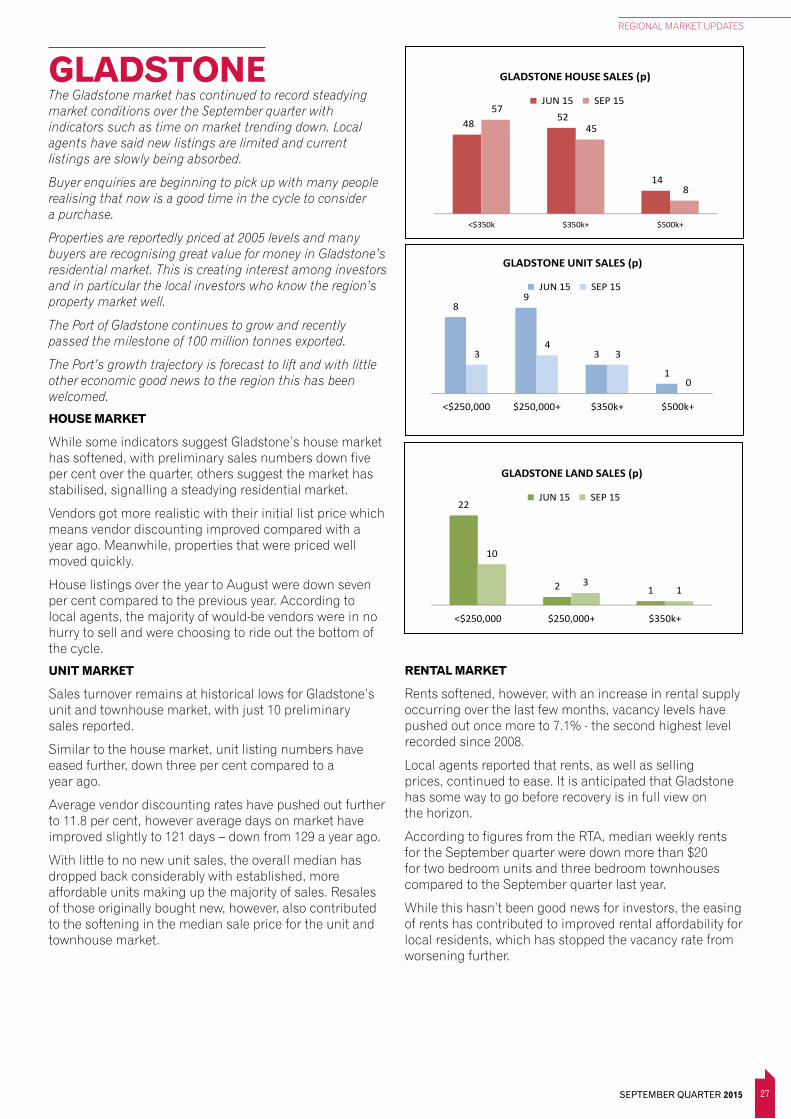
27
REGIONAL MARKET UPDATES
SEPTEMBER QUARTER 2015
GLADSTONE
HOUSE PRICEPOINTS
1,194 1,412
628
18
1,265 1,508
652
29
<$350k $350k+ $500k+ $1m+
BRISBANE SURROUNDS HOUSE SALES (p)
JUN 15 SEP 15INCLUDES IPSWICH, LOGAN, MORETON BAY & REDLAND
55
557 698
119 44
567
776
139
<$350k $350k+ $500k+ $1m+
GOLD COAST HOUSE SALES (p)
JUN 15 SEP 15
163
43
8
166
42
7
<$350k $350k+ $500k+
BUNDABERG HOUSE SALES (p)
JUN 15 SEP 15
153
213
90
3
160
247
114
4
<$350k $350k+ $500k+ $1m+
CAIRNS & DOUGLAS HOUSE SALES (p)
JUN 15 SEP 15
211
71
14
203
78
13
<$350k $350k+ $500k+
FRASER COAST HOUSE SALES (p)
JUN 15 SEP 15
48 52
14
57
45
8
<$350k $350k+ $500k+
GLADSTONE HOUSE SALES (p)
JUN 15 SEP 15
227
156
46
222
149
50
<$350k $350k+ $500k+
TOWNSVILLE HOUSE SALES (p)
JUN 15 SEP 15
75 63
21
89
69
16
<$350k $350k+ $500k+
MACKAY HOUSE SALES (p)
JUN 15 SEP 15
133
72
22
146
57
26
<$350k $350k+ $500k+
ROCKHAMPTON & LIVINGSTONE HOUSE SALES (p)
MAR 15 JUN 15
114
740
1,997
318 124
755
2,126
333
<$350k $350k+ $500k+ $1m+
BRISBANE CITY HOUSE SALES (p)
JUN 15 SEP 15215
163
56
233 200
59
<$350k $350k+ $500k+
TOOWOOMBA HOUSE SALES (p)
JUN 15 SEP 15
70
431 427
58 92
437 477
42
<$350k $350k+ $500k+ $1m+
SUNSHINE COAST & NOOSA HOUSE SALES (p)
JUN 15 SEP 15
UNIT PRICEPOINTS
79
352
890
490
6181
391
1026
548
75
<$250,000 $250,000+ $350k+ $500k+ $1m+
BRISBANE CITY UNIT SALES (p)
JUN 15 SEP 15
269 286
173
70
7
235 246203
65 4
<$250,000 $250,000+ $350k+ $500k+ $1m+
BRISBANE SURROUNDS UNIT SALES (p)
JUN 15 SEP 15
INCLUDES IPSWICH, LOGAN, MORETON BAY & REDLAND
195
542471
234
33
265
678
555
337
55
<$250,000 $250,000+ $350k+ $500k+ $1m+
GOLD COAST UNIT SALES (p)
JUN 15 SEP 15
74
209 221
127
28
76
220 217
137
22
<$250,000 $250,000+ $350k+ $500k+ $1m+
SUNSHINE COAST & NOOSA UNIT SALES (p)
JUN 15 SEP 15
27
12
62
1315
2 1
<$250,000 $250,000+ $350k+ $500k+
BUNDABERG UNIT SALES (p)
JUN 15 SEP 15
206
5930 27
3
219
6343 34
6
<$250,000 $250,000+ $350k+ $500k+ $1m+
CAIRNS & DOUGLAS UNIT SALES (p)
JUN 15 SEP 15
3228
93
43
15
3 3
<$250,000 $250,000+ $350k+ $500k+
FRASER COAST UNIT SALES (p)
JUN 15 SEP 15
89
3
1
34
3
0
<$250,000 $250,000+ $350k+ $500k+
GLADSTONE UNIT SALES (p)
JUN 15 SEP 15
34
24 21 18
1
48
24
149
2
<$250,000 $250,000+ $350k+ $500k+ $1m+
TOWNSVILLE UNIT SALES (p)
JUN 15 SEP 15
13
7 64
12
7
3
0
<$250,000 $250,000+ $350k+ $500k+
MACKAY UNIT SALES (p)
JUN 15 SEP 15
12
68
3
7 78
5
<$250,000 $250,000+ $350k+ $500k+
ROCKHAMPTON & LIVINGSTONE UNIT SALES (p)
JUN 15 SEP 15
31
44
144
31
60
187
<$250,000 $250,000+ $350k+ $500k+
TOOWOOMBA UNIT SALES (p)
JUN 15 SEP 15
The Gladstone market has continued to record steadying market conditions over the September quarter with indicators such as time on market trending down. Local agents have said new listings are limited and current listings are slowly being absorbed.
Buyer enquiries are beginning to pick up with many people realising that now is a good time in the cycle to consider a purchase.
Properties are reportedly priced at 2005 levels and many buyers are recognising great value for money in Gladstone’s residential market. This is creating interest among investors and in particular the local investors who know the region’s property market well.
The Port of Gladstone continues to grow and recently passed the milestone of 100 million tonnes exported.
The Port’s growth trajectory is forecast to lift and with little other economic good news to the region this has been welcomed.
HOUSE MARKET
While some indicators suggest Gladstone’s house market has softened, with preliminary sales numbers down five per cent over the quarter, others suggest the market has stabilised, signalling a steadying residential market.
Vendors got more realistic with their initial list price which means vendor discounting improved compared with a year ago. Meanwhile, properties that were priced well moved quickly.
House listings over the year to August were down seven per cent compared to the previous year. According to local agents, the majority of would-be vendors were in no hurry to sell and were choosing to ride out the bottom of the cycle.
UNIT MARKET
Sales turnover remains at historical lows for Gladstone’s unit and townhouse market, with just 10 preliminary sales reported.
Similar to the house market, unit listing numbers have eased further, down three per cent compared to a year ago.
Average vendor discounting rates have pushed out further to 11.8 per cent, however average days on market have improved slightly to 121 days – down from 129 a year ago.
With little to no new unit sales, the overall median has dropped back considerably with established, more affordable units making up the majority of sales. Resales of those originally bought new, however, also contributed to the softening in the median sale price for the unit and townhouse market.
RENTAL MARKET
Rents softened, however, with an increase in rental supply occurring over the last few months, vacancy levels have pushed out once more to 7.1% - the second highest level recorded since 2008.
Local agents reported that rents, as well as selling prices, continued to ease. It is anticipated that Gladstone has some way to go before recovery is in full view on the horizon.
According to figures from the RTA, median weekly rents for the September quarter were down more than $20 for two bedroom units and three bedroom townhouses compared to the September quarter last year.
While this hasn’t been good news for investors, the easing of rents has contributed to improved rental affordability for local residents, which has stopped the vacancy rate from worsening further.
LAND PRICEPOINTS
(p) Preliminary. See explanatory notes for further information. Source: REIQ, data provided by CoreLogic RP Data.
34 38 36 33
20
7058
28
<$250,000 $250,000+ $350k+ $500k+
BRISBANE CITY LAND SALES (p)
JUN 15 SEP 15
449
10044
8
464
10029 3
<$250,000 $250,000+ $350k+ $500k+
BRISBANE SURROUNDS LAND SALES (p)
JUN 15 SEP 15Includes IPSWICH, LOGAN, MORETON BAY & REDLAND
98
38
617
111
36
13 14
<$250,000 $250,000+ $350k+ $500k+
GOLD COAST LAND SALES (p)
JUN 15 SEP 15
70
36
21
7
6155
149
<$250,000 $250,000+ $350k+ $500k+
SUNSHINE COAST & NOOSA LAND SALES (p)
JUN 15 SEP 1581
124
56
115
<$250,000 $250,000+ $350k+
CAIRNS & DOUGLAS LAND SALES (p)
JUN 15 SEP 15
53
5 1
78
1 1
<$250,000 $250,000+ $350k+
FRASER COAST LAND SALES (p)
JUN 15 SEP 15
22
2 1
10
31
<$250,000 $250,000+ $350k+
GLADSTONE LAND SALES (p)
JUN 15 SEP 15
53
1 0
43
3 0
<$250,000 $250,000+ $350k+
ROCKHAMPTON & LIVINGSTONE LAND SALES (p)
JUN 15 SEP 15
46
2 0
54
4 1
<$250,000 $250,000+ $350k+
TOOWOOMBA LAND SALES (p)
JUN 15 SEP 15
46
2 3
72
71
<$250,000 $250,000+ $350k+
TOWNSVILLE LAND SALES (p)
JUN 15 SEP 15
15
4 4
22
30
<$250,000 $250,000+ $350k+
MACKAY LAND SALES (p)
JUN 15 SEP 15
36
1 1
41
0 0
<$250,000 $250,000+ $350k+
BUNDABERG LAND SALES (p)
JUN 15 SEP 15

28 QUEENSLAND MARKET MONITOR
REGIONAL MARKET UPDATES
GLADSTONE (LGA) ~ 10 N/A N/A $253,000 -29.7% -28.7%
ROCKHAMPTON
RENTAL MARKET - 3 BED TOWNHOUSES
SALES MARKET - UNITS & TOWNHOUSES
RENTAL MARKET - 2 BED UNITS
SALES MARKET - HOUSES
SUBURB NUMBER OF SALES
MEDIAN SALE
QTRLY CHANGE
ANNUAL MEDIAN
SALE
1YR CHANGE
5YR CHANGE
RENTAL MARKET - 3 BED HOUSESPOST SEP-14 SEP-13
CODE LOCALITYL $/WEEK NEW BONDS $/WEEK NEW BONDS
SALES MARKET - VACANT LAND
SUBURB NUMBER OF SALES
MEDIAN SALE
QTRLY CHANGE
ANNUAL MEDIAN
SALE
1YR CHANGE
5YR CHANGE
GLADSTONE (LGA) ~ 110 $342,000 -9.4% $370,000 -7.5% -2.6%
GLADSTONE (LGA) ^ ~ 24 $339,500 -22.4% $458,000 -3.1% -0.4%
AGNES WATER ^ 6 N/A N/A $368,500 8.4% N/A
BOYNE ISLAND 11 $380,000 -1.9% $392,500 -9.0% -6.0%
CALLIOPE 3 N/A N/A $370,000 -11.4% -2.1%
CLINTON 12 $325,000 0.0% $343,500 -8.4% -10.5%
GLEN EDEN 6 N/A N/A $377,500 -8.4% -15.6%
KIN KORA 7 N/A N/A $326,000 -11.9% -10.7%
KIRKWOOD 5 N/A N/A $429,000 -6.7% N/A
NEW AUCKLAND 13 $400,000 4.0% $377,500 -4.4% 1.8%
SOUTH GLADSTONE 4 N/A N/A $340,000 -4.4% 0.4%
TANNUM SANDS ~ 6 N/A N/A $420,000 -14.9% -12.0%
TELINA 6 N/A N/A $400,000 -0.6% -9.1%
WEST GLADSTONE ~ 15 $253,000 N/A $277,500 -25.5% -19.6%
SURROUNDS
BANANA (LGA) 14 N/A N/A $260,000 -4.4% -2.3%
BILOELA 11 $292,500 1.7% $307,500 -0.8% 7.9%
GLADSTONE (LGA) ~ * 14 N/A N/A $185,500 -15.7% 2.5%
KIRKWOOD ~ 2 N/A N/A $195,000 -15.2% 5.8%
GLADSTONE REGIONAL $290 256 $320 295
4677 AGNES WATER $300 10 $300 6
4680 GLADSTONE $290 239 $320 280
BANANA SHIRE $290 71 $300 60
4715 BILOELA $330 32 $330 23
4718 BAUHINIA $250 29 $250 30
4719 CAMBOON $160 7 N.A. 2
GLADSTONE REGIONAL $220 199 $250 238
4680 GLADSTONE $220 198 $250 237
BANANA SHIRE $240 18 $250 22
4715 BILOELA $250 16 $260 13
GLADSTONE REGIONAL $300 94 $350 98
4680 GLADSTONE $300 92 $350 96
The Rockhampton residential sales market over the September quarter stabilised with sales activity levelling out and other market indicators also settling.
The economic conditions in Rockhampton are challenging with employment opportunities or lack thereof having a significant impact on overall confidence. Youth unemployment is an area of concern with few job prospects available to Rockhampton’s younger residents.
Despite this, the Rockhampton residential market looks to be holding ground with overall sales turnover remaining at a consistent level since the December quarter last year.
Local agents however say vendors are becoming more aware of the current selling conditions and it’s likely the region will see average vendor discounting rates increase over the balance of the year.
On the plus side, Rockhampton’s rental market looks to be steadying with an improvement in the region’s vacancy rate over the three months to September.
HOUSE MARKET
Preliminary house sales numbers over the quarter were down marginally – by five per cent for the quarter – however, agents say the market is showing signs of stability.
Buyer activity is most prominent at the affordable end of the market with first home buyers taking the opportunity to buy with minimal to no competition from investors.
As a result of this shift in activity, the quarterly median house price was down 7.4 per cent compared to the June quarter.
REIQ price point data also confirms this change with sales in the sub-$350,000 and sub-$500,000 price point recording an increase over the quarter. Meanwhile sales activity in the prestige end has halved since the end of June.
House listing numbers have increased over the year and local agents say a number of new investment owned properties have been put on the market after not being able to be tenanted.
UNIT MARKET
Making up a small proportion of Rockhampton’s residential real estate market, units and townhouse sales were up marginally however remain subdued with minimal investor activity.
Over the year to September the median unit sale price eased 2.4 per cent while the new unit developments in Rockhampton have contributed to the strong increase in its annual median sale compared to five years ago.
Listing numbers were up over the year to August, resulting in longer days on market and increase in the region’s average vendor discounting rate.
RENTAL MARKET
At the end of September Rockhampton’s vacancy rate dropped back to the mid-four per cent mark after a spike at the end of June.
A number of properties in Parkhurst and Gracemere are reportedly being pulled from the rental market and listed for sale as investors’ 12 month rental guarantee periods end. Agents say this is likely a contributing factor to the improving vacancy levels.
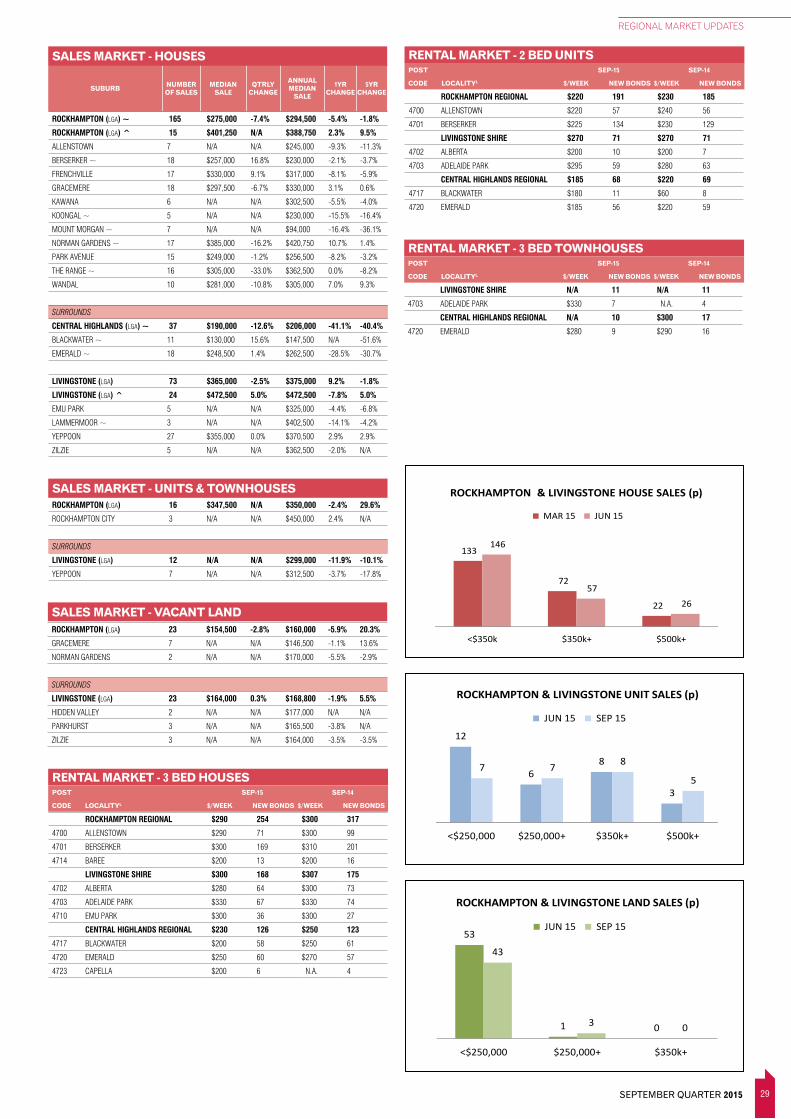
29
REGIONAL MARKET UPDATES
SEPTEMBER QUARTER 2015
HOUSE PRICEPOINTS
1,194 1,412
628
18
1,265 1,508
652
29
<$350k $350k+ $500k+ $1m+
BRISBANE SURROUNDS HOUSE SALES (p)
JUN 15 SEP 15INCLUDES IPSWICH, LOGAN, MORETON BAY & REDLAND
55
557 698
119 44
567
776
139
<$350k $350k+ $500k+ $1m+
GOLD COAST HOUSE SALES (p)
JUN 15 SEP 15
163
43
8
166
42
7
<$350k $350k+ $500k+
BUNDABERG HOUSE SALES (p)
JUN 15 SEP 15
153
213
90
3
160
247
114
4
<$350k $350k+ $500k+ $1m+
CAIRNS & DOUGLAS HOUSE SALES (p)
JUN 15 SEP 15
211
71
14
203
78
13
<$350k $350k+ $500k+
FRASER COAST HOUSE SALES (p)
JUN 15 SEP 15
48 52
14
57
45
8
<$350k $350k+ $500k+
GLADSTONE HOUSE SALES (p)
JUN 15 SEP 15
227
156
46
222
149
50
<$350k $350k+ $500k+
TOWNSVILLE HOUSE SALES (p)
JUN 15 SEP 15
75 63
21
89
69
16
<$350k $350k+ $500k+
MACKAY HOUSE SALES (p)
JUN 15 SEP 15
133
72
22
146
57
26
<$350k $350k+ $500k+
ROCKHAMPTON & LIVINGSTONE HOUSE SALES (p)
MAR 15 JUN 15
114
740
1,997
318 124
755
2,126
333
<$350k $350k+ $500k+ $1m+
BRISBANE CITY HOUSE SALES (p)
JUN 15 SEP 15215
163
56
233 200
59
<$350k $350k+ $500k+
TOOWOOMBA HOUSE SALES (p)
JUN 15 SEP 15
70
431 427
58 92
437 477
42
<$350k $350k+ $500k+ $1m+
SUNSHINE COAST & NOOSA HOUSE SALES (p)
JUN 15 SEP 15
UNIT PRICEPOINTS
79
352
890
490
6181
391
1026
548
75
<$250,000 $250,000+ $350k+ $500k+ $1m+
BRISBANE CITY UNIT SALES (p)
JUN 15 SEP 15
269 286
173
70
7
235 246203
65 4
<$250,000 $250,000+ $350k+ $500k+ $1m+
BRISBANE SURROUNDS UNIT SALES (p)
JUN 15 SEP 15
INCLUDES IPSWICH, LOGAN, MORETON BAY & REDLAND
195
542471
234
33
265
678
555
337
55
<$250,000 $250,000+ $350k+ $500k+ $1m+
GOLD COAST UNIT SALES (p)
JUN 15 SEP 15
74
209 221
127
28
76
220 217
137
22
<$250,000 $250,000+ $350k+ $500k+ $1m+
SUNSHINE COAST & NOOSA UNIT SALES (p)
JUN 15 SEP 15
27
12
62
1315
2 1
<$250,000 $250,000+ $350k+ $500k+
BUNDABERG UNIT SALES (p)
JUN 15 SEP 15
206
5930 27
3
219
6343 34
6
<$250,000 $250,000+ $350k+ $500k+ $1m+
CAIRNS & DOUGLAS UNIT SALES (p)
JUN 15 SEP 15
3228
93
43
15
3 3
<$250,000 $250,000+ $350k+ $500k+
FRASER COAST UNIT SALES (p)
JUN 15 SEP 15
89
3
1
34
3
0
<$250,000 $250,000+ $350k+ $500k+
GLADSTONE UNIT SALES (p)
JUN 15 SEP 15
34
24 21 18
1
48
24
149
2
<$250,000 $250,000+ $350k+ $500k+ $1m+
TOWNSVILLE UNIT SALES (p)
JUN 15 SEP 15
13
7 64
12
7
3
0
<$250,000 $250,000+ $350k+ $500k+
MACKAY UNIT SALES (p)
JUN 15 SEP 15
12
68
3
7 78
5
<$250,000 $250,000+ $350k+ $500k+
ROCKHAMPTON & LIVINGSTONE UNIT SALES (p)
JUN 15 SEP 15
31
44
144
31
60
187
<$250,000 $250,000+ $350k+ $500k+
TOOWOOMBA UNIT SALES (p)
JUN 15 SEP 15
LAND PRICEPOINTS
(p) Preliminary. See explanatory notes for further information. Source: REIQ, data provided by CoreLogic RP Data.
34 38 36 33
20
7058
28
<$250,000 $250,000+ $350k+ $500k+
BRISBANE CITY LAND SALES (p)
JUN 15 SEP 15
449
10044
8
464
10029 3
<$250,000 $250,000+ $350k+ $500k+
BRISBANE SURROUNDS LAND SALES (p)
JUN 15 SEP 15Includes IPSWICH, LOGAN, MORETON BAY & REDLAND
98
38
617
111
36
13 14
<$250,000 $250,000+ $350k+ $500k+
GOLD COAST LAND SALES (p)
JUN 15 SEP 15
70
36
21
7
6155
149
<$250,000 $250,000+ $350k+ $500k+
SUNSHINE COAST & NOOSA LAND SALES (p)
JUN 15 SEP 1581
124
56
115
<$250,000 $250,000+ $350k+
CAIRNS & DOUGLAS LAND SALES (p)
JUN 15 SEP 15
53
5 1
78
1 1
<$250,000 $250,000+ $350k+
FRASER COAST LAND SALES (p)
JUN 15 SEP 15
22
2 1
10
31
<$250,000 $250,000+ $350k+
GLADSTONE LAND SALES (p)
JUN 15 SEP 15
53
1 0
43
3 0
<$250,000 $250,000+ $350k+
ROCKHAMPTON & LIVINGSTONE LAND SALES (p)
JUN 15 SEP 15
46
2 0
54
4 1
<$250,000 $250,000+ $350k+
TOOWOOMBA LAND SALES (p)
JUN 15 SEP 15
46
2 3
72
71
<$250,000 $250,000+ $350k+
TOWNSVILLE LAND SALES (p)
JUN 15 SEP 15
15
4 4
22
30
<$250,000 $250,000+ $350k+
MACKAY LAND SALES (p)
JUN 15 SEP 15
36
1 1
41
0 0
<$250,000 $250,000+ $350k+
BUNDABERG LAND SALES (p)
JUN 15 SEP 15
SALES MARKET - HOUSES
SUBURB NUMBER OF SALES
MEDIAN SALE
QTRLY CHANGE
ANNUAL MEDIAN
SALE
1YR CHANGE
5YR CHANGE
SALES MARKET - VACANT LAND
SALES MARKET - UNITS & TOWNHOUSES
RENTAL MARKET - 3 BED HOUSESPOST SEP-15 SEP-14
CODE LOCALITYL $/WEEK NEW BONDS $/WEEK NEW BONDS
ROCKHAMPTON (LGA) ~ 165 $275,000 -7.4% $294,500 -5.4% -1.8%
ROCKHAMPTON (LGA) ^ 15 $401,250 N/A $388,750 2.3% 9.5%
ALLENSTOWN 7 N/A N/A $245,000 -9.3% -11.3%
BERSERKER ~ 18 $257,000 16.8% $230,000 -2.1% -3.7%
FRENCHVILLE 17 $330,000 9.1% $317,000 -8.1% -5.9%
GRACEMERE 18 $297,500 -6.7% $330,000 3.1% 0.6%
KAWANA 6 N/A N/A $302,500 -5.5% -4.0%
KOONGAL ~ 5 N/A N/A $230,000 -15.5% -16.4%
MOUNT MORGAN ~ 7 N/A N/A $94,000 -16.4% -36.1%
NORMAN GARDENS ~ 17 $385,000 -16.2% $420,750 10.7% 1.4%
PARK AVENUE 15 $249,000 -1.2% $256,500 -8.2% -3.2%
THE RANGE ~ 16 $305,000 -33.0% $362,500 0.0% -8.2%
WANDAL 10 $281,000 -10.8% $305,000 7.0% 9.3%
SURROUNDS
CENTRAL HIGHLANDS (LGA) ~ 37 $190,000 -12.6% $206,000 -41.1% -40.4%
BLACKWATER ~ 11 $130,000 15.6% $147,500 N/A -51.6%
EMERALD ~ 18 $248,500 1.4% $262,500 -28.5% -30.7%
LIVINGSTONE (LGA) 73 $365,000 -2.5% $375,000 9.2% -1.8%
LIVINGSTONE (LGA) ^ 24 $472,500 5.0% $472,500 -7.8% 5.0%
EMU PARK 5 N/A N/A $325,000 -4.4% -6.8%
LAMMERMOOR ~ 3 N/A N/A $402,500 -14.1% -4.2%
YEPPOON 27 $355,000 0.0% $370,500 2.9% 2.9%
ZILZIE 5 N/A N/A $362,500 -2.0% N/A
ROCKHAMPTON (LGA) 16 $347,500 N/A $350,000 -2.4% 29.6%
ROCKHAMPTON CITY 3 N/A N/A $450,000 2.4% N/A
SURROUNDS
LIVINGSTONE (LGA) 12 N/A N/A $299,000 -11.9% -10.1%
YEPPOON 7 N/A N/A $312,500 -3.7% -17.8%
ROCKHAMPTON (LGA) 23 $154,500 -2.8% $160,000 -5.9% 20.3%
GRACEMERE 7 N/A N/A $146,500 -1.1% 13.6%
NORMAN GARDENS 2 N/A N/A $170,000 -5.5% -2.9%
SURROUNDS
LIVINGSTONE (LGA) 23 $164,000 0.3% $168,800 -1.9% 5.5%
HIDDEN VALLEY 2 N/A N/A $177,000 N/A N/A
PARKHURST 3 N/A N/A $165,500 -3.8% N/A
ZILZIE 3 N/A N/A $164,000 -3.5% -3.5%
ROCKHAMPTON REGIONAL $290 254 $300 317
4700 ALLENSTOWN $290 71 $300 99
4701 BERSERKER $300 169 $310 201
4714 BAREE $200 13 $200 16
LIVINGSTONE SHIRE $300 168 $307 175
4702 ALBERTA $280 64 $300 73
4703 ADELAIDE PARK $330 67 $330 74
4710 EMU PARK $300 36 $300 27
CENTRAL HIGHLANDS REGIONAL $230 126 $250 123
4717 BLACKWATER $200 58 $250 61
4720 EMERALD $250 60 $270 57
4723 CAPELLA $200 6 N.A. 4
LIVINGSTONE SHIRE N/A 11 N/A 11
4703 ADELAIDE PARK $330 7 N.A. 4
CENTRAL HIGHLANDS REGIONAL N/A 10 $300 17
4720 EMERALD $280 9 $290 16
RENTAL MARKET - 2 BED UNITSPOST SEP-15 SEP-14
CODE LOCALITYL $/WEEK NEW BONDS $/WEEK NEW BONDS
RENTAL MARKET - 3 BED TOWNHOUSESPOST SEP-15 SEP-14
CODE LOCALITYL $/WEEK NEW BONDS $/WEEK NEW BONDS
ROCKHAMPTON REGIONAL $220 191 $230 185
4700 ALLENSTOWN $220 57 $240 56
4701 BERSERKER $225 134 $230 129
LIVINGSTONE SHIRE $270 71 $270 71
4702 ALBERTA $200 10 $200 7
4703 ADELAIDE PARK $295 59 $280 63
CENTRAL HIGHLANDS REGIONAL $185 68 $220 69
4717 BLACKWATER $180 11 $60 8
4720 EMERALD $185 56 $220 59

30 QUEENSLAND MARKET MONITOR
REGIONAL MARKET UPDATES
MACKAY
HOUSE PRICEPOINTS
1,194 1,412
628
18
1,265 1,508
652
29
<$350k $350k+ $500k+ $1m+
BRISBANE SURROUNDS HOUSE SALES (p)
JUN 15 SEP 15INCLUDES IPSWICH, LOGAN, MORETON BAY & REDLAND
55
557 698
119 44
567
776
139
<$350k $350k+ $500k+ $1m+
GOLD COAST HOUSE SALES (p)
JUN 15 SEP 15
163
43
8
166
42
7
<$350k $350k+ $500k+
BUNDABERG HOUSE SALES (p)
JUN 15 SEP 15
153
213
90
3
160
247
114
4
<$350k $350k+ $500k+ $1m+
CAIRNS & DOUGLAS HOUSE SALES (p)
JUN 15 SEP 15
211
71
14
203
78
13
<$350k $350k+ $500k+
FRASER COAST HOUSE SALES (p)
JUN 15 SEP 15
48 52
14
57
45
8
<$350k $350k+ $500k+
GLADSTONE HOUSE SALES (p)
JUN 15 SEP 15
227
156
46
222
149
50
<$350k $350k+ $500k+
TOWNSVILLE HOUSE SALES (p)
JUN 15 SEP 15
75 63
21
89
69
16
<$350k $350k+ $500k+
MACKAY HOUSE SALES (p)
JUN 15 SEP 15
133
72
22
146
57
26
<$350k $350k+ $500k+
ROCKHAMPTON & LIVINGSTONE HOUSE SALES (p)
MAR 15 JUN 15
114
740
1,997
318 124
755
2,126
333
<$350k $350k+ $500k+ $1m+
BRISBANE CITY HOUSE SALES (p)
JUN 15 SEP 15215
163
56
233 200
59
<$350k $350k+ $500k+
TOOWOOMBA HOUSE SALES (p)
JUN 15 SEP 15
70
431 427
58 92
437 477
42
<$350k $350k+ $500k+ $1m+
SUNSHINE COAST & NOOSA HOUSE SALES (p)
JUN 15 SEP 15
The unpredictable conditions of the Mackay market continued for a third consecutive quarter, creating a challenging environment for owner-occupiers and investors.
Sales turnover has fluctuated between 170 and 200 preliminary house sales per quarter since mid-2014 with other market indicators yet to level off.
Similar to other regions impacted by the mining downturn, property prices have continued to ease with prices returning to 2005 levels.
With softer property prices in play, local owner-occupiers have replaced a significant portion of investors in the market. First home buyers are enjoying the good buying opportunities now available to them.
Neighbouring Isaac Regional Council is similarly struggling to find solid ground and property prices there are also at 2005 levels. However, due to high-yielding properties during the mining boom the region’s median house price has fallen from a much higher peak of $682,000 recorded in the first quarter of 2012 back to the pre-boom median of around $200,000.
Both Mackay and Isaac’s rental markets look to be stabilising with both regions recording steady vacancy rates over the three months to September.
The outlook for the region however is looking promising. The Mackay Airport may be about to commence direct flights to New Zealand. The runway is capable of accommodating such flights, however funding for immigration and customs is required.
The Mackay Regional Council is focused on reinventing the town as a major industrial hub, connected to developments in the Galilee Basin that will directly benefit the region. Manufacturing opportunities and building contracts associated with the railway line from the Basin to the port of Abbot Point are also likely to benefit Mackay.
Local agents are very positive about the next few years and expect the real estate market to turn around in late 2016, early 2017.
HOUSE MARKET
Mackay’s house market stabilised this quarter with preliminary sales numbers increasing by nine per cent.
Average days on market have edged out further to 110 days while average vendor discounting increased 2.4 percentage points to 8.9 per cent over the year to August.
Listing numbers were down four per cent compared to the previous year indicating only vendors who needed to sell were putting their property on the market.
With first home buyers more active, sales activity lifted in the sub-$350,000 price point, which contributed to the 2.8 per cent fall in Mackay’s median house price for the quarter.
UNIT MARKET
Over the September quarter Mackay’s unit and townhouse sales increased at the affordable end of the market.
Units in the sub-$350,000 price points held steady while sales above $350,000 were down. Overall preliminary sales for the region were down a third on the previous quarter.
The June quarter also saw a spike in its median unit sale price – up 12 per cent. With low sales turnover in this segment of the market, changes in the quarterly median sale price are more susceptible to shifts in different qualities of properties sold.
With no new unit developments coming onto the market, the median has come back down to be more reflective of the established unit and townhouse market.
RENTAL MARKET
Mackay’s rental market, surveyed at the end of September, found the region still to be in oversupply; however the overall vacancy rate remained unchanged at 9.1 per cent.
After peaking at 9.8 per cent at the end of last year, this result is an encouraging sign that the region’s rental market is stabilising and confirms the REIQ position that the bottom has been passed.
New residents continue relocate to the region, however some are still leaving in search of work. Local agents expect the vacancy rate to remain where it is for the balance of the year.
Compared to the September quarter last year, the median rent for three bedroom houses eased further, down $50 to $295 per week.
Local agents...expect the Mackay real estate market to start to turn around in late 2016 to early 2017
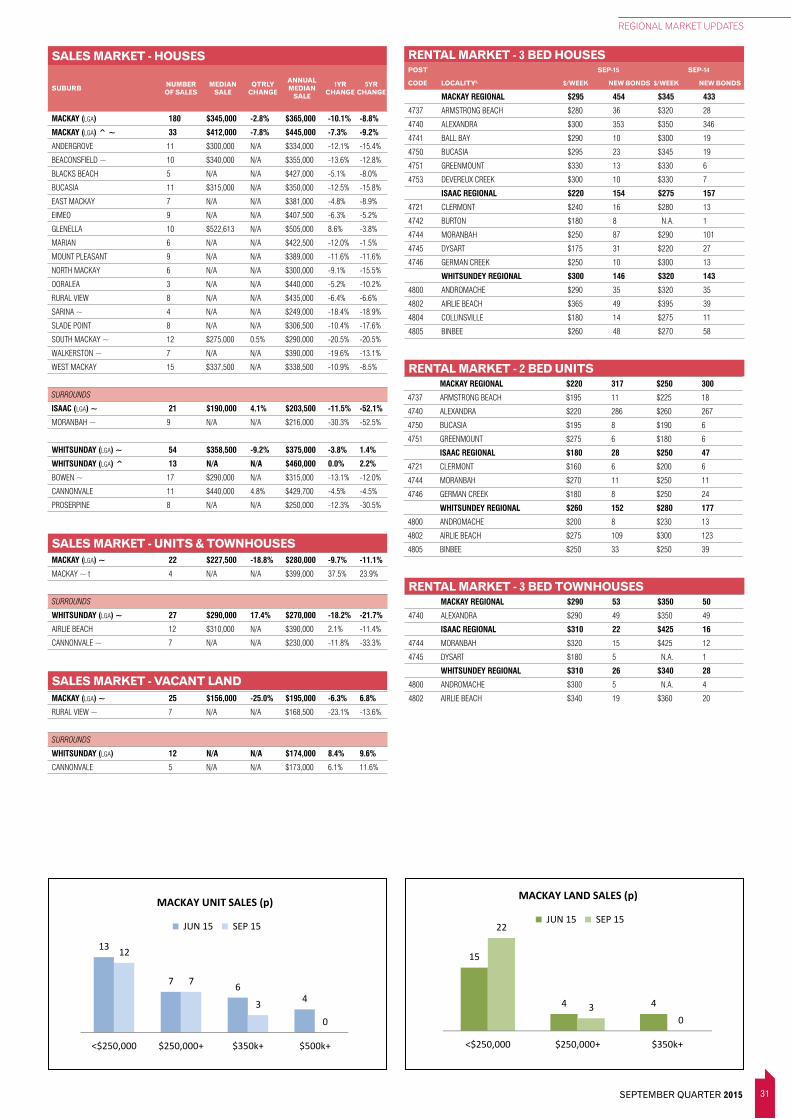
31
REGIONAL MARKET UPDATES
SEPTEMBER QUARTER 2015
MACKAY REGIONAL $295 454 $345 433
4737 ARMSTRONG BEACH $280 36 $320 28
4740 ALEXANDRA $300 353 $350 346
4741 BALL BAY $290 10 $300 19
4750 BUCASIA $295 23 $345 19
4751 GREENMOUNT $330 13 $330 6
4753 DEVEREUX CREEK $300 10 $330 7
ISAAC REGIONAL $220 154 $275 157
4721 CLERMONT $240 16 $280 13
4742 BURTON $180 8 N.A. 1
4744 MORANBAH $250 87 $290 101
4745 DYSART $175 31 $220 27
4746 GERMAN CREEK $250 10 $300 13
WHITSUNDEY REGIONAL $300 146 $320 143
4800 ANDROMACHE $290 35 $320 35
4802 AIRLIE BEACH $365 49 $395 39
4804 COLLINSVILLE $180 14 $275 11
4805 BINBEE $260 48 $270 58
MACKAY (LGA) 180 $345,000 -2.8% $365,000 -10.1% -8.8%
MACKAY (LGA) ^ ~ 33 $412,000 -7.8% $445,000 -7.3% -9.2%
ANDERGROVE 11 $300,000 N/A $334,000 -12.1% -15.4%
BEACONSFIELD ~ 10 $340,000 N/A $355,000 -13.6% -12.8%
BLACKS BEACH 5 N/A N/A $427,000 -5.1% -8.0%
BUCASIA 11 $315,000 N/A $350,000 -12.5% -15.8%
EAST MACKAY 7 N/A N/A $381,000 -4.8% -8.9%
EIMEO 9 N/A N/A $407,500 -6.3% -5.2%
GLENELLA 10 $522,613 N/A $505,000 8.6% -3.8%
MARIAN 6 N/A N/A $422,500 -12.0% -1.5%
MOUNT PLEASANT 9 N/A N/A $389,000 -11.6% -11.6%
NORTH MACKAY 6 N/A N/A $300,000 -9.1% -15.5%
OORALEA 3 N/A N/A $440,000 -5.2% -10.2%
RURAL VIEW 8 N/A N/A $435,000 -6.4% -6.6%
SARINA ~ 4 N/A N/A $249,000 -18.4% -18.9%
SLADE POINT 8 N/A N/A $306,500 -10.4% -17.6%
SOUTH MACKAY ~ 12 $275,000 0.5% $290,000 -20.5% -20.5%
WALKERSTON ~ 7 N/A N/A $390,000 -19.6% -13.1%
WEST MACKAY 15 $337,500 N/A $338,500 -10.9% -8.5%
SURROUNDS
ISAAC (LGA) ~ 21 $190,000 4.1% $203,500 -11.5% -52.1%
MORANBAH ~ 9 N/A N/A $216,000 -30.3% -52.5%
WHITSUNDAY (LGA) ~ 54 $358,500 -9.2% $375,000 -3.8% 1.4%
WHITSUNDAY (LGA) ^ 13 N/A N/A $460,000 0.0% 2.2%
BOWEN ~ 17 $290,000 N/A $315,000 -13.1% -12.0%
CANNONVALE 11 $440,000 4.8% $429,700 -4.5% -4.5%
PROSERPINE 8 N/A N/A $250,000 -12.3% -30.5%
SALES MARKET - HOUSES
SUBURB NUMBER OF SALES
MEDIAN SALE
QTRLY CHANGE
ANNUAL MEDIAN
SALE
1YR CHANGE
5YR CHANGE
SALES MARKET - UNITS & TOWNHOUSES
RENTAL MARKET - 3 BED HOUSESPOST SEP-15 SEP-14
CODE LOCALITYL $/WEEK NEW BONDS $/WEEK NEW BONDS
UNIT PRICEPOINTS
79
352
890
490
6181
391
1026
548
75
<$250,000 $250,000+ $350k+ $500k+ $1m+
BRISBANE CITY UNIT SALES (p)
JUN 15 SEP 15
269 286
173
70
7
235 246203
65 4
<$250,000 $250,000+ $350k+ $500k+ $1m+
BRISBANE SURROUNDS UNIT SALES (p)
JUN 15 SEP 15
INCLUDES IPSWICH, LOGAN, MORETON BAY & REDLAND
195
542471
234
33
265
678
555
337
55
<$250,000 $250,000+ $350k+ $500k+ $1m+
GOLD COAST UNIT SALES (p)
JUN 15 SEP 15
74
209 221
127
28
76
220 217
137
22
<$250,000 $250,000+ $350k+ $500k+ $1m+
SUNSHINE COAST & NOOSA UNIT SALES (p)
JUN 15 SEP 15
27
12
62
1315
2 1
<$250,000 $250,000+ $350k+ $500k+
BUNDABERG UNIT SALES (p)
JUN 15 SEP 15
206
5930 27
3
219
6343 34
6
<$250,000 $250,000+ $350k+ $500k+ $1m+
CAIRNS & DOUGLAS UNIT SALES (p)
JUN 15 SEP 15
3228
93
43
15
3 3
<$250,000 $250,000+ $350k+ $500k+
FRASER COAST UNIT SALES (p)
JUN 15 SEP 15
89
3
1
34
3
0
<$250,000 $250,000+ $350k+ $500k+
GLADSTONE UNIT SALES (p)
JUN 15 SEP 15
34
24 21 18
1
48
24
149
2
<$250,000 $250,000+ $350k+ $500k+ $1m+
TOWNSVILLE UNIT SALES (p)
JUN 15 SEP 15
13
7 64
12
7
3
0
<$250,000 $250,000+ $350k+ $500k+
MACKAY UNIT SALES (p)
JUN 15 SEP 15
12
68
3
7 78
5
<$250,000 $250,000+ $350k+ $500k+
ROCKHAMPTON & LIVINGSTONE UNIT SALES (p)
JUN 15 SEP 15
31
44
144
31
60
187
<$250,000 $250,000+ $350k+ $500k+
TOOWOOMBA UNIT SALES (p)
JUN 15 SEP 15
LAND PRICEPOINTS
(p) Preliminary. See explanatory notes for further information. Source: REIQ, data provided by CoreLogic RP Data.
34 38 36 33
20
7058
28
<$250,000 $250,000+ $350k+ $500k+
BRISBANE CITY LAND SALES (p)
JUN 15 SEP 15
449
10044
8
464
10029 3
<$250,000 $250,000+ $350k+ $500k+
BRISBANE SURROUNDS LAND SALES (p)
JUN 15 SEP 15Includes IPSWICH, LOGAN, MORETON BAY & REDLAND
98
38
617
111
36
13 14
<$250,000 $250,000+ $350k+ $500k+
GOLD COAST LAND SALES (p)
JUN 15 SEP 15
70
36
21
7
6155
149
<$250,000 $250,000+ $350k+ $500k+
SUNSHINE COAST & NOOSA LAND SALES (p)
JUN 15 SEP 1581
124
56
115
<$250,000 $250,000+ $350k+
CAIRNS & DOUGLAS LAND SALES (p)
JUN 15 SEP 15
53
5 1
78
1 1
<$250,000 $250,000+ $350k+
FRASER COAST LAND SALES (p)
JUN 15 SEP 15
22
2 1
10
31
<$250,000 $250,000+ $350k+
GLADSTONE LAND SALES (p)
JUN 15 SEP 15
53
1 0
43
3 0
<$250,000 $250,000+ $350k+
ROCKHAMPTON & LIVINGSTONE LAND SALES (p)
JUN 15 SEP 15
46
2 0
54
4 1
<$250,000 $250,000+ $350k+
TOOWOOMBA LAND SALES (p)
JUN 15 SEP 15
46
2 3
72
71
<$250,000 $250,000+ $350k+
TOWNSVILLE LAND SALES (p)
JUN 15 SEP 15
15
4 4
22
30
<$250,000 $250,000+ $350k+
MACKAY LAND SALES (p)
JUN 15 SEP 15
36
1 1
41
0 0
<$250,000 $250,000+ $350k+
BUNDABERG LAND SALES (p)
JUN 15 SEP 15
RENTAL MARKET - 2 BED UNITS
RENTAL MARKET - 3 BED TOWNHOUSES
SALES MARKET - VACANT LAND
MACKAY (LGA) ~ 22 $227,500 -18.8% $280,000 -9.7% -11.1%
MACKAY ~ t 4 N/A N/A $399,000 37.5% 23.9%
SURROUNDS
WHITSUNDAY (LGA) ~ 27 $290,000 17.4% $270,000 -18.2% -21.7%
AIRLIE BEACH 12 $310,000 N/A $390,000 2.1% -11.4%
CANNONVALE ~ 7 N/A N/A $230,000 -11.8% -33.3%
MACKAY (LGA) ~ 25 $156,000 -25.0% $195,000 -6.3% 6.8%
RURAL VIEW ~ 7 N/A N/A $168,500 -23.1% -13.6%
SURROUNDS
WHITSUNDAY (LGA) 12 N/A N/A $174,000 8.4% 9.6%
CANNONVALE 5 N/A N/A $173,000 6.1% 11.6%
MACKAY REGIONAL $220 317 $250 300
4737 ARMSTRONG BEACH $195 11 $225 18
4740 ALEXANDRA $220 286 $260 267
4750 BUCASIA $195 8 $190 6
4751 GREENMOUNT $275 6 $180 6
ISAAC REGIONAL $180 28 $250 47
4721 CLERMONT $160 6 $200 6
4744 MORANBAH $270 11 $250 11
4746 GERMAN CREEK $180 8 $250 24
WHITSUNDEY REGIONAL $260 152 $280 177
4800 ANDROMACHE $200 8 $230 13
4802 AIRLIE BEACH $275 109 $300 123
4805 BINBEE $250 33 $250 39
MACKAY REGIONAL $290 53 $350 50
4740 ALEXANDRA $290 49 $350 49
ISAAC REGIONAL $310 22 $425 16
4744 MORANBAH $320 15 $425 12
4745 DYSART $180 5 N.A. 1
WHITSUNDEY REGIONAL $310 26 $340 28
4800 ANDROMACHE $300 5 N.A. 4
4802 AIRLIE BEACH $340 19 $360 20
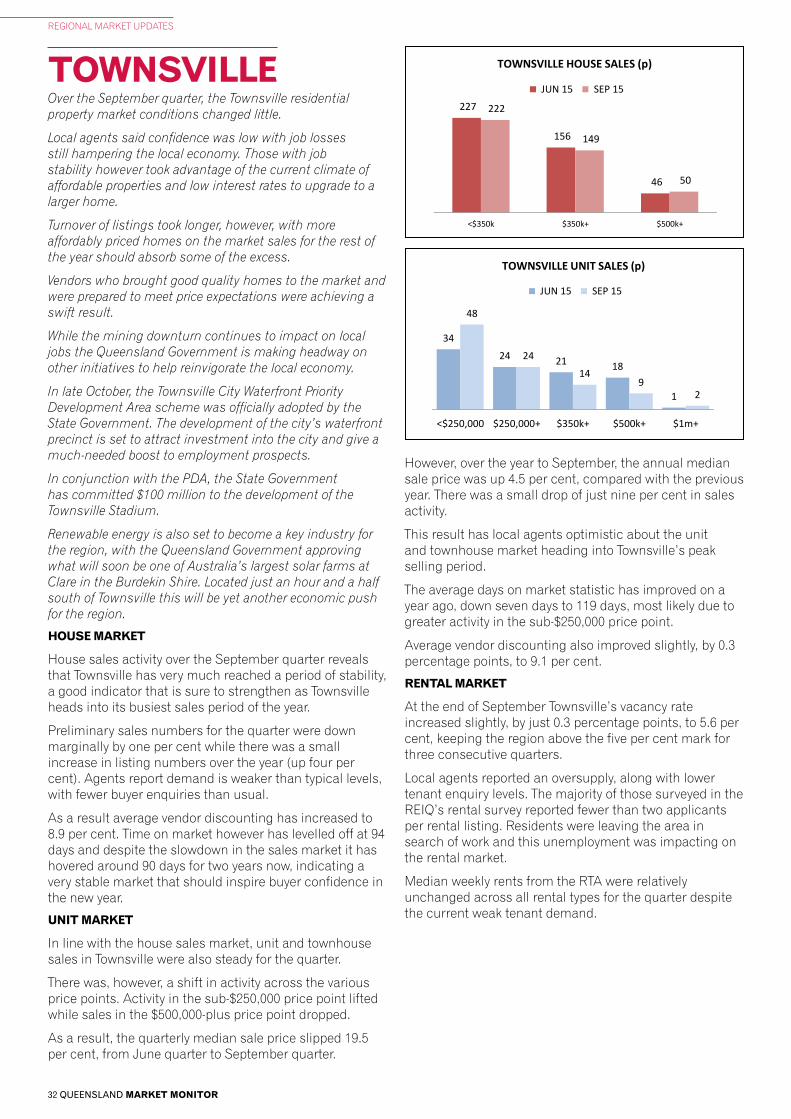
32 QUEENSLAND MARKET MONITOR
REGIONAL MARKET UPDATES
TOWNSVILLE
HOUSE PRICEPOINTS
1,194 1,412
628
18
1,265 1,508
652
29
<$350k $350k+ $500k+ $1m+
BRISBANE SURROUNDS HOUSE SALES (p)
JUN 15 SEP 15INCLUDES IPSWICH, LOGAN, MORETON BAY & REDLAND
55
557 698
119 44
567
776
139
<$350k $350k+ $500k+ $1m+
GOLD COAST HOUSE SALES (p)
JUN 15 SEP 15
163
43
8
166
42
7
<$350k $350k+ $500k+
BUNDABERG HOUSE SALES (p)
JUN 15 SEP 15
153
213
90
3
160
247
114
4
<$350k $350k+ $500k+ $1m+
CAIRNS & DOUGLAS HOUSE SALES (p)
JUN 15 SEP 15
211
71
14
203
78
13
<$350k $350k+ $500k+
FRASER COAST HOUSE SALES (p)
JUN 15 SEP 15
48 52
14
57
45
8
<$350k $350k+ $500k+
GLADSTONE HOUSE SALES (p)
JUN 15 SEP 15
227
156
46
222
149
50
<$350k $350k+ $500k+
TOWNSVILLE HOUSE SALES (p)
JUN 15 SEP 15
75 63
21
89
69
16
<$350k $350k+ $500k+
MACKAY HOUSE SALES (p)
JUN 15 SEP 15
133
72
22
146
57
26
<$350k $350k+ $500k+
ROCKHAMPTON & LIVINGSTONE HOUSE SALES (p)
MAR 15 JUN 15
114
740
1,997
318 124
755
2,126
333
<$350k $350k+ $500k+ $1m+
BRISBANE CITY HOUSE SALES (p)
JUN 15 SEP 15215
163
56
233 200
59
<$350k $350k+ $500k+
TOOWOOMBA HOUSE SALES (p)
JUN 15 SEP 15
70
431 427
58 92
437 477
42
<$350k $350k+ $500k+ $1m+
SUNSHINE COAST & NOOSA HOUSE SALES (p)
JUN 15 SEP 15
UNIT PRICEPOINTS
79
352
890
490
6181
391
1026
548
75
<$250,000 $250,000+ $350k+ $500k+ $1m+
BRISBANE CITY UNIT SALES (p)
JUN 15 SEP 15
269 286
173
70
7
235 246203
65 4
<$250,000 $250,000+ $350k+ $500k+ $1m+
BRISBANE SURROUNDS UNIT SALES (p)
JUN 15 SEP 15
INCLUDES IPSWICH, LOGAN, MORETON BAY & REDLAND
195
542471
234
33
265
678
555
337
55
<$250,000 $250,000+ $350k+ $500k+ $1m+
GOLD COAST UNIT SALES (p)
JUN 15 SEP 15
74
209 221
127
28
76
220 217
137
22
<$250,000 $250,000+ $350k+ $500k+ $1m+
SUNSHINE COAST & NOOSA UNIT SALES (p)
JUN 15 SEP 15
27
12
62
1315
2 1
<$250,000 $250,000+ $350k+ $500k+
BUNDABERG UNIT SALES (p)
JUN 15 SEP 15
206
5930 27
3
219
6343 34
6
<$250,000 $250,000+ $350k+ $500k+ $1m+
CAIRNS & DOUGLAS UNIT SALES (p)
JUN 15 SEP 15
3228
93
43
15
3 3
<$250,000 $250,000+ $350k+ $500k+
FRASER COAST UNIT SALES (p)
JUN 15 SEP 15
89
3
1
34
3
0
<$250,000 $250,000+ $350k+ $500k+
GLADSTONE UNIT SALES (p)
JUN 15 SEP 15
34
24 21 18
1
48
24
149
2
<$250,000 $250,000+ $350k+ $500k+ $1m+
TOWNSVILLE UNIT SALES (p)
JUN 15 SEP 15
13
7 64
12
7
3
0
<$250,000 $250,000+ $350k+ $500k+
MACKAY UNIT SALES (p)
JUN 15 SEP 15
12
68
3
7 78
5
<$250,000 $250,000+ $350k+ $500k+
ROCKHAMPTON & LIVINGSTONE UNIT SALES (p)
JUN 15 SEP 15
31
44
144
31
60
187
<$250,000 $250,000+ $350k+ $500k+
TOOWOOMBA UNIT SALES (p)
JUN 15 SEP 15
Over the September quarter, the Townsville residential property market conditions changed little.
Local agents said confidence was low with job losses still hampering the local economy. Those with job stability however took advantage of the current climate of affordable properties and low interest rates to upgrade to a larger home.
Turnover of listings took longer, however, with more affordably priced homes on the market sales for the rest of the year should absorb some of the excess.
Vendors who brought good quality homes to the market and were prepared to meet price expectations were achieving a swift result.
While the mining downturn continues to impact on local jobs the Queensland Government is making headway on other initiatives to help reinvigorate the local economy.
In late October, the Townsville City Waterfront Priority Development Area scheme was officially adopted by the State Government. The development of the city’s waterfront precinct is set to attract investment into the city and give a much-needed boost to employment prospects.
In conjunction with the PDA, the State Government has committed $100 million to the development of the Townsville Stadium.
Renewable energy is also set to become a key industry for the region, with the Queensland Government approving what will soon be one of Australia’s largest solar farms at Clare in the Burdekin Shire. Located just an hour and a half south of Townsville this will be yet another economic push for the region.
HOUSE MARKET
House sales activity over the September quarter reveals that Townsville has very much reached a period of stability, a good indicator that is sure to strengthen as Townsville heads into its busiest sales period of the year.
Preliminary sales numbers for the quarter were down marginally by one per cent while there was a small increase in listing numbers over the year (up four per cent). Agents report demand is weaker than typical levels, with fewer buyer enquiries than usual.
As a result average vendor discounting has increased to 8.9 per cent. Time on market however has levelled off at 94 days and despite the slowdown in the sales market it has hovered around 90 days for two years now, indicating a very stable market that should inspire buyer confidence in the new year.
UNIT MARKET
In line with the house sales market, unit and townhouse sales in Townsville were also steady for the quarter.
There was, however, a shift in activity across the various price points. Activity in the sub-$250,000 price point lifted while sales in the $500,000-plus price point dropped.
As a result, the quarterly median sale price slipped 19.5 per cent, from June quarter to September quarter.
However, over the year to September, the annual median sale price was up 4.5 per cent, compared with the previous year. There was a small drop of just nine per cent in sales activity.
This result has local agents optimistic about the unit and townhouse market heading into Townsville’s peak selling period.
The average days on market statistic has improved on a year ago, down seven days to 119 days, most likely due to greater activity in the sub-$250,000 price point.
Average vendor discounting also improved slightly, by 0.3 percentage points, to 9.1 per cent.
RENTAL MARKET
At the end of September Townsville’s vacancy rate increased slightly, by just 0.3 percentage points, to 5.6 per cent, keeping the region above the five per cent mark for three consecutive quarters.
Local agents reported an oversupply, along with lower tenant enquiry levels. The majority of those surveyed in the REIQ’s rental survey reported fewer than two applicants per rental listing. Residents were leaving the area in search of work and this unemployment was impacting on the rental market.
Median weekly rents from the RTA were relatively unchanged across all rental types for the quarter despite the current weak tenant demand.

33
REGIONAL MARKET UPDATES
SEPTEMBER QUARTER 2015
LAND PRICEPOINTS
(p) Preliminary. See explanatory notes for further information. Source: REIQ, data provided by CoreLogic RP Data.
34 38 36 33
20
7058
28
<$250,000 $250,000+ $350k+ $500k+
BRISBANE CITY LAND SALES (p)
JUN 15 SEP 15
449
10044
8
464
10029 3
<$250,000 $250,000+ $350k+ $500k+
BRISBANE SURROUNDS LAND SALES (p)
JUN 15 SEP 15Includes IPSWICH, LOGAN, MORETON BAY & REDLAND
98
38
617
111
36
13 14
<$250,000 $250,000+ $350k+ $500k+
GOLD COAST LAND SALES (p)
JUN 15 SEP 15
70
36
21
7
6155
149
<$250,000 $250,000+ $350k+ $500k+
SUNSHINE COAST & NOOSA LAND SALES (p)
JUN 15 SEP 1581
124
56
115
<$250,000 $250,000+ $350k+
CAIRNS & DOUGLAS LAND SALES (p)
JUN 15 SEP 15
53
5 1
78
1 1
<$250,000 $250,000+ $350k+
FRASER COAST LAND SALES (p)
JUN 15 SEP 15
22
2 1
10
31
<$250,000 $250,000+ $350k+
GLADSTONE LAND SALES (p)
JUN 15 SEP 15
53
1 0
43
3 0
<$250,000 $250,000+ $350k+
ROCKHAMPTON & LIVINGSTONE LAND SALES (p)
JUN 15 SEP 15
46
2 0
54
4 1
<$250,000 $250,000+ $350k+
TOOWOOMBA LAND SALES (p)
JUN 15 SEP 15
46
2 3
72
71
<$250,000 $250,000+ $350k+
TOWNSVILLE LAND SALES (p)
JUN 15 SEP 15
15
4 4
22
30
<$250,000 $250,000+ $350k+
MACKAY LAND SALES (p)
JUN 15 SEP 15
36
1 1
41
0 0
<$250,000 $250,000+ $350k+
BUNDABERG LAND SALES (p)
JUN 15 SEP 15
TOWNSVILLE (LGA) 80 $150,000 -8.5% $159,000 -2.5% -3.5%
TOWNSVILLE (LGA) ^ 13 N/A N/A $191,250 -1.9% -9.6%
BOHLE PLAINS 2 N/A N/A $167,500 4.7% -4.3%
BURDELL 3 N/A N/A $160,000 2.0% -6.0%
BUSHLAND BEACH 7 N/A N/A $140,000 -8.5% -7.9%
KELSO 4 N/A N/A $135,000 -2.9% -8.8%
MOUNT LOUISA 3 N/A N/A $179,500 -0.3% 6.8%
MOUNT LOW 3 N/A N/A $156,000 -4.3% -1.9%
OONOONBA - N/A N/A $179,000 13.7% N/A
SHAW 4 N/A N/A $156,500 N/A N/A
TOWNSVILLE (LGA) 446 $342,000 0.3% $348,000 -2.7% -7.4%
TOWNSVILLE (LGA) ^ 48 $431,000 -0.9% $435,000 1.2% 0.2%
AITKENVALE 5 N/A N/A $305,500 0.2% -13.1%
ALICE RIVER ^ 3 N/A N/A $512,000 10.1% 3.4%
ANNANDALE 27 $410,000 -1.2% $415,000 -3.5% -13.5%
BOHLE PLAINS 5 N/A N/A $415,000 -3.5% -7.8%
BURDELL 12 $398,000 3.4% $407,500 -6.3% -0.1%
BUSHLAND BEACH 21 $415,000 9.2% $400,000 -4.0% -4.8%
CONDON 11 $320,000 11.5% $285,000 -2.4% -15.2%
COSGROVE 2 N/A N/A $373,784 -9.9% N/A
CRANBROOK 13 $290,000 0.0% $287,500 -0.9% -13.1%
CURRAJONG 12 $310,000 6.2% $292,000 -3.5% -9.7%
DEERAGUN 4 N/A N/A $325,000 2.4% -7.4%
DOUGLAS 19 $383,500 -1.7% $388,500 -2.1% -9.1%
GULLIVER 7 N/A N/A $278,000 -7.5% -3.8%
HEATLEY 6 N/A N/A $255,000 -12.1% -17.1%
HERMIT PARK 14 $357,500 N/A $354,750 -6.6% -6.6%
HYDE PARK 3 N/A N/A $330,000 N/A -12.6%
IDALIA 14 $515,000 -7.2% $525,000 7.1% 7.1%
KELSO ~ 21 $220,000 -21.4% $280,000 -0.7% -10.8%
KIRWAN 57 $332,500 -0.3% $340,000 -2.9% -10.5%
MOUNT LOUISA 18 $415,000 11.6% $370,000 -3.9% -7.5%
MUNDINGBURRA 5 N/A N/A $362,500 -4.0% -3.3%
NORTH WARD ~ 5 N/A N/A $635,000 23.3% 14.4%
OONOONBA 4 N/A N/A $285,000 N/A N/A
RAILWAY ESTATE 7 N/A N/A $345,000 7.8% -5.5%
RANGEWOOD ^ 3 N/A N/A $476,000 N/A N/A
RASMUSSEN 19 $365,000 N/A $304,500 9.5% 2.0%
SOUTH TOWNSVILLE 7 N/A N/A $355,000 3.6% -6.6%
THURINGOWA CENTRAL 9 N/A N/A $300,000 -4.6% -11.8%
VINCENT 8 N/A N/A $260,000 N/A -9.4%
WEST END 11 $298,250 N/A $337,000 -5.7% -11.3%
WULGURU 8 N/A N/A $295,000 0.3% -9.2%
SURROUNDS
BURDEKIN (LGA) ~ 39 $180,000 12.5% $185,000 -12.9% -26.0%
AYR ~ 21 $205,000 10.8% $195,000 -20.4% -22.8%
CHARTERS TOWERS (LGA) ~ 22 $167,000 -4.6% $175,500 -13.3% -14.4%
CHARTERS TOWERS CITY ~ 5 N/A N/A $150,000 -16.2% -20.0%
HINCHINBROOK (LGA) 16 $230,000 N/A $220,000 -8.3% -17.0%
INGHAM ~ 3 N/A N/A $206,000 -15.9% -14.2%
SALES MARKET - HOUSES
SUBURB NUMBER OF SALES
MEDIAN SALE
QTRLY CHANGE
ANNUAL MEDIAN
SALE
1YR CHANGE
5YR CHANGE
SALES MARKET - VACANT LAND
SUBURB NUMBER OF SALES
MEDIAN SALE
QTRLY CHANGE
ANNUAL MEDIAN
SALE
1YR CHANGE
5YR CHANGE
SALES MARKET - UNITS & TOWNHOUSES
RENTAL MARKET - 3 BED HOUSESPOST SEP-15 SEP-14
CODE LOCALITYL $/WEEK NEW BONDS $/WEEK NEW BONDS
RENTAL MARKET - 2 BED UNITS
RENTAL MARKET - 2 BED TOWNHOUSES
TOWNSVILLE (LGA) ~ 100 $250,000 -19.5% $284,310 4.5% -13.8%
BELGIAN GARDENS 2 N/A N/A $330,000 N/A N/A
DOUGLAS - N/A N/A $330,000 13.8% 5.8%
NORTH WARD ~ 19 $350,000 0.0% $330,000 30.0% -9.3%
PIMLICO 1 N/A N/A $257,500 N/A N/A
SOUTH TOWNSVILLE * 5 N/A N/A $518,615 42.1% 8.6%
TOWNSVILLE CITY ~ 8 N/A N/A $392,500 3.8% -20.0%
WEST END ~ 7 N/A N/A $215,000 -4.4% -25.9%
TOWNSVILLE CITY $305 771 $320 683
4810 BELGIAN GARDENS $340 64 $350 64
4811 IDALIA $328 43 $340 30
4812 CURRAJONG $310 52 $320 64
4814 AITKENVALE $305 202 $320 176
4815 CONDON $290 123 $300 118
4816 ALLIGATOR CREEK $285 14 $250 12
4817 KIRWAN $325 134 $330 94
4818 DEERAGUN $300 117 $310 105
4819 MAGNETIC IS $280 22 $300 20
BURDEKIN SHIRE $265 59 $270 52
4806 ARKENDEITH $250 8 $260 12
4807 AIRVILLE $265 45 $270 37
4808 BRANDON $240 5 N.A. 3
CHARTERS TOWERS REGIONAL $230 44 $250 40
4820 RICHMOND HILL $230 44 $250 40
HINCHINBROOK SHIRE $250 25 $250 32
4850 ABERGOWRIE $250 25 $250 32
TOWNSVILLE CITY $255 713 $265 739
4810 BELGIAN GARDENS $280 335 $285 354
4811 IDALIA $300 48 $350 45
4812 CURRAJONG $230 176 $245 164
4814 AITKENVALE $250 76 $270 83
4815 CONDON $250 17 $270 25
4817 KIRWAN $245 37 $260 36
4818 DEERAGUN $225 9 $224 16
4819 MAGNETIC IS $290 15 $320 16
BURDEKIN SHIRE $210 61 $210 51
4806 ARKENDEITH $190 6 $200 7
4807 AIRVILLE $215 52 $210 42
CHARTERS TOWERS REGIONAL N/A 9 N/A 7
4820 RICHMOND HILL $200 9 $180 7
HINCHINBROOK SHIRE $160 19 $200 18
4850 ABERGOWRIE $160 19 $200 18
TOWNSVILLE CITY $260 51 $260 67
4810 BELGIAN GARDENS $280 24 $260 27
4812 CURRAJONG $250 25 $260 30
...the Queensland government is making headway on other initiatives to help reinvigorate the local economy
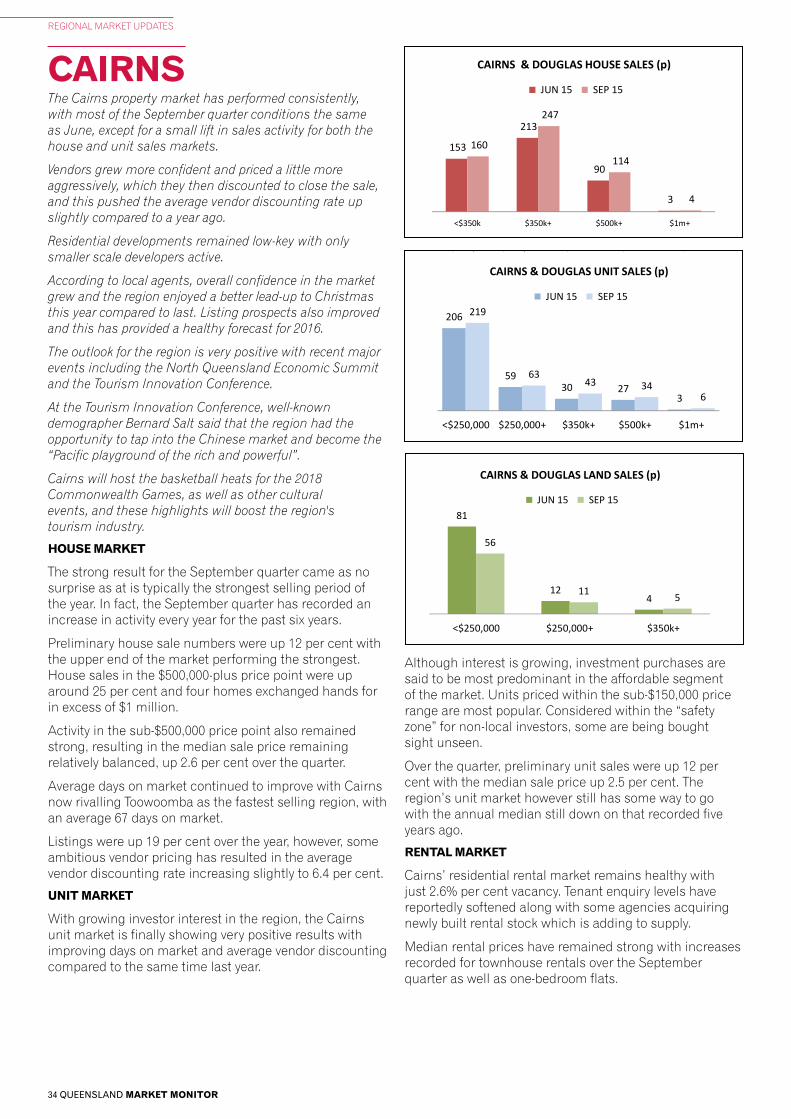
34 QUEENSLAND MARKET MONITOR
REGIONAL MARKET UPDATES
CAIRNS
HOUSE PRICEPOINTS
1,194 1,412
628
18
1,265 1,508
652
29
<$350k $350k+ $500k+ $1m+
BRISBANE SURROUNDS HOUSE SALES (p)
JUN 15 SEP 15INCLUDES IPSWICH, LOGAN, MORETON BAY & REDLAND
55
557 698
119 44
567
776
139
<$350k $350k+ $500k+ $1m+
GOLD COAST HOUSE SALES (p)
JUN 15 SEP 15
163
43
8
166
42
7
<$350k $350k+ $500k+
BUNDABERG HOUSE SALES (p)
JUN 15 SEP 15
153
213
90
3
160
247
114
4
<$350k $350k+ $500k+ $1m+
CAIRNS & DOUGLAS HOUSE SALES (p)
JUN 15 SEP 15
211
71
14
203
78
13
<$350k $350k+ $500k+
FRASER COAST HOUSE SALES (p)
JUN 15 SEP 15
48 52
14
57
45
8
<$350k $350k+ $500k+
GLADSTONE HOUSE SALES (p)
JUN 15 SEP 15
227
156
46
222
149
50
<$350k $350k+ $500k+
TOWNSVILLE HOUSE SALES (p)
JUN 15 SEP 15
75 63
21
89
69
16
<$350k $350k+ $500k+
MACKAY HOUSE SALES (p)
JUN 15 SEP 15
133
72
22
146
57
26
<$350k $350k+ $500k+
ROCKHAMPTON & LIVINGSTONE HOUSE SALES (p)
MAR 15 JUN 15
114
740
1,997
318 124
755
2,126
333
<$350k $350k+ $500k+ $1m+
BRISBANE CITY HOUSE SALES (p)
JUN 15 SEP 15215
163
56
233 200
59
<$350k $350k+ $500k+
TOOWOOMBA HOUSE SALES (p)
JUN 15 SEP 15
70
431 427
58 92
437 477
42
<$350k $350k+ $500k+ $1m+
SUNSHINE COAST & NOOSA HOUSE SALES (p)
JUN 15 SEP 15
UNIT PRICEPOINTS
79
352
890
490
6181
391
1026
548
75
<$250,000 $250,000+ $350k+ $500k+ $1m+
BRISBANE CITY UNIT SALES (p)
JUN 15 SEP 15
269 286
173
70
7
235 246203
65 4
<$250,000 $250,000+ $350k+ $500k+ $1m+
BRISBANE SURROUNDS UNIT SALES (p)
JUN 15 SEP 15
INCLUDES IPSWICH, LOGAN, MORETON BAY & REDLAND
195
542471
234
33
265
678
555
337
55
<$250,000 $250,000+ $350k+ $500k+ $1m+
GOLD COAST UNIT SALES (p)
JUN 15 SEP 15
74
209 221
127
28
76
220 217
137
22
<$250,000 $250,000+ $350k+ $500k+ $1m+
SUNSHINE COAST & NOOSA UNIT SALES (p)
JUN 15 SEP 15
27
12
62
1315
2 1
<$250,000 $250,000+ $350k+ $500k+
BUNDABERG UNIT SALES (p)
JUN 15 SEP 15
206
5930 27
3
219
6343 34
6
<$250,000 $250,000+ $350k+ $500k+ $1m+
CAIRNS & DOUGLAS UNIT SALES (p)
JUN 15 SEP 15
3228
93
43
15
3 3
<$250,000 $250,000+ $350k+ $500k+
FRASER COAST UNIT SALES (p)
JUN 15 SEP 15
89
3
1
34
3
0
<$250,000 $250,000+ $350k+ $500k+
GLADSTONE UNIT SALES (p)
JUN 15 SEP 15
34
24 21 18
1
48
24
149
2
<$250,000 $250,000+ $350k+ $500k+ $1m+
TOWNSVILLE UNIT SALES (p)
JUN 15 SEP 15
13
7 64
12
7
3
0
<$250,000 $250,000+ $350k+ $500k+
MACKAY UNIT SALES (p)
JUN 15 SEP 15
12
68
3
7 78
5
<$250,000 $250,000+ $350k+ $500k+
ROCKHAMPTON & LIVINGSTONE UNIT SALES (p)
JUN 15 SEP 15
31
44
144
31
60
187
<$250,000 $250,000+ $350k+ $500k+
TOOWOOMBA UNIT SALES (p)
JUN 15 SEP 15
LAND PRICEPOINTS
(p) Preliminary. See explanatory notes for further information. Source: REIQ, data provided by CoreLogic RP Data.
34 38 36 33
20
7058
28
<$250,000 $250,000+ $350k+ $500k+
BRISBANE CITY LAND SALES (p)
JUN 15 SEP 15
449
10044
8
464
10029 3
<$250,000 $250,000+ $350k+ $500k+
BRISBANE SURROUNDS LAND SALES (p)
JUN 15 SEP 15Includes IPSWICH, LOGAN, MORETON BAY & REDLAND
98
38
617
111
36
13 14
<$250,000 $250,000+ $350k+ $500k+
GOLD COAST LAND SALES (p)
JUN 15 SEP 15
70
36
21
7
6155
149
<$250,000 $250,000+ $350k+ $500k+
SUNSHINE COAST & NOOSA LAND SALES (p)
JUN 15 SEP 1581
124
56
115
<$250,000 $250,000+ $350k+
CAIRNS & DOUGLAS LAND SALES (p)
JUN 15 SEP 15
53
5 1
78
1 1
<$250,000 $250,000+ $350k+
FRASER COAST LAND SALES (p)
JUN 15 SEP 15
22
2 1
10
31
<$250,000 $250,000+ $350k+
GLADSTONE LAND SALES (p)
JUN 15 SEP 15
53
1 0
43
3 0
<$250,000 $250,000+ $350k+
ROCKHAMPTON & LIVINGSTONE LAND SALES (p)
JUN 15 SEP 15
46
2 0
54
4 1
<$250,000 $250,000+ $350k+
TOOWOOMBA LAND SALES (p)
JUN 15 SEP 15
46
2 3
72
71
<$250,000 $250,000+ $350k+
TOWNSVILLE LAND SALES (p)
JUN 15 SEP 15
15
4 4
22
30
<$250,000 $250,000+ $350k+
MACKAY LAND SALES (p)
JUN 15 SEP 15
36
1 1
41
0 0
<$250,000 $250,000+ $350k+
BUNDABERG LAND SALES (p)
JUN 15 SEP 15
The Cairns property market has performed consistently, with most of the September quarter conditions the same as June, except for a small lift in sales activity for both the house and unit sales markets.
Vendors grew more confident and priced a little more aggressively, which they then discounted to close the sale, and this pushed the average vendor discounting rate up slightly compared to a year ago.
Residential developments remained low-key with only smaller scale developers active.
According to local agents, overall confidence in the market grew and the region enjoyed a better lead-up to Christmas this year compared to last. Listing prospects also improved and this has provided a healthy forecast for 2016.
The outlook for the region is very positive with recent major events including the North Queensland Economic Summit and the Tourism Innovation Conference.
At the Tourism Innovation Conference, well-known demographer Bernard Salt said that the region had the opportunity to tap into the Chinese market and become the “Pacific playground of the rich and powerful”.
Cairns will host the basketball heats for the 2018 Commonwealth Games, as well as other cultural events, and these highlights will boost the region's tourism industry.
HOUSE MARKET
The strong result for the September quarter came as no surprise as at is typically the strongest selling period of the year. In fact, the September quarter has recorded an increase in activity every year for the past six years.
Preliminary house sale numbers were up 12 per cent with the upper end of the market performing the strongest. House sales in the $500,000-plus price point were up around 25 per cent and four homes exchanged hands for in excess of $1 million.
Activity in the sub-$500,000 price point also remained strong, resulting in the median sale price remaining relatively balanced, up 2.6 per cent over the quarter.
Average days on market continued to improve with Cairns now rivalling Toowoomba as the fastest selling region, with an average 67 days on market.
Listings were up 19 per cent over the year, however, some ambitious vendor pricing has resulted in the average vendor discounting rate increasing slightly to 6.4 per cent.
UNIT MARKET
With growing investor interest in the region, the Cairns unit market is finally showing very positive results with improving days on market and average vendor discounting compared to the same time last year.
Although interest is growing, investment purchases are said to be most predominant in the affordable segment of the market. Units priced within the sub-$150,000 price range are most popular. Considered within the “safety zone” for non-local investors, some are being bought sight unseen.
Over the quarter, preliminary unit sales were up 12 per cent with the median sale price up 2.5 per cent. The region’s unit market however still has some way to go with the annual median still down on that recorded five years ago.
RENTAL MARKET
Cairns’ residential rental market remains healthy with just 2.6% per cent vacancy. Tenant enquiry levels have reportedly softened along with some agencies acquiring newly built rental stock which is adding to supply.
Median rental prices have remained strong with increases recorded for townhouse rentals over the September quarter as well as one-bedroom flats.

35
REGIONAL MARKET UPDATES
SEPTEMBER QUARTER 2015
CAIRNS (LGA) 307 $225,000 2.5% $223,000 3.7% -17.6%
BUNGALOW ~ 7 N/A N/A $129,000 -16.8% -25.6%
CAIRNS CITY ~ f 36 $370,000 25.4% $350,000 7.7% -16.7%
CAIRNS NORTH ~ 42 $230,000 -0.6% $230,000 1.8% -28.1%
EARLVILLE ~ 4 N/A N/A $212,500 1.2% -20.6%
EDGE HILL ~ 6 N/A N/A $202,500 22.7% -9.0%
EDMONTON ~ t 3 N/A N/A $185,000 31.2% N/A
FRESHWATER 10 $325,500 N/A $265,000 -5.4% N/A
MANOORA ~ 16 $177,040 8.0% $155,000 10.7% -21.3%
MANUNDA ~ 22 $133,500 -13.6% $150,000 -1.2% -25.0%
MOOROOBOOL ~ 7 N/A N/A $221,500 20.5% 6.7%
PALM COVE ~ 12 $225,000 2.3% $247,500 -10.3% -29.8%
PARRAMATTA PARK ~ 10 $286,000 30.0% $240,750 -0.8% -5.6%
TRINITY BEACH ~ 29 $275,000 14.6% $243,500 -0.2% -18.4%
WESTCOURT ~ 7 N/A N/A $222,000 3.3% -30.8%
WOREE ~ 18 $135,000 N/A $129,500 17.7% -20.3%
YORKEYS KNOB 7 N/A N/A $210,000 -8.7% -16.2%
CAIRNS (LGA) 505 $400,000 2.6% $397,000 5.6% 7.3%
CAIRNS (LGA) ^ ~ 43 $635,000 27.0% $572,250 -0.7% -7.7%
BAYVIEW HEIGHTS 11 $370,000 -10.4% $385,000 1.0% 8.2%
BENTLEY PARK 38 $366,000 12.6% $352,500 2.2% 2.5%
BRINSMEAD 27 $454,500 9.5% $435,000 5.3% 7.4%
BUNGALOW 3 N/A N/A $330,000 -4.3% 3.1%
CARAVONICA 8 N/A N/A $386,500 9.6% 12.2%
CLIFTON BEACH 9 N/A N/A $528,500 5.3% 7.9%
EARLVILLE 12 $395,000 12.9% $350,000 2.9% 14.7%
EDGE HILL 12 $469,500 -0.3% $480,000 3.2% 4.3%
EDMONTON 24 $330,000 4.8% $335,000 1.5% 0.0%
FRESHWATER ~ 14 $522,500 N/A $515,000 21.9% 8.4%
GOLDSBOROUGH ^ 5 N/A N/A $460,000 N/A N/A
GORDONVALE 20 $310,000 -1.5% $308,000 -0.6% 1.0%
GORDONVALE ^ 8 N/A N/A $587,500 N/A N/A
HOLLOWAYS BEACH 10 $406,000 N/A $400,000 3.9% 16.3%
KANIMBLA 6 N/A N/A $521,500 15.9% 12.9%
KEWARRA BEACH ~ 18 $470,000 19.0% $433,000 4.1% 6.3%
MANOORA 14 $335,000 N/A $307,000 14.1% 2.3%
MANUNDA 5 N/A N/A $340,000 7.9% 11.5%
MOOROOBOOL 19 $347,500 10.0% $376,000 13.9% 2.5%
MOUNT SHERIDAN ~ 31 $420,000 20.3% $369,500 7.1% 5.6%
PALM COVE ~ 11 $657,500 N/A $650,000 N/A 39.0%
PARRAMATTA PARK 5 N/A N/A $387,500 3.3% 1.3%
REDLYNCH 23 $502,500 11.7% $459,500 4.4% 6.9%
SMITHFIELD 23 $412,000 0.5% $415,000 5.1% 12.8%
TRINITY BEACH ~ 21 $465,000 -25.0% $478,000 6.8% 24.2%
TRINITY PARK 19 $440,000 1.7% $435,000 4.2% 15.4%
WESTCOURT 5 N/A N/A $350,000 9.4% 5.9%
WHITE ROCK 11 $312,500 -2.3% $310,000 6.9% 8.8%
WHITFIELD 9 N/A N/A $511,000 -2.2% 15.5%
WOREE 6 N/A N/A $351,000 13.2% 3.2%
SURROUNDS
CASSOWARY COAST (LGA) 25 $220,000 -3.1% $243,500 1.5% -9.8%
CASSOWARY COAST (LGA) ^ 13 N/A N/A $337,500 3.1% -0.4%
DOUGLAS (LGA) ~ 38 $457,500 12.8% $425,000 13.3% 9.0%
PORT DOUGLAS 12 $518,000 N/A $530,000 10.4% 3.9%
MAREEBA (LGA) 29 $250,000 0.4% $267,500 -4.5% -6.1%
MAREEBA (LGA) ^ ~ 27 $477,500 19.5% $445,000 6.0% 4.0%
KURANDA ^ 9 N/A N/A $445,000 3.5% -5.5%
MAREEBA 17 $255,000 2.0% $275,000 -1.8% -3.5%
TABLELANDS (LGA) ~ 40 $322,000 4.5% $303,750 4.7% 3.0%
TABLELANDS (LGA) ^ ~ 16 $467,500 6.7% $400,000 3.9% 0.0%
ATHERTON ~ 19 $359,000 15.8% $310,000 0.0% -3.1%
TOLG A ^ 5 N/A N/A $410,000 N/A N/A
SALES MARKET - HOUSES
SUBURB NUMBER OF SALES
MEDIAN SALE
QTRLY CHANGE
ANNUAL MEDIAN
SALE
1YR CHANGE
5YR CHANGE
SALES MARKET - UNITS & TOWNHOUSES (CONT’D)
SUBURB NUMBER OF SALES
MEDIAN SALE
QTRLY CHANGE
ANNUAL MEDIAN
SALE
1YR CHANGE
5YR CHANGE
SALES MARKET - UNITS & TOWNHOUSES
SALES MARKET - VACANT LAND
SURROUNDS
DOUGLAS (LGA) ~ 68 $195,000 -9.5% $227,500 -2.4% -13.7%
PORT DOUGLAS ~ 55 $195,000 -8.8% $215,000 -5.6% -18.9%
ATHERTON 4 N/A N/A $205,500 N/A N/A
CAIRNS (LGA) ~ 68 $192,500 -3.5% $212,000 15.5% 24.7%
EDMONTON 5 N/A N/A $144,650 6.6% N/A
GORDONVALE 8 N/A N/A $139,250 N/A 14.3%
KANIMBLA - N/A N/A $250,000 N/A N/A
KEWARRA BEACH 3 N/A N/A $248,000 N/A N/A
REDLYNCH ~ * 6 N/A N/A $237,500 29.4% 35.7%
SMITHFIELD ~ 15 $215,000 7.8% $200,000 11.9% 7.8%
TRINITY PARK * 2 N/A N/A $227,500 5.8% 33.8%
SURROUNDS
CASSOWARY COAST (LGA) 9 N/A N/A $82,000 -18.0% -43.4%
MISSION BEACH 5 N/A N/A $50,000 -9.1% N/A
DOUGLAS (LGA) 4 N/A N/A $130,750 0.2% N/A
MAREEBA (LGA) 8 N/A N/A $95,000 6.1% -3.1%
MAREEBA 7 N/A N/A $95,000 5.6% -4.0%
CAIRNS REGIONAL $360 466 $350 460
4861 BABINDA $320 5 N.A. 4
4865 GOLDSBOROUGH $300 10 $310 23
4868 BAYVIEW HEIGHTS $350 88 $340 81
4869 BENTLEY PARK $340 77 $325 69
4870 AEROGLEN $375 164 $350 160
4878 BARRON $385 50 $370 42
4879 BUCHAN POINT $380 72 $375 81
DOUGLAS SHIRE $360 25 $330 40
4873 BAILEY CREEK $330 16 $320 28
4877 CRAIGLIE $450 9 $420 12
CASSOWARY COAST REGIONAL $280 98 $280 102
4849 CARDWELL $250 8 $250 6
4852 BINGIL BAY $340 23 $350 20
4854 BILYANA $255 9 $305 13
4860 BAMBOO CREEK $270 49 $275 53
TABLELANDS REGIONAL $290 80 $290 90
4872 BARRINE $320 5 $250 5
4882 TOLGA $300 7 N.A. 3
4883 ATHERTON $300 31 $295 40
4884 LAKE BARRINE $295 12 $300 10
4885 BUTCHERS CREEK $295 6 $270 12
4887 HERBERTON $280 10 $295 5
4888 EVELYN $280 9 $250 14
MAREEBA SHIRE $335 52 $310 54
4880 ARRIGA $320 39 $300 43
4881 KOAH $380 13 $360 11
RENTAL MARKET - 3 BED HOUSESPOST SEP-15 SEP-14
CODE LOCALITYL $/WEEK NEW BONDS $/WEEK NEW BONDS
The Cairns unit market is finally recording very positive results
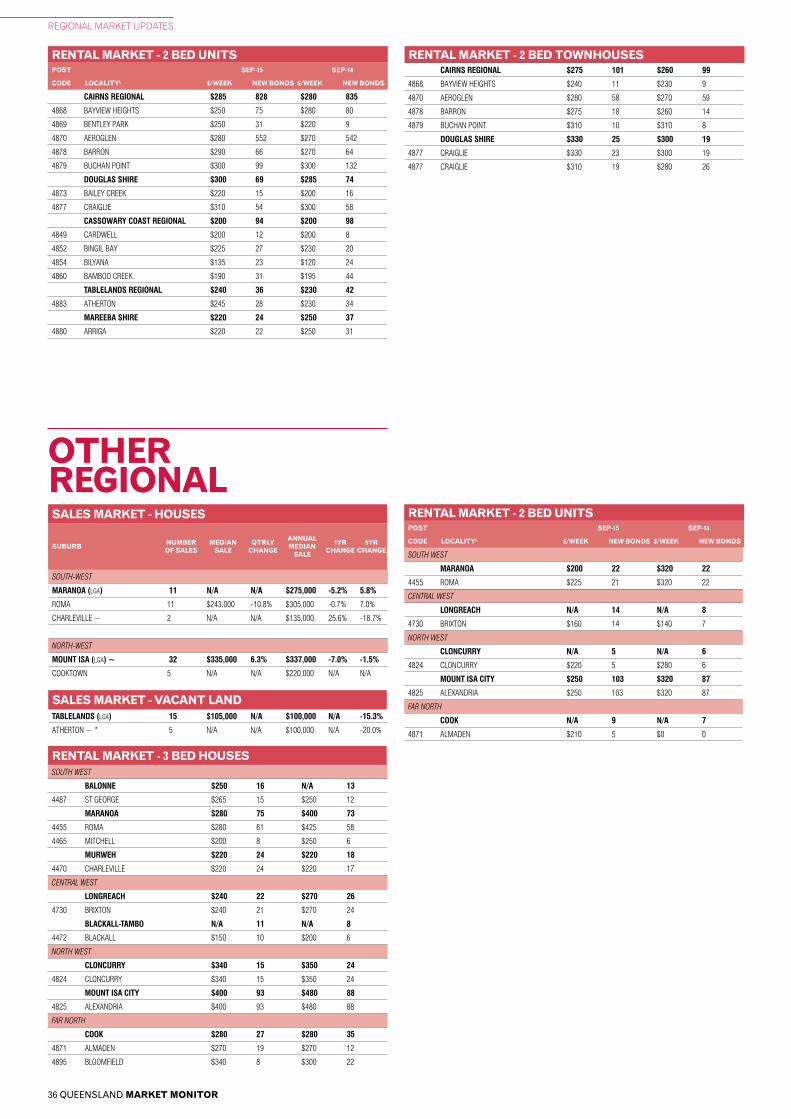
36 QUEENSLAND MARKET MONITOR
REGIONAL MARKET UPDATES
CAIRNS REGIONAL $285 828 $280 835
4868 BAYVIEW HEIGHTS $250 75 $280 80
4869 BENTLEY PARK $250 31 $220 9
4870 AEROGLEN $280 552 $270 542
4878 BARRON $290 66 $270 64
4879 BUCHAN POINT $300 99 $300 132
DOUGLAS SHIRE $300 69 $285 74
4873 BAILEY CREEK $220 15 $200 16
4877 CRAIGLIE $310 54 $300 58
CASSOWARY COAST REGIONAL $200 94 $200 98
4849 CARDWELL $200 12 $200 8
4852 BINGIL BAY $225 27 $230 20
4854 BILYANA $135 23 $120 24
4860 BAMBOO CREEK $190 31 $195 44
TABLELANDS REGIONAL $240 36 $230 42
4883 ATHERTON $245 28 $230 34
MAREEBA SHIRE $220 24 $250 37
4880 ARRIGA $220 22 $250 31
OTHER REGIONAL
SALES MARKET - VACANT LAND
SALES MARKET - HOUSES
SUBURB NUMBER OF SALES
MEDIAN SALE
QTRLY CHANGE
ANNUAL MEDIAN
SALE
1YR CHANGE
5YR CHANGE
RENTAL MARKET - 2 BED UNITSPOST SEP-15 SEP-14
CODE LOCALITYL $/WEEK NEW BONDS $/WEEK NEW BONDS
RENTAL MARKET - 2 BED TOWNHOUSES
SOUTH-WEST
MARANOA (LGA) 11 N/A N/A $275,000 -5.2% 5.8%
ROMA 11 $243,000 -10.8% $305,000 -0.7% 7.0%
CHARLEVILLE ~ 2 N/A N/A $135,000 25.6% -18.7%
NORTH-WEST
MOUNT ISA (LGA) ~ 32 $335,000 6.3% $337,000 -7.0% -1.5%
COOKTOWN 5 N/A N/A $220,000 N/A N/A
TABLELANDS (LGA) 15 $105,000 N/A $100,000 N/A -15.3%
ATHERTON ~ * 5 N/A N/A $100,000 N/A -20.0%
SOUTH WEST
BALONNE $250 16 N/A 13
4487 ST GEORGE $265 15 $250 12
MARANOA $280 75 $400 73
4455 ROMA $280 61 $425 58
4465 MITCHELL $200 8 $250 6
MURWEH $220 24 $220 18
4470 CHARLEVILLE $220 24 $220 17
CENTRAL WEST
LONGREACH $240 22 $270 26
4730 BRIXTON $240 21 $270 24
BLACKALL-TAMBO N/A 11 N/A 8
4472 BLACKALL $150 10 $200 6
NORTH WEST
CLONCURRY $340 15 $350 24
4824 CLONCURRY $340 15 $350 24
MOUNT ISA CITY $400 93 $480 88
4825 ALEXANDRIA $400 93 $480 88
FAR NORTH
COOK $280 27 $280 35
4871 ALMADEN $270 19 $270 12
4895 BLOOMFIELD $340 8 $300 22
RENTAL MARKET - 3 BED HOUSES
SOUTH WEST
MARANOA $200 22 $320 22
4455 ROMA $225 21 $320 22
CENTRAL WEST
LONGREACH N/A 14 N/A 8
4730 BRIXTON $160 14 $140 7
NORTH WEST
CLONCURRY N/A 5 N/A 6
4824 CLONCURRY $220 5 $280 6
MOUNT ISA CITY $250 103 $320 87
4825 ALEXANDRIA $250 103 $320 87
FAR NORTH
COOK N/A 9 N/A 7
4871 ALMADEN $210 5 $0 0
CAIRNS REGIONAL $275 101 $260 99
4868 BAYVIEW HEIGHTS $240 11 $230 9
4870 AEROGLEN $280 58 $270 59
4878 BARRON $275 18 $260 14
4879 BUCHAN POINT $310 10 $310 8
DOUGLAS SHIRE $330 25 $300 19
4877 CRAIGLIE $330 23 $300 19
4877 CRAIGLIE $310 19 $280 26
RENTAL MARKET - 2 BED UNITSPOST SEP-15 SEP-14
CODE LOCALITYL $/WEEK NEW BONDS $/WEEK NEW BONDS
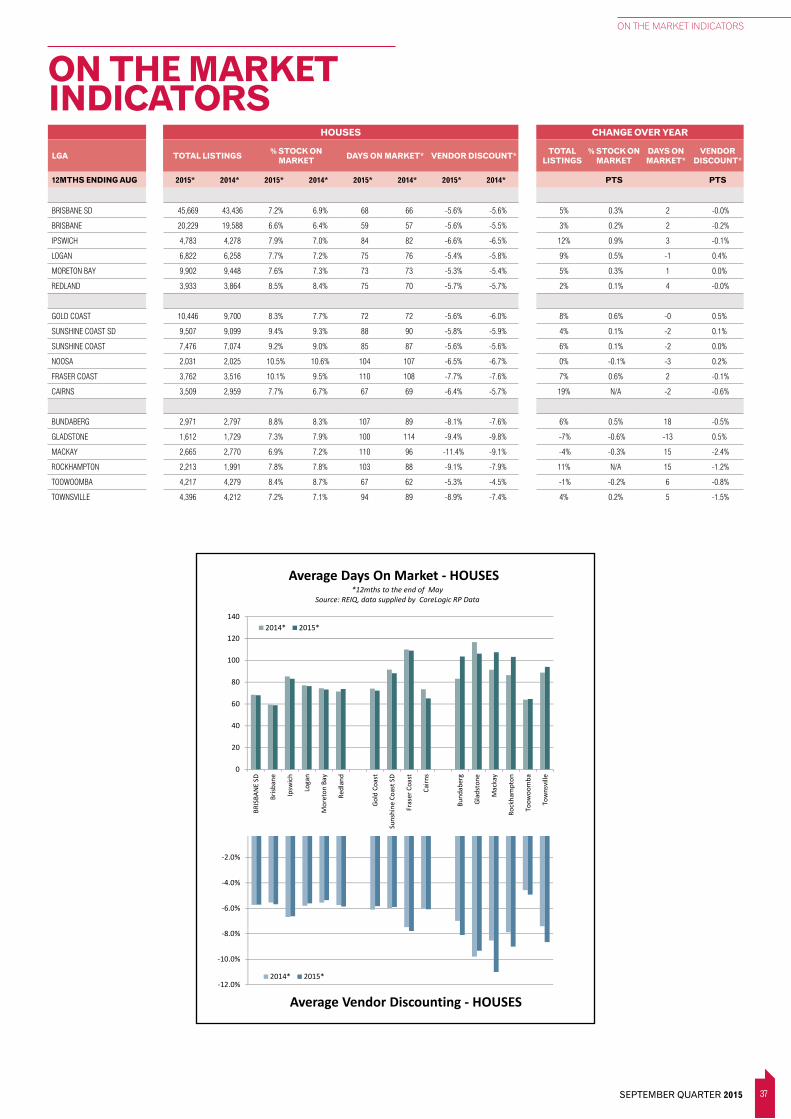
37 SEPTEMBER QUARTER 2015
ON THE MARKET INDICATORS
QMM DATA OTM_12mthsMay15
0
20
40
60
80
100
120
140
160
BRIS
BAN
E SD
Bris
bane
Ipsw
ich
Loga
n
Mor
eton
Bay
Redl
and
Gol
d Co
ast
Suns
hine
Coa
st S
D
Cair
ns
Fras
er C
oast
Bund
aber
g
Gla
dsto
ne
Mac
kay
Rock
ham
pton
Toow
oom
ba
Tow
nsvi
lle
Average Days On Market - UNITS
2014* 2015*
*12mths to the end of MaySource: REIQ, data supplied by CoreLogic RP Data
-12.0%
-10.0%
-8.0%
-6.0%
-4.0%
-2.0%
0.0%
Average Vendor Discounting - HOUSES
2014* 2015*
0
20
40
60
80
100
120
140
BRIS
BAN
E SD
Bris
bane
Ipsw
ich
Loga
n
Mor
eton
Bay
Redl
and
Gol
d Co
ast
Suns
hine
Coa
st S
D
Fras
er C
oast
Cair
ns
Bund
aber
g
Gla
dsto
ne
Mac
kay
Rock
ham
pton
Toow
oom
ba
Tow
nsvi
lle
Average Days On Market - HOUSES
2014* 2015*
*12mths to the end of MaySource: REIQ, data supplied by CoreLogic RP Data
-14.0%
-12.0%
-10.0%
-8.0%
-6.0%
-4.0%
-2.0%
0.0%
Average Vendor Discounting - UNITS
2014* 2015*
ON THE MARKET INDICATORS
HOUSES CHANGE OVER YEAR
LGA TOTAL LISTINGS % STOCK ON MARKET DAYS ON MARKET* VENDOR DISCOUNT* TOTAL
LISTINGS% STOCK ON
MARKETDAYS ON MARKET*
VENDOR DISCOUNT*
12MTHS ENDING AUG 2015* 2014* 2015* 2014* 2015* 2014* 2015* 2014* PTS PTS
BRISBANE SD 45,669 43,436 7.2% 6.9% 68 66 -5.6% -5.6% 5% 0.3% 2 -0.0%
BRISBANE 20,229 19,588 6.6% 6.4% 59 57 -5.6% -5.5% 3% 0.2% 2 -0.2%
IPSWICH 4,783 4,278 7.9% 7.0% 84 82 -6.6% -6.5% 12% 0.9% 3 -0.1%
LOGAN 6,822 6,258 7.7% 7.2% 75 76 -5.4% -5.8% 9% 0.5% -1 0.4%
MORETON BAY 9,902 9,448 7.6% 7.3% 73 73 -5.3% -5.4% 5% 0.3% 1 0.0%
REDLAND 3,933 3,864 8.5% 8.4% 75 70 -5.7% -5.7% 2% 0.1% 4 -0.0%
GOLD COAST 10,446 9,700 8.3% 7.7% 72 72 -5.6% -6.0% 8% 0.6% -0 0.5%
SUNSHINE COAST SD 9,507 9,099 9.4% 9.3% 88 90 -5.8% -5.9% 4% 0.1% -2 0.1%
SUNSHINE COAST 7,476 7,074 9.2% 9.0% 85 87 -5.6% -5.6% 6% 0.1% -2 0.0%
NOOSA 2,031 2,025 10.5% 10.6% 104 107 -6.5% -6.7% 0% -0.1% -3 0.2%
FRASER COAST 3,762 3,516 10.1% 9.5% 110 108 -7.7% -7.6% 7% 0.6% 2 -0.1%
CAIRNS 3,509 2,959 7.7% 6.7% 67 69 -6.4% -5.7% 19% N/A -2 -0.6%
BUNDABERG 2,971 2,797 8.8% 8.3% 107 89 -8.1% -7.6% 6% 0.5% 18 -0.5%
GLADSTONE 1,612 1,729 7.3% 7.9% 100 114 -9.4% -9.8% -7% -0.6% -13 0.5%
MACKAY 2,665 2,770 6.9% 7.2% 110 96 -11.4% -9.1% -4% -0.3% 15 -2.4%
ROCKHAMPTON 2,213 1,991 7.8% 7.8% 103 88 -9.1% -7.9% 11% N/A 15 -1.2%
TOOWOOMBA 4,217 4,279 8.4% 8.7% 67 62 -5.3% -4.5% -1% -0.2% 6 -0.8%
TOWNSVILLE 4,396 4,212 7.2% 7.1% 94 89 -8.9% -7.4% 4% 0.2% 5 -1.5%
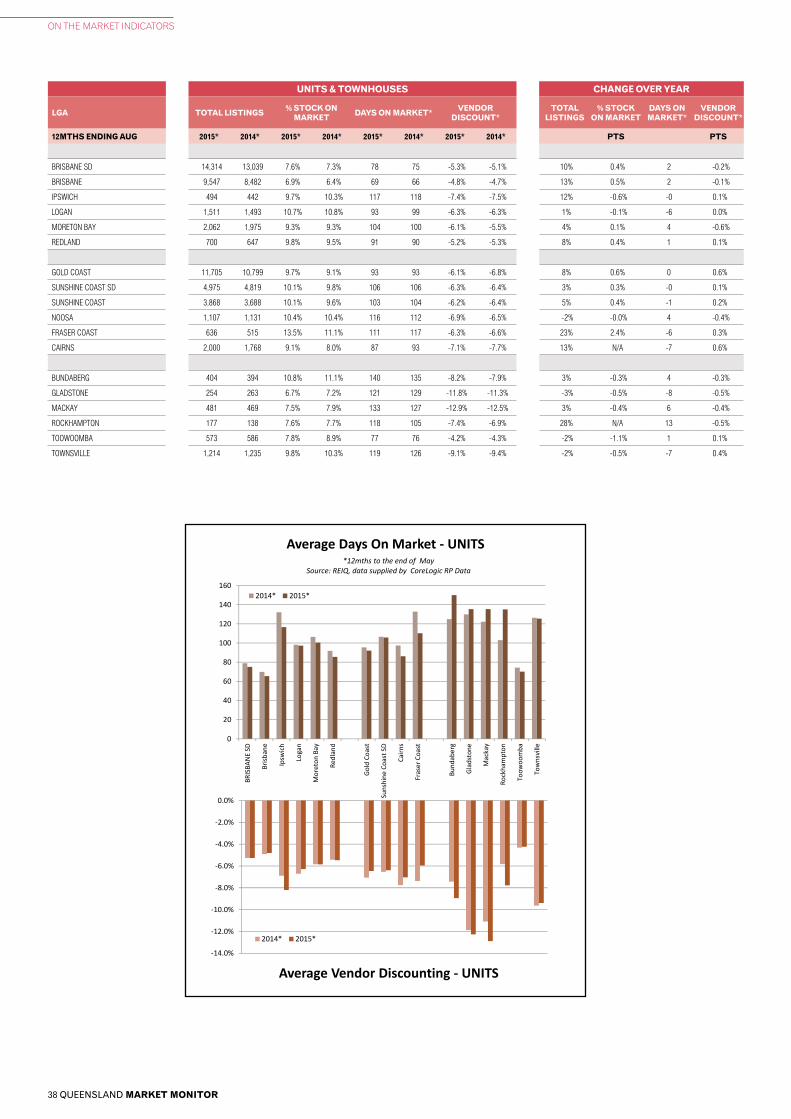
38 QUEENSLAND MARKET MONITOR
ON THE MARKET INDICATORS
UNITS & TOWNHOUSES CHANGE OVER YEAR
LGA TOTAL LISTINGS % STOCK ON MARKET DAYS ON MARKET* VENDOR
DISCOUNT*TOTAL
LISTINGS% STOCK
ON MARKETDAYS ON MARKET*
VENDOR DISCOUNT*
12MTHS ENDING AUG 2015* 2014* 2015* 2014* 2015* 2014* 2015* 2014* PTS PTS
BRISBANE SD 14,314 13,039 7.6% 7.3% 78 75 -5.3% -5.1% 10% 0.4% 2 -0.2%
BRISBANE 9,547 8,482 6.9% 6.4% 69 66 -4.8% -4.7% 13% 0.5% 2 -0.1%
IPSWICH 494 442 9.7% 10.3% 117 118 -7.4% -7.5% 12% -0.6% -0 0.1%
LOGAN 1,511 1,493 10.7% 10.8% 93 99 -6.3% -6.3% 1% -0.1% -6 0.0%
MORETON BAY 2,062 1,975 9.3% 9.3% 104 100 -6.1% -5.5% 4% 0.1% 4 -0.6%
REDLAND 700 647 9.8% 9.5% 91 90 -5.2% -5.3% 8% 0.4% 1 0.1%
GOLD COAST 11,705 10,799 9.7% 9.1% 93 93 -6.1% -6.8% 8% 0.6% 0 0.6%
SUNSHINE COAST SD 4,975 4,819 10.1% 9.8% 106 106 -6.3% -6.4% 3% 0.3% -0 0.1%
SUNSHINE COAST 3,868 3,688 10.1% 9.6% 103 104 -6.2% -6.4% 5% 0.4% -1 0.2%
NOOSA 1,107 1,131 10.4% 10.4% 116 112 -6.9% -6.5% -2% -0.0% 4 -0.4%
FRASER COAST 636 515 13.5% 11.1% 111 117 -6.3% -6.6% 23% 2.4% -6 0.3%
CAIRNS 2,000 1,768 9.1% 8.0% 87 93 -7.1% -7.7% 13% N/A -7 0.6%
BUNDABERG 404 394 10.8% 11.1% 140 135 -8.2% -7.9% 3% -0.3% 4 -0.3%
GLADSTONE 254 263 6.7% 7.2% 121 129 -11.8% -11.3% -3% -0.5% -8 -0.5%
MACKAY 481 469 7.5% 7.9% 133 127 -12.9% -12.5% 3% -0.4% 6 -0.4%
ROCKHAMPTON 177 138 7.6% 7.7% 118 105 -7.4% -6.9% 28% N/A 13 -0.5%
TOOWOOMBA 573 586 7.8% 8.9% 77 76 -4.2% -4.3% -2% -1.1% 1 0.1%
TOWNSVILLE 1,214 1,235 9.8% 10.3% 119 126 -9.1% -9.4% -2% -0.5% -7 0.4%
QMM DATA OTM_12mthsMay15
0
20
40
60
80
100
120
140
160
BRIS
BAN
E SD
Bris
bane
Ipsw
ich
Loga
n
Mor
eton
Bay
Redl
and
Gol
d Co
ast
Suns
hine
Coa
st S
D
Cair
ns
Fras
er C
oast
Bund
aber
g
Gla
dsto
ne
Mac
kay
Rock
ham
pton
Toow
oom
ba
Tow
nsvi
lle
Average Days On Market - UNITS
2014* 2015*
*12mths to the end of MaySource: REIQ, data supplied by CoreLogic RP Data
-12.0%
-10.0%
-8.0%
-6.0%
-4.0%
-2.0%
0.0%
Average Vendor Discounting - HOUSES
2014* 2015*
0
20
40
60
80
100
120
140
BRIS
BAN
E SD
Bris
bane
Ipsw
ich
Loga
n
Mor
eton
Bay
Redl
and
Gol
d Co
ast
Suns
hine
Coa
st S
D
Fras
er C
oast
Cair
ns
Bund
aber
g
Gla
dsto
ne
Mac
kay
Rock
ham
pton
Toow
oom
ba
Tow
nsvi
lle
Average Days On Market - HOUSES
2014* 2015*
*12mths to the end of MaySource: REIQ, data supplied by CoreLogic RP Data
-14.0%
-12.0%
-10.0%
-8.0%
-6.0%
-4.0%
-2.0%
0.0%
Average Vendor Discounting - UNITS
2014* 2015*
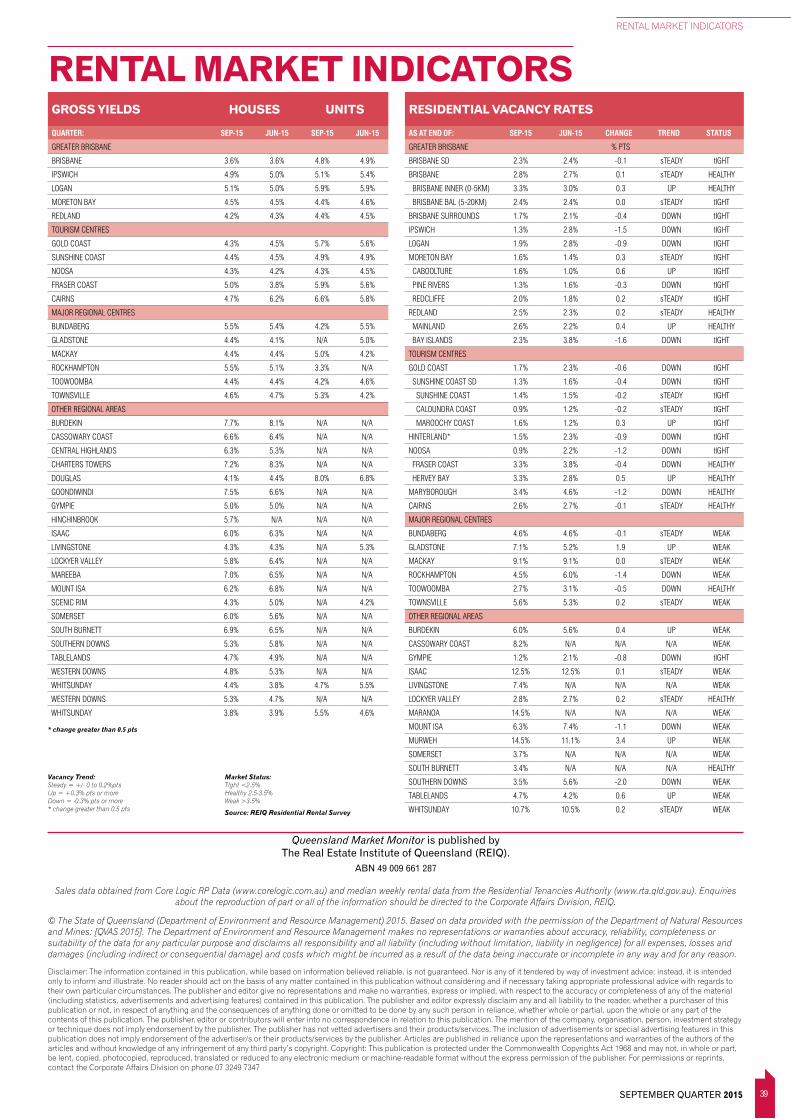
39 SEPTEMBER QUARTER 2015
RENTAL MARKET INDICATORS
RENTAL MARKET INDICATORSRESIDENTIAL VACANCY RATES
AS AT END OF: SEP-15 JUN-15 CHANGE TREND STATUS
GREATER BRISBANE % PTS
BRISBANE SD 2.3% 2.4% -0.1 sTEADY tIGHT
BRISBANE 2.8% 2.7% 0.1 sTEADY HEALTHY
BRISBANE INNER (0-5KM) 3.3% 3.0% 0.3 UP HEALTHY
BRISBANE BAL (5-20KM) 2.4% 2.4% 0.0 sTEADY tIGHT
BRISBANE SURROUNDS 1.7% 2.1% -0.4 DOWN tIGHT
IPSWICH 1.3% 2.8% -1.5 DOWN tIGHT
LOGAN 1.9% 2.8% -0.9 DOWN tIGHT
MORETON BAY 1.6% 1.4% 0.3 sTEADY tIGHT
CABOOLTURE 1.6% 1.0% 0.6 UP tIGHT
PINE RIVERS 1.3% 1.6% -0.3 DOWN tIGHT
REDCLIFFE 2.0% 1.8% 0.2 sTEADY tIGHT
REDLAND 2.5% 2.3% 0.2 sTEADY HEALTHY
MAINLAND 2.6% 2.2% 0.4 UP HEALTHY
BAY ISLANDS 2.3% 3.8% -1.6 DOWN tIGHT
TOURISM CENTRES
GOLD COAST 1.7% 2.3% -0.6 DOWN tIGHT
SUNSHINE COAST SD 1.3% 1.6% -0.4 DOWN tIGHT
SUNSHINE COAST 1.4% 1.5% -0.2 sTEADY tIGHT
CALOUNDRA COAST 0.9% 1.2% -0.2 sTEADY tIGHT
MAROOCHY COAST 1.6% 1.2% 0.3 UP tIGHT
HINTERLAND* 1.5% 2.3% -0.9 DOWN tIGHT
NOOSA 0.9% 2.2% -1.2 DOWN tIGHT
FRASER COAST 3.3% 3.8% -0.4 DOWN HEALTHY
HERVEY BAY 3.3% 2.8% 0.5 UP HEALTHY
MARYBOROUGH 3.4% 4.6% -1.2 DOWN HEALTHY
CAIRNS 2.6% 2.7% -0.1 sTEADY HEALTHY
MAJOR REGIONAL CENTRES
BUNDABERG 4.6% 4.6% -0.1 sTEADY WEAK
GLADSTONE 7.1% 5.2% 1.9 UP WEAK
MACKAY 9.1% 9.1% 0.0 sTEADY WEAK
ROCKHAMPTON 4.5% 6.0% -1.4 DOWN WEAK
TOOWOOMBA 2.7% 3.1% -0.5 DOWN HEALTHY
TOWNSVILLE 5.6% 5.3% 0.2 sTEADY WEAK
OTHER REGIONAL AREAS
BURDEKIN 6.0% 5.6% 0.4 UP WEAK
CASSOWARY COAST 8.2% N/A N/A N/A WEAK
GYMPIE 1.2% 2.1% -0.8 DOWN tIGHT
ISAAC 12.5% 12.5% 0.1 sTEADY WEAK
LIVINGSTONE 7.4% N/A N/A N/A WEAK
LOCKYER VALLEY 2.8% 2.7% 0.2 sTEADY HEALTHY
MARANOA 14.5% N/A N/A N/A WEAK
MOUNT ISA 6.3% 7.4% -1.1 DOWN WEAK
MURWEH 14.5% 11.1% 3.4 UP WEAK
SOMERSET 3.7% N/A N/A N/A WEAK
SOUTH BURNETT 3.4% N/A N/A N/A HEALTHY
SOUTHERN DOWNS 3.5% 5.6% -2.0 DOWN WEAK
TABLELANDS 4.7% 4.2% 0.6 UP WEAK
WHITSUNDAY 10.7% 10.5% 0.2 sTEADY WEAK
GROSS YIELDS HOUSES UNITS
QUARTER: SEP-15 JUN-15 SEP-15 JUN-15
GREATER BRISBANE
BRISBANE 3.6% 3.6% 4.8% 4.9%
IPSWICH 4.9% 5.0% 5.1% 5.4%
LOGAN 5.1% 5.0% 5.9% 5.9%
MORETON BAY 4.5% 4.5% 4.4% 4.6%
REDLAND 4.2% 4.3% 4.4% 4.5%
TOURISM CENTRES
GOLD COAST 4.3% 4.5% 5.7% 5.6%
SUNSHINE COAST 4.4% 4.5% 4.9% 4.9%
NOOSA 4.3% 4.2% 4.3% 4.5%
FRASER COAST 5.0% 3.8% 5.9% 5.6%
CAIRNS 4.7% 6.2% 6.6% 5.8%
MAJOR REGIONAL CENTRES
BUNDABERG 5.5% 5.4% 4.2% 5.5%
GLADSTONE 4.4% 4.1% N/A 5.0%
MACKAY 4.4% 4.4% 5.0% 4.2%
ROCKHAMPTON 5.5% 5.1% 3.3% N/A
TOOWOOMBA 4.4% 4.4% 4.2% 4.6%
TOWNSVILLE 4.6% 4.7% 5.3% 4.2%
OTHER REGIONAL AREAS
BURDEKIN 7.7% 8.1% N/A N/A
CASSOWARY COAST 6.6% 6.4% N/A N/A
CENTRAL HIGHLANDS 6.3% 5.3% N/A N/A
CHARTERS TOWERS 7.2% 8.3% N/A N/A
DOUGLAS 4.1% 4.4% 8.0% 6.8%
GOONDIWINDI 7.5% 6.6% N/A N/A
GYMPIE 5.0% 5.0% N/A N/A
HINCHINBROOK 5.7% N/A N/A N/A
ISAAC 6.0% 6.3% N/A N/A
LIVINGSTONE 4.3% 4.3% N/A 5.3%
LOCKYER VALLEY 5.8% 6.4% N/A N/A
MAREEBA 7.0% 6.5% N/A N/A
MOUNT ISA 6.2% 6.8% N/A N/A
SCENIC RIM 4.3% 5.0% N/A 4.2%
SOMERSET 6.0% 5.6% N/A N/A
SOUTH BURNETT 6.9% 6.5% N/A N/A
SOUTHERN DOWNS 5.3% 5.8% N/A N/A
TABLELANDS 4.7% 4.9% N/A N/A
WESTERN DOWNS 4.8% 5.3% N/A N/A
WHITSUNDAY 4.4% 3.8% 4.7% 5.5%
WESTERN DOWNS 5.3% 4.7% N/A N/A
WHITSUNDAY 3.8% 3.9% 5.5% 4.6%
Queensland Market Monitor is published byThe Real Estate Institute of Queensland (REIQ).
ABN 49 009 661 287
Sales data obtained from Core Logic RP Data (www.corelogic.com.au) and median weekly rental data from the Residential Tenancies Authority (www.rta.qld.gov.au). Enquiries about the reproduction of part or all of the information should be directed to the Corporate Affairs Division, REIQ.
© The State of Queensland (Department of Environment and Resource Management) 2015. Based on data provided with the permission of the Department of Natural Resources and Mines: [QVAS 2015]. The Department of Environment and Resource Management makes no representations or warranties about accuracy, reliability, completeness or suitability of the data for any particular purpose and disclaims all responsibility and all liability (including without limitation, liability in negligence) for all expenses, losses and damages (including indirect or consequential damage) and costs which might be incurred as a result of the data being inaccurate or incomplete in any way and for any reason.
Disclaimer: The information contained in this publication, while based on information believed reliable, is not guaranteed. Nor is any of it tendered by way of investment advice; instead, it is intended only to inform and illustrate. No reader should act on the basis of any matter contained in this publication without considering and if necessary taking appropriate professional advice with regards to their own particular circumstances. The publisher and editor give no representations and make no warranties, express or implied, with respect to the accuracy or completeness of any of the material (including statistics, advertisements and advertising features) contained in this publication. The publisher and editor expressly disclaim any and all liability to the reader, whether a purchaser of this publication or not, in respect of anything and the consequences of anything done or omitted to be done by any such person in reliance, whether whole or partial, upon the whole or any part of the contents of this publication. The publisher, editor or contributors will enter into no correspondence in relation to this publication. The mention of the company, organisation, person, investment strategy or technique does not imply endorsement by the publisher. The publisher has not vetted advertisers and their products/services. The inclusion of advertisements or special advertising features in this publication does not imply endorsement of the advertiser/s or their products/services by the publisher. Articles are published in reliance upon the representations and warranties of the authors of the articles and without knowledge of any infringement of any third party’s copyright. Copyright: This publication is protected under the Commonwealth Copyrights Act 1968 and may not, in whole or part, be lent, copied, photocopied, reproduced, translated or reduced to any electronic medium or machine-readable format without the express permission of the publisher. For permissions or reprints, contact the Corporate Affairs Division on phone 07 3249 7347
Vacancy Trend: Steady = +/- 0 to 0.2%pts Up = +0.3% pts or more Down = -0.3% pts or more * change greater than 0.5 pts
Market Status: TIght <2.5% Healthy 2.5-3.5% Weak >3.5%
Source: REIQ Residential Rental Survey
* change greater than 0.5 pts
QUEENSLAND MARKET MONITOR is a quarterly, electronic publication entirely focused on residential sales and rental research data for regions throughout the State, on a suburb-by-suburb basis. It meets the high standards for accurate data and reliable analysis that you have come to expect from the REIQ.
This detailed level of information will enable you to conduct valuable comparisons between various regions and market segments, and to ensure you are completely informed of all the latest market trends and fluctuations.
Each edition includes:
• Median sale prices for houses, units/townhouses and land;
• Median weekly rents for houses and units/townhouses;
• On the market indicators;
• Rental market indicators;
• Useful charts and graphs; and
• Analytical market commentary.
I WOULD LIKE TO SUBSCRIBE TO
your state-wide property research guide suburb by suburb
REIQ
Return completed form to the REIQ
FAX
07 3249 6201
PHONE
07 3249 7301
POST
PO Box 1555 Coorparoo DC QLD 4151
I would like single issue(s) for $22.95* each
I would like a two-year subscription (8 issues) for $150*
I would like a one-year subscription (4 issues) for $80*
Please start with or please include the following back issues
Title
Full Legal name
Company name
Occupation
Street address Post code
Postal address Post code
Website Mobile
Phone
This is a renewal subscription This purchase is on behalf of a company
Cheque [please make cheques payable to the REIQ]
Visa MasterCard Amex (N.B. we cannot accept Diners)
Expiry Amount
Credit card number
Cardholder’s name Cardholder’s signature
How did you hear about us?
*all prices include GST
OFFICAL USE ONLY ID INV AUTH DATE
PRIVACY NOTICE:THE REIQ MAY USE YOUR PERSONAL INFORMATION IN ACCORDANCE WITH ITS PRIVACY POLICY WHICH CAN BE VIEWED AT WWW.REIQ.COM/PRIVACYALTERNATIVELY, YOU MAY REQUEST A COPY BY:MAIL: PO BOX 1555, COORPAROO DC QLD 4151EMAIL:[email protected]: (07) 3249 7347
I ACKNOWLEDGE THAT I HAVE READ AND UNDERSTOOD THE REIQ’S PRIVACY POLICY

41
REGIONAL MARKET UPDATES
SEPTEMBER QUARTER 2015