Embed Size (px)
Citation preview

INVESTOR WORKSHOP
The Principal Financial Group ®November 6, 2015
INVESTOR WORKSHOP
John Egan – Vice President, Investor Relations
Welcome
Certain statements made by the company which are not historical facts may be considered forward‐looking statements, including, without limitation, statements as to operating earnings, net income available to common stockholders, net cash flows, realized and unrealized gains and losses, capital and liquidity positions, sales and earnings trends, and management'sbeliefs, expectations, goals and opinions. The company does not undertake to update these statements, which are based on a number of assumptions concerning future conditions that may ultimately prove to be inaccurate. Future events and their effects on the company may not be those anticipated, and actual results may differ materially from the results anticipated inthese forward‐looking statements. The risks, uncertainties and factors that could cause or contribute to such material differences are discussed in the company's annual report on Form 10‐K for the year ended Dec. 31, 2014 and in the company’s quarterly report on Form 10‐Q for quarter ended Sept. 30, 2015 filed by the company with the Securities and Exchange Commission, as updated or supplemented from time to time in subsequent filings. These risks and uncertainties include, without limitation: adverse capital and credit market conditions may significantly affect the company’s ability to meet liquidity needs, access to capital and cost of capital; conditions in the global capital markets and the economy generally; continued volatility or further declines in the equity, bond or real estate markets; changes in interest rates or credit spreads; the company’s investment portfolio is subject to several risks that may diminish the value of its invested assets and the investmentreturns credited to customers; the company’s valuation of securities may include methodologies, estimations and assumptions that are subject to differing interpretations; the determination of the amount of allowances and impairments taken on the company’s investments requires estimations and assumptions that are subject to differing interpretations; gross unrealized losses may be realized or result in future impairments; competition from companies that may have greater financial resources,broader arrays of products, higher ratings and stronger financial performance; a downgrade in the company’s financial strength or credit ratings; inability to attract and retain sales representatives and develop new distribution sources; international business risks; the company’s actual experience could differ significantly from its pricing and reserving assumptions; the company’s ability to pay stockholder dividends and meet its obligations may be constrained by the limitations on dividends ordistributions Iowa insurance laws impose on Principal Life; the pattern of amortizing the company’s DAC and other actuarial balances on its universal life‐type insurance contracts, participating life insurance policies and certain investment contracts may change; the company may need to fund deficiencies in its “Closed Block” assets that support participating ordinary life insurance policies that had a dividend scale in force at the time of Principal Life’s 1998 conversion into a stock life insurance company; the company’s reinsurers could default on their obligations or increase their rates; risks arising from acquisitions ofbusinesses; changes in laws, regulations or accounting standards; a computer system failure or security breach could disrupt the company’s business, and damage its reputation; results of litigation and regulatory investigations; from time to time thecompany may become subject to tax audits, tax litigation or similar proceedings, and as a result it may owe additional taxes,interest and penalties in amounts that may be material; fluctuations in foreign currency exchange rates; and applicable laws and the company’s certificate of incorporation and by‐laws may discourage takeovers and business combinations that some stockholders might consider in their best interests.
Forward Looking Statements
3
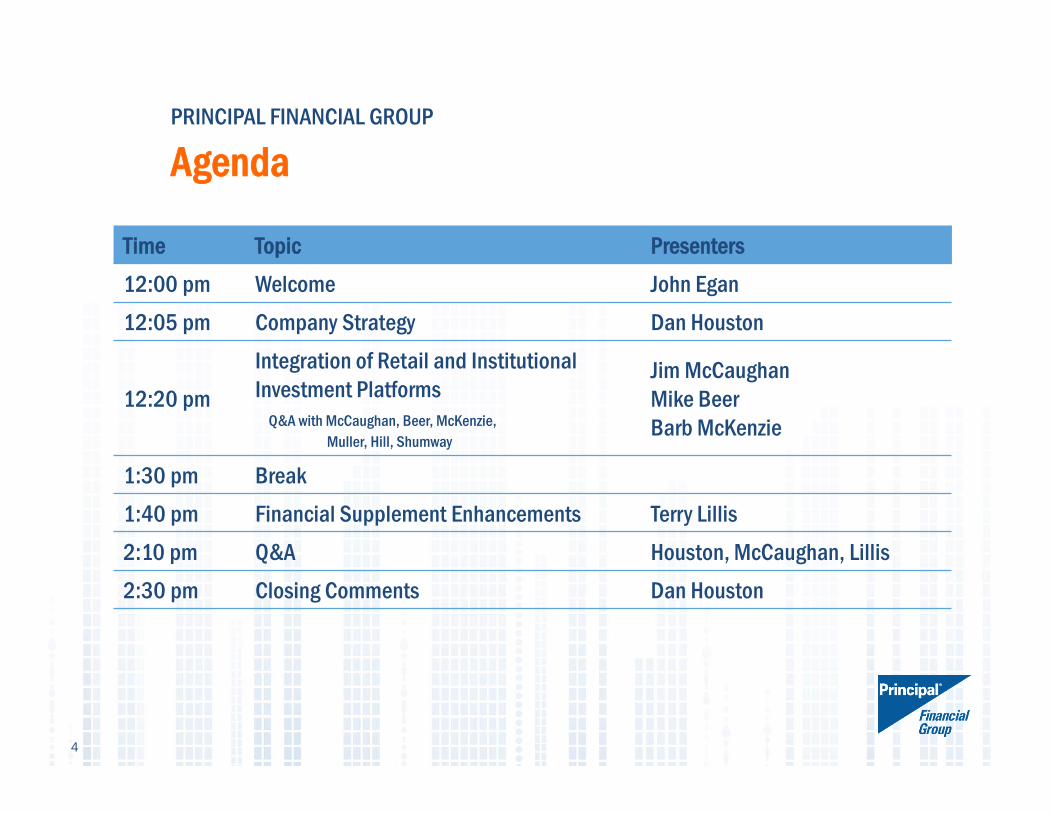
PRINCIPAL FINANCIAL GROUP
Agenda
4
Time Topic Presenters12:00 pm Welcome John Egan12:05 pm Company Strategy Dan Houston
12:20 pmIntegration of Retail and InstitutionalInvestment Platforms
Q&A with McCaughan, Beer, McKenzie, Muller, Hill, Shumway
Jim McCaughanMike BeerBarb McKenzie
1:30 pm Break1:40 pm Financial Supplement Enhancements Terry Lillis2:10 pm Q&A Houston, McCaughan, Lillis2:30 pm Closing Comments Dan Houston
INVESTOR WORKSHOP
Dan Houston – President and Chief Executive Officer
Company Strategy

6
WHERE WECOMPETE
HOW WE WIN
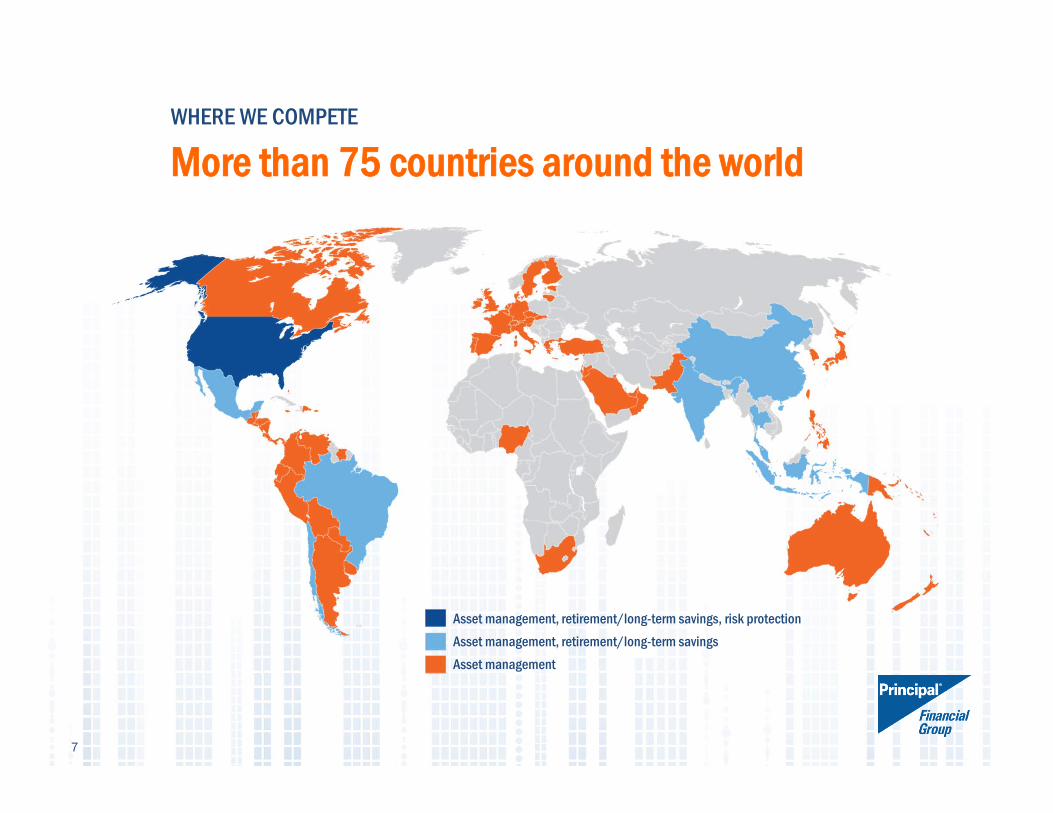
WHERE WE COMPETE
More than 75 countries around the world
Asset management, retirement/long-term savings, risk protectionAsset management, retirement/long-term savingsAsset management
7
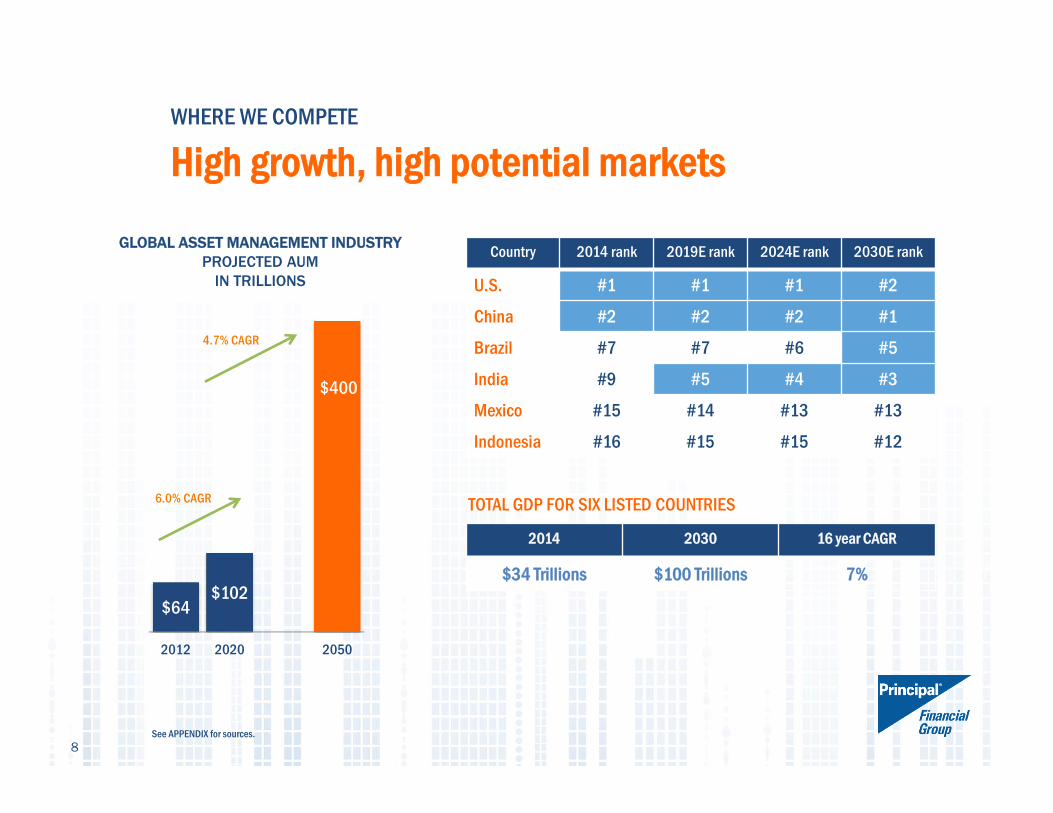
WHERE WE COMPETE
High growth, high potential markets
8
$64$102
$400
2012 2020 2050
Country 2014 rank 2019E rank 2024E rank 2030E rank
U.S. #1 #1 #1 #2
China #2 #2 #2 #1
Brazil #7 #7 #6 #5
India #9 #5 #4 #3
Mexico #15 #14 #13 #13
Indonesia #16 #15 #15 #12
2014 2030 16 year CAGR
$34 Trillions $100 Trillions 7%
TOTAL GDP FOR SIX LISTED COUNTRIES6.0% CAGR
GLOBAL ASSET MANAGEMENT INDUSTRY PROJECTED AUM
IN TRILLIONS
4.7% CAGR
See APPENDIX for sources.
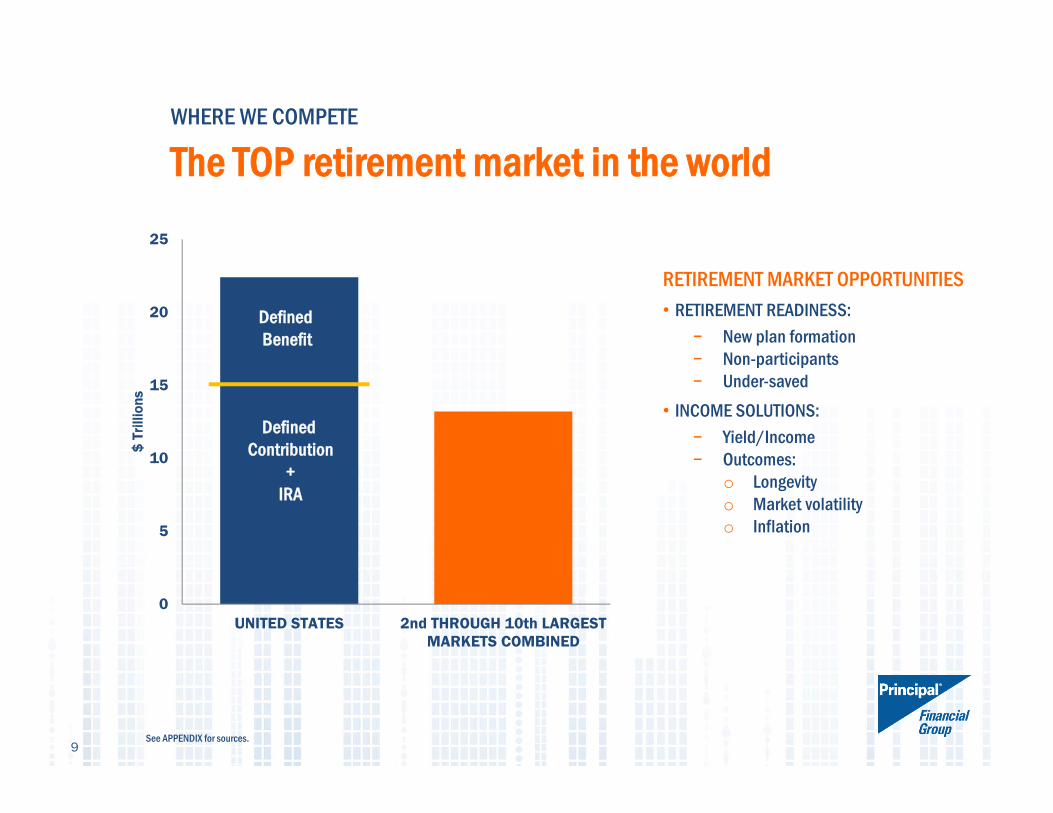
0
5
10
15
20
25
UNITED STATES 2nd THROUGH 10th LARGESTMARKETS COMBINED
$ T
rilli
ons
Defined Contribution
+ IRA
Defined Benefit
WHERE WE COMPETE
The TOP retirement market in the world
9
RETIREMENT MARKET OPPORTUNITIES• RETIREMENT READINESS:
− New plan formation− Non-participants− Under-saved
• INCOME SOLUTIONS:− Yield/Income− Outcomes:
o Longevityo Market volatilityo Inflation
See APPENDIX for sources.
10
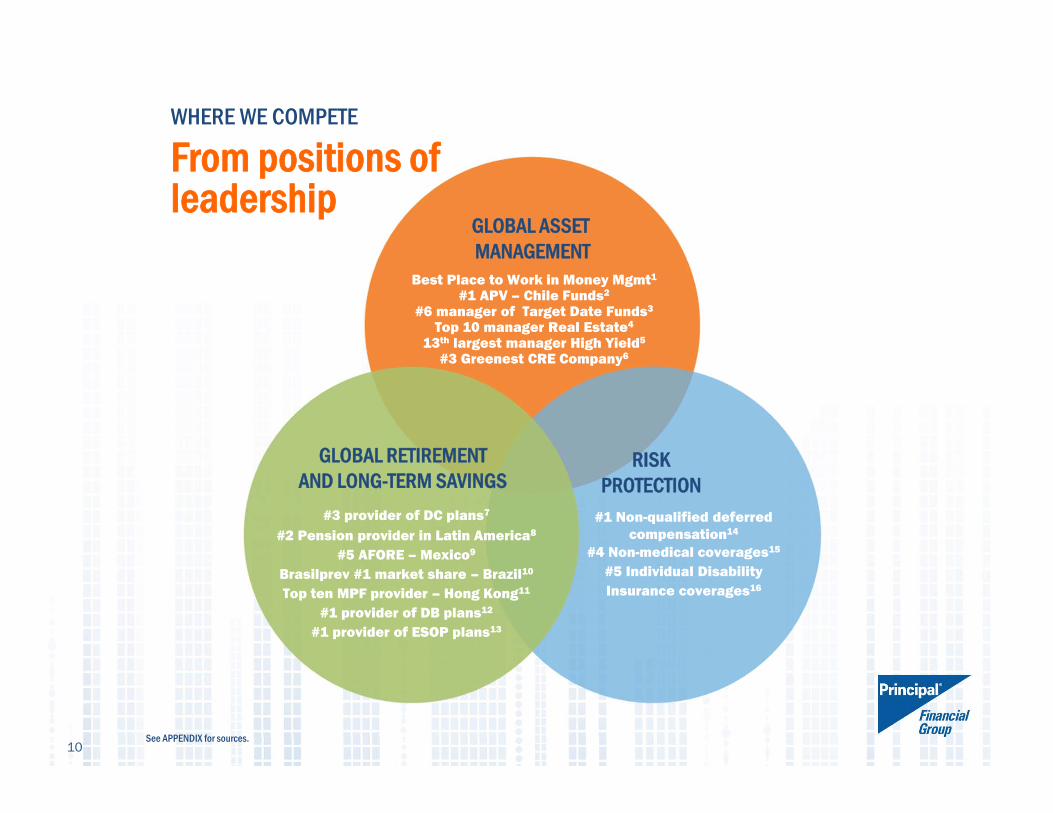
WHERE WE COMPETE
From positions of leadership
GLOBAL RETIREMENTAND LONG-TERM SAVINGS
RISK PROTECTION
GLOBAL ASSETMANAGEMENT
#1 Non-qualified deferred compensation14
#4 Non-medical coverages15
#5 Individual Disability Insurance coverages16
#3 provider of DC plans7
#2 Pension provider in Latin America8
#5 AFORE – Mexico9
Brasilprev #1 market share – Brazil10
Top ten MPF provider – Hong Kong11
#1 provider of DB plans12
#1 provider of ESOP plans13
Best Place to Work in Money Mgmt1
#1 APV – Chile Funds2
#6 manager of Target Date Funds3
Top 10 manager Real Estate4
13th largest manager High Yield5
#3 Greenest CRE Company6
See APPENDIX for sources.
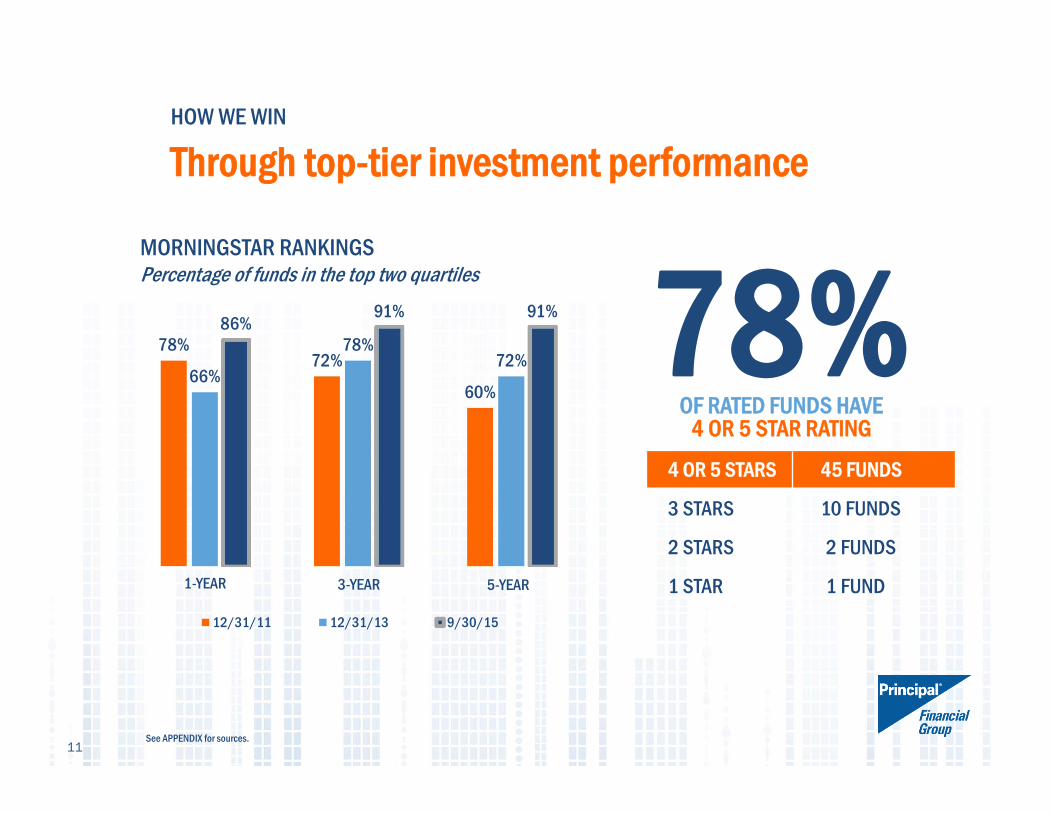
HOW WE WIN
Through top-tier investment performance
78%72%
60%66%
78%72%
86%91% 91%
12/31/11 12/31/13 9/30/15
MORNINGSTAR RANKINGS Percentage of funds in the top two quartiles
1-YEAR 3-YEAR 5-YEAR
78%OF RATED FUNDS HAVE
4 OR 5 STAR RATING
4 OR 5 STARS 45 FUNDS
3 STARS 10 FUNDS
2 STARS 2 FUNDS
1 STAR 1 FUND
11See APPENDIX for sources.
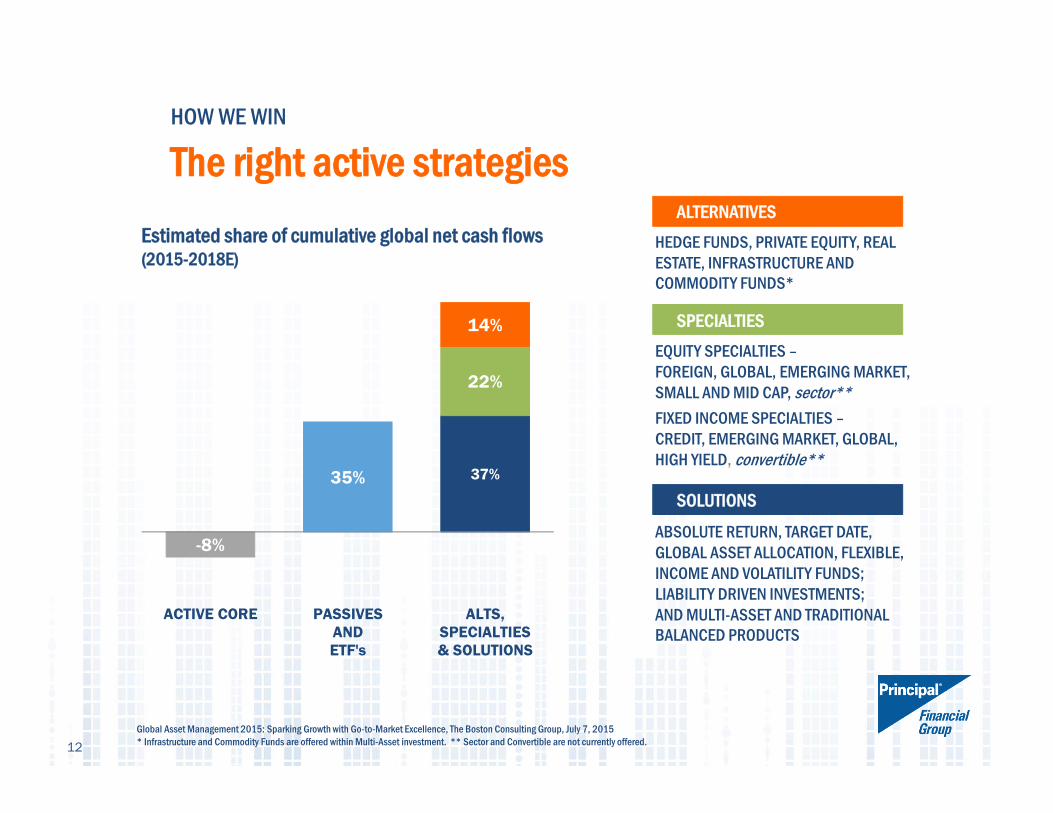
HOW WE WIN
The right active strategies
-8%
35% 37%
22%
14%
ACTIVE CORE PASSIVESANDETF's
ALTS,SPECIALTIES& SOLUTIONS
Estimated share of cumulative global net cash flows(2015-2018E)
12
HEDGE FUNDS, PRIVATE EQUITY, REALESTATE, INFRASTRUCTURE AND COMMODITY FUNDS*
Global Asset Management 2015: Sparking Growth with Go-to-Market Excellence, The Boston Consulting Group, July 7, 2015* Infrastructure and Commodity Funds are offered within Multi-Asset investment. ** Sector and Convertible are not currently offered.
SOLUTIONS
EQUITY SPECIALTIES –FOREIGN, GLOBAL, EMERGING MARKET, SMALL AND MID CAP, sector**FIXED INCOME SPECIALTIES –CREDIT, EMERGING MARKET, GLOBAL, HIGH YIELD, convertible**
ALTERNATIVES
SPECIALTIES
ABSOLUTE RETURN, TARGET DATE,GLOBAL ASSET ALLOCATION, FLEXIBLE, INCOME AND VOLATILITY FUNDS; LIABILITY DRIVEN INVESTMENTS; AND MULTI-ASSET AND TRADITIONAL BALANCED PRODUCTS
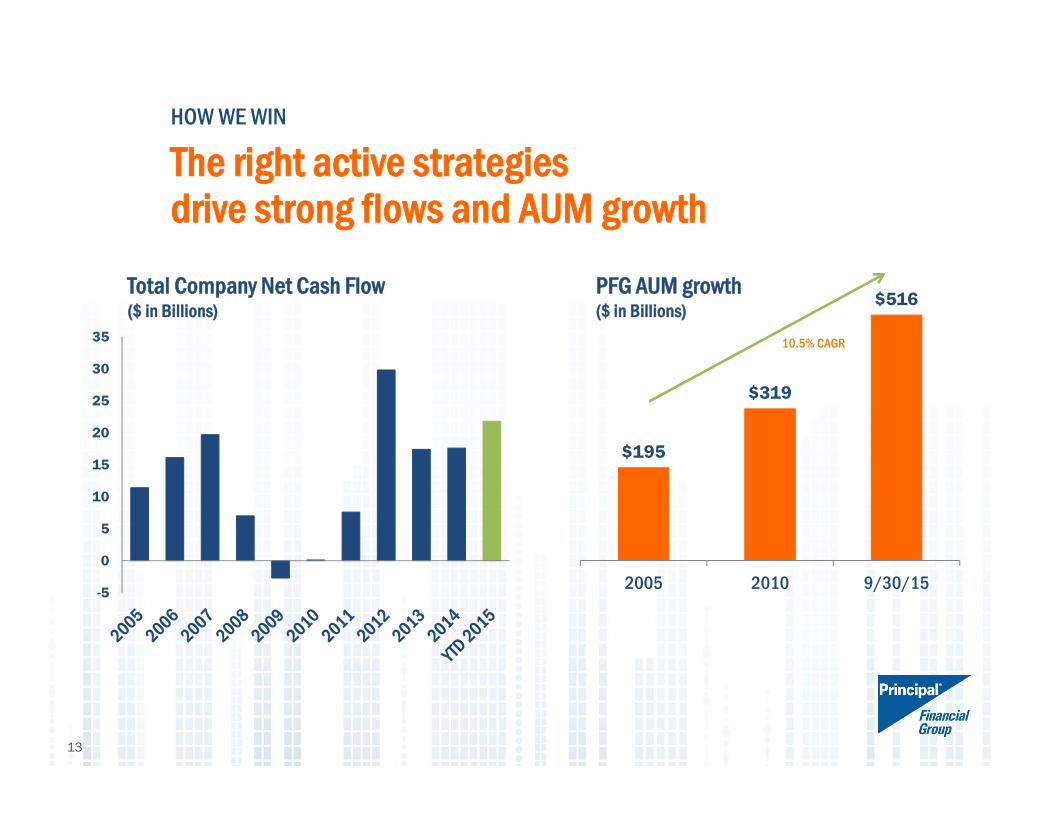
$195
$319
$516
2005 2010 9/30/15
HOW WE WIN
The right active strategies drive strong flows and AUM growth
Total Company Net Cash Flow($ in Billions)
PFG AUM growth($ in Billions)
-5
0
5
10
15
20
25
30
35
13
10.5% CAGR
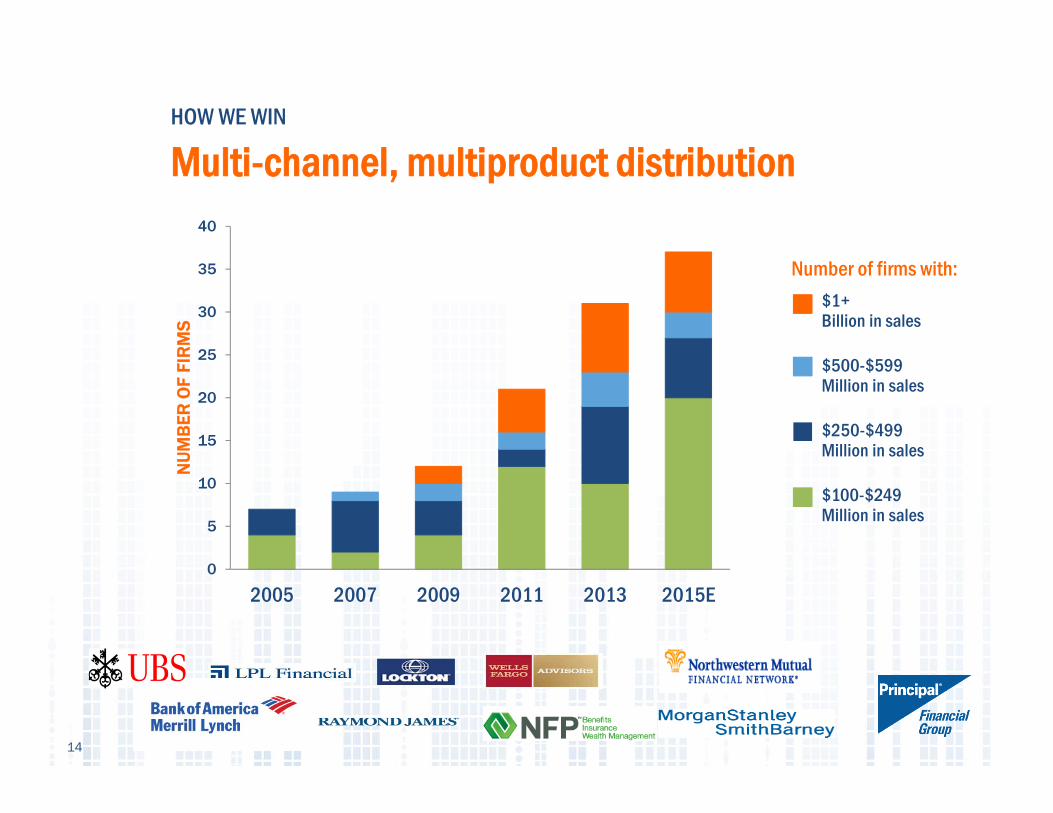
HOW WE WIN
Multi-channel, multiproduct distribution
0
5
10
15
20
25
30
35
40
2005 2007 2009 2011 2013 2015E
NU
MB
ER O
F FI
RM
S
$1+ Billion in sales
$500-$599 Million in sales
$250-$499 Million in sales
$100-$249 Million in sales
Number of firms with:
14
15
THIS ISHOW WE WIN• Investment excellence• Exceptional service• Multi-channel distribution• Collaborative culture
INVESTOR WORKSHOP
Jim McCaughan – CEO, Principal Global InvestorsMike Beer - President and CEO, Principal FundsBarb McKenzie – Senior Executive Director, COO &
Boutique Operations
Integration of Retail and Institutional Investment Platforms
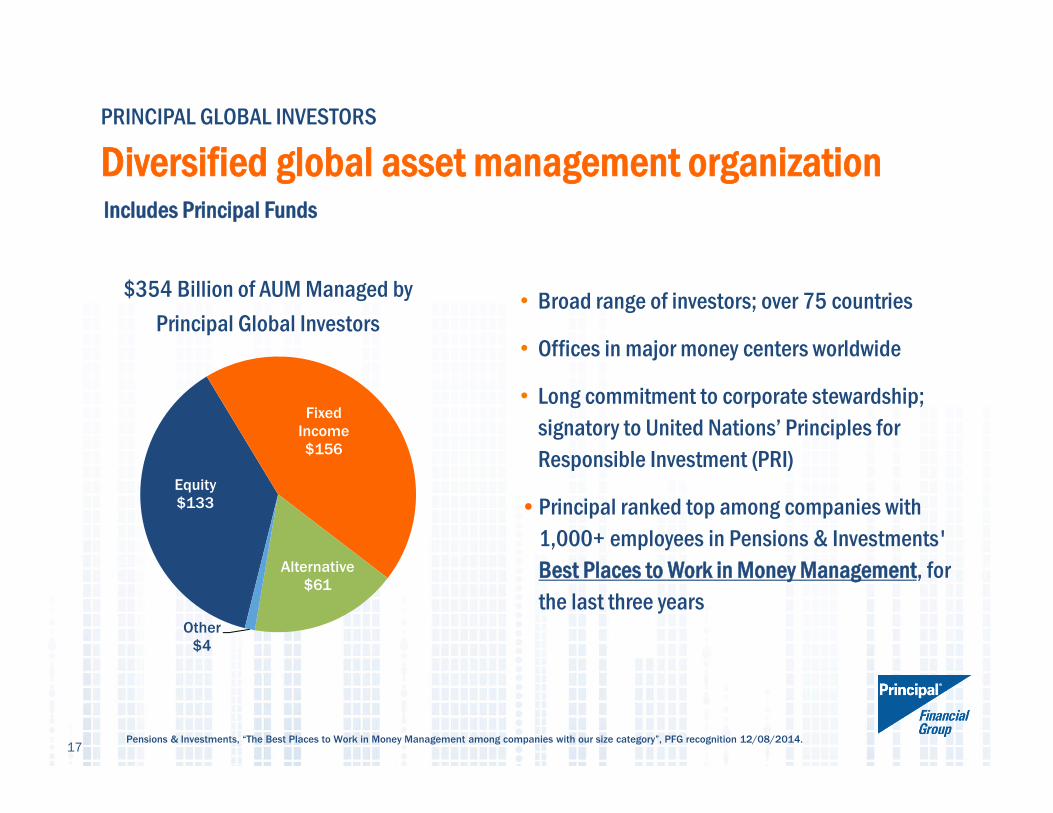
• Broad range of investors; over 75 countries
• Offices in major money centers worldwide
• Long commitment to corporate stewardship; signatory to United Nations’ Principles for Responsible Investment (PRI)
• Principal ranked top among companies with 1,000+ employees in Pensions & Investments' Best Places to Work in Money Management, for the last three years
PRINCIPAL GLOBAL INVESTORS
Diversified global asset management organization
17
$354 Billion of AUM Managed by Principal Global Investors
Equity$133
Fixed Income$156
Alternative$61
Other$4
Pensions & Investments, “The Best Places to Work in Money Management among companies with our size category”, PFG recognition 12/08/2014.
Includes Principal Funds
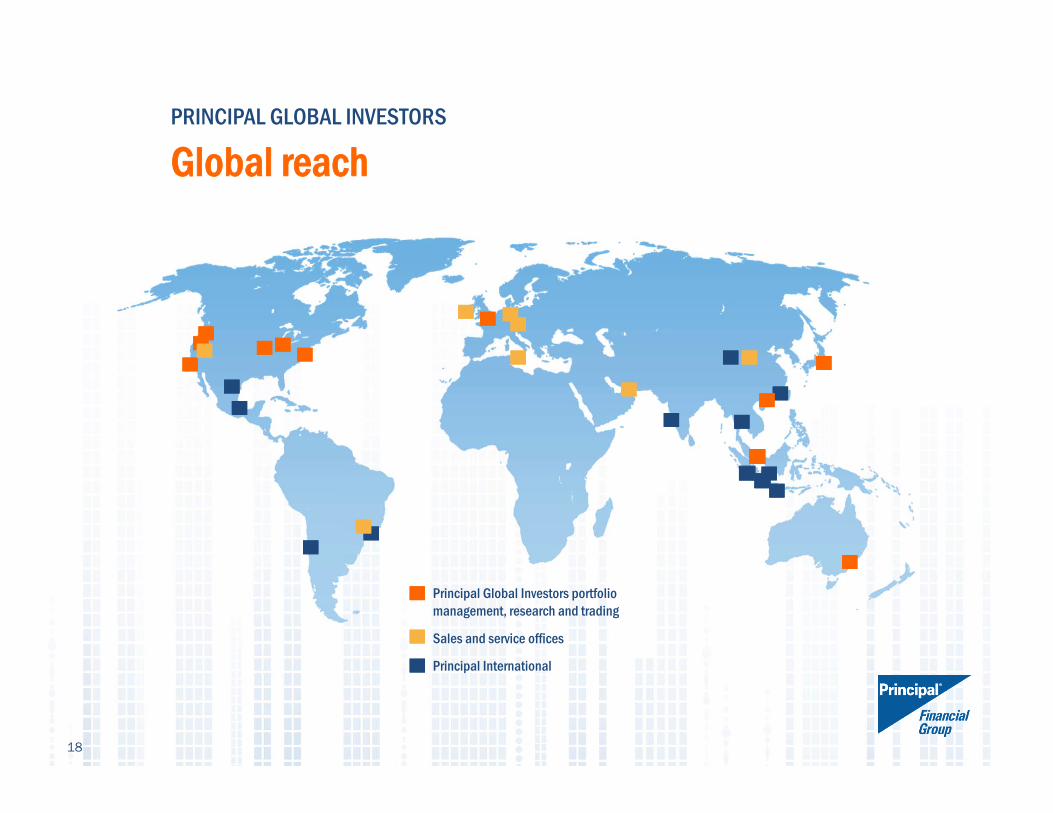
Principal Global Investors portfolio management, research and trading
PRINCIPAL GLOBAL INVESTORS
Global reach
Sales and service offices
Principal International
18
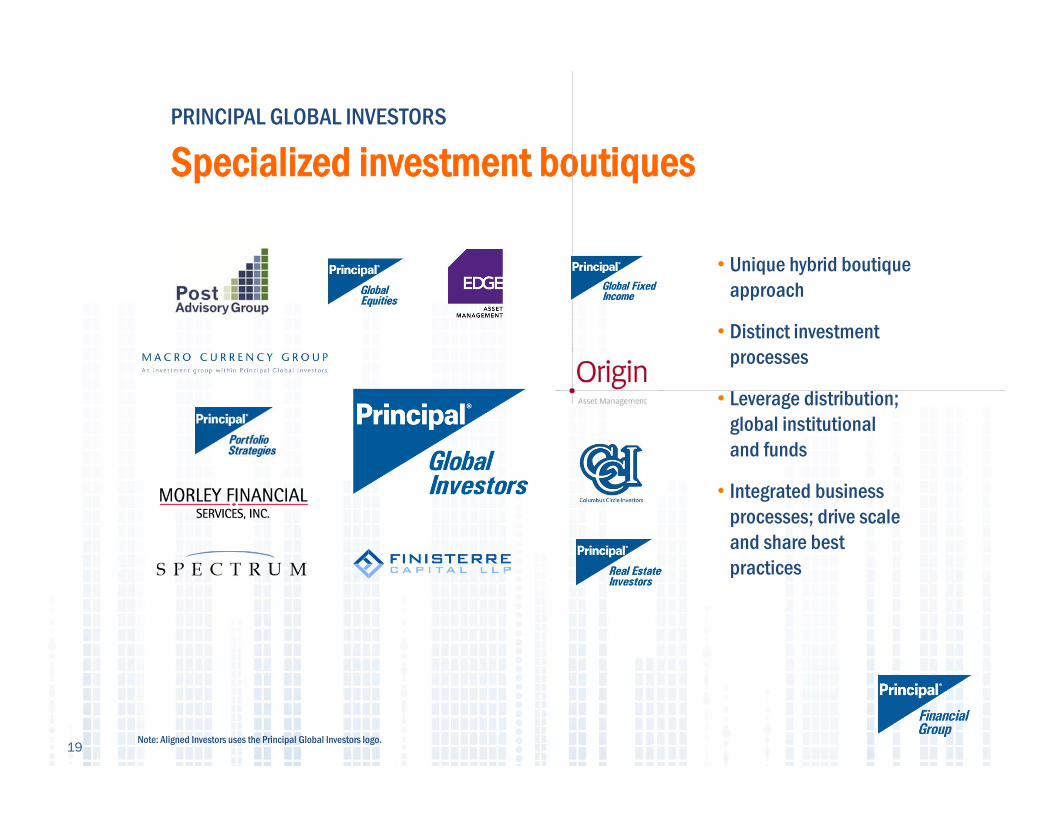
PRINCIPAL GLOBAL INVESTORS
Specialized investment boutiques
Note: Aligned Investors uses the Principal Global Investors logo. 19
• Unique hybrid boutique approach
• Distinct investment processes
• Leverage distribution; global institutional and funds
• Integrated business processes; drive scale and share best practices
PRINCIPAL GLOBAL INVESTORS
Our growth drivers
Driving growth of all businesses, with new opportunities from alignment!
• Long-term strategies – institutional, retirement, high net worth, and retail clients
• Global leader in funds
• Global distribution – institutional and funds
• Range of capabilities – innovative products and solutions
• Multi-boutique approach
20

PRINCIPAL GLOBAL INVESTORS
How we will win
• We are now a GLOBAL DESTINATION FOR FUNDS
‒ $162B in AUM across U.S. and International platforms, as well as various private funds*
‒ Strong performance across boutiques and strategies
• Global alignment of funds governance, operations and distribution
Global leader in funds
* As of 9/30/2015. Includes Principal Funds, Principal Trust , PGI Trusts and CITs, PGI Dublin Funds, PGI Australia Funds, and various boutique-level funds21
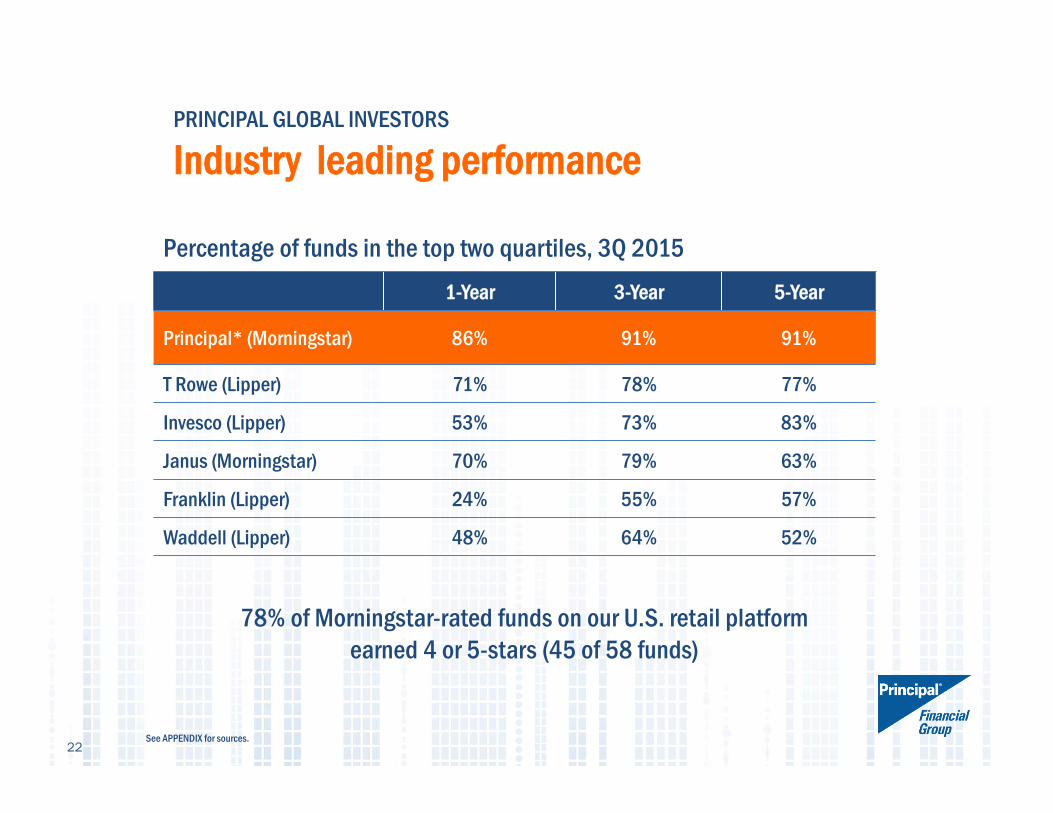
1-Year 3-Year 5-Year
Principal* (Morningstar) 86% 91% 91%
T Rowe (Lipper) 71% 78% 77%
Invesco (Lipper) 53% 73% 83%
Janus (Morningstar) 70% 79% 63%
Franklin (Lipper) 24% 55% 57%
Waddell (Lipper) 48% 64% 52%
PRINCIPAL GLOBAL INVESTORS
Industry leading performance
78% of Morningstar-rated funds on our U.S. retail platform earned 4 or 5-stars (45 of 58 funds)
Percentage of funds in the top two quartiles, 3Q 2015
22See APPENDIX for sources.
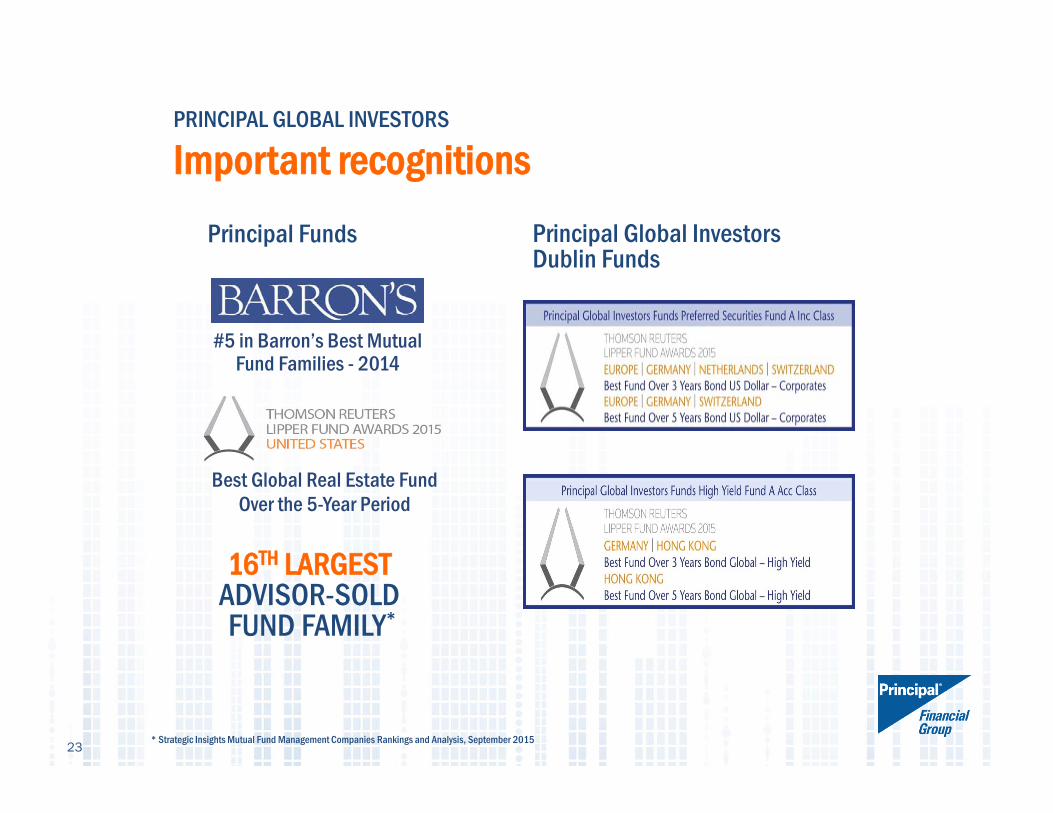
16TH LARGEST ADVISOR-SOLD FUND FAMILY*
PRINCIPAL GLOBAL INVESTORS
Important recognitions
* Strategic Insights Mutual Fund Management Companies Rankings and Analysis, September 2015
#5 in Barron’s Best Mutual Fund Families - 2014
Best Global Real Estate Fund Over the 5-Year Period
Principal Funds Principal Global InvestorsDublin Funds
23
PRINCIPAL GLOBAL INVESTORS
Opportunity set for global funds
• Translating our multi-asset, multi-manager success to offshore fund markets
• Translating success of other products/solutions
• Leveraging stronger relationships and increased power with big global distributors
• Driving efficiencies and sharing best practices across our platforms
24
PRINCIPAL GLOBAL INVESTORS
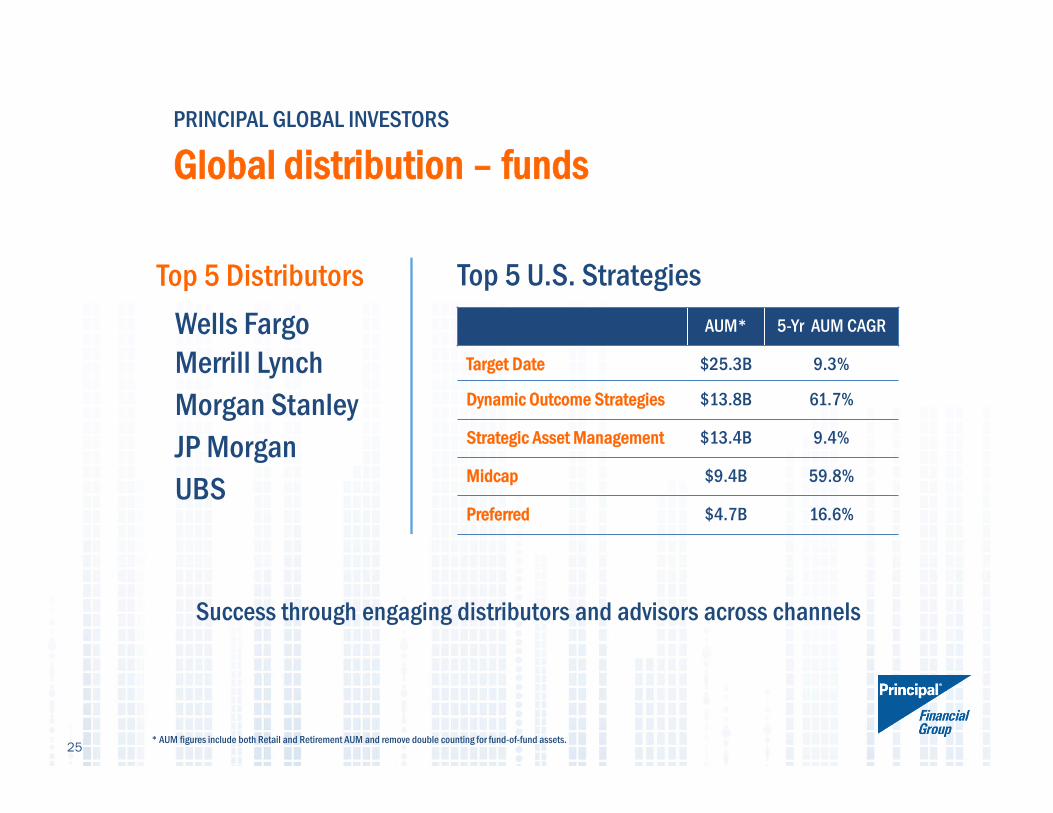
Global distribution – funds
Success through engaging distributors and advisors across channels
Top 5 Distributors Top 5 U.S. StrategiesAUM* 5-Yr AUM CAGR
Target Date $25.3B 9.3%
Dynamic Outcome Strategies $13.8B 61.7%
Strategic Asset Management $13.4B 9.4%
Midcap $9.4B 59.8%
Preferred $4.7B 16.6%
* AUM figures include both Retail and Retirement AUM and remove double counting for fund-of-fund assets. 25
Wells FargoMerrill LynchMorgan StanleyJP MorganUBS
PRINCIPAL GLOBAL INVESTORS
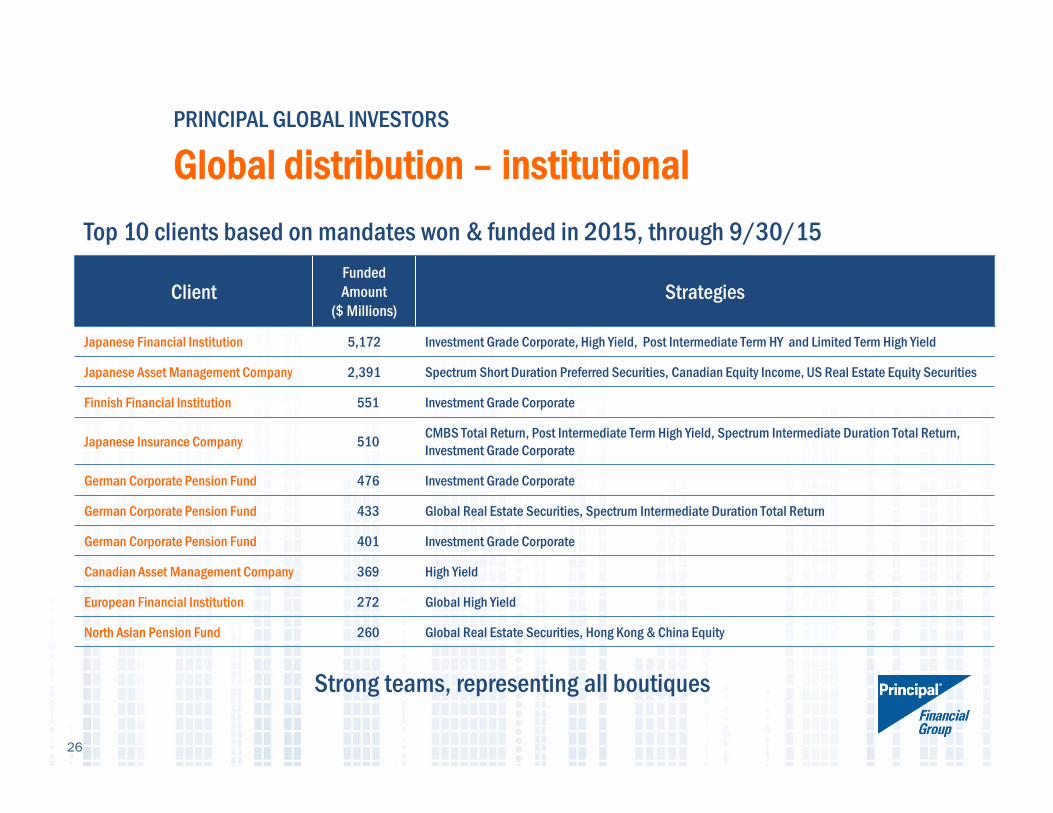
Global distribution – institutional
ClientFunded Amount
($ Millions)Strategies
Japanese Financial Institution 5,172 Investment Grade Corporate, High Yield, Post Intermediate Term HY and Limited Term High Yield
Japanese Asset Management Company 2,391 Spectrum Short Duration Preferred Securities, Canadian Equity Income, US Real Estate Equity Securities
Finnish Financial Institution 551 Investment Grade Corporate
Japanese Insurance Company 510 CMBS Total Return, Post Intermediate Term High Yield, Spectrum Intermediate Duration Total Return, Investment Grade Corporate
German Corporate Pension Fund 476 Investment Grade Corporate
German Corporate Pension Fund 433 Global Real Estate Securities, Spectrum Intermediate Duration Total Return
German Corporate Pension Fund 401 Investment Grade Corporate
Canadian Asset Management Company 369 High Yield
European Financial Institution 272 Global High Yield
North Asian Pension Fund 260 Global Real Estate Securities, Hong Kong & China Equity
Top 10 clients based on mandates won & funded in 2015, through 9/30/15
Strong teams, representing all boutiques
26
PRINCIPAL GLOBAL INVESTORS
How we will win
Innovative products & solutions• Product Development already a core strength
• With alignment, industry leading multi-asset , multi-manager capabilities‒ Principal Portfolio Strategies ‒ Edge Asset Management
• Combined “center of excellence” for product research, development and management‒ Across all legal vehicles, geographies and channels
27
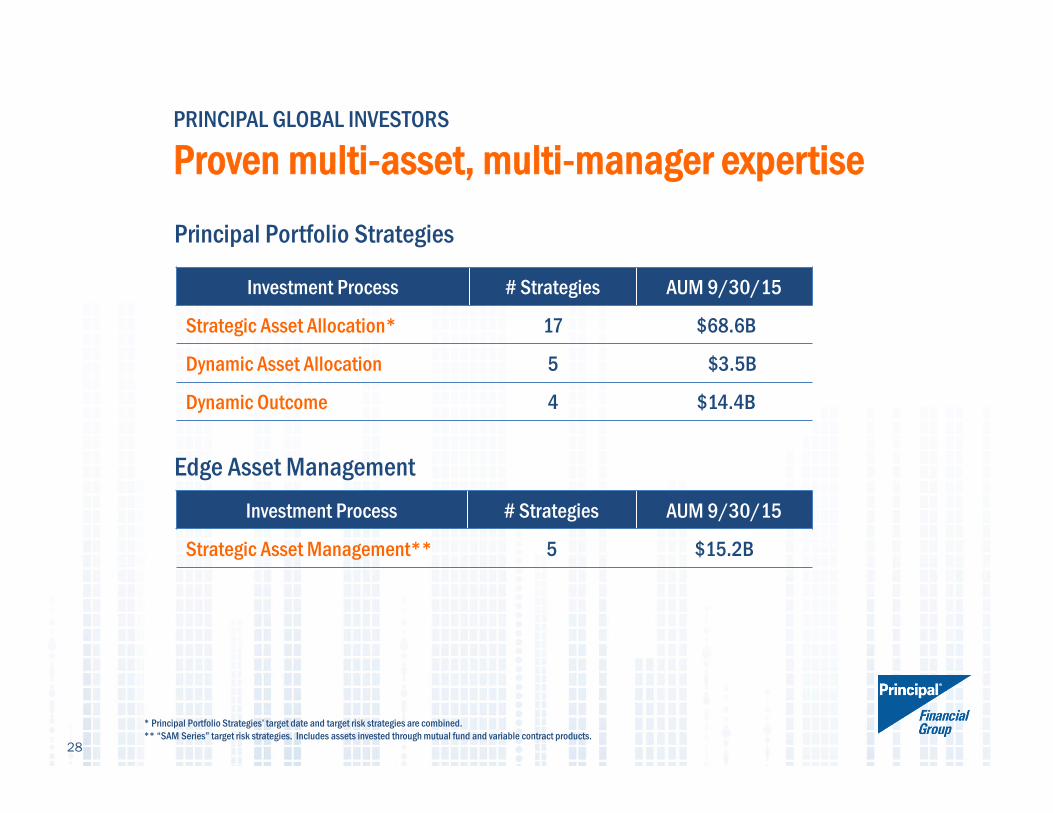
Investment Process # Strategies AUM 9/30/15
Strategic Asset Management** 5 $15.2B
PRINCIPAL GLOBAL INVESTORS
Proven multi-asset, multi-manager expertise
Investment Process # Strategies AUM 9/30/15
Strategic Asset Allocation* 17 $68.6B
Dynamic Asset Allocation 5 $3.5B
Dynamic Outcome 4 $14.4B
Principal Portfolio Strategies
* Principal Portfolio Strategies’ target date and target risk strategies are combined.** “SAM Series” target risk strategies. Includes assets invested through mutual fund and variable contract products.
Edge Asset Management
28
• Industry leader in delivering solutions, including Multi-Asset solutions
• Strong and growing suite of Alternatives
• Early entrant in the Active ETF space
• Hybrid, Passive and Indexed offerings on retirement platform of the Principal Financial Group
•With boutiques across asset classes, sector rotation presents opportunities
PRINCIPAL GLOBAL INVESTORS
Well positioned for industry trends
29
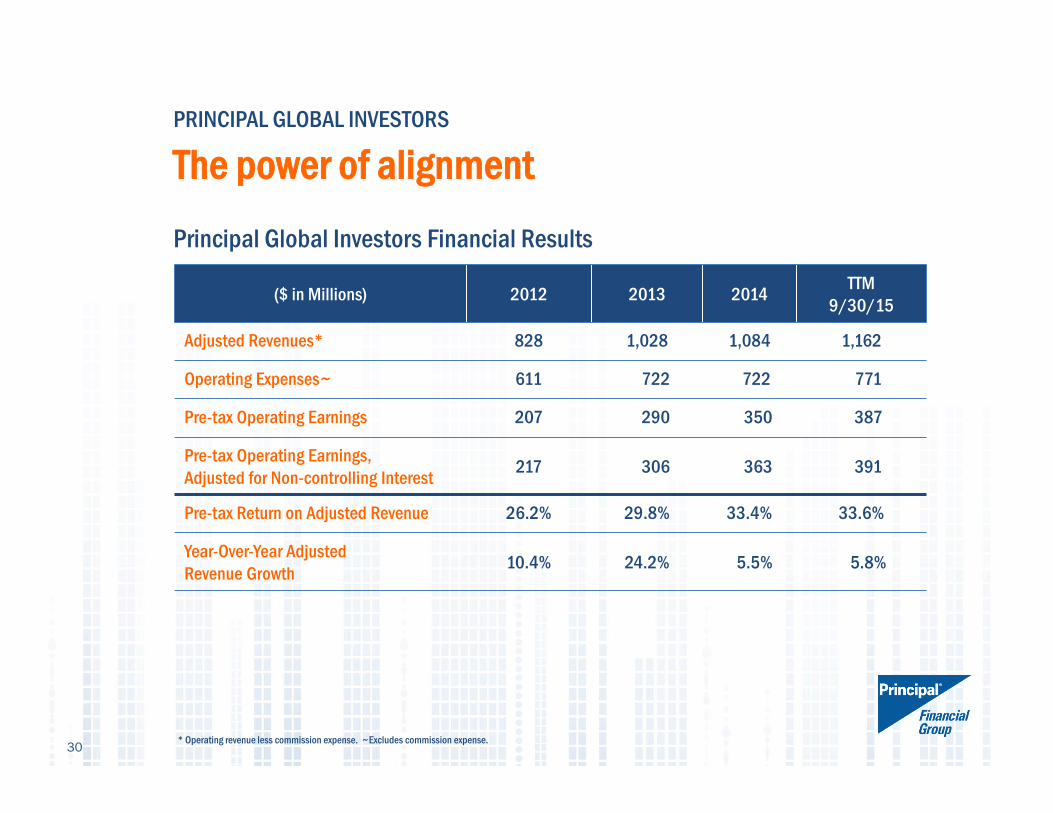
PRINCIPAL GLOBAL INVESTORS
The power of alignment
30
($ in Millions) 2012 2013 2014 TTM9/30/15
Adjusted Revenues* 828 1,028 1,084 1,162
Operating Expenses~ 611 722 722 771
Pre-tax Operating Earnings 207 290 350 387
Pre-tax Operating Earnings, Adjusted for Non-controlling Interest 217 306 363 391
Pre-tax Return on Adjusted Revenue 26.2% 29.8% 33.4% 33.6%
Year-Over-Year Adjusted Revenue Growth 10.4% 24.2% 5.5% 5.8%
Principal Global Investors Financial Results
* Operating revenue less commission expense. ~Excludes commission expense.
PRINCIPAL GLOBAL INVESTORS
Key takeaways
• Principal Global Investors is well positioned to take advantage of industry evolution and investor trends
• Continued collaboration with Principal International to leverage investment capabilities of the Principal Financial Group
• Keeping strong momentum while we pursue growth opportunities from alignment
31

INVESTOR WORKSHOP
Q&A Panel

INVESTOR WORKSHOP
Break
INVESTOR WORKSHOP
Terry Lillis – Executive Vice President & Chief Financial Officer
Financial Supplement Enhancements
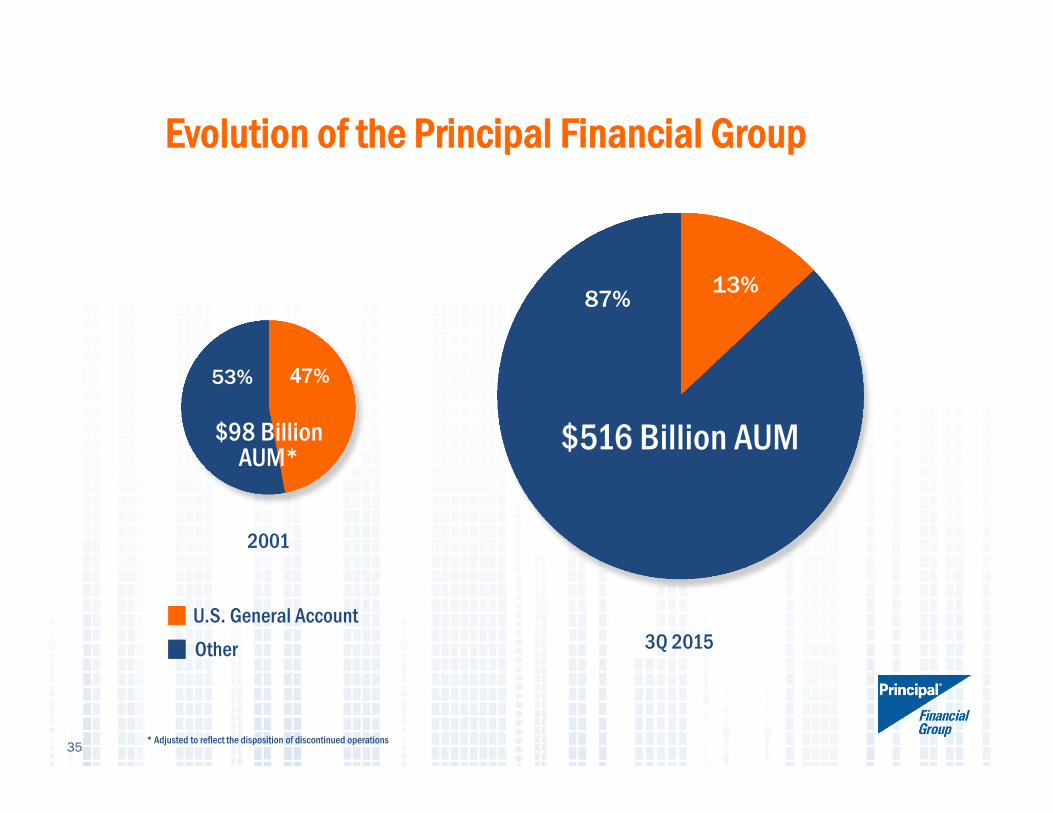
47%53%
13%87%
$516 Billion AUM$98 Billion AUM*
U.S. General AccountOther
* Adjusted to reflect the disposition of discontinued operations
Evolution of the Principal Financial Group
2001
3Q 2015
35
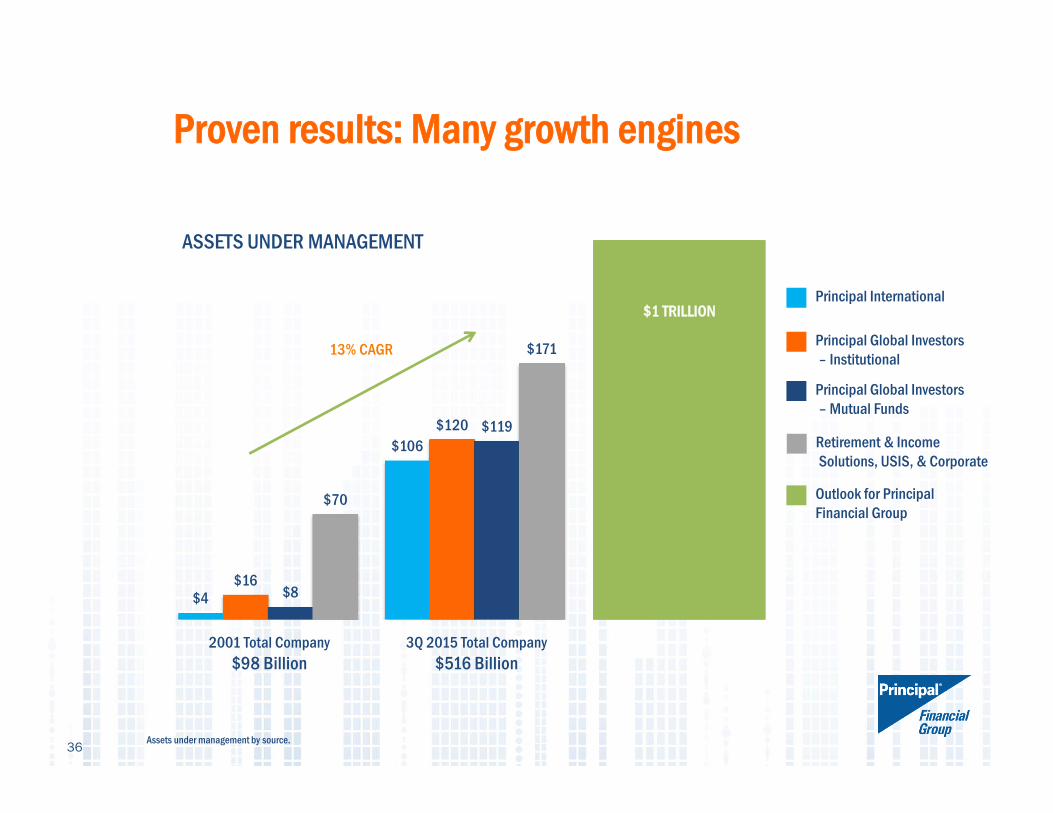
Proven results: Many growth engines
$4
$106
$16
$120
$8
$119
$70
$171
Principal International
Principal Global Investors – Institutional
Principal Global Investors– Mutual Funds
Outlook for Principal Financial Group
3Q 2015 Total Company $516 Billion
2001 Total Company $98 Billion
$1 TRILLION
ASSETS UNDER MANAGEMENT
Retirement & Income Solutions, USIS, & Corporate
36Assets under management by source.
13% CAGR
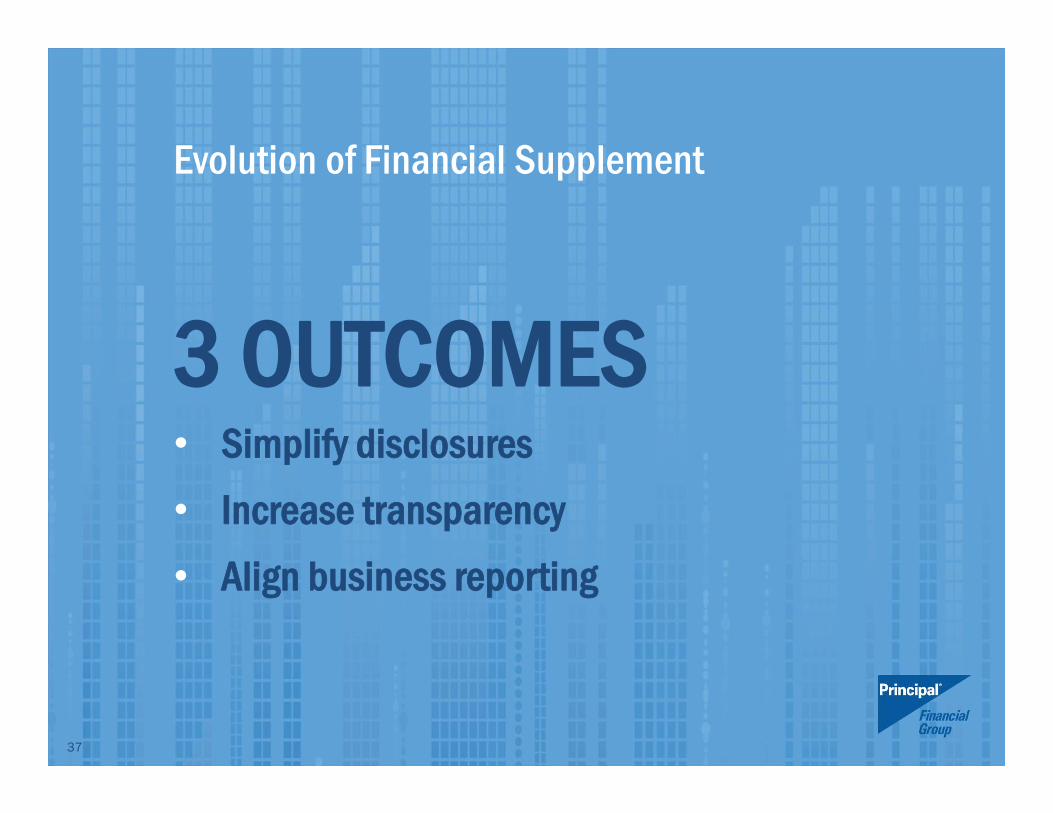
Evolution of Financial Supplement
3 OUTCOMES• Simplify disclosures• Increase transparency• Align business reporting
37
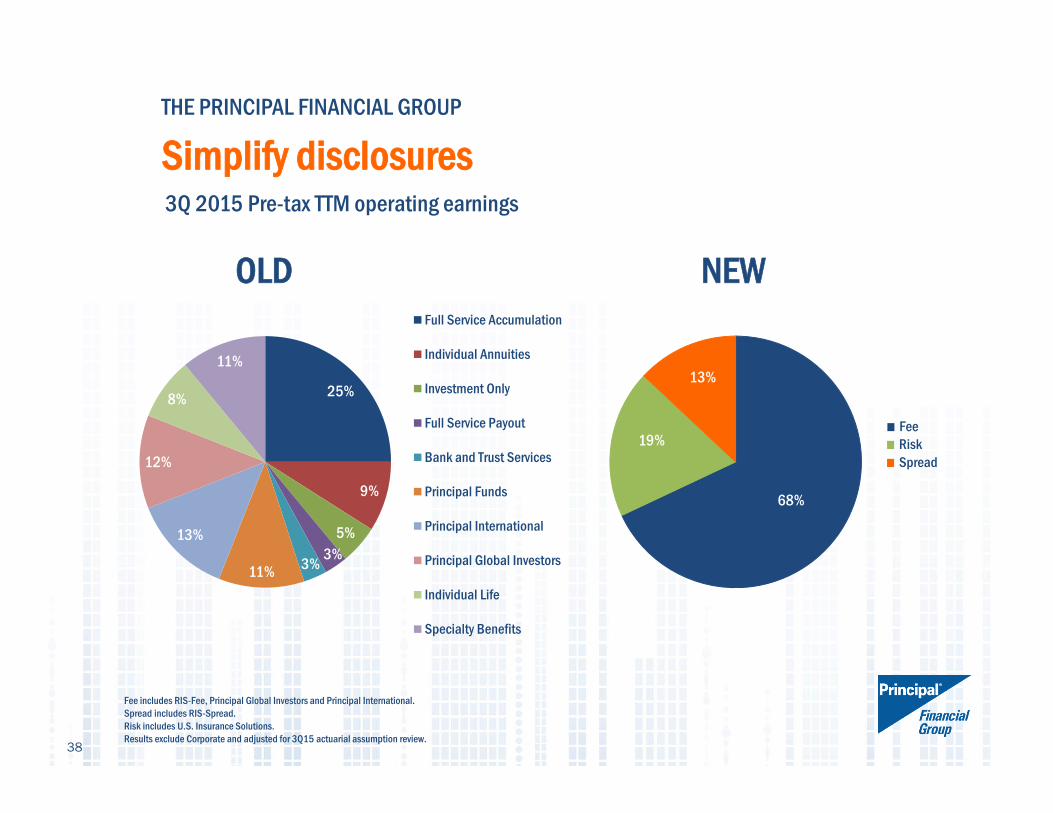
25%
9%
5%3%3%11%
13%
12%
8%
11%
Full Service Accumulation
Individual Annuities
Investment Only
Full Service Payout
Bank and Trust Services
Principal Funds
Principal International
Principal Global Investors
Individual Life
Specialty Benefits
68%
19%
13%
OLD NEW
3Q 2015 Pre-tax TTM operating earnings
38
FeeRiskSpread
THE PRINCIPAL FINANCIAL GROUP
Simplify disclosures
Fee includes RIS-Fee, Principal Global Investors and Principal International.Spread includes RIS-Spread.Risk includes U.S. Insurance Solutions.Results exclude Corporate and adjusted for 3Q15 actuarial assumption review.
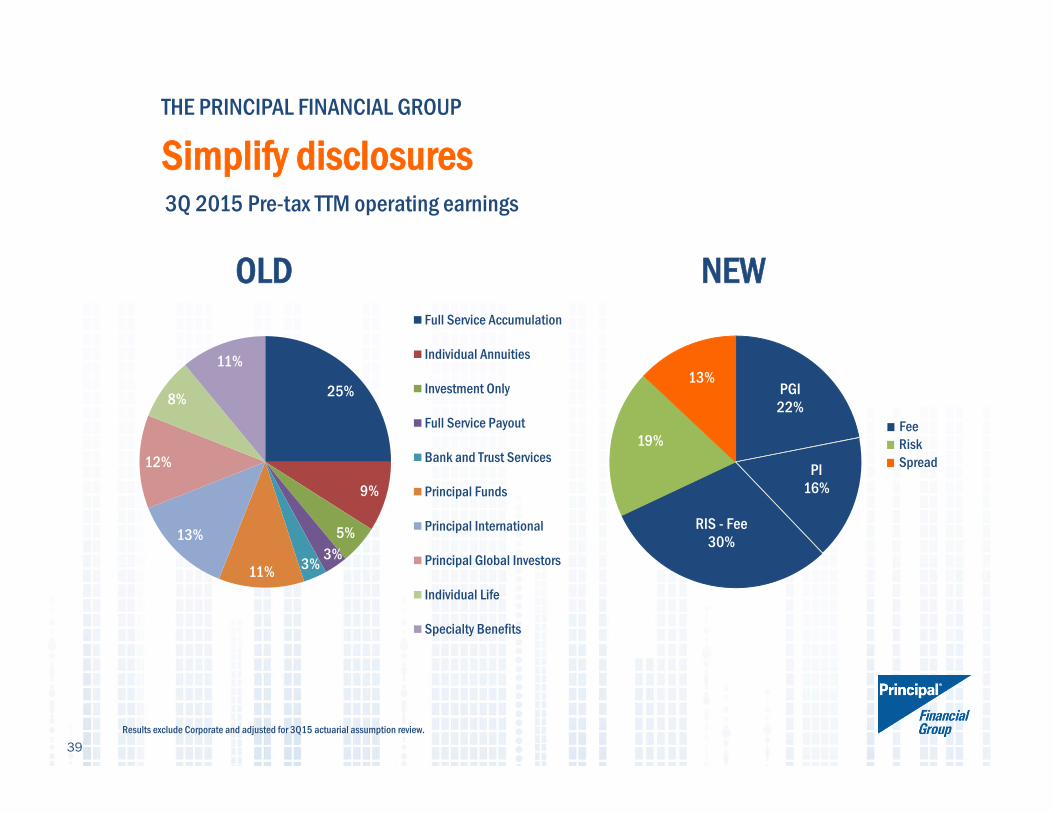
PGI22%
PI16%
RIS - Fee30%
19%
13%
3Q 2015 Pre-tax TTM operating earnings
39
25%
9%
5%3%3%11%
13%
12%
8%
11%
Full Service Accumulation
Individual Annuities
Investment Only
Full Service Payout
Bank and Trust Services
Principal Funds
Principal International
Principal Global Investors
Individual Life
Specialty Benefits
Results exclude Corporate and adjusted for 3Q15 actuarial assumption review.
FeeRiskSpread
THE PRINCIPAL FINANCIAL GROUP
Simplify disclosures
OLD NEW
• More focus on trailing twelve months
− Pre-tax operating earnings for business segments
− Equity method accounting clarification
− After-tax operating earnings for total company and fee, spread, risk
• Total company return on equity
− Includes impact from foreign currency translation
• Relevant investment disclosures
MORE CONCISE AND PERTINENT DISCLOSURES
40
THE PRINCIPAL FINANCIAL GROUP
Simplify disclosures
OLD NEW
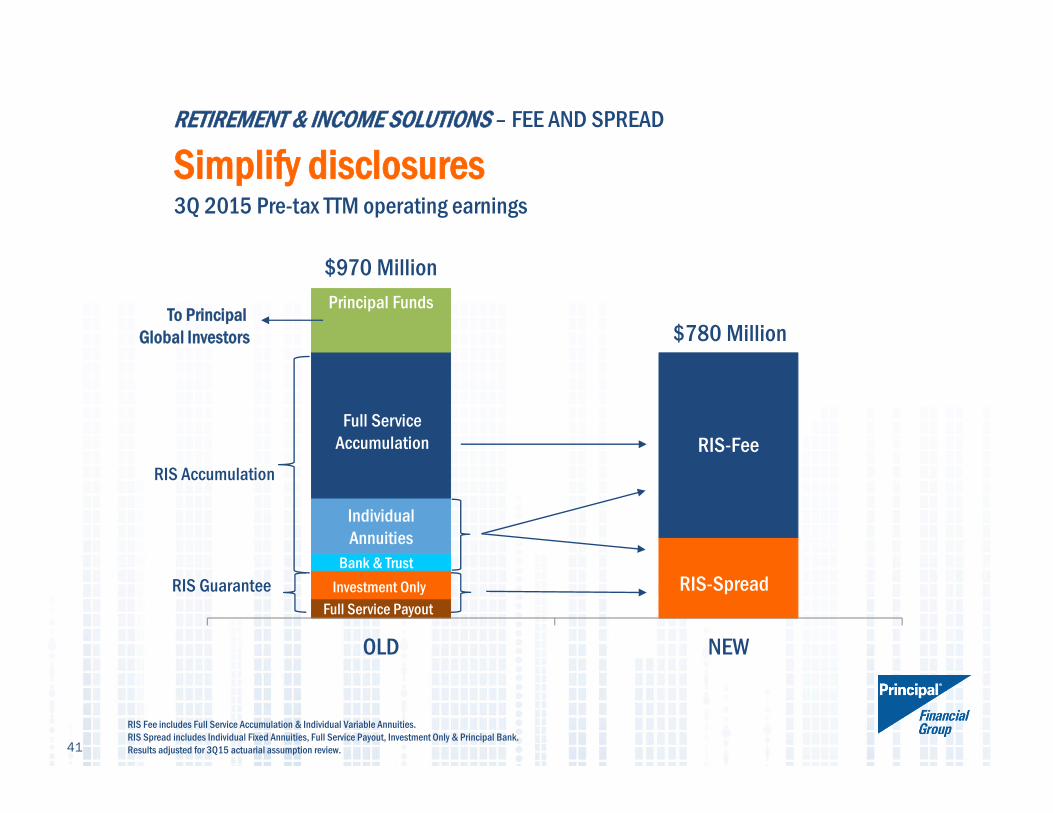
RETIREMENT & INCOME SOLUTIONS – FEE AND SPREAD
Simplify disclosures
$970 Million
RIS Fee includes Full Service Accumulation & Individual Variable Annuities. RIS Spread includes Individual Fixed Annuities, Full Service Payout, Investment Only & Principal Bank.Results adjusted for 3Q15 actuarial assumption review.
3Q 2015 Pre-tax TTM operating earnings
To Principal Global Investors
RIS-Fee
RIS-Spread
RIS Accumulation
RIS Guarantee
41
$780 MillionPrincipal Funds
Full Service Accumulation
Individual Annuities
Bank & TrustInvestment Only
Full Service Payout
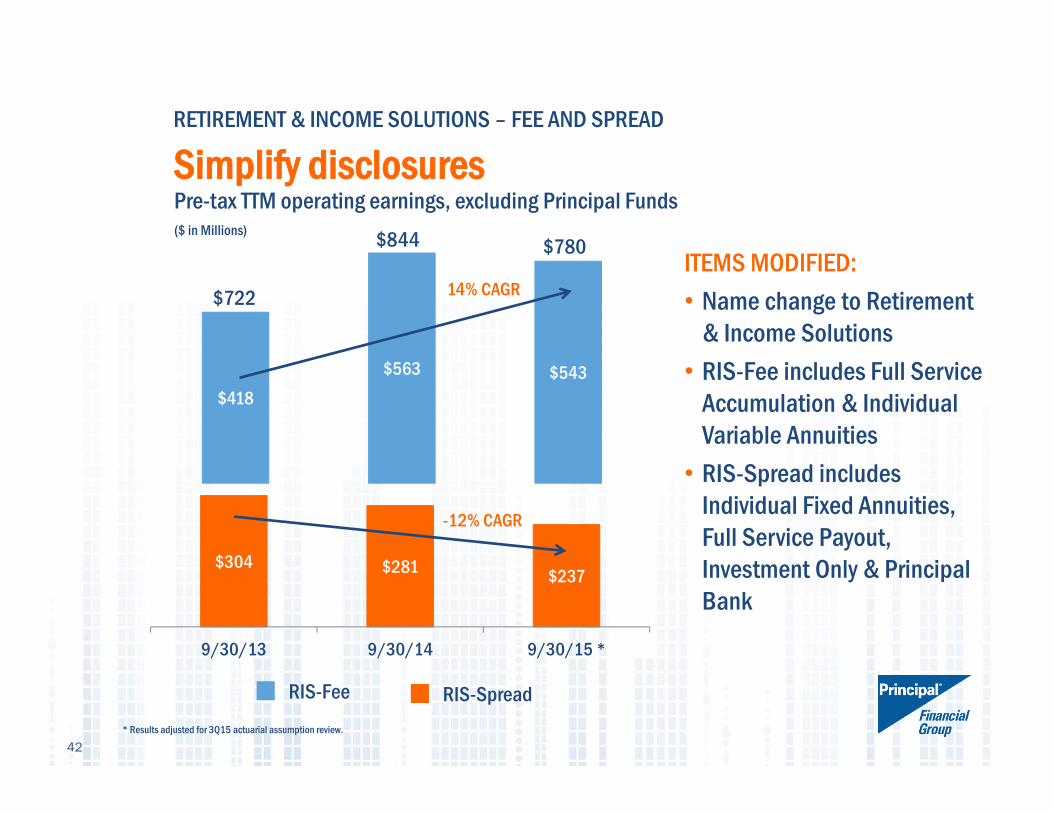
Pre-tax TTM operating earnings, excluding Principal Funds($ in Millions)
$418$563 $543
RETIREMENT & INCOME SOLUTIONS – FEE AND SPREAD
Simplify disclosures
$304 $281 $237
9/30/13 9/30/14 9/30/15 *
RIS-Fee RIS-Spread
14% CAGR
-12% CAGR
$722
$844 $780
42* Results adjusted for 3Q15 actuarial assumption review.
ITEMS MODIFIED:• Name change to Retirement
& Income Solutions• RIS-Fee includes Full Service
Accumulation & Individual Variable Annuities• RIS-Spread includes
Individual Fixed Annuities, Full Service Payout, Investment Only & Principal Bank
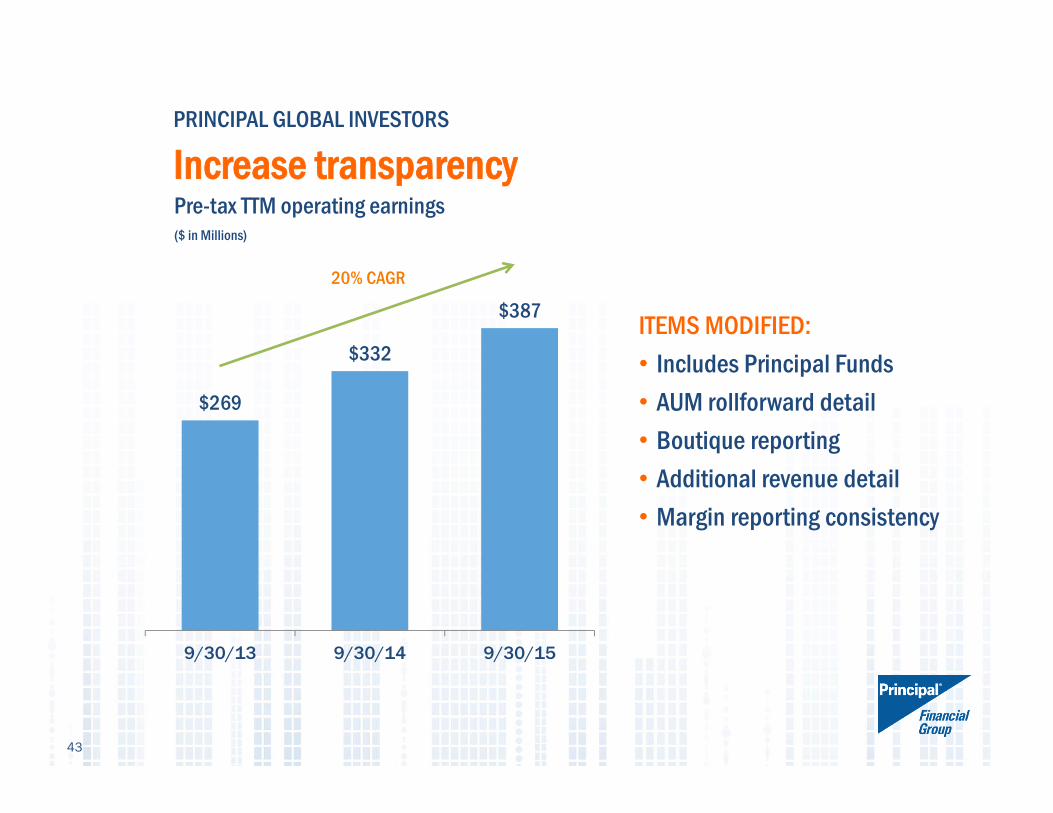
$269
$332
$387
9/30/13 9/30/14 9/30/15
PRINCIPAL GLOBAL INVESTORS
Increase transparency
ITEMS MODIFIED:• Includes Principal Funds• AUM rollforward detail• Boutique reporting • Additional revenue detail• Margin reporting consistency
Pre-tax TTM operating earnings($ in Millions)
43
20% CAGR
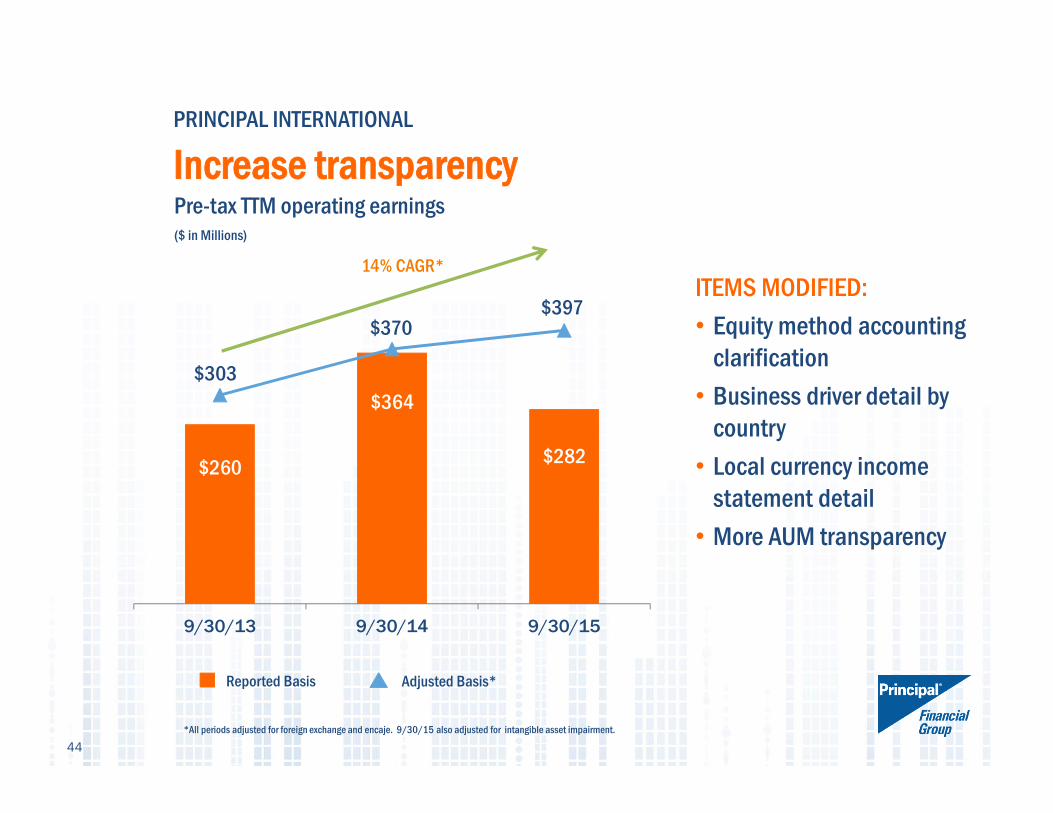
$260
$364
$282
$303
$370$397
9/30/13 9/30/14 9/30/15
ITEMS MODIFIED:• Equity method accounting
clarification• Business driver detail by
country• Local currency income
statement detail• More AUM transparency
PRINCIPAL INTERNATIONAL
Increase transparencyPre-tax TTM operating earnings($ in Millions)
Reported Basis
44*All periods adjusted for foreign exchange and encaje. 9/30/15 also adjusted for intangible asset impairment.
Adjusted Basis*
14% CAGR*
Alignment of Disclosures
ALIGNMENT GOING FORWARD• 3Q 2015 supplement new format available online• 4Q 2015 only presented in new format
2016 OUTLOOK CALL IN NEW FORMAT• December 3, 2015
REPORTING• Fee, Spread, and Risk
45

INVESTOR WORKSHOP
Q&A Panel
Appendix - sources
47
Slide 8 – Sources for left side chart: Asset Management 2020: A Brave New World, PwC, 2014; The age of asset management? Speech by Andrew G Haldane, Executive Director, Financial Stability, Bank of England, at the London Business School, London, 4 April 2014.) Sources for right side chart: http://www.cebr.com/reports/world-economic-league-table-2015/Slide 9 - Retirement Markets 2015, Retirement Research Inc., April 2015Slide 10 – Sources: 1Pensions & Investments, “The Best Places to Work in Money Management among companies with our size category”, PFG recognition 12/08/2014. 2Asociacion de Administradóras de FondosMutuos De Chile, 10/2014. 3 In the United States. Strategic Insight Lifecycle FlowWatch report July 2015. 4Managers ranked by total worldwide real estate assets (net of leverage), as of June 30, 2015. “Largest Real Estate Managers”, PENSIONS & INVESTMENTS, October 19, 2015. 5Managers ranked by U.S. institutional, tax-exempt assets managed internally, as of 12/31/14, “Largest Money Managers”, Pensions & Investments, May 2015. 6Commercial Property Executive Published April 2015 “2015 Greenest CRE Companies” list”. 7
PLANSPONSOR Recordkeeping Survey, June 2015. 8 AUM among multi-country pension providers. 9CONSAR & PROCESAR, October 2014. 10Fenaprevi, March 2015. 11Towers Watson. Based on AUM as of 09/2014. 12PLANSPONSOR Defined Benefit Administration Survey, May 2015. 13 PLANSPONSOR Recordkeeping Survey, June 2015. 14PLANSPONSOR NQDC Buyer’s Guide, July 2015. 15LIMRA 2014 survey: Non-medical based on fully insured employer contracts in force. 16 LIMRA 2015 survey: Individual Disability Insurance (IDI) rank based on in-force policiesSlide 11 & 22 - Principal “I” shares; if no “I” share class then “A” share class; separate accounts use “R6” rate level; Includes Principal mutual funds, separate accounts and collective investment trusts (CITs); Excludes money market, stable value and U.S. Property separate account.
EXECUTIVE BIOGRAPHIES
MIKE BEER is president and CEO, Principal Funds and chairman and CEO of Principal Trust Company™.
He is president of Principal Management Corporation, which serves as investment adviser for Principal Funds. He also serves as a director for Principal Funds. Mike joined the company in 1989 as an accounting manager. He was elected an officer and named financial officer in 1990 for Princor Financial Services Corporation, a member company of the Principal Financial Group®, vice president and financial officer in 1995, senior vice president and chief operating officer in 1998, and executive vice president and chief operating officer in 1999. In 2005, Mike was promoted to president of Princor Financial Services. He was then elected as a director for the Principal Funds mutual fund family in June 2012 and named president and CEO, Principal Funds in 2015.
Prior to joining the Principal Financial Group, Mike was an accounting manager for Norwest Mortgage and a senior accountant for Deloitte Haskins & Sells. He received his bachelor’s degree in accounting in 1983 from the University of Northern Iowa and passed the certified public accountant exam in 1984. Mike is a member of the American Institute of Certified Public Accountants and the Iowa Society of Certified Public Accountants.
JOHN EGAN is vice president, Investor Relations with the Principal Financial Group. John joined The Principal® in 2010. Prior to joining the company, he most recently served as vice president, Investor Relations with Assurant Inc., and vice president and financial analyst with Assurant Asset Management. John earned his bachelor’s degree in accounting from Manhattan College and his M.B.A. in finance from St. John’s University. He serves as a board member of the Holy Family School, and is also a member of the National Investor Relations Institute (NIRI).
TIM HILL is vice president of Principal Funds Distributor and is the National Sales Director for the company.
Tim began his financial services career in 1993 as a Registered Representative with Edward Jones. Before joining Principal Funds in 2003, he was a senior vice president with Alliance Bernstein for five years. Tim has appeared on CNBC and contributed to articles published in both The New York Times and InvestmentNews.
Tim received a B.A. in Business Administration from Jamestown College.
DANIEL J. HOUSTON is president and CEO of the Principal Financial Group. He is responsible for overall management of the company.
Dan joined the company in 1984 in Dallas. He has held several management positions and was named senior vice president in 2000, executive vice president in 2006 and president of Retirement and Investor Services in 2008. He was named president and chief operating officer in 2014 before assuming his current role in 2015.Houston is a member of several boards, including Greater Des Moines Partnership, The American Council of Life Insurers (ACLI), Employee Benefits Research Institute (EBRI), Iowa State University Business School Dean’s Advisory Council, and Partnership for a Healthier America (PHA).
Dan received his bachelor’s degree from Iowa State University in 1984. He has appeared before the U.S. Senate Special Committee on Aging to discuss the importance of educating the workforce about the financial needs in retirement. Houston joined the joint forum of U.S. Senate Committees on Finance and Health, Education, Labor and Pensions to discuss “Private-Sector Retirement Savings Plans: What Does the Future Hold?” He also authored a chapter in “The Upside of Aging,” published by John Wiley & Sons in 2014, on the keys to achieving financial security in retirement.
EXECUTIVE BIOGRAPHIES
TERRANCE (TERRY) J. LILLIS is executive vice president and CFO of the Principal Financial Group.
Terry joined The Principal in 1982 as an actuarial student. He held various senior actuarial and management roles through 2000 when he was named chief financial officer – Retirement & Investor Services. He was promoted to senior vice president and chief financial officer for The Principal in 2008 and to his current title in 2014.
An Iowa native, Terry received a bachelor’s degree from Simpson College and a master’s degree from the University of Iowa. He is a member of the Iowa Actuaries Club, the American Academy of Actuaries and a member of the Society of Actuaries. He also serves on the Mercy Medical Center Board of Directors—Planning & Marketing and Finance Committees, the Simpson College Board of Trustees, the Henry B. Tippie College of Business Advisory
Board, and the Diocese of Des Moines and Catholic Charities Finance Council.
JIM MCCAUGHAN is president of global asset management and CEO of Principal Global Investors.
Jim oversees all global asset management activities, including developing global strategies and identifying and analyzing market opportunities. McCaughan has over 30 years of experience in the investment business and was most recently the CEO of the Americas division of Credit Suisse Asset Management, New York, N.Y. Prior to Credit Suisse, he was president and chief operating officer of Oppenheimer Capital in New York. Jim also speaks around the world, is frequently quoted by the financial news media, and appears regularly on CNBC and Bloomberg Television, among others.
McCaughan earned a degree in mathematics from the University of Cambridge in England. He is a Fellow of the Institute of Actuaries.

BARBARA A. MCKENZIE is senior executive director – COO & boutique operations at Principal Global Investors.
She is responsible for three boutiques: Principal Global Equities, Edge Asset Management and Morley Financial Services, Inc. In addition, she is responsible for the development and efficient operation of business processes to facilitate the growth of the firm globally. This includes oversight of compliance, operations and IT.
Barb joined the company in 1984 as a commercial real estate representative. She was promoted to regional administrator in 1988 and to senior regional administrator in 1990. She was elected an officer and named assistant director - Commercial Real Estate in 1993. In 1996 she was promoted to director – Research and Portfolio Management, to senior managing director in 1999, and to executive director – International
Investments in 2004.
Barb received her bachelor’s degree from the University of Iowa in Iowa City, and her master’s degree from Indiana University in Bloomington, Ind. She is a Fellow of the Life Office Management Institute.
ANDREA MULLER is executive director, International Distribution for Principal Global Investors and a member of the global operating committee.
Andrea is responsible for all sales, marketing, relationship management and client service activities in Asia Pacific, including Japan and Australia, as well as Europe, Latin America and the Middle East. Prior to that Andrea was Chief Executive, Asia and had responsibility for Asia including the Singapore, Hong Kong, China and Dubai offices.
Andrea also leads the asset management aspects of The Principal regional joint ventures in China and Malaysia. Andrea joined the firm in 2010 after years of experience with large multinational firms including Head of Fitch Ratings Asia Pacific, Managing Director at UBS in both Singapore and France, and European Partner at
Shearman & Sterling.
Andrea received a juris doctorate from Georgetown Law Center, a Bachelor of Science degree from Georgetown University’s School of Foreign Service and a Master in European Union studies from the College d’Europe in Belgium. Andrea served on the Board of the Asia Securities and Financial Markets Association (ASIFMA), on the Exco of the Investment Management Association (Singapore) and the Board of Governors of the American Chamber of Commerce (Singapore). She has additional language skills in French.

EXECUTIVE BIOGRAPHIES
ELLEN SHUMWAY is senior executive director of strategy and boutique operations at Principal Global Investors. Ellen joined The Principal in 2005 as vice president-corporate strategic development. Ellen currently leads the development of the firm’s affiliate businesses and oversees their operations, marketing and governance. Ellen also advises on the sales collaboration between the firm’s institutional advisory services group and the affiliates. Her background includes 15 years at McKinsey & Company, Chicago, as a partner and leader in the firm’s North American insurance practice. Previously, she was an assistant treasurer at J.P. Morgan & Company, Inc. Ellen received an MBA from the University of Chicago and a bachelor’s degree from Johns Hopkins University.


![Investor Presentation Sep 2020 - Home Loan Company in India · Ticket Size [at disbursement] [₹ Lakh] Sold Down Principal [₹ r] Months on Book Pool Principal [₹ r] Amortisation](https://img.pdfslide.us/doc/110x75/607225a6414044566409cf42/investor-presentation-sep-2020-home-loan-company-in-india-ticket-size-at-disbursement.jpg)