Embed Size (px)
Citation preview
Deutsche Bank
PBC Investor & Analyst Workshop
Strategy session
PBC Investor & Analyst Workshop15 June 2011
Deutsche BankInvestor Relations
financial transparency.
Deutsche Bank
PBC: Strategy and ambitionRainer NeskeMember of the Management Board Head of Private & Business ClientsHead of Private & Business Clients
PBC Investor & Analyst Workshop15 June 2011
Deutsche BankInvestor Relations
financial transparency.
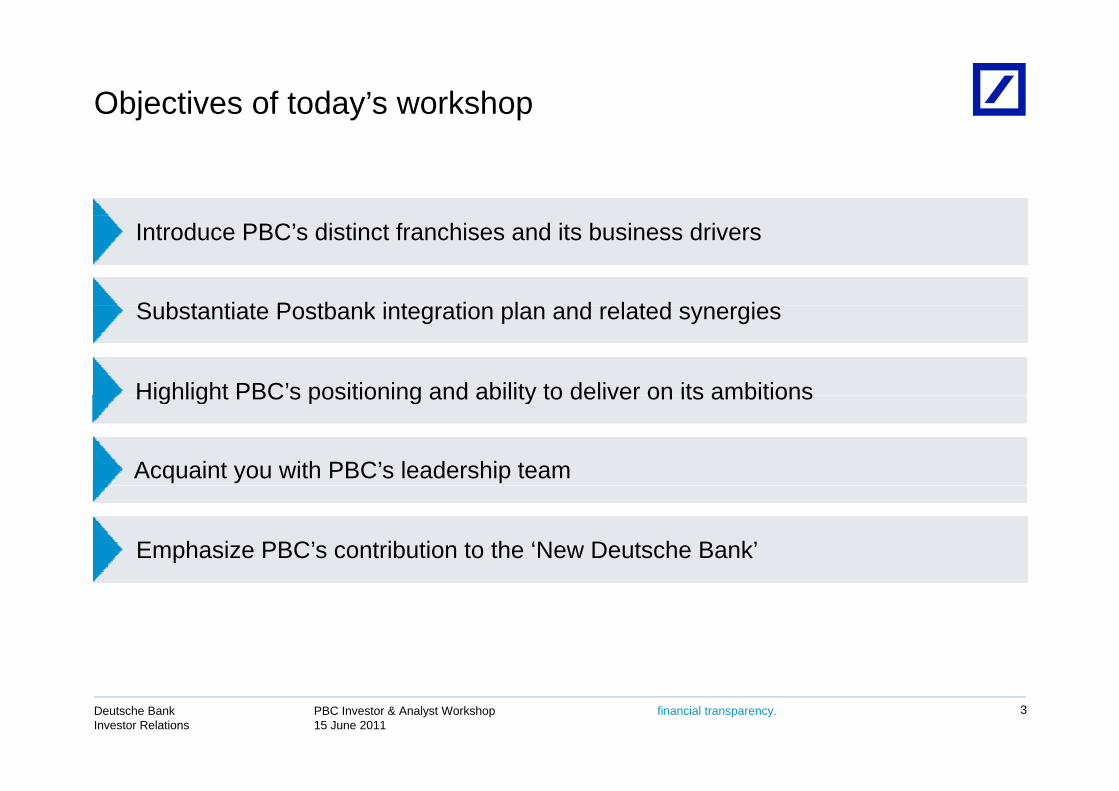
Objectives of today’s workshop
S b t ti t P tb k i t ti l d l t d i
Introduce PBC’s distinct franchises and its business drivers
Substantiate Postbank integration plan and related synergies
Highlight PBC’s positioning and ability to deliver on its ambitionsHighlight PBC s positioning and ability to deliver on its ambitions
Acquaint you with PBC’s leadership team
Emphasize PBC’s contribution to the ‘New Deutsche Bank’
PBC Investor & Analyst Workshop15 June 2011
Deutsche BankInvestor Relations
financial transparency. 3
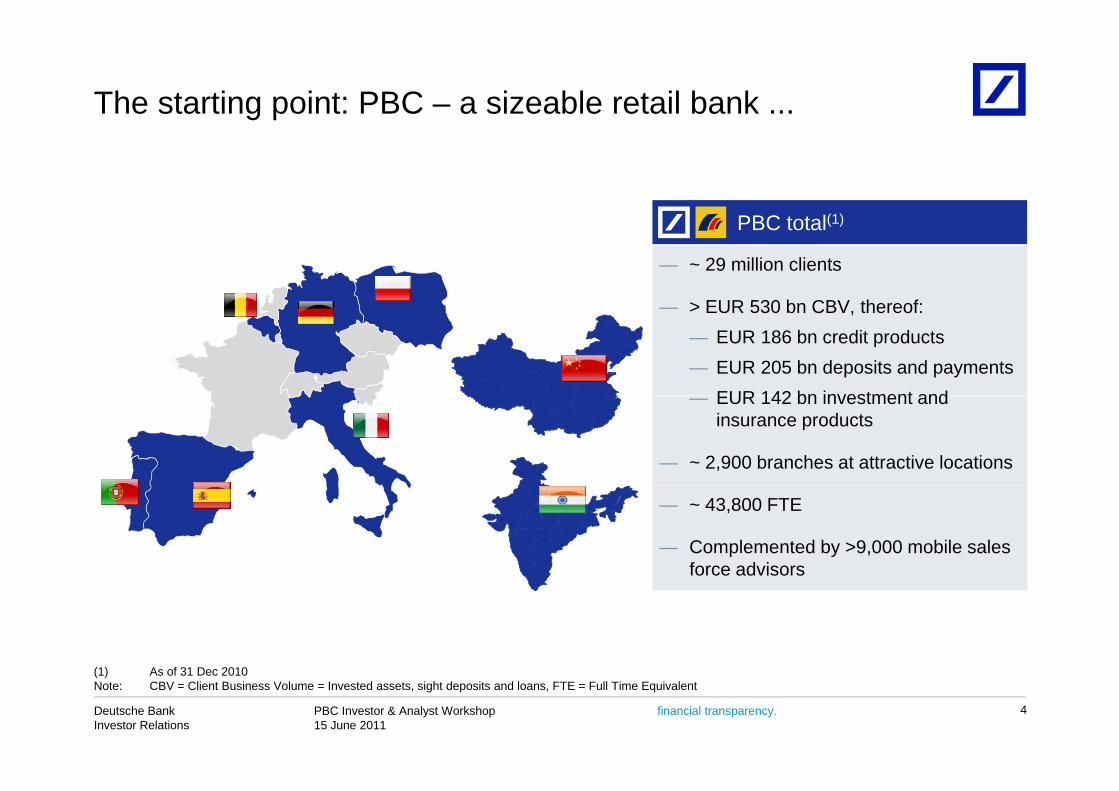
The starting point: PBC – a sizeable retail bank ...
PBC t t l(1)PBC total(1)
— ~ 29 million clients
> EUR 530 bn CBV thereof:— > EUR 530 bn CBV, thereof:— EUR 186 bn credit products— EUR 205 bn deposits and payments
EUR 142 bn investment and— EUR 142 bn investment and insurance products
— ~ 2,900 branches at attractive locations
— ~ 43,800 FTE
— Complemented by >9,000 mobile sales force advisorsforce advisors
PBC Investor & Analyst Workshop15 June 2011
Deutsche BankInvestor Relations
financial transparency. 4
(1) As of 31 Dec 2010Note: CBV = Client Business Volume = Invested assets, sight deposits and loans, FTE = Full Time Equivalent
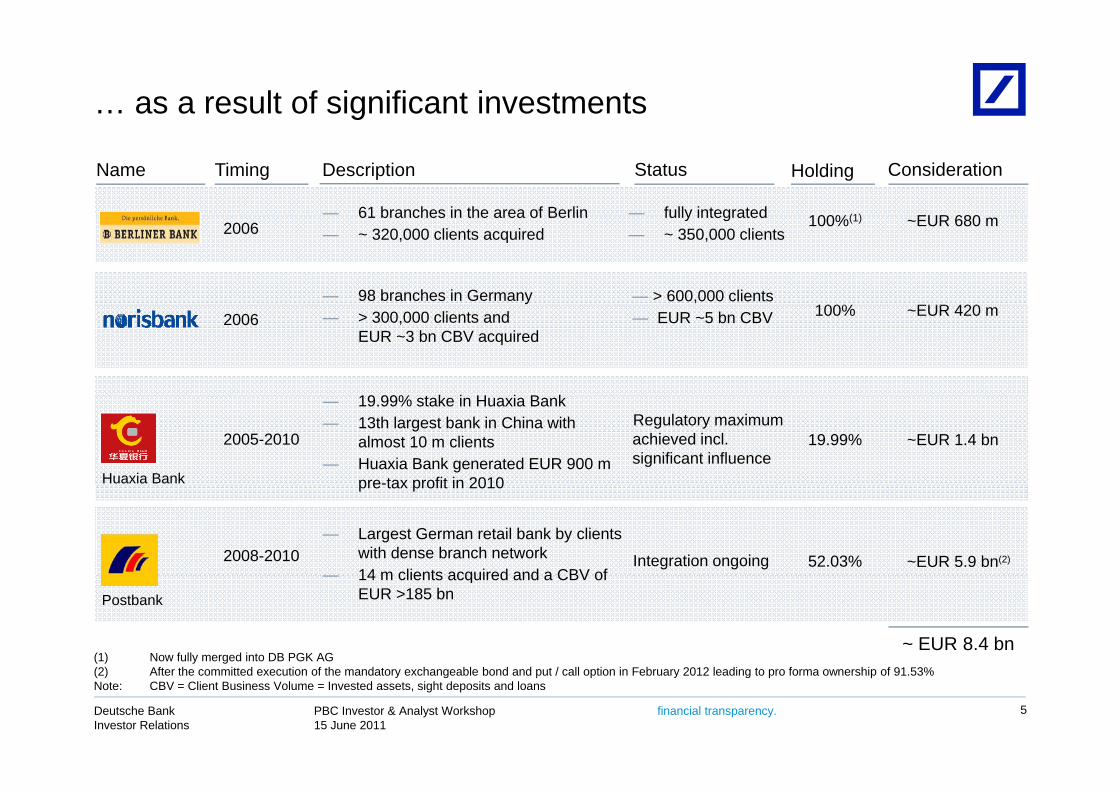
… as a result of significant investments
— 61 branches in the area of Berlin
Name Timing Description Holding Consideration
EUR 680100%(1)
Status
— fully integrated61 branches in the area of Berlin— ~ 320,000 clients acquired
— 98 branches in Germany
2006 ~EUR 680 m
EUR 420
100%(1)
100%
fully integrated— ~ 350,000 clients
— > 600,000 clients
19 99% t k i H i B k
— > 300,000 clients and EUR ~3 bn CBV acquired
2006 ~EUR 420 m100%— EUR ~5 bn CBV
— 19.99% stake in Huaxia Bank— 13th largest bank in China with
almost 10 m clients— Huaxia Bank generated EUR 900 m
pre-tax profit in 2010
2005-2010 ~EUR 1.4 bn19.99%Regulatory maximum achieved incl. significant influence
Huaxia Bank pre tax profit in 2010
— Largest German retail bank by clients with dense branch network14 m clients acquired and a CBV of
2008-2010 ~EUR 5.9 bn(2)52.03%Integration ongoing
(1) Now fully merged into DB PGK AG
— 14 m clients acquired and a CBV of EUR >185 bn
~ EUR 8.4 bn
Postbank
PBC Investor & Analyst Workshop15 June 2011
Deutsche BankInvestor Relations
financial transparency.
(2) After the committed execution of the mandatory exchangeable bond and put / call option in February 2012 leading to pro forma ownership of 91.53%Note: CBV = Client Business Volume = Invested assets, sight deposits and loans
5
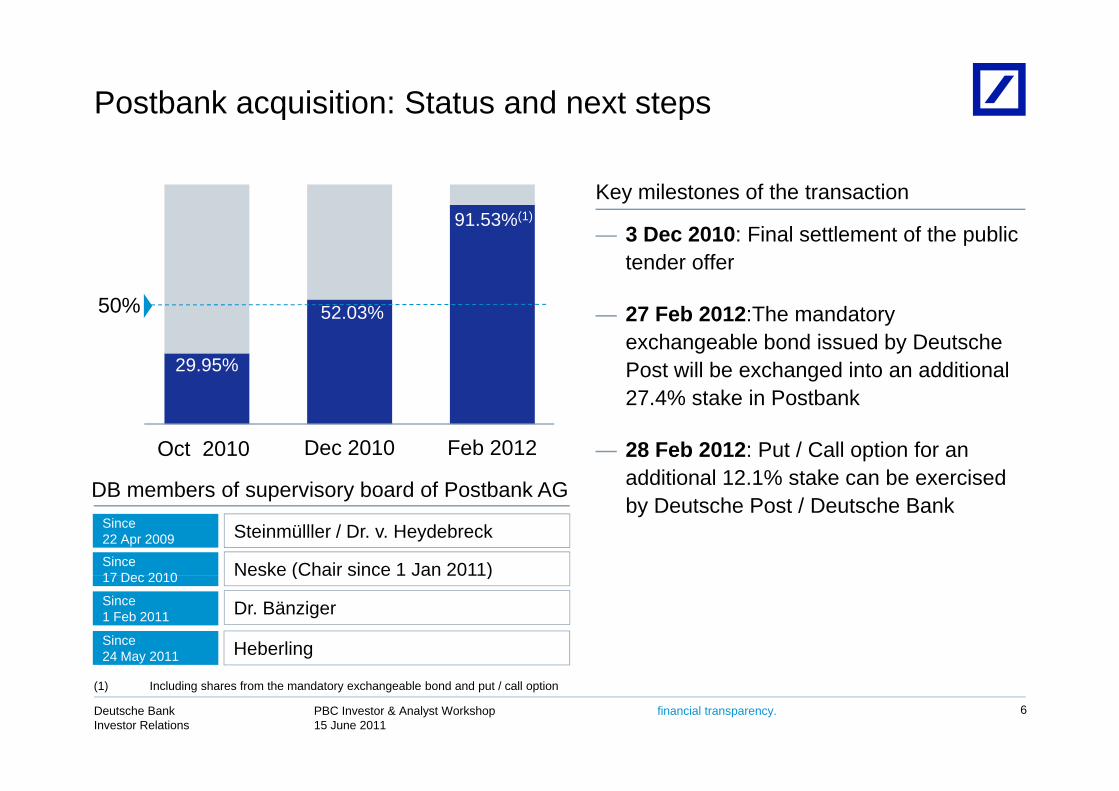
Postbank acquisition: Status and next steps
91 53%(1)
Key milestones of the transaction
52 03%
91.53%(1)
50%
— 3 Dec 2010: Final settlement of the public tender offer
29.95%
52.03%50% — 27 Feb 2012:The mandatory exchangeable bond issued by Deutsche Post will be exchanged into an additional 27 4% stake in Postbank
Oct 2010 Dec 2010 Feb 2012
DB b f i b d f P tb k AG
27.4% stake in Postbank
— 28 Feb 2012: Put / Call option for an additional 12.1% stake can be exercised DB members of supervisory board of Postbank AG
Since22 Apr 2009
Since17 Dec 2010
Steinmülller / Dr. v. Heydebreck
Neske (Chair since 1 Jan 2011)
%by Deutsche Post / Deutsche Bank
Since1 Feb 2011
17 Dec 2010
Dr. Bänziger
Neske (Chair since 1 Jan 2011)
Since24 May 2011 Heberling
PBC Investor & Analyst Workshop15 June 2011
Deutsche BankInvestor Relations
financial transparency. 6
(1) Including shares from the mandatory exchangeable bond and put / call option
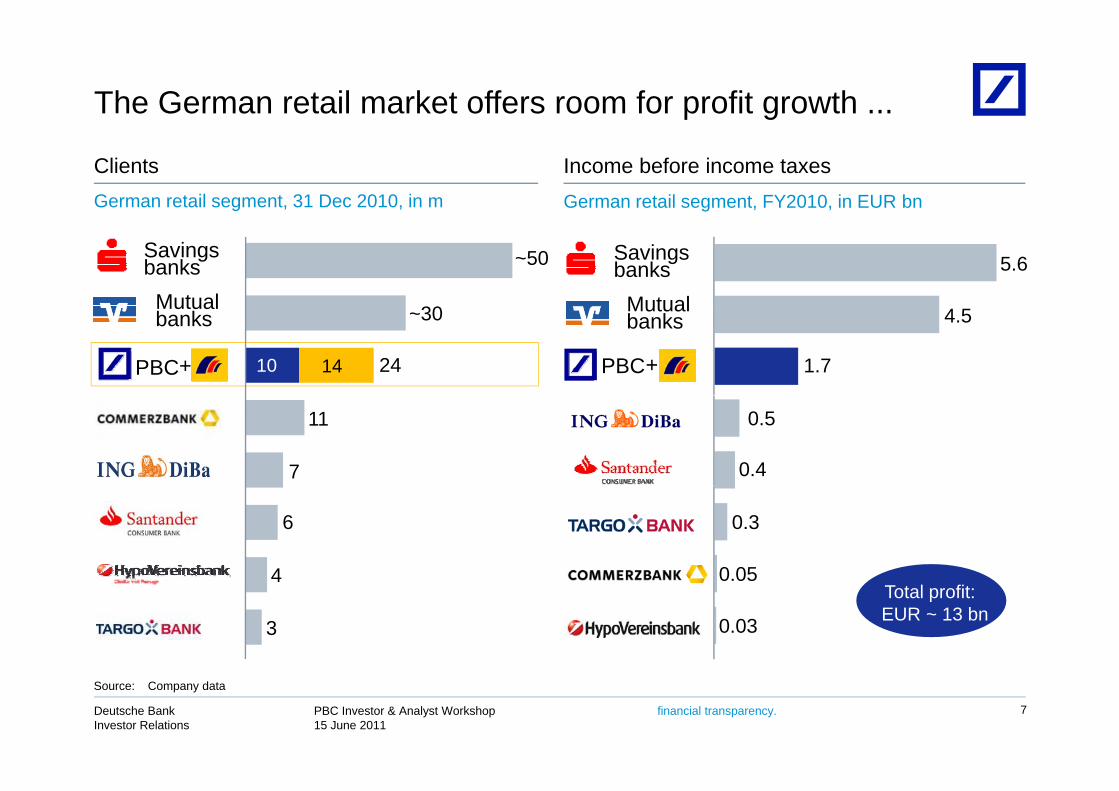
The German retail market offers room for profit growth ...
German retail segment, 31 Dec 2010, in m
Clients Income before income taxesGerman retail segment, FY2010, in EUR bn
Savingsbanks
Mutual
5.6~50SavingsbanksMutual
+
Mutualbanks
PBC
4.5
1.7PBC+
~30
14 2410
Mutualbanks
0.5
0.47
11
0.3
0 054
6
Total profit: EUR ~ 13 bn
0.05
0.033
4
PBC Investor & Analyst Workshop15 June 2011
Deutsche BankInvestor Relations
financial transparency. 7
Source: Company data

... not at least due to the sound economic environment
German wealth at an all-time high Declining unemployment rate
Euro zoneGermanyIn %Financial assets of German households, in EUR trillion
111098
5
4.5
765
2005 2006 2007 2008 2009 2010 1Q2011
4
3.52005 2006 2007 2008 2009 2010
Real GDP growthIn %
Industry & consumer sentiment trending upwardsIfo (lhs) GfK (rhs)
3.5 3.42.5
1.72.0 2.0
6.0
8.0
10.0
90100110120
2010 2011F
Germany
2010
Euro zone
2012F 2011F 2012F0.0
2.0
4.0
60708090
2006 2007 2008 2009 2010 1Q
PBC Investor & Analyst Workshop15 June 2011
Deutsche BankInvestor Relations
financial transparency. 8
2011Source: OECD

We will leverage our position as a leading European player
Total retail segment, FY2010, in EUR bn
Revenues Income before income taxesTotal retail segment, FY2010, in EUR bn
37.6
23.3
10.9
4.8
13.4
10.8
2.9
2.4
10.3
9.2PBC + PBC +
2.2
1.8
6.6
6.5
3 8
1.4
1.13.8
3.20.4
0.05
PBC Investor & Analyst Workshop15 June 2011
Deutsche BankInvestor Relations
financial transparency. 9
Source: Company data
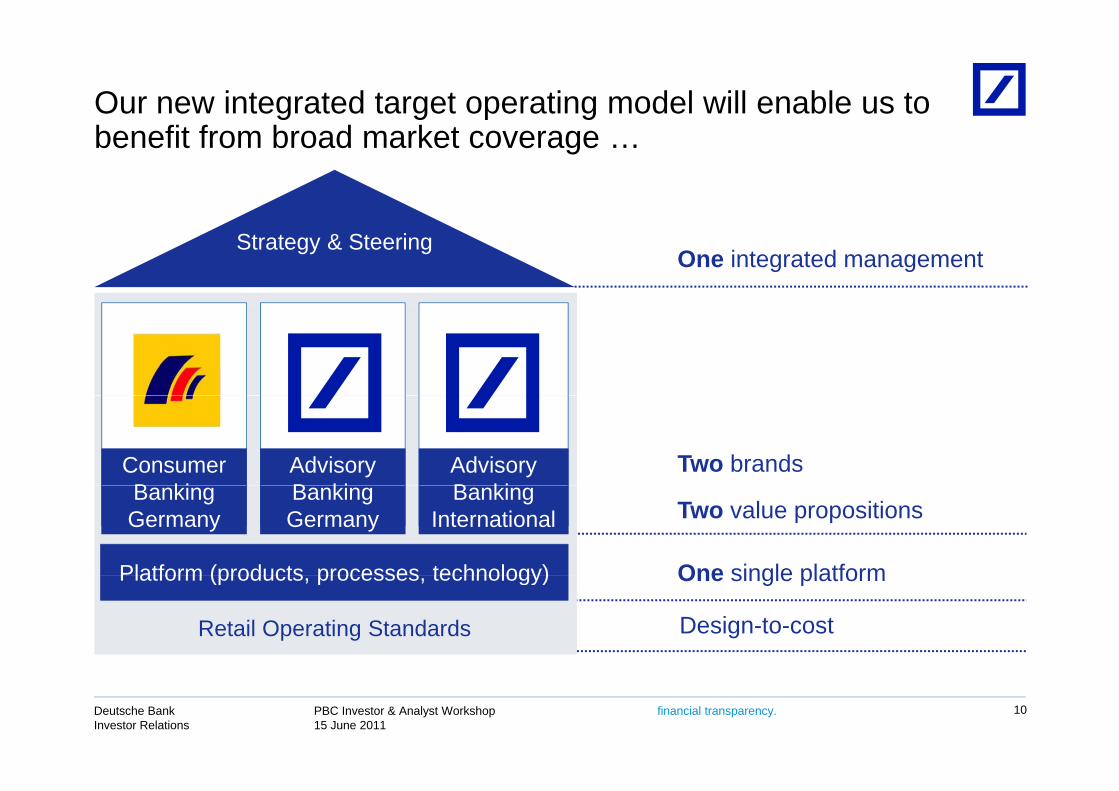
Our new integrated target operating model will enable us to b fit f b d k tbenefit from broad market coverage …
One integrated managementStrategy & Steering
Two brandsConsumer B ki
AdvisoryB ki
Advisory B ki
One single platform
Two value propositions
Platform (products processes technology)
Banking Germany
Banking Germany
Banking International
One single platformPlatform (products, processes, technology)
Retail Operating Standards Design-to-cost
PBC Investor & Analyst Workshop15 June 2011
Deutsche BankInvestor Relations
financial transparency. 10
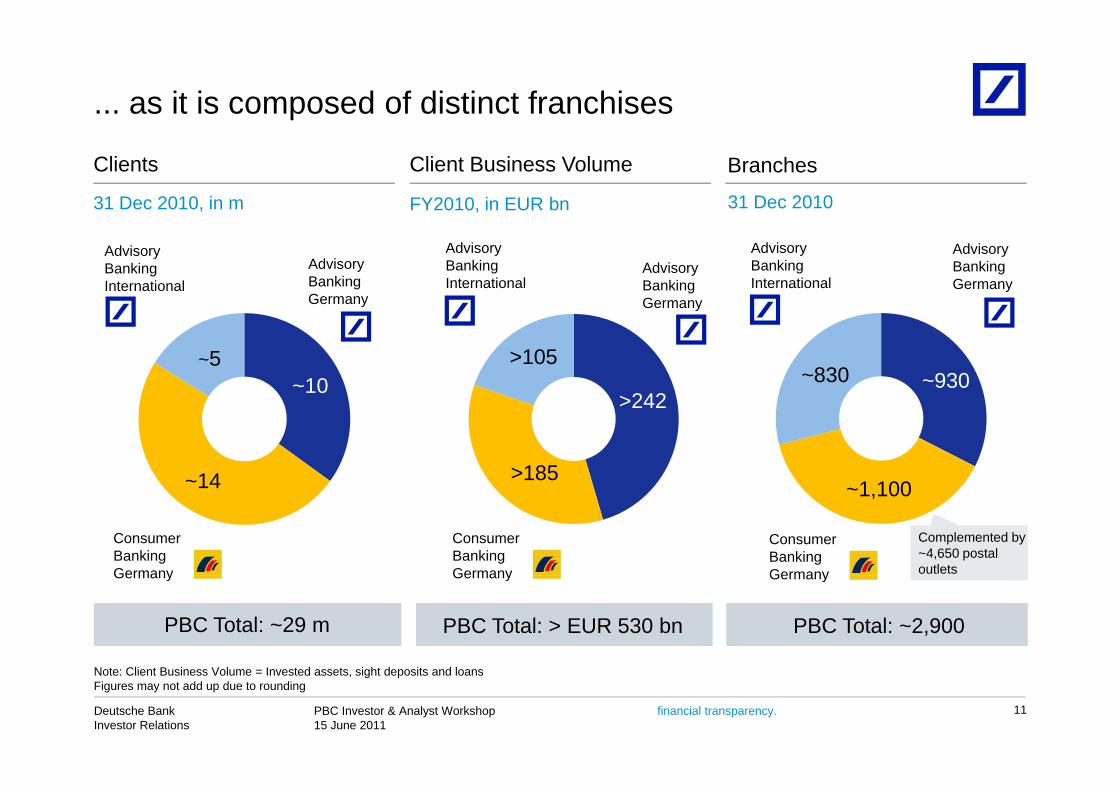
... as it is composed of distinct franchises
Clients Client Business Volume Branches
31 Dec 2010, in m FY2010, in EUR bn 31 Dec 2010
Advisory Banking Germany
Advisory Banking International
Advisory Banking International
Advisory Banking Germany
Advisory Banking Germany
Advisory Banking International
~10~5
Germanyy
>105
>242~830 ~930
~14
>242
>1851 10014
Consumer Banking Germany
Consumer Banking Germany
Consumer Banking Germany
~1,100
Complemented by ~4,650 postal outletsGermany GermanyGermany
PBC Total: ~29 m PBC Total: > EUR 530 bn PBC Total: ~2,900
PBC Investor & Analyst Workshop15 June 2011
Deutsche BankInvestor Relations
financial transparency. 11
Note: Client Business Volume = Invested assets, sight deposits and loansFigures may not add up due to rounding

PBC Executive Committee
CFOCOO
Sales Functions
Advisory Banking Advisory Banking
HeadRainer Neske
Products
Advisory Banking Germany
Advisory Banking International
CCO (Guest)
Roland FolzChristian Ricken
CRO PostbankCIO
Global Credit Products
Global Investment & Insurance Products
Products
Pedro Larena
Consumer Banking Germany
Thomas Rodermann
Tim RooneyThomas Rodermann (1)
Global Deposits& Payments
Christian SewingHanns-Peter Storr
Wolfgang Gaertner
HRCAO
Frank Strauss
Postbank
Ch i ti Ri k (1) Karl on RohrG ido He eldopSt f Jütt
PBC Investor & Analyst Workshop15 June 2011
Deutsche BankInvestor Relations
financial transparency.
Christian Ricken(1) Karl von RohrGuido HeuveldopStefan Jütte
12
(1) Acting
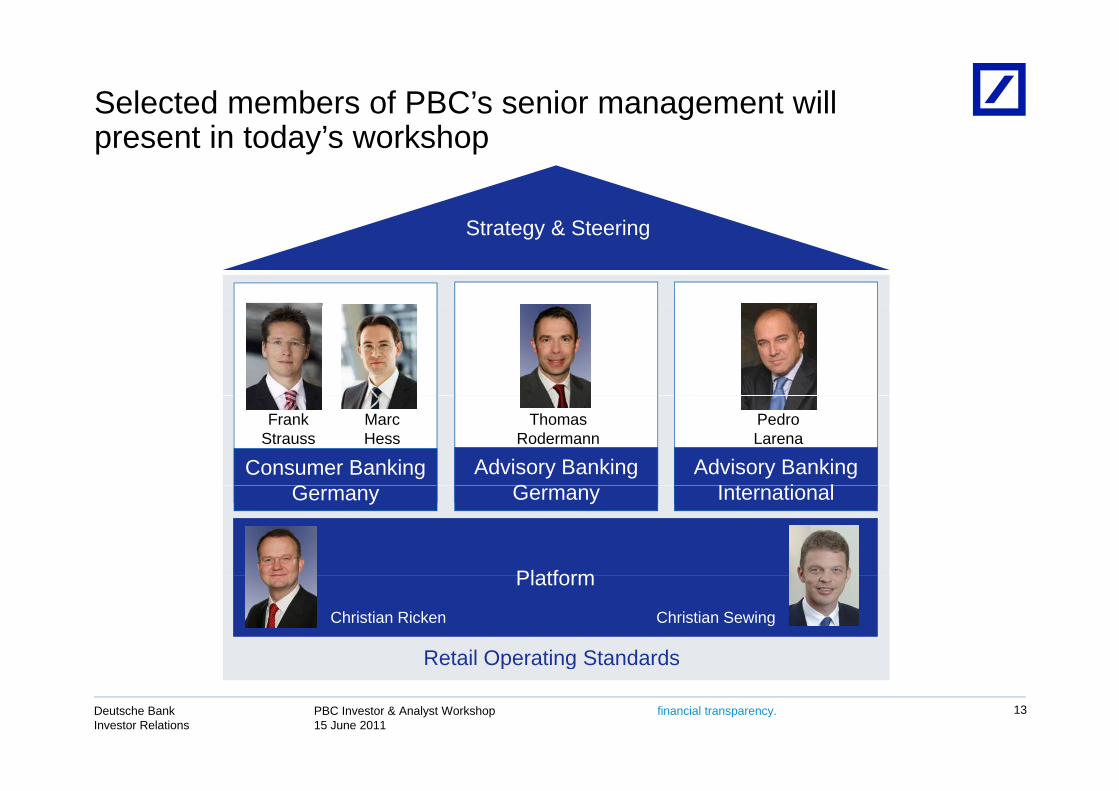
Selected members of PBC’s senior management will t i t d ’ k hpresent in today’s workshop
Strategy & Steering
Consumer Banking G
Advisory Banking G
Advisory BankingI t ti l
Marc Hess
Frank Strauss
Thomas Rodermann
Pedro Larena
Platform
Germany Germany International
Platform
Retail Operating Standards
Christian SewingChristian Ricken
PBC Investor & Analyst Workshop15 June 2011
Deutsche BankInvestor Relations
financial transparency.
Retail Operating Standards
13
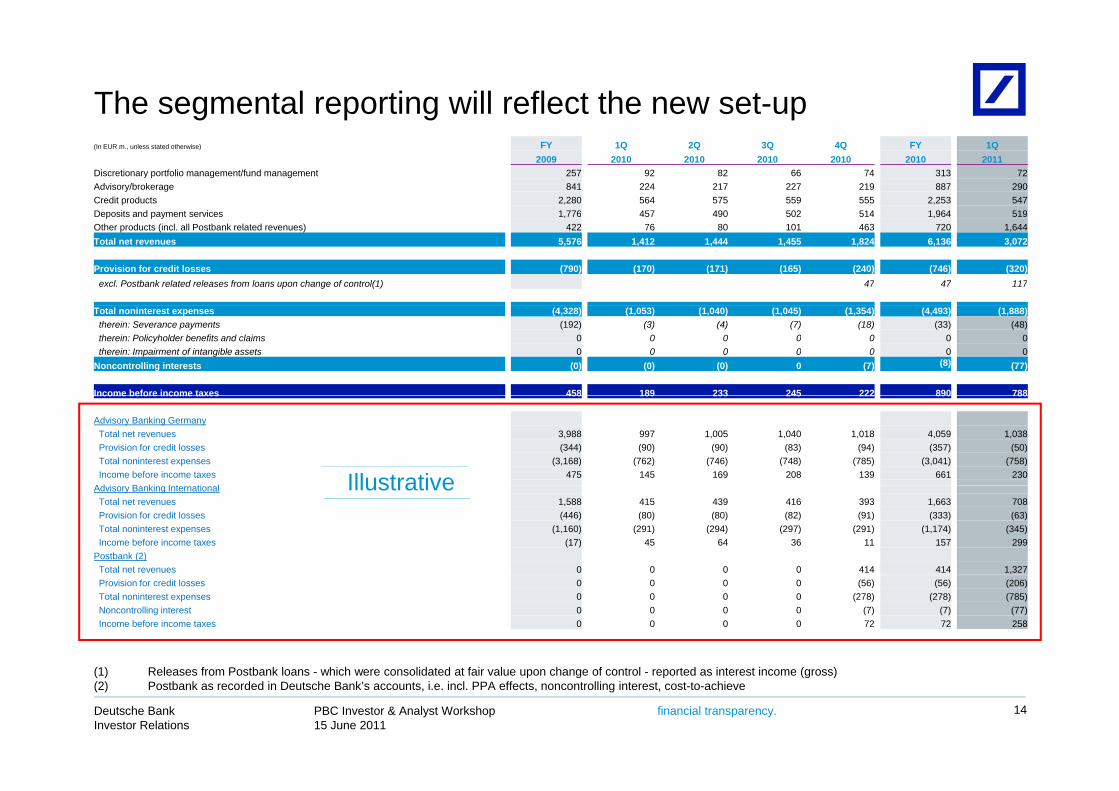
The segmental reporting will reflect the new set-up(In EUR m., unless stated otherwise) FY 1Q 2Q 3Q 4Q FY 1Q
2009 2010 2010 2010 2010 2010 2011Discretionary portfolio management/fund management 257 92 82 66 74 313 72Advisory/brokerage 841 224 217 227 219 887 290Credit products 2,280 564 575 559 555 2,253 547Deposits and payment services 1,776 457 490 502 514 1,964 519Deposits and payment services 1,776 457 490 502 514 1,964 519Other products (incl. all Postbank related revenues) 422 76 80 101 463 720 1,644Total net revenues 5,576 1,412 1,444 1,455 1,824 6,136 3,072
Provision for credit losses (790) (170) (171) (165) (240) (746) (320)excl. Postbank related releases from loans upon change of control(1) 47 47 117
Total noninterest expenses (4,328) (1,053) (1,040) (1,045) (1,354) (4,493) (1,888)therein: Severance payments (192) (3) (4) (7) (18) (33) (48)therein: Policyholder benefits and claims 0 0 0 0 0 0 0therein: Impairment of intangible assets 0 0 0 0 0 0 0
Noncontrolling interests (0) (0) (0) 0 (7) (8) (77)
Income before income taxes 458 189 233 245 222 890 788Income before income taxes 458 189 233 245 222 890 788
Advisory Banking GermanyTotal net revenues 3,988 997 1,005 1,040 1,018 4,059 1,038Provision for credit losses (344) (90) (90) (83) (94) (357) (50)Total noninterest expenses (3,168) (762) (746) (748) (785) (3,041) (758)Income before income taxes 475 145 169 208 139 661 230
Ad i B ki I t ti l IllustrativeAdvisory Banking InternationalTotal net revenues 1,588 415 439 416 393 1,663 708Provision for credit losses (446) (80) (80) (82) (91) (333) (63)Total noninterest expenses (1,160) (291) (294) (297) (291) (1,174) (345)Income before income taxes (17) 45 64 36 11 157 299
Postbank (2)Total net revenues 0 0 0 0 414 414 1,327
Illustrative
Provision for credit losses 0 0 0 0 (56) (56) (206)Total noninterest expenses 0 0 0 0 (278) (278) (785)Noncontrolling interest 0 0 0 0 (7) (7) (77)Income before income taxes 0 0 0 0 72 72 258
PBC Investor & Analyst Workshop15 June 2011
Deutsche BankInvestor Relations
financial transparency. 14
(1) Releases from Postbank loans - which were consolidated at fair value upon change of control - reported as interest income (gross)(2) Postbank as recorded in Deutsche Bank’s accounts, i.e. incl. PPA effects, noncontrolling interest, cost-to-achieve
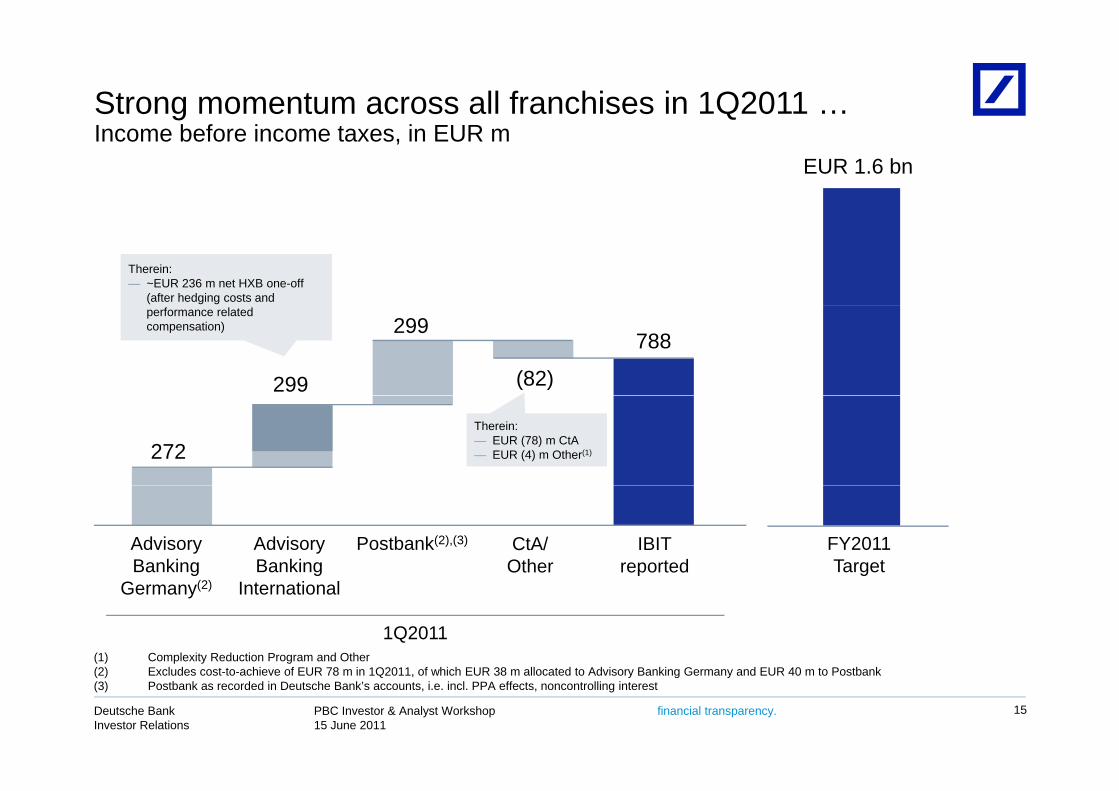
Strong momentum across all franchises in 1Q2011 …I b f i t i EURIncome before income taxes, in EUR m
EUR 1.6 bn
Therein:— ~EUR 236 m net HXB one-off
(after hedging costs and
788
299
299
(82)
performance related compensation)
272Therein:— EUR (78) m CtA— EUR (4) m Other(1)
Advisory Banking
Advisory Banking
Postbank(2),(3) IBITreported
CtA/Other
FY2011 Targetg
Germany(2)g
Internationalp g
1Q2011(1) Complexity Reduction Program and Other
PBC Investor & Analyst Workshop15 June 2011
Deutsche BankInvestor Relations
financial transparency. 15
(2) Excludes cost-to-achieve of EUR 78 m in 1Q2011, of which EUR 38 m allocated to Advisory Banking Germany and EUR 40 m to Postbank(3) Postbank as recorded in Deutsche Bank’s accounts, i.e. incl. PPA effects, noncontrolling interest
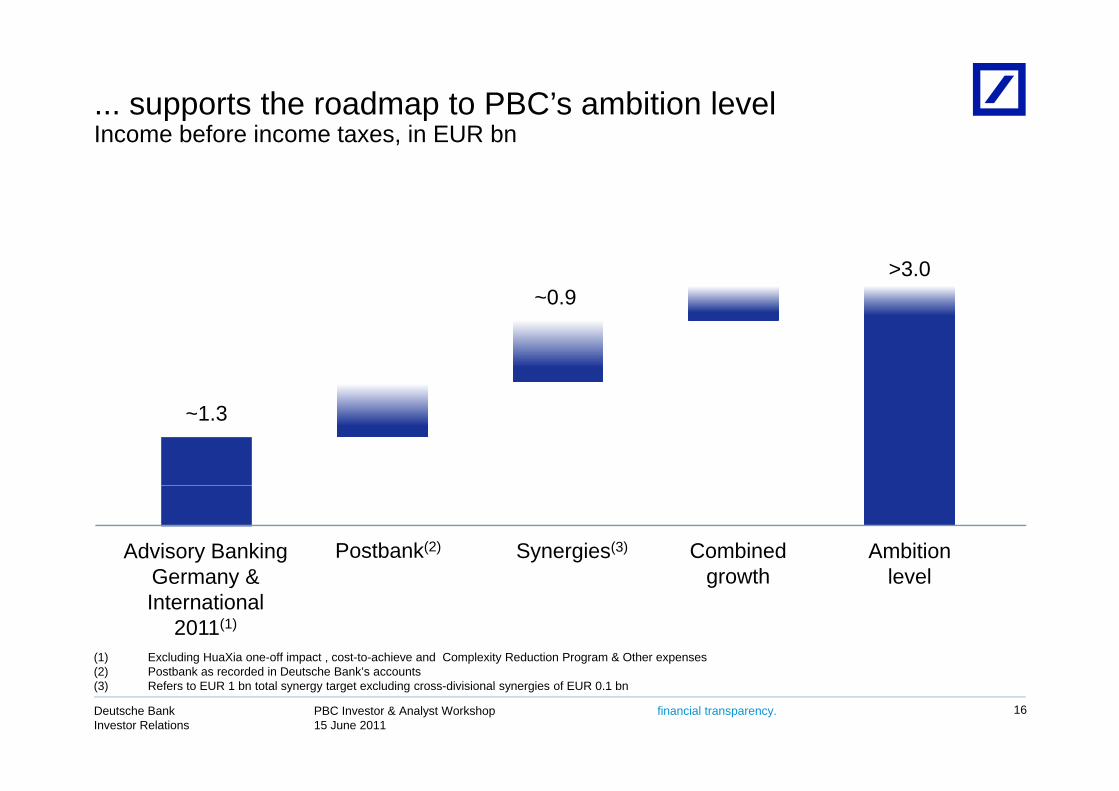
... supports the roadmap to PBC’s ambition levelI b f i t i EUR bIncome before income taxes, in EUR bn
~0.9>3.0
~1.3
Combined growth
Ambition level
Advisory Banking Germany &
Synergies(3)Postbank(2)
growth levelGermany & International
2011(1)
(1) Excluding HuaXia one-off impact , cost-to-achieve and Complexity Reduction Program & Other expenses
PBC Investor & Analyst Workshop15 June 2011
Deutsche BankInvestor Relations
financial transparency. 16
(2) Postbank as recorded in Deutsche Bank’s accounts(3) Refers to EUR 1 bn total synergy target excluding cross-divisional synergies of EUR 0.1 bn

Deutsche Bank
N Pl f &New Platform & Postbank Integration
Dr. Christian RickenCOO PBC
PBC Investor & Analyst Workshop15 June 2011
Deutsche BankInvestor Relations
financial transparency.
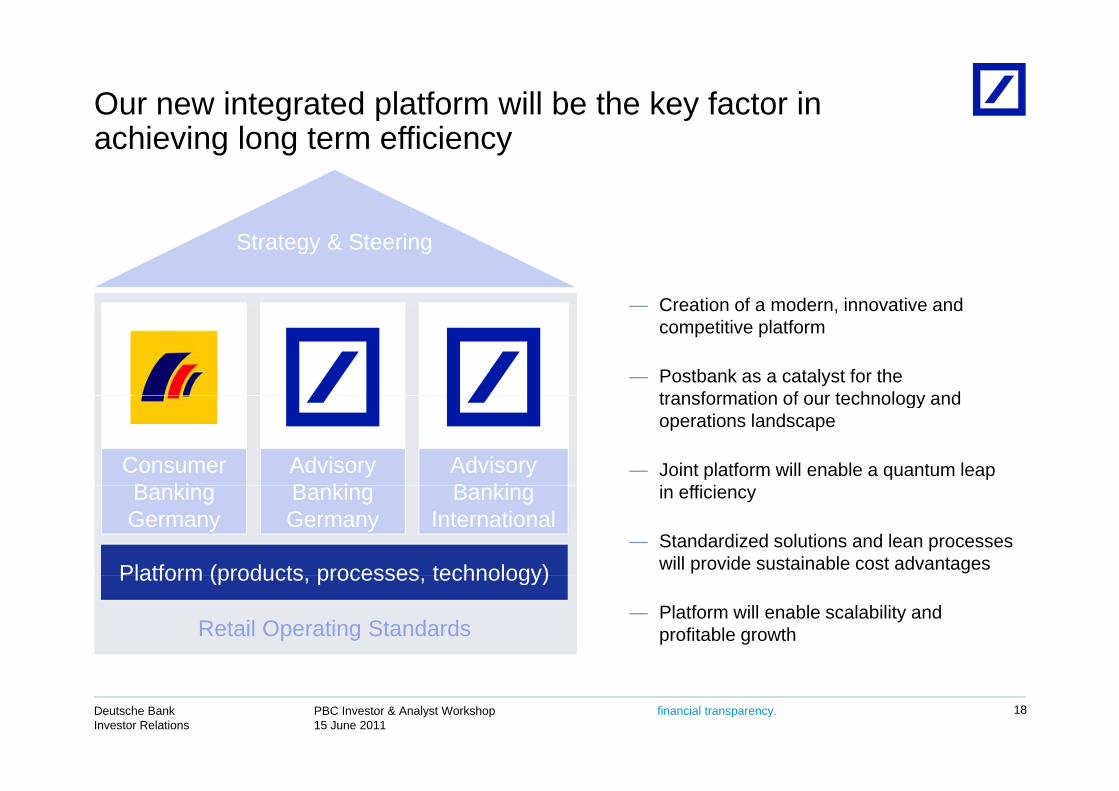
Our new integrated platform will be the key factor in hi i l ffi i
Target stateachieving long term efficiency
Strategy & Steering
— Creation of a modern innovative and— Creation of a modern, innovative and competitive platform
— Postbank as a catalyst for the transformation of our technology and
Consumer B ki
AdvisoryB ki
Advisory B ki
transformation of our technology and operations landscape
— Joint platform will enable a quantum leap i ffi i
Platform (products processes technology)
Banking Germany
Banking Germany
Banking International
in efficiency
— Standardized solutions and lean processes will provide sustainable cost advantages Platform (products, processes, technology)
Retail Operating Standards— Platform will enable scalability and
profitable growth
PBC Investor & Analyst Workshop15 June 2011
Deutsche BankInvestor Relations
financial transparency. 18
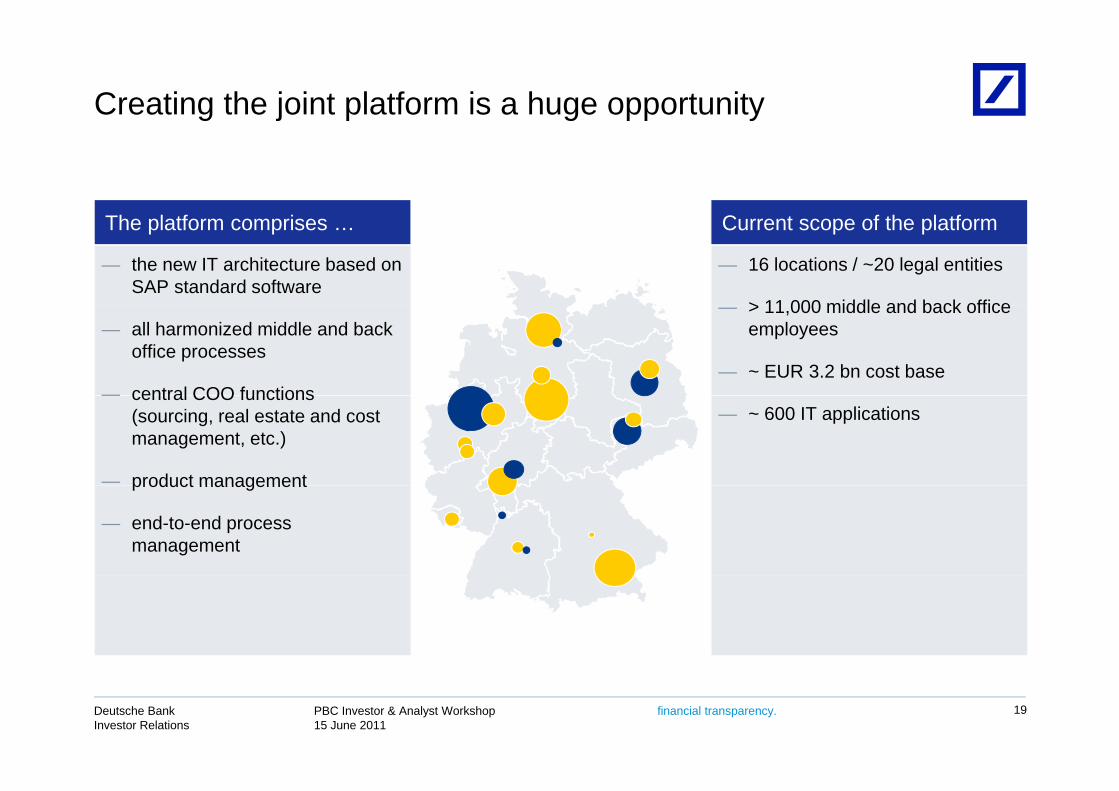
Creating the joint platform is a huge opportunity
C t f th l tfTh l tf i Current scope of the platform
— 16 locations / ~20 legal entities
> 11 000 middle and back office
The platform comprises …
— the new IT architecture based on SAP standard software
— > 11,000 middle and back office employees
— ~ EUR 3.2 bn cost base
— all harmonized middle and back office processes
— central COO functions— ~ 600 IT applications
— central COO functions (sourcing, real estate and cost management, etc.)
— product managementproduct management
— end-to-end process management
PBC Investor & Analyst Workshop15 June 2011
Deutsche BankInvestor Relations
financial transparency. 19
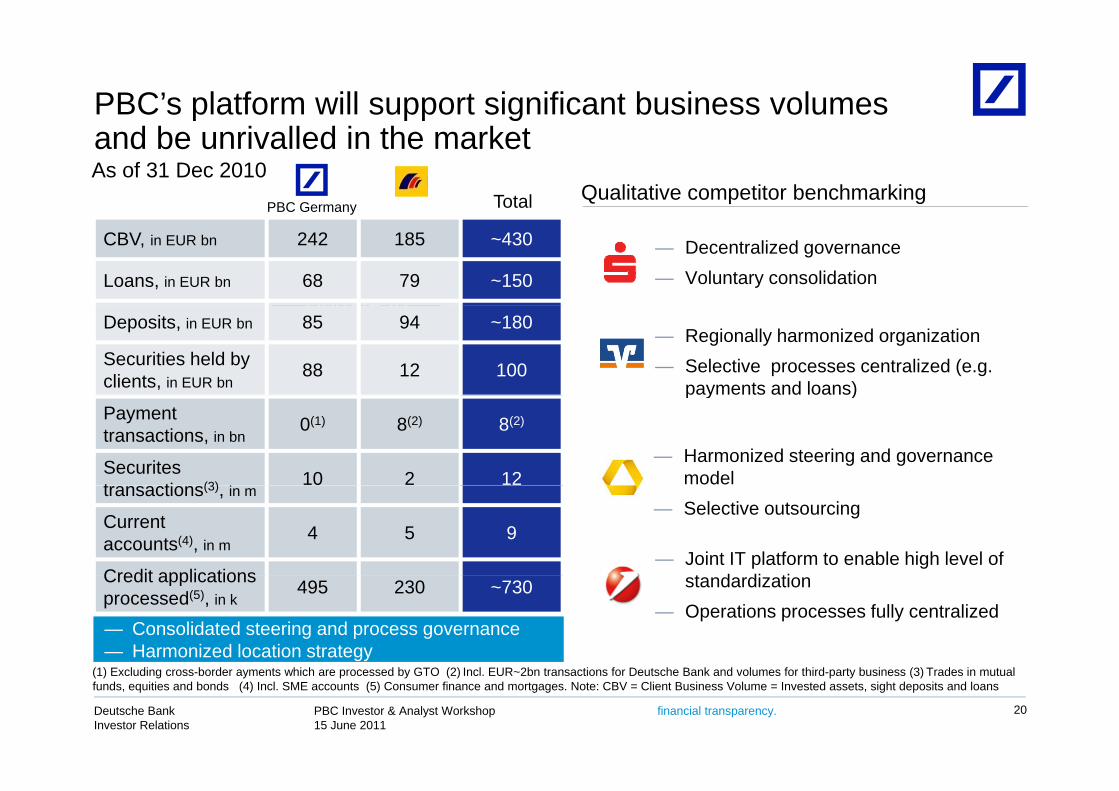
PBC’s platform will support significant business volumes d b i ll d i h kand be unrivalled in the market
TotalPBC GermanyQualitative competitor benchmarking
As of 31 Dec 2010
Update to
CBV, in EUR bn 242 185 ~430
Loans, in EUR bn 68 79 ~150
— Decentralized governance— Voluntary consolidation
Update tofollowDeposits, in EUR bn 85 94 ~180
Securities held byclients, in EUR bn
88 12 100
— Regionally harmonized organization— Selective processes centralized (e.g.
payments and loans)Payment transactions, in bn
0(1) 8(2) 8(2)
Securitest ti (3) 10 2 12
p y )
— Harmonized steering and governancemodeltransactions(3), in m
Currentaccounts(4), in m
4 5 9
Credit applications
— Selective outsourcing
— Joint IT platform to enable high level of t d di tiCredit applications
processed(5), in k495 230 ~730 standardization
— Operations processes fully centralized— Consolidated steering and process governance— Harmonized location strategy
PBC Investor & Analyst Workshop15 June 2011
Deutsche BankInvestor Relations
financial transparency. 20
(1) Excluding cross-border ayments which are processed by GTO (2) Incl. EUR~2bn transactions for Deutsche Bank and volumes for third-party business (3) Trades in mutual funds, equities and bonds (4) Incl. SME accounts (5) Consumer finance and mortgages. Note: CBV = Client Business Volume = Invested assets, sight deposits and loans
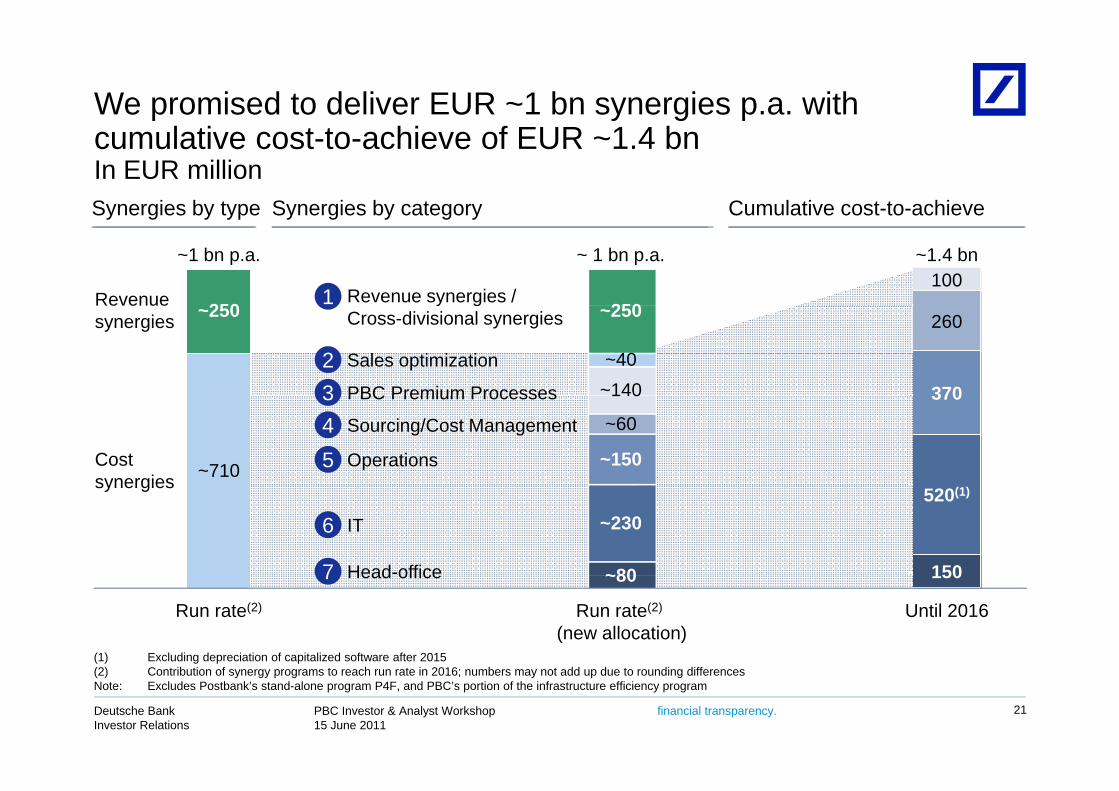
We promised to deliver EUR ~1 bn synergies p.a. with l i hi f EUR 1 4 bcumulative cost-to-achieve of EUR ~1.4 bn
In EUR millionSynergies by type Synergies by category Cumulative cost-to-achieve
Revenue
~1 bn p.a.
250100
~1.4 bn
Revenue synergies / 1
~ 1 bn p.a.
250
y g y yp y g y g y
synergies ~250
370
260
Sales optimization
PBC Premium Processes
y gCross-divisional synergies
23 ~140
~40
~250
Costsynergies ~710
370
(1)
Operations
PBC Premium Processes
Sourcing/Cost Management
345 ~150
~60
140
synergies520(1)(1)
150Head-office
IT6
7 ~80
~230
Run rate(2) Until 2016
150Head office7
Run rate(2)
(new allocation)
~80
(1) Excluding depreciation of capitalized software after 2015
PBC Investor & Analyst Workshop15 June 2011
Deutsche BankInvestor Relations
financial transparency. 21
(2) Contribution of synergy programs to reach run rate in 2016; numbers may not add up due to rounding differencesNote: Excludes Postbank’s stand-alone program P4F, and PBC’s portion of the infrastructure efficiency program

Revenue synergies (incl. cross divisional synergies and l i ) i ld l EUR 2 0
1sales cooperation) to yield at least EUR 250 m
Run rate target of ~EUR 250 m Key levers
In EUR m — Deepening successful cooperation in investment products
L hi i i t i k t
Current FCOriginal plan
250(1)— Launching aggressive campaigns to gain market
share in traditional banking products
— Leveraging synergy potential from joint product
12090
sourcing from 3rd party providers
— Enlarging active sales force capacity in branches
Leveraging funding benefit from higher
Non-PBC
90 — Leveraging funding benefit from higher share of stable revenues and retail deposits
PBC
ForecastPlan Run rate2011 2013
PBC Investor & Analyst Workshop15 June 2011
Deutsche BankInvestor Relations
financial transparency. 22
(1) Split between PBC and Group to be further defined
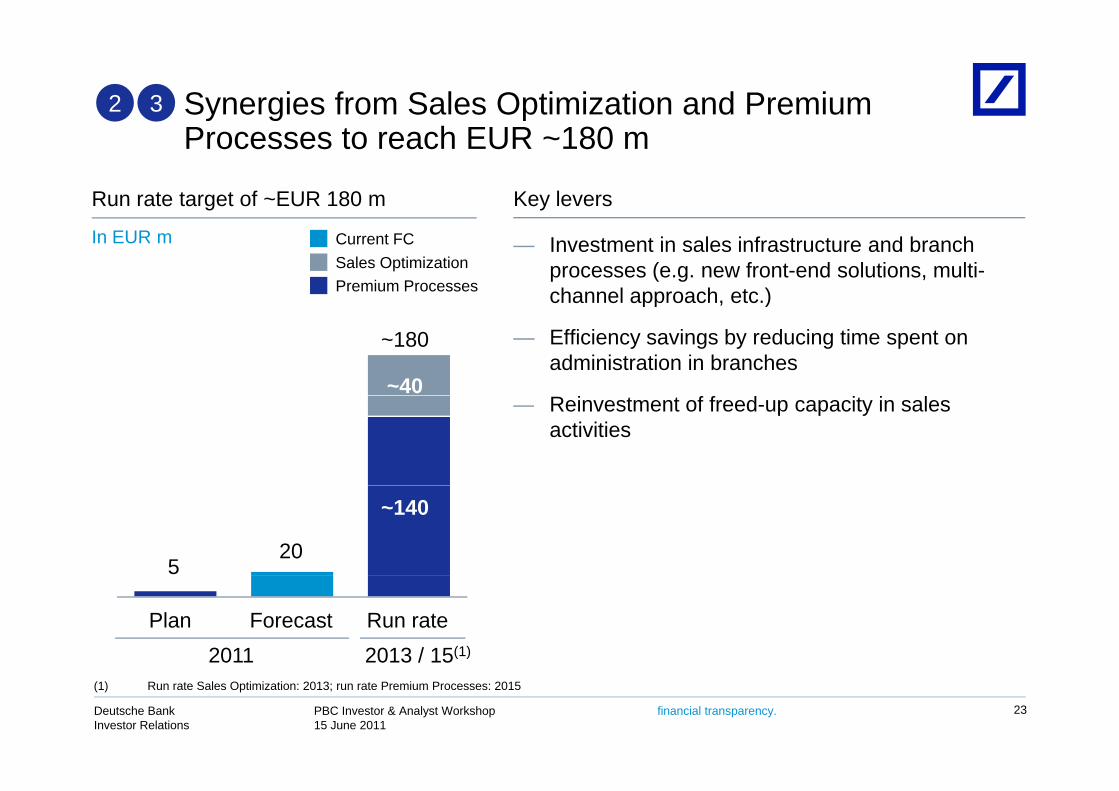
Synergies from Sales Optimization and Premium P h EUR 180
2 3Processes to reach EUR ~180 m
Run rate target of ~EUR 180 m Key levers
In EUR m — Investment in sales infrastructure and branch processes (e.g. new front-end solutions, multi-channel approach, etc.)
Current FCSales OptimizationPremium Processes
~40
~180
pp , )
— Efficiency savings by reducing time spent on administration in branches
— Reinvestment of freed-up capacity in sales activities
20
~140
5
Plan Run rate2011 2013 / 15(1)
Forecast
PBC Investor & Analyst Workshop15 June 2011
Deutsche BankInvestor Relations
financial transparency. 23
(1) Run rate Sales Optimization: 2013; run rate Premium Processes: 2015

2 3 Deep dive: Reduction of time spent on administration ill b i d i l i iwill be reinvested in sales activity
Key leversStatus quo
Benchmark
Customer advisory time — Freeing-up sales time as a key lever to improved profitability and broader and deeper client relationships
Competitorp p
— End-to-end process reengineering:— Standardization of services and sales
activities
— Overall customer advisory time needs to be i d
ac es— Simplification of everyday processes
in branches— Increased use of self-service channelsincreased
— Best practice competitors have more than twice as much time with the customer
Increased use of self service channels for customers
— Simplification of product offering to reduce complexity
— Sales force suffering from complex processes and a complex product range
p y— Preparation for migration to
standardized platform
PBC Investor & Analyst Workshop15 June 2011
Deutsche BankInvestor Relations
financial transparency. 24
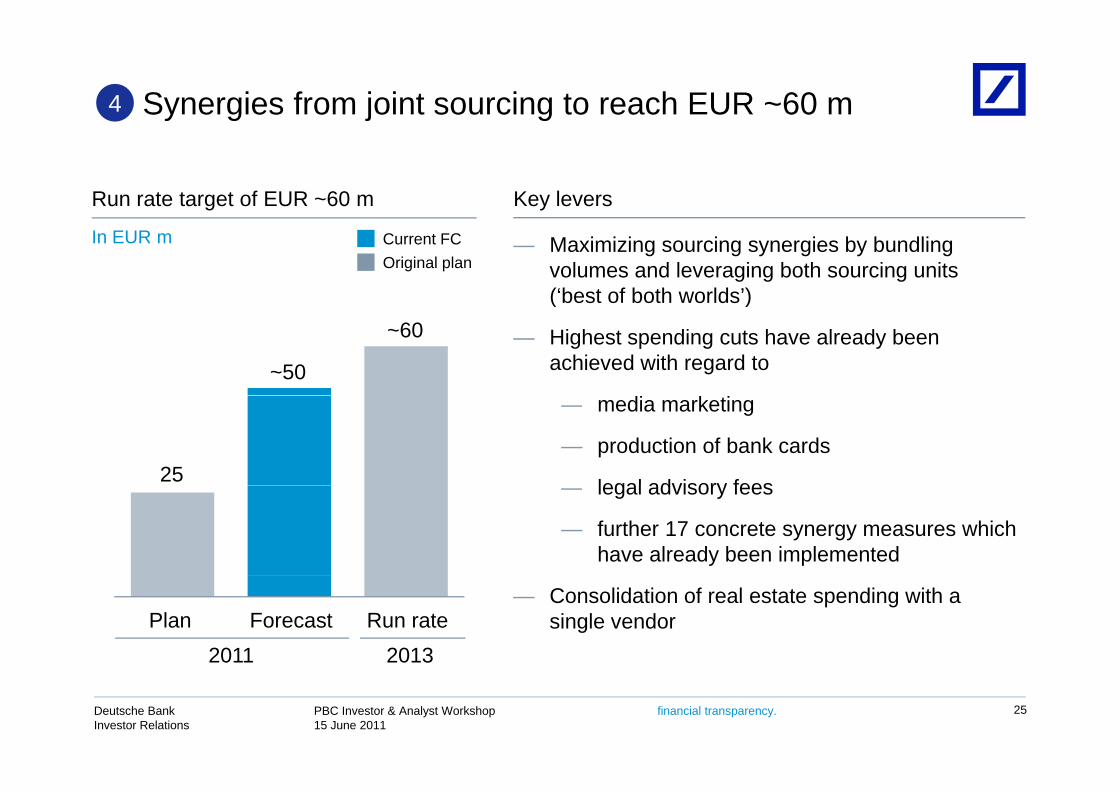
Synergies from joint sourcing to reach EUR ~60 m4
Run rate target of EUR ~60 m Key levers
— Maximizing sourcing synergies by bundling volumes and leveraging both sourcing units (‘best of both worlds’)
Current FCOriginal plan
In EUR m
( )
— Highest spending cuts have already been achieved with regard to~50
~60
— media marketing
— production of bank cards
legal advisory fees25 — legal advisory fees
— further 17 concrete synergy measures which have already been implemented
— Consolidation of real estate spending with a single vendorPlan Run rate
2011 2013Forecast
PBC Investor & Analyst Workshop15 June 2011
Deutsche BankInvestor Relations
financial transparency. 25

Operations synergies to reach EUR ~150 m5
Run rate target of ~EUR 150 m Key levers
— Harmonizing "end-to-end" process model (front office to middle office / back office)
R d i d i ti t li i t
In EUR m Current FCOriginal plan
— Reducing process deviations to eliminate complexity costs (fewer exceptions)
— Increasing efficiency and productivity with higher
~150
automation on standard SAP platform
— Bundling middle office / back office activities to achieve economies of scale through optimized locations structure
— Reducing overall factor costs by utilizing legal entity structures10 10 y
— Introducing solutions across legal entities to reduce overall management complexityPlan Run rate
2011 2015Forecast
PBC Investor & Analyst Workshop15 June 2011
Deutsche BankInvestor Relations
financial transparency. 26

Joint IT target model to yield EUR ~230 m6
Run rate target of EUR ~230 m Key levers
In EUR m — Using state-of-the-art standard software innon-differentiating areas
R d i ti t k t f d t
Current FCOriginal plan
— Reducing time-to-market for new products
— Full multi-channel support
— Enabling a step-change in the bank’s operations
~230
— Enabling a step-change in the bank s operations
— New platform provides cost advantages:
— decreased project costs as only one joint p j y jplatform is run
— decreased running costs through complexity reduction and decommissioning of legacy
25 ~25reduction and decommissioning of legacy systems
Plan Run rate2011 end 2015
Forecast
PBC Investor & Analyst Workshop15 June 2011
Deutsche BankInvestor Relations
financial transparency. 27
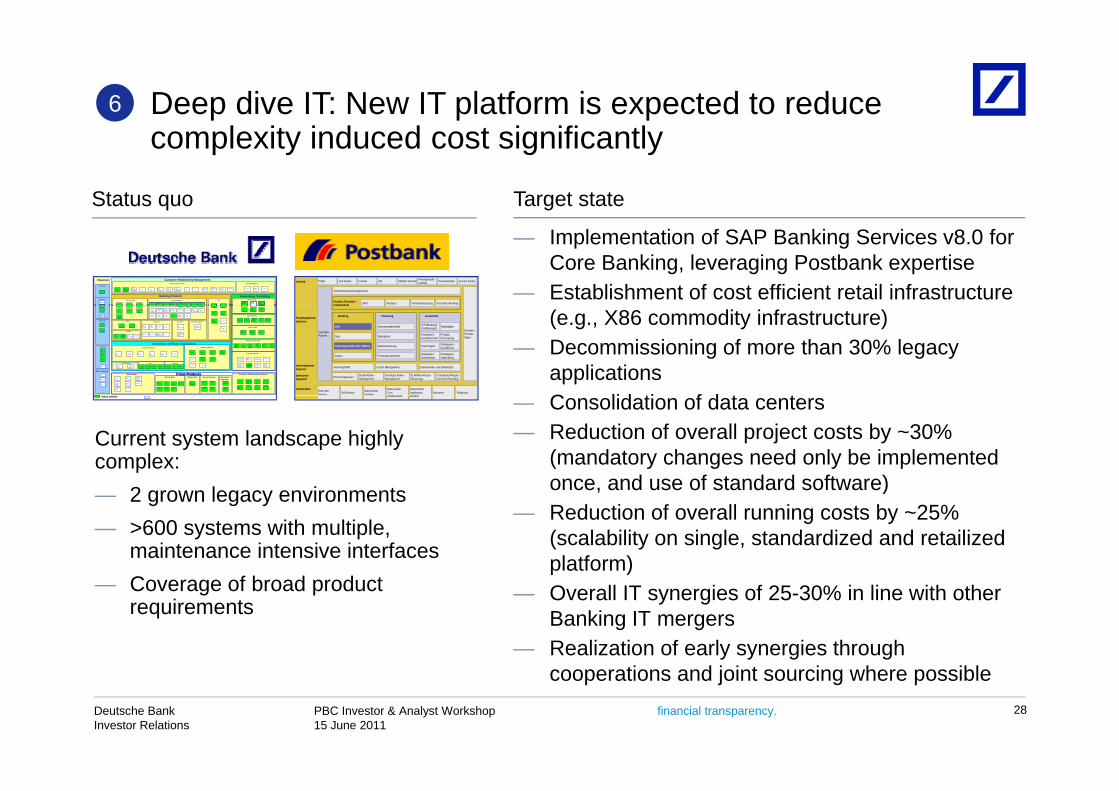
Deep dive IT: New IT platform is expected to reduce l it i d d t i ifi tl
6complexity induced cost significantly
Status quo Target state
Filiale Call-Centre Internet SB Mobiler Vertrieb Fremdprodukt-vertrieb Fremdvertrieb Service CentreVertrieb
Vertriebsunterstützungsservice
CRM Analytics Vertriebssteuerung VertriebscontrollingKunden-/Vertriebs-management
Channels Customer Relationship Management
Accounting, ControllingBanking Products
BranchFE
Call Centre
Advisory & Sales Support Portfolio Managment
Legal ReportingCurrent Account Loans & Morgages Cash
N OS
MaxblueC MT K WG §13
K WG §14Jahres-steuer -bescheinigung
Erträgnis-aufs tellung
Cosmos A nlage-Manager RPMSKIM CMD
CampaignManagment
PardonB eschw erde-Managment
FINO F&VPFinanz-Beratung(Fin. Adv isory)
Renten-berechnung
CMDCampaignManagment
db-select db-Fina n-zierungIVS Aufhebungs-
entgeltD B BausparKr edit-
Kalkulation
T nten
d
Dauer auftragKK ZVK K DISPO
TFTradeFinance
MahnwesenToolboxFernbachFE
KFPKDEDecisionEngine
RU FUSKOSC OKontoScoring
NOS PK
Channels Customer Relationship Management
Accounting, ControllingBanking Products
BranchFE
Call Centre
Advisory & Sales Support Portfolio Managment
Legal ReportingCurrent Account Loans & Morgages Cash
N OSN OS
MaxblueC MT K WG §13
K WG §14Jahres-steuer -bescheinigung
Erträgnis-aufs tellung
Cosmos A nlage-Manager RPMSKIM CMD
CampaignManagment
PardonB eschw erde-Managment
FINO F&VPFinanz-Beratung(Fin. Adv isory)
Renten-berechnung
CMDCampaignManagment
db-select db-Fina n-zierungIVS Aufhebungs-
entgeltD B BausparKr edit-
Kalkulation
T nten
d
Dauer auftragKK ZVK K DISPO
TFTradeFinance
MahnwesenToolboxFernbachFE
KFPKDEDecisionEngine
RU FUSKOSC OKontoScoring
NOS PK
— Implementation of SAP Banking Services v8.0 for Core Banking, leveraging Postbank expertise
— Establishment of cost efficient retail infrastructure Zentraler Partner
management
Business Process Mgmt.
Banking Financing Investment
Giro
Spar
Zahlungsverkehr (IZV, SEPA)
Karten
Konsumentenkredit
Bausparen
Baufinanzierung
Firmenkundenkredit
WP-Beratung/Portfoliomgmt.
Investment-produktvertrieb
Order Mgmt.
Wertpapier-stammdaten
Marktdaten
ProductProcessing
Wertpapier-konditionen
Wertpapier-abwicklung
Archiving/DMS Output Management Dokumenten- und Dateninput
Rechnungswesen Kredit-Risiko-Management
Sonstiges Risiko-Management
ALM/Aktiv-Passiv-Steuerung
Compliance/Regula-torisches Reporting
Produktgebende Systeme
Unterstützende Systeme
Enterprise Systeme*
End UserService Self Service Data Center
Facilities
Data Center Core Infrastructure
Data Center Application Hosting
Netzwerk TelephonyInfrastruktur
Cross Products
Operations and Basic Applications
SB Systeme
In ternet
Electr. Banking
General Ledger
Management Information
Reporti ng / Infocentre
Risk Controll ing
Printing & Documentation SystemsMarket DataPartner Data Information
& MailingAccess SecurityMaster Files
Cards
Savings
Securities Insurance Fixed Term deposits
Securities Settlements Payments & Clearing
Kooperationen Keba Treasury
db contact
NO S CC
WertpapierBeratungs-Servic e (WBS )
ATM
BankingTerminal
PublicSite
TRX Mgr
WebSign
EC S
CA T EB
db-dialog
FIN TS
EurexRates
DWZ Rates(foreignCountr ies)
DB Market-view
IBFFMD b-r ates
D WZ Rates(domestic)
Pr ice File
TeledataInnovativeSoftw ar e
KISS Rates PartnerDaten
G WG
Zer berus
KWG 24
Schufa
( Cred it B ureauChe ck)
SIGN
KEK V97(gen. Tabelse.g. VGRU)
db legi KUVBS
KUO NLJupiter
db-intranet(Lot us Notes)
NorisbankIntr anet
DVSDruckver sand-System
db-print
EDMS
DanubeOutput Mgm tSystem
RDMS
db-brief
D OKPRO
ORINOC O
Kredit-Portfolio-Manager
Kontostands-meldungen
Ver tr iebs-Datenbank(Incent iveTool)
K onto-Ü bersicht
db-analyse-System
Kunden-Kalkulation(KU BIS)
db-smartKonto-Entwicklung
Kompass
BalancedScorecard
VLR
CoDac
Ver triebs -report
DWHCDWH
sIDM OLTP
NSWGD H
SAP/R3
FI/C OMAR /AP
BCS
B2Br ain eD ataPCR(PreventCrimeResearch)
CRESEWSOnline
ZAST Salden-bestätigung
GeldwäscheSmar agd
AKT
Fro
n
K asseU msatz AKT
Backend
EZÜZahlungs-Auftrag NEU
SOE batch
GOS(Sor ten)
ZVKK Smartstr eamIG FNDZ MINT
KasseUmsatzBackend
TK N / PTS SWIFT Merva
MTNA
IMPS IGF DOK
Termingeld-abrechnung
PCVersicherung
Versicherungs-Verwaltungs-System
DirectTrader
IAS
Top Invest
WMIWer tpapier -Mitteilung
EurexDTB
DO(DirektesO rdern)
db-soupon
KMS O CM
Spa rTer mingeld-Sparbrief-Abrechnung
PCBauspar
Schrankfach
DPO(DepotOnline)
Depot-BuchungIntegr ierte
B uchungdb-traderMVS
WPHG §9Effekten-Skontr o
Depot-Statistik
IntegrierteBuchung
db-tr aderMVS
APS GDS Kondor +db-rück db-fr ei LN APPS IXOS
EBT CPD KAD
IRIS(Immobilienu. Raster Info)
WebrasterKSIBKSKont o-Führung
InterneBefr istung
FSKFestsatz-Kredite
KBManager
BK SSach-bear beitung
MBSManager WechselAntrags-
Scoring
BMBeitreibungs-Manager
Effekten-B esicherteK redite
g
KMKreditManager
MahnungOnline
Cross Products
Operations and Basic Applications
SB Systeme
In ternet
Electr. Banking
General Ledger
Management Information
Reporti ng / Infocentre
Risk Controll ing
Printing & Documentation SystemsMarket DataPartner Data Information
& MailingAccess SecurityMaster Files
Cards
Savings
Securities Insurance Fixed Term deposits
Securities Settlements Payments & Clearing
Kooperationen Keba Treasury
db contact
NO S CC
WertpapierBeratungs-Servic e (WBS )
ATM
BankingTerminal
PublicSite
TRX Mgr
WebSign
EC S
CA T EB
db-dialog
FIN TS
EurexRates
DWZ Rates(foreignCountr ies)
DB Market-view
IBFFMD b-r ates
D WZ Rates(domestic)
Pr ice File
TeledataInnovativeSoftw ar e
KISS Rates PartnerDaten
G WG
Zer berus
KWG 24
Schufa
( Cred it B ureauChe ck)
SIGN
KEK V97(gen. Tabelse.g. VGRU)
db legi KUVBS
KUO NLJupiter
db-intranet(Lot us Notes)
NorisbankIntr anet
DVSDruckver sand-System
db-print
EDMS
DanubeOutput Mgm tSystem
RDMS
db-brief
D OKPRO
ORINOC O
Kredit-Portfolio-Manager
Kontostands-meldungen
Ver tr iebs-Datenbank(Incent iveTool)
K onto-Ü bersicht
db-analyse-System
Kunden-Kalkulation(KU BIS)
db-smartKonto-Entwicklung
Kompass
BalancedScorecard
VLR
CoDac
Ver triebs -report
DWHCDWH
sIDM OLTP
NSWGD H
SAP/R3
FI/C OMAR /AP
BCS
B2Br ain eD ataPCR(PreventCrimeResearch)
CRESEWSOnline
ZAST Salden-bestätigung
GeldwäscheSmar agd
AKT
Fro
n
K asseU msatz AKT
Backend
EZÜZahlungs-Auftrag NEU
SOE batch
GOS(Sor ten)
ZVKK Smartstr eamIG FNDZ MINT
KasseUmsatzBackend
TK N / PTS SWIFT Merva
MTNA
IMPS IGF DOK
Termingeld-abrechnung
PCVersicherung
Versicherungs-Verwaltungs-System
DirectTrader
IAS
Top Invest
WMIWer tpapier -Mitteilung
EurexDTB
DO(DirektesO rdern)
db-soupon
KMS O CM
Spa rTer mingeld-Sparbrief-Abrechnung
PCBauspar
Schrankfach
DPO(DepotOnline)
Depot-BuchungIntegr ierte
B uchungdb-traderMVS
WPHG §9Effekten-Skontr o
Depot-Statistik
IntegrierteBuchung
db-tr aderMVS
APS GDS Kondor +db-rück db-fr ei LN APPS IXOS
EBT CPD KAD
IRIS(Immobilienu. Raster Info)
WebrasterKSIBKSKont o-Führung
InterneBefr istung
FSKFestsatz-Kredite
KBManager
BK SSach-bear beitung
MBSManager WechselAntrags-
Scoring
BMBeitreibungs-Manager
Effekten-B esicherteK redite
g
KMKreditManager
MahnungOnline (e.g., X86 commodity infrastructure)
— Decommissioning of more than 30% legacy applications C lid ti f d t t
Current system landscape highly complex:
Infrastructure HostingUsed by norisbankUsed by norisbank — Consolidation of data centers— Reduction of overall project costs by ~30%
(mandatory changes need only be implemented once and use of standard software)— 2 grown legacy environments
— >600 systems with multiple, maintenance intensive interfaces
once, and use of standard software)— Reduction of overall running costs by ~25%
(scalability on single, standardized and retailized platform)
— Coverage of broad product requirements — Overall IT synergies of 25-30% in line with other
Banking IT mergers— Realization of early synergies through
PBC Investor & Analyst Workshop15 June 2011
Deutsche BankInvestor Relations
financial transparency. 28
cooperations and joint sourcing where possible
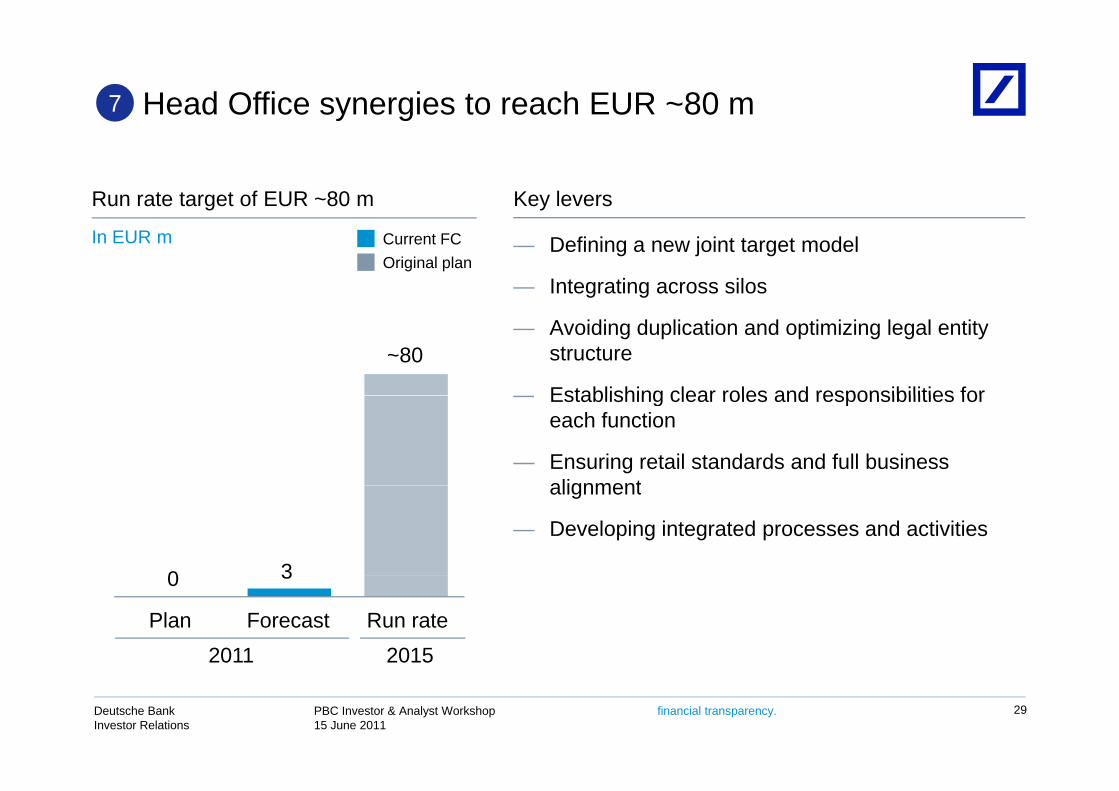
Head Office synergies to reach EUR ~80 m7
Run rate target of EUR ~80 m Key levers
In EUR m — Defining a new joint target model
— Integrating across silos
Current FCOriginal plan
~80— Avoiding duplication and optimizing legal entity
structure
— Establishing clear roles and responsibilities for— Establishing clear roles and responsibilities for each function
— Ensuring retail standards and full business alignmentalignment
— Developing integrated processes and activities
0 30 3
Plan Run rate2011 2015
Forecast
PBC Investor & Analyst Workshop15 June 2011
Deutsche BankInvestor Relations
financial transparency. 29

Phased approach for run rate achievementI EUR
Revenue Premium
In EUR m
Revenue synergies
~250
S l
Premium Processes
~140
IT~230
Sales Optimization
~40
Operations~150
Sourcing / Cost Management
~60
Head-office~80
end 201520152013
PBC Investor & Analyst Workshop15 June 2011
Deutsche BankInvestor Relations
financial transparency. 30
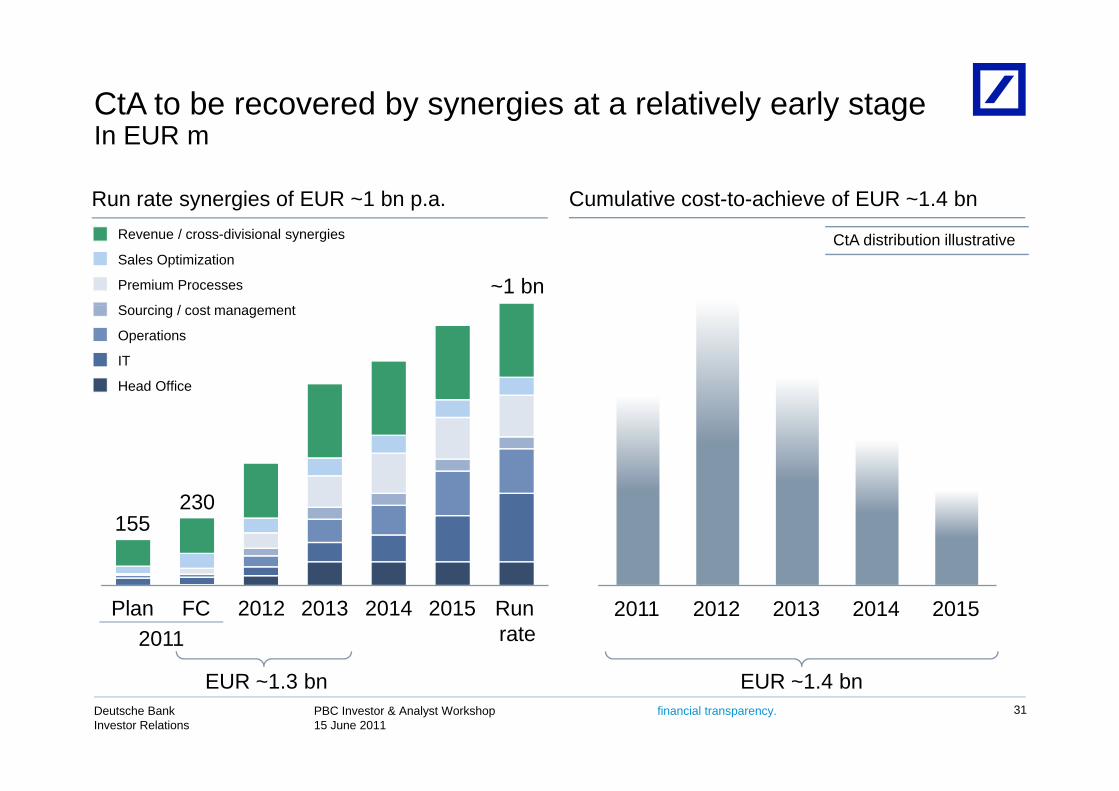
CtA to be recovered by synergies at a relatively early stageI EURIn EUR m
Cumulative cost-to-achieve of EUR ~1.4 bnRun rate synergies of EUR ~1 bn p.a.
Premium Processes ~1 bnS i / t t
Sales Optimization
Revenue / cross-divisional synergies CtA distribution illustrative
Sourcing / cost management
IT
Head Office
Operations
155230
2015201420132012FCPlan Runrate2011
2011 2012 2013 2014 2015
PBC Investor & Analyst Workshop15 June 2011
Deutsche BankInvestor Relations
financial transparency.
EUR ~1.3 bn EUR ~1.4 bn31
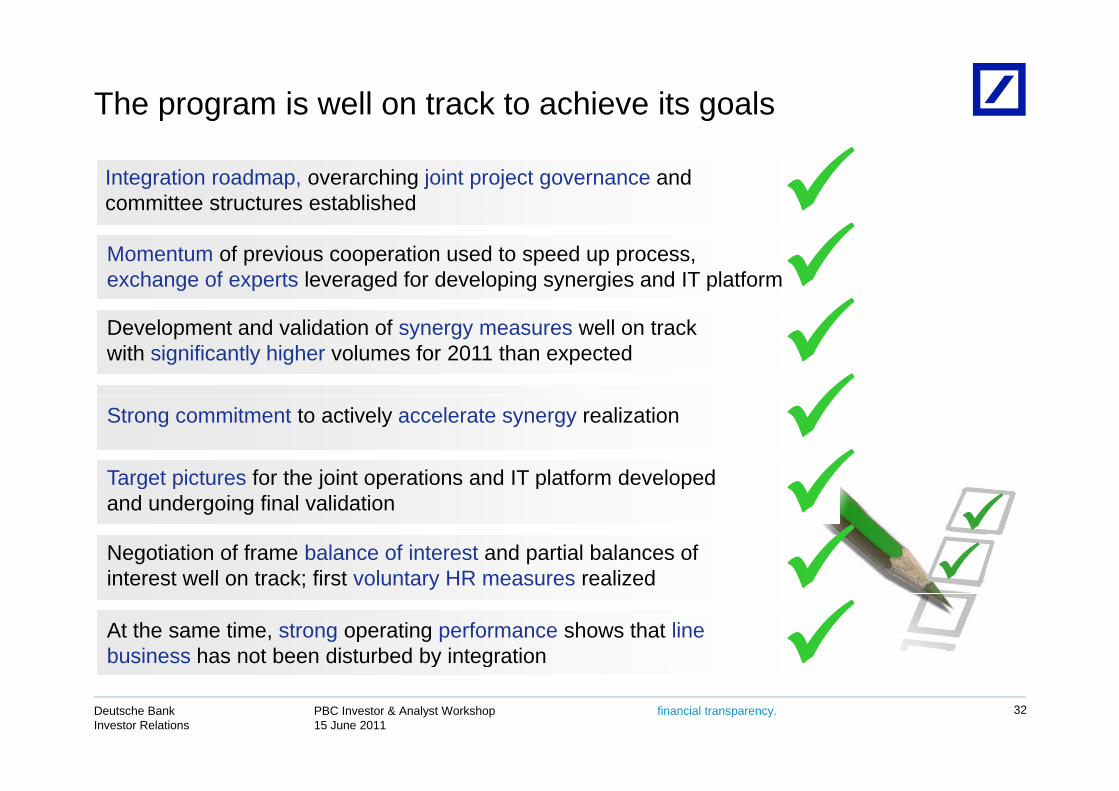
The program is well on track to achieve its goals
Integration roadmap, overarching joint project governance and committee structures established Momentum of previous cooperation used to speed up process, exchange of experts leveraged for developing synergies and IT platform
Development and validation of synergy measures well on track with significantly higher volumes for 2011 than expected
Target pictures for the joint operations and IT platform developed
Strong commitment to actively accelerate synergy realization
g p j p p pand undergoing final validation
Negotiation of frame balance of interest and partial balances of interest well on track; first voluntary HR measures realized
At the same time, strong operating performance shows that line business has not been disturbed by integration
interest well on track; first voluntary HR measures realized
PBC Investor & Analyst Workshop15 June 2011
Deutsche BankInvestor Relations
financial transparency.
y g
32

Deutsche Bank
Risk and RWA Outlook
Christian SewingChief Credit Officer, Deutsche Bank
PBC Investor & Analyst Workshop15 June 2011
Deutsche BankInvestor Relations
financial transparency.
Agenda
1 PBC loan book1 PBC loan book
2 Postbank Fair Value Adjustment upon consolidation2 Postbank Fair Value Adjustment upon consolidation
3 Economic environment and RWA development3 Economic environment and RWA development
PBC Investor & Analyst Workshop15 June 2011
Deutsche BankInvestor Relations
financial transparency. 34
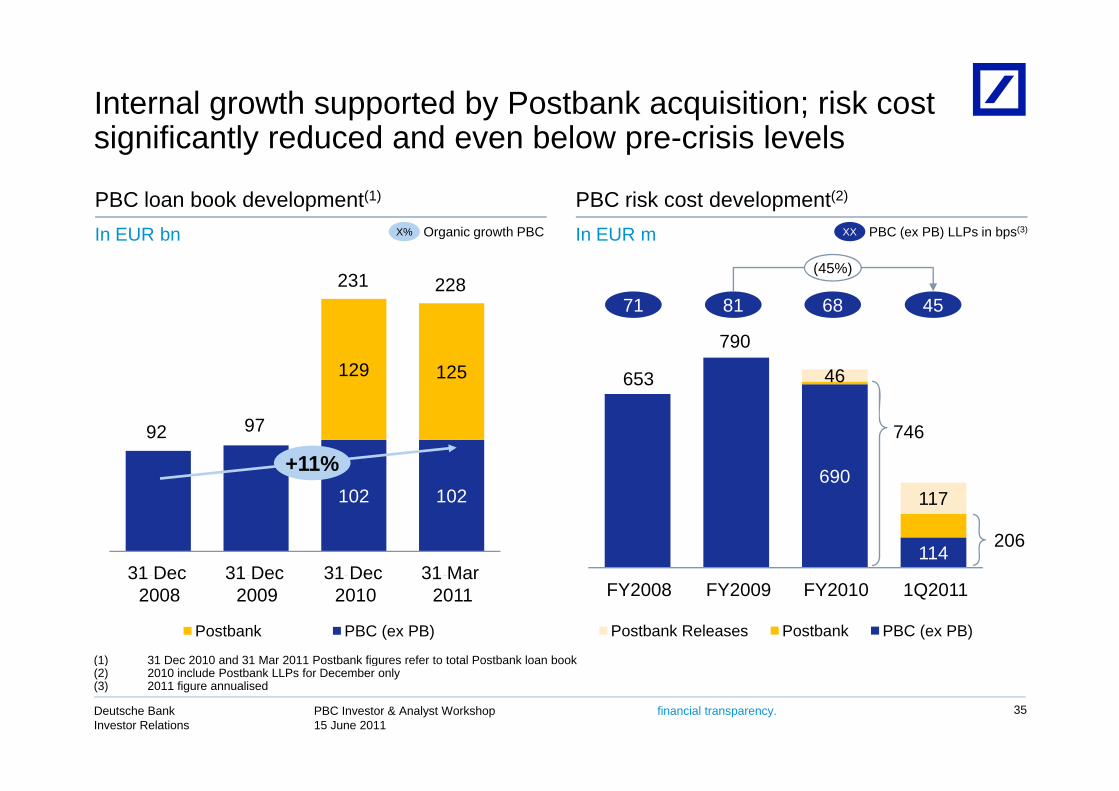
Internal growth supported by Postbank acquisition; risk cost i ifi tl d d d b l i i l lsignificantly reduced and even below pre-crisis levels
PBC loan book development(1) PBC risk cost development(2)
In EUR bn In EUR m
231 228
XX PBC (ex PB) LLPs in bps(3)X% Organic growth PBC
71 81 68 45
(45%)
129 125 46653
790
71 81 68 45
+11%92 97
690
746
102 102
Dec 08 Dec 09 Dec 10 Mar 11114
117
206
31 Dec 31 Dec 31 Dec 31 MarDec 08 Dec 09 Dec 10 Mar 11
Postbank PBC (ex PB)
FY 2008 FY 2009 FY 2010 Q1 2011
Postbank Releases Postbank PBC (ex PB)
31 Dec2008
31 Dec2009
31 Dec2010
31 Mar 2011 FY2008 FY2009 FY2010 1Q2011
(1) 31 Dec 2010 and 31 Mar 2011 Postbank figures refer to total Postbank loan book
PBC Investor & Analyst Workshop15 June 2011
Deutsche BankInvestor Relations
financial transparency. 35
( ) g(2) 2010 include Postbank LLPs for December only(3) 2011 figure annualised
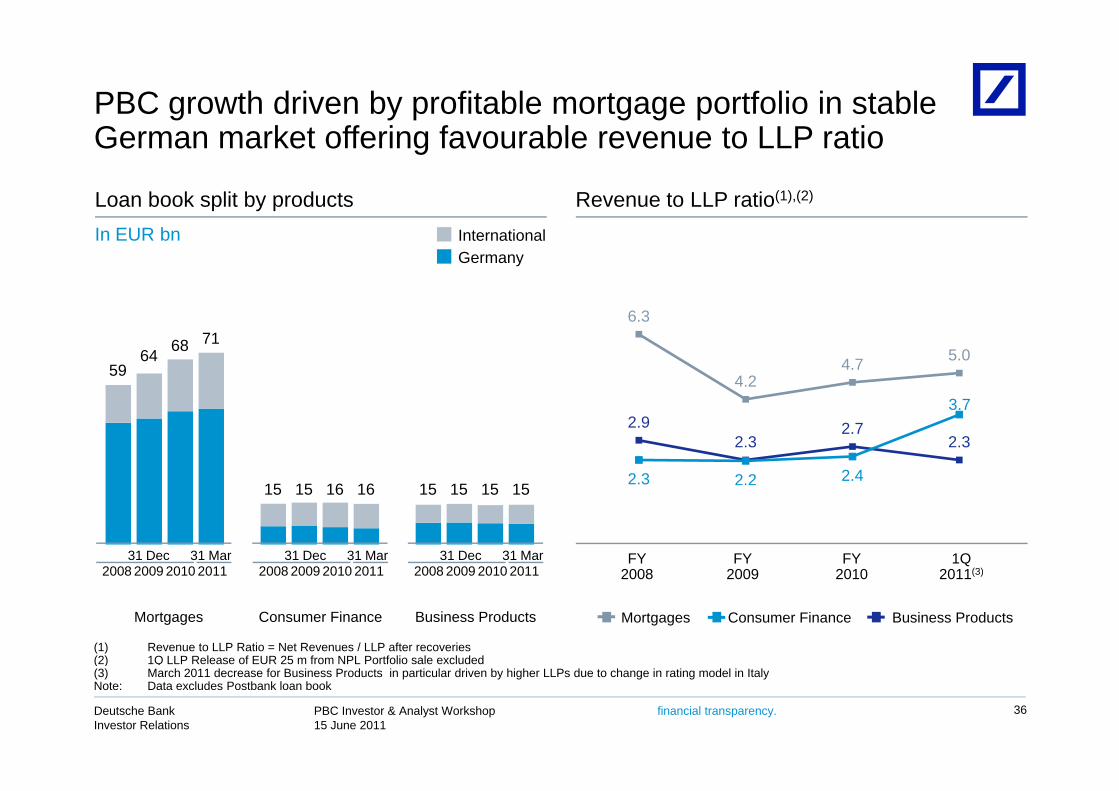
PBC growth driven by profitable mortgage portfolio in stable G k t ff i f bl t LLP tiGerman market offering favourable revenue to LLP ratio
Loan book split by products Revenue to LLP ratio(1),(2)
In EUR bn InternationalGermany
6.3
4.24.7 5.0
5964 68 71
2.92.3
2.72.3
2.3 2.2 2.4
3.7
15 15 16 16 15 15 15 15
2008 2010 20111Q
2011(3)FY
2008FY
2009FY
2010
15 15 16 16 15 15 15 15
31 Dec 31 Mar2009 2008 2010 2011
31 Dec 31 Mar2009 2008 2010 2011
31 Dec 31 Mar2009
Mortgages
2008 2010 2011
Consumer Finance Business Products
2011( )2008 2009 2010
Mortgages Consumer Finance Business Products
(1) Revenue to LLP Ratio = Net Revenues / LLP after recoveries(2) 1Q LLP Release of EUR 25 m from NPL Portfolio sale excluded
2009 2008 2010 20112009 2008 2010 20112009
PBC Investor & Analyst Workshop15 June 2011
Deutsche BankInvestor Relations
financial transparency. 36
( )(3) March 2011 decrease for Business Products in particular driven by higher LLPs due to change in rating model in ItalyNote: Data excludes Postbank loan book
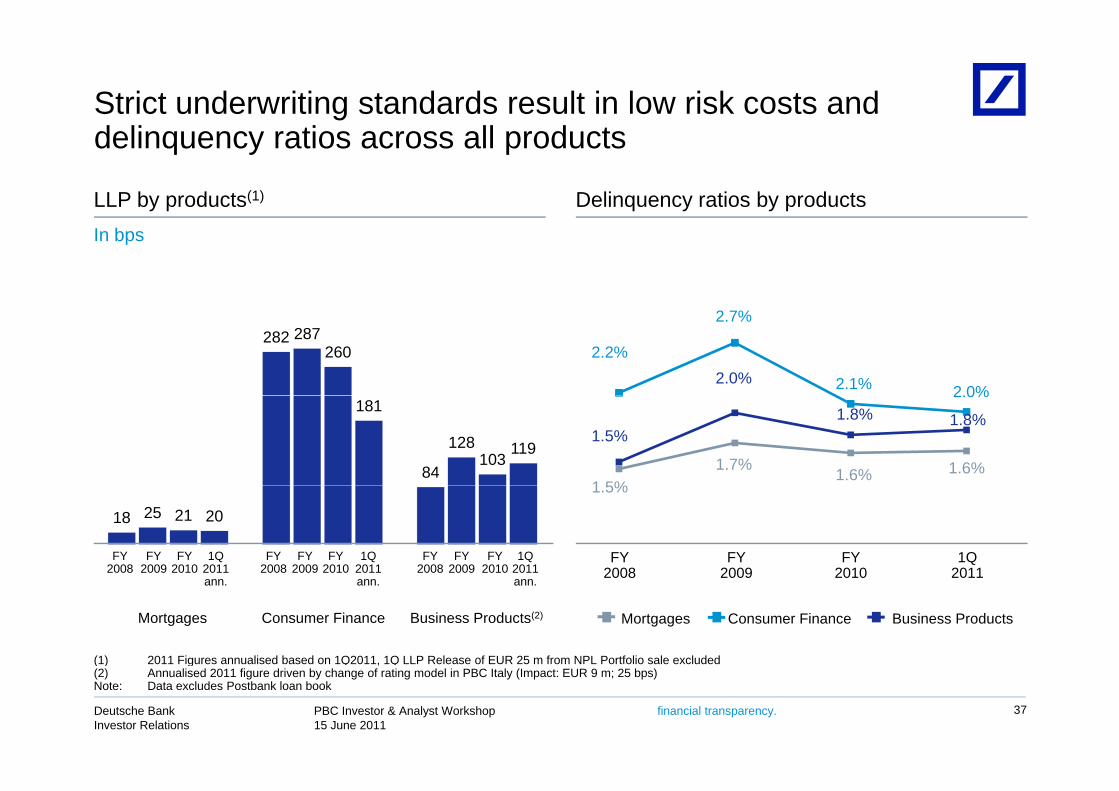
Strict underwriting standards result in low risk costs and d li ti ll d tdelinquency ratios across all products
LLP by products(1) Delinquency ratios by productsIn bps
2.0%2.2%
2.7%
2.1% 2.0%
282 287260
1 5%1.7% 1.6% 1.6%
1.5%1.8% 1.8%
2.0%181
84
128103
119
1.5%
18 25 21 20
1Q2011
1Q2011
1Q2011
FY 2010
FY 2010
FY 2010
FY 2009
FY 2008
FY 2009
FY 2008
FY 2009
FY 2008
FY2008
FY2009
FY2010
1Q2011ann. ann. ann. 2008 2009 2010 2011
(1) 2011 Figures annualised based on 1Q2011, 1Q LLP Release of EUR 25 m from NPL Portfolio sale excluded
Mortgages Consumer Finance Business Products(2) Mortgages Consumer Finance Business Products
PBC Investor & Analyst Workshop15 June 2011
Deutsche BankInvestor Relations
financial transparency. 37
( ) g ,(2) Annualised 2011 figure driven by change of rating model in PBC Italy (Impact: EUR 9 m; 25 bps)Note: Data excludes Postbank loan book

Pro-active risk management allowed growth with d i i k tdecreasing risk costs
2007 / 2008
PBC loan book & LLP development (indexed)(1)Early active risk measures
2007 / 2008— Successful de-risking of vulnerable sub-portfolios
in Spain— Introduction of risk framework for business clients
100
120
Loan Book LLPs (in bps)
(money at risk concept)— Strengthening of workout / collection units in
Europe 80
100
2008 / 2009— Exit of sales channel dbCredit in Spain & dbKredyt
in PolandStrategy shift in India focus on high end
60
— Strategy shift in India - focus on high-end customers & exit of Consumer Finance biz
Ongoing measures 20
40
— Continued adjustment of risk criteria while growth in general was supported
— Sale of written-off portfolios, mainly in Germany0
4Q 2008
1Q 2009
2Q 2009
3Q 2009
4Q 2009
1Q 2010
2Q 2010
3Q 2010
4Q 2010
1Q 2011
PBC Investor & Analyst Workshop15 June 2011
Deutsche BankInvestor Relations
financial transparency. 38
(1) One-off LLP release of EUR 60 m due to methodology change in 1Q2009 excluded, 1Q LLP Release of EUR 25 m from NPL Portfolio sale excludedNote: Timeline in graph shows date of measurement taken, result reflected later on. Data excludes Postbank loan book
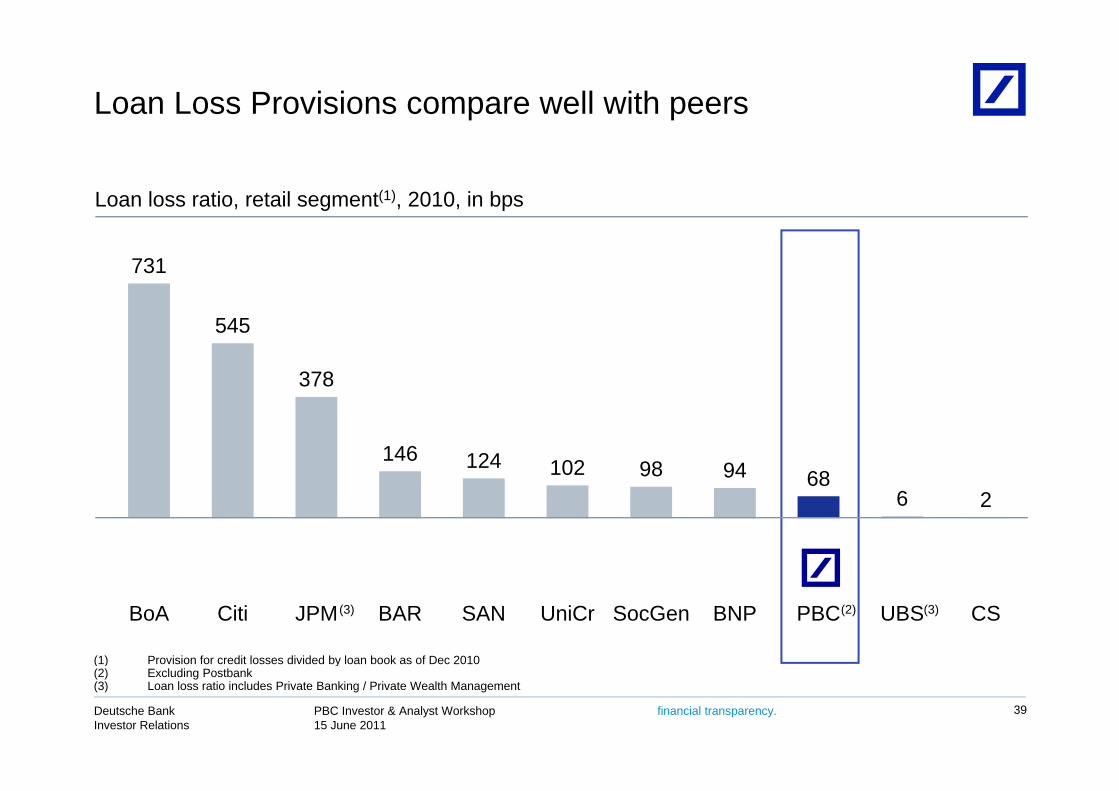
Loan Loss Provisions compare well with peers
Loan loss ratio, retail segment(1), 2010, in bps
731
545
378
146 124 102 98 94 68686 2
BoA Citi JPM BAR SAN UniCr SocGen BNP PBC UBS CS(3) (3)(2)
(1) Provision for credit losses divided by loan book as of Dec 2010
PBC Investor & Analyst Workshop15 June 2011
Deutsche BankInvestor Relations
financial transparency. 39
( ) y(2) Excluding Postbank(3) Loan loss ratio includes Private Banking / Private Wealth Management
Agenda
1 PBC loan book1 PBC loan book
2 Postbank Fair Value Adjustment upon consolidation2 Postbank Fair Value Adjustment upon consolidation
3 Economic environment and RWA development3 Economic environment and RWA development
PBC Investor & Analyst Workshop15 June 2011
Deutsche BankInvestor Relations
financial transparency. 40
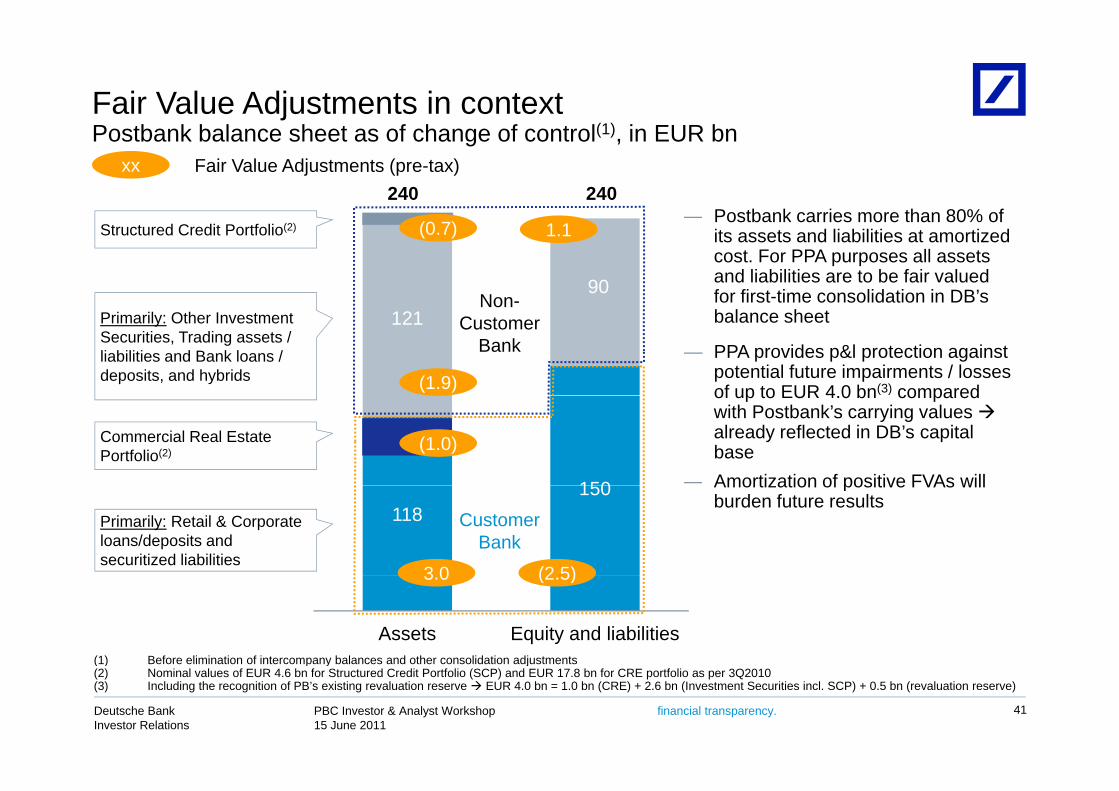
Fair Value Adjustments in contextP tb k b l h t f h f t l(1) i EUR b
240 240
Postbank balance sheet as of change of control(1), in EUR bnxx Fair Value Adjustments (pre-tax)
Postbank carries more than 80% of
90Non-
Structured Credit Portfolio(2) (0.7) 1.1— Postbank carries more than 80% of
its assets and liabilities at amortized cost. For PPA purposes all assets and liabilities are to be fair valued for first-time consolidation in DB’s
121Non
CustomerBank
(1.9)
Primarily: Other Investment Securities, Trading assets / liabilities and Bank loans / deposits, and hybrids
— PPA provides p&l protection against potential future impairments / losses of up to EUR 4 0 bn(3) compared
balance sheet
150
Commercial Real Estate Portfolio(2) (1.0)
— Amortization of positive FVAs will
of up to EUR 4.0 bn compared with Postbank’s carrying values already reflected in DB’s capital base
118150
Customer Bank
3 0 (2 5)
Primarily: Retail & Corporate loans/deposits and securitized liabilities
Amortization of positive FVAs will burden future results
Assets Equity and liabilities
3.0 (2.5)
(1) Before elimination of intercompany balances and other consolidation adjustments
PBC Investor & Analyst Workshop15 June 2011
Deutsche BankInvestor Relations
financial transparency. 41
( ) p y j(2) Nominal values of EUR 4.6 bn for Structured Credit Portfolio (SCP) and EUR 17.8 bn for CRE portfolio as per 3Q2010(3) Including the recognition of PB’s existing revaluation reserve EUR 4.0 bn = 1.0 bn (CRE) + 2.6 bn (Investment Securities incl. SCP) + 0.5 bn (revaluation reserve)

Agenda
1 PBC loan book1 PBC loan book
2 Postbank Fair Value Adjustment upon consolidation2 Postbank Fair Value Adjustment upon consolidation
3 Economic environment and RWA development3 Economic environment and RWA development
PBC Investor & Analyst Workshop15 June 2011
Deutsche BankInvestor Relations
financial transparency. 43
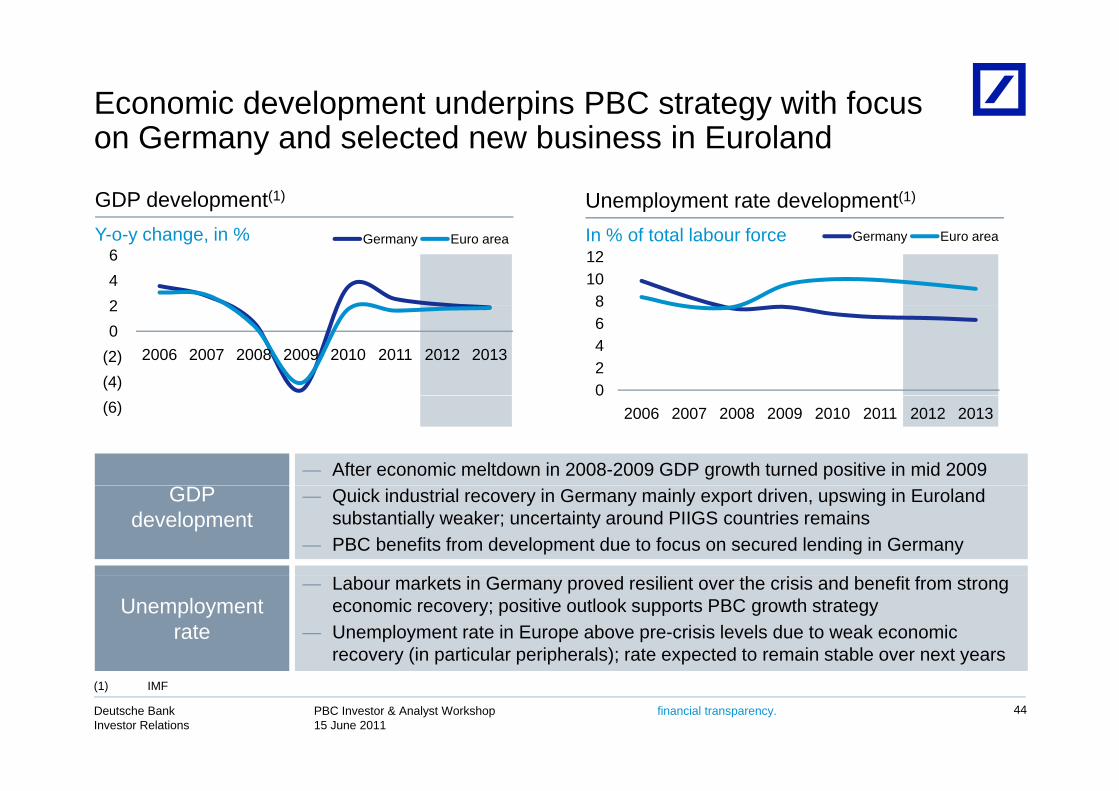
Economic development underpins PBC strategy with focus G d l t d b i i E l d
GDP development(1) Unemployment rate development(1)
on Germany and selected new business in Euroland
24 6
Germany Euro area Y-o-y change, in %
81012
Germany Euro area In % of total labour force
(4)(2)0 2
2006 2007 2008 2009 2010 2011 2012 2013
02468
(6)
— After economic meltdown in 2008-2009 GDP growth turned positive in mid 2009
02006 2007 2008 2009 2010 2011 2012 2013
GDP development
— Quick industrial recovery in Germany mainly export driven, upswing in Eurolandsubstantially weaker; uncertainty around PIIGS countries remains
— PBC benefits from development due to focus on secured lending in Germany
Unemployment rate
— Labour markets in Germany proved resilient over the crisis and benefit from strong economic recovery; positive outlook supports PBC growth strategy
— Unemployment rate in Europe above pre-crisis levels due to weak economic recovery (in particular peripherals); rate expected to remain stable over next years
PBC Investor & Analyst Workshop15 June 2011
Deutsche BankInvestor Relations
financial transparency. 44
(1) IMF
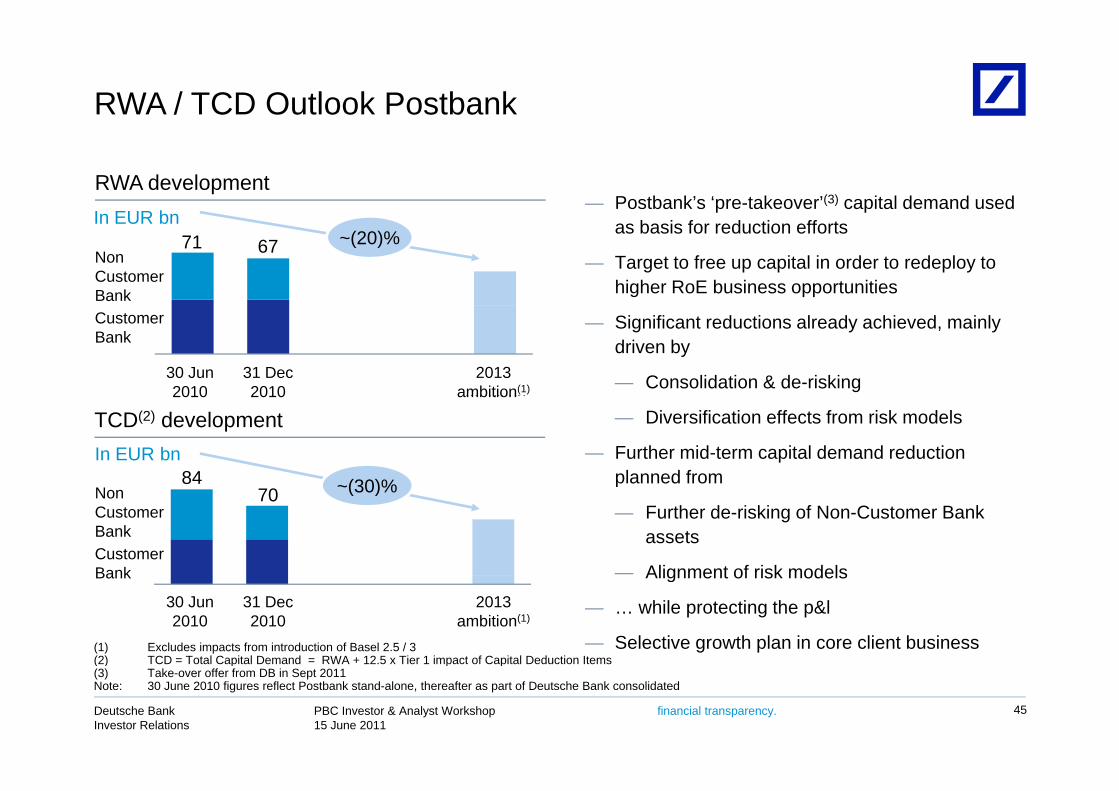
RWA / TCD Outlook Postbank
RWA development— Postbank’s ‘pre-takeover’(3) capital demand used
In EUR bn as basis for reduction efforts
— Target to free up capital in order to redeploy to higher RoE business opportunities
~(20)%71 67In EUR bn
NonCustomerBank
— Significant reductions already achieved, mainly driven by
— Consolidation & de-risking30-Jun-10 31-Dec-10 2013Ambition
CustomerBank
30 Jun 2010
31 Dec2010
2013ambition(1)
TCD(2) development — Diversification effects from risk models
— Further mid-term capital demand reduction planned from
In EUR bn
Ambition
84 ~(30)%
2010 2010 ambition
p
— Further de-risking of Non-Customer Bank assets
— Alignment of risk models
70
CustomerBank
NonCustomerBank
~(30)%
30-Jun-10 31-Dec-10 2013Ambition
30 Jun 2010
31 Dec2010
2013ambition(1)
Alignment of risk models
— … while protecting the p&l
— Selective growth plan in core client business(1) Excludes impacts from introduction of Basel 2.5 / 3(2) TCD = Total Capital Demand = RWA + 12.5 x Tier 1 impact of Capital Deduction Items
Bank
PBC Investor & Analyst Workshop15 June 2011
Deutsche BankInvestor Relations
financial transparency. 45
( ) p p p(3) Take-over offer from DB in Sept 2011 Note: 30 June 2010 figures reflect Postbank stand-alone, thereafter as part of Deutsche Bank consolidated

RWA outlook PBC ex PostbankG th hil i t i i t i t d iti it i
45
Growth while maintaining strict underwriting criteria
— RWA growth plan underpins strategic importance PBC RWA development by productIn EUR bn
Business products37
45 of lending for PBC
— Strategic shift towards interest income
— Increased share of recurrent revenues
In EUR bn
MortgagesConsumer Finance
Other(1)
— RWA growth supported by limited impact from Basel 3 on PBC
— RWA allocation based on several parameters:
2010actuals
Mortgages
2013ambition
RWA allocation based on several parameters: profitability, risk assessment, macro-economic environment, available profitable funding
— Strong focus on our home market in Germany
PBC RWA development by regionIn EUR bn
3745 g y
and secured lending. Selected growth in Europe / International book with affluent clients and strict u/w criteria
37
International
Germany
— Profitable funding of loan growth is possible –PBC’s status as liquidity provider remains unchanged
2013ambition
2010actuals
PBC Investor & Analyst Workshop15 June 2011
Deutsche BankInvestor Relations
financial transparency. 46
(1) ‘Others’ include RWA for allocations from infrastructure divisions and operational risks
Cautionary statements
This presentation contains forward-looking statements. Forward-looking statements are statements that are not historicalThis presentation contains forward looking statements. Forward looking statements are statements that are not historicalfacts; they include statements about our beliefs and expectations and the assumptions underlying them. Thesestatements are based on plans, estimates and projections as they are currently available to the management of DeutscheBank. Forward-looking statements therefore speak only as of the date they are made, and we undertake no obligation toupdate publicly any of them in light of new information or future eventsupdate publicly any of them in light of new information or future events.
By their very nature, forward-looking statements involve risks and uncertainties. A number of important factors couldtherefore cause actual results to differ materially from those contained in any forward-looking statement. Such factorsinclude the conditions in the financial markets in Germany, in Europe, in the United States and elsewhere from which wey, p ,derive a substantial portion of our revenues and in which we hold a substantial portion of our assets, the development ofasset prices and market volatility, potential defaults of borrowers or trading counterparties, the implementation of ourstrategic initiatives, the reliability of our risk management policies, procedures and methods, and other risks referenced inour filings with the U S Securities and Exchange Commission Such factors are described in detail in our SEC Form 20-Four filings with the U.S. Securities and Exchange Commission. Such factors are described in detail in our SEC Form 20-Fof 15 March 2011 under the heading “Risk Factors.” Copies of this document are readily available upon request or can bedownloaded from www.deutsche-bank.com/ir.
This presentation also contains non-IFRS financial measures. For a reconciliation to directly comparable figures reportedp y p g punder IFRS, to the extent such reconciliation is not provided in this presentation, refer to the 1Q2011 Financial DataSupplement, which is accompanying this presentation and available at www.deutsche-bank.com/ir.
PBC Investor & Analyst Workshop15 June 2011
Deutsche BankInvestor Relations
financial transparency. 47