Embed Size (px)
Citation preview
Investor Presentation
March, 2015
POLARIS INDUSTRIES INC.
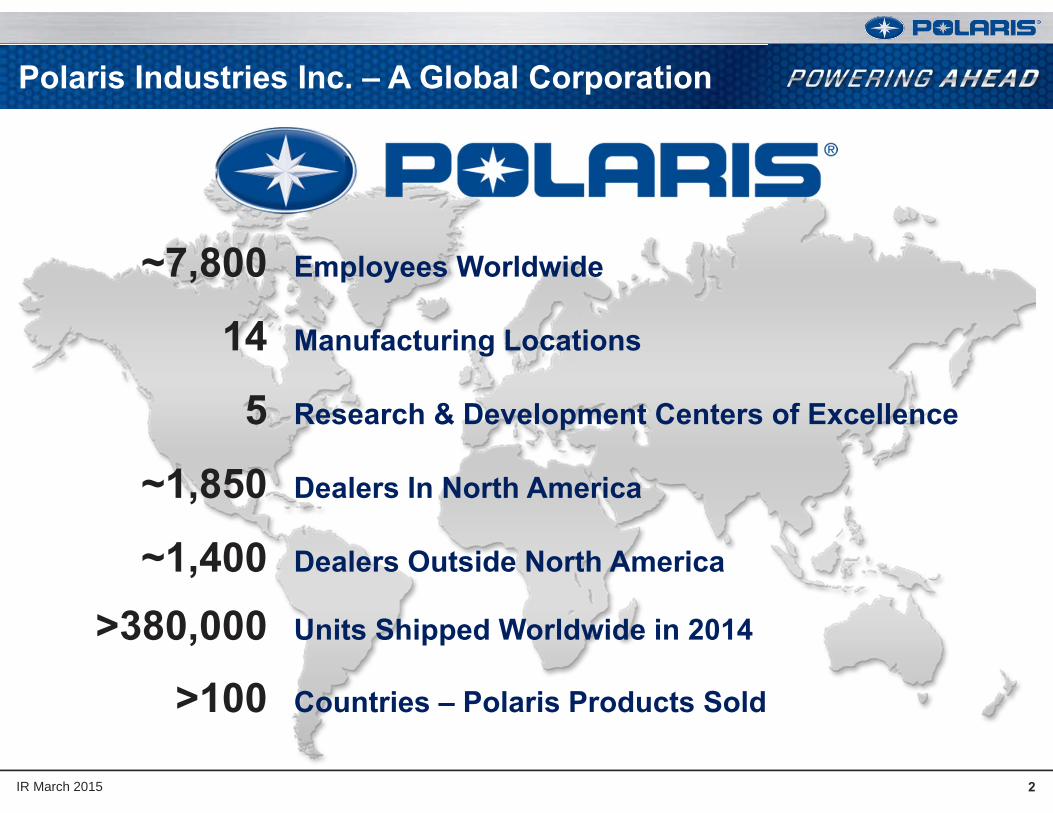
Polaris Industries Inc. – A Global Corporation
~7,800 Employees Worldwide
14 Manufacturing Locations
5 Research & Development Centers of Excellence
~1,850 Dealers In North America
~1,400 Dealers Outside North America
>380,000 Units Shipped Worldwide in 2014
>100 Countries – Polaris Products Sold
IR March 2015 2
3
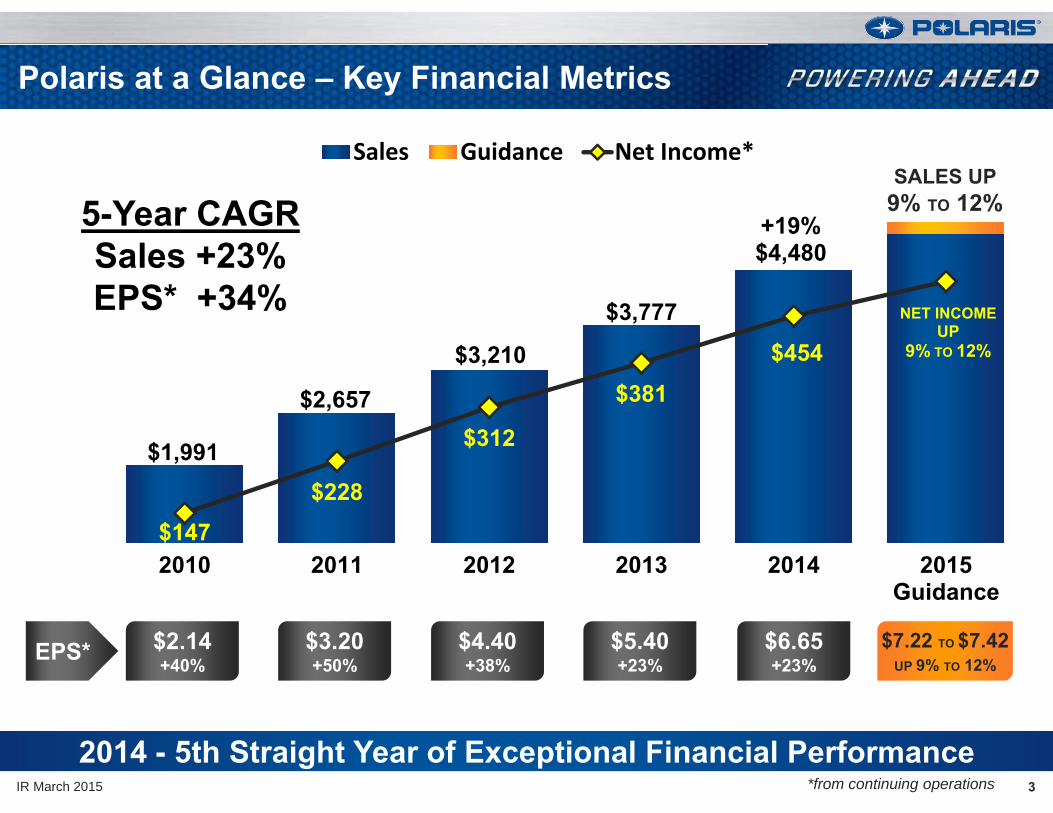
Polaris at a Glance – Key Financial Metrics
IR March 2015
$1,991
$2,657
$3,210
$3,777
+19%$4,480
$147$228
$312
$381
$454
NET INCOMEUP
9% TO 12%
2010 2011 2012 2013 2014 2015Guidance
Sales Guidance Net Income*
2014 - 5th Straight Year of Exceptional Financial Performance
SALES UP9% TO 12%
EPS* $2.14+40%
$7.22 TO $7.42UP 9% TO 12%
5-Year CAGRSales +23%EPS* +34%
$3.20+50%
$4.40+38%
$5.40+23%
$6.65+23%
*from continuing operations
4
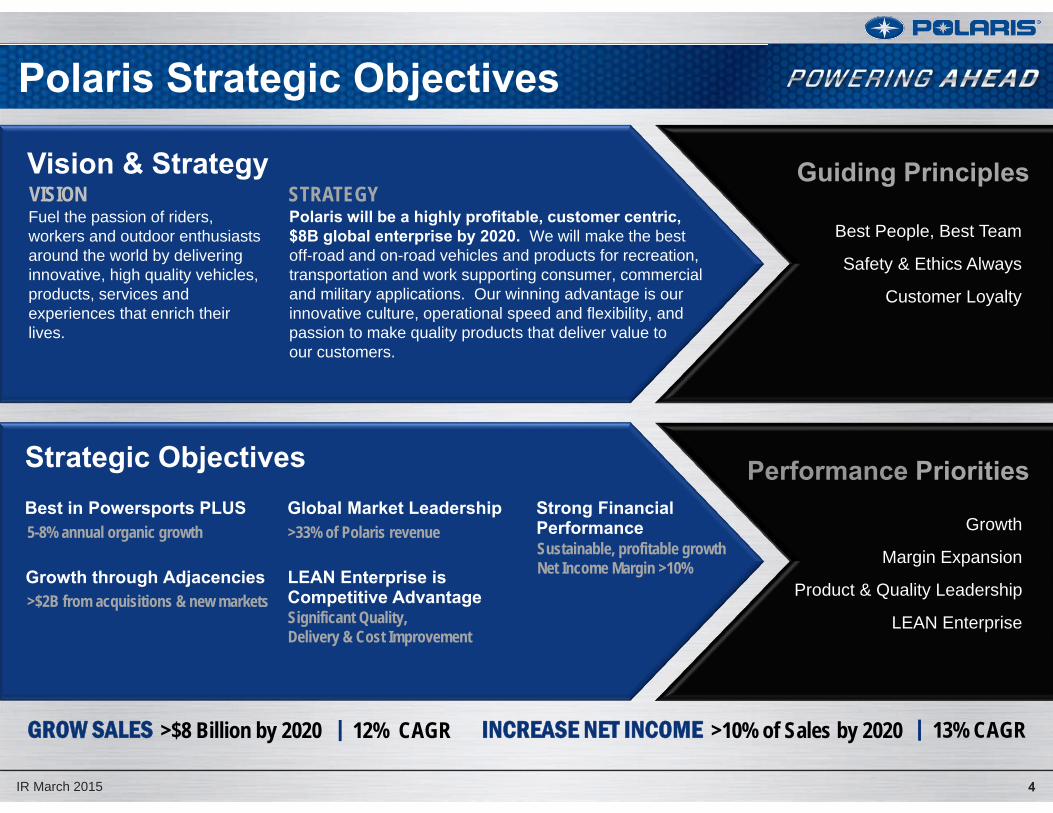
Polaris Strategic Objectives
IR March 2015
Vision & Strategy
Strategic Objectives
VISION STRATEGYFuel the passion of riders, workers and outdoor enthusiasts around the world by delivering innovative, high quality vehicles, products, services and experiences that enrich their lives.
Polaris will be a highly profitable, customer centric, $8B global enterprise by 2020. We will make the best off-road and on-road vehicles and products for recreation, transportation and work supporting consumer, commercial and military applications. Our winning advantage is our innovative culture, operational speed and flexibility, and passion to make quality products that deliver value to our customers.
Best in Powersports PLUS Global Market Leadership Strong Financial Performance
Growth through Adjacencies LEAN Enterprise is Competitive Advantage
5-8% annual organic growth >33% of Polaris revenue
>$2B from acquisitions & new markets Significant Quality, Delivery & Cost Improvement
Sustainable, profitable growthNet Income Margin >10%
Guiding Principles
Performance Priorities
Best People, Best Team
Safety & Ethics Always
Customer Loyalty
Growth
Margin Expansion
Product & Quality Leadership
LEAN Enterprise
GROW SALES >$8 Billion by 2020 12% CAGR INCREASE NET INCOME >10% of Sales by 2020 13% CAGR
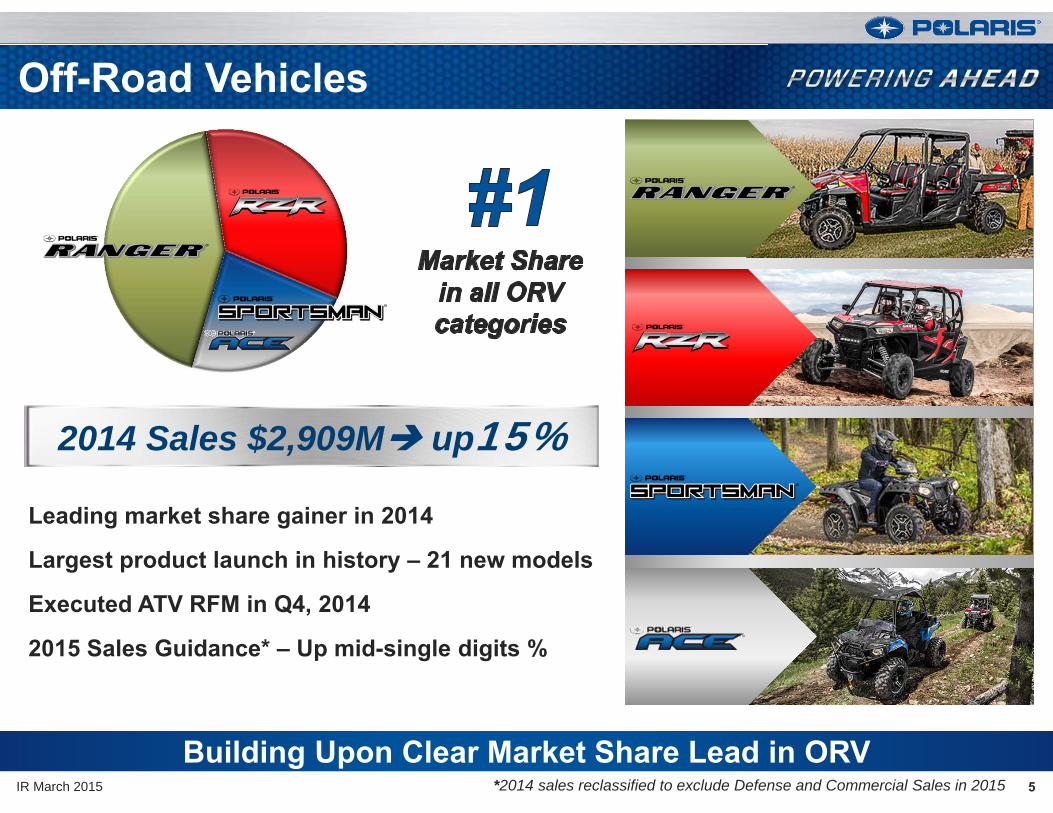
Off-Road Vehicles
Leading market share gainer in 2014
Largest product launch in history – 21 new models
Executed ATV RFM in Q4, 2014
2015 Sales Guidance* – Up mid-single digits %
5IR March 2015
Building Upon Clear Market Share Lead in ORV*2014 sales reclassified to exclude Defense and Commercial Sales in 2015
2014 Sales $2,909M up15%
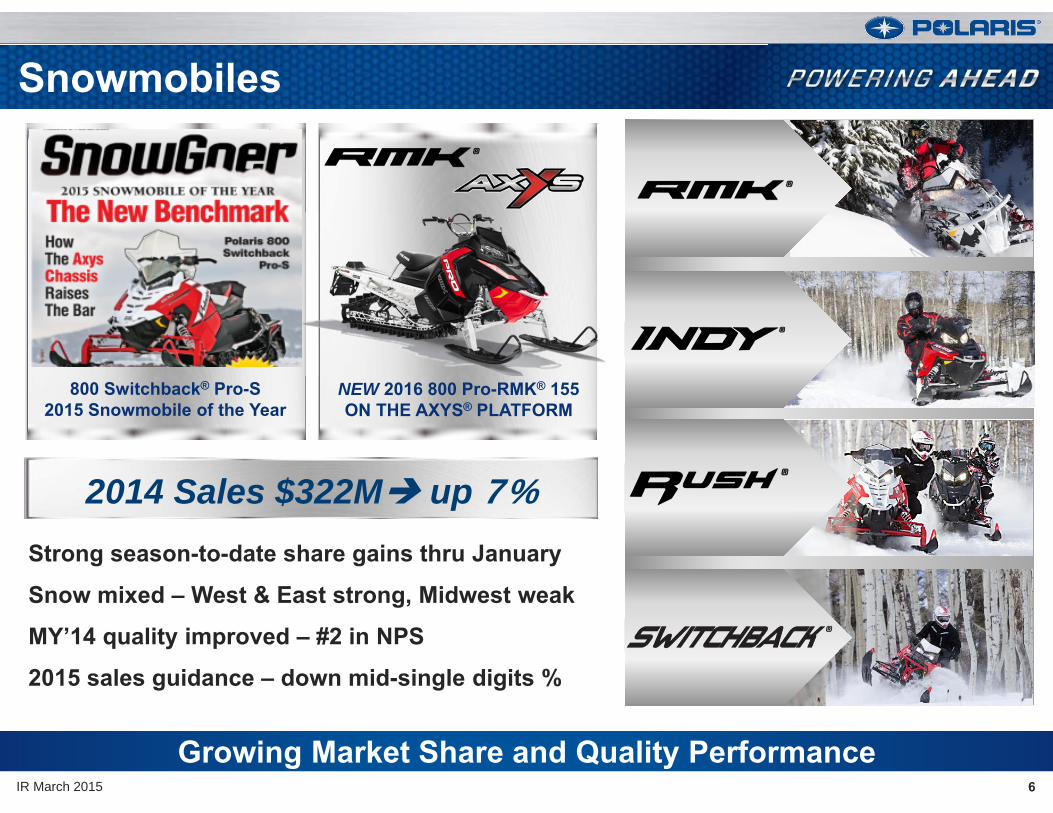
Snowmobiles
Strong season-to-date share gains thru January
Snow mixed – West & East strong, Midwest weak
MY’14 quality improved – #2 in NPS
2015 sales guidance – down mid-single digits %
6IR March 2015
Growing Market Share and Quality Performance
800 Switchback® Pro-S2015 Snowmobile of the Year
2014 Sales $322M up 7%
NEW 2016 800 Pro-RMK® 155 ON THE AXYS® PLATFORM
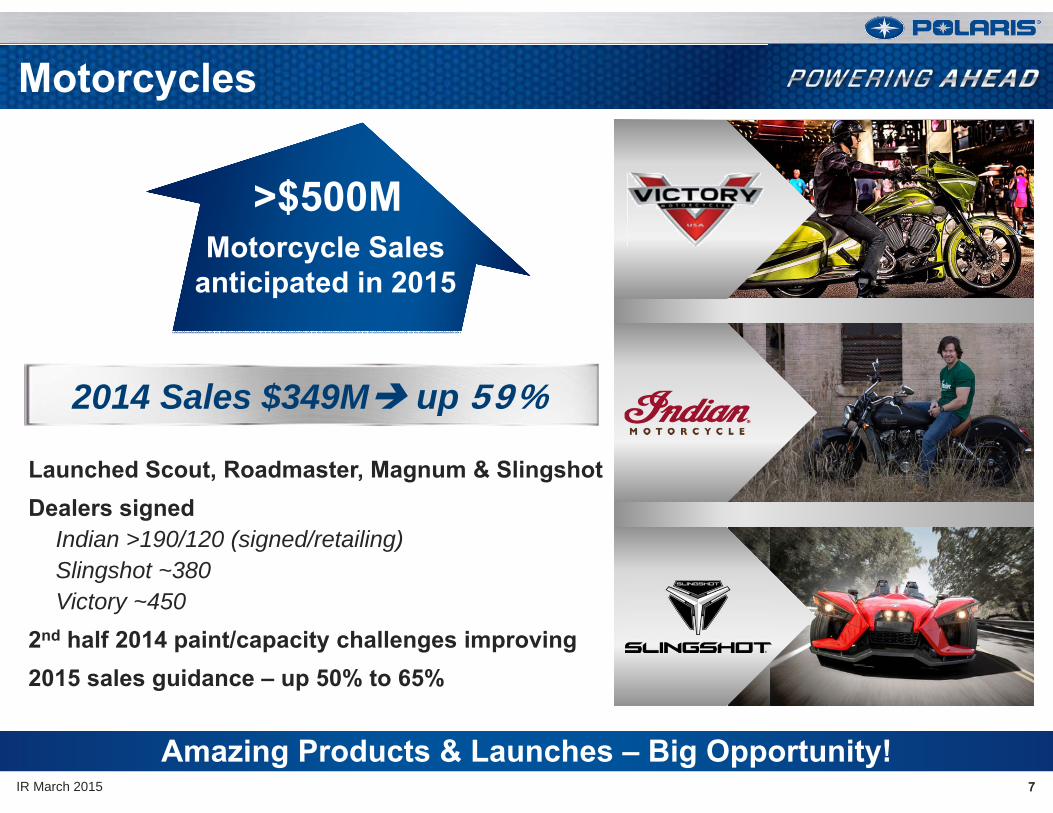
Motorcycles
Launched Scout, Roadmaster, Magnum & SlingshotDealers signed
Indian >190/120 (signed/retailing)Slingshot ~380Victory ~450
2nd half 2014 paint/capacity challenges improving2015 sales guidance – up 50% to 65%
7IR March 2015
Amazing Products & Launches – Big Opportunity!
>$500MMotorcycle Sales
anticipated in 2015
2014 Sales $349M up 59%

PG&A
8IR March 2015
Growing House Brands; Leveraging Aftermarket BrandsPG&A Sales by Category & Product Line
Innovation ongoing>400 new accessories>200 new apparel items
Expanded SMART implementationLeveraging aftermarket brand portfolio2015 sales guidance - up high-teens %
Aftermarket Brand Portfolio
Growing House Brands; Leveraging Aftermarket Brands
House Brand Portfolio
60,000+SKUs
2,500+ SKUs
2,000+ SKUs
1,000+ SKUs
Accessories
MotorcyclesSmallVehicles
Other
GarmentsSnow
Parts
Off-RoadVehicles
2014 Sales $742M up 21%
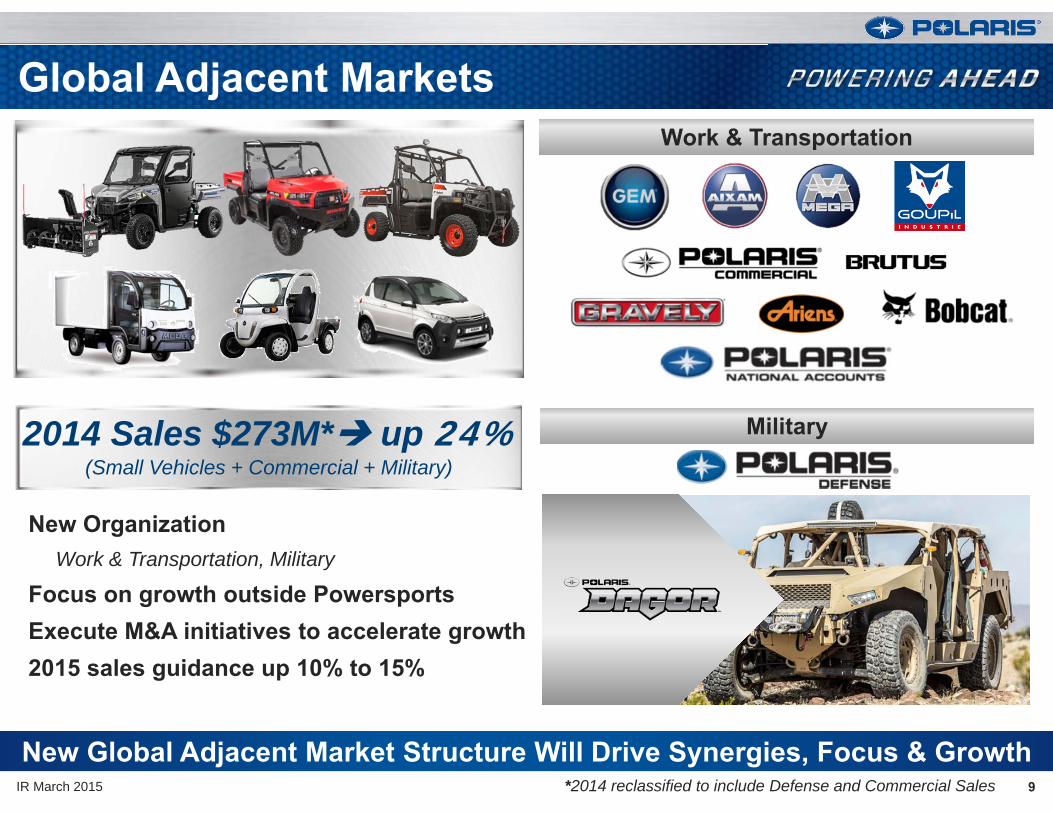
Global Adjacent Markets
9IR March 2015
Work & Transportation
New OrganizationWork & Transportation, Military
Focus on growth outside PowersportsExecute M&A initiatives to accelerate growth2015 sales guidance up 10% to 15%
Military
New Global Adjacent Market Structure Will Drive Synergies, Focus & Growth*2014 reclassified to include Defense and Commercial Sales
2014 Sales $273M* up 24%(Small Vehicles + Commercial + Military)
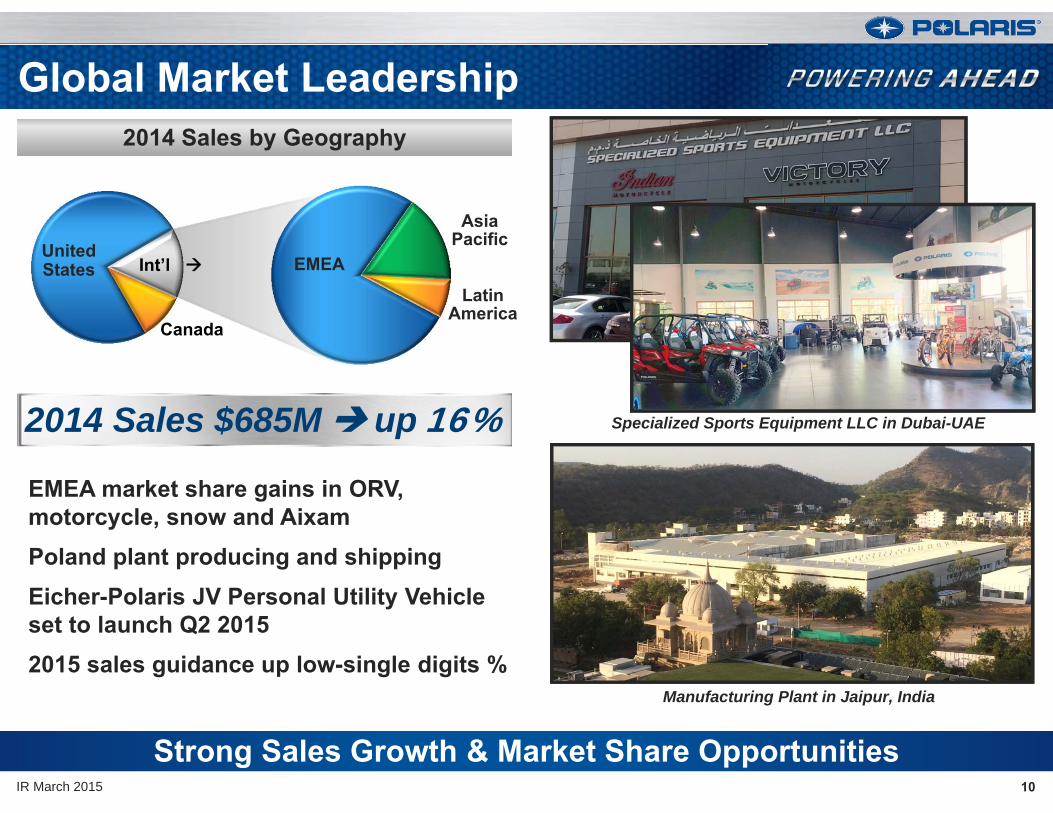
EMEA
Asia Pacific
Latin America
Global Market Leadership
10IR March 2015
2014 Sales by Geography
Strong Sales Growth & Market Share Opportunities
EMEA market share gains in ORV, motorcycle, snow and AixamPoland plant producing and shippingEicher-Polaris JV Personal Utility Vehicle set to launch Q2 20152015 sales guidance up low-single digits %
Int’l
Canada
United States
2014 Sales $685M up 16%
Manufacturing Plant in Jaipur, India
Specialized Sports Equipment LLC in Dubai-UAE
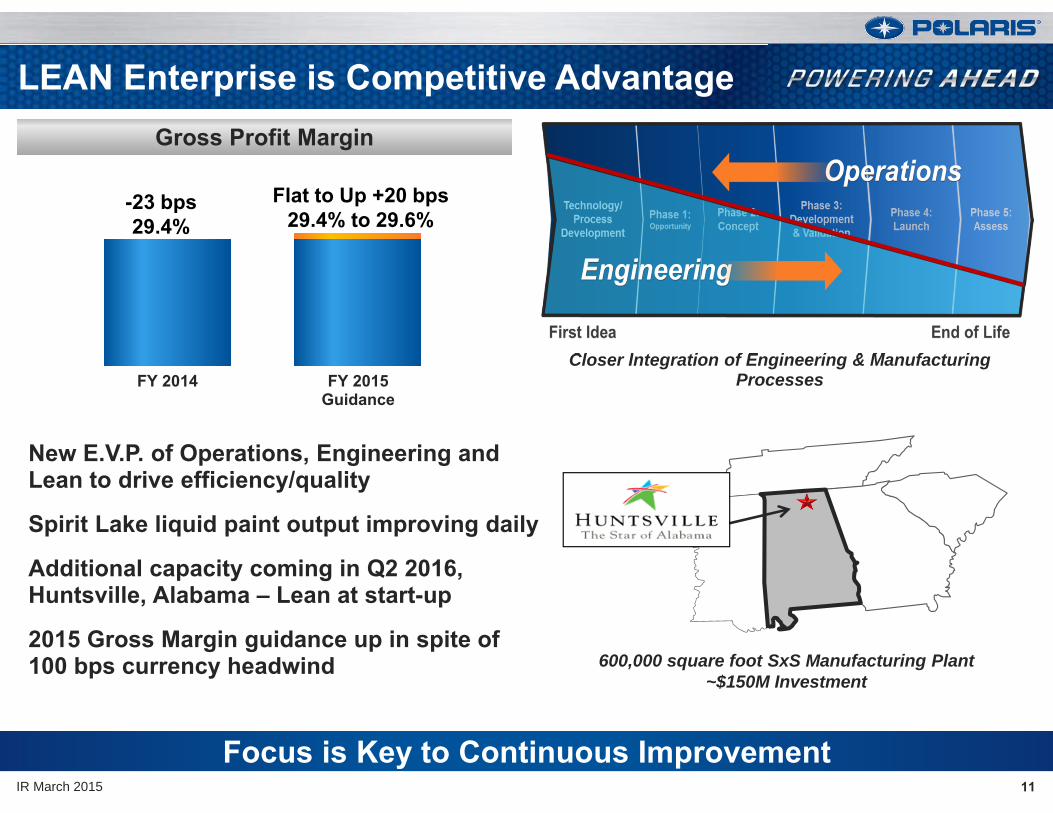
FY 2014 FY 2015Guidance
LEAN Enterprise is Competitive Advantage
11IR March 2015
Gross Profit Margin
New E.V.P. of Operations, Engineering and Lean to drive efficiency/quality
Spirit Lake liquid paint output improving daily
Additional capacity coming in Q2 2016, Huntsville, Alabama – Lean at start-up
2015 Gross Margin guidance up in spite of 100 bps currency headwind
Closer Integration of Engineering & Manufacturing Processes
Focus is Key to Continuous Improvement
-23 bps29.4%
Flat to Up +20 bps29.4% to 29.6%
600,000 square foot SxS Manufacturing Plant~$150M Investment
Leadership Focus on Sustainable, Profitable Growth12
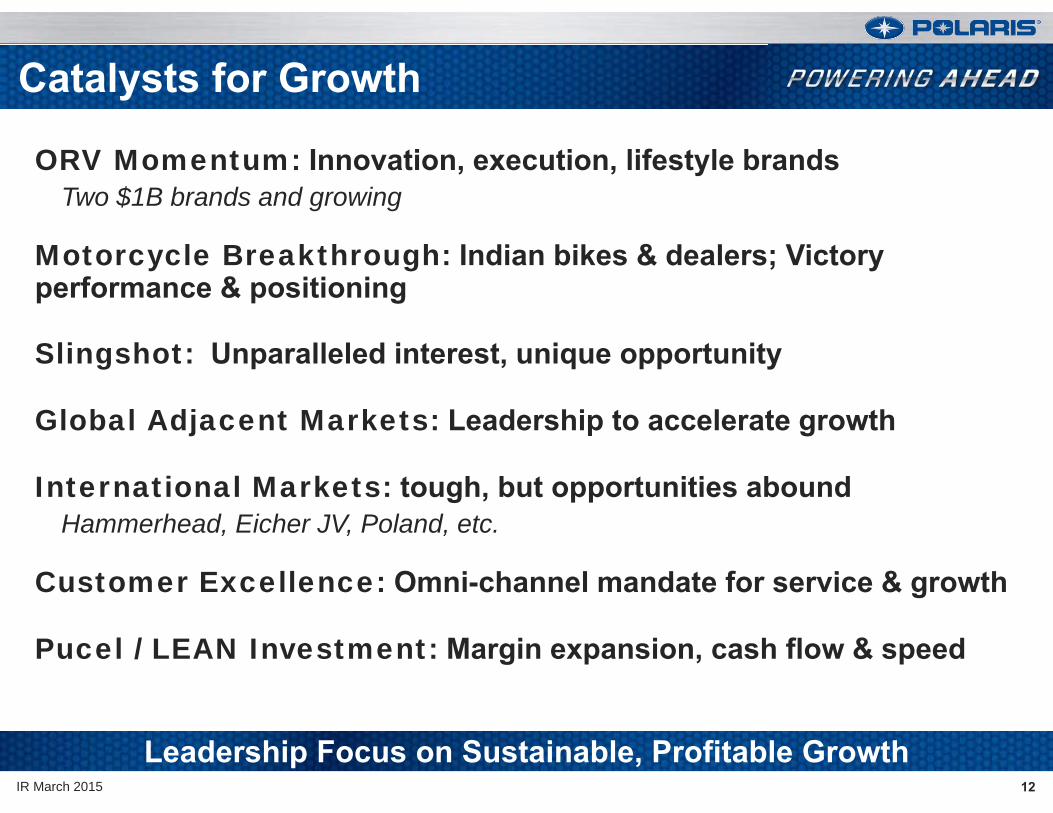
Catalysts for Growth
IR March 2015
ORV Momentum: Innovation, execution, lifestyle brandsTwo $1B brands and growing
Motorcycle Breakthrough: Indian bikes & dealers; Victory performance & positioning
Slingshot: Unparalleled interest, unique opportunity
Global Adjacent Markets: Leadership to accelerate growth
International Markets: tough, but opportunities aboundHammerhead, Eicher JV, Poland, etc.
Customer Excellence: Omni-channel mandate for service & growth
Pucel / LEAN Investment: Margin expansion, cash flow & speed
14
Appendices
IR March 2015
Slide5-Year Financial Performance 16N.A. Retail Sales & Dealer Inventory – Full Year 2014 17New Product Introductions (MY’15 & Early MY’16) 18Slingshot 192015 Full Year Detailed Guidance 202015 Gross Profit Margin Guidance 21Major Foreign Currencies for Polaris 22Balance Sheet and Liquidity Profile 23Global Manufacturing Operations 24Customer Profiles 25
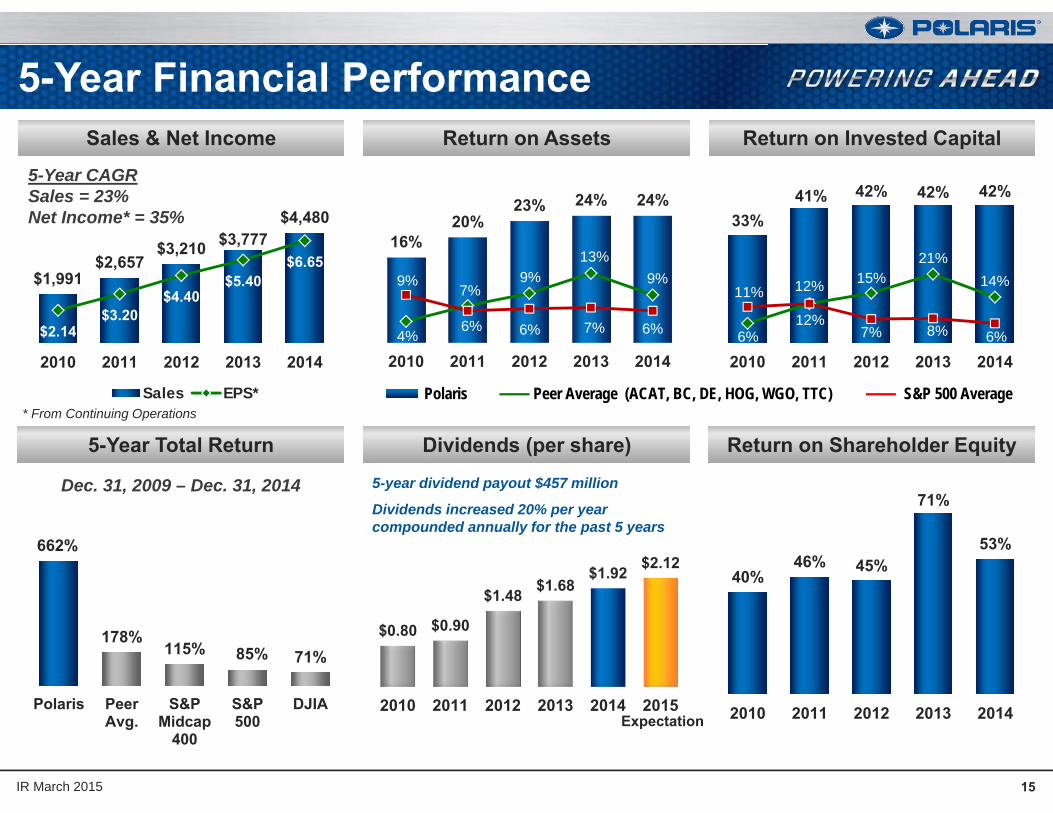
Return on Invested CapitalReturn on Assets
5-Year Financial Performance
15IR March 2015
Sales & Net Income
Return on Shareholder EquityDividends (per share)5-Year Total Return
16%20%
23% 24% 24%
4%
7%9%
13%9%9%
6% 6% 7% 6%
2010 2011 2012 2013 2014
33%41% 42% 42% 42%
6%12%
15%21%
14%11% 12%
7% 8% 6%
2010 2011 2012 2013 2014
$1,991 $2,657
$3,210 $3,777 $4,480
$2.14$3.20
$4.40$5.40
$6.65
2010 2011 2012 2013 2014
Sales EPS*
662%
178%115% 85% 71%
Polaris PeerAvg.
S&PMidcap
400
S&P500
DJIA
40%46% 45%
71%
53%
2010 2011 2012 2013 2014
5-Year CAGRSales = 23%Net Income* = 35%
Polaris Peer Average (ACAT, BC, DE, HOG, WGO, TTC) S&P 500 Average
$0.80 $0.90
$1.48 $1.68$1.92 $2.12
2010 2011 2012 2013 2014 2015
5-year dividend payout $457 million
Dividends increased 20% per year compounded annually for the past 5 years
Expectation
Dec. 31, 2009 – Dec. 31, 2014
* From Continuing Operations

2013 2014
N.A. Retail Sales & Dealer Inventory – FY 2014
Dealer Inventory Up, but Remains Appropriate, Opportunities Exist
N.A. Dealer InventoryN.A. Powersports Market Share & Retail Sales
Polaris N.A. retail 13% for Q4 and 12% FY 2014 vs. 2013Gained share in ORV, motorcycles and snowmobiles season-to-date
Polaris year-end 2014 N.A. dealer inventory 16% vs. 2013ORV high-teens % driven primarily by new models and market segments; ATVs moving to RFM Indian motorcycles ; Victory year-over-year; Slingshot began shipping in November 2014; stockouts Snowmobiles and Small Vehicles single-digits %
ATV dealers using RFM process beginning Q4 2014
2010 2011 2012 2013 2014 Polaris Industry
+5%
+12%
IR March 2015 16
Consolidated Market Share in UnitsUsing Total Motorcycle Industry
Retail SalesMarket Share4% Existing Models
8% New models/ categories
4% New Dealers
16% Total Increase
+16%

21N
EW O
ff-R
oad
Vehi
cles
6N
EW M
otor
cycl
es
17IR March 2015
NEW MY’15 & Early ’16 Products
Industry-Leading Products in All Categories
PG&
A
Over 400 NEW Accessories; >200 NEW Apparel
XP 1000High Lifter Edition
900 TRAIL, 50” S 900, 60”
900 XC EDITION XP 4 1000
XP 1000 XP 1000
ACE 570
ETX
X2 570
TOURING570 SP
TOURINGXP 1000
ETX 570 570 FULL SIZE
CREW 570 CREW 570 FULL SIZEXP900
MAGNUM
ROADMASTER
SLINGSHOT / SLINGSHOT SL
SCOUT
DARKHORSE
4 900
CREW 900-6
DIESEL HST
Slingshot
18IR March 2015
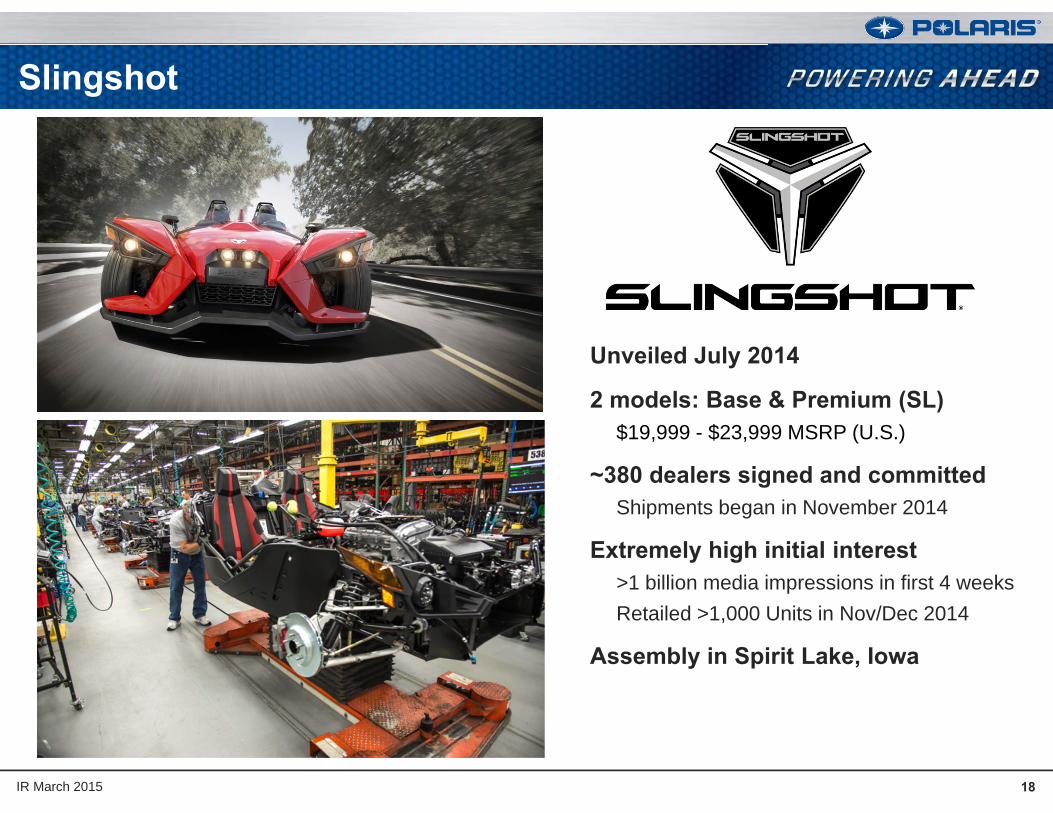
Unveiled July 2014
2 models: Base & Premium (SL)$19,999 - $23,999 MSRP (U.S.)
~380 dealers signed and committedShipments began in November 2014
Extremely high initial interest>1 billion media impressions in first 4 weeksRetailed >1,000 Units in Nov/Dec 2014
Assembly in Spirit Lake, Iowa
19
2015 Full Year Guidance
IR March 2015
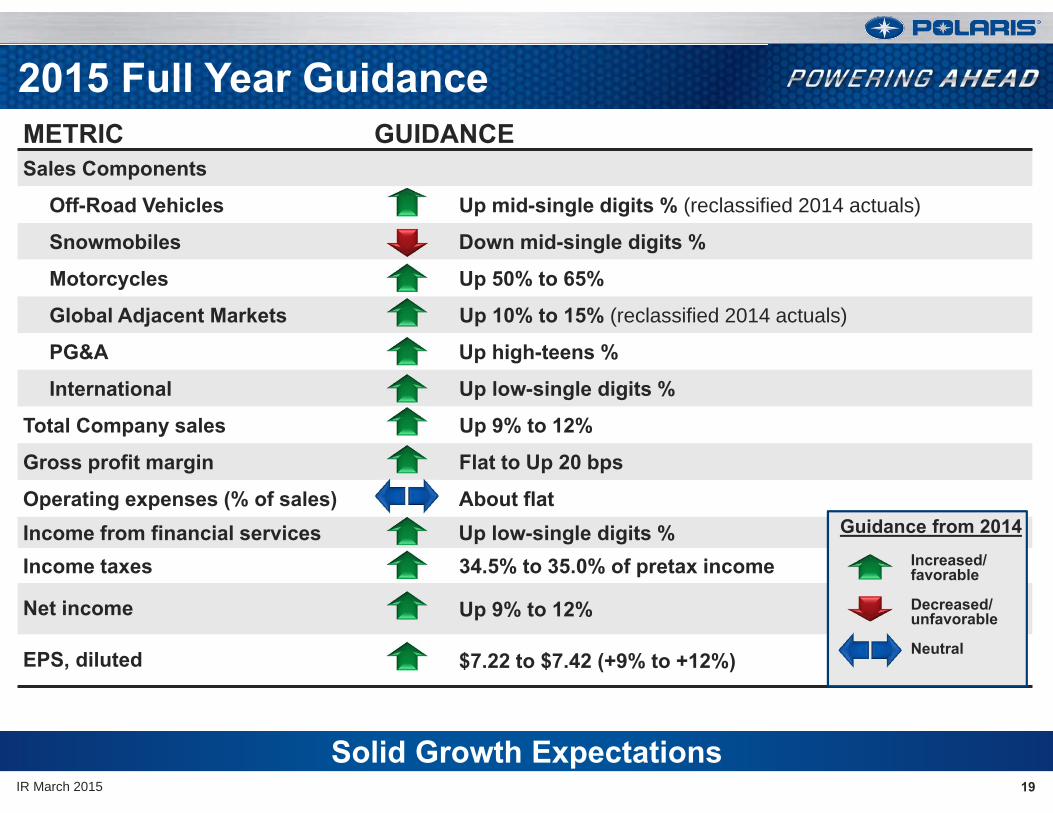
METRIC GUIDANCESales Components
Off-Road Vehicles Up mid-single digits % (reclassified 2014 actuals)
Snowmobiles Down mid-single digits %
Motorcycles Up 50% to 65%
Global Adjacent Markets Up 10% to 15% (reclassified 2014 actuals)
PG&A Up high-teens %
International Up low-single digits %
Total Company sales Up 9% to 12%
Gross profit margin Flat to Up 20 bps
Operating expenses (% of sales) About flatIncome from financial services Up low-single digits %Income taxes 34.5% to 35.0% of pretax income
Net income Up 9% to 12%
EPS, diluted $7.22 to $7.42 (+9% to +12%)
Solid Growth Expectations
Guidance from 2014Increased/ favorable
Decreased/unfavorable
Neutral
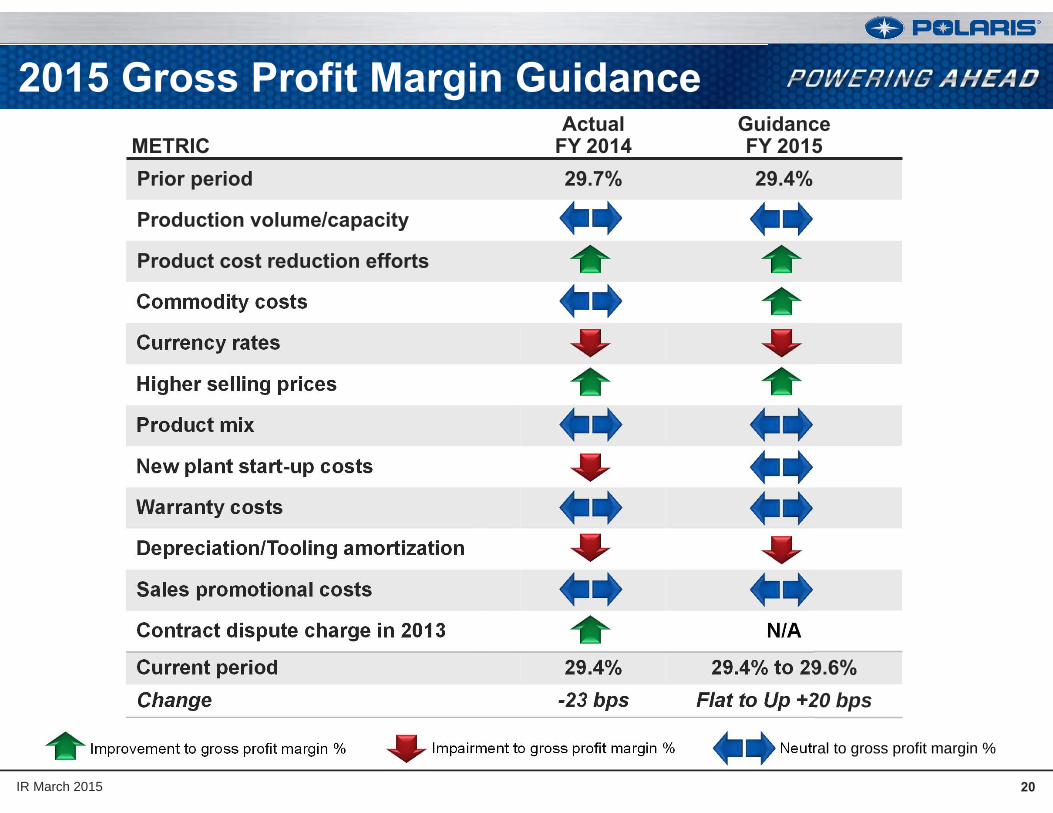
2015 Gross Profit Margin Guidance
20IR March 2015
METRICActual
FY 2014GuidanceFY 2015
Prior period 29.7% 29.4%
Production volume/capacity
Product cost reduction efforts
Commodity costs
Currency rates
Higher selling prices
Product mix
New plant start-up costs
Warranty costs
Depreciation/Tooling amortization
Sales promotional costs
Contract dispute charge in 2013 N/A
Current period 29.4% 29.4% to 29.6%Change -23 bps Flat to Up +20 bps
Improvement to gross profit margin % Impairment to gross profit margin % Neutral to gross profit margin %
Significant Impact in 2014, Pressure Expected to Persist into 201521
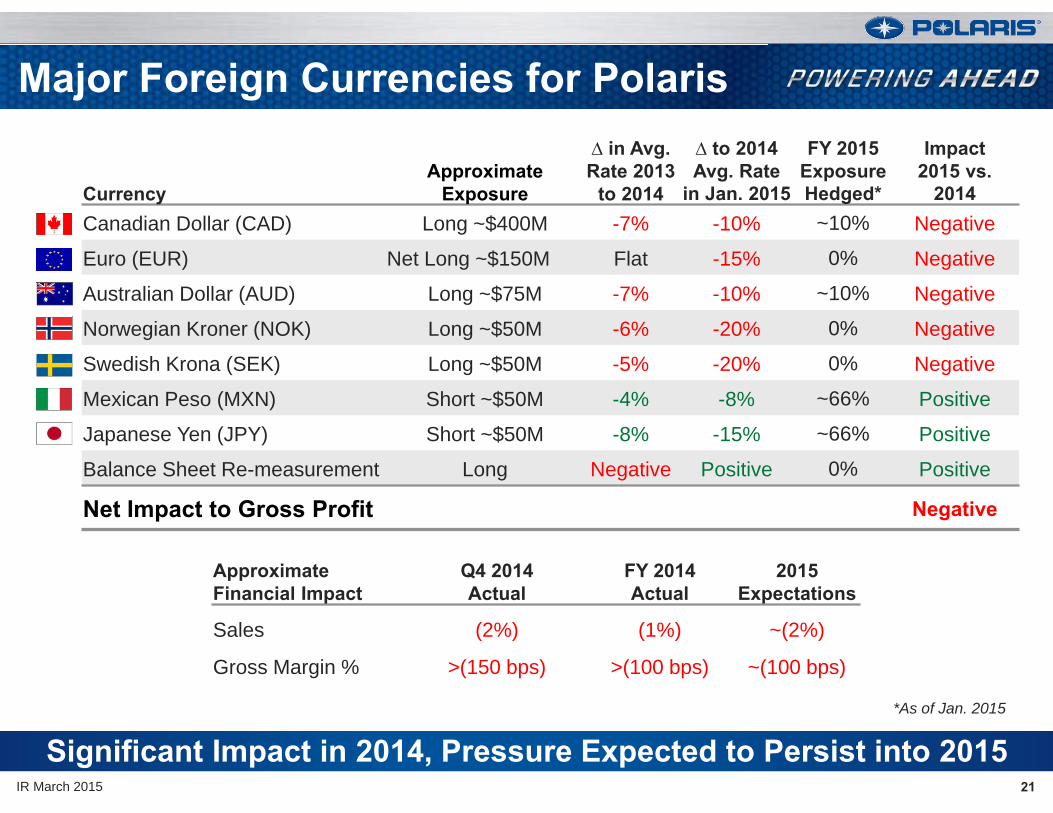
Major Foreign Currencies for Polaris
IR March 2015
CurrencyApproximate
Exposure
∆ in Avg.Rate 2013
to 2014
∆ to 2014Avg. Rate
in Jan. 2015
FY 2015 Exposure Hedged*
Impact2015 vs.
2014Canadian Dollar (CAD) Long ~$400M -7% -10% ~10% Negative
Euro (EUR) Net Long ~$150M Flat -15% 0% Negative
Australian Dollar (AUD) Long ~$75M -7% -10% ~10% Negative
Norwegian Kroner (NOK) Long ~$50M -6% -20% 0% Negative
Swedish Krona (SEK) Long ~$50M -5% -20% 0% Negative
Mexican Peso (MXN) Short ~$50M -4% -8% ~66% Positive
Japanese Yen (JPY) Short ~$50M -8% -15% ~66% Positive
Balance Sheet Re-measurement Long Negative Positive 0% Positive
Net Impact to Gross Profit Negative
ApproximateFinancial Impact
Q4 2014Actual
FY 2014Actual
2015Expectations
Sales (2%) (1%) ~(2%)
Gross Margin % >(150 bps) >(100 bps) ~(100 bps)
*As of Jan. 2015

22
Balance Sheet and Liquidity Profile
IR March 2015
$ In millions (except per share and rate data) FY 2014
Fav / (UnFav)FY 2013 2015 Full Year Guidance
Cash $137.6 49% Increase
Debt / Capital lease obligations $226.1 21% Unchanged
Credit facility $350.0 Flat Unchanged
Factory inventory $565.7 (35%) Improved Turns
Capital expenditures $205.1 8% >$250M
Depreciation and amortization $127.5 38% Increase about 25% from 2014
Operating cash flowfrom continuing operations $529.3 6% Increase at higher % than net income
Dividend (per share) $1.92 14% Increase 10% over 2014
Polaris Acceptance receivables $1,141.1 23% About flat with 2014
Retail credit – Volume– Approval rate– Penetration rate
$903.758%32%
16%FlatFlat
Rates stable
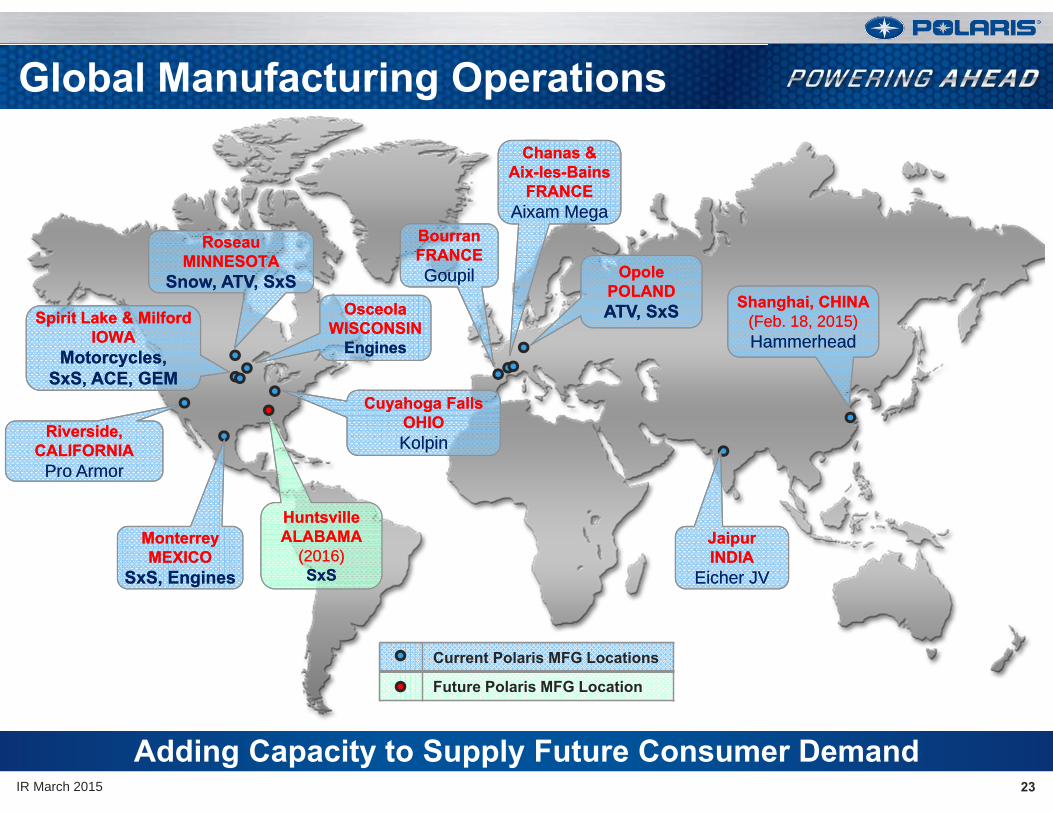
Global Manufacturing Operations
23IR March 2015
Adding Capacity to Supply Future Consumer Demand
Current Polaris MFG Locations
Future Polaris MFG Location
Monterrey MEXICO
SxS, Engines
Monterrey MEXICO
SxS, Engines
Spirit Lake & MilfordIOWA
Motorcycles,SxS, ACE, GEM
Spirit Lake & MilfordIOWA
Motorcycles,SxS, ACE, GEM
RoseauMINNESOTA
Snow, ATV, SxS
RoseauMINNESOTA
Snow, ATV, SxSOsceola
WISCONSINEngines
OsceolaWISCONSIN
Engines
BourranFRANCEGoupil
BourranFRANCEGoupil
Chanas &Aix-les-Bains
FRANCEAixam Mega
Chanas &Aix-les-Bains
FRANCEAixam Mega
OpolePOLANDATV, SxS
OpolePOLANDATV, SxS
JaipurINDIA
Eicher JV
JaipurINDIA
Eicher JV
HuntsvilleALABAMA
(2016)SxS
HuntsvilleALABAMA
(2016)SxS
Cuyahoga FallsOHIO Kolpin
Cuyahoga FallsOHIO Kolpin
Riverside, CALIFORNIA
Pro Armor
Riverside, CALIFORNIA
Pro Armor
Shanghai, CHINA(Feb. 18, 2015)Hammerhead
Shanghai, CHINA(Feb. 18, 2015)Hammerhead
24
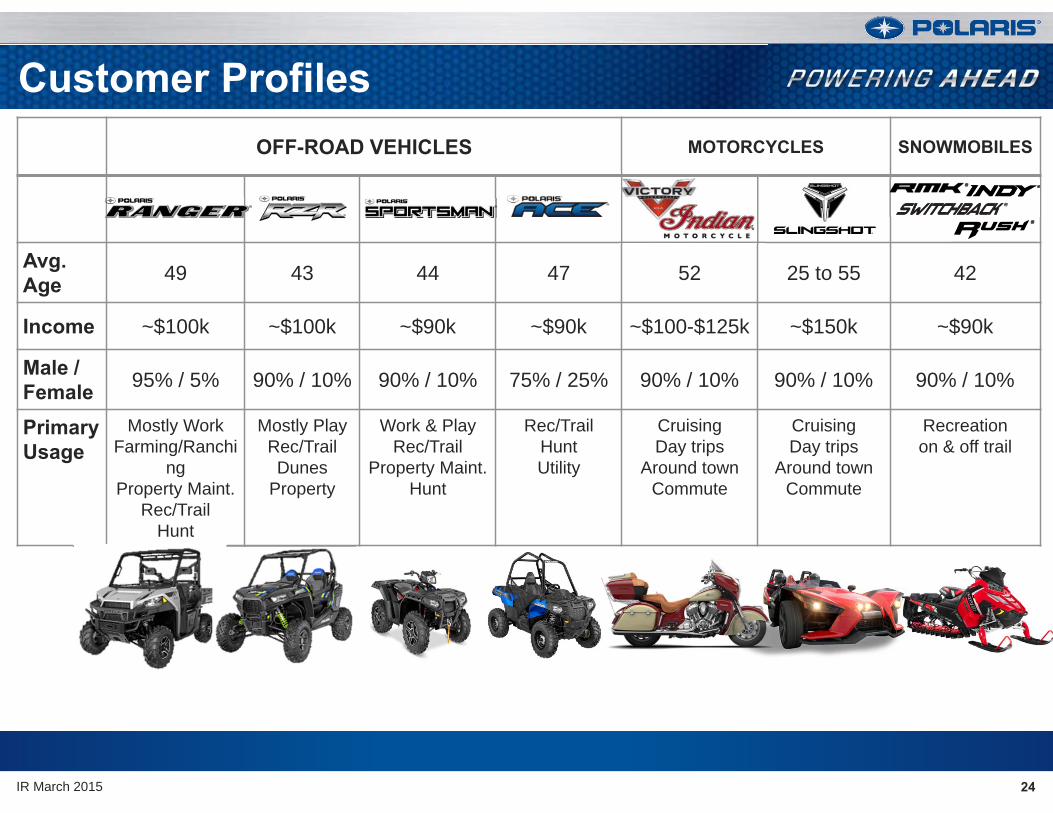
Customer Profiles
IR March 2015
OFF-ROAD VEHICLES MOTORCYCLES SNOWMOBILES
Avg.Age 49 43 44 47 52 25 to 55 42
Income ~$100k ~$100k ~$90k ~$90k ~$100-$125k ~$150k ~$90k
Male / Female 95% / 5% 90% / 10% 90% / 10% 75% / 25% 90% / 10% 90% / 10% 90% / 10%
Primary Usage
Mostly WorkFarming/Ranchi
ngProperty Maint.
Rec/TrailHunt
Mostly PlayRec/TrailDunes
Property
Work & PlayRec/Trail
Property Maint.Hunt
Rec/TrailHuntUtility
CruisingDay trips
Around townCommute
CruisingDay trips
Around townCommute
Recreationon & off trail

25
Safe Harbor
IR March 2015
Except for historical information contained herein, the matters set forth in this document, including but not limited to management’s expectations regarding 2015 sales, shipments, margins, net income and cash flow, the opportunities for expansion and diversification of the Company’s business and the Company’s guidance on earnings per share from continuing operations are forward-looking statements that involve certain risks and uncertainties that could cause actual results to differ materially from those forward-looking statements. Potential risks and uncertainties include such factors as product offerings, promotional activities and pricing strategies by competitors; manufacturing operation initiatives; acquisition integration costs; warranty expenses; foreign currency exchange rate fluctuations; environmental and product safety regulatory activity; effects of weather; commodity costs; uninsured product liability claims; uncertainty in the retail and wholesale credit markets; performance of affiliate partners; changes in tax policy and overall economic conditions, including inflation, consumer confidence and spending and relationships with dealers and suppliers. Investors are also directed to consider other risks and uncertainties discussed in our 2014 annual report and Form 10-K filed by the Company with the Securities and Exchange Commission. The Company does not undertake any duty to any person to provide updates to its forward-looking statements.
The data source for retail sales figures included in this presentation is registration information provided by Polaris dealers in North America and compiled by the Company or Company estimates. The Company must rely on information that its dealers supply concerning retail sales, and other retail sales data sources and this information is subject to revision.