Embed Size (px)
Citation preview
12.07.201
2 1
IntraFish – Seafood Investor Forum London 31 October 2014
2
The Seafood case: Evolution, not revolution
1) A decade of industry evolution masked by a single event with double impact, Chile…
2) Lower supply growth going forward
3) Potential Re-rating of company valuations
Source: Kontali, DNB Markets
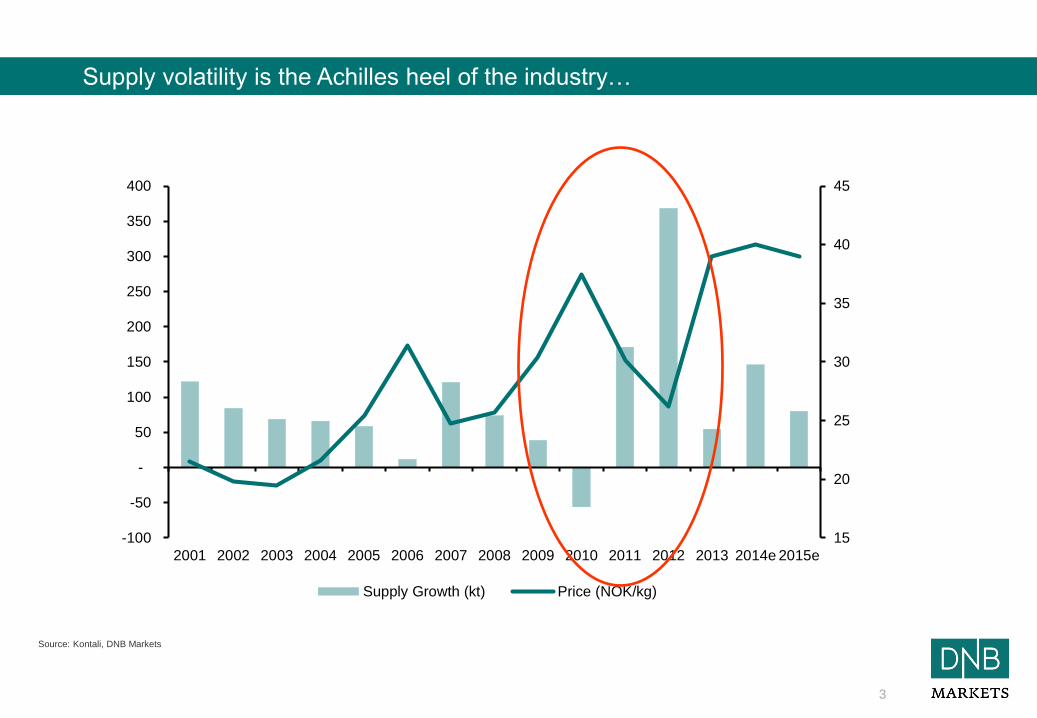
Supply volatility is the Achilles heel of the industry…
3
15
20
25
30
35
40
45
-100
-50
-
50
100
150
200
250
300
350
400
2001 2002 2003 2004 2005 2006 2007 2008 2009 2010 2011 2012 2013 2014e 2015e
Supply Growth (kt) Price (NOK/kg)
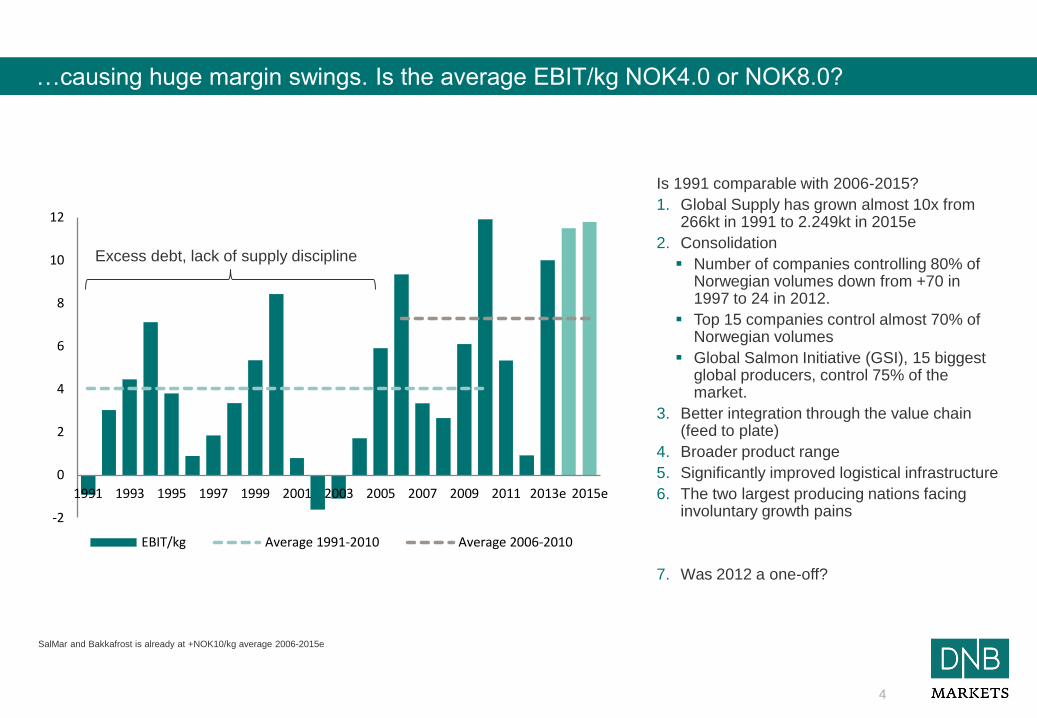
Is 1991 comparable with 2006-2015?
1. Global Supply has grown almost 10x from 266kt in 1991 to 2.249kt in 2015e
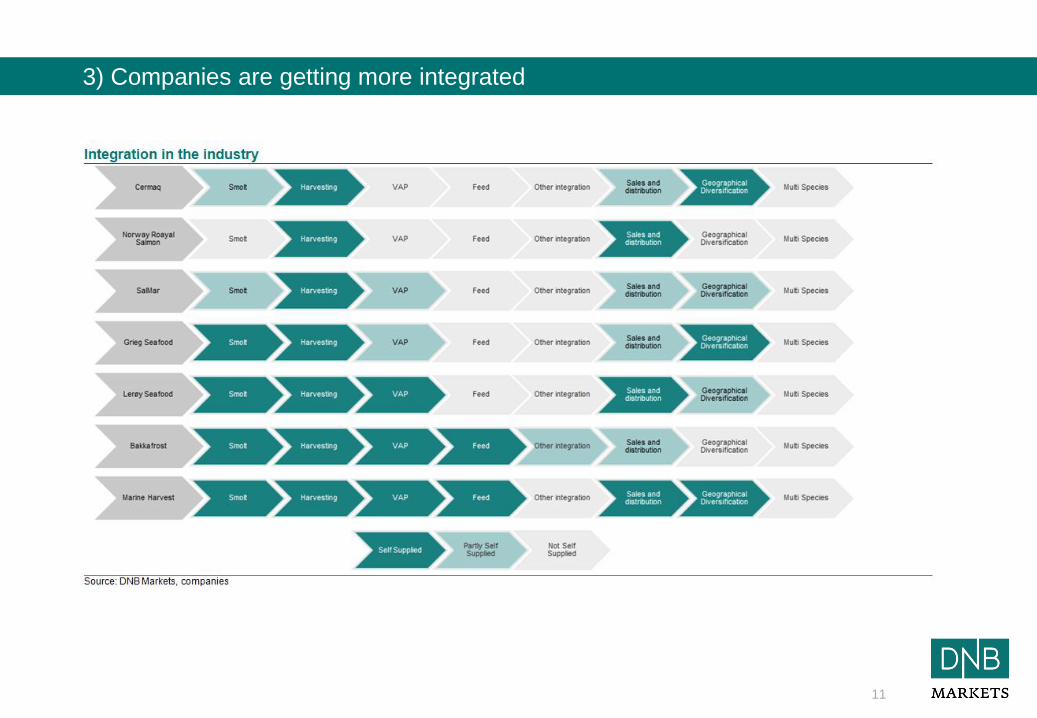
2. Consolidation
Number of companies controlling 80% of Norwegian volumes down from +70 in 1997 to 24 in 2012.
Top 15 companies control almost 70% of Norwegian volumes
Global Salmon Initiative (GSI), 15 biggest global producers, control 75% of the market.
3. Better integration through the value chain (feed to plate)
4. Broader product range
5. Significantly improved logistical infrastructure
6. The two largest producing nations facing involuntary growth pains
7. Was 2012 a one-off?
SalMar and Bakkafrost is already at +NOK10/kg average 2006-2015e
4
…causing huge margin swings. Is the average EBIT/kg NOK4.0 or NOK8.0?
-2
0
2
4
6
8
10
12
1991 1993 1995 1997 1999 2001 2003 2005 2007 2009 2011 2013e 2015e
EBIT/kg Average 1991-2010 Average 2006-2010
Excess debt, lack of supply discipline
Source: Kontali, DNB Markets
5
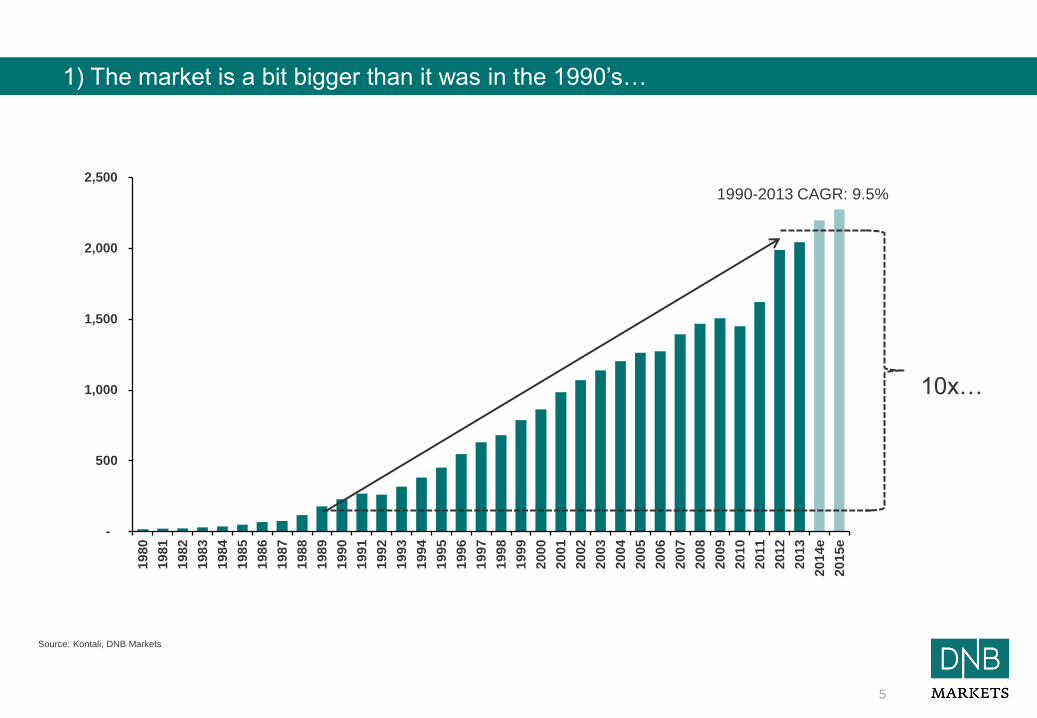
1) The market is a bit bigger than it was in the 1990’s…
-
500
1,000
1,500
2,000
2,500
19
80
19
81
19
82
19
83
19
84
19
85
19
86
19
87
19
88
19
89
19
90
19
91
19
92
19
93
19
94
19
95
19
96
19
97
19
98
19
99
20
00
20
01
20
02
20
03
20
04
20
05
20
06
20
07
20
08
20
09
20
10
20
11
20
12
20
13
20
14e
20
15e
1990-2013 CAGR: 9.5%
10x…
6
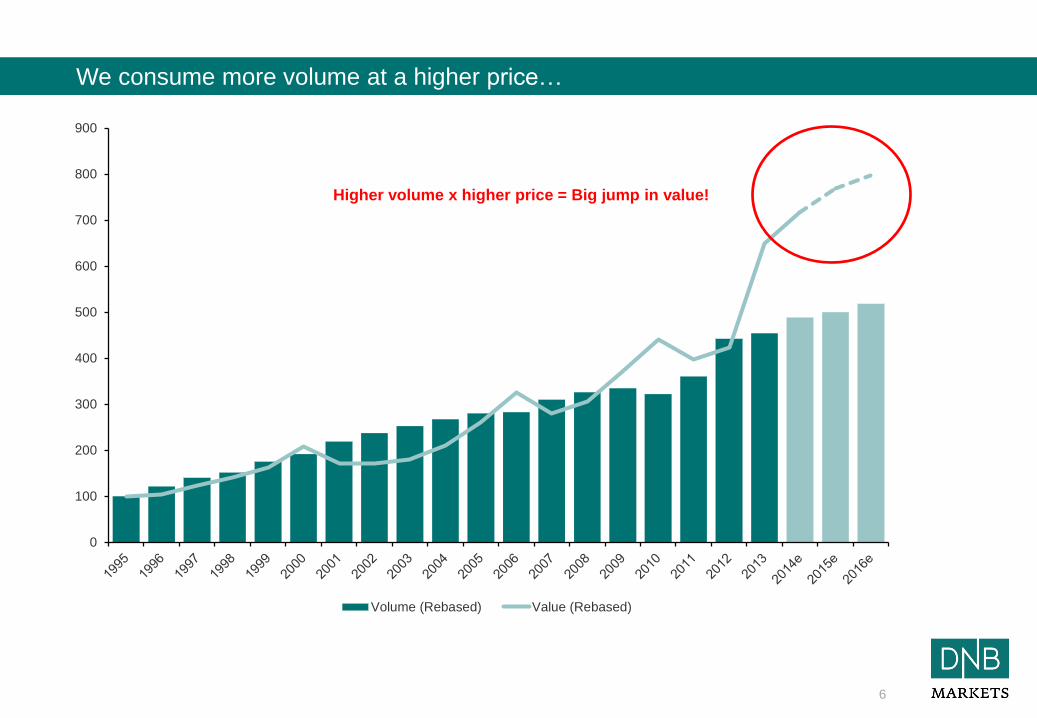
We consume more volume at a higher price…
Higher volume x higher price = Big jump in value!
0
100
200
300
400
500
600
700
800
900
Volume (Rebased) Value (Rebased)
Higher volume x higher price = Big jump in value!
7
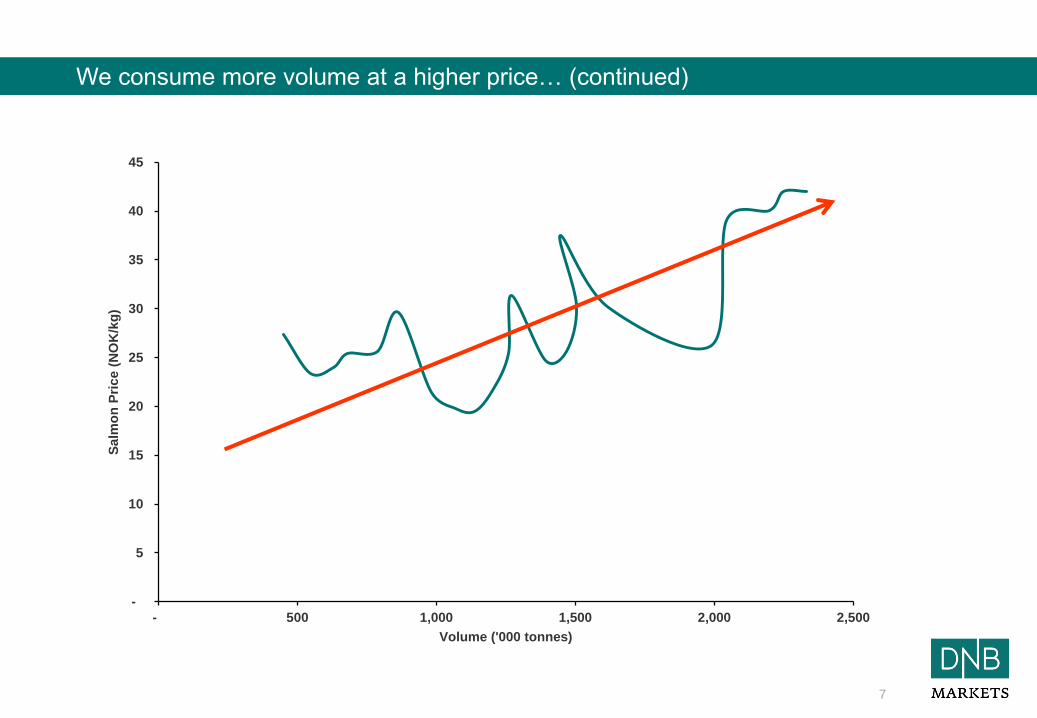
We consume more volume at a higher price (continued)…..
-
5
10
15
20
25
30
35
40
45
- 500 1,000 1,500 2,000 2,500
Salm
on
Pri
ce (
NO
K/k
g)
Volume ('000 tonnes)
We consume more volume at a higher price… (continued)
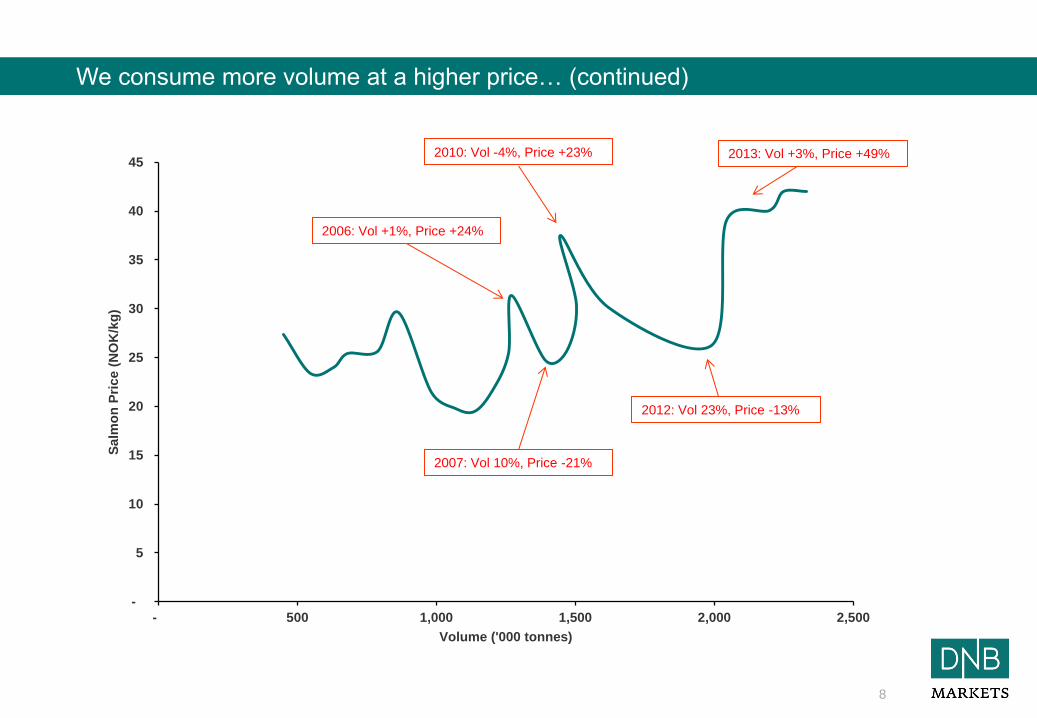
8
We are consuming more at a higher price (continued)…..
-
5
10
15
20
25
30
35
40
45
- 500 1,000 1,500 2,000 2,500
Salm
on
Pri
ce (
NO
K/k
g)
Volume ('000 tonnes)
2010: Vol -4%, Price +23%
2006: Vol +1%, Price +24%
2012: Vol 23%, Price -13%
2013: Vol +3%, Price +49%
2007: Vol 10%, Price -21%
We consume more volume at a higher price… (continued)
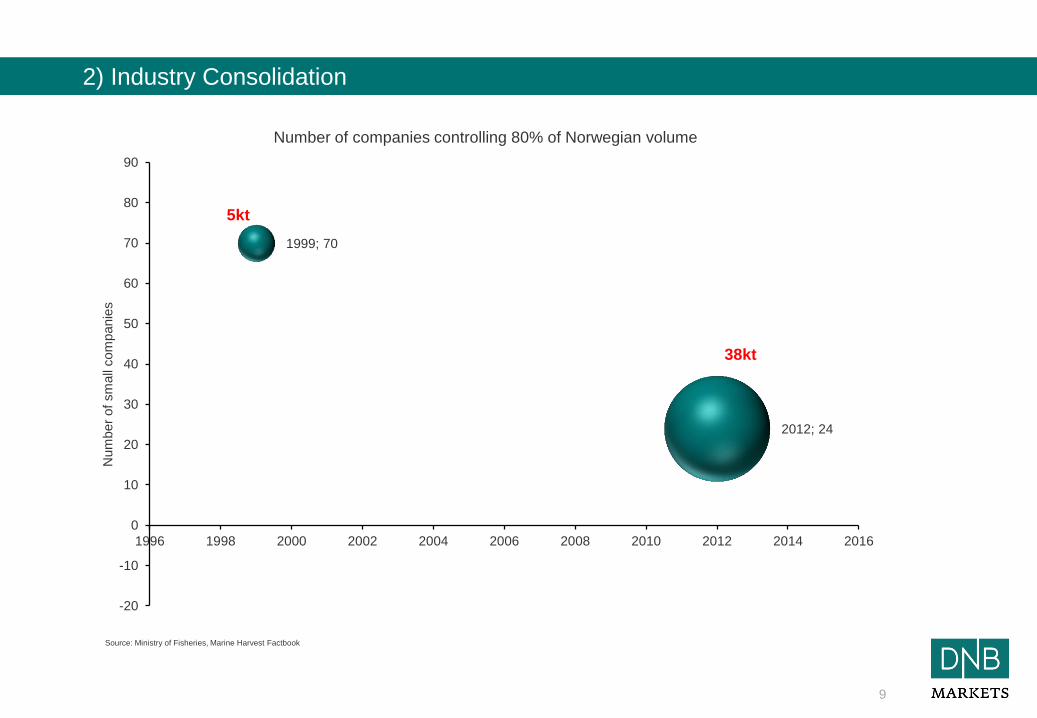
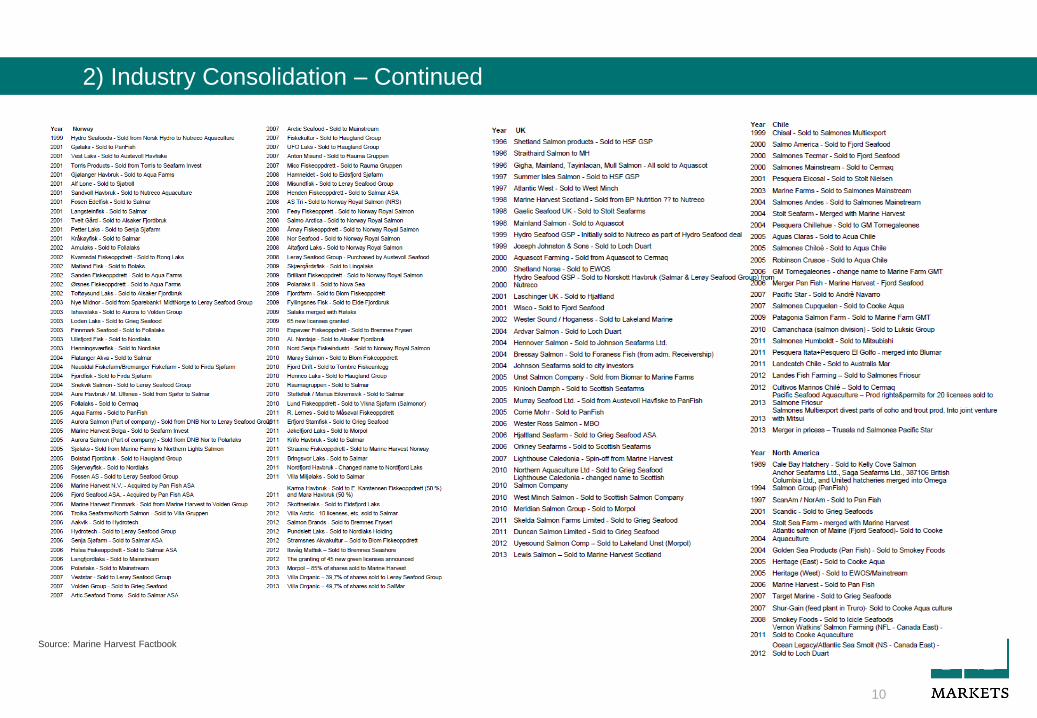
2) Industry Consolidation
9
Source: Ministry of Fisheries, Marine Harvest Factbook
1999; 70
2012; 24
-20
-10
0
10
20
30
40
50
60
70
80
90
1996 1998 2000 2002 2004 2006 2008 2010 2012 2014 2016
Num
ber
of
sm
all
com
panie
s
Number of companies controlling 80% of Norwegian volume
5kt
38kt
Source: Marine Harvest Factbook
10
2) Industry Consolidation – Continued
11
3) Companies are getting more integrated
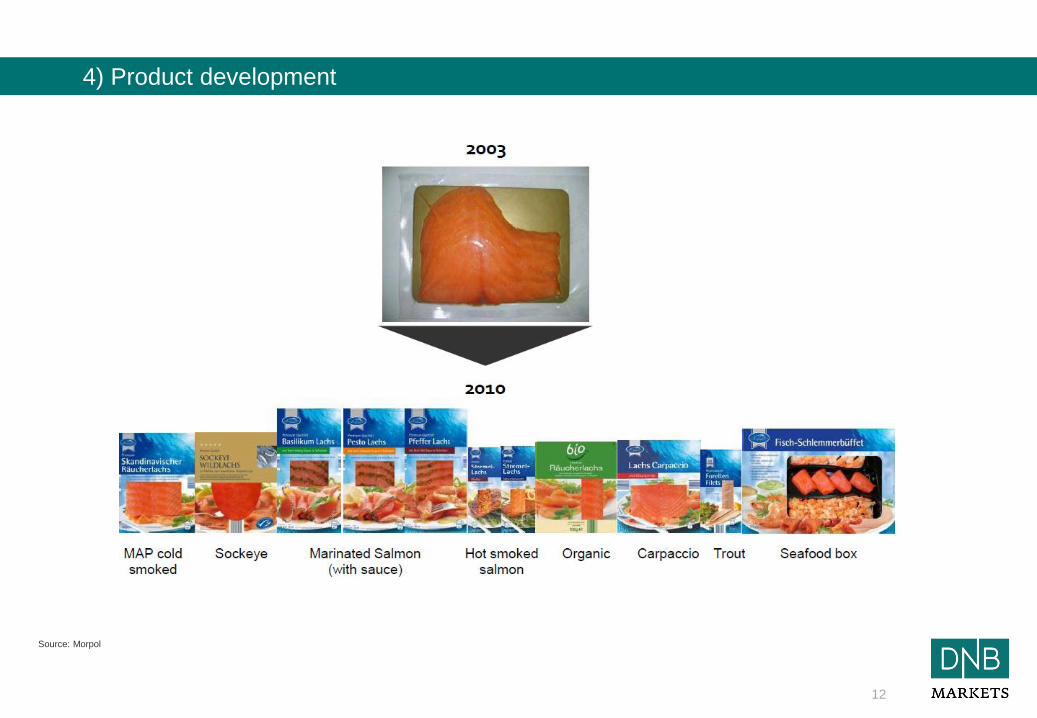
Source: Morpol
12
4) Product development
Source: DNB Markets
13
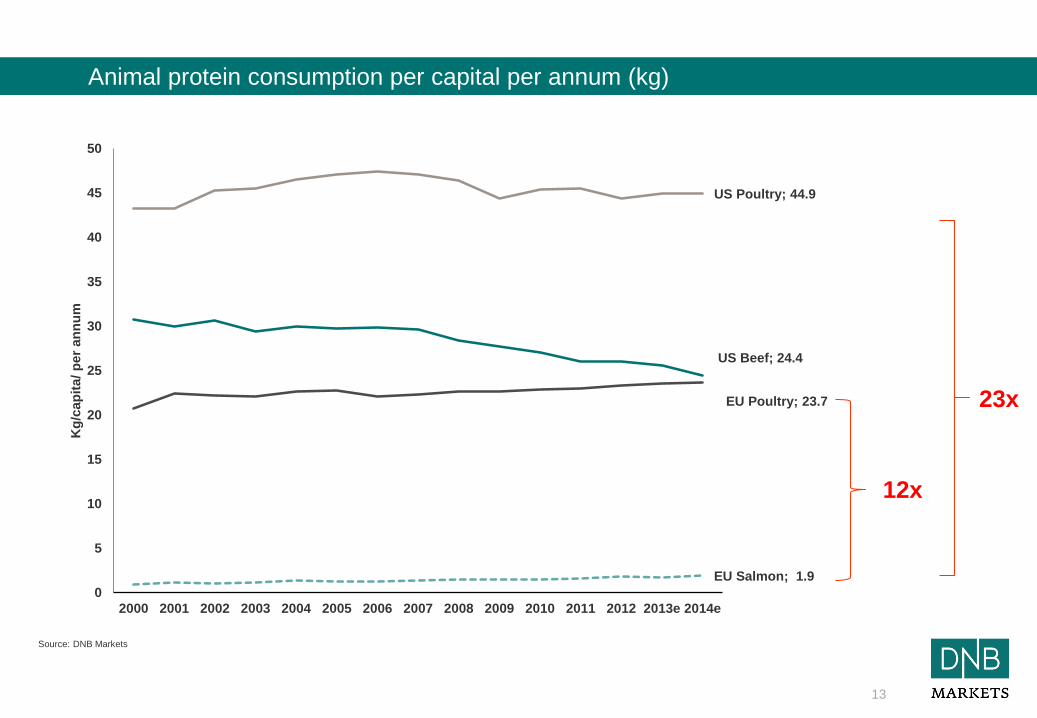
Animal protein consumption per capital per annum (kg)
US Beef; 24.4
US Poultry; 44.9
EU Poultry; 23.7
EU Salmon; 1.9
0
5
10
15
20
25
30
35
40
45
50
2000 2001 2002 2003 2004 2005 2006 2007 2008 2009 2010 2011 2012 2013e 2014e
Kg
/cap
ita
/ p
er
an
nu
m
12x
23x
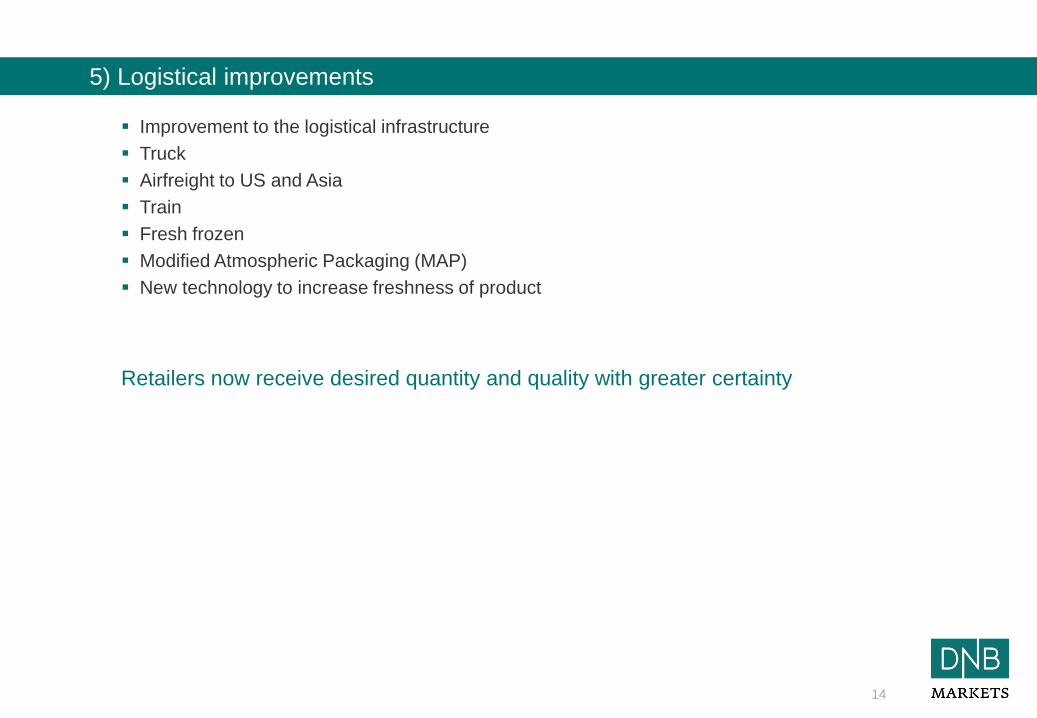
Improvement to the logistical infrastructure
Truck
Airfreight to US and Asia
Train
Fresh frozen
Modified Atmospheric Packaging (MAP)
New technology to increase freshness of product
Retailers now receive desired quantity and quality with greater certainty
14
5) Logistical improvements
15
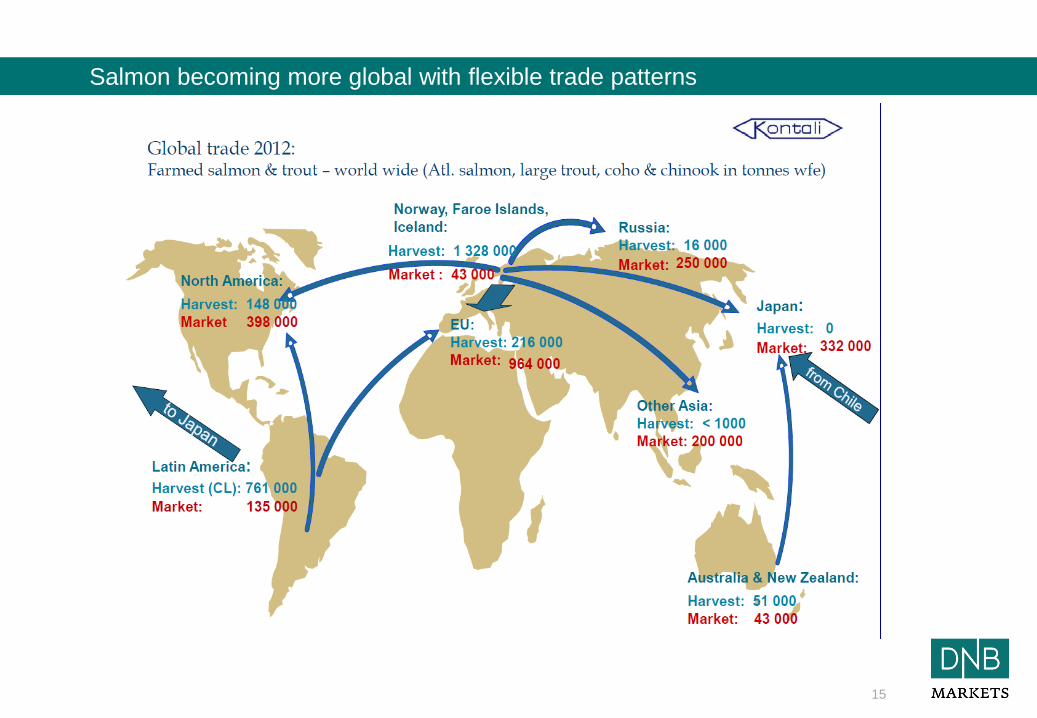
Salmon becoming more global with flexible trade patterns
Source: Ministry of fisheries, DNB Markets
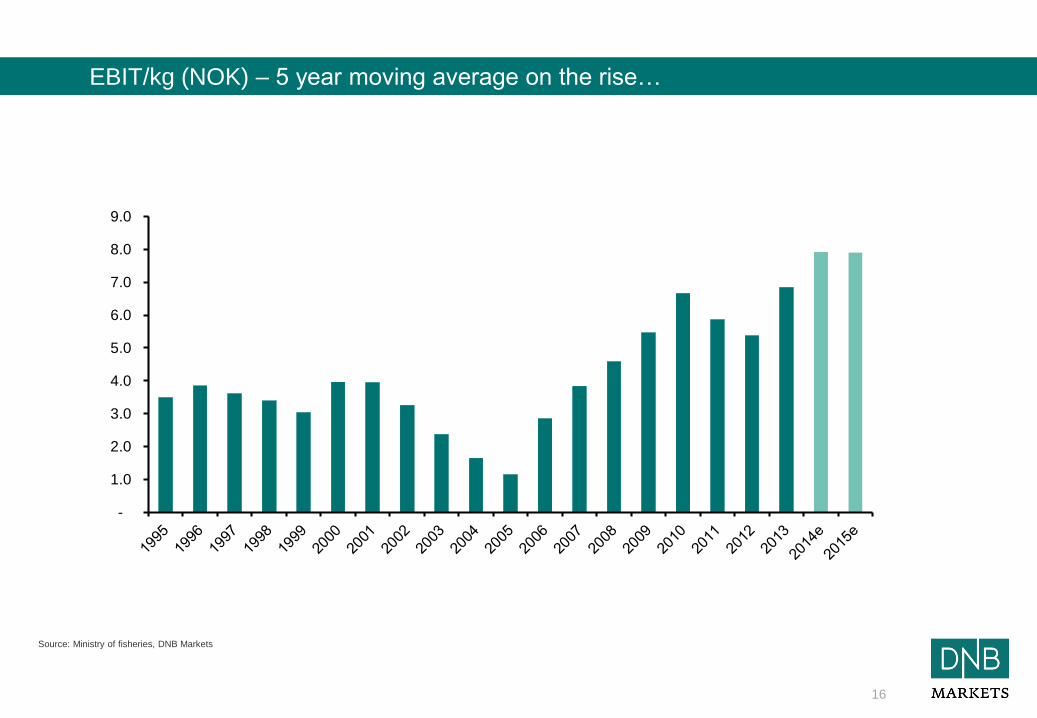
EBIT/kg (NOK) – 5 year moving average on the rise…
16
-
1.0
2.0
3.0
4.0
5.0
6.0
7.0
8.0
9.0
*SalMar and Bakkafrost is already at +NOK10/kg average 2006-2015e
17
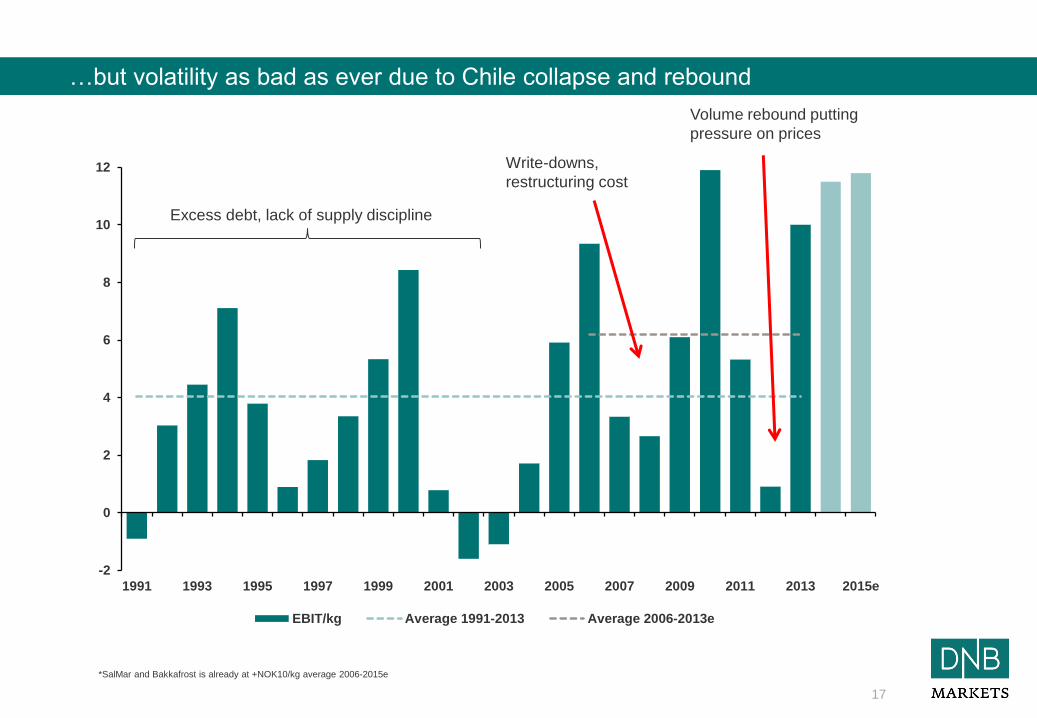
…but volatility as bad as ever due to Chile collapse and rebound
-2
0
2
4
6
8
10
12
1991 1993 1995 1997 1999 2001 2003 2005 2007 2009 2011 2013 2015e
EBIT/kg Average 1991-2013 Average 2006-2013e
Write-downs,
restructuring cost
Volume rebound putting
pressure on prices
Excess debt, lack of supply discipline
18
What if Chile never collapsed……
Source: Ministry of Fisheries, DNB Markets
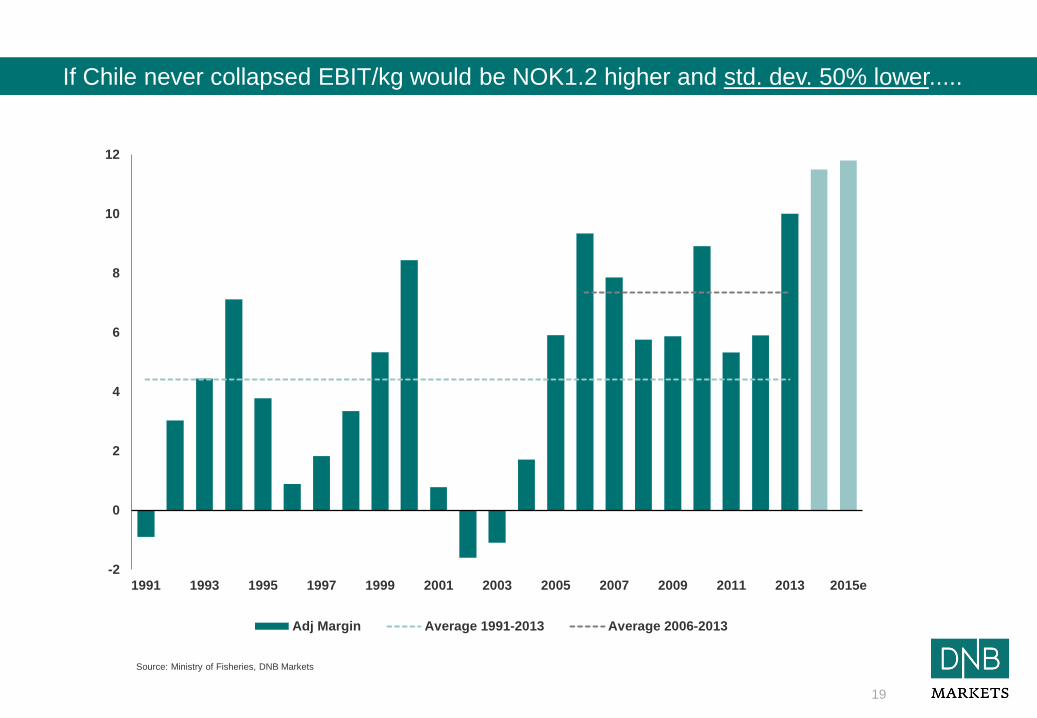
If Chile never collapsed EBIT/kg would be NOK1.2 higher and std. dev. 50% lower.....
19
-2
0
2
4
6
8
10
12
1991 1993 1995 1997 1999 2001 2003 2005 2007 2009 2011 2013 2015e
Adj Margin Average 1991-2013 Average 2006-2013
No rolling MAB in Norway
Growth in Norway will be accompanies by very strict demands to
biological sustainability
20
Latest Seafood Sector update titled – Few clouds in the sky
Source. Kontali
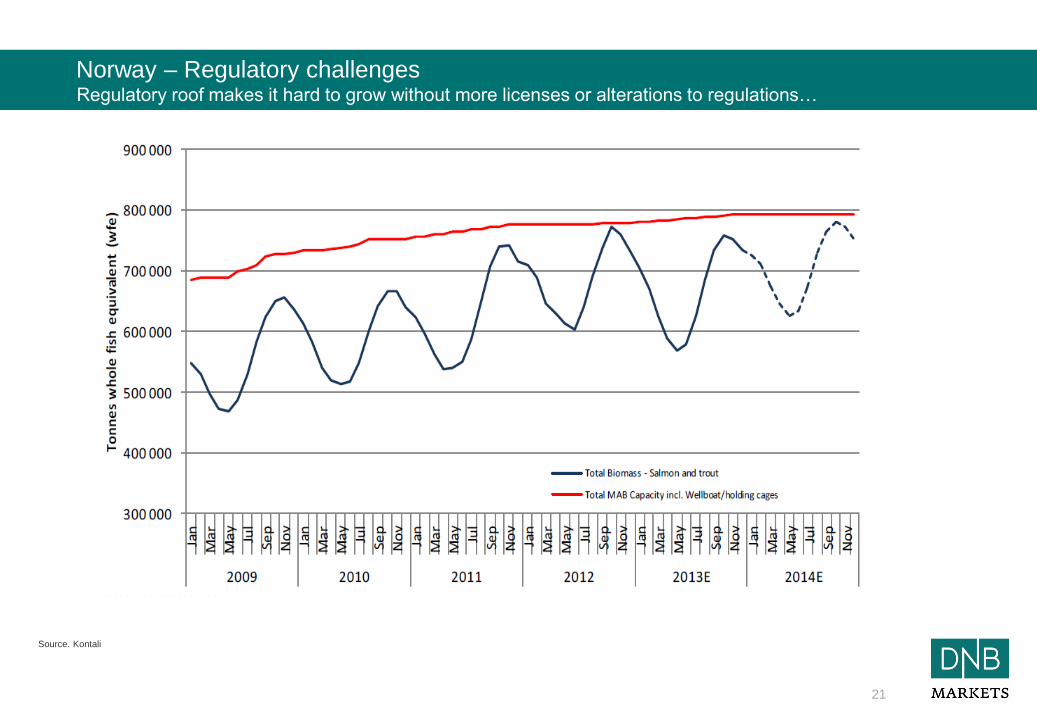
Norway – Regulatory challenges Regulatory roof makes it hard to grow without more licenses or alterations to regulations…
21
22
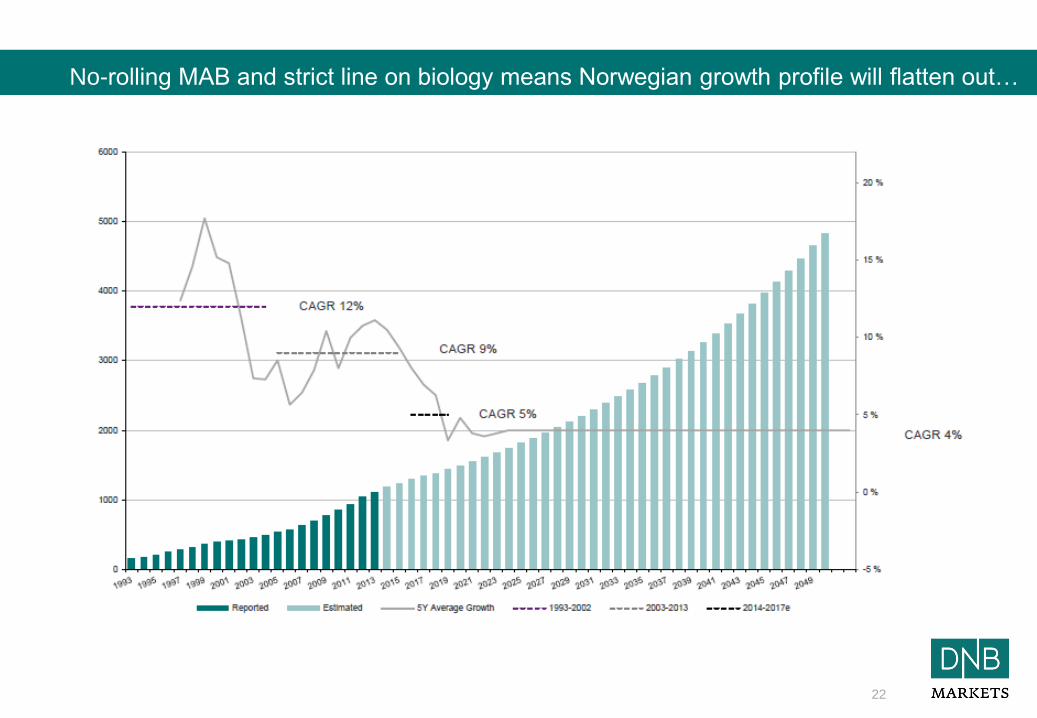
No-rolling MAB and strict line on biology means Norwegian growth profile will flatten out…
Source: Aquacbench, DNB Markets
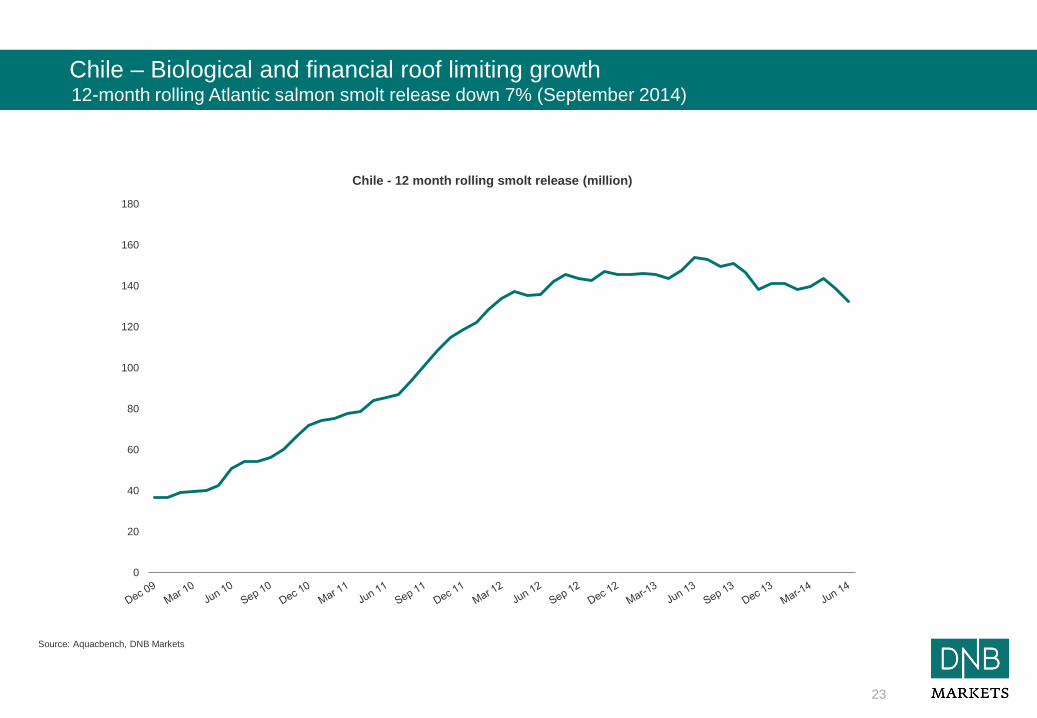
Chile – Biological and financial roof limiting growth 12-month rolling Atlantic salmon smolt release down 7% (September 2014)
23
0
20
40
60
80
100
120
140
160
180
Chile - 12 month rolling smolt release (million)
24
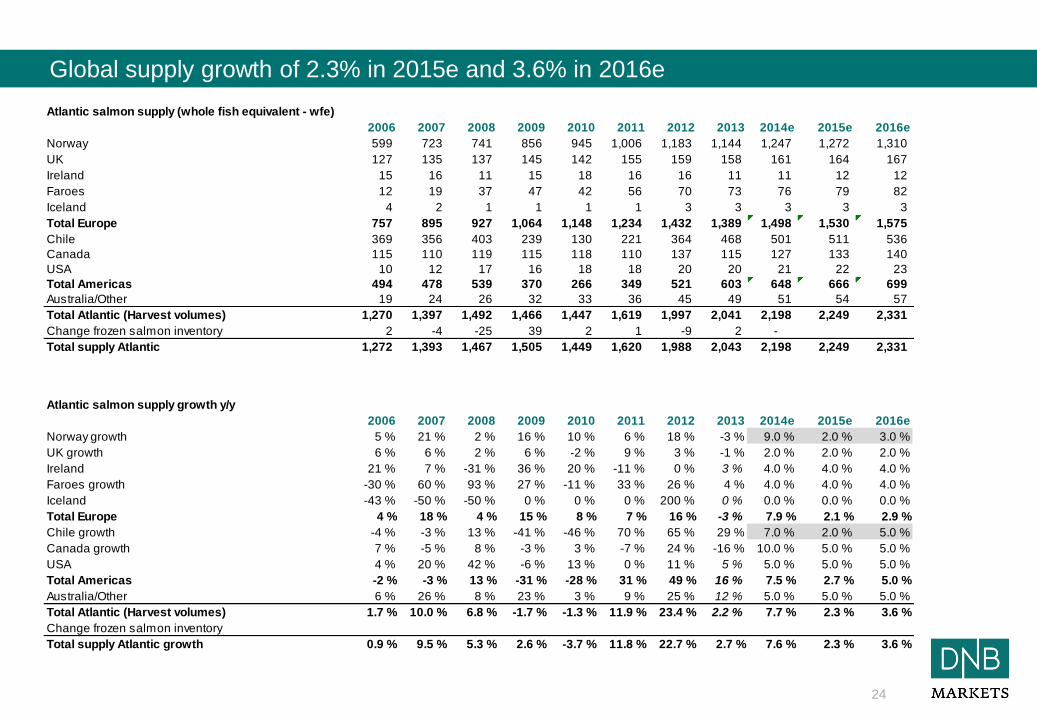
Global supply growth of 2.3% in 2015e and 3.6% in 2016e
Atlantic salmon supply (whole fish equivalent - wfe)
2006 2007 2008 2009 2010 2011 2012 2013 2014e 2015e 2016e
Norway 599 723 741 856 945 1,006 1,183 1,144 1,247 1,272 1,310
UK 127 135 137 145 142 155 159 158 161 164 167
Ireland 15 16 11 15 18 16 16 11 11 12 12
Faroes 12 19 37 47 42 56 70 73 76 79 82
Iceland 4 2 1 1 1 1 3 3 3 3 3
Total Europe 757 895 927 1,064 1,148 1,234 1,432 1,389 1,498 1,530 1,575
Chile 369 356 403 239 130 221 364 468 501 511 536
Canada 115 110 119 115 118 110 137 115 127 133 140
USA 10 12 17 16 18 18 20 20 21 22 23
Total Americas 494 478 539 370 266 349 521 603 648 666 699
Australia/Other 19 24 26 32 33 36 45 49 51 54 57
Total Atlantic (Harvest volumes) 1,270 1,397 1,492 1,466 1,447 1,619 1,997 2,041 2,198 2,249 2,331
Change frozen salmon inventory 2 -4 -25 39 2 1 -9 2 -
Total supply Atlantic 1,272 1,393 1,467 1,505 1,449 1,620 1,988 2,043 2,198 2,249 2,331
Atlantic salmon supply growth y/y
2006 2007 2008 2009 2010 2011 2012 2013 2014e 2015e 2016e
Norway growth 5 % 21 % 2 % 16 % 10 % 6 % 18 % -3 % 9.0 % 2.0 % 3.0 %
UK growth 6 % 6 % 2 % 6 % -2 % 9 % 3 % -1 % 2.0 % 2.0 % 2.0 %
Ireland 21 % 7 % -31 % 36 % 20 % -11 % 0 % 3 % 4.0 % 4.0 % 4.0 %
Faroes growth -30 % 60 % 93 % 27 % -11 % 33 % 26 % 4 % 4.0 % 4.0 % 4.0 %
Iceland -43 % -50 % -50 % 0 % 0 % 0 % 200 % 0 % 0.0 % 0.0 % 0.0 %
Total Europe 4 % 18 % 4 % 15 % 8 % 7 % 16 % -3 % 7.9 % 2.1 % 2.9 %
Chile growth -4 % -3 % 13 % -41 % -46 % 70 % 65 % 29 % 7.0 % 2.0 % 5.0 %
Canada growth 7 % -5 % 8 % -3 % 3 % -7 % 24 % -16 % 10.0 % 5.0 % 5.0 %
USA 4 % 20 % 42 % -6 % 13 % 0 % 11 % 5 % 5.0 % 5.0 % 5.0 %
Total Americas -2 % -3 % 13 % -31 % -28 % 31 % 49 % 16 % 7.5 % 2.7 % 5.0 %
Australia/Other 6 % 26 % 8 % 23 % 3 % 9 % 25 % 12 % 5.0 % 5.0 % 5.0 %
Total Atlantic (Harvest volumes) 1.7 % 10.0 % 6.8 % -1.7 % -1.3 % 11.9 % 23.4 % 2.2 % 7.7 % 2.3 % 3.6 %
Change frozen salmon inventory
Total supply Atlantic growth 0.9 % 9.5 % 5.3 % 2.6 % -3.7 % 11.8 % 22.7 % 2.7 % 7.6 % 2.3 % 3.6 %
Analysts: Alexander Aukner (+47 24 16 90 79; [email protected] )
Seafood weekly 30 October 2014
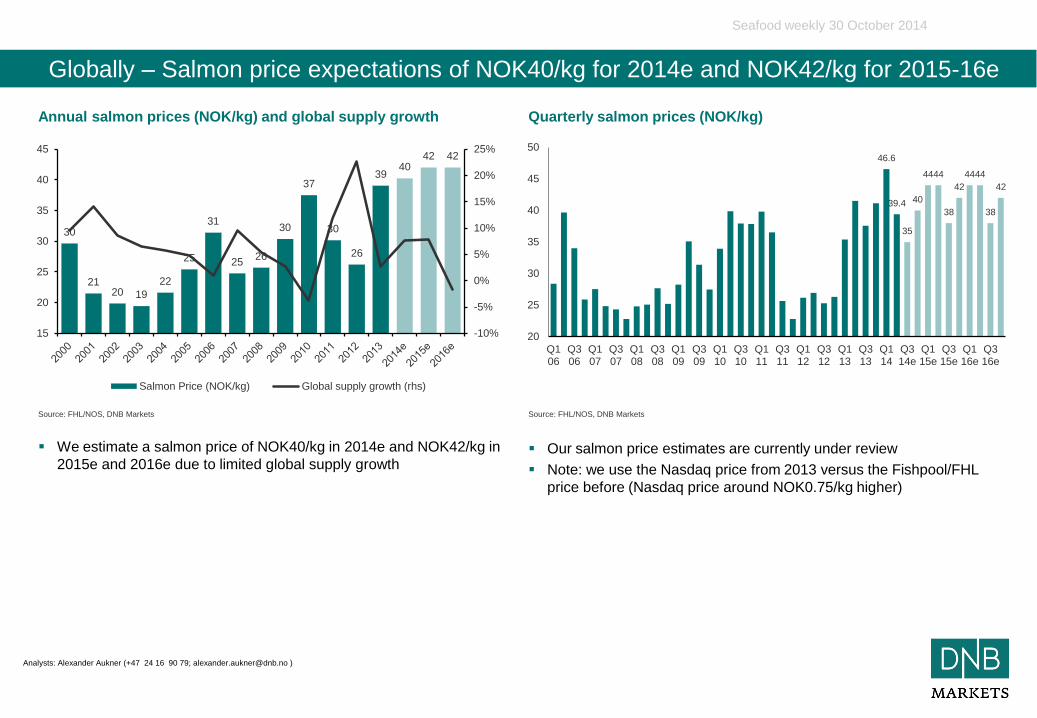
We estimate a salmon price of NOK40/kg in 2014e and NOK42/kg in
2015e and 2016e due to limited global supply growth
Globally – Salmon price expectations of NOK40/kg for 2014e and NOK42/kg for 2015-16e
Our salmon price estimates are currently under review
Note: we use the Nasdaq price from 2013 versus the Fishpool/FHL
price before (Nasdaq price around NOK0.75/kg higher)
Source: FHL/NOS, DNB Markets Source: FHL/NOS, DNB Markets
Annual salmon prices (NOK/kg) and global supply growth Quarterly salmon prices (NOK/kg)
30
21 20 19
22
25
31
25 26
30
37
30
26
39 40
42 42
-10%
-5%
0%
5%
10%
15%
20%
25%
15
20
25
30
35
40
45
Salmon Price (NOK/kg) Global supply growth (rhs)
46.6
39.4
35
40
44 44
38
42
44 44
38
42
20
25
30
35
40
45
50
Q106
Q306
Q107
Q307
Q108
Q308
Q109
Q309
Q110
Q310
Q111
Q311
Q112
Q312
Q113
Q313
Q114
Q314e
Q115e
Q315e
Q116e
Q316e
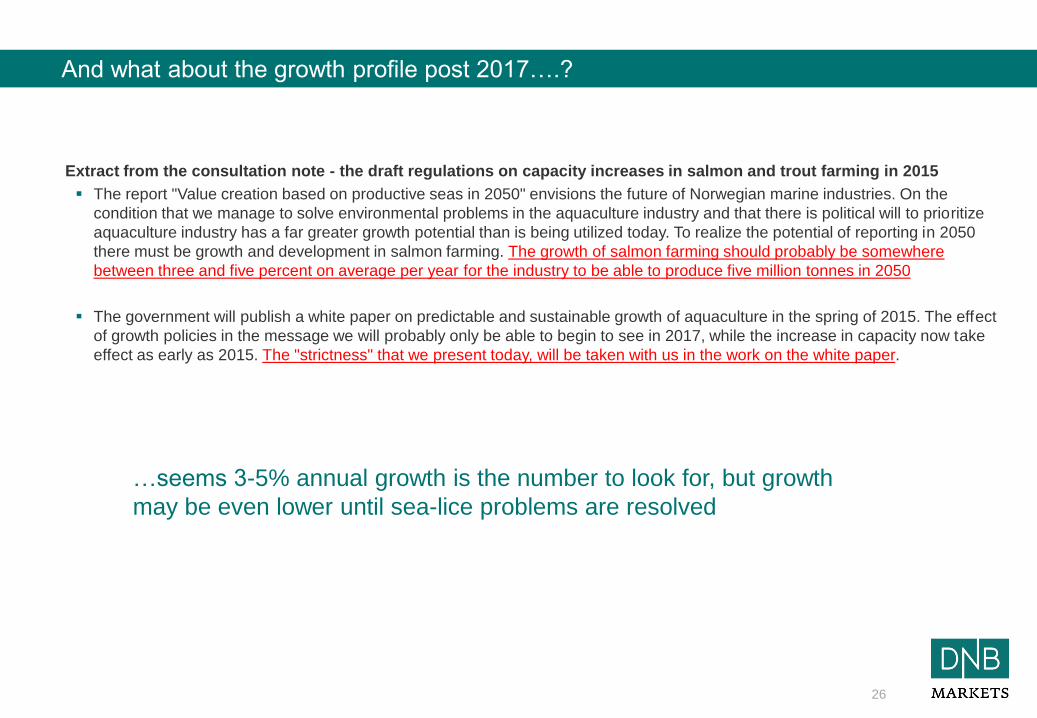
Extract from the consultation note - the draft regulations on capacity increases in salmon and trout farming in 2015
The report "Value creation based on productive seas in 2050" envisions the future of Norwegian marine industries. On the
condition that we manage to solve environmental problems in the aquaculture industry and that there is political will to prioritize
aquaculture industry has a far greater growth potential than is being utilized today. To realize the potential of reporting in 2050
there must be growth and development in salmon farming. The growth of salmon farming should probably be somewhere
between three and five percent on average per year for the industry to be able to produce five million tonnes in 2050
The government will publish a white paper on predictable and sustainable growth of aquaculture in the spring of 2015. The effect
of growth policies in the message we will probably only be able to begin to see in 2017, while the increase in capacity now take
effect as early as 2015. The "strictness" that we present today, will be taken with us in the work on the white paper.
26
And what about the growth profile post 2017….?
…seems 3-5% annual growth is the number to look for, but growth
may be even lower until sea-lice problems are resolved
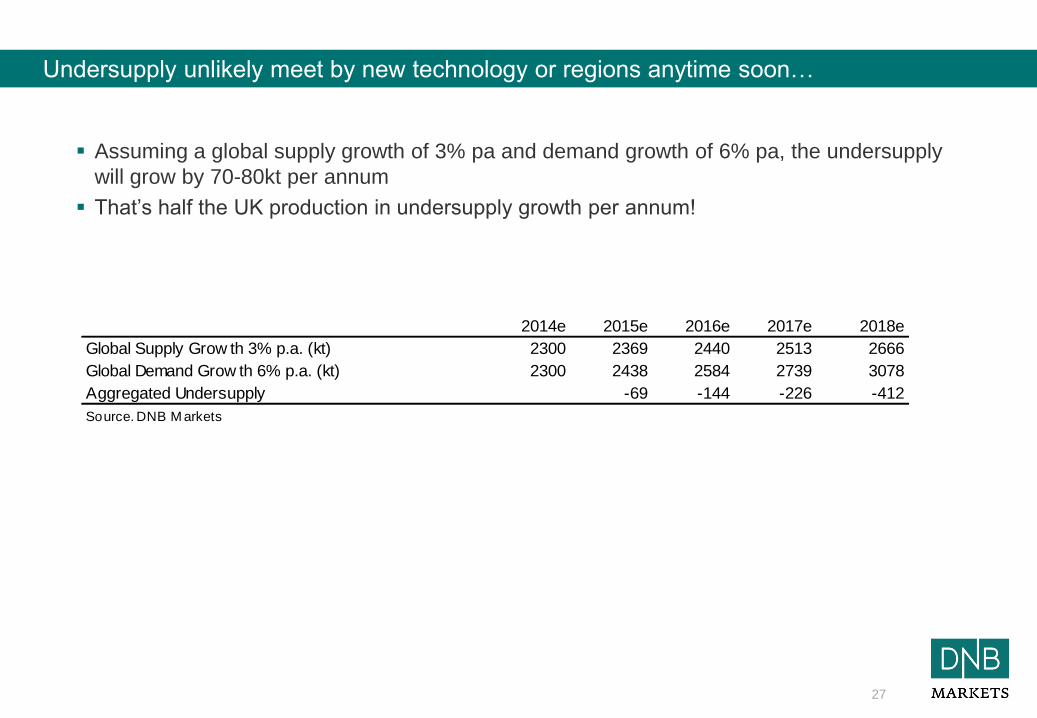
Assuming a global supply growth of 3% pa and demand growth of 6% pa, the undersupply
will grow by 70-80kt per annum
That’s half the UK production in undersupply growth per annum!
27
Undersupply unlikely meet by new technology or regions anytime soon…
2014e 2015e 2016e 2017e 2018e
Global Supply Grow th 3% p.a. (kt) 2300 2369 2440 2513 2666
Global Demand Grow th 6% p.a. (kt) 2300 2438 2584 2739 3078
Aggregated Undersupply -69 -144 -226 -412
Source. DNB M arkets
Solid balance sheets and attractive valuations mean we
remain positive to the sector
29
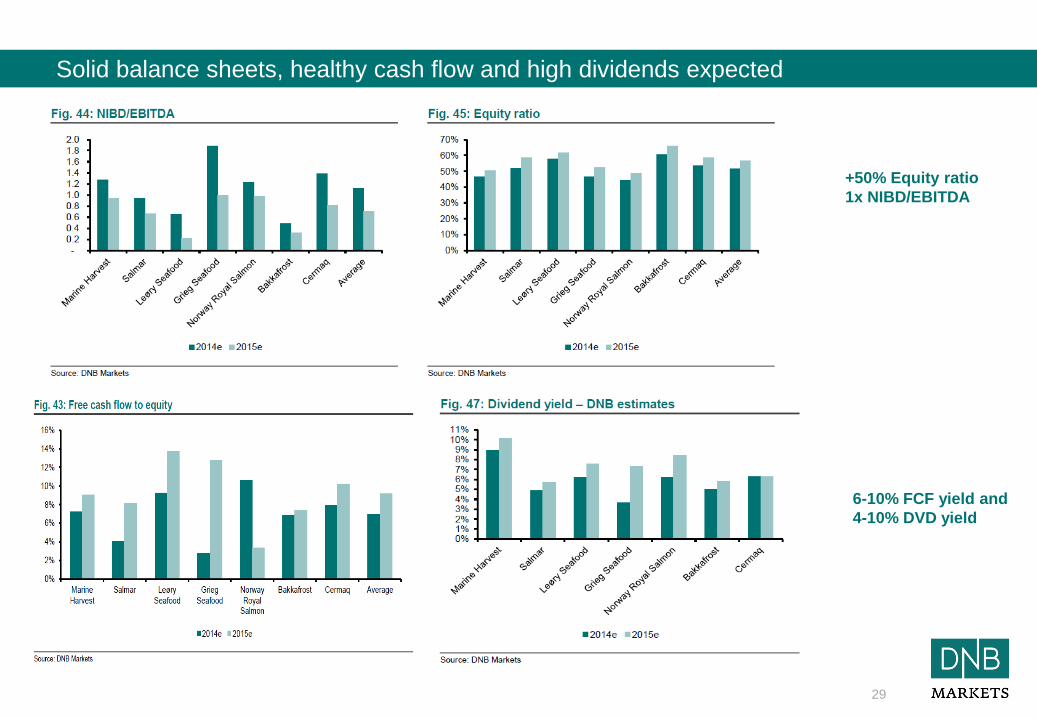
Solid balance sheets, healthy cash flow and high dividends expected
+50% Equity ratio
1x NIBD/EBITDA
6-10% FCF yield and
4-10% DVD yield
30
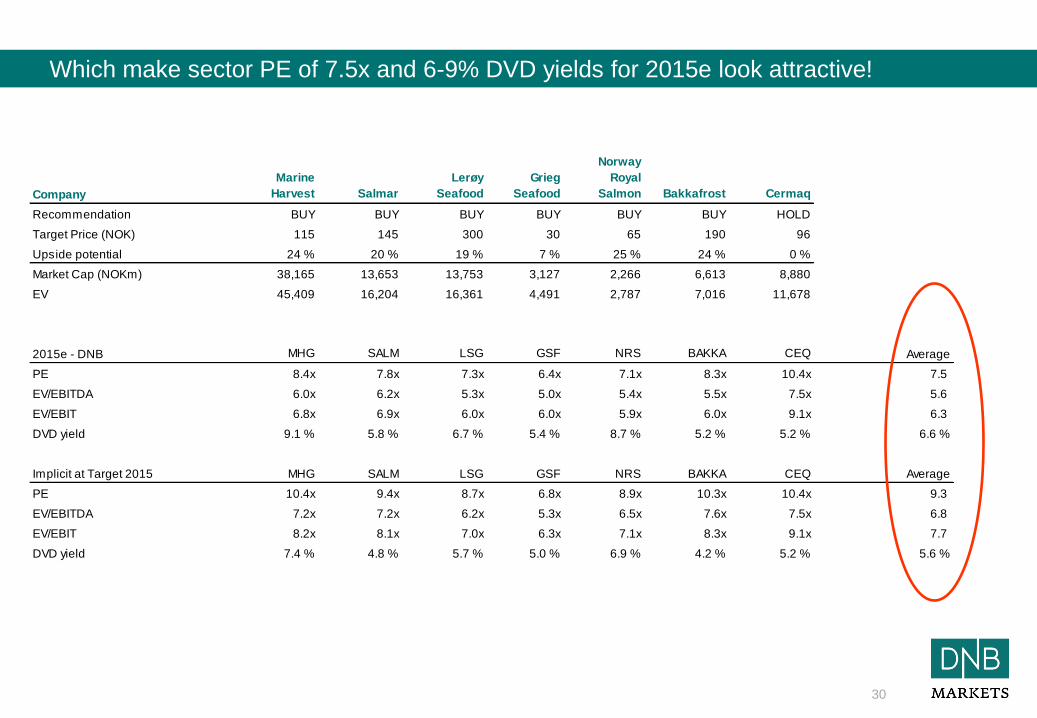
Which make sector PE of 7.5x and 6-9% DVD yields for 2015e look attractive!
CEQ – Bid from
Mitsubishi Corp.
Company
Marine
Harvest Salmar
Lerøy
Seafood
Grieg
Seafood
Norway
Royal
Salmon Bakkafrost Cermaq
Recommendation BUY BUY BUY BUY BUY BUY HOLD
Target Price (NOK) 115 145 300 30 65 190 96
Upside potential 24 % 20 % 19 % 7 % 25 % 24 % 0 %
Market Cap (NOKm) 38,165 13,653 13,753 3,127 2,266 6,613 8,880
EV 45,409 16,204 16,361 4,491 2,787 7,016 11,678
2015e - DNB MHG SALM LSG GSF NRS BAKKA CEQ Average
PE 8.4x 7.8x 7.3x 6.4x 7.1x 8.3x 10.4x 7.5
EV/EBITDA 6.0x 6.2x 5.3x 5.0x 5.4x 5.5x 7.5x 5.6
EV/EBIT 6.8x 6.9x 6.0x 6.0x 5.9x 6.0x 9.1x 6.3
DVD yield 9.1 % 5.8 % 6.7 % 5.4 % 8.7 % 5.2 % 5.2 % 6.6 %
Implicit at Target 2015 MHG SALM LSG GSF NRS BAKKA CEQ Average
PE 10.4x 9.4x 8.7x 6.8x 8.9x 10.3x 10.4x 9.3
EV/EBITDA 7.2x 7.2x 6.2x 5.3x 6.5x 7.6x 7.5x 6.8
EV/EBIT 8.2x 8.1x 7.0x 6.3x 7.1x 8.3x 9.1x 7.7
DVD yield 7.4 % 4.8 % 5.7 % 5.0 % 6.9 % 4.2 % 5.2 % 5.6 %
31
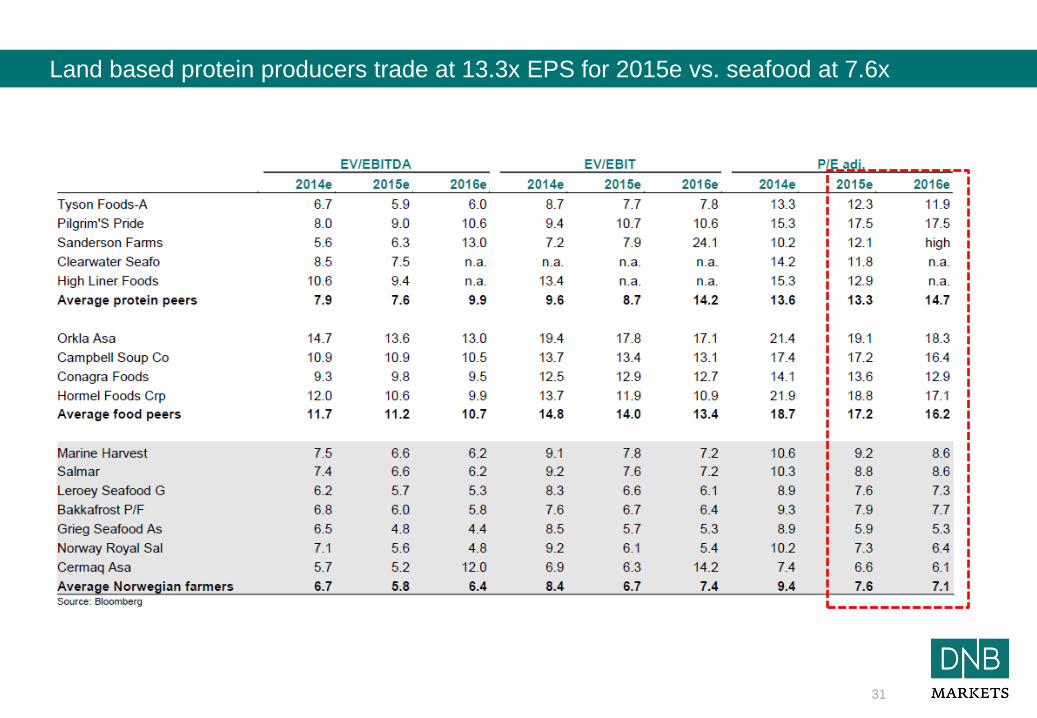
Land based protein producers trade at 13.3x EPS for 2015e vs. seafood at 7.6x
32
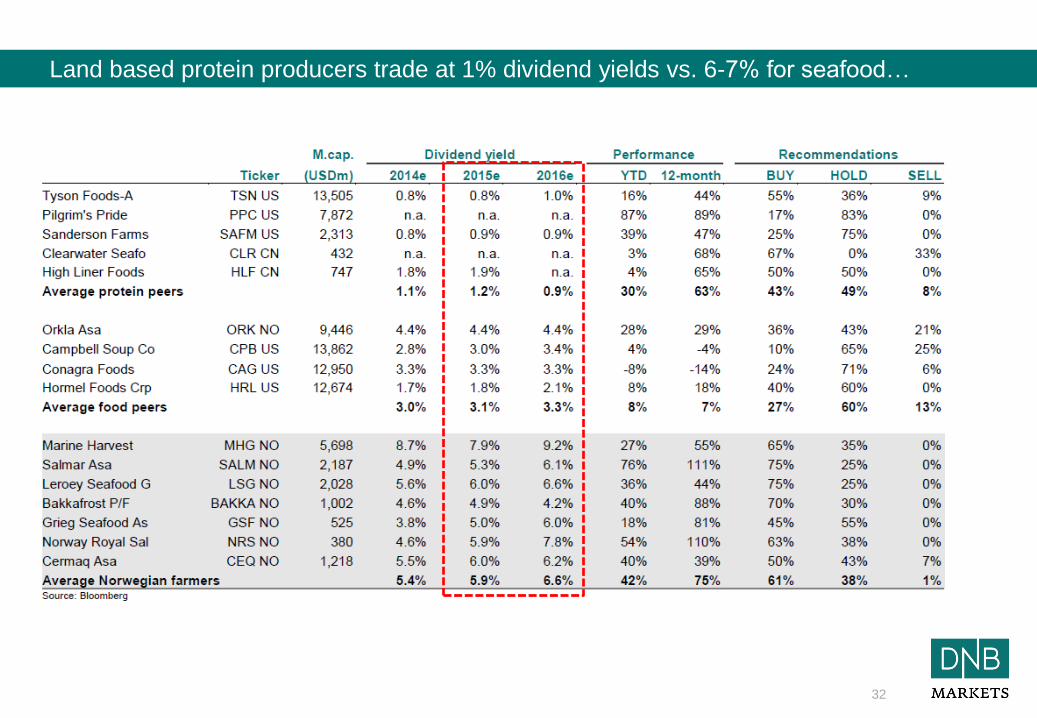
Land based protein producers trade at 1% dividend yields vs. 6-7% for seafood…
33
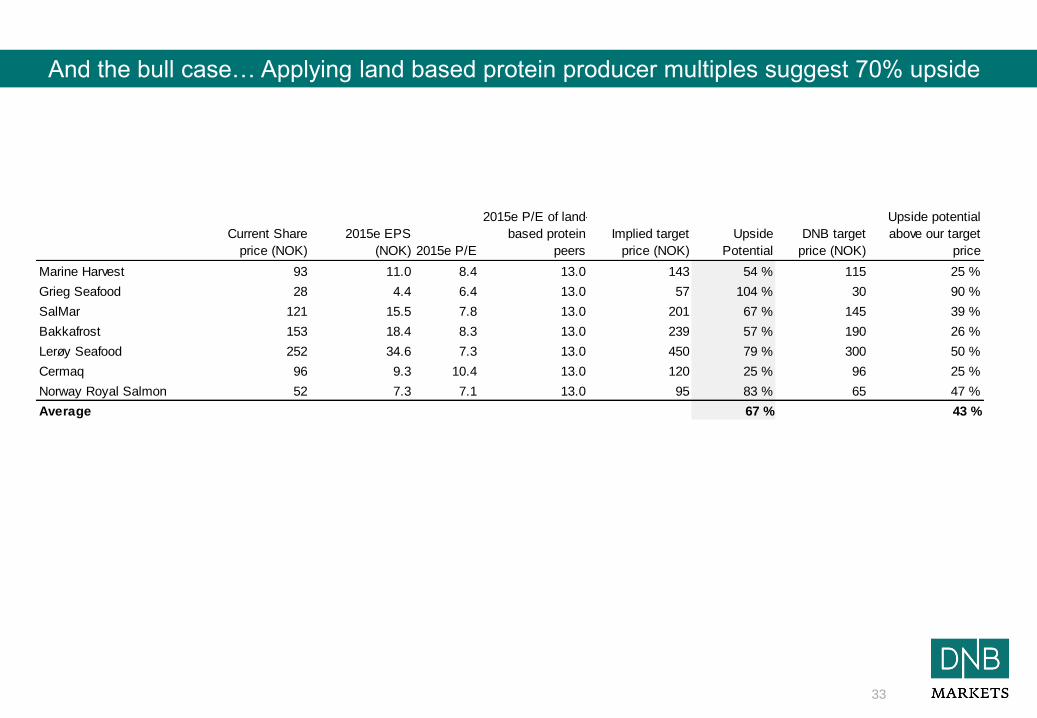
And the bull case… Applying land based protein producer multiples suggest 70% upside
Current Share
price (NOK)
2015e EPS
(NOK) 2015e P/E
2015e P/E of land-
based protein
peers
Implied target
price (NOK)
Upside
Potential
DNB target
price (NOK)
Upside potential
above our target
price
Marine Harvest 93 11.0 8.4 13.0 143 54 % 115 25 %
Grieg Seafood 28 4.4 6.4 13.0 57 104 % 30 90 %
SalMar 121 15.5 7.8 13.0 201 67 % 145 39 %
Bakkafrost 153 18.4 8.3 13.0 239 57 % 190 26 %
Lerøy Seafood 252 34.6 7.3 13.0 450 79 % 300 50 %
Cermaq 96 9.3 10.4 13.0 120 25 % 96 25 %
Norway Royal Salmon 52 7.3 7.1 13.0 95 83 % 65 47 %
Average 67 % 43 %
34
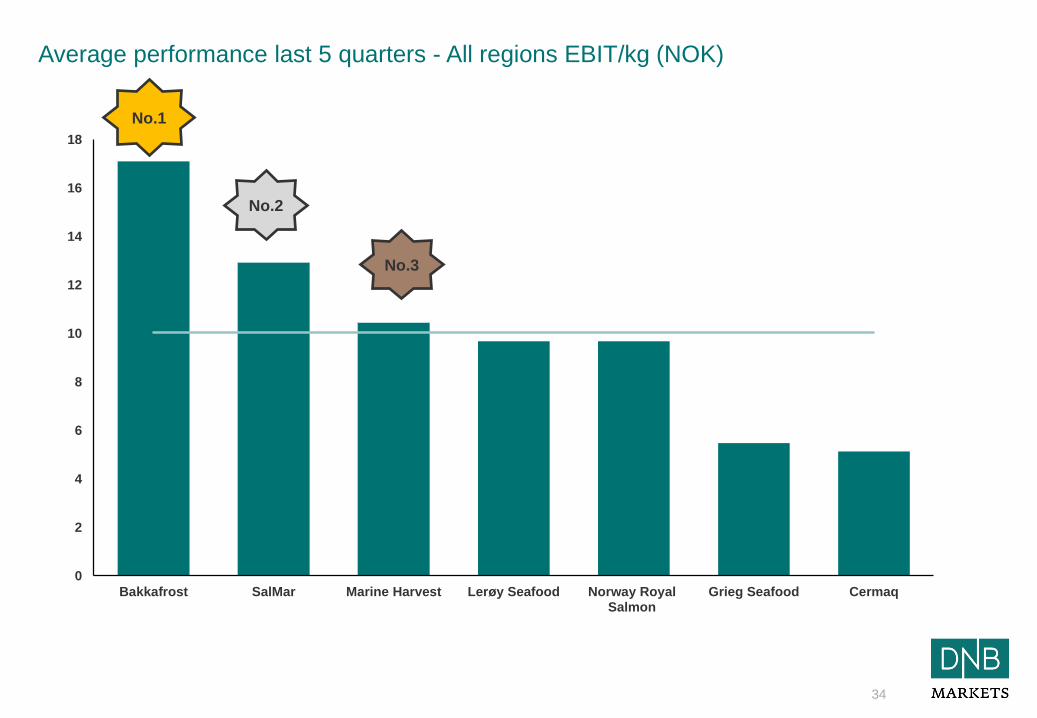
Average performance last 5 quarters - All regions EBIT/kg (NOK)
0
2
4
6
8
10
12
14
16
18
Bakkafrost SalMar Marine Harvest Lerøy Seafood Norway RoyalSalmon
Grieg Seafood Cermaq
No.1
No.2
No.3
35
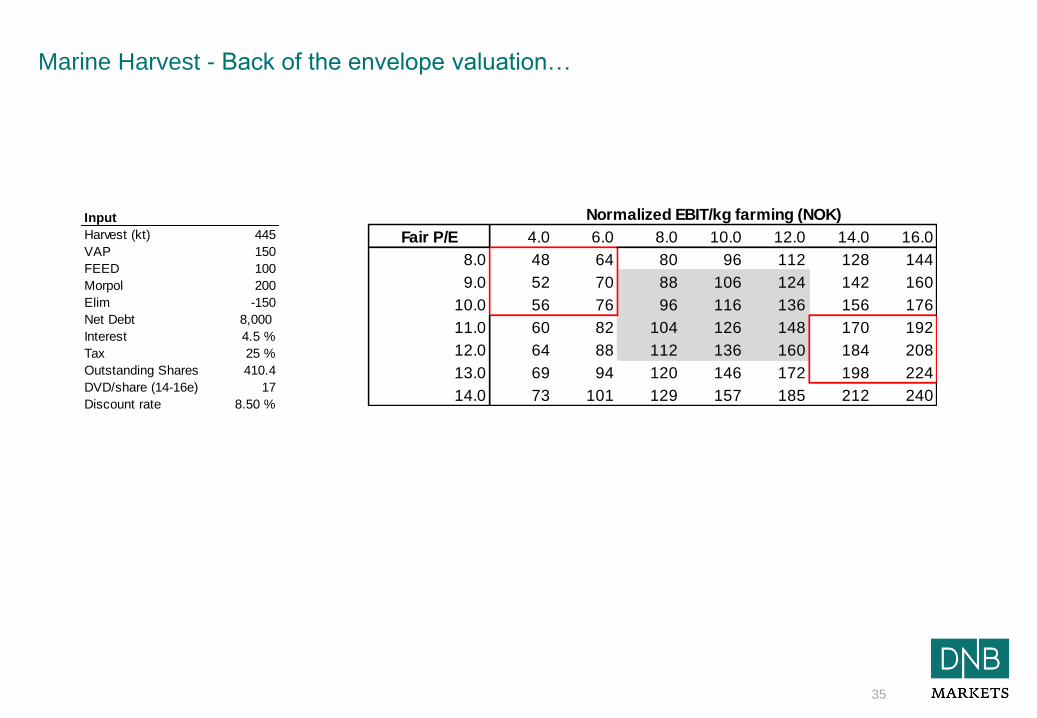
Marine Harvest - Back of the envelope valuation…
Fair P/E 4.0 6.0 8.0 10.0 12.0 14.0 16.0
8.0 48 64 80 96 112 128 144
9.0 52 70 88 106 124 142 160
10.0 56 76 96 116 136 156 176
11.0 60 82 104 126 148 170 192
12.0 64 88 112 136 160 184 208
13.0 69 94 120 146 172 198 224
14.0 73 101 129 157 185 212 240
Normalized EBIT/kg farming (NOK)Input
Harvest (kt) 445
VAP 150
FEED 100
Morpol 200
Elim -150
Net Debt 8,000
Interest 4.5 %
Tax 25 %
Outstanding Shares 410.4
DVD/share (14-16e) 17
Discount rate 8.50 %
Morning Presentation
36
Disclaimer
IMPORTANT/DISCLAIMER
This note (the “Note”) must be seen as marketing material and not as an investment recommendation within the meaning of the Norwegian Securities Trading Act of 2007 paragraph 3-10 and the
Norwegian Securities Trading Regulation 2007/06/29 no. 876. The Note has been prepared by DNB Markets, a division of DNB Bank ASA, a Norwegian bank organized under the laws of the
Kingdom of Norway (the “Bank”), for information purposes only. The Note shall not be used for any unlawful or unauthorized purposes. The Bank, its affiliates, and any third-party providers, as well
as their directors, officers, shareholders, employees or agents (individually, each a “DNB Party”; collectively, “DNB Parties”) do not guarantee the accuracy, completeness, timeliness or availability of
the Note. DNB Parties are not responsible for any errors or omissions, regardless of the cause, nor for the results obtained from the use of the Note, nor for the security or maintenance of any data
input by the user. The Note is provided on an “as is” basis. DNB PARTIES DISCLAIM ANY AND ALL EXPRESS OR IMPLIED WARRANTIES, INCLUDING, BUT NOT LIMITED TO, ANY
WARRANTIES OF MERCHANTABILITY OR FITNESS FOR A PARTICULAR PURPOSE OR USE, FREEDOM FROM BUGS, SOFTWARE ERRORS OR DEFECTS, THAT THE NOTE’S
FUNCTIONING WILL BE UNINTERRUPTED OR THAT THE NOTE WILL OPERATE WITH ANY SOFTWARE OR HARDWARE CONFIGURATION. In no event shall DNB Parties be liable to any
party for any direct, indirect, incidental, exemplary, compensatory, punitive, special or consequential damages, costs, expenses, legal fees, or losses (including, without limitation, lost income or lost
profits and opportunity costs) in connection with any use of the Note, even if advised of the possibility of such damages. Any opinions expressed herein reflect the Bank’s judgment at the time the
Note was prepared and DNB Parties assume no obligation to update the Note in any form or format. The Note should not be relied on and is not a substitute for the skill, judgment and experience of
the user, its management, employees, advisors and/or clients when making investment and other business decisions. No DNB Party is acting as fiduciary or investment advisor in connection with the
dissemination of the Note. While the Note is based on information obtained from public sources that the Bank believes to be reliable, no DNB Party has performed an audit of, nor accepts any duty of
due diligence or independent verification of, any information it receives. Confidentiality rules and internal rules restrict the exchange of information between different parts of the Bank and this may
prevent employees of DNB Markets who are preparing the Note from utilizing or being aware of information available in DNB Markets/the Bank which may be relevant to the recipients of the Note.
Please contact DNB Markets at + 47 22 94 89 98 for further information and inquiries regarding this Note, such as ownership positions and publicly available/commonly known corporate advisory
performed by DNB Markets etc, in relation to the Norwegian Securities Trading Act 2007/06/29 no. 75 and the Norwegian Securities Trading Regulation 2007/06/29 no. 876.
The Note is not an offer to buy or sell any security or other financial instrument or to participate in any investment strategy. Distribution of material like the Note is in certain jurisdictions restricted by
law. Persons in possession of the Note should seek further guidance regarding such restrictions before distributing the Note.
The Note is for clients only, and not for publication, and has been prepared for information purposes only by DNB Markets - a division of DNB Bank ASA registered in Norway with registration number
NO 984 851 006 (the Register of Business Enterprises) under supervision of the Financial Supervisory Authority of Norway (Finanstilsynet), Monetary Authority of Singapore, the Chilean
Superintendent of Banks, and on a limited basis by the Financial Services Authority of UK. Information about DNB Markets can be found at dnb.no.
Additional information for clients in Singapore
The Note has been distributed by the Singapore branch of DNB Bank ASA. It is intended for general circulation and does not take into account the specific investment objectives, financial situation or
particular needs of any particular person. You should seek advice from a financial adviser regarding the suitability of any product referred to in the Note, taking into account your specific financial
objectives, financial situation or particular needs before making a commitment to purchase any such product.
Recipients of the Note should note that, by virtue of their status as “accredited investors” or “expert investors”, the Singapore branch of DNB Bank ASA will be exempt from complying with certain
compliance requirements under the Financial Advisers Act, Chapter 110 of Singapore (the “FAA”), the Financial Advisers Regulations and associated regulations there under. In particular, it will be
exempt from: - Section 27 of the FAA (which requires that there must be a reasonable basis for recommendations when making recommendations on investments).
Please contact the Singapore branch of DNB Bank ASA at +65 6212 0753 in respect of any matters arising from, or in connection with, the Note.
We, the DNB group, our associates, officers and/or employees may have interests in any products referred to in the Note by acting in various roles including as distributor, holder of principal
positions, adviser or lender. We, the DNB group, our associates, officers and/or employees may receive fees, brokerage or commissions for acting in those capacities. In addition, we, the DNB group,
our associates, officers and/or employees may buy or sell products as principal or agent and may effect transactions which are not consistent with the information set out in the Note.
Additional Information, including for Recipients in the In the United States:
The Note does not constitute an offer to sell or buy a security and does not include information, opinions, or recommendations with respect to securities of an issuer or an analysis of a
security or an issuer; rather, it is a “market letter,” as the term is defined in NASD Rule 2211.