Embed Size (px)
DESCRIPTION
Citation preview
Third quarter 2013 results
14 November 2013
Data in EUR million, unless otherwise stated 3Q 2013 Results Report
DISCLAIMER: Please see important disclaimer in section 8 of this document
ONO – Third quarter 2013 results (unaudited) - 2
Content
1. REPORTING STRUCTURE ............................................................................................ 3
2. OVERVIEW OF GRUPO CORPORATIVO ONO ................................................................ 4
2.1. Key operating and financial events .......................................................................... 5
2.2. Financial highlights ................................................................................................ 7
2.3. Operating highlights............................................................................................... 7
3. GRUPO CORPORATIVO ONO ..................................................................................... 10
3.1. Condensed Consolidated Financial Statements ....................................................... 10
3.2. Notes to the condensed Consolidated Balance Sheet .............................................. 21
3.3. Notes to the Condensed Consolidated Cash Flow ................................................... 23
4. ONO MIDCO ............................................................................................................... 25
5. CABLEUROPA ............................................................................................................ 27
5.1. Condensed Consolidated Financial Statements ....................................................... 27
5.2. Debt and liquidity ................................................................................................ 29
6. DISCLOSURE ABOUT MARKET RISK ........................................................................... 30
6.1. Quantitative and qualitative disclosure about market risk .......................................... 30
6.2. Interest rate sensitivity ......................................................................................... 30
6.3. Currency fluctuation sensitivity .............................................................................. 30
7. GLOSSARY ................................................................................................................ 32
7.1. Operational Definitions ......................................................................................... 32
7.2. Financial Definitions ............................................................................................ 32
7.3. Total Homes and Businesses Data ........................................................................ 33
8. DISCLAIMER .............................................................................................................. 34
Data in EUR million, unless otherwise stated 3Q 2013 Results Report
DISCLAIMER: Please see important disclaimer in section 8 of this document
ONO – Third quarter 2013 results (unaudited) - 3
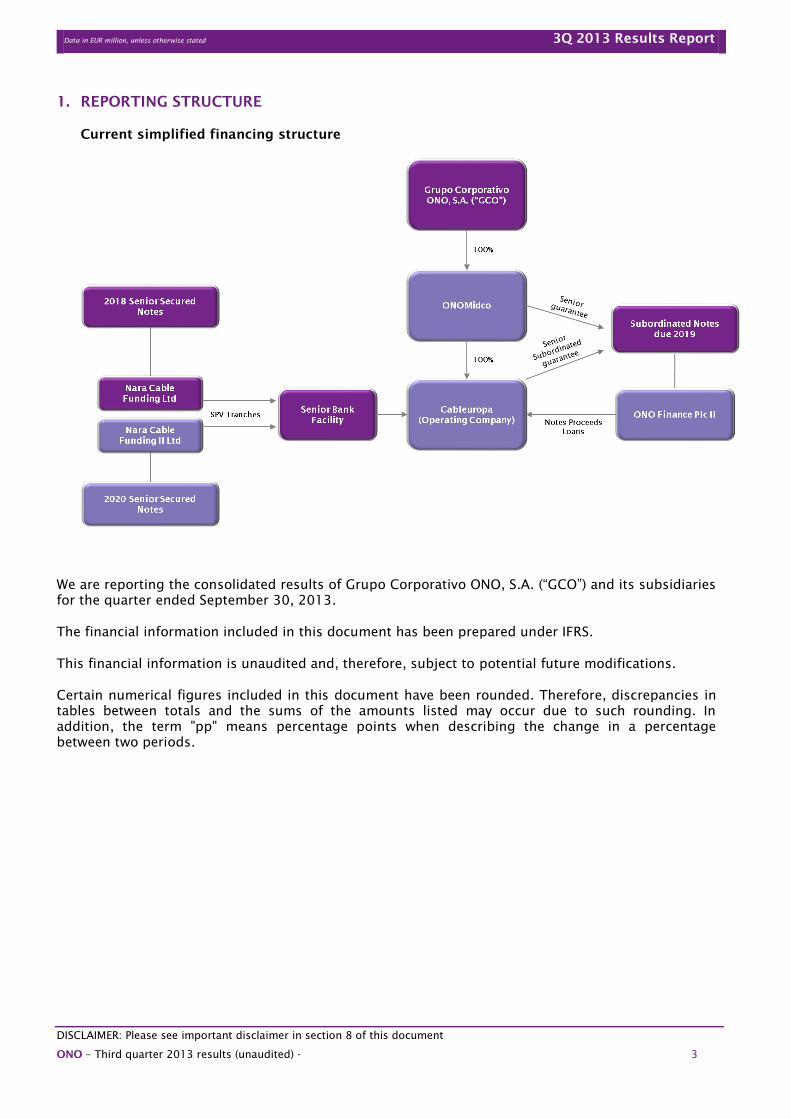
1. REPORTING STRUCTURE
Current simplified financing structure
We are reporting the consolidated results of Grupo Corporativo ONO, S.A. (“GCO”) and its subsidiaries
for the quarter ended September 30, 2013.
The financial information included in this document has been prepared under IFRS.
This financial information is unaudited and, therefore, subject to potential future modifications.
Certain numerical figures included in this document have been rounded. Therefore, discrepancies in
tables between totals and the sums of the amounts listed may occur due to such rounding. In
addition, the term "pp" means percentage points when describing the change in a percentage
between two periods.
Data in EUR million, unless otherwise stated 3Q 2013 Results Report
DISCLAIMER: Please see important disclaimer in section 8 of this document
ONO – Third quarter 2013 results (unaudited) - 4
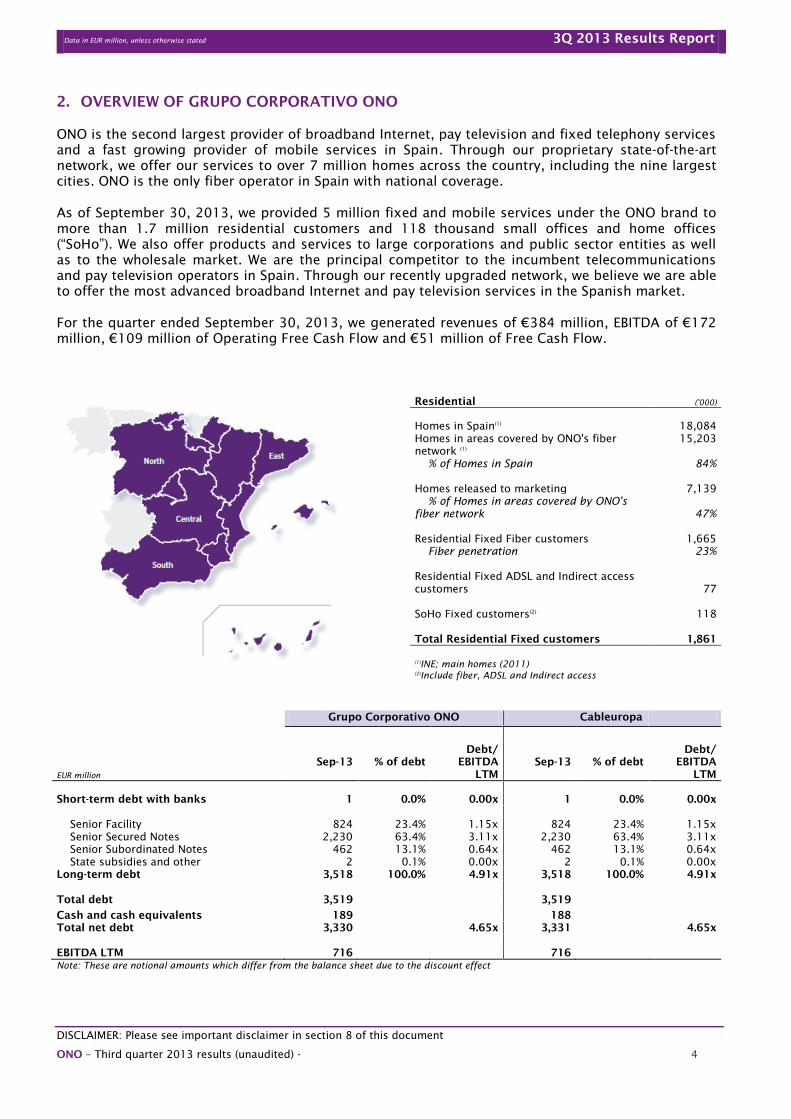
2. OVERVIEW OF GRUPO CORPORATIVO ONO
ONO is the second largest provider of broadband Internet, pay television and fixed telephony services
and a fast growing provider of mobile services in Spain. Through our proprietary state-of-the-art
network, we offer our services to over 7 million homes across the country, including the nine largest
cities. ONO is the only fiber operator in Spain with national coverage.
As of September 30, 2013, we provided 5 million fixed and mobile services under the ONO brand to
more than 1.7 million residential customers and 118 thousand small offices and home offices
(“SoHo”). We also offer products and services to large corporations and public sector entities as well
as to the wholesale market. We are the principal competitor to the incumbent telecommunications
and pay television operators in Spain. Through our recently upgraded network, we believe we are able
to offer the most advanced broadband Internet and pay television services in the Spanish market.
For the quarter ended September 30, 2013, we generated revenues of €384 million, EBITDA of €172
million, €109 million of Operating Free Cash Flow and €51 million of Free Cash Flow.
Residential ('000)
Homes in Spain(1)
18,084
Homes in areas covered by ONO's fiber
network (1)
15,203
% of Homes in Spain 84%
Homes released to marketing 7,139
% of Homes in areas covered by ONO's
fiber network 47%
Residential Fixed Fiber customers 1,665
Fiber penetration 23%
Residential Fixed ADSL and Indirect access
customers 77
SoHo Fixed customers(2)
118
Total Residential Fixed customers
1,861
(1)
INE; main homes (2011)
(2)
Include fiber, ADSL and Indirect access
Grupo Corporativo ONO Cableuropa
EUR million
Sep-13 % of debt
Debt/
EBITDA
LTM
Sep-13 % of debt
Debt/
EBITDA
LTM
Short-term debt with banks 1 0.0% 0.00x 1 0.0% 0.00x
Senior Facility 824 23.4% 1.15x 824 23.4% 1.15x
Senior Secured Notes 2,230 63.4% 3.11x 2,230 63.4% 3.11x
Senior Subordinated Notes 462 13.1% 0.64x 462 13.1% 0.64x
State subsidies and other 2 0.1% 0.00x 2 0.1% 0.00x
Long-term debt 3,518 100.0% 4.91x 3,518 100.0% 4.91x
Total debt 3,519 3,519
Cash and cash equivalents 189 188
Total net debt 3,330 4.65x 3,331 4.65x
EBITDA LTM 716 716
Note: These are notional amounts which differ from the balance sheet due to the discount effect
Data in EUR million, unless otherwise stated 3Q 2013 Results Report
DISCLAIMER: Please see important disclaimer in section 8 of this document
ONO – Third quarter 2013 results (unaudited) - 5
2.1. Key operating and financial events
ONO renews its strategy to better compete in current macro and industry environments
In October 2013, during our First Capital Markets Day, we announced the launching of our
renewed strategy to better compete in current macro and industry environments with the ambition
of becoming the preferred option for households and SoHos as provider of communication and
entertainment services in Spain.
Our renewed strategy will focus in three strategic drivers: (i) reach more customers to accelerate
sustainable growth; (ii) increase customer loyalty to reduce churn and create more value; and (iii)
improve our profitability while increasing targeted investments to continue generating cash.
In order to achieve these strategic goals, we have identified five pillars on which to build our
renewed strategy:
1) Development of a differentiated commercial offering with special focus in super high
broadband speeds (>50Mbps) and mobile (Multi-Sims) in order to increase the share of
wallet of our customers while we improve our go-to-market effectiveness and we selectively
increase our marketing investments.
2) Increase customer satisfaction and loyalty to reduce churn through the commercialization
of bundled products (3P/4P), providing free speed upgrades and other product upgrades to
customers as well as providing a superior customer experience.
3) Continuous product innovation in order to reach more customers and provide a superior
customer experience (i.e. TiVo, TV online, WiFi public network, other entertainment
services).
4) Fully digitalize customer life cycle to improve customer experience and reduce costs
through the development of a full eServices functionality and the improvement of our
eCare and eSales platforms.
5) Maximize process efficiency in order to improve our cost structure from good to best in
class through business optimization initiatives (building optimizations, contract
renegotiations, improving call center metrics, reducing field repairs and increasing self-
installation amongst other initiatives) and organizational optimizations.
We believe that ONO is the telecom company best positioned to fully take advantage of a
stabilization of the Spanish macroeconomic environment and that through the implementation of
our renewed strategy we will be able to achieve (i) faster growth; (ii) strong cash generation and
(iii) sustained deleveraging which we believe will provide a compelling return proposition for
investors.
Further advances in high-speed Internet
We continue to lead the market in super-fast broadband. At present we have the capability to
deliver broadband speeds of up to 200Mbps to over 7 million homes in Spain which makes us the
only telecom operator able to market these products on a broad scale.
On the back of our state-of-the-art infrastructure we have developed a superior offering with real
broadband speeds of up to 100 Mbps for residential customers and up to 200Mbps for SoHos (we
expect to launch 500 Mbps broadband speeds in the near future) that compares favorably to the
high-end packages with up to 30 Mbps speeds offered by the DSL players on a non-homogenous
basis.
Data in EUR million, unless otherwise stated 3Q 2013 Results Report
DISCLAIMER: Please see important disclaimer in section 8 of this document
ONO – Third quarter 2013 results (unaudited) - 6
In August 2013 we took a step forward in our strong commitment towards super high speeds. On
the one hand we fully redefined our retail offering to include exclusively super high broadband
speeds packages of 50,100 & 200 Mbps (we continue to marginally sell 20Mbps broadband
packages through the on-line channel for most price sensitive customers). On the other hand, we
launched a loyalty campaign by which we are seeking to migrate existing customers to our new
super high speeds product offering either for free or for a small incremental price.
As of September 2013, 818 thousand residential customers subscribed to our high and super-high
speed Internet packages, representing 60% of our residential broadband customer base and
almost 600 thousand broadband customers had already been migrated to our new product
offerings. We believe that these commercial results position ONO as the market leader in high-
speed Internet in Spain.
Further advances in mobile
We have increased our total mobile services by 587 thousand in the last twelve months to reach
902 thousand as of September 2013 on the back of our competitive price plans. We believe this to
be an excellent commercial result.
During 2012, we redefined our mobile proposition with the aim of adapting our tariffs to new
customers’ needs and markets dynamics. This included the development of more compelling
fixed-mobile convergent and bundled offers and the introduction of selective handset financing.
In August 2013 we further improved our mobile proposition and we launched a renewed multi-SIM
mobile package by which customers can subscribe to a 200min/200Mbps product for €5 per
month. We expect this service to continue delivering positive results in the future on the back of
our competitive price plans.
Further advances in pay TV
In October 2011, we officially launched our next generation TV service (TiVo) to customers in
Madrid and Barcelona and since then we have made this service available in our entire network.
This innovative product, which we believe is unmatched in Spain, provides our customers with a
high quality interactive experience and a wide variety of content combining 37 HD channels (HD
leadership in Spain), 3D functionalities and broadband connectivity with a powerful and
personalized search engine and a PVR (Personal Video Recorder).
As of September 2013, we had over 259 thousand TiVo services which represent 31% of our TV
customer base. We believe that the TiVo results so far suggest positive market acceptance as
showcased by the positive momentum in customer acquisitions, low churn levels and high
satisfaction metrics.
With the aim of continuing to improve our pay TV offering, in October 2013 we upgraded our TiVo
service with new functionalities that include an improved user interface, an improved search
engine, the ability to share content between different TiVo boxes within a household and a new
energy saving mode amongst other.
We intent to continue improving our pay TV offering in the near future with the development of
new products and services such as TV online. We believe this will help us to increase the number
of our TV customers and revenues going forward.
Data in EUR million, unless otherwise stated 3Q 2013 Results Report
DISCLAIMER: Please see important disclaimer in section 8 of this document
ONO – Third quarter 2013 results (unaudited) - 7
2.2. Financial highlights
Financial highlights
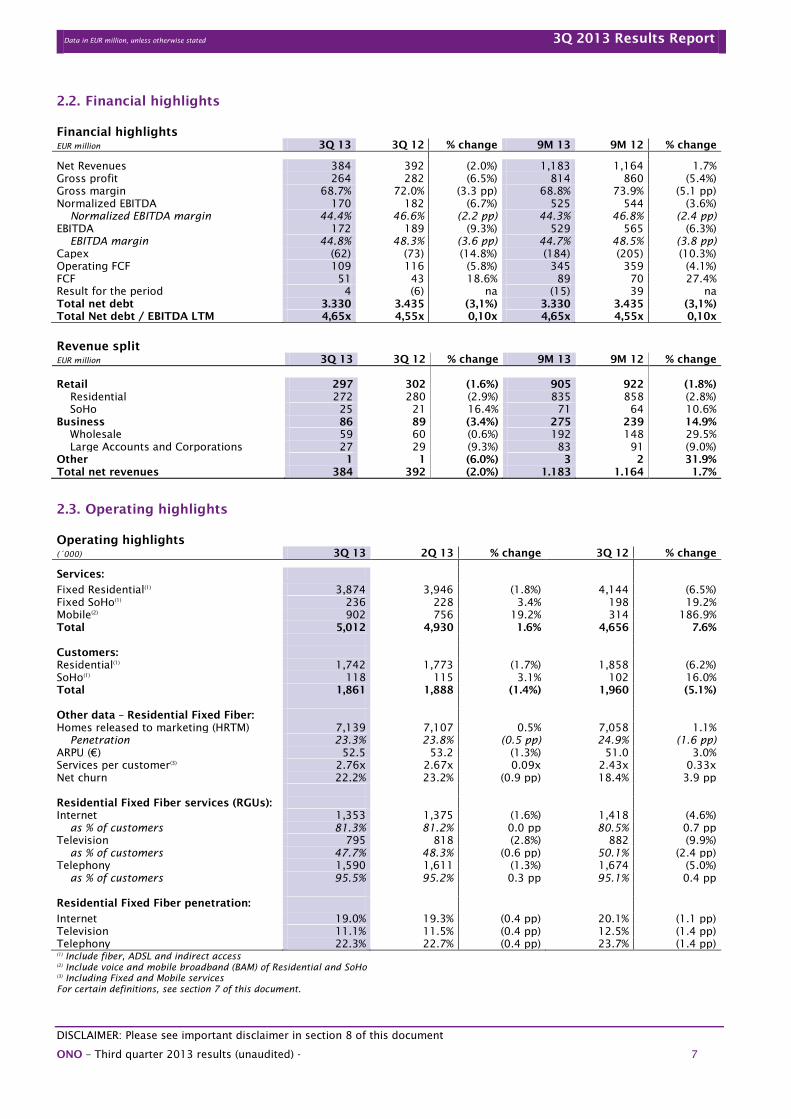
EUR million 3Q 13 3Q 12 % change 9M 13 9M 12 % change
Net Revenues 384 392 (2.0%) 1,183 1,164 1.7%
Gross profit 264 282 (6.5%) 814 860 (5.4%)
Gross margin 68.7% 72.0% (3.3 pp) 68.8% 73.9% (5.1 pp)
Normalized EBITDA 170 182 (6.7%) 525 544 (3.6%)
Normalized EBITDA margin 44.4% 46.6% (2.2 pp) 44.3% 46.8% (2.4 pp)
EBITDA 172 189 (9.3%) 529 565 (6.3%)
EBITDA margin 44.8% 48.3% (3.6 pp) 44.7% 48.5% (3.8 pp)
Capex (62) (73) (14.8%) (184) (205) (10.3%)
Operating FCF 109 116 (5.8%) 345 359 (4.1%)
FCF 51 43 18.6% 89 70 27.4%
Result for the period 4 (6) na (15) 39 na
Total net debt 3.330 3.435 (3,1%) 3.330 3.435 (3,1%)
Total Net debt / EBITDA LTM 4,65x 4,55x 0,10x 4,65x 4,55x 0,10x
Revenue split
EUR million 3Q 13 3Q 12 % change 9M 13 9M 12 % change
Retail 297 302 (1.6%) 905 922 (1.8%)
Residential 272 280 (2.9%) 835 858 (2.8%)
SoHo 25 21 16.4% 71 64 10.6%
Business 86 89 (3.4%) 275 239 14.9%
Wholesale 59 60 (0.6%) 192 148 29.5%
Large Accounts and Corporations 27 29 (9.3%) 83 91 (9.0%)
Other 1 1 (6.0%) 3 2 31.9%
Total net revenues 384 392 (2.0%) 1.183 1.164 1.7%
2.3. Operating highlights
Operating highlights
(´000) 3Q 13 2Q 13 % change 3Q 12 % change
Services:
Fixed Residential(1)
3,874 3,946 (1.8%) 4,144 (6.5%)
Fixed SoHo(1)
236 228 3.4% 198 19.2%
Mobile(2)
902 756 19.2% 314 186.9%
Total 5,012 4,930 1.6% 4,656 7.6%
Customers:
Residential(1)
1,742 1,773 (1.7%) 1,858 (6.2%)
SoHo(1)
118 115 3.1% 102 16.0%
Total 1,861 1,888 (1.4%) 1,960 (5.1%)
Other data – Residential Fixed Fiber:
Homes released to marketing (HRTM) 7,139 7,107 0.5% 7,058 1.1%
Penetration 23.3% 23.8% (0.5 pp) 24.9% (1.6 pp)
ARPU (€) 52.5 53.2 (1.3%) 51.0 3.0%
Services per customer(3)
2.76x 2.67x 0.09x 2.43x 0.33x
Net churn 22.2% 23.2% (0.9 pp) 18.4% 3.9 pp
Residential Fixed Fiber services (RGUs):
Internet 1,353 1,375 (1.6%) 1,418 (4.6%)
as % of customers 81.3% 81.2% 0.0 pp 80.5% 0.7 pp
Television 795 818 (2.8%) 882 (9.9%)
as % of customers 47.7% 48.3% (0.6 pp) 50.1% (2.4 pp)
Telephony 1,590 1,611 (1.3%) 1,674 (5.0%)
as % of customers 95.5% 95.2% 0.3 pp 95.1% 0.4 pp
Residential Fixed Fiber penetration:
Internet 19.0% 19.3% (0.4 pp) 20.1% (1.1 pp)
Television 11.1% 11.5% (0.4 pp) 12.5% (1.4 pp)
Telephony 22.3% 22.7% (0.4 pp) 23.7% (1.4 pp)
(1)
Include fiber, ADSL and indirect access
(2)
Include voice and mobile broadband (BAM) of Residential and SoHo
(3)
Including Fixed and Mobile services
For certain definitions, see section 7 of this document.
Data in EUR million, unless otherwise stated 3Q 2013 Results Report
DISCLAIMER: Please see important disclaimer in section 8 of this document
ONO – Third quarter 2013 results (unaudited) - 8
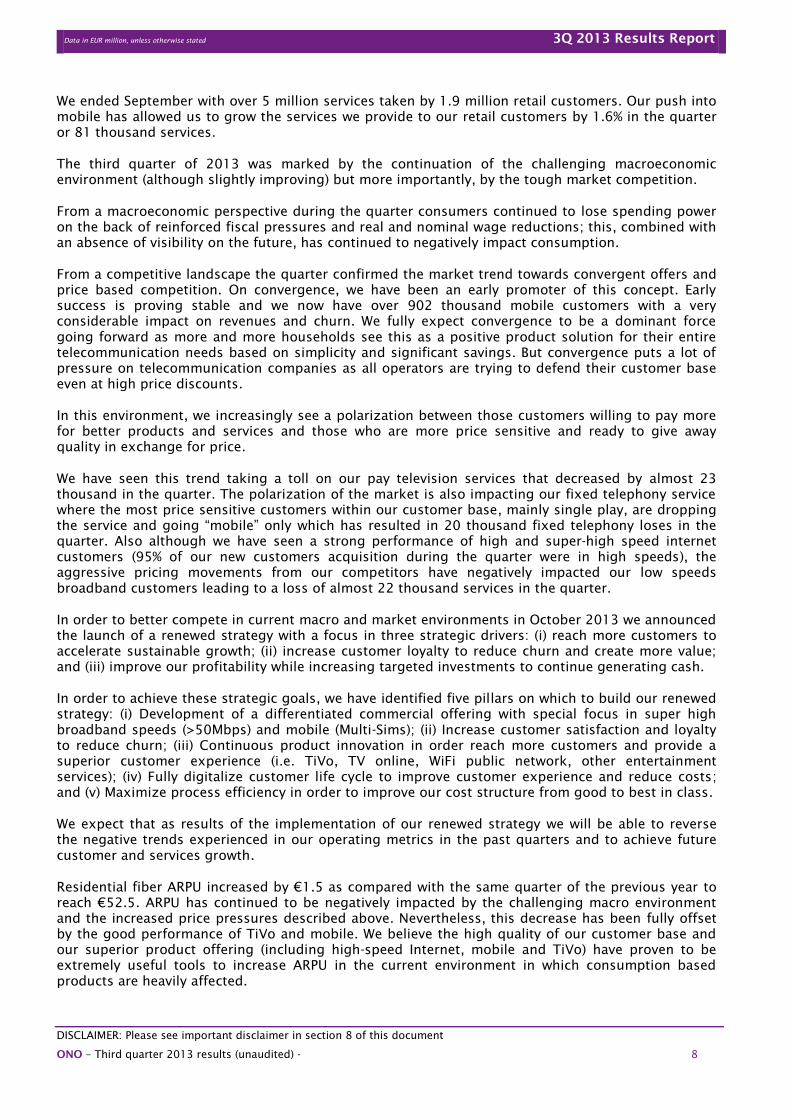
We ended September with over 5 million services taken by 1.9 million retail customers. Our push into
mobile has allowed us to grow the services we provide to our retail customers by 1.6% in the quarter
or 81 thousand services.
The third quarter of 2013 was marked by the continuation of the challenging macroeconomic
environment (although slightly improving) but more importantly, by the tough market competition.
From a macroeconomic perspective during the quarter consumers continued to lose spending power
on the back of reinforced fiscal pressures and real and nominal wage reductions; this, combined with
an absence of visibility on the future, has continued to negatively impact consumption.
From a competitive landscape the quarter confirmed the market trend towards convergent offers and
price based competition. On convergence, we have been an early promoter of this concept. Early
success is proving stable and we now have over 902 thousand mobile customers with a very
considerable impact on revenues and churn. We fully expect convergence to be a dominant force
going forward as more and more households see this as a positive product solution for their entire
telecommunication needs based on simplicity and significant savings. But convergence puts a lot of
pressure on telecommunication companies as all operators are trying to defend their customer base
even at high price discounts.
In this environment, we increasingly see a polarization between those customers willing to pay more
for better products and services and those who are more price sensitive and ready to give away
quality in exchange for price.
We have seen this trend taking a toll on our pay television services that decreased by almost 23
thousand in the quarter. The polarization of the market is also impacting our fixed telephony service
where the most price sensitive customers within our customer base, mainly single play, are dropping
the service and going “mobile” only which has resulted in 20 thousand fixed telephony loses in the
quarter. Also although we have seen a strong performance of high and super-high speed internet
customers (95% of our new customers acquisition during the quarter were in high speeds), the
aggressive pricing movements from our competitors have negatively impacted our low speeds
broadband customers leading to a loss of almost 22 thousand services in the quarter.
In order to better compete in current macro and market environments in October 2013 we announced
the launch of a renewed strategy with a focus in three strategic drivers: (i) reach more customers to
accelerate sustainable growth; (ii) increase customer loyalty to reduce churn and create more value;
and (iii) improve our profitability while increasing targeted investments to continue generating cash.
In order to achieve these strategic goals, we have identified five pillars on which to build our renewed
strategy: (i) Development of a differentiated commercial offering with special focus in super high
broadband speeds (>50Mbps) and mobile (Multi-Sims); (ii) Increase customer satisfaction and loyalty
to reduce churn; (iii) Continuous product innovation in order reach more customers and provide a
superior customer experience (i.e. TiVo, TV online, WiFi public network, other entertainment
services); (iv) Fully digitalize customer life cycle to improve customer experience and reduce costs;
and (v) Maximize process efficiency in order to improve our cost structure from good to best in class.
We expect that as results of the implementation of our renewed strategy we will be able to reverse
the negative trends experienced in our operating metrics in the past quarters and to achieve future
customer and services growth.
Residential fiber ARPU increased by €1.5 as compared with the same quarter of the previous year to
reach €52.5. ARPU has continued to be negatively impacted by the challenging macro environment
and the increased price pressures described above. Nevertheless, this decrease has been fully offset
by the good performance of TiVo and mobile. We believe the high quality of our customer base and
our superior product offering (including high-speed Internet, mobile and TiVo) have proven to be
extremely useful tools to increase ARPU in the current environment in which consumption based
products are heavily affected.
Data in EUR million, unless otherwise stated 3Q 2013 Results Report
DISCLAIMER: Please see important disclaimer in section 8 of this document
ONO – Third quarter 2013 results (unaudited) - 9
Our focus on providing bundled services, the continuous up-sale and cross-sale campaigns to our
customer base as well as our push into mobile have enabled us to increase our residential fiber
services per customer by 0.3x in the last twelve months to reach 2.76x as of September. In addition,
in the third quarter of 2013, 86% of our residential fiber customers subscribed to a bundled package
(47% Double, 39% Triple) and 13% subscribed to a quadruple play package which makes us the
leading provider of bundled services in Spain.
Residential fiber net churn decreased by 1% in the quarter to reach 22.2% as of September 2013. The
negative macro and industry environments have continued to negatively impact our most price
sensitive customers, typically those that subscribe to a single service or to a low tier double or triple
play packages. Nevertheless we believe that the new initiatives we have developed on the back of our
renewed strategy that include: (i) free speeds upgrades and product repositioning (over 600 thousand
customers migrated as of September 2013); (ii) high quality customers acquisition; and (iii) improved
prevention and retention processes are already delivering positive results and will continue to help us
reduce churn going forward.
Our SoHo segment continued to perform well and we managed to add over 8 thousand services and 4
thousand customers in the last quarter to reach 236 thousand and 118 thousand, respectively. These
good results were mainly driven by: (i) our strong product offerings and competitive price plans that
include broadband speeds of up to 200 Mbps (500 Mbps in the near future), mobile, multi-site
services as well as other value added services (including domain registration, housing, hosting and
cloud computing; (ii) our successful channel mix strategy; (iii) the improvement of our brand
awareness (through brand recognition activities and direct marketing efforts amongst other
initiatives); and (iv) the improvement of customer experience and churn levels as result of our
improved multi-skill platforms.
Data in EUR million, unless otherwise stated 3Q 2013 Results Report
DISCLAIMER: Please see important disclaimer in section 8 of this document
ONO – Third quarter 2013 results (unaudited) - 10
3. GRUPO CORPORATIVO ONO
3.1. Condensed Consolidated Financial Statements
Condensed Consolidated Statements of Operations
EUR million 3Q 13 3Q 12 % change 9M 13 9M 12 % change
Net Revenues 384 392 (2.0%) 1,183 1,164 1.7%
Cost of sales (120) (110) 9.6% (369) (303) 21.6%
Net opex (92) (93) (0.8%) (286) (296) (3.5%)
EBITDA 172 189 (9.3%) 529 565 (6.3%)
Depreciation and amortization (107) (104) 2.7% (301) (293) 2.8%
Other results - 0 na 0 54 na
Other revenues 0 0 na 0 0 na
Over provisions - 0 na 2 0 na
Impairment and gains or losses on
disposal of fixed assets (1) (22) na (17) (25) na
EBIT / Operating result 64 63 0.4% 214 301 (29.0%)
Net financial result (64) (72) (12.2%) (241) (245) (1.7%)
EBT / Result before income tax (0) (9) na (27) 56 na
Income tax 5 3 na 13 (17) na
Result before non-controlling
interest 4 (6) na (15) 39 na
Non-controlling interest (0) (0) na (0) (0) na
Result for the period 4 (6) na (15) 39 na
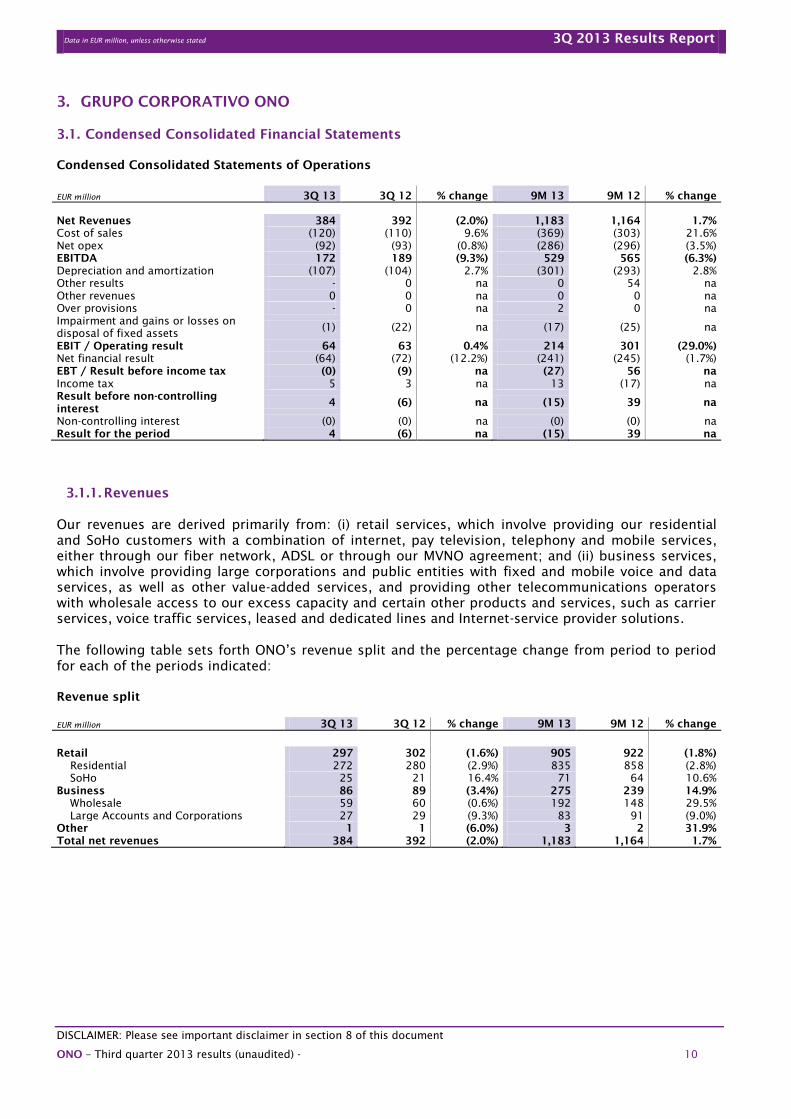
3.1.1. Revenues
Our revenues are derived primarily from: (i) retail services, which involve providing our residential
and SoHo customers with a combination of internet, pay television, telephony and mobile services,
either through our fiber network, ADSL or through our MVNO agreement; and (ii) business services,
which involve providing large corporations and public entities with fixed and mobile voice and data
services, as well as other value-added services, and providing other telecommunications operators
with wholesale access to our excess capacity and certain other products and services, such as carrier
services, voice traffic services, leased and dedicated lines and Internet-service provider solutions.
The following table sets forth ONO’s revenue split and the percentage change from period to period
for each of the periods indicated:
Revenue split
EUR million 3Q 13 3Q 12 % change 9M 13 9M 12 % change
Retail 297 302 (1.6%) 905 922 (1.8%)
Residential 272 280 (2.9%) 835 858 (2.8%)
SoHo 25 21 16.4% 71 64 10.6%
Business 86 89 (3.4%) 275 239 14.9%
Wholesale 59 60 (0.6%) 192 148 29.5%
Large Accounts and Corporations 27 29 (9.3%) 83 91 (9.0%)
Other 1 1 (6.0%) 3 2 31.9%
Total net revenues 384 392 (2.0%) 1,183 1,164 1.7%
Data in EUR million, unless otherwise stated 3Q 2013 Results Report
DISCLAIMER: Please see important disclaimer in section 8 of this document
ONO – Third quarter 2013 results (unaudited) - 11
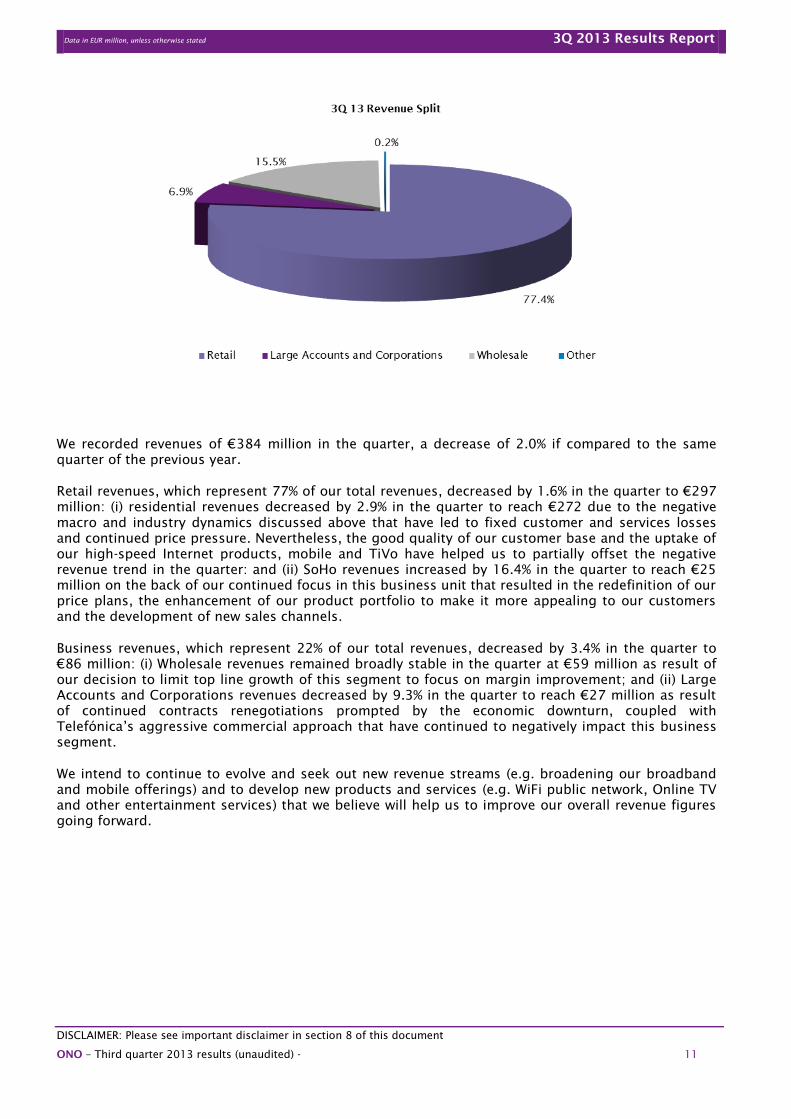
We recorded revenues of €384 million in the quarter, a decrease of 2.0% if compared to the same
quarter of the previous year.
Retail revenues, which represent 77% of our total revenues, decreased by 1.6% in the quarter to €297
million: (i) residential revenues decreased by 2.9% in the quarter to reach €272 due to the negative
macro and industry dynamics discussed above that have led to fixed customer and services losses
and continued price pressure. Nevertheless, the good quality of our customer base and the uptake of
our high-speed Internet products, mobile and TiVo have helped us to partially offset the negative
revenue trend in the quarter: and (ii) SoHo revenues increased by 16.4% in the quarter to reach €25
million on the back of our continued focus in this business unit that resulted in the redefinition of our
price plans, the enhancement of our product portfolio to make it more appealing to our customers
and the development of new sales channels.
Business revenues, which represent 22% of our total revenues, decreased by 3.4% in the quarter to
€86 million: (i) Wholesale revenues remained broadly stable in the quarter at €59 million as result of
our decision to limit top line growth of this segment to focus on margin improvement; and (ii) Large
Accounts and Corporations revenues decreased by 9.3% in the quarter to reach €27 million as result
of continued contracts renegotiations prompted by the economic downturn, coupled with
Telefónica’s aggressive commercial approach that have continued to negatively impact this business
segment.
We intend to continue to evolve and seek out new revenue streams (e.g. broadening our broadband
and mobile offerings) and to develop new products and services (e.g. WiFi public network, Online TV
and other entertainment services) that we believe will help us to improve our overall revenue figures
going forward.
Data in EUR million, unless otherwise stated 3Q 2013 Results Report
DISCLAIMER: Please see important disclaimer in section 8 of this document
ONO – Third quarter 2013 results (unaudited) - 12
3.1.2. Retail fixed services
(´000) 3Q 13 2Q 13 % change 3Q 12 % change
Residential 3,874 3,946 (1.8%) 4,144 (6.5%)
SoHo 236 228 3.4% 198 19.2%
Total Retail 4,110 4,173 (1.5%) 4,342 (5.3%)
3.1.2.1. Residential Fixed services
(´000) 3Q 13 2Q 13 % change 3Q 12 % change
Fiber 3,738 3,804 (1.7%) 3,974 (5.9%)
ADSL and Indirect access 136 143 (4.4%) 170 (19.7%)
Total Residential Fixed services 3,874 3,946 (1.8%) 4,144 (6.5%)
a) Residential Fixed Fiber
The residential fixed fiber services segment provides us with revenues from monthly fees and initial
activation and connection charges from residential bundled and individual services; usage charges
from residential telephony services; customer premise equipment rental charges; incoming
interconnection; variable fees for pay-per-view and video-on-demand (VoD) services from fiber
television services, revenues from our mobile business and other minor items. We currently offer our
residential customers double-play and triple-play packages of services which consist of telephony and
either internet or television, or both services as well as mobile services.
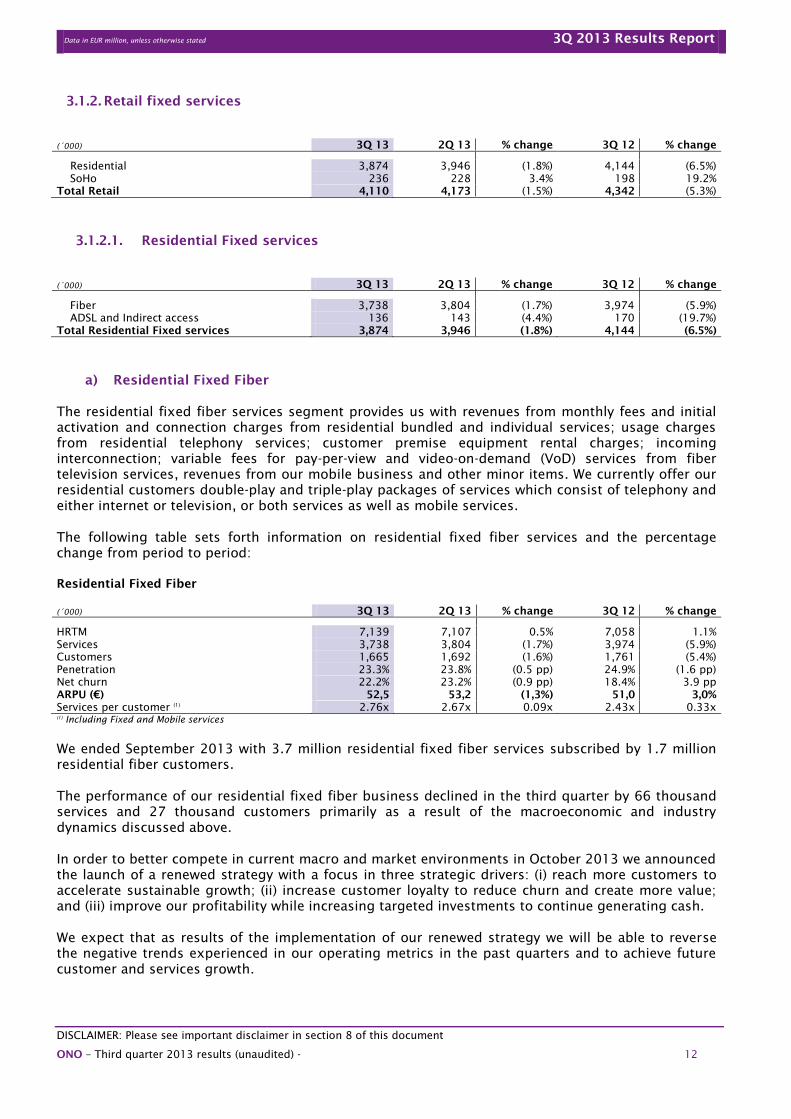
The following table sets forth information on residential fixed fiber services and the percentage
change from period to period:
Residential Fixed Fiber
(´000) 3Q 13 2Q 13 % change 3Q 12 % change
HRTM 7,139 7,107 0.5% 7,058 1.1%
Services 3,738 3,804 (1.7%) 3,974 (5.9%)
Customers 1,665 1,692 (1.6%) 1,761 (5.4%)
Penetration 23.3% 23.8% (0.5 pp) 24.9% (1.6 pp)
Net churn 22.2% 23.2% (0.9 pp) 18.4% 3.9 pp
ARPU (€) 52,5 53,2 (1,3%) 51,0 3,0%
Services per customer (1)
2.76x 2.67x 0.09x 2.43x 0.33x
(1)
Including Fixed and Mobile services
We ended September 2013 with 3.7 million residential fixed fiber services subscribed by 1.7 million
residential fiber customers.
The performance of our residential fixed fiber business declined in the third quarter by 66 thousand
services and 27 thousand customers primarily as a result of the macroeconomic and industry
dynamics discussed above.
In order to better compete in current macro and market environments in October 2013 we announced
the launch of a renewed strategy with a focus in three strategic drivers: (i) reach more customers to
accelerate sustainable growth; (ii) increase customer loyalty to reduce churn and create more value;
and (iii) improve our profitability while increasing targeted investments to continue generating cash.
We expect that as results of the implementation of our renewed strategy we will be able to reverse
the negative trends experienced in our operating metrics in the past quarters and to achieve future
customer and services growth.
Data in EUR million, unless otherwise stated 3Q 2013 Results Report
DISCLAIMER: Please see important disclaimer in section 8 of this document
ONO – Third quarter 2013 results (unaudited) - 13
Residential fiber ARPU increased by €1.5 as compared with the same quarter of the previous year to
reach €52.5. ARPU has continued to be negatively impacted by challenging macro environment and
the increased price pressures described above. Nevertheless, this decrease has been fully offset by
the good performance of TiVo and mobile. We believe the high quality of our customer base and our
strong product offering (including high-speed Internet, mobile and TiVo) have proven to be extremely
useful tools to increase ARPU in the current environment in which consumption based products are
heavily affected.
Our focus on providing bundled services, the continuous up-sale and cross-sale campaigns to our
customer base as well as our push into mobile have enabled us to increase our residential fiber
services per customer by 0.3x in the last twelve months to reach 2.76x as of September 2013. In
addition, in the third quarter of 2013, 86% of our residential fiber customers subscribed to a bundled
package (47% Double, 39% Triple) and 13% subscribed to a quadruple play package which makes us
the leading provider of bundled services in Spain.
Residential fiber net churn decreased by 1% in the quarter to reach 22.2% as of September 2013. The
negative macro and industry environments have continued to negatively impact our most price
sensitive customers, typically those that subscribe to a single service or to a low tier double or triple
play packages. Nevertheless we believe that the new initiatives we have developed on the back of our
renewed strategy that include: (i) Free speeds upgrades and product repositioning (over 600
thousand customers migrated as of September 2013); (ii) High quality customers acquisition; and (iii)
improved prevention and retention processes are already delivering positive results and will continue
to help us reduce churn going forward.
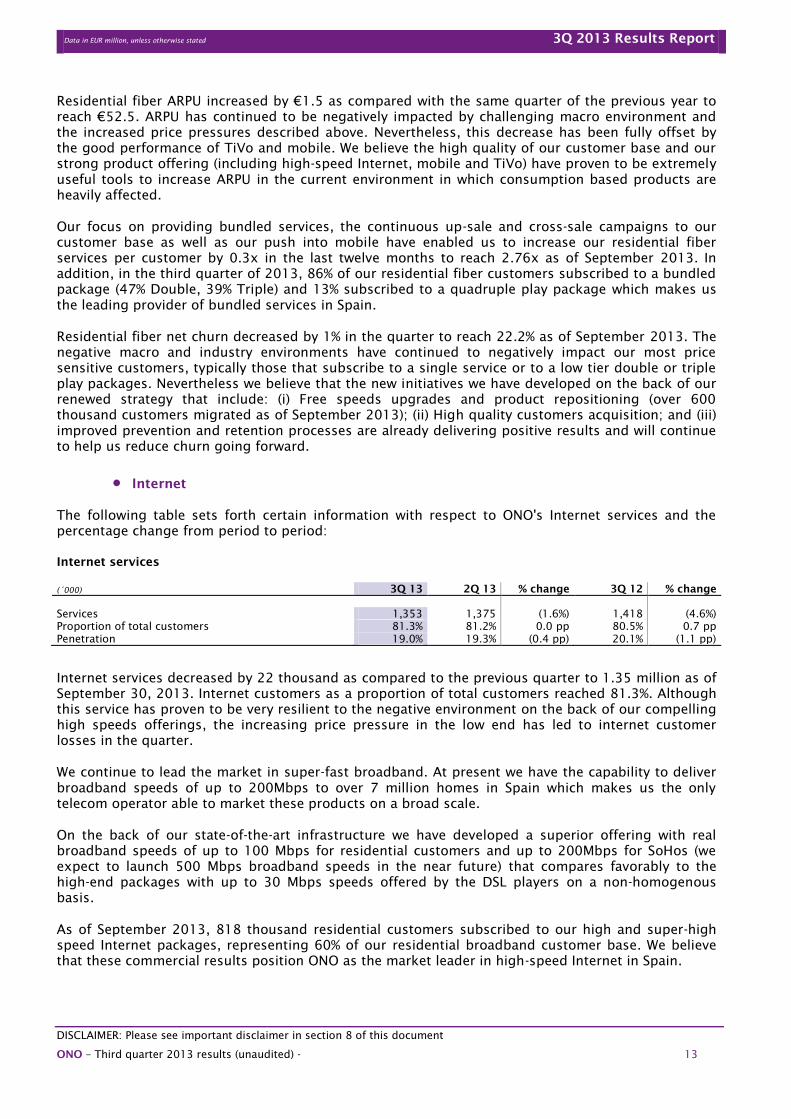
Internet
The following table sets forth certain information with respect to ONO's Internet services and the
percentage change from period to period:
Internet services
(´000) 3Q 13 2Q 13 % change 3Q 12 % change
Services 1,353 1,375 (1.6%) 1,418 (4.6%)
Proportion of total customers 81.3% 81.2% 0.0 pp 80.5% 0.7 pp
Penetration 19.0% 19.3% (0.4 pp) 20.1% (1.1 pp)
Internet services decreased by 22 thousand as compared to the previous quarter to 1.35 million as of
September 30, 2013. Internet customers as a proportion of total customers reached 81.3%. Although
this service has proven to be very resilient to the negative environment on the back of our compelling
high speeds offerings, the increasing price pressure in the low end has led to internet customer
losses in the quarter.
We continue to lead the market in super-fast broadband. At present we have the capability to deliver
broadband speeds of up to 200Mbps to over 7 million homes in Spain which makes us the only
telecom operator able to market these products on a broad scale.
On the back of our state-of-the-art infrastructure we have developed a superior offering with real
broadband speeds of up to 100 Mbps for residential customers and up to 200Mbps for SoHos (we
expect to launch 500 Mbps broadband speeds in the near future) that compares favorably to the
high-end packages with up to 30 Mbps speeds offered by the DSL players on a non-homogenous
basis.
As of September 2013, 818 thousand residential customers subscribed to our high and super-high
speed Internet packages, representing 60% of our residential broadband customer base. We believe
that these commercial results position ONO as the market leader in high-speed Internet in Spain.

Data in EUR million, unless otherwise stated 3Q 2013 Results Report
DISCLAIMER: Please see important disclaimer in section 8 of this document
ONO – Third quarter 2013 results (unaudited) - 14
In August 2013 we took a step forward in our strong commitment towards super high speeds. On the
one hand we fully redefined our retail offering to include exclusively super high broadband speeds
packages of 50,100 & 200 Mbps (we continue to marginally sell 20Mbps broadband packages
through the on-line channel for most price sensitive customers). On the other hand, we launched a
loyalty campaign by which we are seeking to migrate existing customers to our new super high speed
product offering either for free or fore a small incremental price.
We expect that as results of the implementation of our renewed strategy we will be able to reverse
the negative trend experienced in our broadband customer numbers in the past quarters and to
achieve future broadband customer growth.
Television
The following table sets forth certain information with respect to ONO’s television services and the
percentage change from period to period:
Television services
(´000) 3Q 13 2Q 13 % change 3Q 12 % change
Services 795 818 (2.8%) 882 (9.9%)
Proportion of total customers 47.7% 48.3% (0.6 pp) 50.1% (2.4 pp)
Penetration 11.1% 11.5% (0.4 pp) 12.5% (1.4 pp)
Fiber television services decreased by 23 thousand as compared to the previous quarter to 795
thousand as of September 30, 2013. We believe this service continues to be impacted by the negative
macroeconomic environment, the significant price increase experienced in football and the VAT
increase which we believe is motivating our most price sensitive customers to drop the service and
switch to “free to air” services in order to preserve their disposable income.
To proactively address the weakness on this service, we are promoting TiVo, a unique product that
has positioned ONO at the forefront of the TV market in Spain. This innovative product, which we
believe is unmatched in Spain, provides our customers with a high quality interactive experience and
a wide variety of content combining 37 HD channels (HD leadership in Spain), 3D functionalities and
broadband connectivity with a powerful and personalized search engine and a PVR (Personal Video
Recorder). We believe these unique functionalities will help us to increase the number of our TV
customers and revenues going forward.
As of September 2013, we had over 259 thousand TiVo services which represent 31% of our TV
customer base. We believe that the TiVo results so far suggest positive market acceptance showcased
by the positive momentum in customer acquisitions, low churn levels and high customer satisfaction
metrics.
With the aim of continuing to improve our pay TV offering, in October 2013 we upgraded our TiVo
product with new functionalities that include an improved user interface, an improved search engine,
the ability to share content between different TiVo boxes within a household and a new energy saving
mode amongst other.
We intend to continue improving our pay TV offering in the near future with the development of new
products and services such as online TV services what we believe will help us to increase the number
of our TV customers and revenues going forward.
Data in EUR million, unless otherwise stated 3Q 2013 Results Report
DISCLAIMER: Please see important disclaimer in section 8 of this document
ONO – Third quarter 2013 results (unaudited) - 15
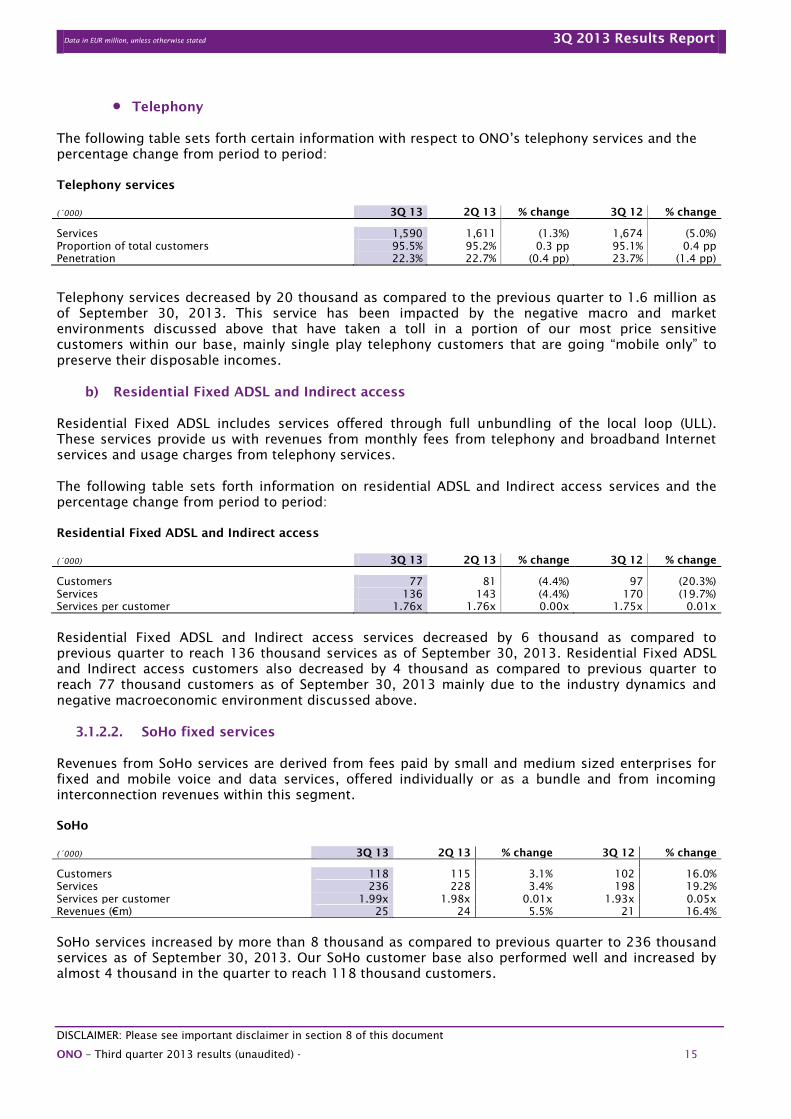
Telephony
The following table sets forth certain information with respect to ONO’s telephony services and the
percentage change from period to period:
Telephony services
(´000) 3Q 13 2Q 13 % change 3Q 12 % change
Services 1,590 1,611 (1.3%) 1,674 (5.0%)
Proportion of total customers 95.5% 95.2% 0.3 pp 95.1% 0.4 pp
Penetration 22.3% 22.7% (0.4 pp) 23.7% (1.4 pp)
Telephony services decreased by 20 thousand as compared to the previous quarter to 1.6 million as
of September 30, 2013. This service has been impacted by the negative macro and market
environments discussed above that have taken a toll in a portion of our most price sensitive
customers within our base, mainly single play telephony customers that are going “mobile only” to
preserve their disposable incomes.
b) Residential Fixed ADSL and Indirect access
Residential Fixed ADSL includes services offered through full unbundling of the local loop (ULL).
These services provide us with revenues from monthly fees from telephony and broadband Internet
services and usage charges from telephony services.
The following table sets forth information on residential ADSL and Indirect access services and the
percentage change from period to period:
Residential Fixed ADSL and Indirect access
(´000) 3Q 13 2Q 13 % change 3Q 12 % change
Customers 77 81 (4.4%) 97 (20.3%)
Services 136 143 (4.4%) 170 (19.7%)
Services per customer 1.76x 1.76x 0.00x 1.75x 0.01x
Residential Fixed ADSL and Indirect access services decreased by 6 thousand as compared to
previous quarter to reach 136 thousand services as of September 30, 2013. Residential Fixed ADSL
and Indirect access customers also decreased by 4 thousand as compared to previous quarter to
reach 77 thousand customers as of September 30, 2013 mainly due to the industry dynamics and
negative macroeconomic environment discussed above.
3.1.2.2. SoHo fixed services
Revenues from SoHo services are derived from fees paid by small and medium sized enterprises for
fixed and mobile voice and data services, offered individually or as a bundle and from incoming
interconnection revenues within this segment.
SoHo
(´000) 3Q 13 2Q 13 % change 3Q 12 % change
Customers 118 115 3.1% 102 16.0%
Services 236 228 3.4% 198 19.2%
Services per customer 1.99x 1.98x 0.01x 1.93x 0.05x
Revenues (€m) 25 24 5.5% 21 16.4%
SoHo services increased by more than 8 thousand as compared to previous quarter to 236 thousand
services as of September 30, 2013. Our SoHo customer base also performed well and increased by
almost 4 thousand in the quarter to reach 118 thousand customers.
Data in EUR million, unless otherwise stated 3Q 2013 Results Report
DISCLAIMER: Please see important disclaimer in section 8 of this document
ONO – Third quarter 2013 results (unaudited) - 16
These good results were mainly driven by: (i) our strong product offering and competitive price plans
that include broadband speeds of up to 200 Mbps (500 Mbps in the near future), mobile, multi-site
services as well as other value added services (including domain registration, housing, hosting and
cloud computing; (ii) our successful channel mix strategy; (iii) the improvement of our brand
awareness (through brand recognition activities and direct marketing efforts amongst other
initiatives); and (iv) the improvement customer experience and churn levels as result of our improved
multi-skill platforms.
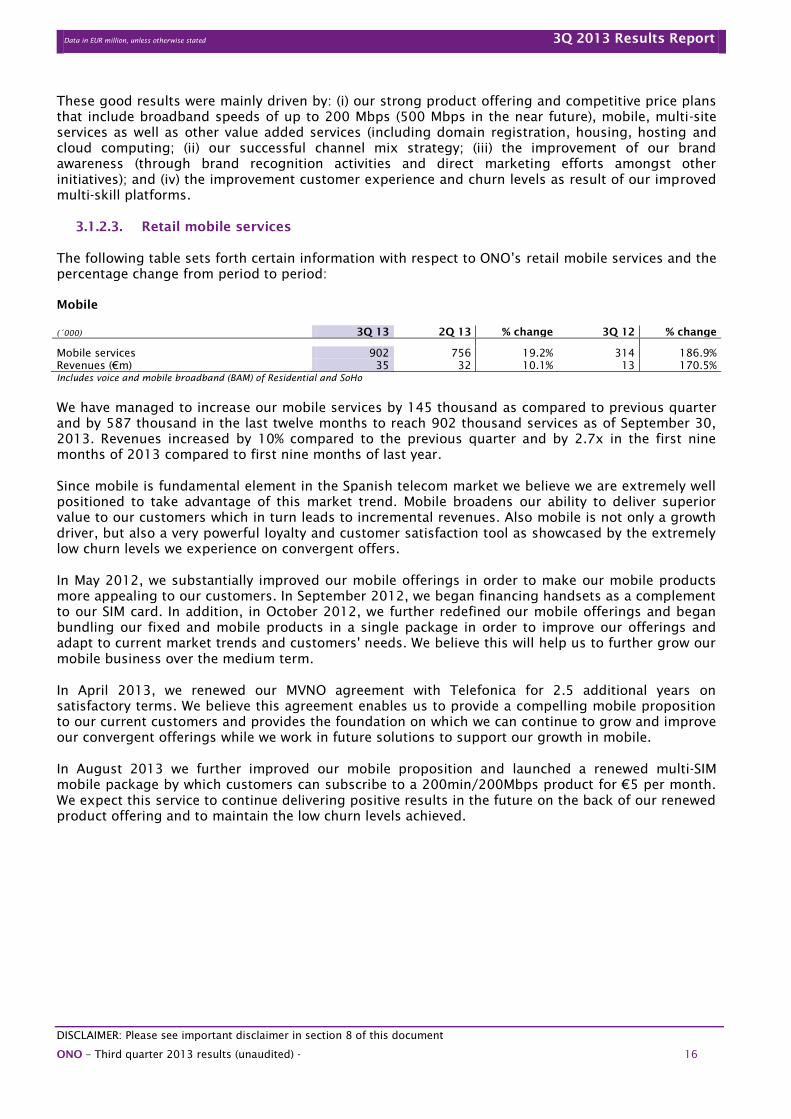
3.1.2.3. Retail mobile services
The following table sets forth certain information with respect to ONO’s retail mobile services and the
percentage change from period to period:
Mobile
(´000) 3Q 13 2Q 13 % change 3Q 12 % change
Mobile services 902 756 19.2% 314 186.9%
Revenues (€m) 35 32 10.1% 13 170.5%
Includes voice and mobile broadband (BAM) of Residential and SoHo
We have managed to increase our mobile services by 145 thousand as compared to previous quarter
and by 587 thousand in the last twelve months to reach 902 thousand services as of September 30,
2013. Revenues increased by 10% compared to the previous quarter and by 2.7x in the first nine
months of 2013 compared to first nine months of last year.
Since mobile is fundamental element in the Spanish telecom market we believe we are extremely well
positioned to take advantage of this market trend. Mobile broadens our ability to deliver superior
value to our customers which in turn leads to incremental revenues. Also mobile is not only a growth
driver, but also a very powerful loyalty and customer satisfaction tool as showcased by the extremely
low churn levels we experience on convergent offers.
In May 2012, we substantially improved our mobile offerings in order to make our mobile products
more appealing to our customers. In September 2012, we began financing handsets as a complement
to our SIM card. In addition, in October 2012, we further redefined our mobile offerings and began
bundling our fixed and mobile products in a single package in order to improve our offerings and
adapt to current market trends and customers' needs. We believe this will help us to further grow our
mobile business over the medium term.
In April 2013, we renewed our MVNO agreement with Telefonica for 2.5 additional years on
satisfactory terms. We believe this agreement enables us to provide a compelling mobile proposition
to our current customers and provides the foundation on which we can continue to grow and improve
our convergent offerings while we work in future solutions to support our growth in mobile.
In August 2013 we further improved our mobile proposition and launched a renewed multi-SIM
mobile package by which customers can subscribe to a 200min/200Mbps product for €5 per month.
We expect this service to continue delivering positive results in the future on the back of our renewed
product offering and to maintain the low churn levels achieved.

Data in EUR million, unless otherwise stated 3Q 2013 Results Report
DISCLAIMER: Please see important disclaimer in section 8 of this document
ONO – Third quarter 2013 results (unaudited) - 17
3.1.3. Business services
3.1.3.1. Wholesale
Revenues from the wholesale business unit are derived from carrier services, voice traffic services,
leased and dedicated lines and ISP solutions, provided to other telecommunications operators and
from the provision of intelligent network services.
Wholesale
EUR million 3Q 13 3Q 12 % change 9M 13 9M 12 % change
Revenues 59 60 (0.6%) 192 148 29.5%
Wholesale revenues remained broadly stable as compared to the previous quarter reaching €59
million as a result of our decision to limit top line growth of this segment to focus in margin
improvement
The strong performance experienced in this segment in the past quarters is the result of a carefully
planned set of initiatives launched in the last two years to boost voice services revenues. In 2010, we
laid the foundations for growth by setting up a VoIP platform to help us manage prepaid services,
implementing a LCR tool (Least-Cost Routing) and reengineering the whole delivery process to make
it more efficient and faster. Since 2011, we added new IP traffic termination providers to improve our
commercial offer and we strengthened the team by hiring an experienced sales representative and a
routing manager.
Going forward we expect to continue growing our wholesale business albeit at a slower pace while we
seek to increase the margin contribution of this business segment.
3.1.3.2. Large Accounts and Corporations
Revenues within the Large Accounts and Corporations business segment are derived from
customized solutions designed to satisfy the communication needs (voice, Internet, data solutions
and equipment) of large corporate groups, institutions and central and autonomous government
agencies, through an integrated range of tailored services.
The following table sets forth revenues from the Large Accounts and Corporations segment and the
percentage change from period to period:
Large Accounts and Corporations
EUR million 3Q 13 3Q 12 % change 9M 13 9M 12 % change
Revenues 27 29 (9.3%) 83 91 (9.0%)
Large Accounts and Corporations revenues decreased by 9.3% as compared to previous quarters to
€27 million as a result of continued contracts renegotiations prompted by the economic downturn,
coupled with Telefónica’s aggressive commercial approach have continued to negatively impact this
business segment.
Data in EUR million, unless otherwise stated 3Q 2013 Results Report
DISCLAIMER: Please see important disclaimer in section 8 of this document
ONO – Third quarter 2013 results (unaudited) - 18
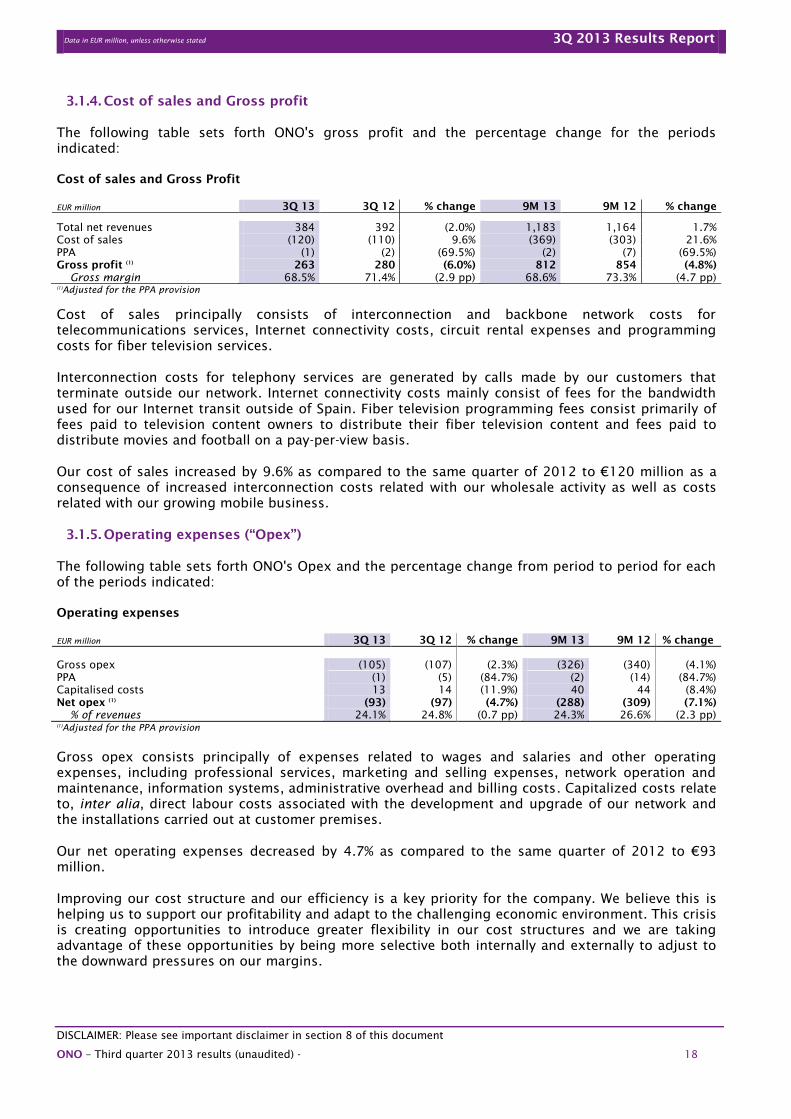
3.1.4. Cost of sales and Gross profit
The following table sets forth ONO's gross profit and the percentage change for the periods
indicated:
Cost of sales and Gross Profit
EUR million 3Q 13 3Q 12 % change 9M 13 9M 12 % change
Total net revenues 384 392 (2.0%) 1,183 1,164 1.7%
Cost of sales (120) (110) 9.6% (369) (303) 21.6%
PPA (1) (2) (69.5%) (2) (7) (69.5%)
Gross profit (1)
263 280 (6.0%) 812 854 (4.8%)
Gross margin 68.5% 71.4% (2.9 pp) 68.6% 73.3% (4.7 pp)
(1)
Adjusted for the PPA provision
Cost of sales principally consists of interconnection and backbone network costs for
telecommunications services, Internet connectivity costs, circuit rental expenses and programming
costs for fiber television services.
Interconnection costs for telephony services are generated by calls made by our customers that
terminate outside our network. Internet connectivity costs mainly consist of fees for the bandwidth
used for our Internet transit outside of Spain. Fiber television programming fees consist primarily of
fees paid to television content owners to distribute their fiber television content and fees paid to
distribute movies and football on a pay-per-view basis.
Our cost of sales increased by 9.6% as compared to the same quarter of 2012 to €120 million as a
consequence of increased interconnection costs related with our wholesale activity as well as costs
related with our growing mobile business.
3.1.5. Operating expenses (“Opex”)
The following table sets forth ONO's Opex and the percentage change from period to period for each
of the periods indicated:
Operating expenses
EUR million 3Q 13 3Q 12 % change 9M 13 9M 12 % change
Gross opex (105) (107) (2.3%) (326) (340) (4.1%)
PPA (1) (5) (84.7%) (2) (14) (84.7%)
Capitalised costs 13 14 (11.9%) 40 44 (8.4%)
Net opex (1)
(93) (97) (4.7%) (288) (309) (7.1%)
% of revenues 24.1% 24.8% (0.7 pp) 24.3% 26.6% (2.3 pp)
(1)
Adjusted for the PPA provision
Gross opex consists principally of expenses related to wages and salaries and other operating
expenses, including professional services, marketing and selling expenses, network operation and
maintenance, information systems, administrative overhead and billing costs. Capitalized costs relate
to, inter alia, direct labour costs associated with the development and upgrade of our network and
the installations carried out at customer premises.
Our net operating expenses decreased by 4.7% as compared to the same quarter of 2012 to €93
million.
Improving our cost structure and our efficiency is a key priority for the company. We believe this is
helping us to support our profitability and adapt to the challenging economic environment. This crisis
is creating opportunities to introduce greater flexibility in our cost structures and we are taking
advantage of these opportunities by being more selective both internally and externally to adjust to
the downward pressures on our margins.
Data in EUR million, unless otherwise stated 3Q 2013 Results Report
DISCLAIMER: Please see important disclaimer in section 8 of this document
ONO – Third quarter 2013 results (unaudited) - 19
During the year, our strict cost control policies coupled with continuous optimization and
transformation initiatives have led to sustained Opex savings across the entire organization despite
the increased price pressures resulting from higher CPI levels.
Examples of the initiatives that we have implemented so far include: (i) renegotiation of our collective
bargaining agreement in order to link salaries evolution to the profitability of the business; (ii)
increase the number of sales through our most cost efficient channels (on-line); (iii) improving
network maintenance and fault resolution to reduce costs; and (iv) building optimization.
Although we have made noticeable the progress made so far we believe that there is a lot more to do
in the next quarters to make our business more efficient, resilient and capable of withstanding the
hostile environment in which we operate. We have identified two levers to continue improving our
cost structure and that we believe will help us to take it from good to best in class: (i) Fully digitalize
customer life cycle through the development of a full eServices functionality and the improvement of
our eCare and eSales platforms; and (ii) maximize process efficiency through optimization initiatives
(building optimizations, contract renegotiations, improving call center business metrics, reducing
field repairs and increasing self-installation amongst other initiatives) and organizational
optimizations.
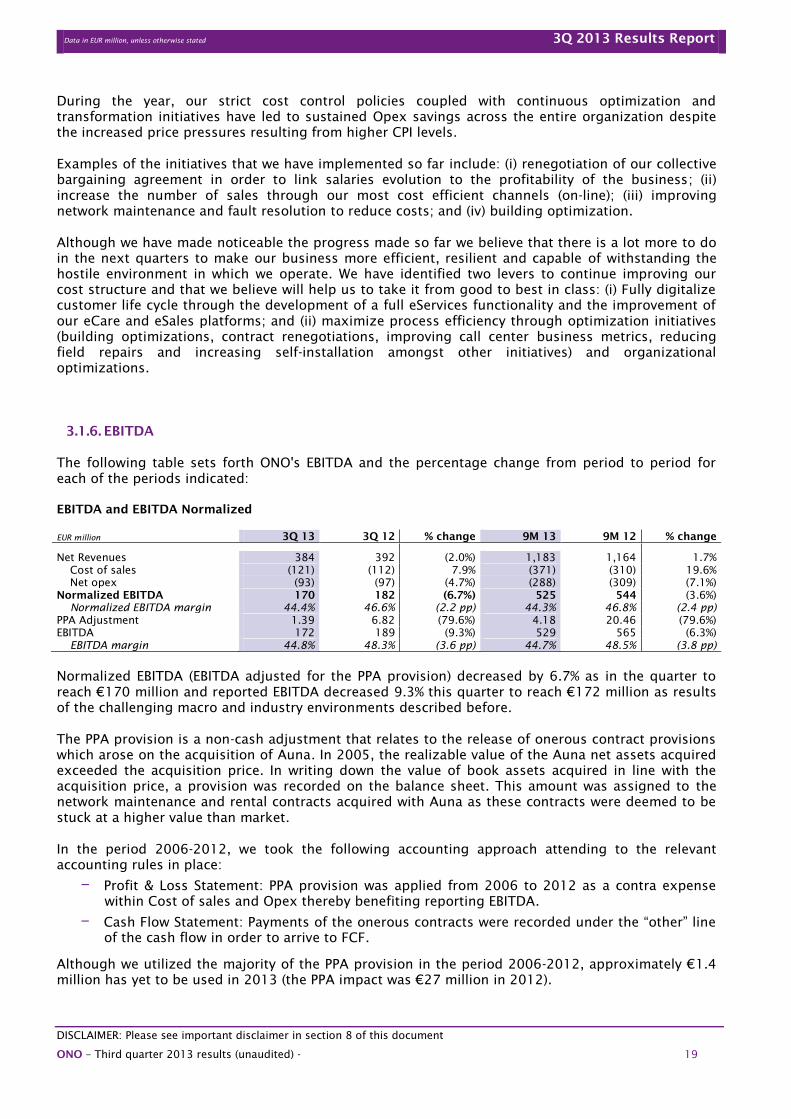
3.1.6. EBITDA
The following table sets forth ONO's EBITDA and the percentage change from period to period for
each of the periods indicated:
EBITDA and EBITDA Normalized
EUR million 3Q 13 3Q 12 % change 9M 13 9M 12 % change
Net Revenues 384 392 (2.0%) 1,183 1,164 1.7%
Cost of sales (121) (112) 7.9% (371) (310) 19.6%
Net opex (93) (97) (4.7%) (288) (309) (7.1%)
Normalized EBITDA 170 182 (6.7%) 525 544 (3.6%)
Normalized EBITDA margin 44.4% 46.6% (2.2 pp) 44.3% 46.8% (2.4 pp)
PPA Adjustment 1.39 6.82 (79.6%) 4.18 20.46 (79.6%)
EBITDA 172 189 (9.3%) 529 565 (6.3%)
EBITDA margin 44.8% 48.3% (3.6 pp) 44.7% 48.5% (3.8 pp)
Normalized EBITDA (EBITDA adjusted for the PPA provision) decreased by 6.7% as in the quarter to
reach €170 million and reported EBITDA decreased 9.3% this quarter to reach €172 million as results
of the challenging macro and industry environments described before.
The PPA provision is a non-cash adjustment that relates to the release of onerous contract provisions
which arose on the acquisition of Auna. In 2005, the realizable value of the Auna net assets acquired
exceeded the acquisition price. In writing down the value of book assets acquired in line with the
acquisition price, a provision was recorded on the balance sheet. This amount was assigned to the
network maintenance and rental contracts acquired with Auna as these contracts were deemed to be
stuck at a higher value than market.
In the period 2006-2012, we took the following accounting approach attending to the relevant
accounting rules in place:
– Profit & Loss Statement: PPA provision was applied from 2006 to 2012 as a contra expense
within Cost of sales and Opex thereby benefiting reporting EBITDA.
– Cash Flow Statement: Payments of the onerous contracts were recorded under the “other” line
of the cash flow in order to arrive to FCF.
Although we utilized the majority of the PPA provision in the period 2006-2012, approximately €1.4
million has yet to be used in 2013 (the PPA impact was €27 million in 2012).
Data in EUR million, unless otherwise stated 3Q 2013 Results Report
DISCLAIMER: Please see important disclaimer in section 8 of this document
ONO – Third quarter 2013 results (unaudited) - 20
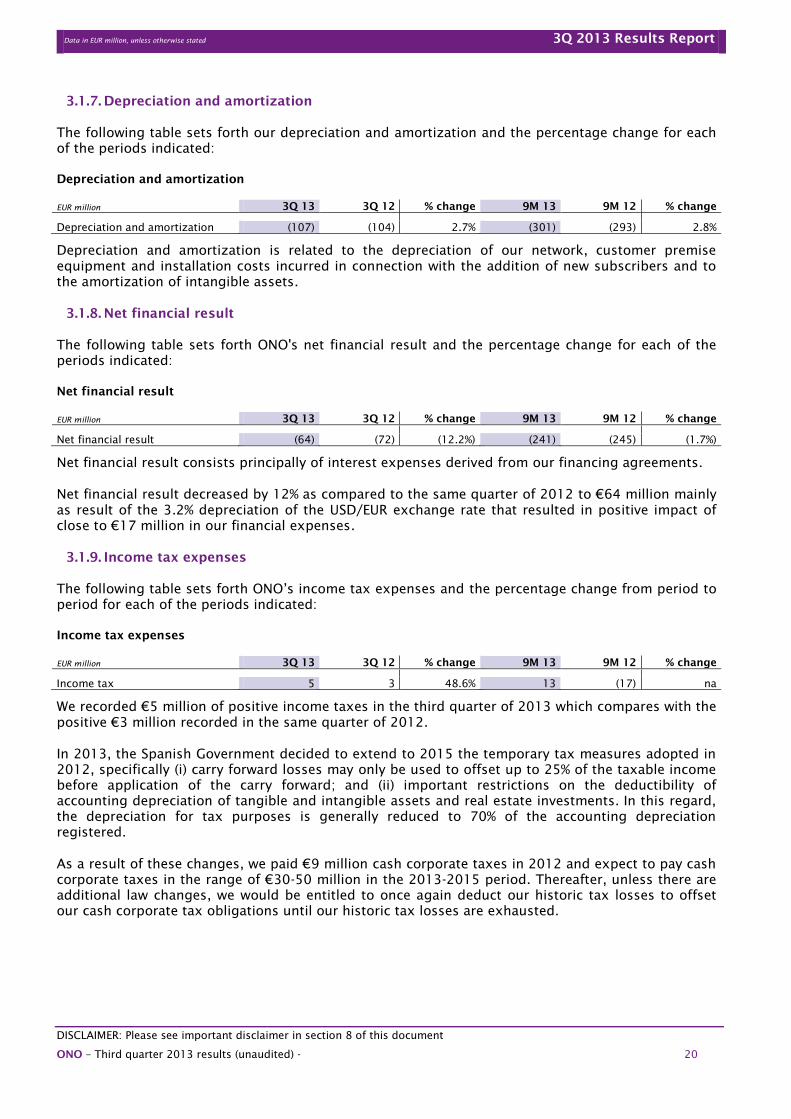
3.1.7. Depreciation and amortization
The following table sets forth our depreciation and amortization and the percentage change for each
of the periods indicated:
Depreciation and amortization
EUR million 3Q 13 3Q 12 % change 9M 13 9M 12 % change
Depreciation and amortization (107) (104) 2.7% (301) (293) 2.8%
Depreciation and amortization is related to the depreciation of our network, customer premise
equipment and installation costs incurred in connection with the addition of new subscribers and to
the amortization of intangible assets.
3.1.8. Net financial result
The following table sets forth ONO's net financial result and the percentage change for each of the
periods indicated:
Net financial result
EUR million 3Q 13 3Q 12 % change 9M 13 9M 12 % change
Net financial result (64) (72) (12.2%) (241) (245) (1.7%)
Net financial result consists principally of interest expenses derived from our financing agreements.
Net financial result decreased by 12% as compared to the same quarter of 2012 to €64 million mainly
as result of the 3.2% depreciation of the USD/EUR exchange rate that resulted in positive impact of
close to €17 million in our financial expenses.
3.1.9. Income tax expenses
The following table sets forth ONO’s income tax expenses and the percentage change from period to
period for each of the periods indicated:
Income tax expenses
EUR million 3Q 13 3Q 12 % change 9M 13 9M 12 % change
Income tax 5 3 48.6% 13 (17) na
We recorded €5 million of positive income taxes in the third quarter of 2013 which compares with the
positive €3 million recorded in the same quarter of 2012.
In 2013, the Spanish Government decided to extend to 2015 the temporary tax measures adopted in
2012, specifically (i) carry forward losses may only be used to offset up to 25% of the taxable income
before application of the carry forward; and (ii) important restrictions on the deductibility of
accounting depreciation of tangible and intangible assets and real estate investments. In this regard,
the depreciation for tax purposes is generally reduced to 70% of the accounting depreciation
registered.
As a result of these changes, we paid €9 million cash corporate taxes in 2012 and expect to pay cash
corporate taxes in the range of €30-50 million in the 2013-2015 period. Thereafter, unless there are
additional law changes, we would be entitled to once again deduct our historic tax losses to offset
our cash corporate tax obligations until our historic tax losses are exhausted.
Data in EUR million, unless otherwise stated 3Q 2013 Results Report
DISCLAIMER: Please see important disclaimer in section 8 of this document
ONO – Third quarter 2013 results (unaudited) - 21
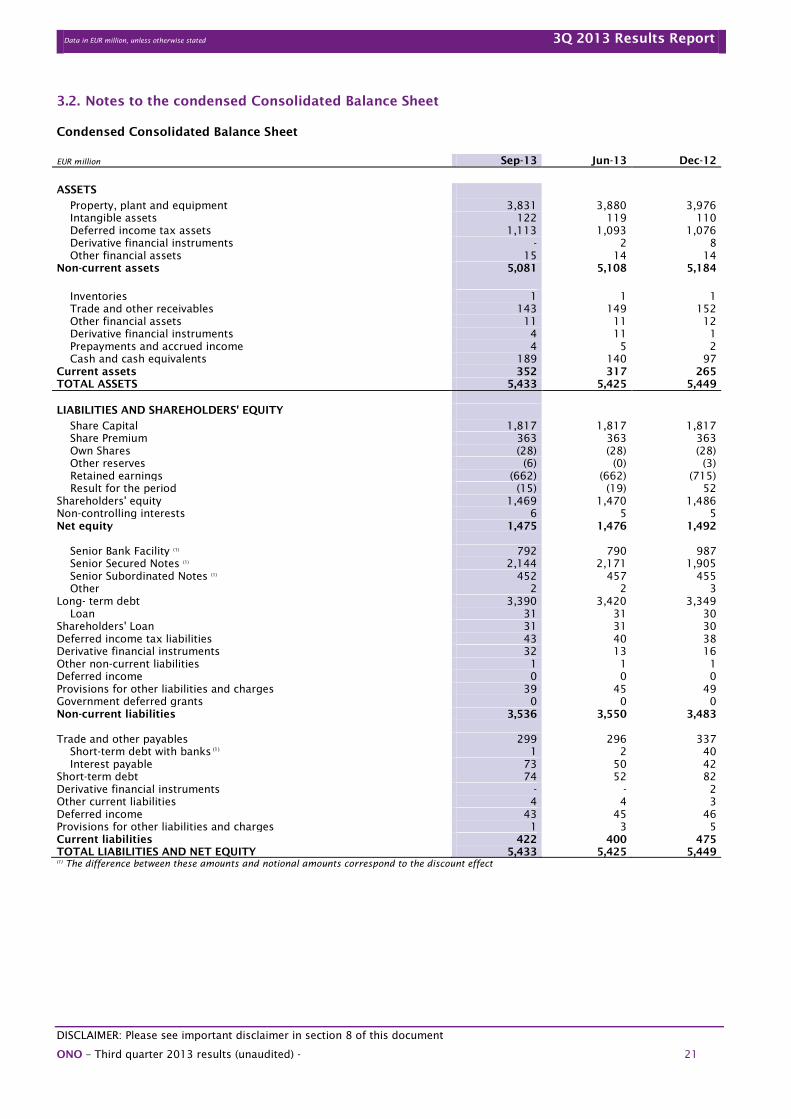
3.2. Notes to the condensed Consolidated Balance Sheet
Condensed Consolidated Balance Sheet
EUR million Sep-13 Jun-13 Dec-12
ASSETS
Property, plant and equipment 3,831 3,880 3,976
Intangible assets 122 119 110
Deferred income tax assets 1,113 1,093 1,076
Derivative financial instruments - 2 8
Other financial assets 15 14 14
Non-current assets 5,081 5,108 5,184
Inventories 1 1 1
Trade and other receivables 143 149 152
Other financial assets 11 11 12
Derivative financial instruments 4 11 1
Prepayments and accrued income 4 5 2
Cash and cash equivalents 189 140 97
Current assets 352 317 265
TOTAL ASSETS 5,433 5,425 5,449
LIABILITIES AND SHAREHOLDERS' EQUITY
Share Capital 1,817 1,817 1,817
Share Premium 363 363 363
Own Shares (28) (28) (28)
Other reserves (6) (0) (3)
Retained earnings (662) (662) (715)
Result for the period (15) (19) 52
Shareholders' equity 1,469 1,470 1,486
Non-controlling interests 6 5 5
Net equity 1,475 1,476 1,492
Senior Bank Facility (1)
792 790 987
Senior Secured Notes (1)
2,144 2,171 1,905
Senior Subordinated Notes (1)
452 457 455
Other
2 2 3
Long- term debt 3,390 3,420 3,349
Loan 31 31 30
Shareholders' Loan 31 31 30
Deferred income tax liabilities 43 40 38
Derivative financial instruments 32 13 16
Other non-current liabilities 1 1 1
Deferred income 0 0 0
Provisions for other liabilities and charges 39 45 49
Government deferred grants 0 0 0
Non-current liabilities 3,536 3,550 3,483
Trade and other payables 299 296 337
Short-term debt with banks (1)
1 2 40
Interest payable
73 50 42
Short-term debt 74 52 82
Derivative financial instruments - - 2
Other current liabilities 4 4 3
Deferred income 43 45 46
Provisions for other liabilities and charges 1 3 5
Current liabilities 422 400 475
TOTAL LIABILITIES AND NET EQUITY 5,433 5,425 5,449
(1)
The difference between these amounts and notional amounts correspond to the discount effect
Data in EUR million, unless otherwise stated 3Q 2013 Results Report
DISCLAIMER: Please see important disclaimer in section 8 of this document
ONO – Third quarter 2013 results (unaudited) - 22
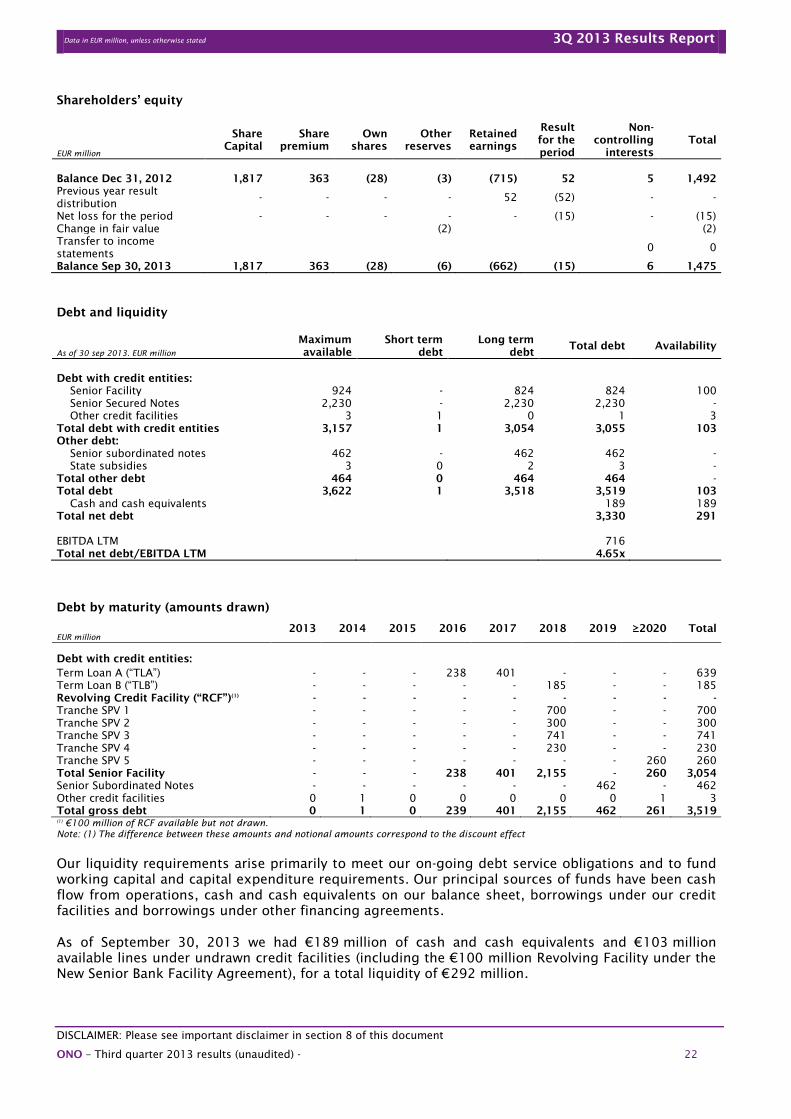
Shareholders’ equity
EUR million
Share
Capital
Share
premium
Own
shares
Other
reserves
Retained
earnings
Result
for the
period
Non-
controlling
interests
Total
Balance Dec 31, 2012 1,817 363 (28) (3) (715) 52 5 1,492
Previous year result
distribution - - - - 52 (52) - -
Net loss for the period - - - - - (15) - (15)
Change in fair value (2) (2)
Transfer to income
statements 0 0
Balance Sep 30, 2013 1,817 363 (28) (6) (662) (15) 6 1,475
Debt and liquidity
As of 30 sep 2013. EUR million
Maximum
available
Short term
debt
Long term
debt Total debt Availability
Debt with credit entities:
Senior Facility 924 - 824 824 100
Senior Secured Notes 2,230 - 2,230 2,230 -
Other credit facilities 3 1 0 1 3
Total debt with credit entities 3,157 1 3,054 3,055 103
Other debt:
Senior subordinated notes 462 - 462 462 -
State subsidies 3 0 2 3 -
Total other debt 464 0 464 464 -
Total debt 3,622 1 3,518 3,519 103
Cash and cash equivalents 189 189
Total net debt 3,330 291
EBITDA LTM 716
Total net debt/EBITDA LTM 4.65x
Debt by maturity (amounts drawn)
EUR million
2013 2014 2015 2016 2017 2018 2019 ≥2020 Total
Debt with credit entities:
Term Loan A (“TLA”) - - - 238 401 - - - 639
Term Loan B (“TLB”) - - - - - 185 - - 185
Revolving Credit Facility (“RCF”)(1)
- - - - - - - - -
Tranche SPV 1 - - - - - 700 - - 700
Tranche SPV 2 - - - - - 300 - - 300
Tranche SPV 3 - - - - - 741 - - 741
Tranche SPV 4 - - - - - 230 - - 230
Tranche SPV 5 - - - - - - - 260 260
Total Senior Facility - - - 238 401 2,155 - 260 3,054
Senior Subordinated Notes - - - - - - 462 - 462
Other credit facilities 0 1 0 0 0 0 0 1 3
Total gross debt 0 1 0 239 401 2,155 462 261 3,519
(1)
€100 million of RCF available but not drawn.
Note: (1) The difference between these amounts and notional amounts correspond to the discount effect
Our liquidity requirements arise primarily to meet our on-going debt service obligations and to fund
working capital and capital expenditure requirements. Our principal sources of funds have been cash
flow from operations, cash and cash equivalents on our balance sheet, borrowings under our credit
facilities and borrowings under other financing agreements.
As of September 30, 2013 we had €189 million of cash and cash equivalents and €103 million
available lines under undrawn credit facilities (including the €100 million Revolving Facility under the
New Senior Bank Facility Agreement), for a total liquidity of €292 million.
Data in EUR million, unless otherwise stated 3Q 2013 Results Report
DISCLAIMER: Please see important disclaimer in section 8 of this document
ONO – Third quarter 2013 results (unaudited) - 23
As a result of our refinancing process completed in June 2012 and the issuance of the €260 million
Senior Secured Notes in February 2013, the maturity profile of our debt has been significantly
improved and currently we have no relevant debt maturities before 2017.
We expect the maturities of the Bank Tranches of our Senior Facility (Term Loan A, Term Loan B and
RCF (if drawn)) to be met through available cash and cash equivalents and operating cash flow.
However, we expect that we will be required to refinance a substantial portion of the indebtedness
under the Notes Tranches of the New Senior Facility on or before their maturity in 2018.
We may incur additional indebtedness in the future principally to fund our interest expenses, working
capital needs and, to the extent not covered by operating cash flows, capital expenditures. Any
drawings under the New Senior Bank Facility Agreement are subject to the satisfaction of certain
conditions precedent and compliance with covenants, including the maintenance of certain ratios.
In order to reduce interest expense in the future, we may elect to use available cash to repay debt or
purchase our bonds in the market from time to time.
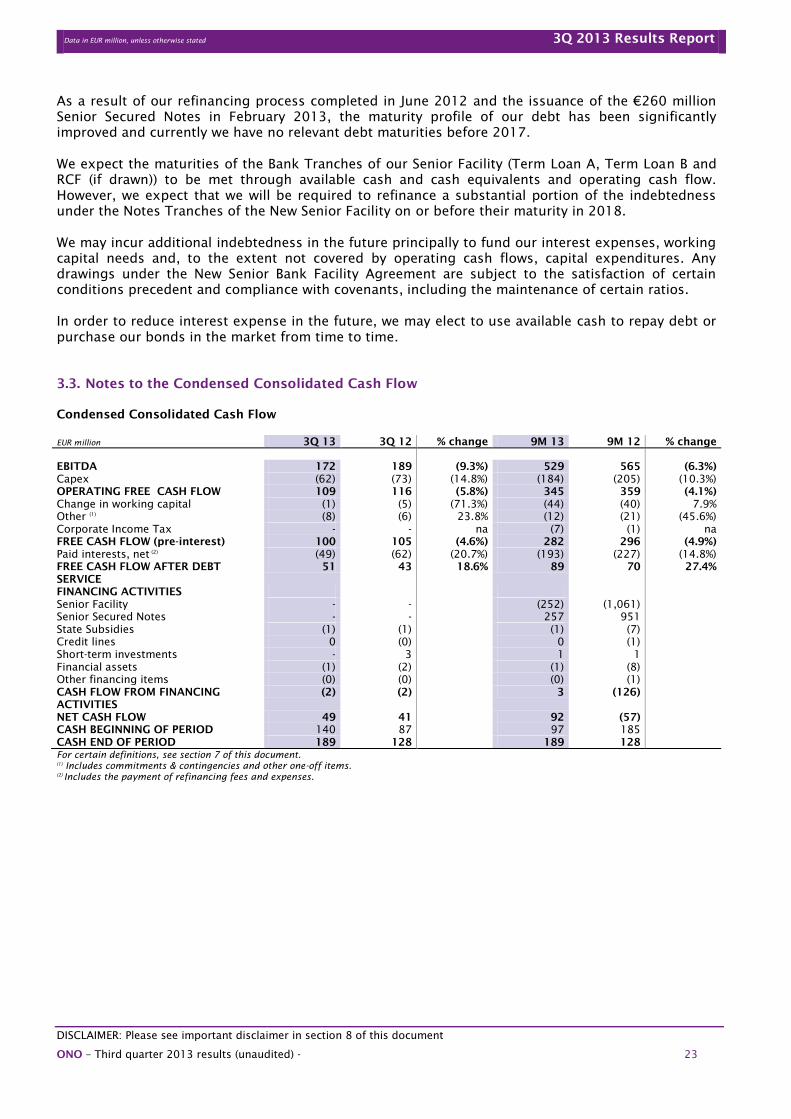
3.3. Notes to the Condensed Consolidated Cash Flow
Condensed Consolidated Cash Flow
EUR million 3Q 13 3Q 12 % change 9M 13 9M 12 % change
EBITDA 172 189 (9.3%) 529 565 (6.3%)
Capex (62) (73) (14.8%) (184) (205) (10.3%)
OPERATING FREE CASH FLOW 109 116 (5.8%) 345 359 (4.1%)
Change in working capital (1) (5) (71.3%) (44) (40) 7.9%
Other (1)
(8) (6) 23.8% (12) (21) (45.6%)
Corporate Income Tax - - na (7) (1) na
FREE CASH FLOW (pre-interest) 100 105 (4.6%) 282 296 (4.9%)
Paid interests, net (2)
(49) (62) (20.7%) (193) (227) (14.8%)
FREE CASH FLOW AFTER DEBT
SERVICE
51 43 18.6% 89 70 27.4%
FINANCING ACTIVITIES
Senior Facility - - (252) (1,061)
Senior Secured Notes - - 257 951
State Subsidies (1) (1) (1) (7)
Credit lines 0 (0) 0 (1)
Short-term investments - 3 1 1
Financial assets (1) (2) (1) (8)
Other financing items (0) (0) (0) (1)
CASH FLOW FROM FINANCING
ACTIVITIES
(2) (2) 3 (126)
NET CASH FLOW 49 41 92 (57)
CASH BEGINNING OF PERIOD 140 87 97 185
CASH END OF PERIOD 189 128 189 128
For certain definitions, see section 7 of this document.
(1)
Includes commitments & contingencies and other one-off items.
(2)
Includes the payment of refinancing fees and expenses.
Data in EUR million, unless otherwise stated 3Q 2013 Results Report
DISCLAIMER: Please see important disclaimer in section 8 of this document
ONO – Third quarter 2013 results (unaudited) - 24
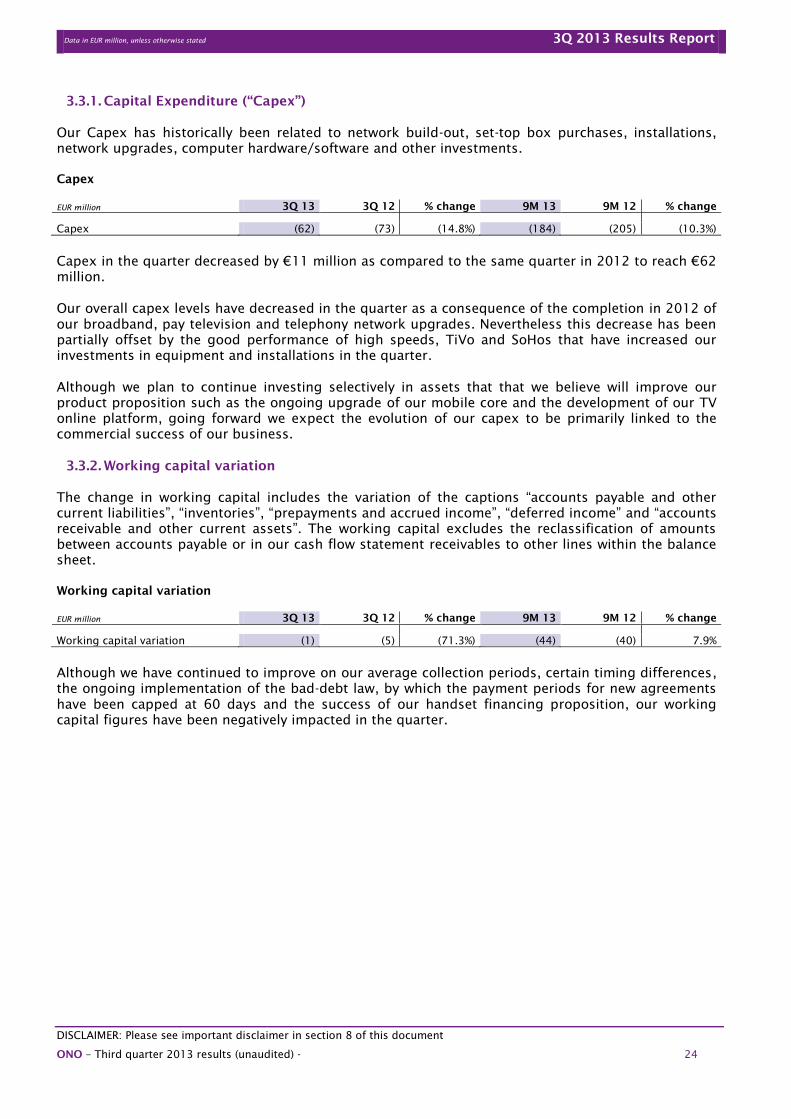
3.3.1. Capital Expenditure (“Capex”)
Our Capex has historically been related to network build-out, set-top box purchases, installations,
network upgrades, computer hardware/software and other investments.
Capex
EUR million 3Q 13 3Q 12 % change 9M 13 9M 12 % change
Capex (62) (73) (14.8%) (184) (205) (10.3%)
Capex in the quarter decreased by €11 million as compared to the same quarter in 2012 to reach €62
million.
Our overall capex levels have decreased in the quarter as a consequence of the completion in 2012 of
our broadband, pay television and telephony network upgrades. Nevertheless this decrease has been
partially offset by the good performance of high speeds, TiVo and SoHos that have increased our
investments in equipment and installations in the quarter.
Although we plan to continue investing selectively in assets that that we believe will improve our
product proposition such as the ongoing upgrade of our mobile core and the development of our TV
online platform, going forward we expect the evolution of our capex to be primarily linked to the
commercial success of our business.
3.3.2. Working capital variation
The change in working capital includes the variation of the captions “accounts payable and other
current liabilities”, “inventories”, “prepayments and accrued income”, “deferred income” and “accounts
receivable and other current assets”. The working capital excludes the reclassification of amounts
between accounts payable or in our cash flow statement receivables to other lines within the balance
sheet.
Working capital variation
EUR million 3Q 13 3Q 12 % change 9M 13 9M 12 % change
Working capital variation (1) (5) (71.3%) (44) (40) 7.9%
Although we have continued to improve on our average collection periods, certain timing differences,
the ongoing implementation of the bad-debt law, by which the payment periods for new agreements
have been capped at 60 days and the success of our handset financing proposition, our working
capital figures have been negatively impacted in the quarter.
Data in EUR million, unless otherwise stated 3Q 2013 Results Report
DISCLAIMER: Please see important disclaimer in section 8 of this document
ONO – Third quarter 2013 results (unaudited) - 25
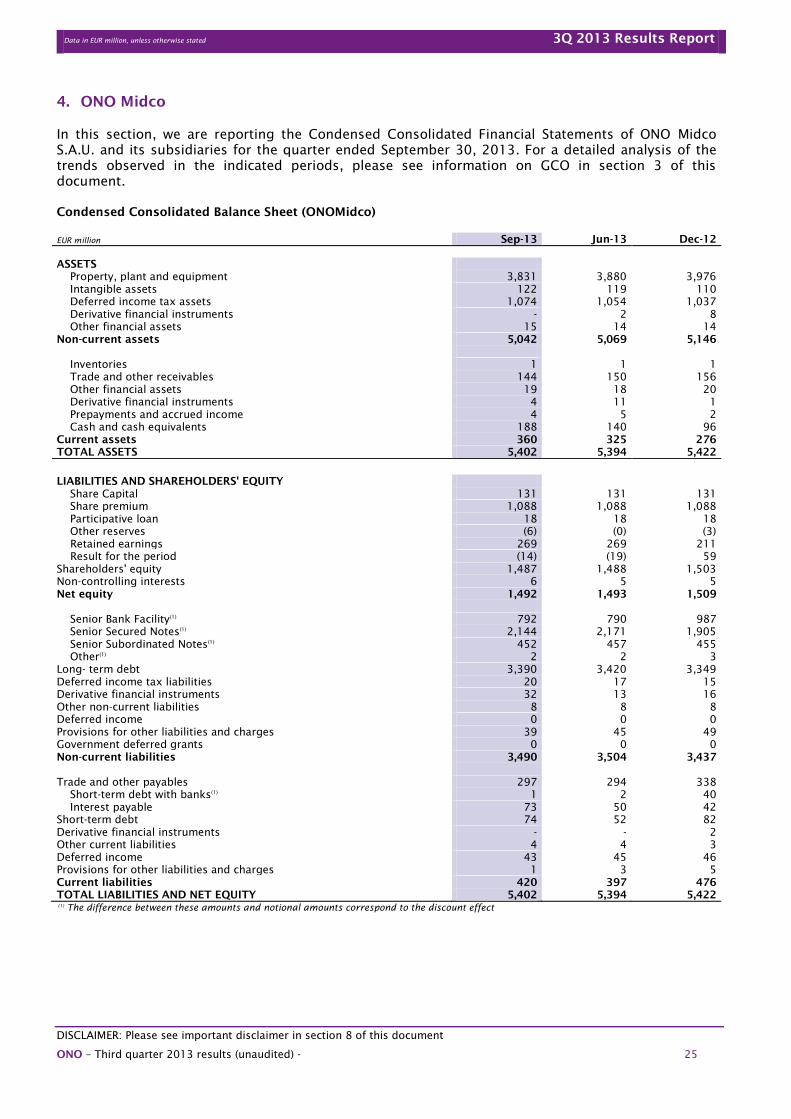
4. ONO Midco
In this section, we are reporting the Condensed Consolidated Financial Statements of ONO Midco
S.A.U. and its subsidiaries for the quarter ended September 30, 2013. For a detailed analysis of the
trends observed in the indicated periods, please see information on GCO in section 3 of this
document.
Condensed Consolidated Balance Sheet (ONOMidco)
EUR million Sep-13 Jun-13 Dec-12
ASSETS
Property, plant and equipment 3,831 3,880 3,976
Intangible assets 122 119 110
Deferred income tax assets 1,074 1,054 1,037
Derivative financial instruments - 2 8
Other financial assets 15 14 14
Non-current assets 5,042 5,069 5,146
Inventories 1 1 1
Trade and other receivables 144 150 156
Other financial assets 19 18 20
Derivative financial instruments 4 11 1
Prepayments and accrued income 4 5 2
Cash and cash equivalents 188 140 96
Current assets 360 325 276
TOTAL ASSETS 5,402 5,394 5,422
LIABILITIES AND SHAREHOLDERS' EQUITY
Share Capital 131 131 131
Share premium 1,088 1,088 1,088
Participative loan 18 18 18
Other reserves (6) (0) (3)
Retained earnings 269 269 211
Result for the period (14) (19) 59
Shareholders' equity 1,487 1,488 1,503
Non-controlling interests 6 5 5
Net equity 1,492 1,493 1,509
Senior Bank Facility(1)
792 790 987
Senior Secured Notes(1)
2,144 2,171 1,905
Senior Subordinated Notes(1)
452 457 455
Other(1)
2 2 3
Long- term debt 3,390 3,420 3,349
Deferred income tax liabilities 20 17 15
Derivative financial instruments 32 13 16
Other non-current liabilities 8 8 8
Deferred income 0 0 0
Provisions for other liabilities and charges 39 45 49
Government deferred grants 0 0 0
Non-current liabilities 3,490 3,504 3,437
Trade and other payables 297 294 338
Short-term debt with banks(1)
1 2 40
Interest payable 73 50 42
Short-term debt 74 52 82
Derivative financial instruments - - 2
Other current liabilities 4 4 3
Deferred income 43 45 46
Provisions for other liabilities and charges 1 3 5
Current liabilities 420 397 476
TOTAL LIABILITIES AND NET EQUITY 5,402 5,394 5,422
(1)
The difference between these amounts and notional amounts correspond to the discount effect
Data in EUR million, unless otherwise stated 3Q 2013 Results Report
DISCLAIMER: Please see important disclaimer in section 8 of this document
ONO – Third quarter 2013 results (unaudited) - 26
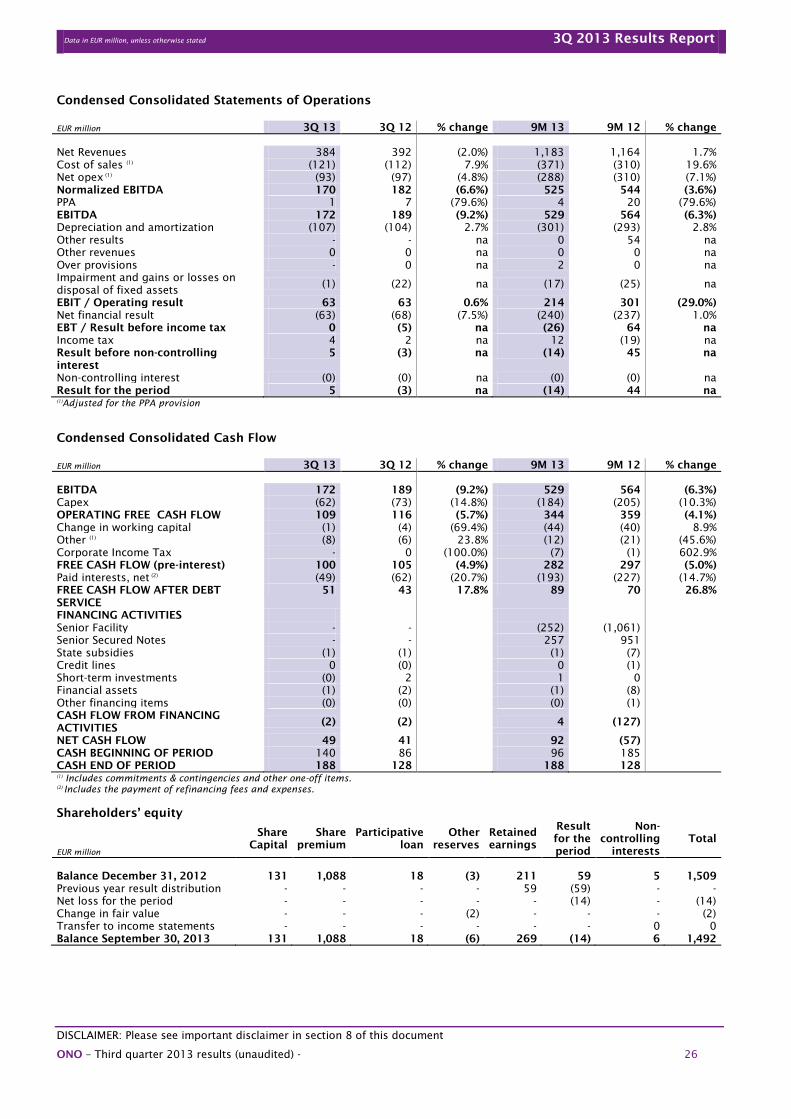
Condensed Consolidated Statements of Operations
EUR million 3Q 13 3Q 12 % change 9M 13 9M 12 % change
Net Revenues 384 392 (2.0%) 1,183 1,164 1.7%
Cost of sales (1)
(121) (112) 7.9% (371) (310) 19.6%
Net opex (1)
(93) (97) (4.8%) (288) (310) (7.1%)
Normalized EBITDA 170 182 (6.6%) 525 544 (3.6%)
PPA 1 7 (79.6%) 4 20 (79.6%)
EBITDA 172 189 (9.2%) 529 564 (6.3%)
Depreciation and amortization (107) (104) 2.7% (301) (293) 2.8%
Other results - - na 0 54 na
Other revenues 0 0 na 0 0 na
Over provisions - 0 na 2 0 na
Impairment and gains or losses on
disposal of fixed assets (1) (22) na (17) (25) na
EBIT / Operating result 63 63 0.6% 214 301 (29.0%)
Net financial result (63) (68) (7.5%) (240) (237) 1.0%
EBT / Result before income tax 0 (5) na (26) 64 na
Income tax 4 2 na 12 (19) na
Result before non-controlling
interest
5 (3) na (14) 45 na
Non-controlling interest (0) (0) na (0) (0) na
Result for the period 5 (3) na (14) 44 na
(1)
Adjusted for the PPA provision
Condensed Consolidated Cash Flow
EUR million 3Q 13 3Q 12 % change 9M 13 9M 12 % change
EBITDA 172 189 (9.2%) 529 564 (6.3%)
Capex (62) (73) (14.8%) (184) (205) (10.3%)
OPERATING FREE CASH FLOW 109 116 (5.7%) 344 359 (4.1%)
Change in working capital (1) (4) (69.4%) (44) (40) 8.9%
Other (1)
(8) (6) 23.8% (12) (21) (45.6%)
Corporate Income Tax - 0 (100.0%) (7) (1) 602.9%
FREE CASH FLOW (pre-interest) 100 105 (4.9%) 282 297 (5.0%)
Paid interests, net (2)
(49) (62) (20.7%) (193) (227) (14.7%)
FREE CASH FLOW AFTER DEBT
SERVICE
51 43 17.8% 89 70 26.8%
FINANCING ACTIVITIES
Senior Facility - - (252) (1,061)
Senior Secured Notes - - 257 951
State subsidies (1) (1) (1) (7)
Credit lines 0 (0) 0 (1)
Short-term investments (0) 2 1 0
Financial assets (1) (2) (1) (8)
Other financing items (0) (0) (0) (1)
CASH FLOW FROM FINANCING
ACTIVITIES (2) (2) 4 (127)
NET CASH FLOW 49 41 92 (57)
CASH BEGINNING OF PERIOD 140 86 96 185
CASH END OF PERIOD 188 128 188 128
(1)
Includes commitments & contingencies and other one-off items.
(2)
Includes the payment of refinancing fees and expenses.
Shareholders’ equity
EUR million
Share
Capital
Share
premium
Participative
loan
Other
reserves
Retained
earnings
Result
for the
period
Non-
controlling
interests
Total
Balance December 31, 2012 131 1,088 18 (3) 211 59 5 1,509
Previous year result distribution - - - - 59 (59) - -
Net loss for the period - - - - - (14) - (14)
Change in fair value - - - (2) - - - (2)
Transfer to income statements - - - - - - 0 0
Balance September 30, 2013 131 1,088 18 (6) 269 (14) 6 1,492
Data in EUR million, unless otherwise stated 3Q 2013 Results Report
DISCLAIMER: Please see important disclaimer in section 8 of this document
ONO – Third quarter 2013 results (unaudited) - 27
5. CABLEUROPA
5.1. Condensed Consolidated Financial Statements
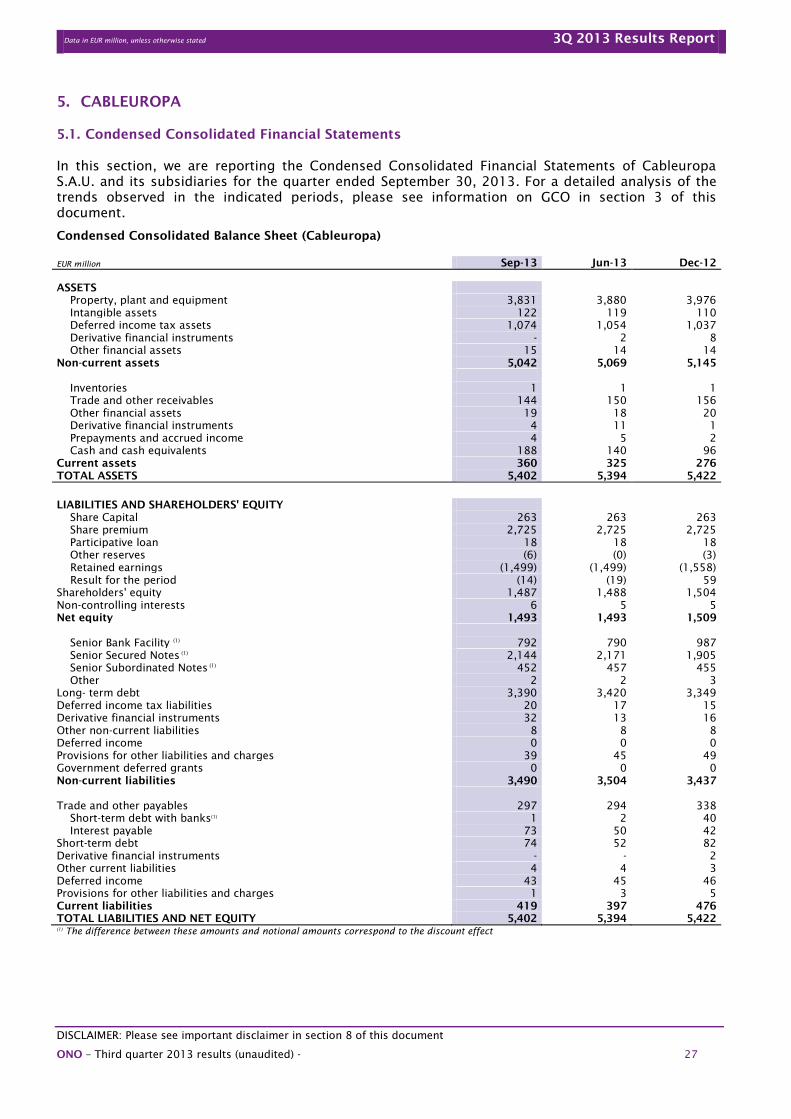
In this section, we are reporting the Condensed Consolidated Financial Statements of Cableuropa
S.A.U. and its subsidiaries for the quarter ended September 30, 2013. For a detailed analysis of the
trends observed in the indicated periods, please see information on GCO in section 3 of this
document.
Condensed Consolidated Balance Sheet (Cableuropa)
EUR million Sep-13 Jun-13 Dec-12
ASSETS
Property, plant and equipment 3,831 3,880 3,976
Intangible assets 122 119 110
Deferred income tax assets 1,074 1,054 1,037
Derivative financial instruments - 2 8
Other financial assets 15 14 14
Non-current assets 5,042 5,069 5,145
Inventories 1 1 1
Trade and other receivables 144 150 156
Other financial assets 19 18 20
Derivative financial instruments 4 11 1
Prepayments and accrued income 4 5 2
Cash and cash equivalents 188 140 96
Current assets 360 325 276
TOTAL ASSETS 5,402 5,394 5,422
LIABILITIES AND SHAREHOLDERS' EQUITY
Share Capital 263 263 263
Share premium 2,725 2,725 2,725
Participative loan 18 18 18
Other reserves (6) (0) (3)
Retained earnings (1,499) (1,499) (1,558)
Result for the period (14) (19) 59
Shareholders' equity 1,487 1,488 1,504
Non-controlling interests 6 5 5
Net equity 1,493 1,493 1,509
Senior Bank Facility (1)
792 790 987
Senior Secured Notes (1)
2,144 2,171 1,905
Senior Subordinated Notes (1)
452 457 455
Other 2 2 3
Long- term debt 3,390 3,420 3,349
Deferred income tax liabilities 20 17 15
Derivative financial instruments 32 13 16
Other non-current liabilities 8 8 8
Deferred income 0 0 0
Provisions for other liabilities and charges 39 45 49
Government deferred grants 0 0 0
Non-current liabilities 3,490 3,504 3,437
Trade and other payables 297 294 338
Short-term debt with banks(1)
1 2 40
Interest payable 73 50 42
Short-term debt 74 52 82
Derivative financial instruments - - 2
Other current liabilities 4 4 3
Deferred income 43 45 46
Provisions for other liabilities and charges 1 3 5
Current liabilities 419 397 476
TOTAL LIABILITIES AND NET EQUITY 5,402 5,394 5,422
(1)
The difference between these amounts and notional amounts correspond to the discount effect

Data in EUR million, unless otherwise stated 3Q 2013 Results Report
DISCLAIMER: Please see important disclaimer in section 8 of this document
ONO – Third quarter 2013 results (unaudited) - 28
Condensed Consolidated Statements of Operations
EUR million 3Q 13 3Q 12 % change 9M 13 9M 12 % change
Net Revenues 384 392 (2.0%) 1,183 1,164 1.7%
Cost of sales (1)
(121) (112) 7.9% (371) (310) 19.6%
Net opex (1)
(93) (97) (4.8%) (288) (310) (7.1%)
Normalized EBITDA 170 182 (6.6%) 525 544 (3.6%)
PPA 1 7 (79.6%) 4 20 (79.6%)
EBITDA 172 189 (9.2%) 529 564 (6.3%)
Depreciation and amortization (107) (104) 2.7% (301) (293) 2.8%
Other results - - na 0 54 na
Other revenues 0 0 na 0 0 na
Over provisions - 0 na 2 0 na
Impairment and gains or losses on
disposal of fixed assets (1) (22) na (17) (25) na
EBIT / Operating result 63 63 0.6% 214 301 (29.0%)
Net financial result (63) (68) (7.5%) (240) (237) 1.0%
EBT / Result before income tax 0 (5) na (26) 64 na
Income tax 4 2 na 12 (19) na
Result before non-controlling
interest
5 (3) na (14) 45 na
Non-controlling interest (0) (0) na (0) (0) na
Result for the period 5 (3) na (14) 44 na
(1)
Adjusted for the PPA provision
Condensed Consolidated Cash Flow
EUR million 3Q 13 3Q 12 % change 9M 13 9M 12 % change
EBITDA 172 189 (9.2%) 529 564 (6.3%)
Capex (62) (73) (14.8%) (184) (205) (10.3%)
OPERATING FREE CASH FLOW 109 116 (5.7%) 344 359 (4.1%)
Change in working capital (1) (4) (69.4%) (44) (40) 8.9%
Other (1)
(8) (6) 23.8% (12) (21) (45.6%)
Corporate Income Tax - 0 (100.0%) (7) (1) 602.9%
FREE CASH FLOW (pre-interest) 100 105 (4.9%) 282 297 (5.0%)
Paid interests, net (2)
(49) (62) (20.7%) (193) (227) (14.7%)
FREE CASH FLOW AFTER DEBT
SERVICE 51 43 17.8% 89 70 26.8%
FINANCING ACTIVITIES
Senior facility - - (252) (1,061)
Senior Secured Notes - - 257 951
State subsidies (1) (1) (1) (7)
Credit lines 0 (0) 0 (1)
Short-term investments (0) 2 1 0
Financial assets (1) (2) (1) (8)
Other financing items (0) (0) (0) (1)
CASH FLOW FROM FINANCING
ACTIVITIES
(2) (2) 4 (127)
NET CASH FLOW 49 41 92 (57)
CASH BEGINNING OF PERIOD 140 86 96 185
CASH END OF PERIOD 188 128 188 128
(1)
Includes commitments & contingencies and other one-off items.
(2)
Includes the payment of refinancing fees and expenses.
Shareholders’ equity
EUR million
Share
Capital
Share
premium
Participative
loan
Other
reserves
Retained
earnings
Result
for the
period
Non-
controlling
interests
Total
Balance December 31, 2012 263 2,725 18 (3) (1,558) 59 5 1,509
Previous year result distribution - - - - 59 (59) - -
Net loss for the period - - - - - (14) - (14)
Change in fair value - - - (2) - - - (2)
Transfer to income statements - - - - - - 0 0
Balance September 30, 2013 263 2,725 18 (6) (1,499) (14) 6 1,493

Data in EUR million, unless otherwise stated 3Q 2013 Results Report
DISCLAIMER: Please see important disclaimer in section 8 of this document
ONO – Third quarter 2013 results (unaudited) - 29
5.2. Debt and liquidity
Debt and liquidity
As of 30 sep 2013. EUR million
Maximum
available
Short-term
debt
Long-term
debt
Total debt Availability
Debt with credit entities:
Senior Facility 924 - 824 824 100
Senior Secured Notes 2,230 - 2,230 2,230 -
Other credit facilities 3 1 0 1 3
Total debt with credit entities 3,157 1 3,054 3,055 103
Other debt:
Senior Subordinated Notes 462 - 462 462 -
State subsidies and other 3 0 2 3 -
Total other debt 464 0 464 464 -
Total debt 3,622 1 3,518 3,519 103
Cash and cash equivalents 188 188
Total net debt 3,331 291
EBITDA LTM 716
Total net debt/EBITDA LTM 4.65x
Note: The difference between these amounts and notional amounts correspond to the discount effect
Debt by maturity (amounts drawn)
EUR million 2013 2014 2015 2016 2017 2018 2019 ≥2020 Total
Debt with credit entities:
Term Loan A (“TLA”) - - - 238 401 - - - 639
Term Loan B (“TLB”) - - - - - 185 - - 185
Revolving Credit Facility (“RCF”)(1)
- - - - - - - - -
Tranche SPV 1 - - - - - 700 - - 700
Tranche SPV 2 - - - - - 300 - - 300
Tranche SPV 3 - - - - - 741 - - 741
Tranche SPV 4 - - - - - 230 - - 230
Tranche SPV 5 - - - - - - - 260 260
Total Senior Facility - - - 238 401 2,155 - 260 3,054
Senior Subordinated Notes - - - - - - 462 - 462
Other credit facilities 0 1 0 0 0 0 0 1 3
Total gross debt 0 1 0 239 401 2,155 462 261 3,519
(1)
€100 million of RCF available but not drawn.
Note: The difference between these amounts and the book value of the debt instrument corresponds to the capitalized costs of their issue.
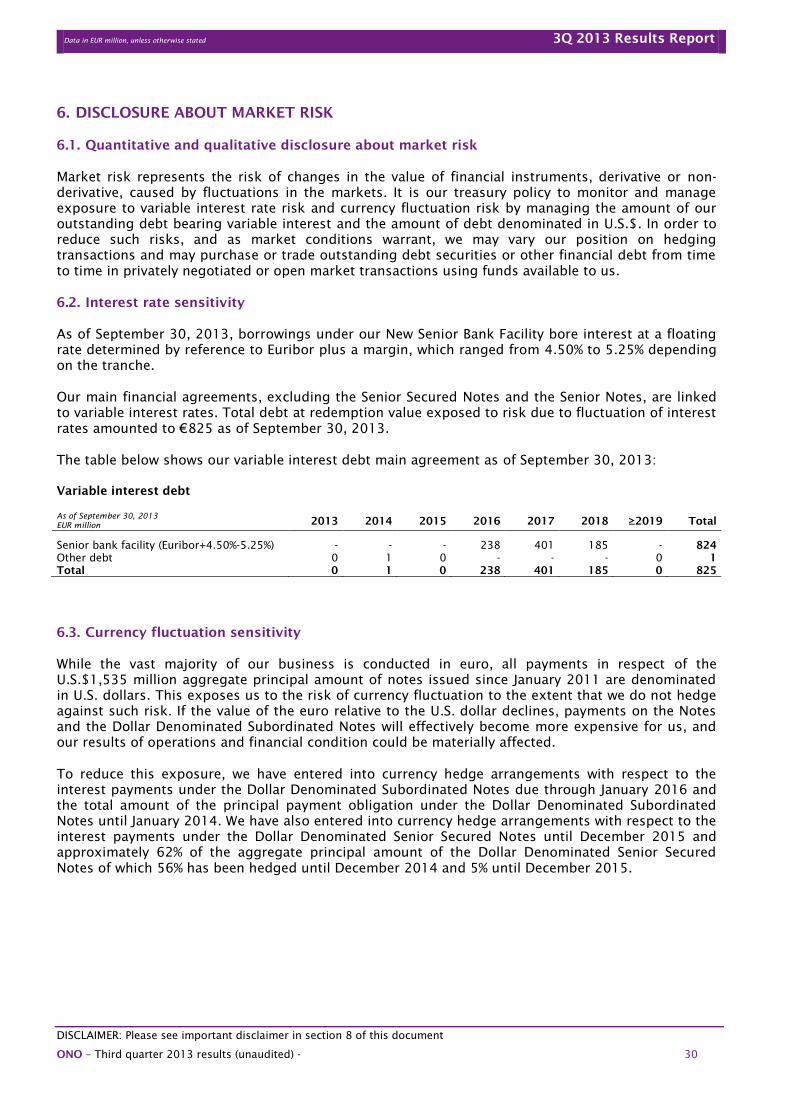
Data in EUR million, unless otherwise stated 3Q 2013 Results Report
DISCLAIMER: Please see important disclaimer in section 8 of this document
ONO – Third quarter 2013 results (unaudited) - 30
6. DISCLOSURE ABOUT MARKET RISK
6.1. Quantitative and qualitative disclosure about market risk
Market risk represents the risk of changes in the value of financial instruments, derivative or non-
derivative, caused by fluctuations in the markets. It is our treasury policy to monitor and manage
exposure to variable interest rate risk and currency fluctuation risk by managing the amount of our
outstanding debt bearing variable interest and the amount of debt denominated in U.S.$. In order to
reduce such risks, and as market conditions warrant, we may vary our position on hedging
transactions and may purchase or trade outstanding debt securities or other financial debt from time
to time in privately negotiated or open market transactions using funds available to us.
6.2. Interest rate sensitivity
As of September 30, 2013, borrowings under our New Senior Bank Facility bore interest at a floating
rate determined by reference to Euribor plus a margin, which ranged from 4.50% to 5.25% depending
on the tranche.
Our main financial agreements, excluding the Senior Secured Notes and the Senior Notes, are linked
to variable interest rates. Total debt at redemption value exposed to risk due to fluctuation of interest
rates amounted to €825 as of September 30, 2013.
The table below shows our variable interest debt main agreement as of September 30, 2013:
Variable interest debt
As of September 30, 2013
EUR million 2013 2014 2015 2016 2017 2018 ≥2019 Total
Senior bank facility (Euribor+4.50%-5.25%) - - - 238 401 185 - 824
Other debt 0 1 0 - - - 0 1
Total 0 1 0 238 401 185 0 825
6.3. Currency fluctuation sensitivity
While the vast majority of our business is conducted in euro, all payments in respect of the
U.S.$1,535 million aggregate principal amount of notes issued since January 2011 are denominated
in U.S. dollars. This exposes us to the risk of currency fluctuation to the extent that we do not hedge
against such risk. If the value of the euro relative to the U.S. dollar declines, payments on the Notes
and the Dollar Denominated Subordinated Notes will effectively become more expensive for us, and
our results of operations and financial condition could be materially affected.
To reduce this exposure, we have entered into currency hedge arrangements with respect to the
interest payments under the Dollar Denominated Subordinated Notes due through January 2016 and
the total amount of the principal payment obligation under the Dollar Denominated Subordinated
Notes until January 2014. We have also entered into currency hedge arrangements with respect to the
interest payments under the Dollar Denominated Senior Secured Notes until December 2015 and
approximately 62% of the aggregate principal amount of the Dollar Denominated Senior Secured
Notes of which 56% has been hedged until December 2014 and 5% until December 2015.
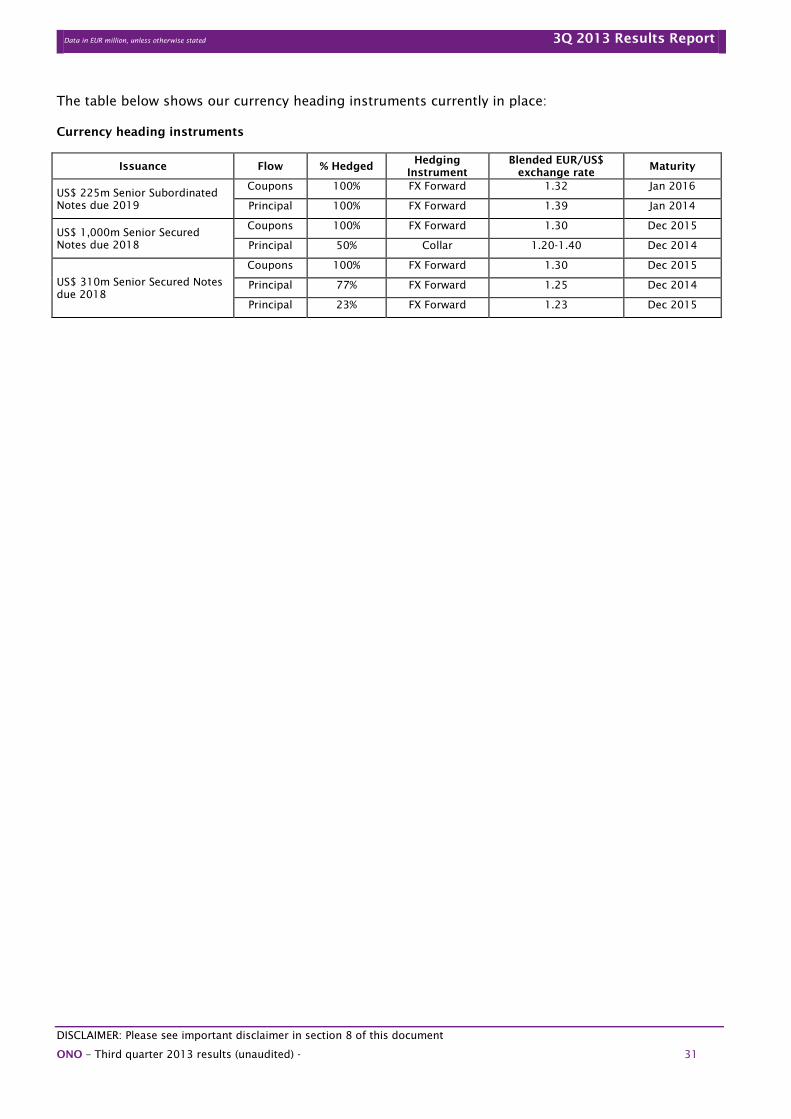
Data in EUR million, unless otherwise stated 3Q 2013 Results Report
DISCLAIMER: Please see important disclaimer in section 8 of this document
ONO – Third quarter 2013 results (unaudited) - 31
The table below shows our currency heading instruments currently in place:
Currency heading instruments
Issuance Flow % Hedged Hedging
Instrument
Blended EUR/US$
exchange rate Maturity
US$ 225m Senior Subordinated
Notes due 2019
Coupons 100% FX Forward 1.32 Jan 2016
Principal 100% FX Forward 1.39 Jan 2014
US$ 1,000m Senior Secured
Notes due 2018
Coupons 100% FX Forward 1.30 Dec 2015
Principal 50% Collar 1.20-1.40 Dec 2014
US$ 310m Senior Secured Notes
due 2018
Coupons 100% FX Forward 1.30 Dec 2015
Principal 77% FX Forward 1.25 Dec 2014
Principal 23% FX Forward 1.23 Dec 2015
Data in EUR million, unless otherwise stated 3Q 2013 Results Report
DISCLAIMER: Please see important disclaimer in section 8 of this document
ONO – Third quarter 2013 results (unaudited) - 32
7. GLOSSARY
In this Report, the following defined terms have the meanings indicated below:
7.1. Operational Definitions
“ADSL” means Asymmetric Digital Subscriber Line, a data communications technology that enables
faster data transmission over copper telephone lines than a conventional voiceband modem can
provide by utilizing frequencies not used by a voice telephone call.
“ARPU” means monthly average revenue per user, and is calculated by dividing total revenues
generated from our Internet, fiber television and telephony services provided to customers that are
directly connected to our network in the last quarter of the relevant period by the average number of
customers in that quarter, the result of which is divided by three. The average number of customers
for any period is calculated by adding the number of customers at the beginning of the period to the
number of customers at the end of the period and dividing by two.
“Homes released to marketing” or “HRTM” means homes to which we can provide broadband Internet,
fiber television and telephony services within an average of four days, which occurs after the
customer tap and drop have been installed.
“Net churn” means the percentage obtained by dividing the number of customers (without the
customers moving from one ONO home to another ONO home) who cease to receive any of our
services (either voluntarily or involuntarily) in the last quarter of the relevant period by the average
total number of customers during that quarter, multiplied by four. The average number of customers
for any period is calculated by adding the number of customers at the beginning of the period to the
number of customers at the end of the period and dividing by two.
“Penetration“ is the percentage of customers over homes released to marketing in our areas of
operation, and with respect to any particular service, penetration is the percentage of RGUs of that
service over homes released to marketing in our areas of operation.
7.2. Financial Definitions
“EBITDA” represents earnings before interests, taxes, depreciation and amortization, extraordinary,
restructuring and other non-cash items and minority interests.
“EBITDA LTM” is the aggregate amount of EBITDA for the last four consecutive calendar quarters.
“EBITDA margin” is calculated by dividing EBITDA for a particular period by the total revenues for that
period.
“Normalized EBITDA” is EBITDA adjusted for the PPA provision.
“PPA” is a non-cash adjustment that relates to the release of onerous contract provisions which arose
on the acquisition of Auna. In 2005, the realizable value of the Auna net assets acquired exceeded
the acquisition price. In writing down the value of book assets acquired in line with the acquisition
price, a provision was recorded on the balance sheet. This amount was assigned to the network
maintenance and rental contracts acquired with Auna as these contracts were deemed to be stuck at
a higher value than market.
“Opex (Operating Expenses)” are comprised of cost of service, staff cost, other operating expense,
costs capitalized as property and equipment, depreciation and amortization, and impairments.
“Capex (Capital Expenditures)” refer to purchases of tangible and intangible assets, consisting
principally of set-top box purchases and other customer capital expenditure, installations, network
Data in EUR million, unless otherwise stated 3Q 2013 Results Report
DISCLAIMER: Please see important disclaimer in section 8 of this document
ONO – Third quarter 2013 results (unaudited) - 33
build-out, upgrades, maintenance and other investments, computer hardware and software and
content rights.
“Operating free cash flow” means EBITDA less capital expenditure.
“Free cash flow after debt service” means EBITDA, less capital expenditures, changes in working
capital, disbursements and net cash interest expense paid.
“Shareholder’s contributions” represent subordinated loans from GCO to Cableuropa in the form of
Participative loans. For the purpose of capitalization calculations under Spanish corporate law,
Participative loans are treated as shareholders’ equity.
“Total debt” is short-term and long-term debt. Total debt does not include subordinated participative
loans granted by GCO or accrued interest expenses.
“Net debt” means total debt less cash and cash equivalents.
7.3. Total Homes and Businesses Data
Total homes for each of our franchise areas are derived from the 2011 Spanish national census
published by the National Statistics Institute of Spain (Instituto Nacional de Estadística or "INE"). Total
businesses for each of our franchise areas are derived from the 2012 businesses central directory,
which is also published by INE. Although we accept responsibility for the accurate extraction of such
data, we accept no further responsibility with respect to such data.
Data in EUR million, unless otherwise stated 3Q 2013 Results Report
DISCLAIMER: Please see important disclaimer in section 8 of this document
ONO – Third quarter 2013 results (unaudited) - 34
8. DISCLAIMER
The financial and other information in this release contains forward-looking statements (all
statements other than those made solely with respect to historical facts) based upon management's
beliefs and data currently available to management. These forward-looking statements are based on a
variety of assumptions that may not be realized and are subject to significant business, economic,
legal and competitive risks and uncertainties, including those set forth below, many of which are
beyond ONO’s (“the Company”) control. The Company's actual operations, financial condition, cash
flows and operating results may differ materially from those expressed or implied by any such
forward-looking statements and the Company undertakes no obligation to update or revise any such
forward-looking statements.
Parts of the financial and other information contained in this release are based on certain estimates
with respect to the Company's liquidity, capital resources, results of operations and projections for
future periods that are subject to a number of risks and uncertainties including, but not limited to,
the following: the ability of the Company to continue as a going concern; the ability of the Company
and its subsidiaries to fulfill their obligations under, service and operate pursuant to the terms of,
their existing credit facilities and arrangements; the state of the Spanish and global economy and its
impact on the Company’s business; the ability to fund, develop and execute the Company's business
plan; competitive pressures from other companies in the same or similar lines of business as the
Company; trends in the economy as a whole which may affect subscriber confidence and demand for
the goods and services supplied by the Company; the ability of the Company to predict consumer
demand as a whole, as well as demand for specific goods and services; the acceptance and continued
use by subscribers and potential subscribers of the Company's services; changes in technology and
competition; the Company's ability to achieve expected operational efficiencies and economies of
scale and its ability to generate expected cash flow, revenue and achieve assumed margins; the
ability of the Company to attract, retain and compensate key executives and other personnel; the
Company’s ability to successfully integrate acquired businesses; the ability of the Company to
maintain existing arrangements and/or enter into new arrangements with third party providers and
contract partners; changes in applicable law, regulations or interpretation thereof; continued
presence of a fair, competitive market; potential adverse publicity; as well as other factors detailed
from time to time in the Company's public reports. Given these and other uncertainties, readers are
cautioned not to place undue reliance on the forward-looking statements contained in this release.
The financial information contained in this document has been prepared under IFRS.
FURTHER INFORMATION
Investor Relations
E-mail: [email protected]
Website: www.ono.es/sobreono/ – Investor Relations