Embed Size (px)
Citation preview
TSX, NYSE MKT: LSG
Lake Shore Gold TSX: LSG
NYSE MKT: LSG
1
L A K E S H O R E G O L D C O R P.
Marketing Presentation
August 2015
2
Information included in this presentation relating to the Company's expected production levels, production growth, costs, cash flows, economic returns, exploration
activities, potential for increasing resources, project expenditures and business plans are "forward-looking statements" or "forward-looking information" within the meaning
of certain securities laws, including under the provisions of Canadian provincial securities laws and under the United States Private Securities Litigation Reform Act of
1995 and are referred to herein as "forward-looking statements." The Company does not intend, and does not assume any obligation, to update these forward-looking
statements. These forward-looking statements represent management's best judgment based on current facts and assumptions that management considers reasonable,
including that operating and capital plans will not be disrupted by issues such as mechanical failure, unavailability of parts, labour disturbances, interruption in
transportation or utilities, or adverse weather conditions, that there are no material unanticipated variations in budgeted costs, that contractors will complete projects
according to schedule, and that actual mineralization on properties will be consistent with models and will not be less than identified mineral reserves. The Company
makes no representation that reasonable business people in possession of the same information would reach the same conclusions. Forward-looking statements involve
known and unknown risks, uncertainties and other factors which may cause the actual results, performance or achievements of the Company to be materially different
from any future results, performance or achievements expressed or implied by the forward-looking statements. In particular, delays in development or mining and
fluctuations in the price of gold or in currency markets could prevent the Company from achieving its targets. Readers should not place undue reliance on forward-looking
statements. More information about risks and uncertainties affecting the Company and its business is available in the Company's most recent Annual Information Form
and other regulatory filings with the Canadian Securities Administrators, which are posted on sedar at www.sedar.com, or the Company’s most recent Annual Report on
Form 40-F and other regulatory filings with the Securities and Exchange Commission.
QUALITY CONTROL
Lake Shore Gold has a quality control program to ensure best practices in the sampling and analysis of drill core. A total of three Quality Control samples consisting of 1
blank, 1 certified standard and 1 reject duplicate are inserted into groups of 20 drill core samples. The blanks and the certified standards are checked to be within
acceptable limits prior to being accepted into the GEMS SQL database. Routine assays have been completed using a standard fire assay with a 30-gram aliquot. For
samples that return a value greater than three grams per tonne gold on exploration projects and greater than 10 gpt at the Timmins mine and Thunder Creek underground
project, the remaining pulp is taken and fire assayed with a gravimetric finish. Select zones with visible gold are typically tested by pulp metallic analysis on some projects.
NQ size drill core is saw cut and half the drill core is sampled in standard intervals. The remaining half of the core is stored in a secure location. The drill core is
transported in security-sealed bags for preparation at ALS Chemex Prep Lab located in Timmins, Ontario, and the pulps shipped to ALS Chemex Assay Laboratory in
Vancouver, B.C. ALS Chemex is an ISO 9001-2000 registered laboratory preparing for ISO 17025 certification.
QUALIFIED PERSON
Scientific and technical information related to mine production and reserves contained in this presentation has been reviewed and approved by Natasha Vaz, P.Eng., Vice-
President, Technical Services, who is an employee of Lake Shore Gold Corp., and a “qualified person” as defined by National Instrument 43-101 – Standards of
Disclosure for Mineral Projects (“NI 43-101”).
Scientific and technical information related to resources, drilling and all matters involving mine production geology, as well as exploration drilling, contained in this
presentation, or source material for this presentation, was reviewed and approved by Eric Kallio, P.Geo., Senior Vice-President, Exploration. Mr. Kallio is an employee of
Lake Shore Gold Corp., and is a “qualified person” as defined by NI 43-101.
Forward-Looking Statements
3
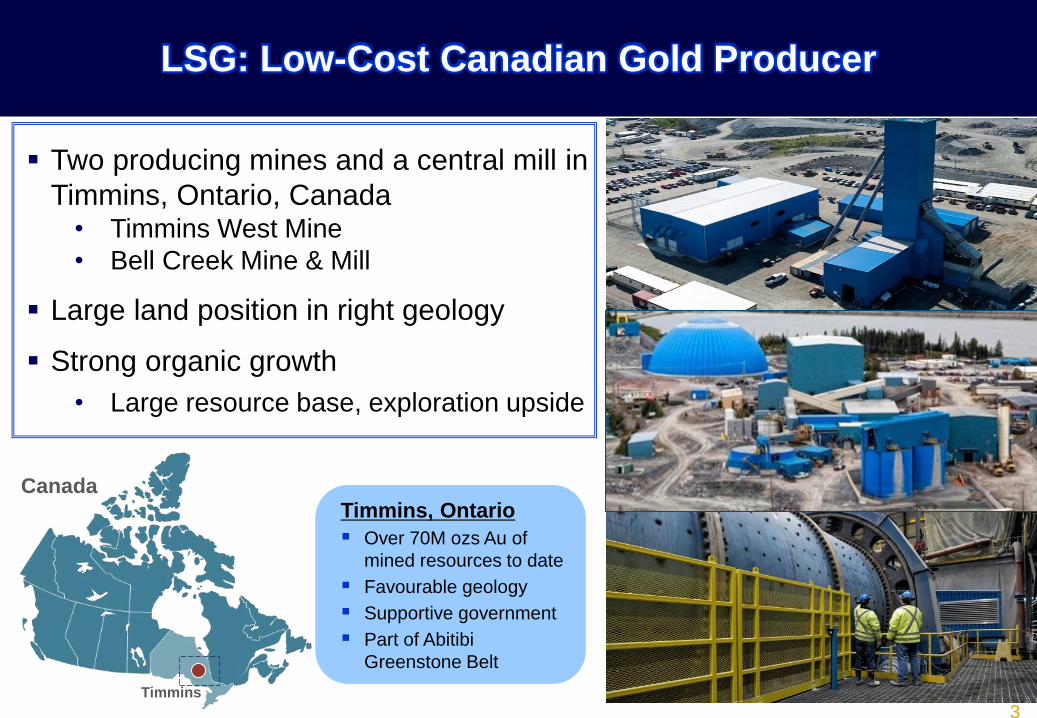
Two producing mines and a central mill in
Timmins, Ontario, Canada • Timmins West Mine
• Bell Creek Mine & Mill
Large land position in right geology
Strong organic growth
• Large resource base, exploration upside
LSG: Low-Cost Canadian Gold Producer
Timmins, Ontario
Over 70M ozs Au of
mined resources to date
Favourable geology
Supportive government
Part of Abitibi
Greenstone Belt
Timmins
Canada
4
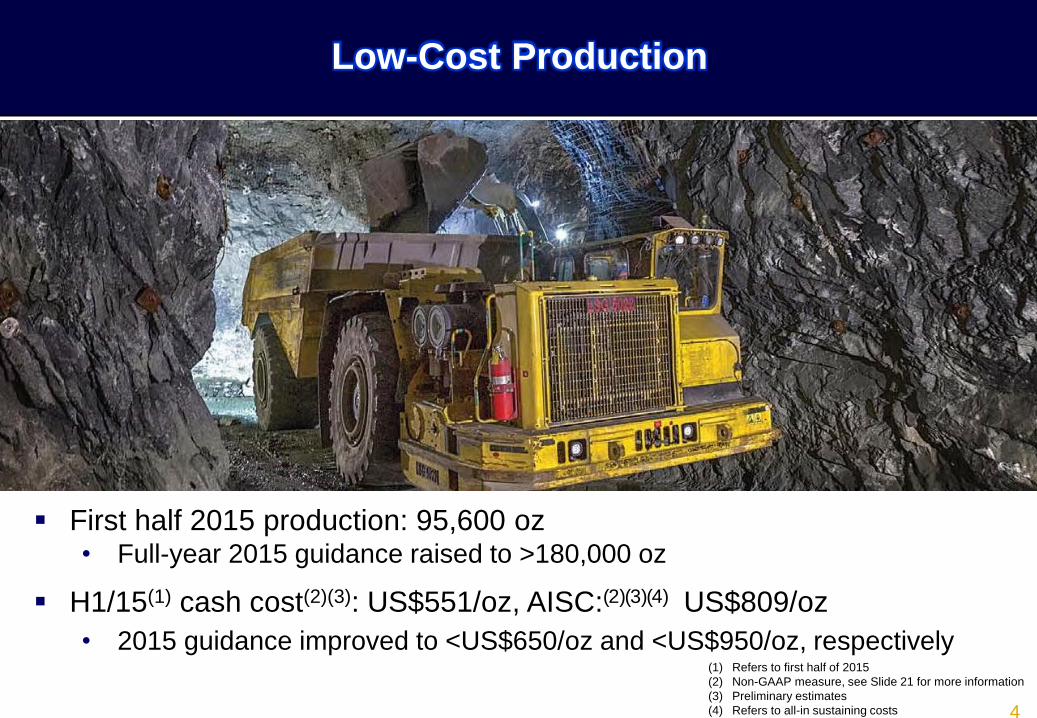
Low-Cost Production
First half 2015 production: 95,600 oz • Full-year 2015 guidance raised to >180,000 oz
H1/15(1) cash cost(2)(3): US$551/oz, AISC:(2)(3)(4) US$809/oz
• 2015 guidance improved to <US$650/oz and <US$950/oz, respectively
(1) Refers to first half of 2015
(2) Non-GAAP measure, see Slide 21 for more information
(3) Preliminary estimates
(4) Refers to all-in sustaining costs
5
Cash and Cash Flow
50-Tonne Truck at
Timmins West Mine
Cash(1) increased @ $22.0M YTD in 2015 – currently $84M
Business generated $52M of cash in 2014
• Cash increased $27M ($45M of debt repayments, $20M of financings)
Operating cash flows(2) in 2014: $111.3M, $62.3M in H1/15
(1) Refers to cash and bullion
(2) Refers to cash flows from continuing operating activities
6
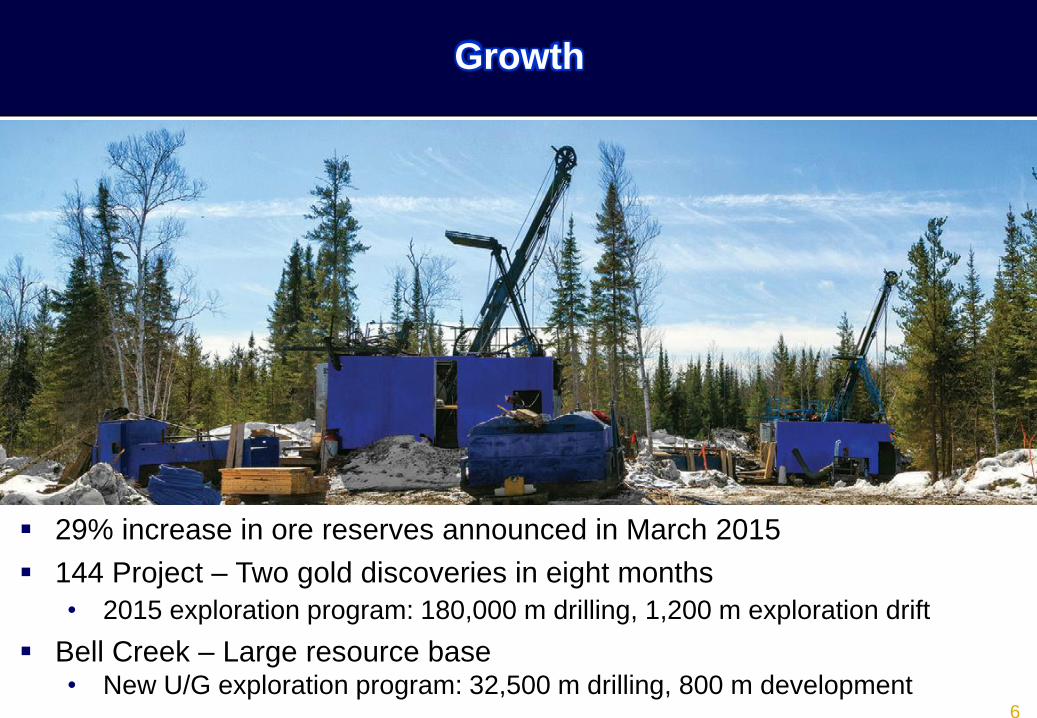
Growth
29% increase in ore reserves announced in March 2015
144 Project – Two gold discoveries in eight months
• 2015 exploration program: 180,000 m drilling, 1,200 m exploration drift
Bell Creek – Large resource base • New U/G exploration program: 32,500 m drilling, 800 m development
7
Dome
Hollinger
McIntyre
Hoyle
Pond Porcupine
Destor
Fault Pamour
City of Timmins
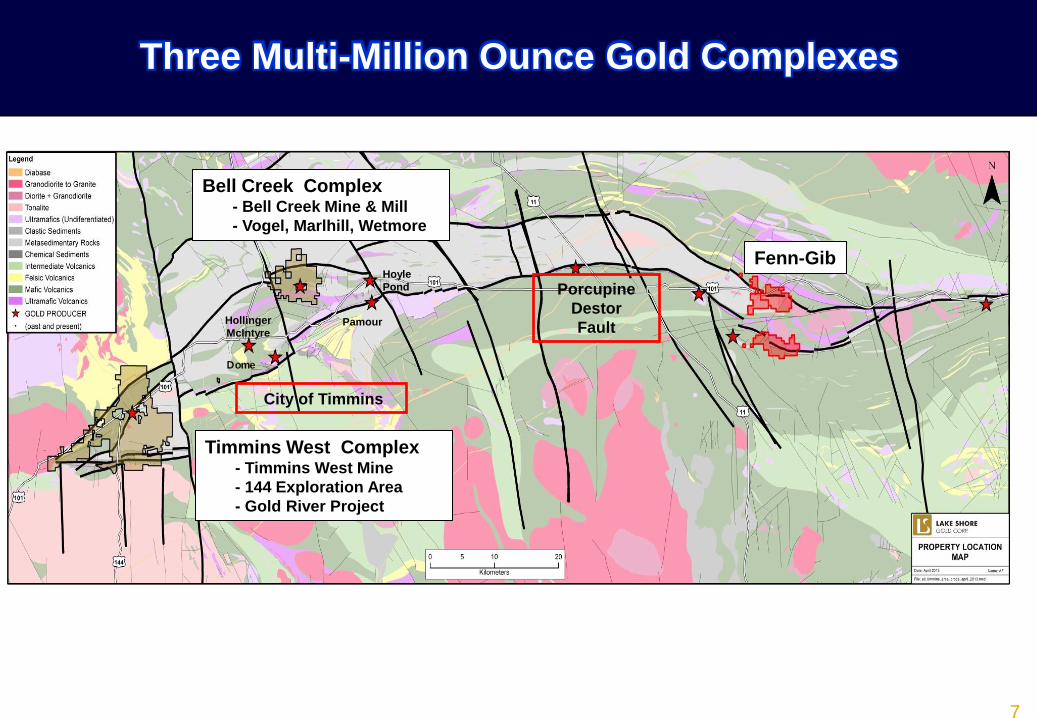
Timmins West Complex - Timmins West Mine
- 144 Exploration Area
- Gold River Project
Favourable Land Positions in Timmins Gold Camp
Bell Creek Complex - Bell Creek Mine & Mill
- Vogel, Marlhill, Wetmore
Fenn-Gib
Three Multi-Million Ounce Gold Complexes
8
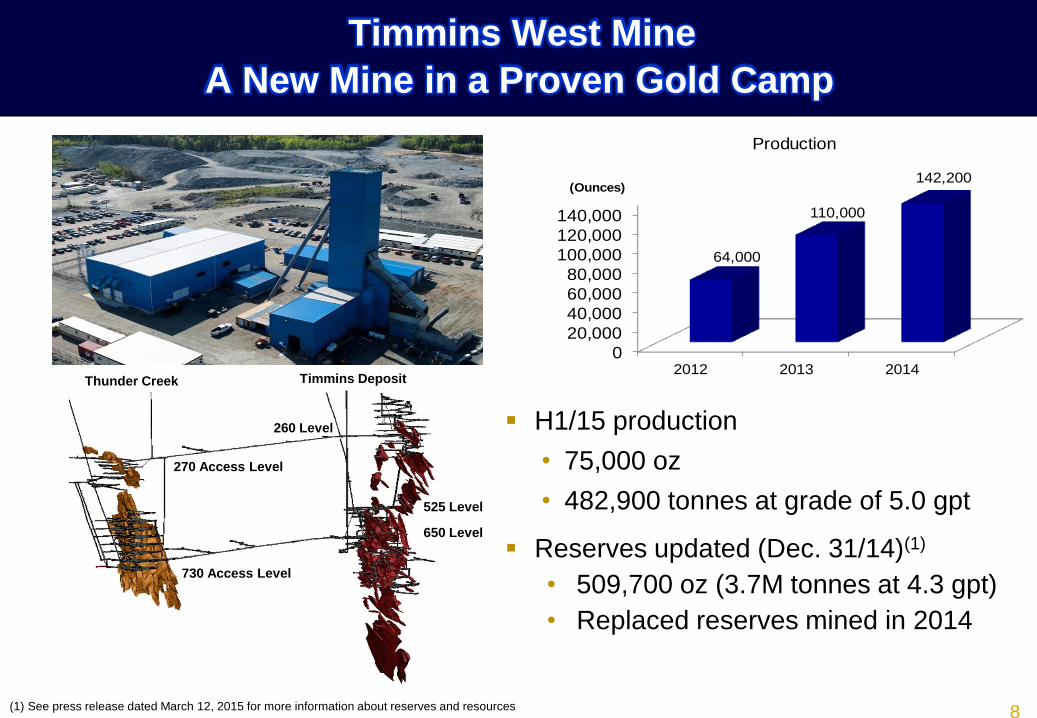
Timmins West Mine
A New Mine in a Proven Gold Camp
H1/15 production
• 75,000 oz
• 482,900 tonnes at grade of 5.0 gpt
Reserves updated (Dec. 31/14)(1)
• 509,700 oz (3.7M tonnes at 4.3 gpt)
• Replaced reserves mined in 2014
(1) See press release dated March 12, 2015 for more information about reserves and resources
0
20,000
40,000
60,000
80,000
100,000
120,000
140,000
2012 2013 2014
64,000
110,000
142,200(Ounces)
Production
Timmins Deposit Thunder Creek
270 Access Level
730 Access Level
260 Level
525 Level
650 Level
9
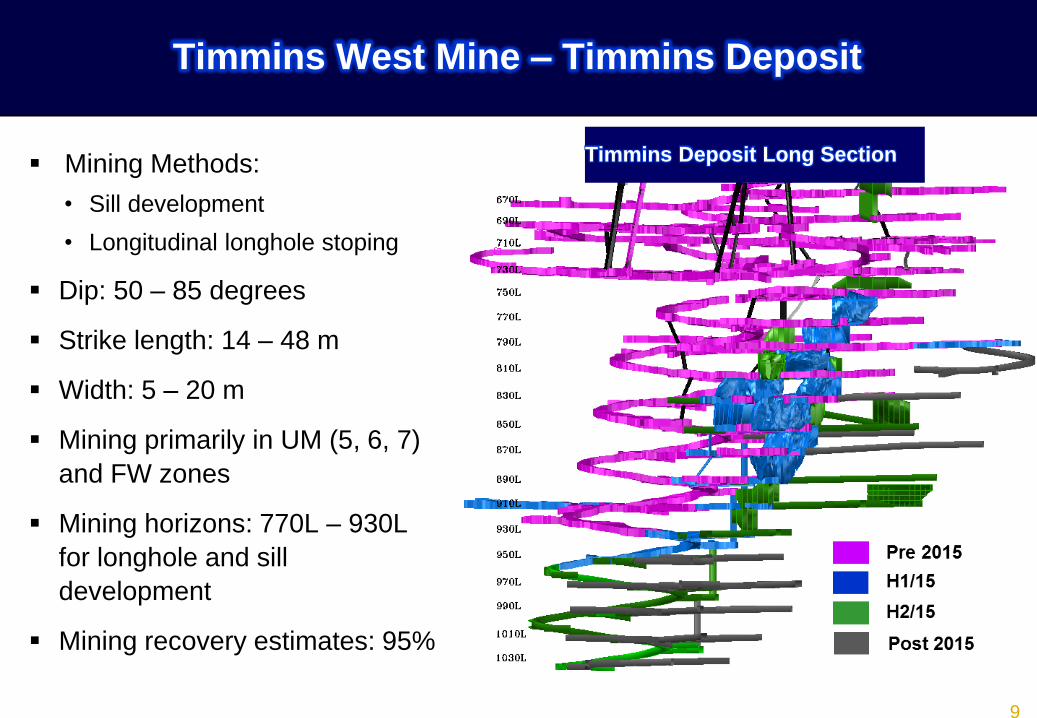
Mining Methods:
• Sill development
• Longitudinal longhole stoping
Dip: 50 – 85 degrees
Strike length: 14 – 48 m
Width: 5 – 20 m
Mining primarily in UM (5, 6, 7)
and FW zones
Mining horizons: 770L – 930L
for longhole and sill
development
Mining recovery estimates: 95%
Timmins West Mine – Timmins Deposit
Timmins Deposit Long Section
10
Highlights of Production Plan - TC
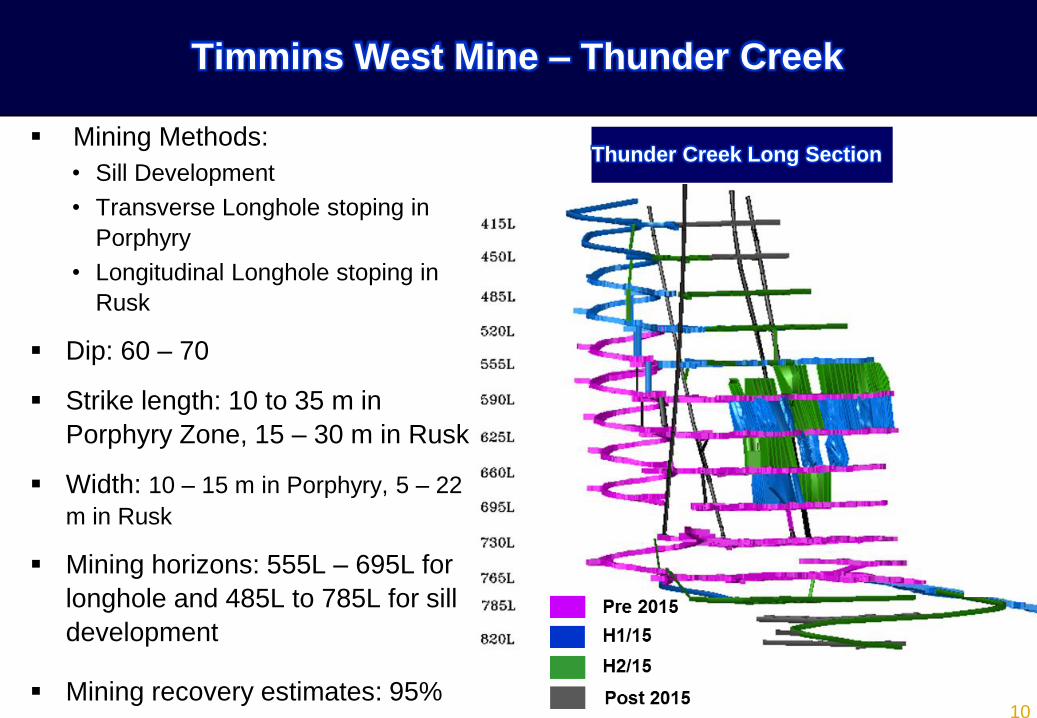
Mining Methods:
• Sill Development
• Transverse Longhole stoping in
Porphyry
• Longitudinal Longhole stoping in
Rusk
Dip: 60 – 70
Strike length: 10 to 35 m in
Porphyry Zone, 15 – 30 m in Rusk
Width: 10 – 15 m in Porphyry, 5 – 22
m in Rusk
Mining horizons: 555L – 695L for
longhole and 485L to 785L for sill
development
Mining recovery estimates: 95%
Thunder Creek Long Section
Timmins West Mine – Thunder Creek
11
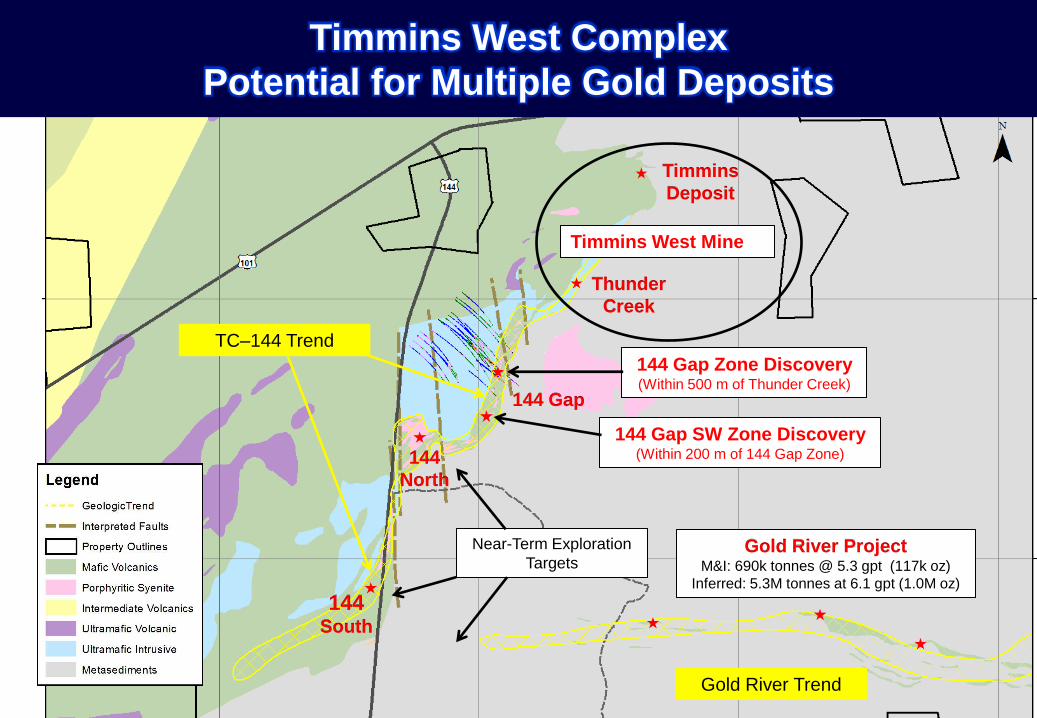
Timmins West Complex
Potential for Multiple Gold Deposits
Timmins West Mine
144 Gap Zone Discovery (Within 500 m of Thunder Creek)
Near-Term Exploration
Targets
Gold River Trend
TC–144 Trend
Gold River Project M&I: 690k tonnes @ 5.3 gpt (117k oz)
Inferred: 5.3M tonnes at 6.1 gpt (1.0M oz)
Timmins
Deposit
Thunder
Creek
144
North
144 South
144 Gap SW Zone Discovery (Within 200 m of 144 Gap Zone)
144 Gap
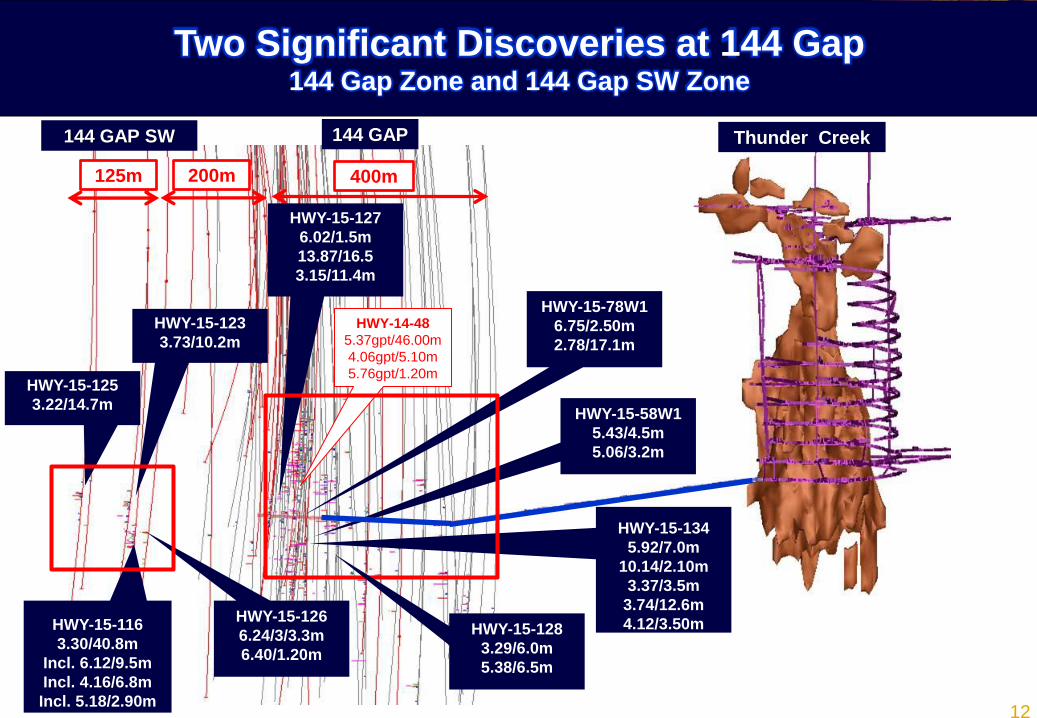
12
400m 200m 125m
Thunder Creek 144 GAP 144 GAP SW
HWY-15-116
3.30/40.8m
Incl. 6.12/9.5m
Incl. 4.16/6.8m
Incl. 5.18/2.90m
HWY-15-125
3.22/14.7m
HWY-15-123
3.73/10.2m
HWY-15-126
6.24/3/3.3m
6.40/1.20m
HWY-15-127
6.02/1.5m
13.87/16.5
3.15/11.4m
HWY-14-48
5.37gpt/46.00m
4.06gpt/5.10m
5.76gpt/1.20m
HWY-15-78W1
6.75/2.50m
2.78/17.1m
HWY-15-58W1
5.43/4.5m
5.06/3.2m
HWY-15-134
5.92/7.0m
10.14/2.10m
3.37/3.5m
3.74/12.6m
4.12/3.50m
Two Significant Discoveries at 144 Gap 144 Gap Zone and 144 Gap SW Zone
HWY-15-128
3.29/6.0m
5.38/6.5m
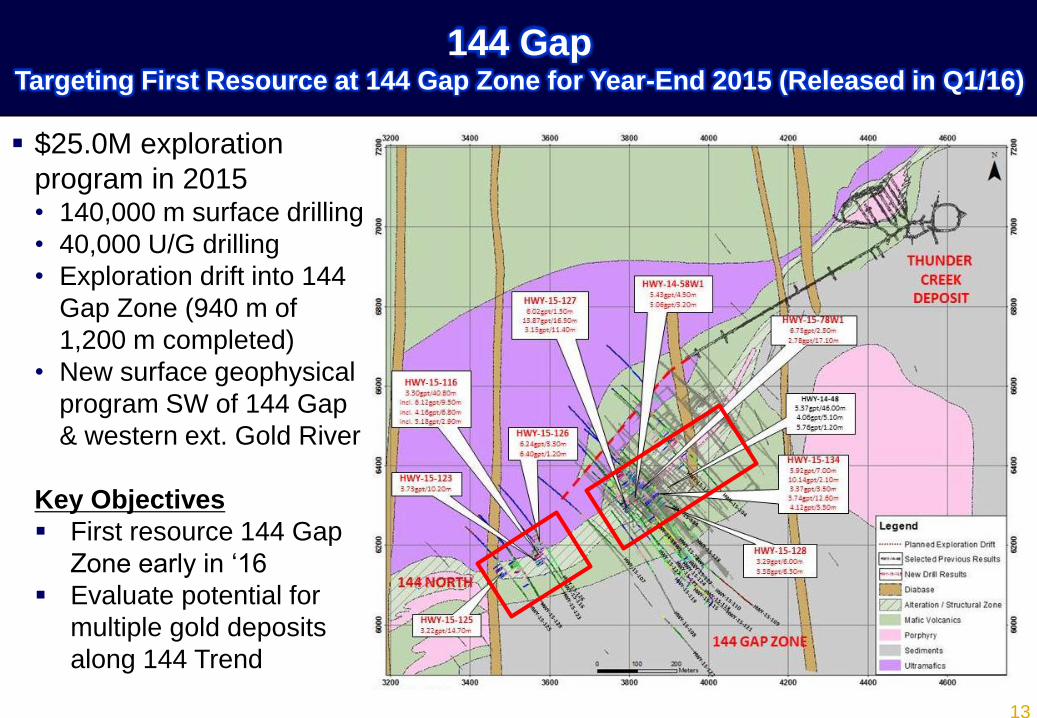
13
$25.0M exploration
program in 2015 • 140,000 m surface drilling
• 40,000 U/G drilling
• Exploration drift into 144
Gap Zone (940 m of
1,200 m completed)
• New surface geophysical
program SW of 144 Gap
& western ext. Gold River
Key Objectives
First resource 144 Gap
Zone early in ‘16
Evaluate potential for
multiple gold deposits
along 144 Trend
144 Gap Targeting First Resource at 144 Gap Zone for Year-End 2015 (Released in Q1/16)
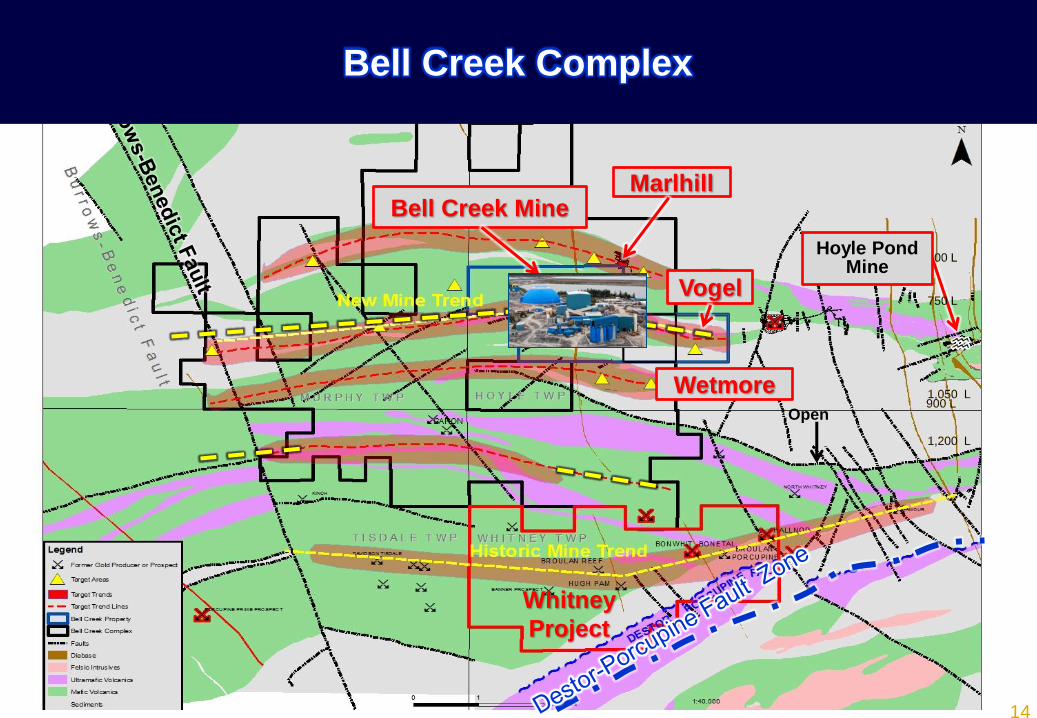
14
600 L
750 L
1,050 L
1,200 L
Bell Creek Mine Marlhill
Vogel
Hoyle Pond Mine
Wetmore 900 L
Open
Bell Creek Complex
Whitney
Project
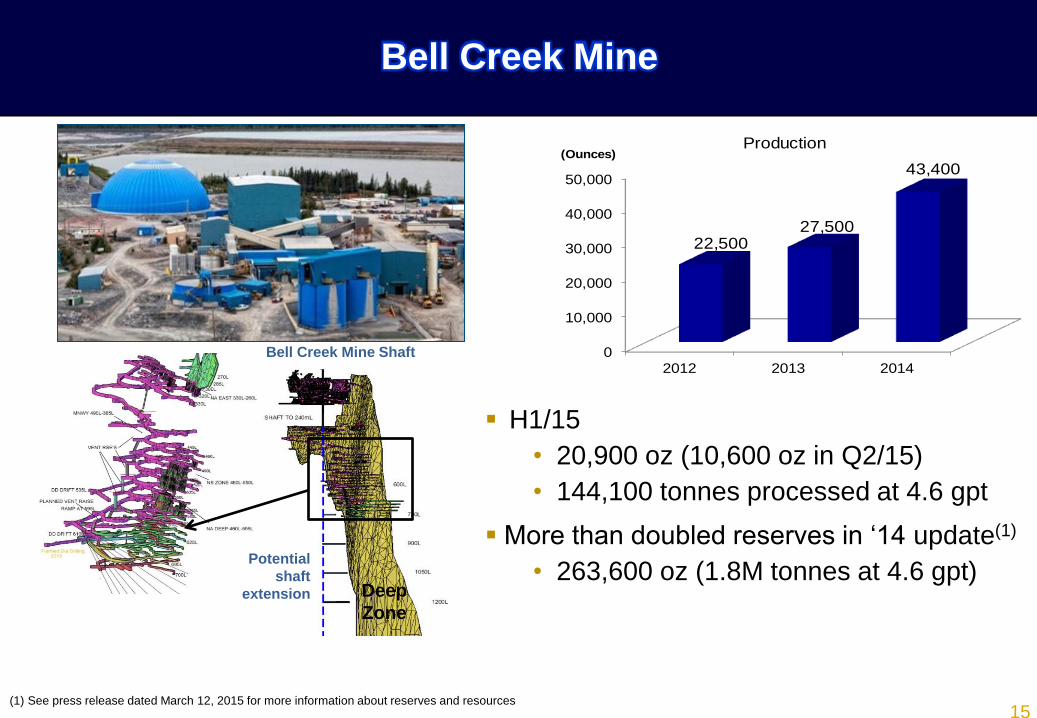
15
Bell Creek Mine
H1/15
• 20,900 oz (10,600 oz in Q2/15)
• 144,100 tonnes processed at 4.6 gpt
More than doubled reserves in ‘14 update(1)
• 263,600 oz (1.8M tonnes at 4.6 gpt)
Bell Creek Mine Shaft
Deep
Zone
Potential
shaft
extension
0
10,000
20,000
30,000
40,000
50,000
2012 2013 2014
22,50027,500
43,400(Ounces)
Production
(1) See press release dated March 12, 2015 for more information about reserves and resources
16
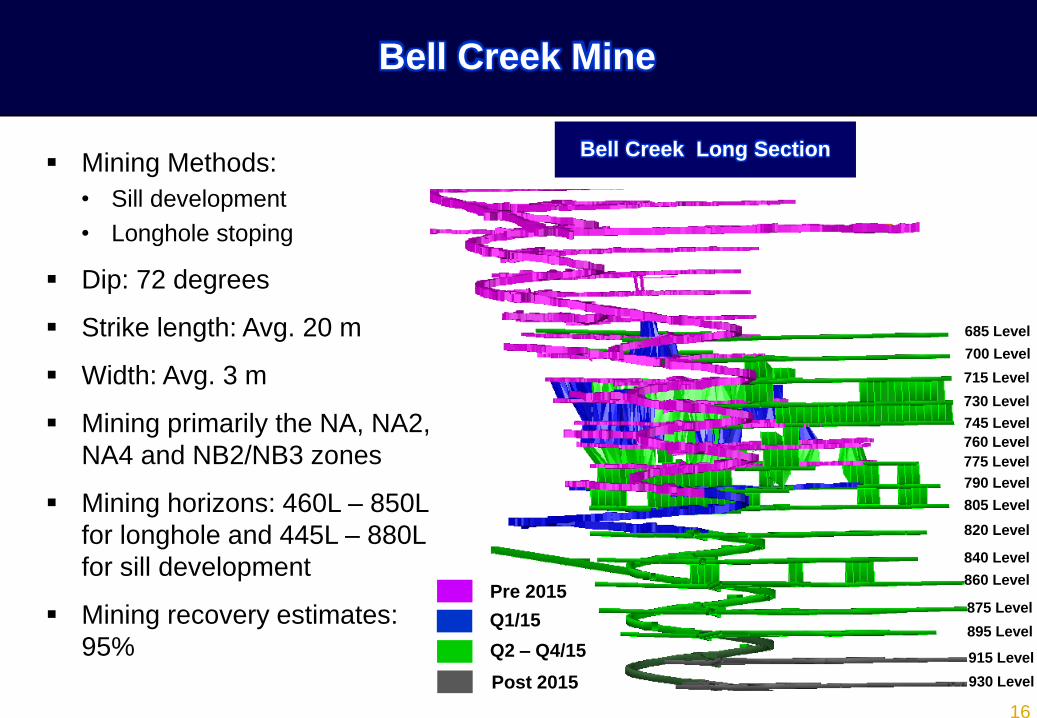
Highlights of Production Plan - BC
Mining Methods:
• Sill development
• Longhole stoping
Dip: 72 degrees
Strike length: Avg. 20 m
Width: Avg. 3 m
Mining primarily the NA, NA2,
NA4 and NB2/NB3 zones
Mining horizons: 460L – 850L
for longhole and 445L – 880L
for sill development
Mining recovery estimates:
95%
Bell Creek Long Section
Bell Creek Mine
685 Level
700 Level
715 Level
730 Level
745 Level
760 Level
775 Level
790 Level
805 Level
820 Level
840 Level
860 Level
875 Level
895 Level
915 Level
930 Level
Q1/15
Q2 – Q4/15
Post 2015
Pre 2015
17
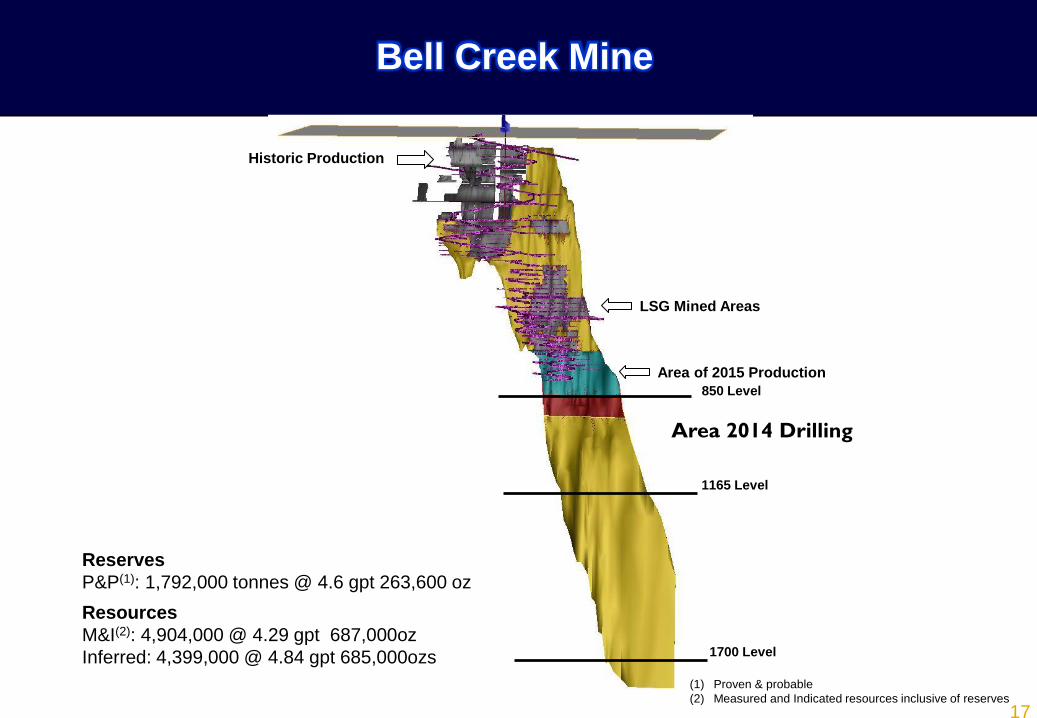
Reserves
P&P(1): 1,792,000 tonnes @ 4.6 gpt 263,600 oz
Resources
M&I(2): 4,904,000 @ 4.29 gpt 687,000oz
Inferred: 4,399,000 @ 4.84 gpt 685,000ozs
Area 2014 Drilling
Bell Creek Mine
(1) Proven & probable
(2) Measured and Indicated resources inclusive of reserves
850 Level
1165 Level
1700 Level
Area of 2015 Production
LSG Mined Areas
Historic Production
18
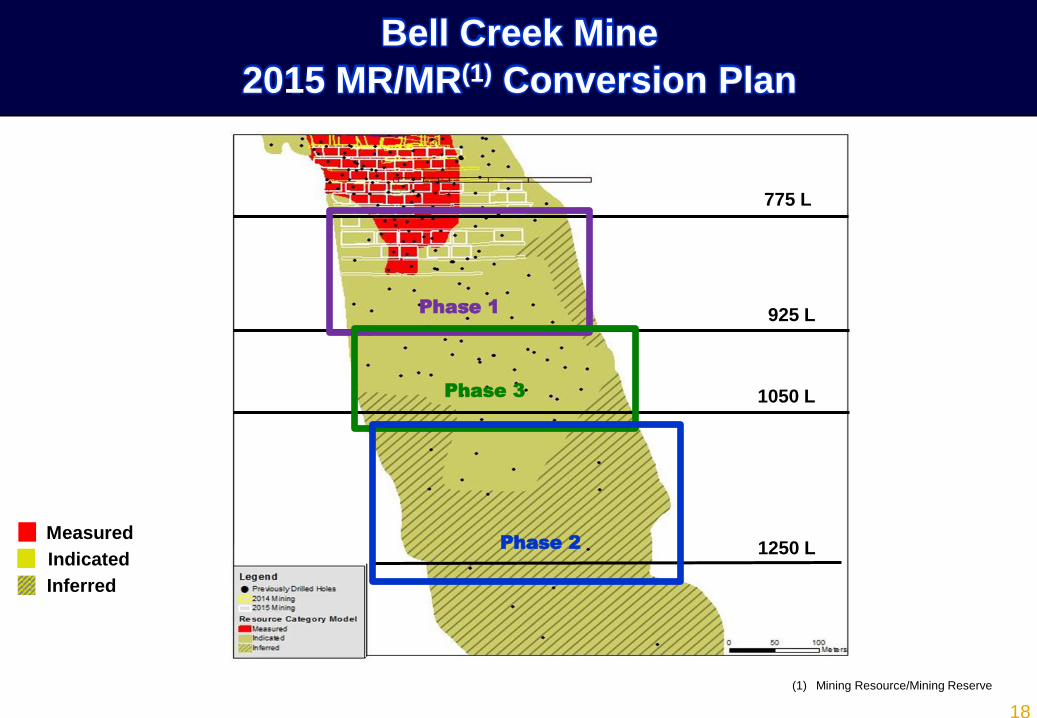
Bell Creek Mine
2015 MR/MR(1) Conversion Plan
775 L
925 L
1050 L
1250 L
Phase 3
Phase 2
Phase 1
(1) Mining Resource/Mining Reserve
Measured
Indicated
Inferred
19
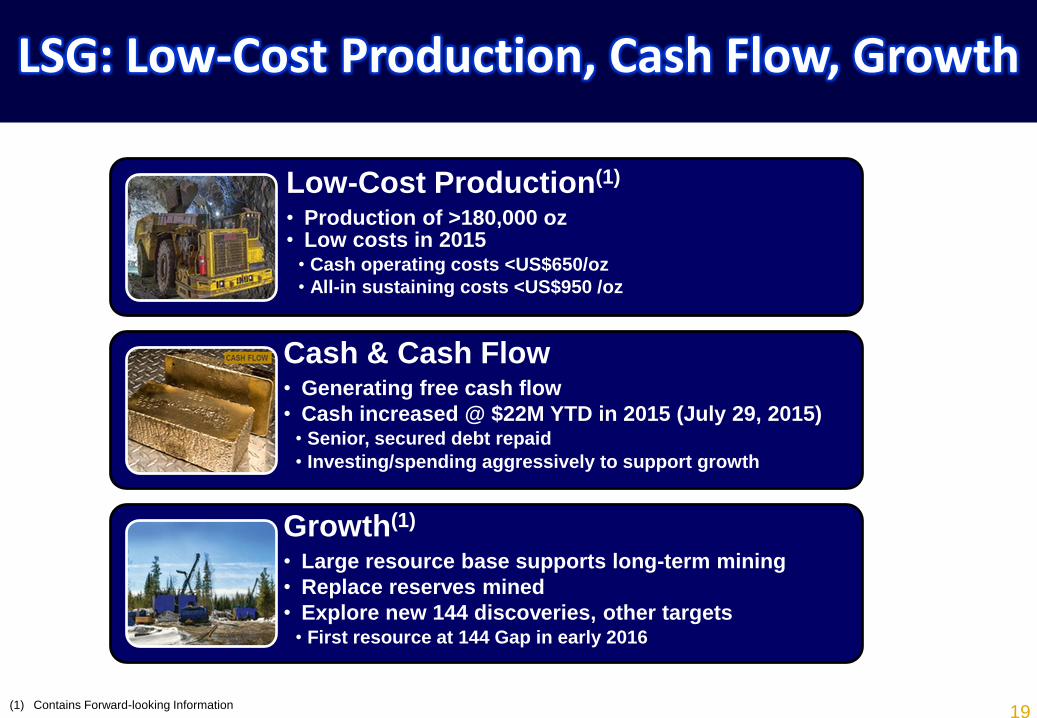
LSG: Low-Cost Production, Cash Flow, Growth
Low-Cost Production(1) • Production of >180,000 oz • Low costs in 2015
• Cash operating costs <US$650/oz
• All-in sustaining costs <US$950 /oz
Cash & Cash Flow • Generating free cash flow
• Cash increased @ $22M YTD in 2015 (July 29, 2015) • Senior, secured debt repaid
• Investing/spending aggressively to support growth
Growth(1) • Large resource base supports long-term mining
• Replace reserves mined
• Explore new 144 discoveries, other targets • First resource at 144 Gap in early 2016
(1) Contains Forward-looking Information
21
Cash Operating Costs per Ounce
Cash operating cost per ounce is a Non-GAAP measure. In the gold mining industry, cash operating cost per ounce is a common
performance measure but does not have any standardized meaning. Cash operating costs per ounce are based on ounces sold
and are derived from amounts included in the Consolidated Statements of Comprehensive Loss (Income) and include mine site
operating costs such as mining, processing and administration, but exclude depreciation, depletion and share-based payment
expenses and reclamation costs. The Company discloses cash cost per ounce as it believes this measure provides valuable
assistance to investors and analysts in evaluating the Company’s performance and ability to generate cash flow. This measure
should not be considered in isolation or as a substitute for measures prepared in accordance with GAAP such as total production
costs. A reconciliation of cash operating costs and cash operating cost per ounce to total production costs for the years ended
December 31, 2014 and 2013 is set out on page 19 of the Company’s 2014 and fourth quarter of 2014 Management Discussion & Analysis (“MD&A”). A reconciliation of cash operating costs and cash operating cost per ounce to total production costs for the
three months ended March 31, 2015 is set out on page 16 of the Company’s first quarter 2015 MD&A.
All-In Sustaining Costs per Ounce
Effective the second quarter 2013, the Company has adopted a total all-in sustaining cost (“AISC”) performance measure. AISC
is a Non-GAAP measure. The measure is intended to assist readers in evaluating the total costs of producing gold from current
operations. While there is no standardized meaning across the industry for this measure, the Company’s definition conforms to
the AISC definition as set out by the World Gold Council in its guidance note dated June 27, 2013. The Company defines all-in
sustaining cost as the sum of cash costs from mine operations, sustaining capital (capital required to maintain current operations
at existing levels), corporate general and administrative expenses, in-mine exploration expenses and reclamation cost accretion
related to current operations. All-in sustaining cost excludes growth capital, reclamation cost accretion not related to current
operations and interest and other financing costs. A reconciliation of all-in sustaining costs and all-in sustaining cost per ounce to
total production costs for the years ended December 31, 2014 and 2013 is set out on page 20 of the Company’s 2014 and fourth quarter 2014 MD&A. A reconciliation of cash operating costs and cash operating cost per ounce to total production costs for the
three months ended March 31, 2015 is set out on page 17 of the Company’s first quarter 2015 MD&A.
Non-GAAP Measures(1)
(1) The Company’s MDA”s for the full year and fourth quarter of 2014 and first quarter of 2015 are posted at www.sedar.com and on the Company’s website at www.lsgold.com.
22
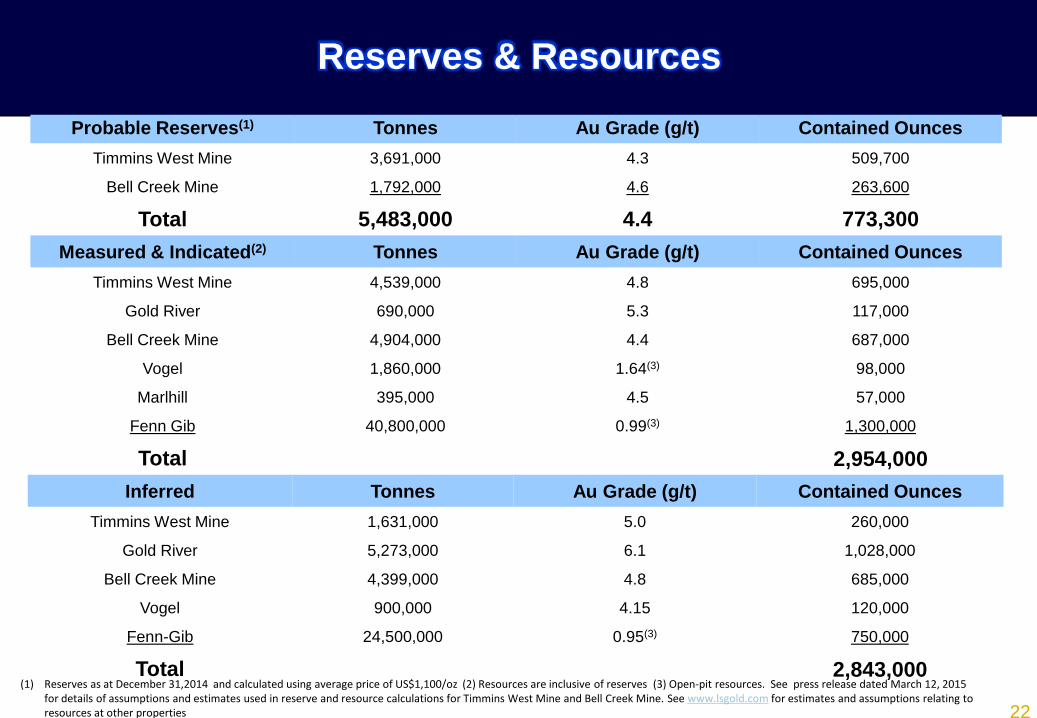
Probable Reserves(1) Tonnes Au Grade (g/t) Contained Ounces
Timmins West Mine 3,691,000 4.3 509,700
Bell Creek Mine 1,792,000 4.6 263,600
Total 5,483,000 4.4 773,300
Measured & Indicated(2) Tonnes Au Grade (g/t) Contained Ounces
Timmins West Mine 4,539,000 4.8 695,000
Gold River 690,000 5.3 117,000
Bell Creek Mine 4,904,000 4.4 687,000
Vogel 1,860,000 1.64(3) 98,000
Marlhill 395,000 4.5 57,000
Fenn Gib 40,800,000 0.99(3) 1,300,000
Total 2,954,000
Inferred Tonnes Au Grade (g/t) Contained Ounces
Timmins West Mine 1,631,000 5.0 260,000
Gold River 5,273,000 6.1 1,028,000
Bell Creek Mine 4,399,000 4.8 685,000
Vogel 900,000 4.15 120,000
Fenn-Gib 24,500,000 0.95(3) 750,000
Total 2,843,000 (1) Reserves as at December 31,2014 and calculated using average price of US$1,100/oz (2) Resources are inclusive of reserves (3) Open-pit resources. See press release dated March 12, 2015
for details of assumptions and estimates used in reserve and resource calculations for Timmins West Mine and Bell Creek Mine. See www.lsgold.com for estimates and assumptions relating to resources at other properties
Reserves & Resources