Embed Size (px)
Citation preview

1H/2Q 2016 Results Presentation1H/2Q 2016 Results Presentation
London 29 July 2016
Mauro Moretti Chief Executive Officer and General Manager
Gian Piero Cutillo Chief Financial Officer
KEY ACHIEVEMENTS IN 1H 2016 (CEO and General Manager)
RESULTS AND OUTLOOK (CFO)RESULTS AND OUTLOOK (CFO)
UPDATE ON STRATEGIC DEVELOPMENTS (CEO and General Manager)
Q&A
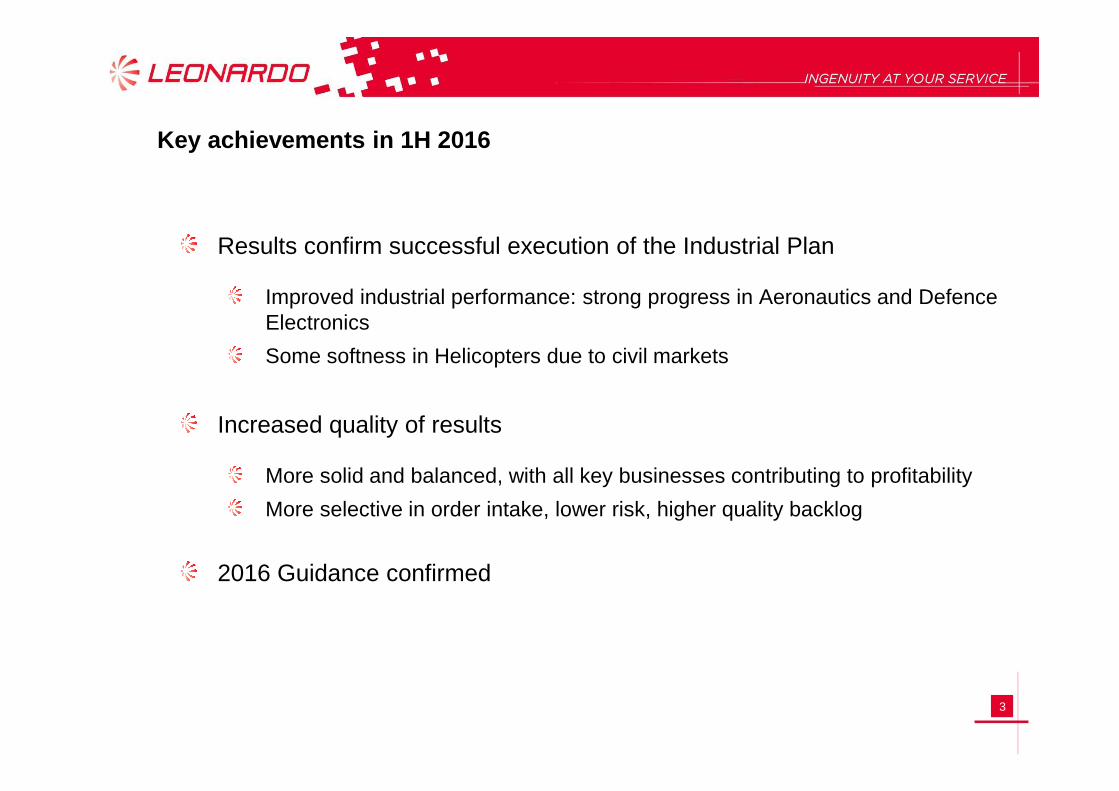
Key achievements in 1H 2016
Results confirm successful execution of the Industrial Plan
Improved industrial performance: strong progress in Aeronautics and DefenceElectronics
Some softness in Helicopters due to civil markets
3
Increased quality of results
More solid and balanced, with all key businesses contributing to profitability
More selective in order intake, lower risk, higher quality backlog
2016 Guidance confirmed
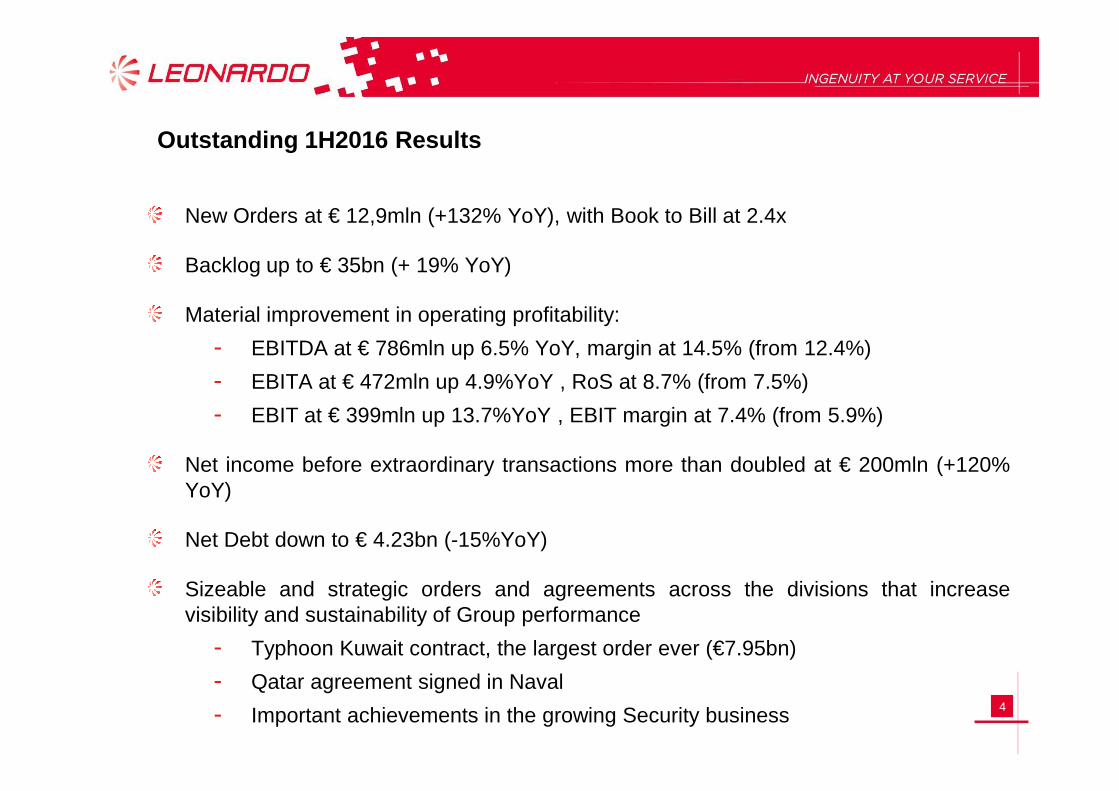
Outstanding 1H2016 Results
New Orders at € 12,9mln (+132% YoY), with Book to Bill at 2.4x
Backlog up to € 35bn (+ 19% YoY)
Material improvement in operating profitability:
- EBITDA at € 786mln up 6.5% YoY, margin at 14.5% (from 12.4%)
- EBITA at € 472mln up 4.9%YoY , RoS at 8.7% (from 7.5%)
4
- EBIT at € 399mln up 13.7%YoY , EBIT margin at 7.4% (from 5.9%)
Net income before extraordinary transactions more than doubled at € 200mln (+120%YoY)
Net Debt down to € 4.23bn (-15%YoY)
Sizeable and strategic orders and agreements across the divisions that increasevisibility and sustainability of Group performance
- Typhoon Kuwait contract, the largest order ever (€7.95bn)
- Qatar agreement signed in Naval
- Important achievements in the growing Security business

KEY ACHIEVEMENTS IN 1H 2016 (CEO and General Manager)
RESULTS AND OUTLOOK (CFO)
5
RESULTS AND OUTLOOK (CFO)
UPDATE ON STRATEGIC DEVELOPMENTS (CEO and General Manager)
Q&A
Key messages
Solid start to the year reflecting a better balanced business
Continuous improvement in Electronics, Defence & Security and Aeronautics
Offsetting increasingly challenging Helicopters market
Material step up in Net Result
6
Material step up in Net Result
FY expectations confirmed
Very positive incremental impact from EFA Kuwait contract
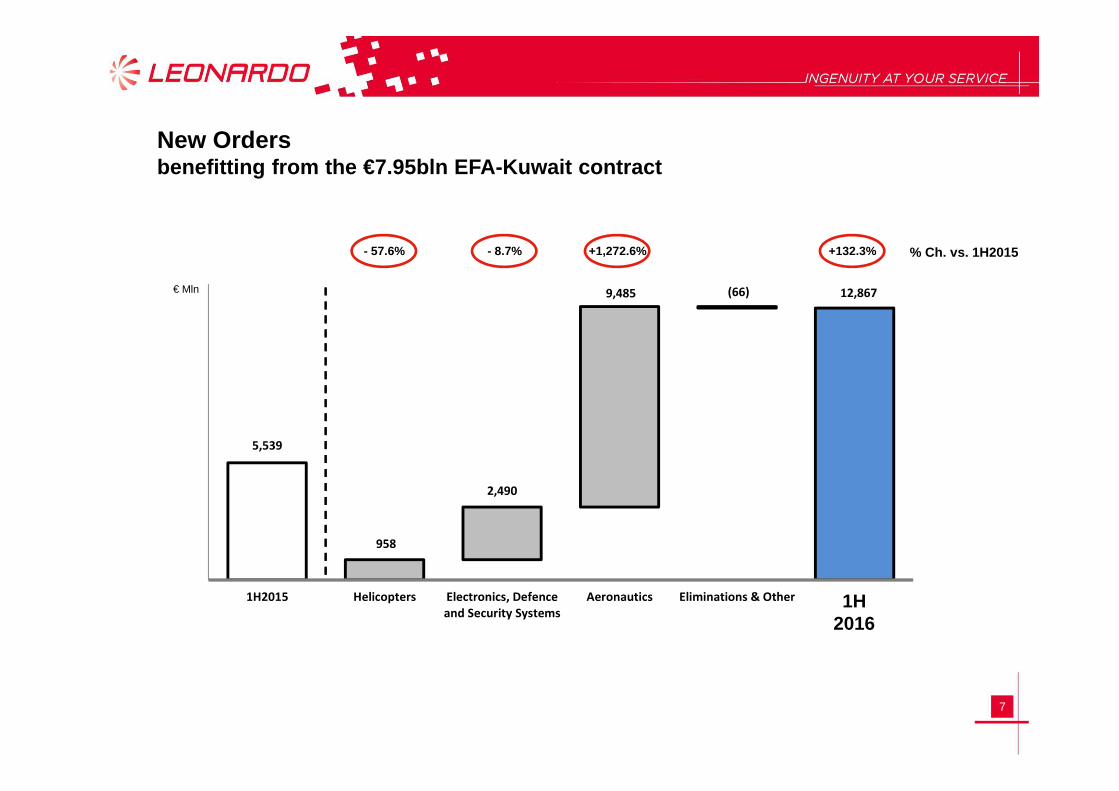
9,485 (66) 12,867
New Ordersbenefitting from the €7.95bln EFA-Kuwait contract
€ Mln
+1,272.6%- 8.7%- 57.6% +132.3% % Ch. vs. 1H2015
7
5,539
958
2,490
1H2015 Helicopters Electronics, Defence
and Security Systems
Aeronautics Eliminations & Other 1H20161H 2016
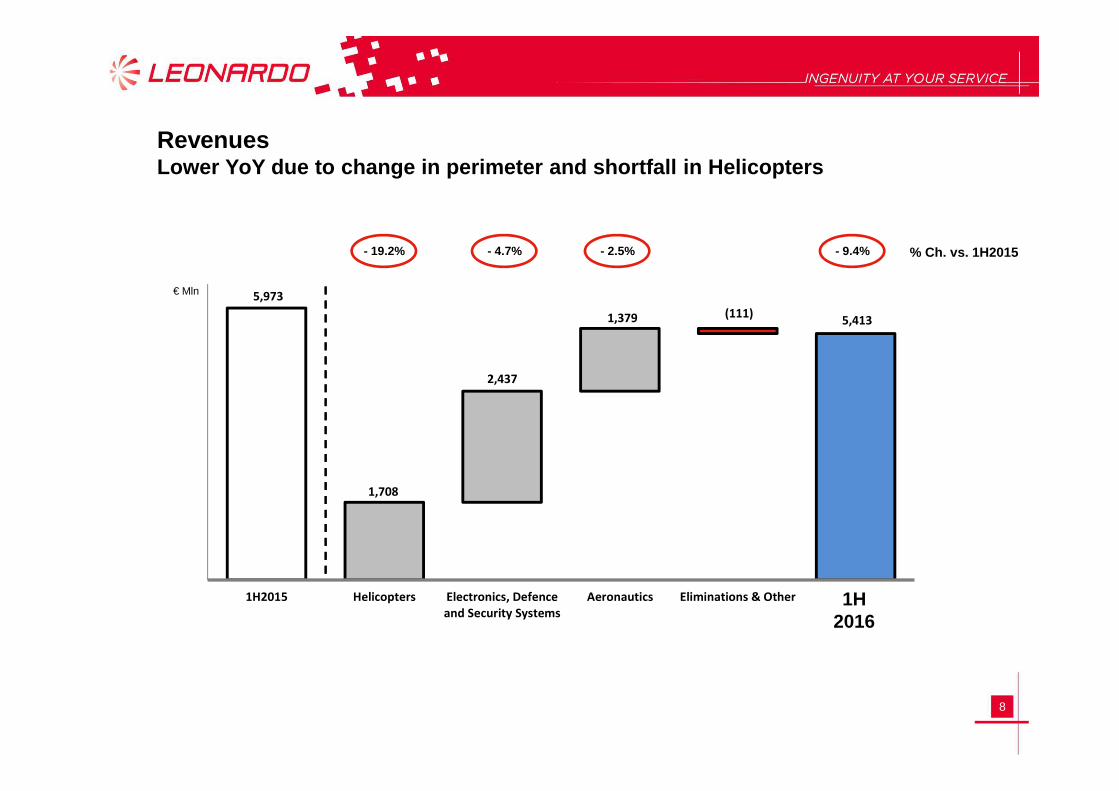
5,973
2,437
1,379 (111)5,413
RevenuesLower YoY due to change in perimeter and shortfall in Helicop ters
€ Mln
- 2.5%- 4.7%- 19.2% - 9.4% % Ch. vs. 1H2015
8
1,708
1H2015 Helicopters Electronics, Defence
and Security Systems
Aeronautics Eliminations & Other 1H20161H 2016
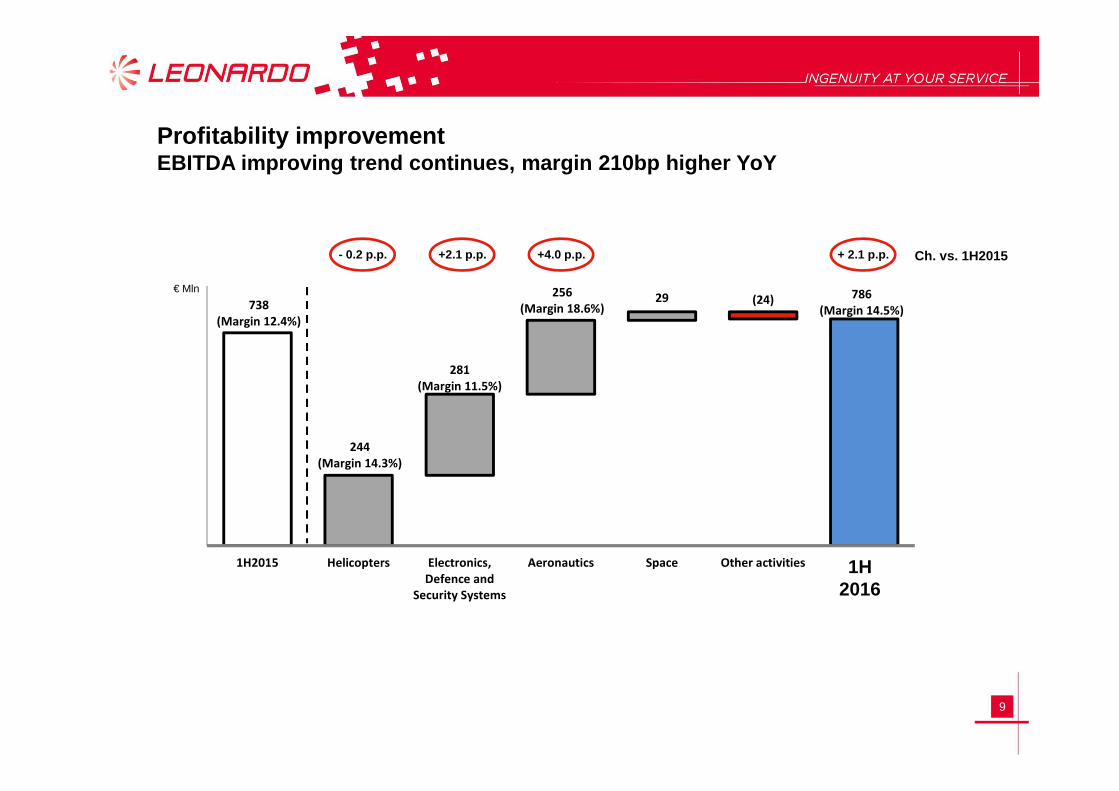
738
(Margin 12.4%)
281
(Margin 11.5%)
256
(Margin 18.6%)29 (24) 786
(Margin 14.5%)
Profitability improvement EBITDA improving trend continues, margin 210bp high er YoY
€ Mln
Ch. vs. 1H2015+4.0 p.p.+2.1 p.p.- 0.2 p.p. + 2.1 p.p.
9
244
(Margin 14.3%)
1H2015 Helicopters Electronics,
Defence and
Security Systems
Aeronautics Space Other activities 1H20161H 2016
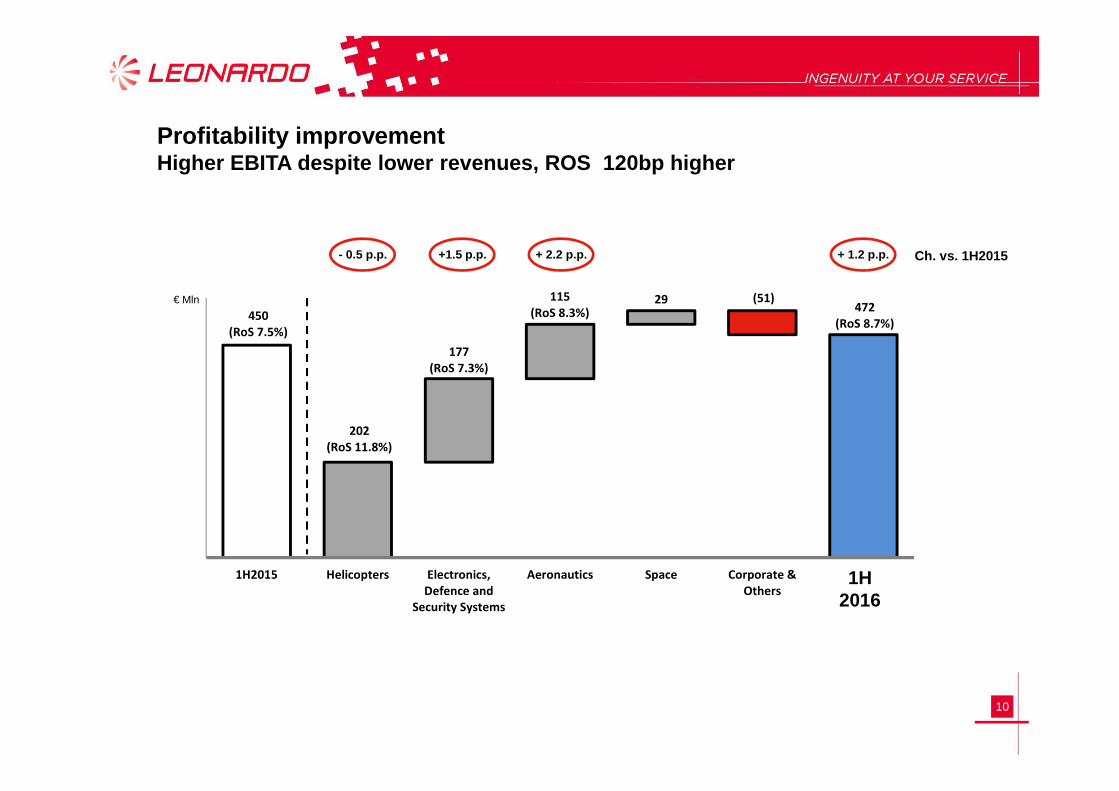
450
(RoS 7.5%)
177
(RoS 7.3%)
115
(RoS 8.3%)29 (51)
472
(RoS 8.7%)
Profitability improvement Higher EBITA despite lower revenues, ROS 120bp high er
€ Mln
Ch. vs. 1H2015+ 2.2 p.p.+1.5 p.p.- 0.5 p.p. + 1.2 p.p.
10
202
(RoS 11.8%)
1H2015 Helicopters Electronics,
Defence and
Security Systems
Aeronautics Space Corporate &
Others
1H20161H 2016
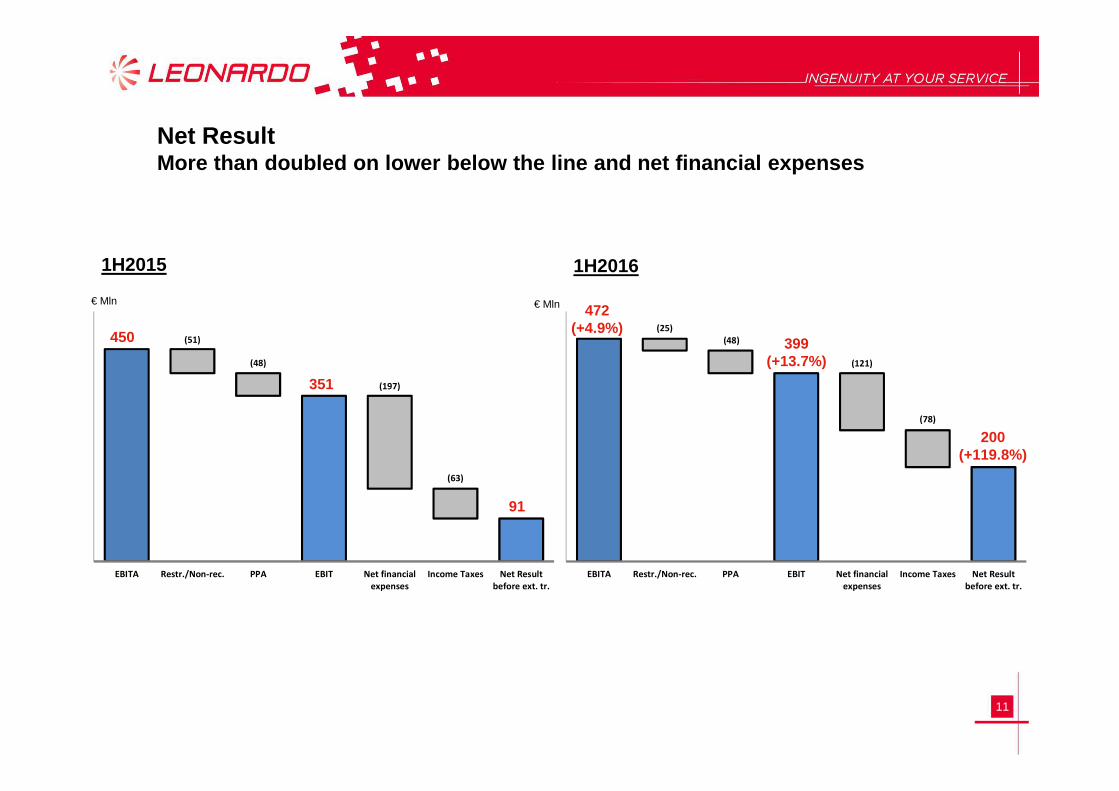
450 (51)
(48)
351 (197)
472 (25)
(48)
399 (121)
Net ResultMore than doubled on lower below the line and net f inancial expenses
1H2015 1H2016
€ Mln€ Mln
450
351
472(+4.9%)
399(+13.7%)
11
(63)
91
EBITA Restr./Non-rec. PPA EBIT Net financial
expenses
Income Taxes Net Result
before ext. tr.
(78)
200
EBITA Restr./Non-rec. PPA EBIT Net financial
expenses
Income Taxes Net Result
before ext. tr.
91
200(+119.8%)
Eurofighter Kuwait contractOrder booked in 2Q2016
Contract signed on April 5th 2016 for 28 Eurofighter in the most advanced configuration, including new E-Scan radar
Leonardo as prime contractor will lead all activities on behalf of the Consortium. Our share is ca. 60% of total value (€ 7,95mln), remaining 40% is pass-through
8-year contract (2016-2023 ). Production, delivery and acceptance will be in Italy (Aircraft Division). Deliveries will start in 2019
12
Division). Deliveries will start in 2019
The impact of the contract on the Group :
ORDERS: 1H2016 reflects the entire amount of the contract
REVENUES: meaningless contribution in 2016, ramping up in 2017-2018, peak of ca. € 2bln per year in 2020-2021
EBITA: not expected to be dilutive on margins in 2017-2018, only marginally from 2019 onwards as Revenues peak up
FOCF: downpayment received in July with € 200mln net impact on 2016 FOCF and €400mln in 2017. As typical for this kind of contracts, cash absorption expected as the deliveries start, due to the build up of the Working Capital
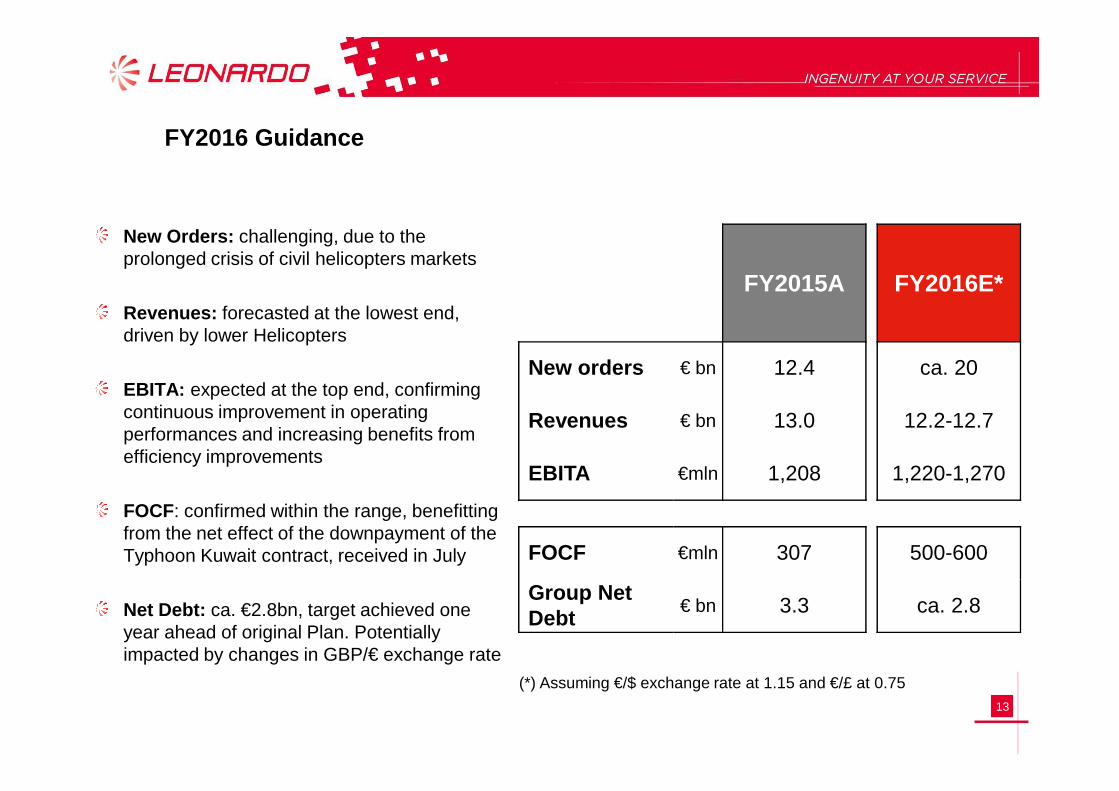
FY2016 Guidance
FY2015A FY2016E*
New orders € bn 12.4 ca. 20
New Orders: challenging, due to the prolonged crisis of civil helicopters markets
Revenues: forecasted at the lowest end, driven by lower Helicopters
EBITA: expected at the top end, confirming
13
(*) Assuming €/$ exchange rate at 1.15 and €/£ at 0.75
Revenues € bn 13.0 12.2-12.7
EBITA €mln 1,208 1,220-1,270
FOCF €mln 307 500-600
Group Net Debt
€ bn 3.3 ca. 2.8
EBITA: expected at the top end, confirming continuous improvement in operating performances and increasing benefits from efficiency improvements
FOCF: confirmed within the range, benefitting from the net effect of the downpayment of the Typhoon Kuwait contract, received in July
Net Debt: ca. €2.8bn, target achieved one year ahead of original Plan. Potentially impacted by changes in GBP/€ exchange rate
KEY ACHIEVEMENTS IN 1H 2016 (CEO and General Manager)
RESULTS AND OUTLOOK (CFO)
14
RESULTS AND OUTLOOK (CFO)
UPDATE ON STRATEGIC DEVELOPMENTS (CEO and General Manager)
Q&A
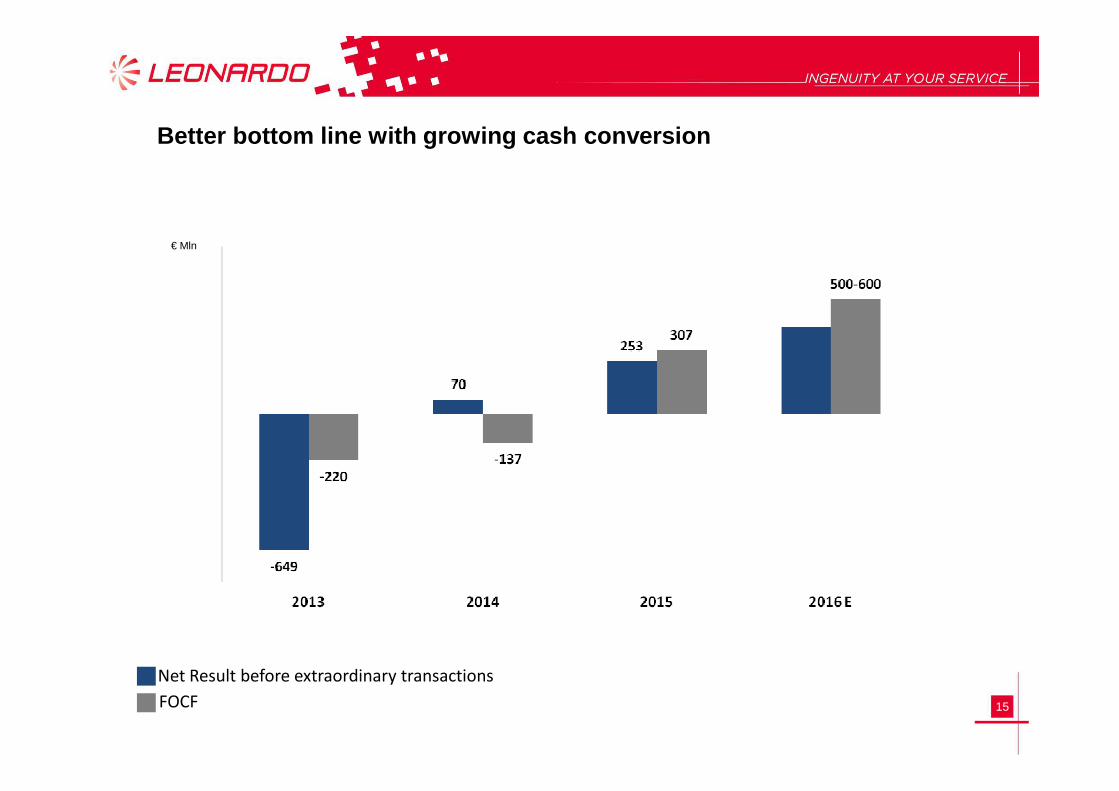
Better bottom line with growing cash conversion
€ Mln
15
Net Result before extraordinary transactions
FOCF
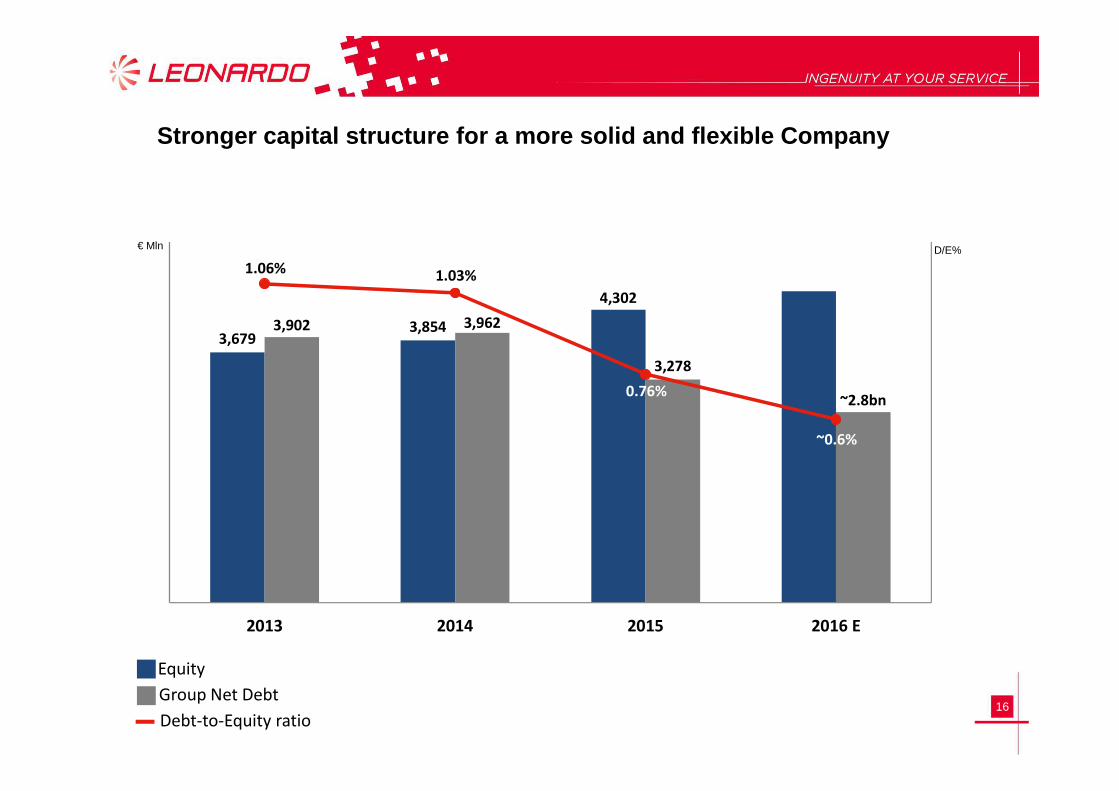
Stronger capital structure for a more solid and flexible Company
3,6793,854
4,302
3,902 3,962
3,278
~2.8bn
1.06% 1.03%
0.76%
€ Mln D/E%
16
Equity
Group Net Debt
Debt-to-Equity ratio
~2.8bn0.76%
~0.6%
2013 2014 2015 2016 E
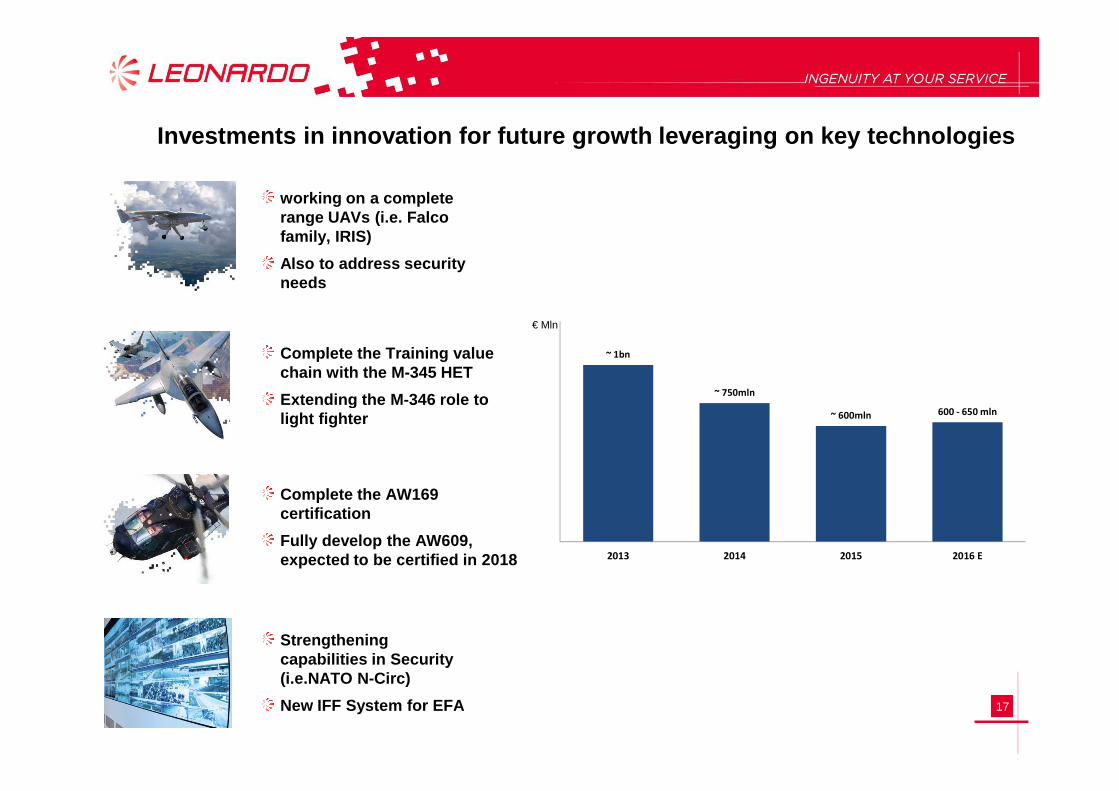
Investments in innovation for future growth leveraging on key technologies
Complete the Training value chain with the M-345 HET
Extending the M-346 role to
working on a complete range UAVs (i.e. Falcofamily, IRIS)
Also to address security needs
~ 1bn
~ 750mln
€ Mln
17
Extending the M-346 role to light fighter
Complete the AW169 certification
Fully develop the AW609, expected to be certified in 2018
Strengthening capabilities in Security (i.e.NATO N-Circ)
New IFF System for EFA
~ 750mln
~ 600mln 600 - 650 mln
2013 2014 2015 2016 E
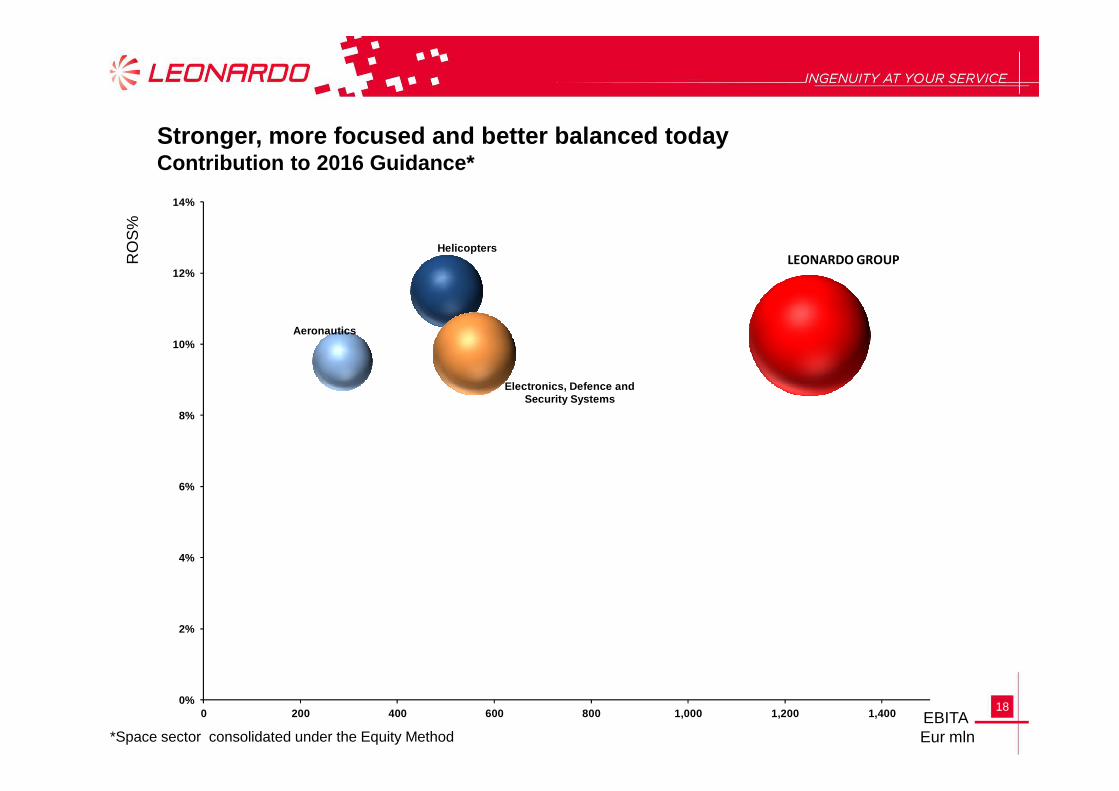
Stronger, more focused and better balanced todayContribution to 2016 Guidance*
Helicopters
Aeronautics
FINMECCANICA GROUP
Electronics, Defence and Security Systems
10%
12%
14%
RO
S%
LEONARDO GROUP
18
Security Systems
0%
2%
4%
6%
8%
0 200 400 600 800 1,000 1,200 1,400
EBITA
EBITA Eur mln*Space sector consolidated under the Equity Method
Executing and delivering strongly in 2016
We have deeply rationalized the business and product portfolio
Extracting the benefits of being today a one integrated Company
Facing some market challenges we are concentrating our efforts anddoing an outstanding job in what we can control:
- Cost
19
- Cost
- Investments
- Technologies
- Commercial approach
Result of these efforts clearly evident in our performance
Relentless commitment to deliver more to our shareholders
Focusing on responsible business conduct

SECTOR RESULTS
20
SECTOR RESULTS
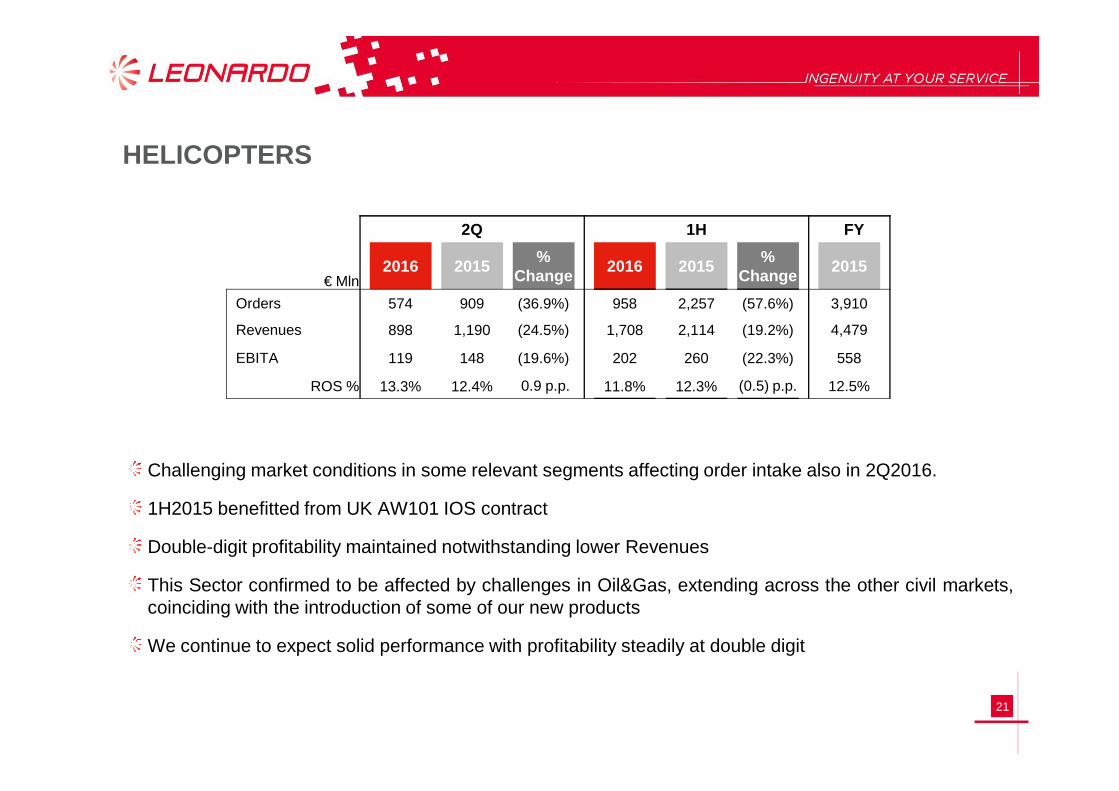
HELICOPTERS
2Q 1H FY
€ Mln 2016 2015
% Change
2016 2015%
Change2015
Orders 574 909 (36.9%) 958 2,257 (57.6%) 3,910
Revenues 898 1,190 (24.5%) 1,708 2,114 (19.2%) 4,479
EBITA 119 148 (19.6%) 202 260 (22.3%) 558
ROS % 13.3% 12.4% 0.9 p.p. 11.8% 12.3% (0.5) p.p. 12.5%
21
Challenging market conditions in some relevant segments affecting order intake also in 2Q2016.
1H2015 benefitted from UK AW101 IOS contract
Double-digit profitability maintained notwithstanding lower Revenues
This Sector confirmed to be affected by challenges in Oil&Gas, extending across the other civil markets,coinciding with the introduction of some of our new products
We continue to expect solid performance with profitability steadily at double digit
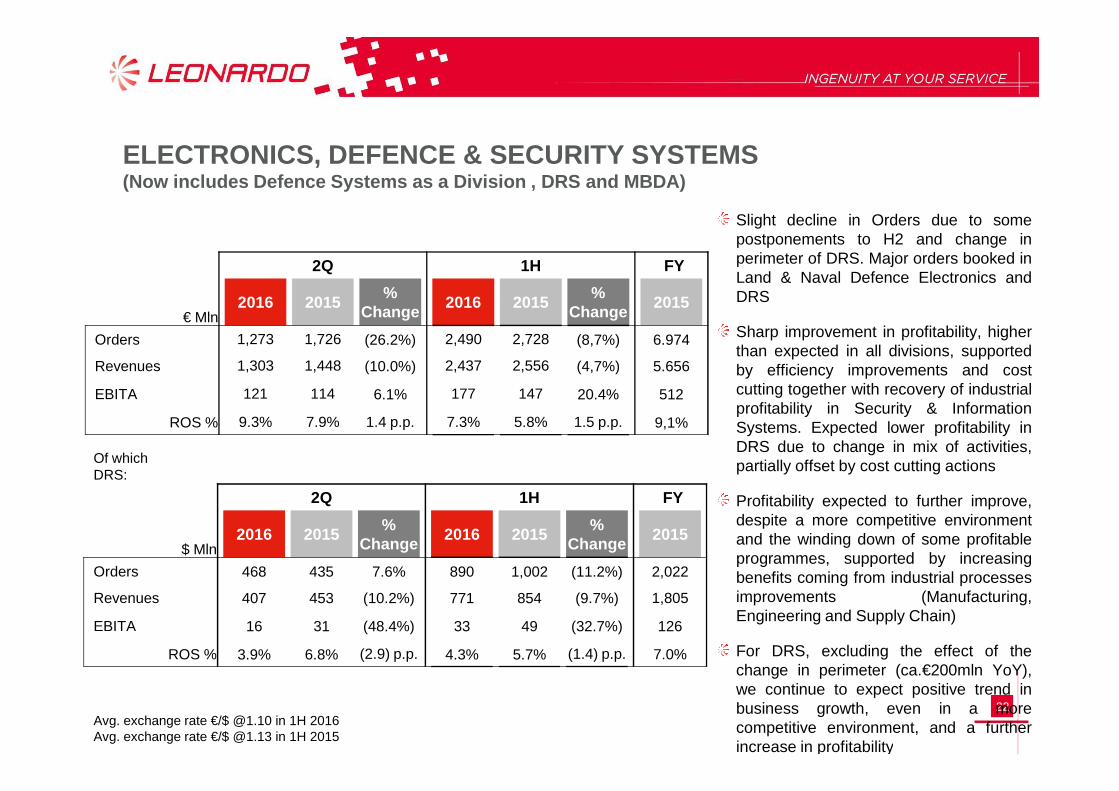
ELECTRONICS, DEFENCE & SECURITY SYSTEMS(Now includes Defence Systems as a Division , DRS a nd MBDA)
2Q 1H FY
€ Mln 2016 2015
% Change
2016 2015%
Change2015
Orders 1,273 1,726 (26.2%) 2,490 2,728 (8,7%) 6.974
Revenues 1,303 1,448 (10.0%) 2,437 2,556 (4,7%) 5.656
EBITA 121 114 6.1% 177 147 20.4% 512
Slight decline in Orders due to somepostponements to H2 and change inperimeter of DRS. Major orders booked inLand & Naval Defence Electronics andDRS
Sharp improvement in profitability, higherthan expected in all divisions, supportedby efficiency improvements and costcutting together with recovery of industrial
22
Of whichDRS:
Avg. exchange rate €/$ @1.10 in 1H 2016Avg. exchange rate €/$ @1.13 in 1H 2015
EBITA 121 114 6.1% 177 147 20.4% 512
ROS % 9.3% 7.9% 1.4 p.p. 7.3% 5.8% 1.5 p.p. 9,1%
2Q 1H FY
$ Mln 2016 2015
% Change
2016 2015%
Change2015
Orders 468 435 7.6% 890 1,002 (11.2%) 2,022
Revenues 407 453 (10.2%) 771 854 (9.7%) 1,805
EBITA 16 31 (48.4%) 33 49 (32.7%) 126
ROS % 3.9% 6.8% (2.9) p.p. 4.3% 5.7% (1.4) p.p. 7.0%
cutting together with recovery of industrialprofitability in Security & InformationSystems. Expected lower profitability inDRS due to change in mix of activities,partially offset by cost cutting actions
Profitability expected to further improve,despite a more competitive environmentand the winding down of some profitableprogrammes, supported by increasingbenefits coming from industrial processesimprovements (Manufacturing,Engineering and Supply Chain)
For DRS, excluding the effect of thechange in perimeter (ca.€200mln YoY),we continue to expect positive trend inbusiness growth, even in a morecompetitive environment, and a furtherincrease in profitability
AERONAUTICS
2Q 1H FY
€ Mln 2016 2015
% Change
2016 2015%
Change2015
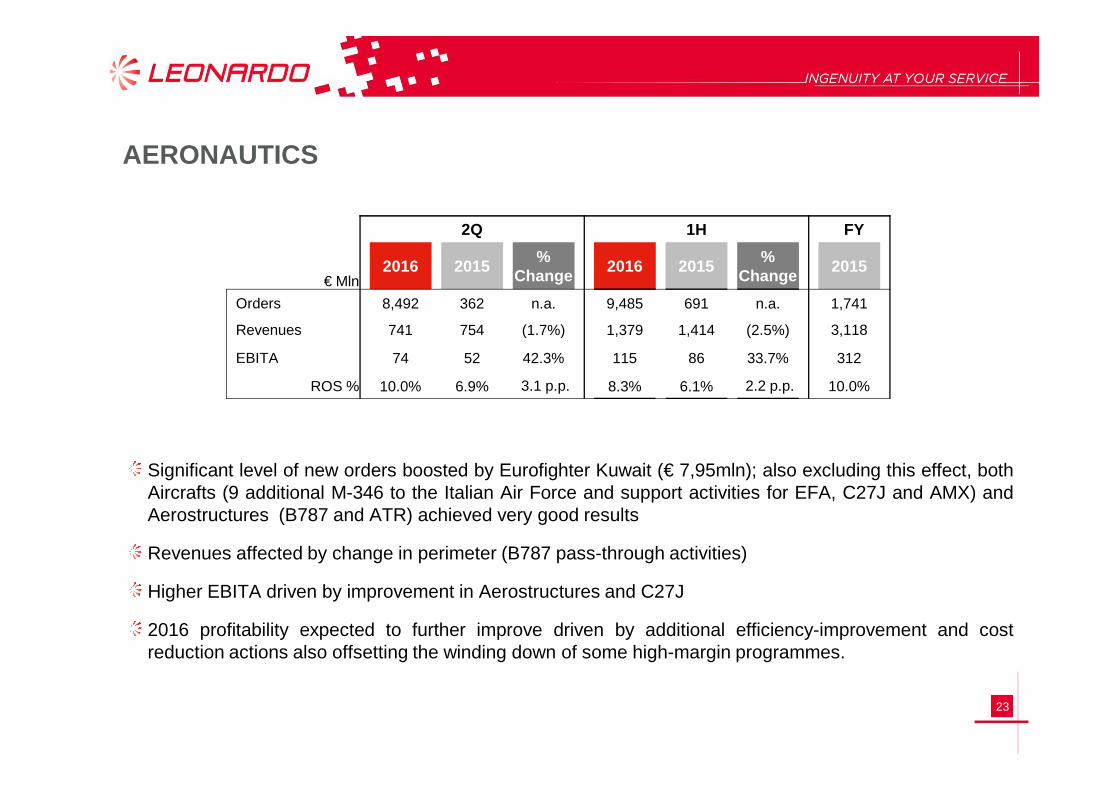
Orders 8,492 362 n.a. 9,485 691 n.a. 1,741
Revenues 741 754 (1.7%) 1,379 1,414 (2.5%) 3,118
EBITA 74 52 42.3% 115 86 33.7% 312
ROS % 10.0% 6.9% 3.1 p.p. 8.3% 6.1% 2.2 p.p. 10.0%
23
Significant level of new orders boosted by Eurofighter Kuwait (€ 7,95mln); also excluding this effect, bothAircrafts (9 additional M-346 to the Italian Air Force and support activities for EFA, C27J and AMX) andAerostructures (B787 and ATR) achieved very good results
Revenues affected by change in perimeter (B787 pass-through activities)
Higher EBITA driven by improvement in Aerostructures and C27J
2016 profitability expected to further improve driven by additional efficiency-improvement and costreduction actions also offsetting the winding down of some high-margin programmes.
SPACE
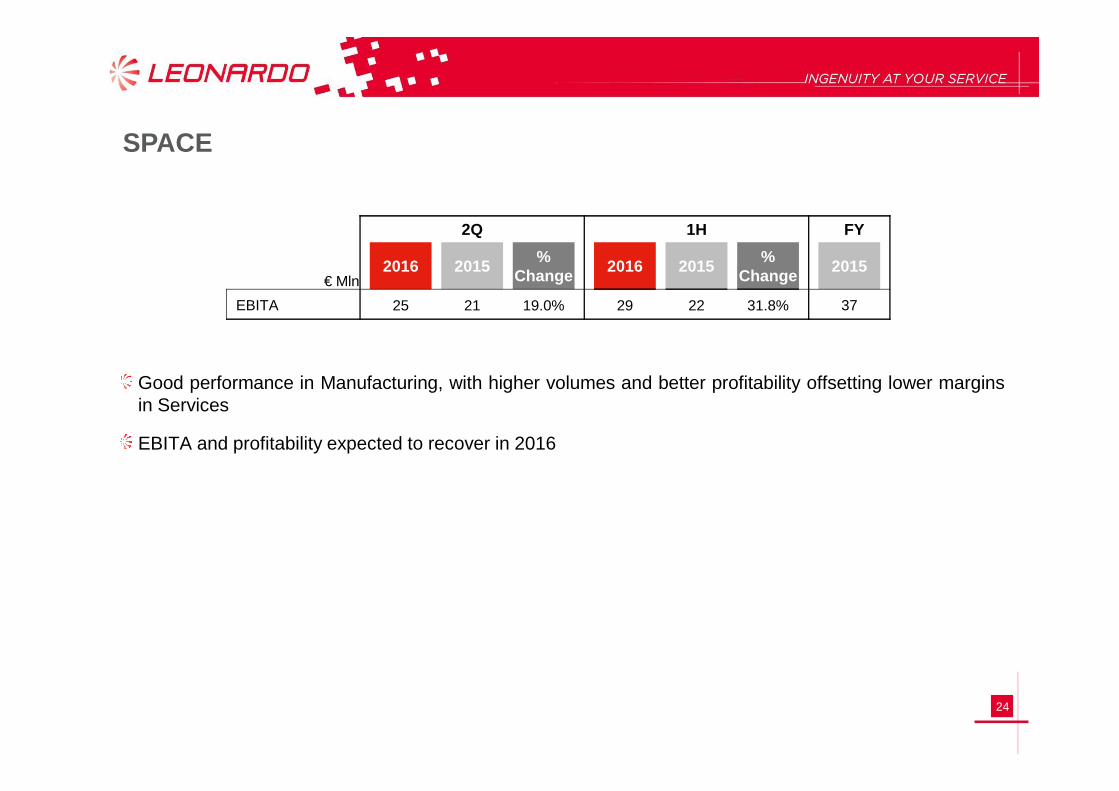
Good performance in Manufacturing, with higher volumes and better profitability offsetting lower marginsin Services
2Q 1H FY
€ Mln 2016 2015
% Change
2016 2015%
Change2015
EBITA 25 21 19.0% 29 22 31.8% 37
24
in Services
EBITA and profitability expected to recover in 2016
APPENDIX
25
APPENDIX
GROUP PERFORMANCE 2Q 1H FY
€ Mln2016 2015
% Change
2016 2015 %
Change2015
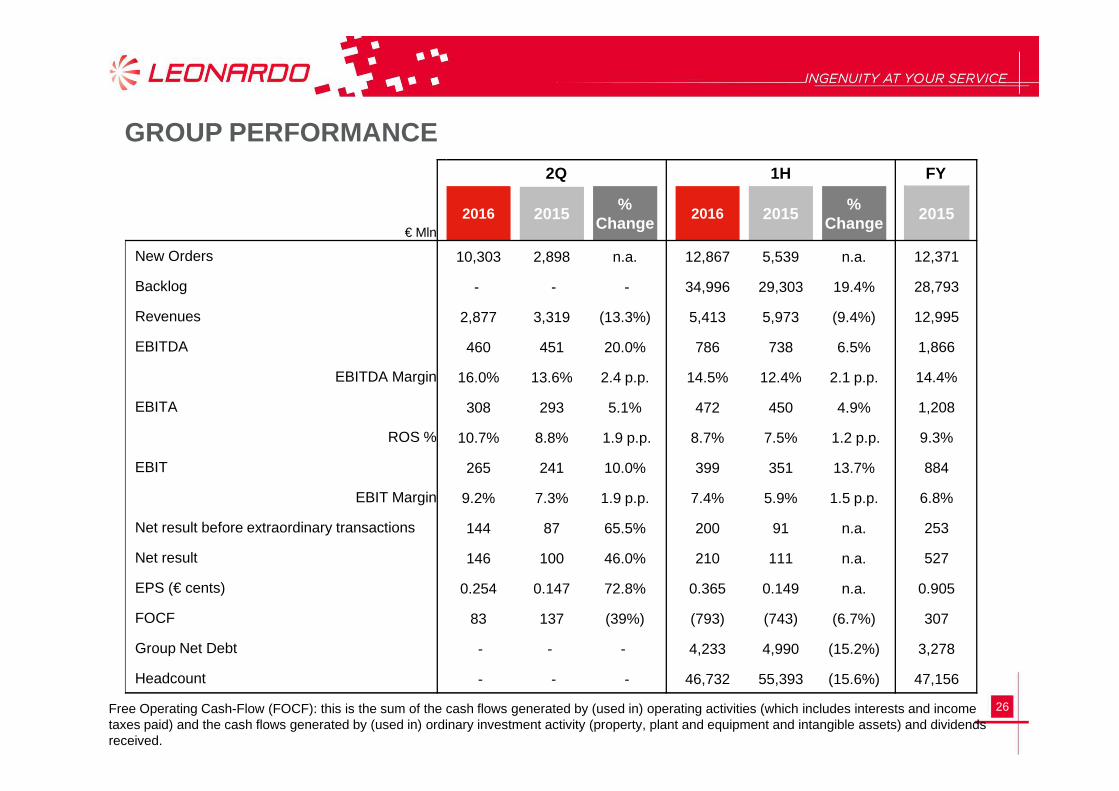
New Orders 10,303 2,898 n.a. 12,867 5,539 n.a. 12,371
Backlog - - - 34,996 29,303 19.4% 28,793
Revenues 2,877 3,319 (13.3%) 5,413 5,973 (9.4%) 12,995
EBITDA 460 451 20.0% 786 738 6.5% 1,866
EBITDA Margin 16.0% 13.6% 2.4 p.p. 14.5% 12.4% 2.1 p.p. 14.4%
26Free Operating Cash-Flow (FOCF): this is the sum of the cash flows generated by (used in) operating activities (which includes interests and income taxes paid) and the cash flows generated by (used in) ordinary investment activity (property, plant and equipment and intangible assets) and dividends received.
EBITA 308 293 5.1% 472 450 4.9% 1,208
ROS % 10.7% 8.8% 1.9 p.p. 8.7% 7.5% 1.2 p.p. 9.3%
EBIT 265 241 10.0% 399 351 13.7% 884
EBIT Margin 9.2% 7.3% 1.9 p.p. 7.4% 5.9% 1.5 p.p. 6.8%
Net result before extraordinary transactions 144 87 65.5% 200 91 n.a. 253
Net result 146 100 46.0% 210 111 n.a. 527
EPS (€ cents) 0.254 0.147 72.8% 0.365 0.149 n.a. 0.905
FOCF 83 137 (39%) (793) (743) (6.7%) 307
Group Net Debt - - - 4,233 4,990 (15.2%) 3,278
Headcount - - - 46,732 55,393 (15.6%) 47,156
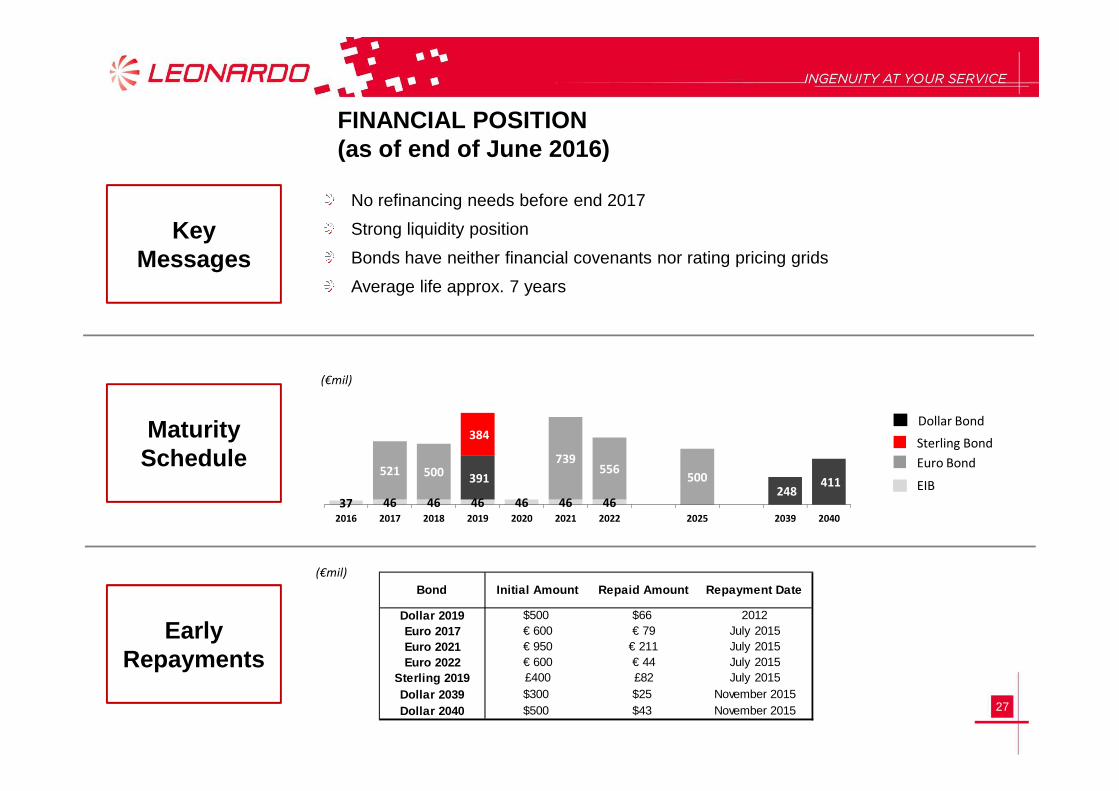
FINANCIAL POSITION (as of end of June 2016)
(€mil)
No refinancing needs before end 2017
Strong liquidity position
Bonds have neither financial covenants nor rating pricing grids
Average life approx. 7 years
KeyMessages
27
Sterling Bond
Euro Bond
EIB
Dollar BondMaturitySchedule
EarlyRepayments
(€mil)
Bond Initial Amount Repaid Amount Repayment Date
Dollar 2019 $500 $66 2012Euro 2017 € 600 € 79 July 2015Euro 2021 € 950 € 211 July 2015Euro 2022 € 600 € 44 July 2015
Sterling 2019 £400 £82 July 2015Dollar 2039 $300 $25 November 2015Dollar 2040 $500 $43 November 2015
37 46 46 46 46 46 46
521 500739
556500391
248 411
384
2016 2017 2018 2019 2020 2021 2022 2025 2039 2040
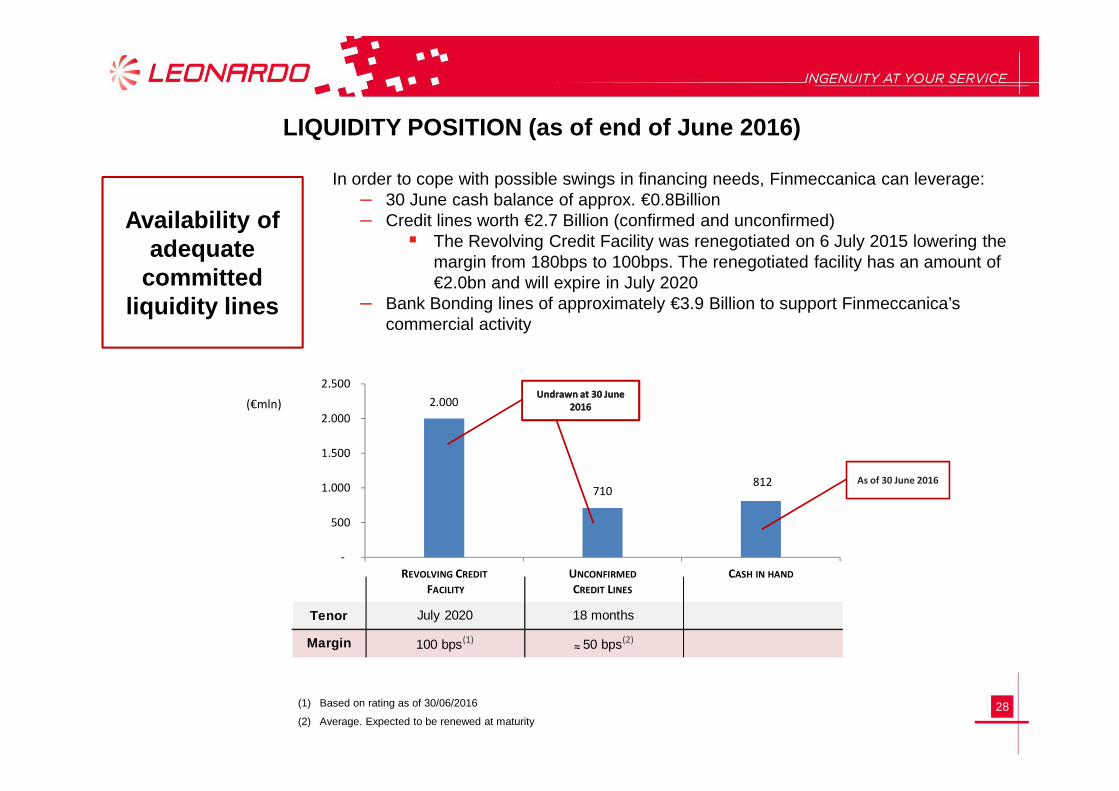
LIQUIDITY POSITION (as of end of June 2016)
Availability ofadequate
committedliquidity lines
In order to cope with possible swings in financing needs, Finmeccanica can leverage:– 30 June cash balance of approx. €0.8Billion– Credit lines worth €2.7 Billion (confirmed and unconfirmed)
� The Revolving Credit Facility was renegotiated on 6 July 2015 lowering the margin from 180bps to 100bps. The renegotiated facility has an amount of €2.0bn and will expire in July 2020
– Bank Bonding lines of approximately €3.9 Billion to support Finmeccanica’s commercial activity
2.000
2.500Undrawn at 30 June Undrawn at 30 June
28(1) Based on rating as of 30/06/2016
(2) Average. Expected to be renewed at maturity
(€mln)
Tenor July 2020 18 months
Margin 100 bps(1) ≈ 50 bps(2)
2.000
710812
-
500
1.000
1.500
2.000
REVOLVING CREDIT
FACILITY
UNCONFIRMED
CREDIT LINES
CASH IN HAND
As of 30 June 2016
Undrawn at 30 June
2016
Undrawn at 30 June
2016
SAFE HARBOR STATEMENTNOTE: Some of the statements included in this document are not historical facts but rather statements of future expectations, also related to future economic and financial performance, to be considered forward-looking statements. These forward-looking statements are based on Company’s views and assumptions as of the date of the statements and involve known and unknown risks and uncertainties that could cause actual results, performance or events to differ materially from those expressed or implied in such statements. Given these uncertainties, you should not rely on forward-looking statements.The following factors could affect our forward-looking statements: the ability to obtain or the timing of obtaining future government awards; the availability of government funding and customer requirements both domestically and internationally; changes in government or customer priorities due to programme reviews or revisions to
29
strategic objectives (including changes in priorities to respond to terrorist threats or to improve homeland security); difficulties in developing and producing operationally advanced technology systems; the competitive environment; economic business and political conditions domestically and internationally; programme performance and the timing of contract payments; the timing and customer acceptance of product deliveries and launches; our ability to achieve or realise savings for our customers or ourselves through our global cost-cutting programme and other financial management programmes; and the outcome of contingencies (including completion of any acquisitions and divestitures, litigation and environmental remediation efforts).These are only some of the numerous factors that may affect the forward-looking statements contained in this document. The Company undertakes no obligation to revise or update forward-looking statements as a result of new information since these statements may no longer be accurate or timely.
Contacts
Raffaella LugliniHead of Investor Relations & SRI+39 06 [email protected]
Investor Relations & Sustainable Responsible Investors (SRI)
Valeria RicciottiEquity Analysts & Investors+39 06 [email protected]
Alessio CrosaFixed Income Analysts & Investors and relationship with Credit Rating Agencies+39 06 [email protected]
Manuel LiottaGroup Sustainability & ESG+39 06 [email protected]
30We do business in a sustainable manner, with a continued commitment to
economic and social development and the protection of public health and
the environment.
ANNUAL REPORT 2015
PRESS RELEASE
VIDEO-WEBCAST
2015 Annual Results
[email protected] www.leonardocompany.com/investors
Sustainability
Quick links