Embed Size (px)
Citation preview

Presentation Title Presentation Subtitle
Crestwood Midstream Partners LP Crestwood Equity Partners LP
Connections for America’s Energy ™
™
Presentation Title Presentation Subtitle
Crestwood Midstream Partners LP Crestwood Equity Partners LP
Connections for America’s Energy ™
™
Presentation Title Presentation Subtitle
Crestwood Midstream Partners LP Crestwood Equity Partners LP
Connections for America’s Energy ™
™
2/29/16
Presentation Title Presentation Subtitle
Crestwood Midstream Partners LP Crestwood Equity Partners LP
Connections for America’s Energy ™
™
Presentation Title Presentation Subtitle
Crestwood Midstream Partners LP Crestwood Equity Partners LP
Connections for America’s Energy ™
™ Connections for America’s Energy ™
™
Investor Presentation March 2016
Connections for America’s Energy ™ ™ ™ ™ ™ ™
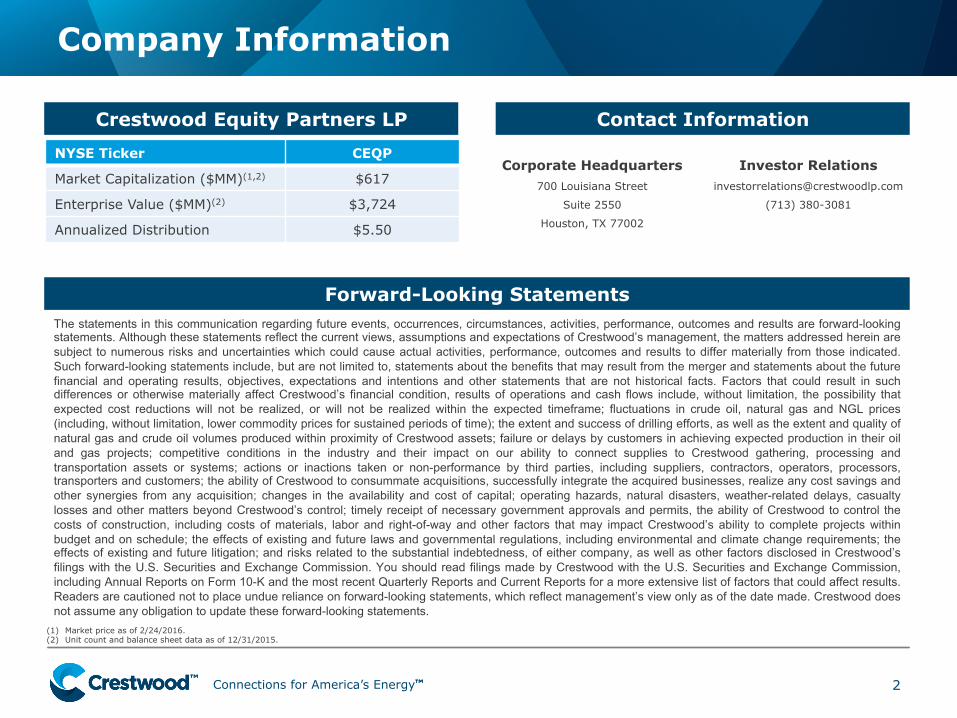
The statements in this communication regarding future events, occurrences, circumstances, activities, performance, outcomes and results are forward-looking statements. Although these statements reflect the current views, assumptions and expectations of Crestwood’s management, the matters addressed herein are subject to numerous risks and uncertainties which could cause actual activities, performance, outcomes and results to differ materially from those indicated. Such forward-looking statements include, but are not limited to, statements about the benefits that may result from the merger and statements about the future financial and operating results, objectives, expectations and intentions and other statements that are not historical facts. Factors that could result in such differences or otherwise materially affect Crestwood’s financial condition, results of operations and cash flows include, without limitation, the possibility that expected cost reductions will not be realized, or will not be realized within the expected timeframe; fluctuations in crude oil, natural gas and NGL prices (including, without limitation, lower commodity prices for sustained periods of time); the extent and success of drilling efforts, as well as the extent and quality of natural gas and crude oil volumes produced within proximity of Crestwood assets; failure or delays by customers in achieving expected production in their oil and gas projects; competitive conditions in the industry and their impact on our ability to connect supplies to Crestwood gathering, processing and transportation assets or systems; actions or inactions taken or non-performance by third parties, including suppliers, contractors, operators, processors, transporters and customers; the ability of Crestwood to consummate acquisitions, successfully integrate the acquired businesses, realize any cost savings and other synergies from any acquisition; changes in the availability and cost of capital; operating hazards, natural disasters, weather-related delays, casualty losses and other matters beyond Crestwood’s control; timely receipt of necessary government approvals and permits, the ability of Crestwood to control the costs of construction, including costs of materials, labor and right-of-way and other factors that may impact Crestwood’s ability to complete projects within budget and on schedule; the effects of existing and future laws and governmental regulations, including environmental and climate change requirements; the effects of existing and future litigation; and risks related to the substantial indebtedness, of either company, as well as other factors disclosed in Crestwood’s filings with the U.S. Securities and Exchange Commission. You should read filings made by Crestwood with the U.S. Securities and Exchange Commission, including Annual Reports on Form 10-K and the most recent Quarterly Reports and Current Reports for a more extensive list of factors that could affect results. Readers are cautioned not to place undue reliance on forward-looking statements, which reflect management’s view only as of the date made. Crestwood does not assume any obligation to update these forward-looking statements.
Company Information
2
Forward-Looking Statements
Contact Information
Corporate Headquarters 700 Louisiana Street
Suite 2550
Houston, TX 77002
(1) Market price as of 2/24/2016. (2) Unit count and balance sheet data as of 12/31/2015.
Crestwood Equity Partners LP NYSE Ticker CEQP
Market Capitalization ($MM)(1,2) $617
Enterprise Value ($MM)(2) $3,724
Annualized Distribution $5.50
Investor Relations [email protected]
(713) 380-3081
Connections for America’s Energy ™ ™ ™ ™ ™ ™
Key Investor Highlights
3
Connections for America’s Energy ™ ™ ™ ™ ™ ™
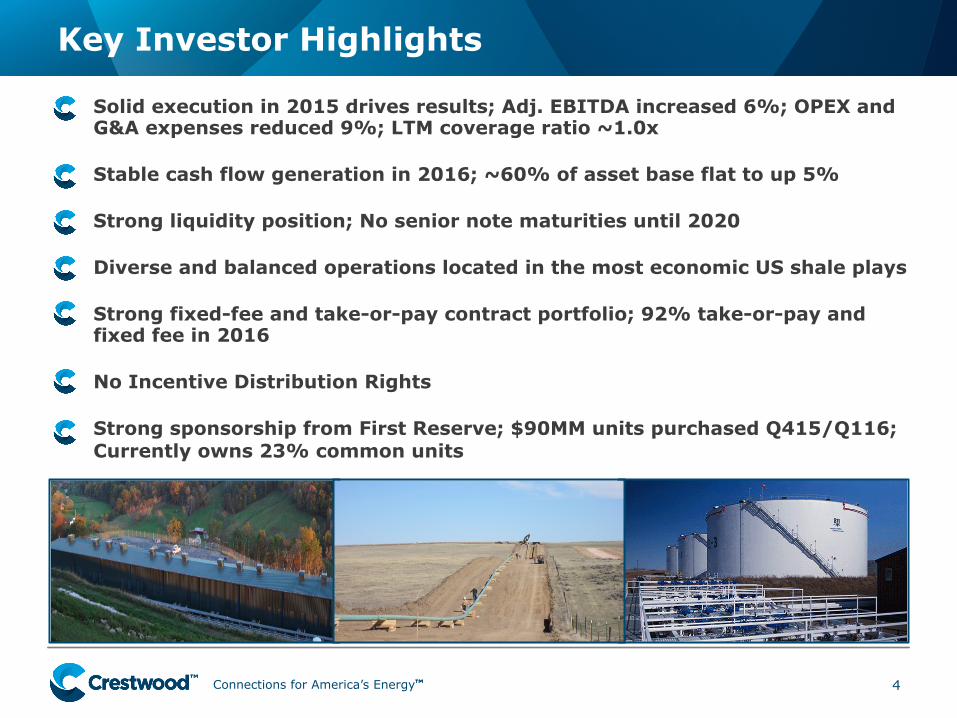
• Solid execution in 2015 drives results; Adj. EBITDA increased 6%; OPEX and G&A expenses reduced 9%; LTM coverage ratio ~1.0x
• Stable cash flow generation in 2016; ~60% of asset base flat to up 5%
• Strong liquidity position; No senior note maturities until 2020
• Diverse and balanced operations located in the most economic US shale plays
• Strong fixed-fee and take-or-pay contract portfolio; 92% take-or-pay and fixed fee in 2016
• No Incentive Distribution Rights
• Strong sponsorship from First Reserve; $90MM units purchased Q415/Q116; Currently owns 23% common units
Key Investor Highlights
4
Connections for America’s Energy ™ ™ ™ ™ ™ ™
2016 Outlook
5
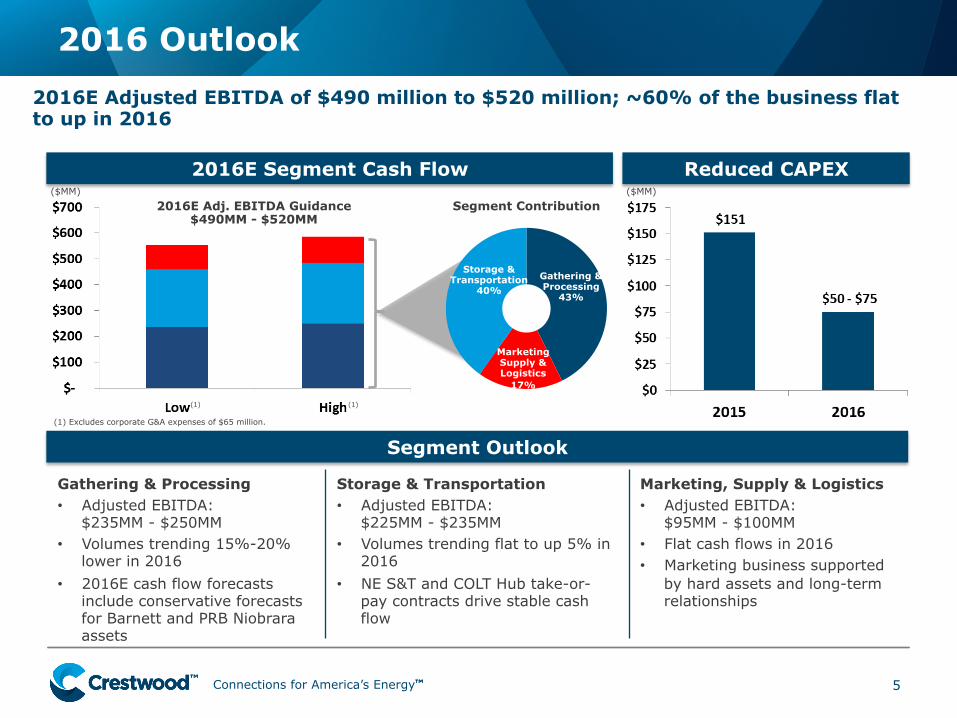
Marketing, Supply & Logistics • Adjusted EBITDA:
$95MM - $100MM • Flat cash flows in 2016 • Marketing business supported
by hard assets and long-term relationships
2016E Adjusted EBITDA of $490 million to $520 million; ~60% of the business flat to up in 2016
2016E Segment Cash Flow Reduced CAPEX
Gathering & Processing
43%
Storage & Transportation
40%
Marketing Supply & Logistics
17%
2016E Adj. EBITDA Guidance $490MM - $520MM
Segment Outlook
Storage & Transportation • Adjusted EBITDA:
$225MM - $235MM • Volumes trending flat to up 5% in
2016 • NE S&T and COLT Hub take-or-
pay contracts drive stable cash flow
Gathering & Processing • Adjusted EBITDA:
$235MM - $250MM • Volumes trending 15%-20%
lower in 2016 • 2016E cash flow forecasts
include conservative forecasts for Barnett and PRB Niobrara assets
(1) Excludes corporate G&A expenses of $65 million.
Segment Contribution
(1) (1)
($MM) ($MM)
Connections for America’s Energy ™ ™ ™ ™ ™ ™
Repositioning Crestwood in 2015/16
6
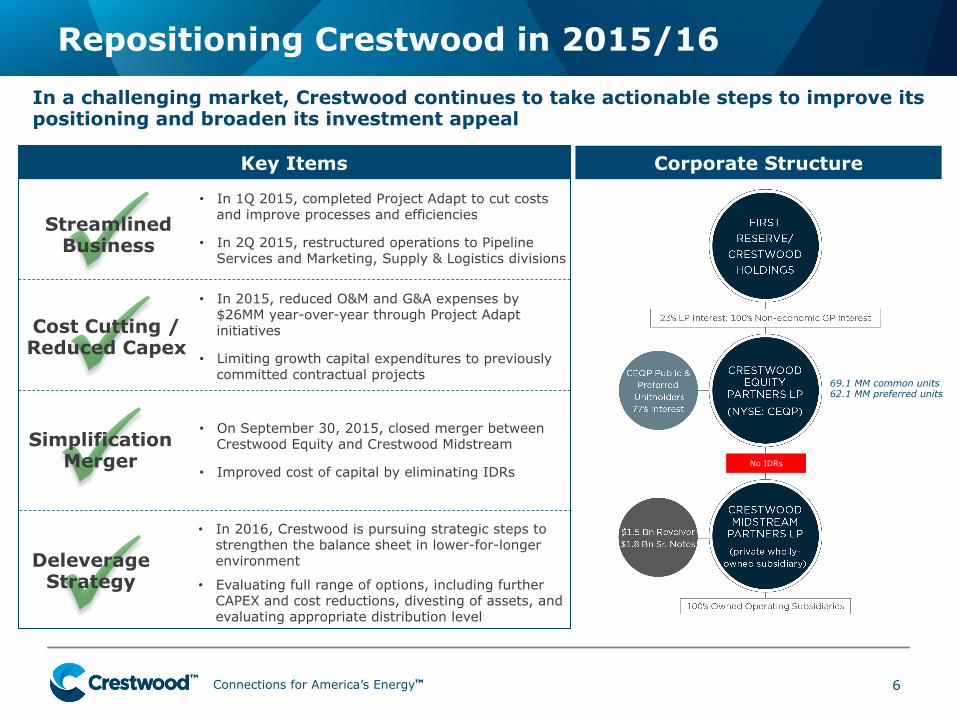
Corporate Structure
69.1 MM common units 62.1 MM preferred units
In a challenging market, Crestwood continues to take actionable steps to improve its positioning and broaden its investment appeal
No IDRs
Key Items
• In 2015, reduced O&M and G&A expenses by $26MM year-over-year through Project Adapt initiatives
• Limiting growth capital expenditures to previously committed contractual projects ü
ü Simplification Merger
Cost Cutting / Reduced Capex
• In 1Q 2015, completed Project Adapt to cut costs and improve processes and efficiencies
• In 2Q 2015, restructured operations to Pipeline Services and Marketing, Supply & Logistics divisions
• On September 30, 2015, closed merger between Crestwood Equity and Crestwood Midstream
• Improved cost of capital by eliminating IDRs
ü
ü Deleverage Strategy
• In 2016, Crestwood is pursuing strategic steps to strengthen the balance sheet in lower-for-longer environment
• Evaluating full range of options, including further CAPEX and cost reductions, divesting of assets, and evaluating appropriate distribution level
Streamlined Business
Connections for America’s Energy ™ ™ ™ ™ ™ ™
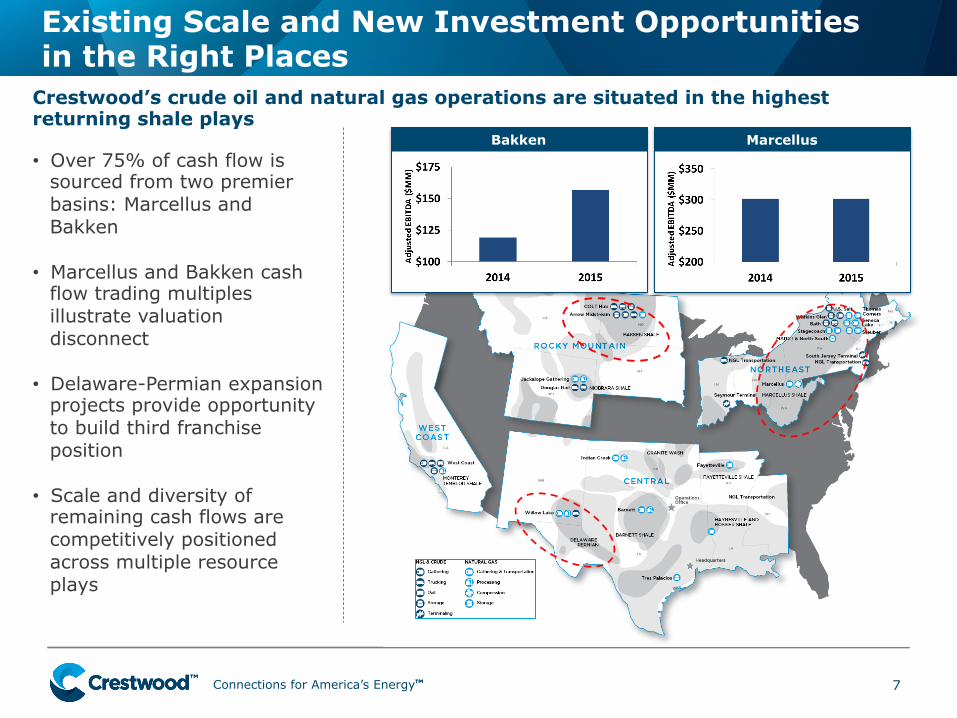
Existing Scale and New Investment Opportunities in the Right Places
7
Bakken
• Over 75% of cash flow is sourced from two premier basins: Marcellus and Bakken
• Marcellus and Bakken cash flow trading multiples illustrate valuation disconnect
• Delaware-Permian expansion projects provide opportunity to build third franchise position
• Scale and diversity of remaining cash flows are competitively positioned across multiple resource plays
Crestwood’s crude oil and natural gas operations are situated in the highest returning shale plays
Marcellus
Connections for America’s Energy ™ ™ ™ ™ ™ ™
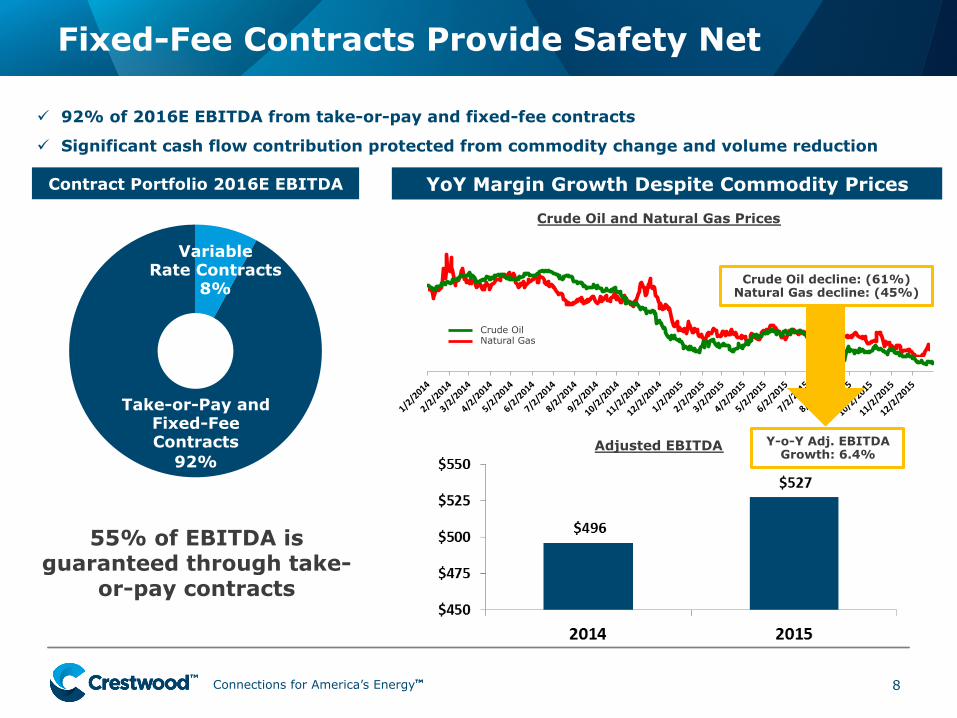
Fixed-Fee Contracts Provide Safety Net
8
Contract Portfolio 2016E EBITDA
Variable Rate Contracts
8%
Take-or-Pay and Fixed-Fee Contracts
92%
ü 92% of 2016E EBITDA from take-or-pay and fixed-fee contracts
ü Significant cash flow contribution protected from commodity change and volume reduction
55% of EBITDA is guaranteed through take-
or-pay contracts
YoY Margin Growth Despite Commodity Prices
Adjusted EBITDA
Crude Oil and Natural Gas Prices
Crude Oil Natural Gas
Y-o-Y Adj. EBITDA Growth: 6.4%
Crude Oil decline: (61%) Natural Gas decline: (45%)
Connections for America’s Energy ™ ™ ™ ™ ™ ™
$299
$253
$100
$150
$200
$250
$300
$350
4Q14 Annualized FY 2015
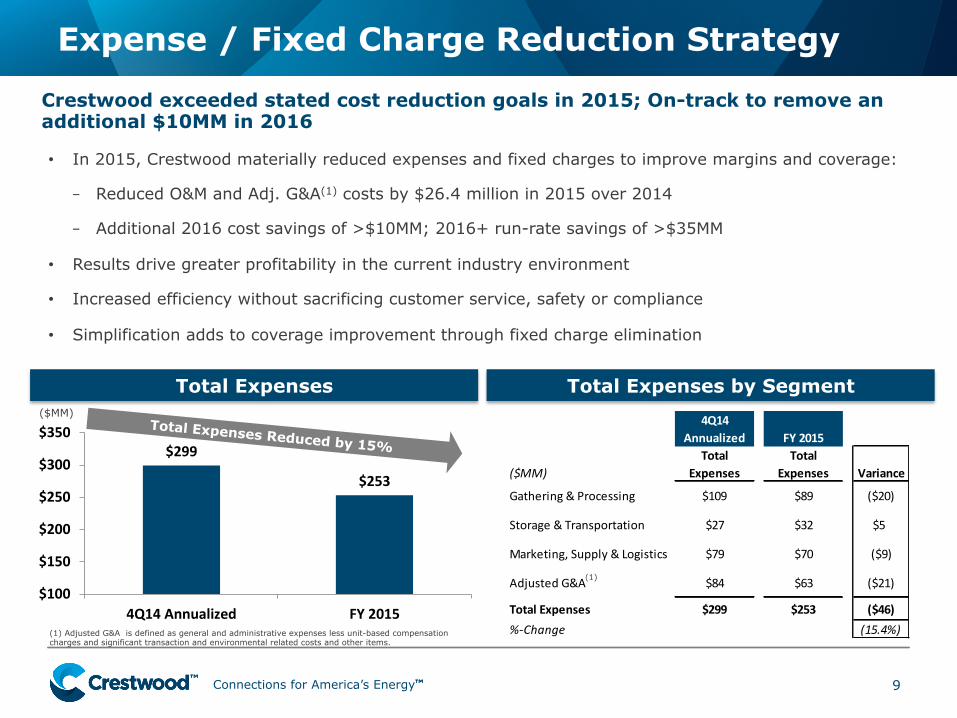
Expense / Fixed Charge Reduction Strategy
9
($MM)
Total Expenses Total Expenses by Segment
Total Expenses Reduced by 15%
Crestwood exceeded stated cost reduction goals in 2015; On-track to remove an additional $10MM in 2016
• In 2015, Crestwood materially reduced expenses and fixed charges to improve margins and coverage:
– Reduced O&M and Adj. G&A(1) costs by $26.4 million in 2015 over 2014
– Additional 2016 cost savings of >$10MM; 2016+ run-rate savings of >$35MM
• Results drive greater profitability in the current industry environment
• Increased efficiency without sacrificing customer service, safety or compliance
• Simplification adds to coverage improvement through fixed charge elimination
(1) Adjusted G&A is defined as general and administrative expenses less unit-based compensation charges and significant transaction and environmental related costs and other items.
(1)
4Q14 Annualized FY 2015
($MM)Total
ExpensesTotal
Expenses Variance
Gathering & Processing $109 $89 ($20)
Storage & Transportation $27 $32 $5
Marketing, Supply & Logistics $79 $70 ($9)
Adjusted G&A $84 $63 ($21)
Total Expenses $299 $253 ($46)%-‐Change (15.4%)
Connections for America’s Energy ™ ™ ™ ™ ™ ™
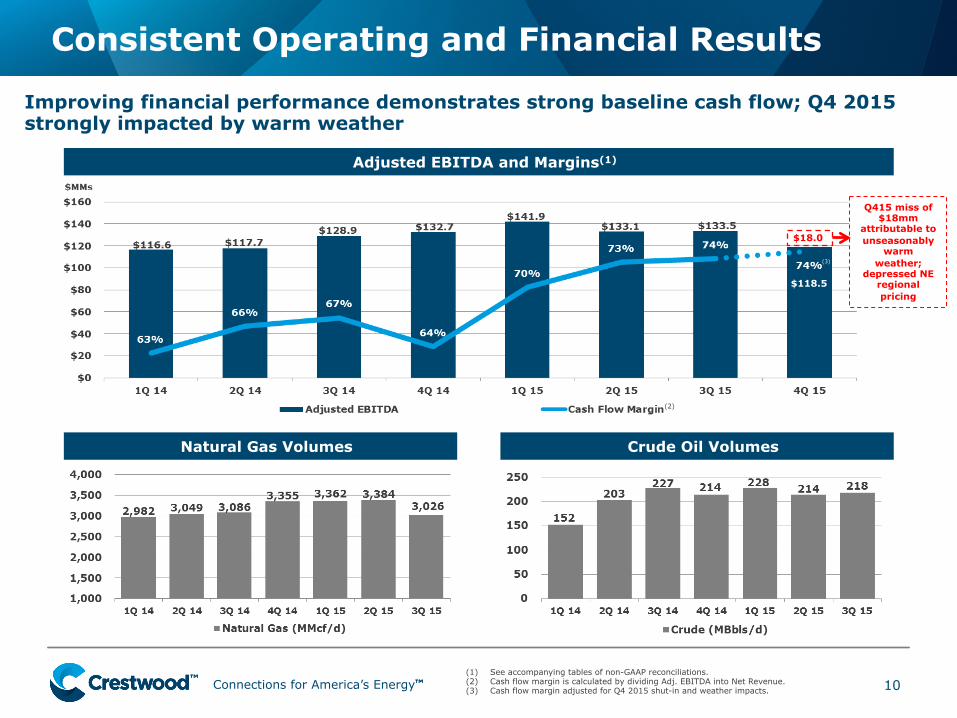
Consistent Operating and Financial Results
10 (1) See accompanying tables of non-GAAP reconciliations. (2) Cash flow margin is calculated by dividing Adj. EBITDA into Net Revenue. (3) Cash flow margin adjusted for Q4 2015 shut-in and weather impacts.
Adjusted EBITDA and Margins(1)
Natural Gas Volumes
Improving financial performance demonstrates strong baseline cash flow; Q4 2015 strongly impacted by warm weather
(2)
Crude Oil Volumes
$18.0
Q415 miss of $18mm
attributable to unseasonably
warm weather;
depressed NE regional pricing
(3)
$118.5
Connections for America’s Energy ™ ™ ™ ™ ™ ™
Capital Structure
11
Capitalization
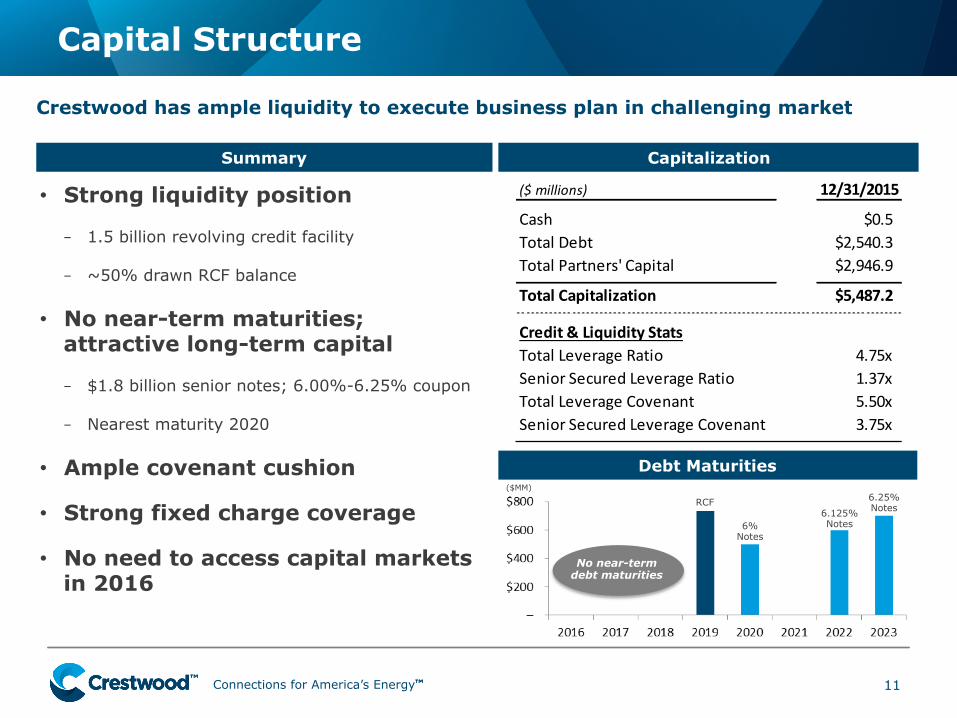
• Strong liquidity position
– 1.5 billion revolving credit facility
– ~50% drawn RCF balance
• No near-term maturities; attractive long-term capital
– $1.8 billion senior notes; 6.00%-6.25% coupon
– Nearest maturity 2020
• Ample covenant cushion
• Strong fixed charge coverage
• No need to access capital markets in 2016
Crestwood has ample liquidity to execute business plan in challenging market
Debt Maturities
No near-term debt maturities
RCF
6% Notes
6.125% Notes
6.25% Notes
($ millions) 12/31/2015
Cash $0.5Total Debt $2,540.3Total Partners' Capital $2,946.9
Total Capitalization $5,487.2
Credit & Liquidity StatsTotal Leverage Ratio 4.75xSenior Secured Leverage Ratio 1.37xTotal Leverage Covenant 5.50xSenior Secured Leverage Covenant 3.75x
Summary
($MM)
Connections for America’s Energy ™ ™ ™ ™ ™ ™
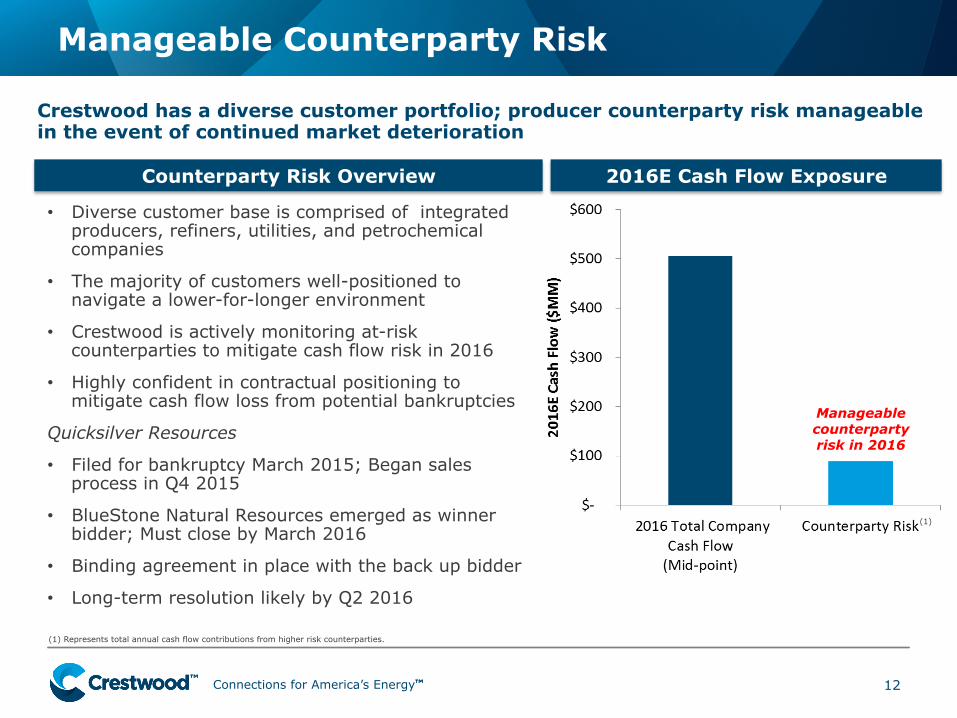
• Diverse customer base is comprised of integrated producers, refiners, utilities, and petrochemical companies
• The majority of customers well-positioned to navigate a lower-for-longer environment
• Crestwood is actively monitoring at-risk counterparties to mitigate cash flow risk in 2016
• Highly confident in contractual positioning to mitigate cash flow loss from potential bankruptcies
Quicksilver Resources
• Filed for bankruptcy March 2015; Began sales process in Q4 2015
• BlueStone Natural Resources emerged as winner bidder; Must close by March 2016
• Binding agreement in place with the back up bidder
• Long-term resolution likely by Q2 2016
Manageable Counterparty Risk
12
Crestwood has a diverse customer portfolio; producer counterparty risk manageable in the event of continued market deterioration
2016E Cash Flow Exposure Counterparty Risk Overview
Manageable counterparty risk in 2016
(1)
(1) Represents total annual cash flow contributions from higher risk counterparties.
Connections for America’s Energy ™ ™ ™ ™ ™ ™
Core Operations Update
13
Connections for America’s Energy ™ ™ ™ ™ ™ ™
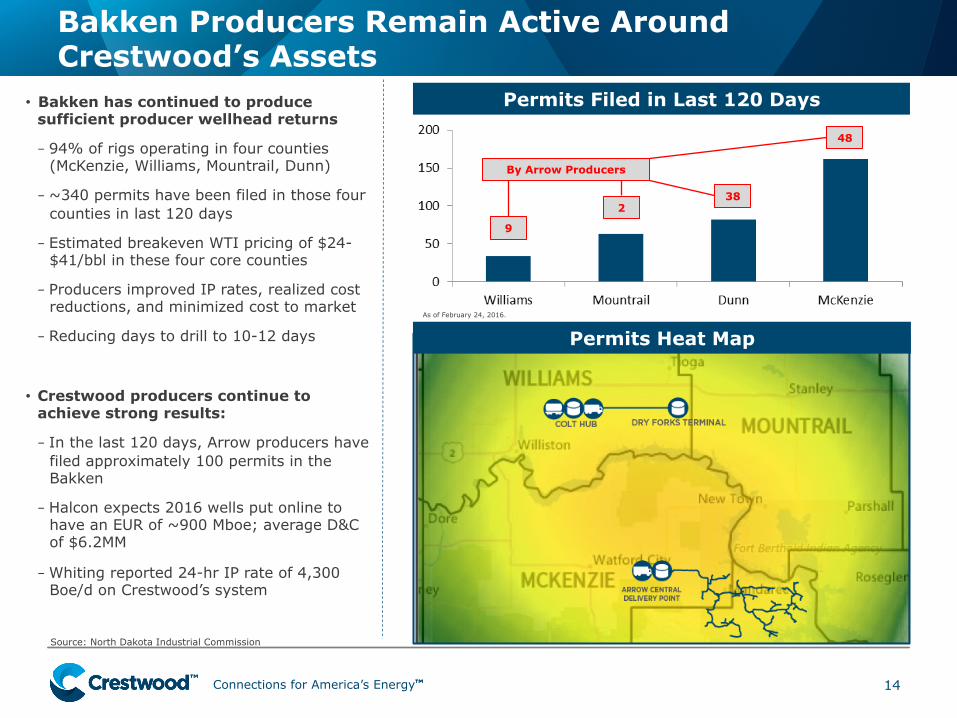
• Bakken has continued to produce sufficient producer wellhead returns
– 94% of rigs operating in four counties (McKenzie, Williams, Mountrail, Dunn)
– ~340 permits have been filed in those four counties in last 120 days
– Estimated breakeven WTI pricing of $24-$41/bbl in these four core counties
– Producers improved IP rates, realized cost reductions, and minimized cost to market
– Reducing days to drill to 10-12 days
• Crestwood producers continue to achieve strong results:
– In the last 120 days, Arrow producers have filed approximately 100 permits in the Bakken
– Halcon expects 2016 wells put online to have an EUR of ~900 Mboe; average D&C of $6.2MM
– Whiting reported 24-hr IP rate of 4,300 Boe/d on Crestwood’s system
Bakken Producers Remain Active Around Crestwood’s Assets
14
Permits Filed in Last 120 Days
Permits Heat Map
By Arrow Producers
9
2 38
48
Source: North Dakota Industrial Commission
As of February 24, 2016.
Connections for America’s Energy ™ ™ ™ ™ ™ ™
0
25
50
75
100
125
Q1:14 Q2:14 Q3:14 Q4:14 Q1:15 Q2:15 Q3:15 Q4:15
Gathe
ring Vo
lumes (M
boe/d)
Crude Oil Natural Gas Water
$0
$5
$10
$15
$20
$25
Q1:14 Q2:14 Q3:14 Q4:14 Q1:15 Q2:15 Q3:15 Q4:15
Adjusted
EBITD
A ($MM)
Bakken Arrow Gathering System
15
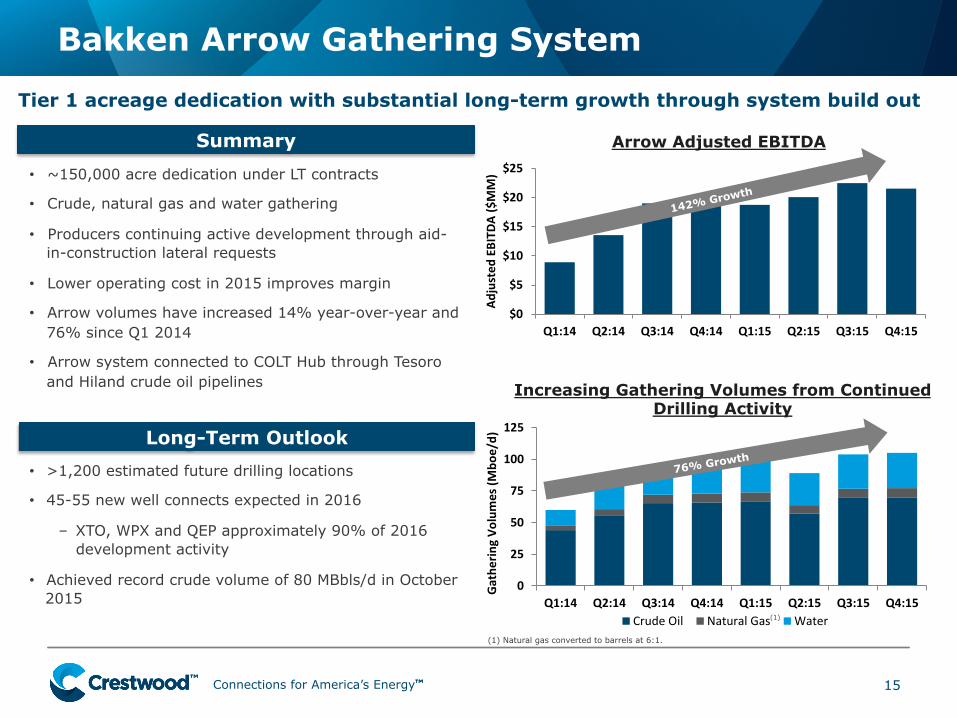
Tier 1 acreage dedication with substantial long-term growth through system build out
Summary
• ~150,000 acre dedication under LT contracts
• Crude, natural gas and water gathering
• Producers continuing active development through aid-in-construction lateral requests
• Lower operating cost in 2015 improves margin
• Arrow volumes have increased 14% year-over-year and 76% since Q1 2014
• Arrow system connected to COLT Hub through Tesoro and Hiland crude oil pipelines
Long-Term Outlook • >1,200 estimated future drilling locations
• 45-55 new well connects expected in 2016
– XTO, WPX and QEP approximately 90% of 2016 development activity
• Achieved record crude volume of 80 MBbls/d in October 2015
(1) Natural gas converted to barrels at 6:1.
Arrow Adjusted EBITDA
Increasing Gathering Volumes from Continued Drilling Activity
(1)
142% Growth
76% Growth
Connections for America’s Energy ™ ™ ™ ™ ™ ™
Bakken COLT Hub and Connector
16
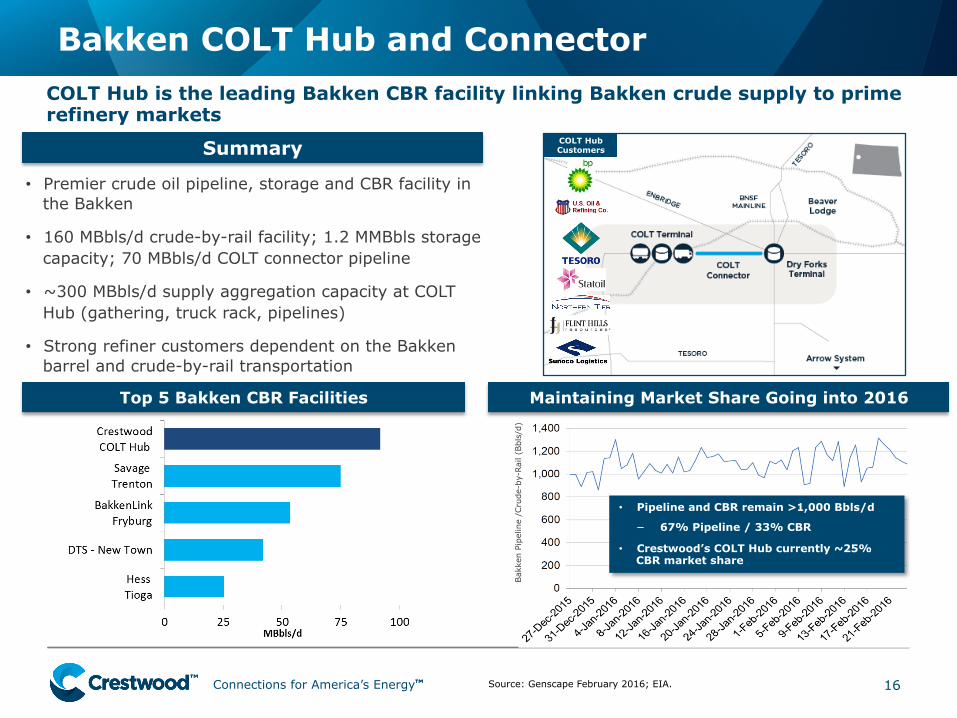
COLT Hub is the leading Bakken CBR facility linking Bakken crude supply to prime refinery markets
Source: Genscape February 2016; EIA.
Summary
• Premier crude oil pipeline, storage and CBR facility in the Bakken
• 160 MBbls/d crude-by-rail facility; 1.2 MMBbls storage capacity; 70 MBbls/d COLT connector pipeline
• ~300 MBbls/d supply aggregation capacity at COLT Hub (gathering, truck rack, pipelines)
• Strong refiner customers dependent on the Bakken barrel and crude-by-rail transportation
Top 5 Bakken CBR Facilities
COLT Hub Customers
Maintaining Market Share Going into 2016
Bak
ken
Pipe
line
/Cru
de-b
y-Ra
il (B
bls/
d)
• Pipeline and CBR remain >1,000 Bbls/d
− 67% Pipeline / 33% CBR
• Crestwood’s COLT Hub currently ~25% CBR market share
Connections for America’s Energy ™ ™ ™ ™ ™ ™
$10$15$20$25$30$35$40$45
Q1:14 Q2:14 Q3:14 Q4:14 Q1:15 Q2:15 Q3:15 Q4:15
Adjusted
EBITD
A ($MM)
17
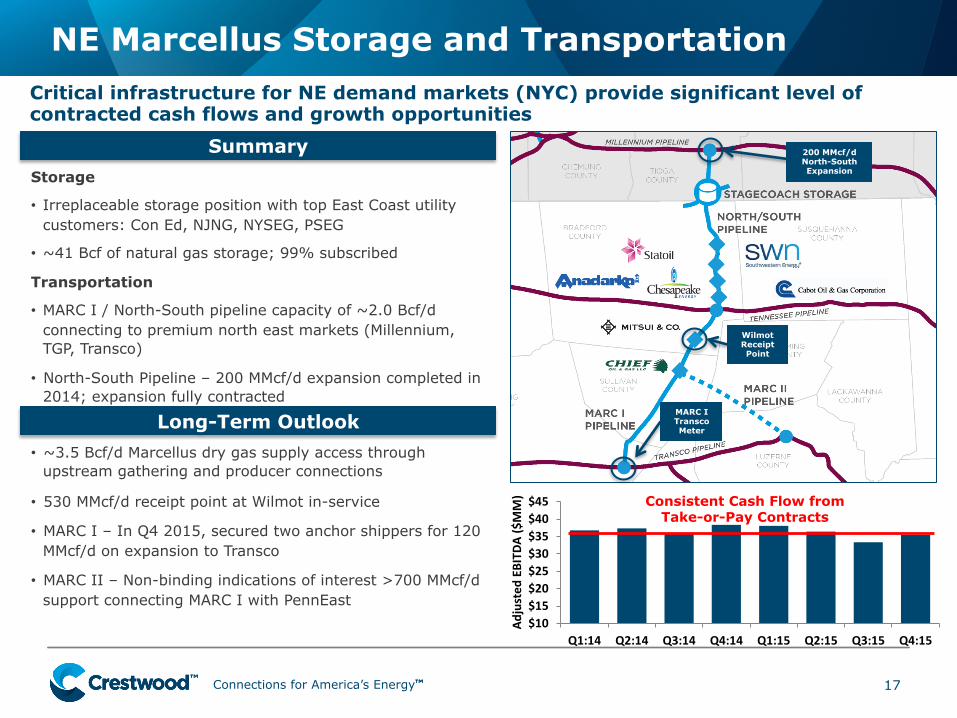
NE Marcellus Storage and Transportation
Summary 200 MMcf/d North-South Expansion
Wilmot Receipt Point
MARC I Transco Meter Long-Term Outlook
• ~3.5 Bcf/d Marcellus dry gas supply access through upstream gathering and producer connections
• 530 MMcf/d receipt point at Wilmot in-service
• MARC I – In Q4 2015, secured two anchor shippers for 120 MMcf/d on expansion to Transco
• MARC II – Non-binding indications of interest >700 MMcf/d support connecting MARC I with PennEast
Critical infrastructure for NE demand markets (NYC) provide significant level of contracted cash flows and growth opportunities
Storage
• Irreplaceable storage position with top East Coast utility customers: Con Ed, NJNG, NYSEG, PSEG
• ~41 Bcf of natural gas storage; 99% subscribed
Transportation
• MARC I / North-South pipeline capacity of ~2.0 Bcf/d connecting to premium north east markets (Millennium, TGP, Transco)
• North-South Pipeline – 200 MMcf/d expansion completed in 2014; expansion fully contracted
Consistent Cash Flow from Take-or-Pay Contracts
Connections for America’s Energy ™ ™ ™ ™ ™ ™
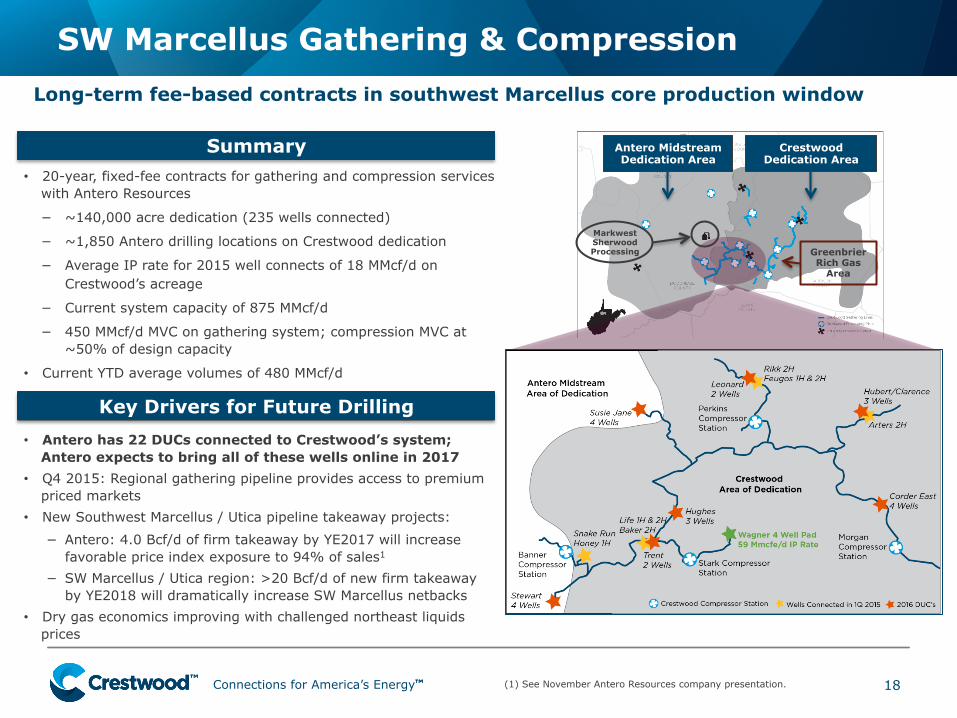
• 20-year, fixed-fee contracts for gathering and compression services with Antero Resources
− ~140,000 acre dedication (235 wells connected)
− ~1,850 Antero drilling locations on Crestwood dedication
− Average IP rate for 2015 well connects of 18 MMcf/d on Crestwood’s acreage
− Current system capacity of 875 MMcf/d
− 450 MMcf/d MVC on gathering system; compression MVC at ~50% of design capacity
• Current YTD average volumes of 480 MMcf/d
SW Marcellus Gathering & Compression
18
Long-term fee-based contracts in southwest Marcellus core production window
Summary
Markwest Sherwood Processing Greenbrier
Rich Gas Area
Crestwood Dedication Area
Antero Midstream Dedication Area
Key Drivers for Future Drilling • Antero has 22 DUCs connected to Crestwood’s system;
Antero expects to bring all of these wells online in 2017 • Q4 2015: Regional gathering pipeline provides access to premium
priced markets • New Southwest Marcellus / Utica pipeline takeaway projects:
− Antero: 4.0 Bcf/d of firm takeaway by YE2017 will increase favorable price index exposure to 94% of sales1
− SW Marcellus / Utica region: >20 Bcf/d of new firm takeaway by YE2018 will dramatically increase SW Marcellus netbacks
• Dry gas economics improving with challenged northeast liquids prices
(1) See November Antero Resources company presentation.
Connections for America’s Energy ™ ™ ™ ™ ™ ™
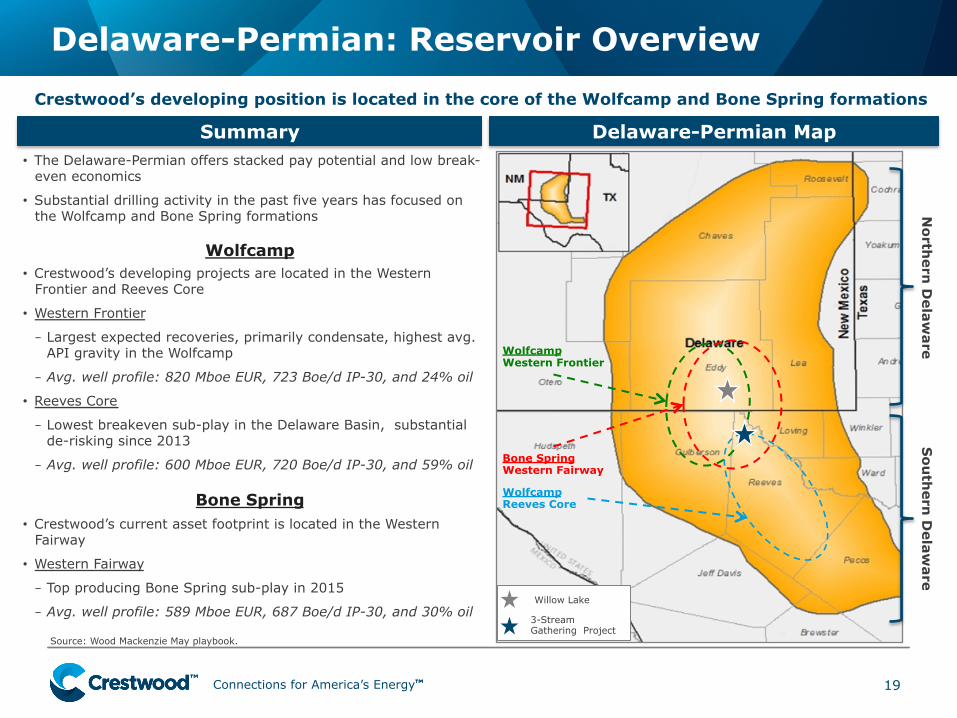
Delaware-Permian: Reservoir Overview
19
• The Delaware-Permian offers stacked pay potential and low break-even economics
• Substantial drilling activity in the past five years has focused on the Wolfcamp and Bone Spring formations
Wolfcamp Western Frontier
Bone Spring Western Fairway
Wolfcamp Reeves Core
North
ern D
elaware
Sou
thern
Delaw
are
Source: Wood Mackenzie May playbook.
Willow Lake
3-Stream Gathering Project
Summary Delaware-Permian Map
Crestwood’s developing position is located in the core of the Wolfcamp and Bone Spring formations
Wolfcamp
Bone Spring
• Crestwood’s developing projects are located in the Western Frontier and Reeves Core
• Western Frontier
– Largest expected recoveries, primarily condensate, highest avg. API gravity in the Wolfcamp
– Avg. well profile: 820 Mboe EUR, 723 Boe/d IP-30, and 24% oil
• Reeves Core
– Lowest breakeven sub-play in the Delaware Basin, substantial de-risking since 2013
– Avg. well profile: 600 Mboe EUR, 720 Boe/d IP-30, and 59% oil
• Crestwood’s current asset footprint is located in the Western Fairway
• Western Fairway
– Top producing Bone Spring sub-play in 2015
– Avg. well profile: 589 Mboe EUR, 687 Boe/d IP-30, and 30% oil
Connections for America’s Energy ™ ™ ™ ™ ™ ™
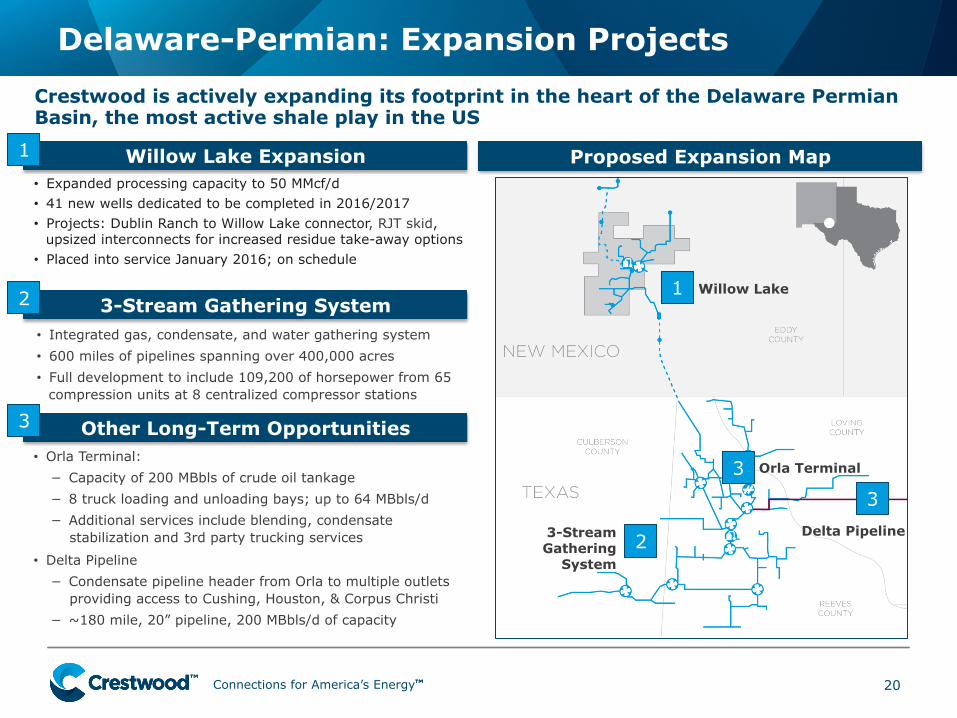
Delaware-Permian: Expansion Projects
20
Crestwood is actively expanding its footprint in the heart of the Delaware Permian Basin, the most active shale play in the US
Other Long-Term Opportunities
• Integrated gas, condensate, and water gathering system • 600 miles of pipelines spanning over 400,000 acres • Full development to include 109,200 of horsepower from 65
compression units at 8 centralized compressor stations
3-Stream Gathering System
Proposed Expansion Map
• Orla Terminal: − Capacity of 200 MBbls of crude oil tankage − 8 truck loading and unloading bays; up to 64 MBbls/d − Additional services include blending, condensate
stabilization and 3rd party trucking services
• Delta Pipeline − Condensate pipeline header from Orla to multiple outlets
providing access to Cushing, Houston, & Corpus Christi − ~180 mile, 20” pipeline, 200 MBbls/d of capacity
2
3
3
2
1
Willow Lake Expansion • Expanded processing capacity to 50 MMcf/d • 41 new wells dedicated to be completed in 2016/2017 • Projects: Dublin Ranch to Willow Lake connector, RJT skid,
upsized interconnects for increased residue take-away options • Placed into service January 2016; on schedule
1
3
Willow Lake
Delta Pipeline
Orla Terminal
3-Stream Gathering
System

Connections for America’s Energy ™ ™ ™ ™ ™ ™
• Leading marketer of Marcellus/Utica NGLs
• 2.8 MMBbls of Northeast US NGL storage capacity; >500 NGL trucking units; >1,600 NGL railcars
• Sources, transports, stores and delivers NGLs to domestic and export markets; >350 customers
• Commenced LPG exports through Marcus Hook, PA
• New LPG terminals in WY, RI and NC underway
• Strong NGL supply continues to push prices lower creating a buying opportunity to build seasonal storage
• Marketing opportunities to diversify in the West Coast and Rocky Mountain regions
21
Crestwood NGL Assets and Services
Servicing Blue Chip
Customers
Crestwood is well-positioned to benefit from continued Marcellus/Utica NGL supply growth through its integrated logistics platform including Bath and Seymour storage, ME2 pipeline capacity and Marcus Hook export capability
Summary Leading Marcellus/Utica NGL Logistics Platform
Marcus Hook NGL Exports
Bath NGL Storage
Seymour NGL Storage
601534
88
75
218
2015E = 490 MBPD
UEO-CHK
Dominion
Blue Racer
Crestwood
BP
Markwest
Connections for America’s Energy ™ ™ ™ ™ ™ ™
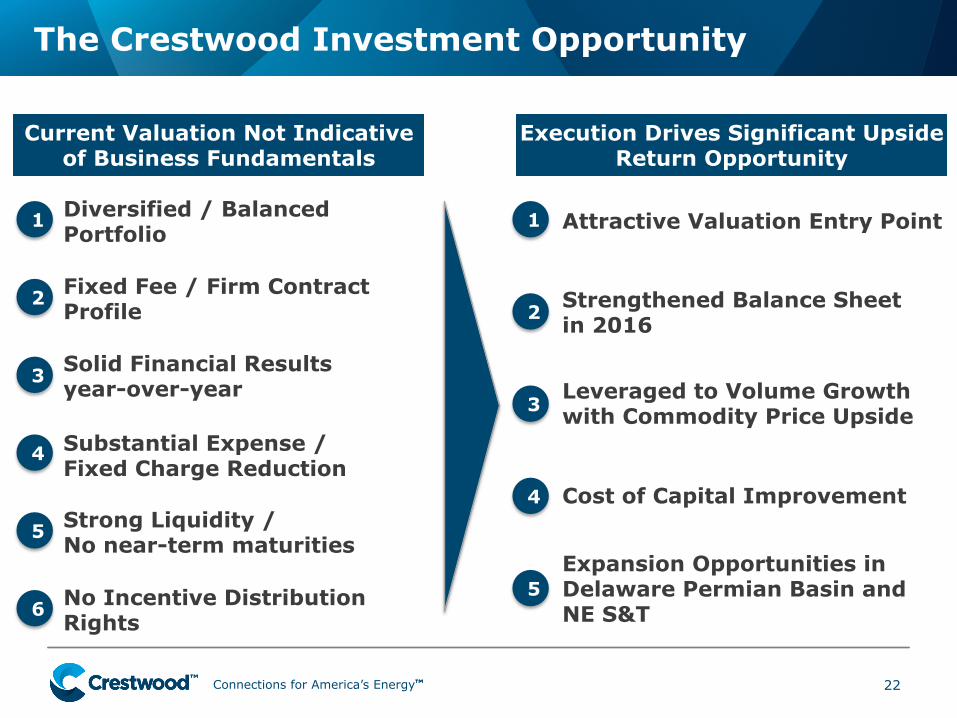
The Crestwood Investment Opportunity
No Incentive Distribution Rights
22
1
Substantial Expense / Fixed Charge Reduction
2
Solid Financial Results year-over-year 3
Diversified / Balanced Portfolio
4
Fixed Fee / Firm Contract Profile
5
Current Valuation Not Indicative of Business Fundamentals
Leveraged to Volume Growth with Commodity Price Upside
1
Cost of Capital Improvement
2
Expansion Opportunities in Delaware Permian Basin and NE S&T
3
Strengthened Balance Sheet in 2016
4
Attractive Valuation Entry Point
5
Execution Drives Significant Upside Return Opportunity
Strong Liquidity / No near-term maturities
6
Connections for America’s Energy ™ ™ ™ ™ ™ ™
Non-GAAP Reconciliations
23
Connections for America’s Energy ™ ™ ™ ™ ™ ™
CEQP Non-GAAP Reconciliations
24
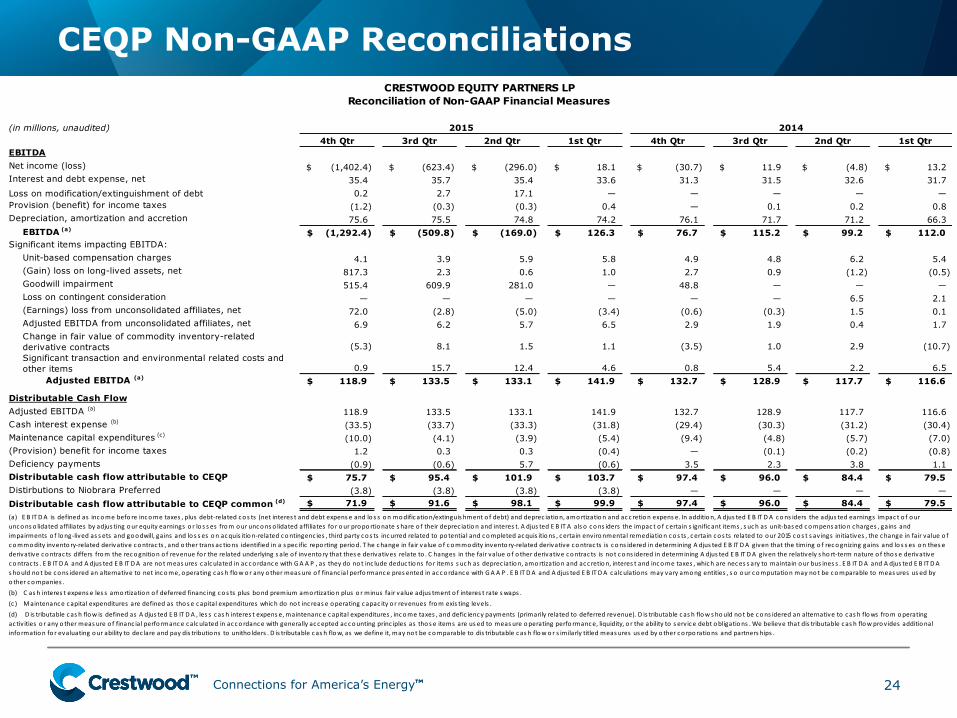
(in millions, unaudited) 4th Qtr 3rd Qtr 2nd Qtr 1st Qtr 4th Qtr 3rd Qtr 2nd Qtr 1st QtrEBITDANet income (loss) (1,402.4)$ (623.4)$ (296.0)$ 18.1$ (30.7)$ 11.9$ (4.8)$ 13.2$ Interest and debt expense, net 35.4 35.7 35.4 33.6 31.3 31.5 32.6 31.7Loss on modification/extinguishment of debt 0.2 2.7 17.1 — — — — —Provision (benefit) for income taxes (1.2) (0.3) (0.3) 0.4 — 0.1 0.2 0.8Depreciation, amortization and accretion 75.6 75.5 74.8 74.2 76.1 71.7 71.2 66.3
EBITDA (a) (1,292.4)$ (509.8)$ (169.0)$ 126.3$ 76.7$ 115.2$ 99.2$ 112.0$ Significant items impacting EBITDA:
Unit-based compensation charges 4.1 3.9 5.9 5.8 4.9 4.8 6.2 5.4(Gain) loss on long-lived assets, net 817.3 2.3 0.6 1.0 2.7 0.9 (1.2) (0.5)Goodwill impairment 515.4 609.9 281.0 — 48.8 — — —Loss on contingent consideration — — — — — — 6.5 2.1(Earnings) loss from unconsolidated affiliates, net 72.0 (2.8) (5.0) (3.4) (0.6) (0.3) 1.5 0.1Adjusted EBITDA from unconsolidated affiliates, net 6.9 6.2 5.7 6.5 2.9 1.9 0.4 1.7Change in fair value of commodity inventory-related derivative contracts (5.3) 8.1 1.5 1.1 (3.5) 1.0 2.9 (10.7)Significant transaction and environmental related costs and other items 0.9 15.7 12.4 4.6 0.8 5.4 2.2 6.5
Adjusted EBITDA (a) 118.9$ 133.5$ 133.1$ 141.9$ 132.7$ 128.9$ 117.7$ 116.6$
Distributable Cash FlowAdjusted EBITDA (a) 118.9 133.5 133.1 141.9 132.7 128.9 117.7 116.6Cash interest expense (b) (33.5) (33.7) (33.3) (31.8) (29.4) (30.3) (31.2) (30.4)Maintenance capital expenditures (c) (10.0) (4.1) (3.9) (5.4) (9.4) (4.8) (5.7) (7.0)(Provision) benefit for income taxes 1.2 0.3 0.3 (0.4) — (0.1) (0.2) (0.8)Deficiency payments (0.9) (0.6) 5.7 (0.6) 3.5 2.3 3.8 1.1Distributable cash flow attributable to CEQP 75.7$ 95.4$ 101.9$ 103.7$ 97.4$ 96.0$ 84.4$ 79.5$ Distirbutions to Niobrara Preferred (3.8) (3.8) (3.8) (3.8) — — — — Distributable cash flow attributable to CEQP common (d) 71.9$ 91.6$ 98.1$ 99.9$ 97.4$ 96.0$ 84.4$ 79.5$
(b) C as h interes t expens e les s amo rtization o f deferred financ ing co s ts plus bond premium amo rtization plus o r minus fair value adjus tment o f interes t rate s waps . (c ) Maintenance c apital expenditures are defined as tho s e c apital expenditures which do no t inc reas e operating c apac ity o r revenues from exis ting levels . (d) D is tributable c as h flow is defined as A djus ted E B IT DA , les s c as h interes t expens e, maintenance c apital expenditures , income taxes , and defic iency payments (primarily related to deferred revenue). D is tributable c as h flow s hould no t be cons idered an alternative to c as h flows from operating ac tiv ities o r any o ther meas ure o f financ ial perfo rmance c alculated in ac co rdance with generally ac cepted ac counting princ iples as tho s e items are us ed to meas ure operating perfo rmance, liquidity, o r the ability to s erv ic e debt obligations . We believe that dis tributable c as h flow pro vides additional info rmation fo r evaluating our ability to dec lare and pay dis tributions to unitho lders . D is tributable c as h flow, as we define it, may no t be comparable to dis tributable c as h flow o r s imilarly titled meas ures us ed by o ther co rpo rations and partners hips .
20142015
CRESTWOOD EQUITY PARTNERS LP Reconciliation of Non-GAAP Financial Measures
(a) E B IT DA is defined as income befo re income taxes , plus debt-‐related co s ts (net interes t and debt expens e and lo s s on modific ation/extinguis hment o f debt) and deprec iation, amo rtization and ac c retion expens e. In addition, A djus ted E B IT DA cons iders the adjus ted earnings impac t o f our uncons o lidated affiliates by adjus ting our equity earnings o r lo s s es from our uncons o lidated affiliates fo r our propo rtionate s hare o f their deprec iation and interes t. A djus ted E B IT A als o cons iders the impac t o f c ertain s ignific ant items , s uch as unit-‐bas ed compens ation charges , gains and impairments o f lo ng-‐lived as s ets and goodwill, gains and lo s s es on acquis itio n-‐related contingenc ies , third party co s ts incurred related to po tential and completed acquis itio ns , c ertain environmental remediation co s ts , c ertain co s ts related to our 2015 co s t s av ings initiatives , the change in fair value o f commodity invento ry-‐related derivative contrac ts , and o ther trans ac tions identified in a s pec ific repo rting period. T he change in fair value o f commodity invento ry-‐related derivative contrac ts is c ons idered in determining A djus ted E B IT DA given that the timing o f recognizing gains and lo s s es on thes e derivative contrac ts differs from the recognition o f revenue fo r the related underlying s ale o f invento ry that thes e derivatives relate to . C hanges in the fair value o f o ther derivative contrac ts is no t cons idered in determining A djus ted E B IT DA given the relatively s ho rt-‐term nature o f tho s e derivative contrac ts . E B IT DA and A djus ted E B IT DA are no t meas ures c alculated in ac co rdance with GA A P , as they do no t inc lude deduc tions fo r items s uch as deprec iation, amo rtization and ac c retion, interes t and income taxes , which are neces s ary to maintain our bus ines s . E B IT DA and A djus ted E B IT DA s hould no t be cons idered an alternative to net income, operating c as h flow o r any o ther meas ure o f financ ial perfo rmance pres ented in ac co rdance with GA A P . E B IT DA and A djus ted E B IT DA calculations may vary among entities , s o our computation may no t be comparable to meas ures us ed by o ther companies .