Embed Size (px)
Citation preview

Investor presentation March 2015
\ 2
Important notice
Forward-looking statements This presentation contains forward-looking statements within the meaning of Section 27A of the Securities Act of 1933 and
Section 21E of the Securities Exchange Act of 1934. All statements, other than statements of historical facts, included in this
presentation that address activities, events or developments that Markit Ltd. (“Markit” or the “Company”) expects, believes or
anticipates will or may occur in the future are forward-looking statements. Without limiting the generality of the foregoing, forward-
looking statements contained in this presentation may include the expectations of management regarding plans, strategies,
objectives and anticipated financial and operating results of the Company. Markit’s estimates and forward-looking statements are
mainly based on its current expectations and estimates of future events and trends, which affect or may affect its businesses and
operations. Although Markit believes that these estimates and forward-looking statements are based upon reasonable
assumptions, they are subject to several risks and uncertainties and are made in light of information currently available to Markit.
When used in this presentation, the words “anticipate,” “believe,” “intend,” “expect,” “plan,” “will” or other similar words are
intended to identify forward-looking statements. Such statements are subject to a number of assumptions, risks and uncertainties,
many of which are beyond the control of Markit, which may cause actual results to differ materially from those implied or
expressed by the forward-looking statements. Further information on such assumptions, risks and uncertainties is available in
Markit’s filings with the United States Securities and Exchange Commission (“SEC”). Markit’s SEC filings are available at
www.sec.gov or on the investor relations section of its website, www.markit.com. Markit undertakes no obligation and does not
intend to update these forward-looking statements to reflect events or circumstances occurring after the date of this presentation.
You are cautioned not to place undue reliance on these forward-looking statements, which speak only as of the date of this press
release. All forward-looking statements are qualified in their entirety by this cautionary statement.
Non-IFRS financial measures This presentation also includes measures defined by the SEC as non-IFRS financial measures. Markit believes that these non-
IFRS measures can provide useful supplemental information to securities analysts, investors and other interested parties
regarding financial and business trends relating to its financial condition and results of operations when read in conjunction with
the company’s reported results. Definitions and reconciliations of these non-IFRS measures to most directly comparable IFRS
financial measures are available in the Appendix of this presentation and in Markit’s Annual Report on form 20-F.
Copyright ©2015, Markit Group Limited. All rights reserved and all intellectual property rights are retained by Markit.
\ 3
Markit overview
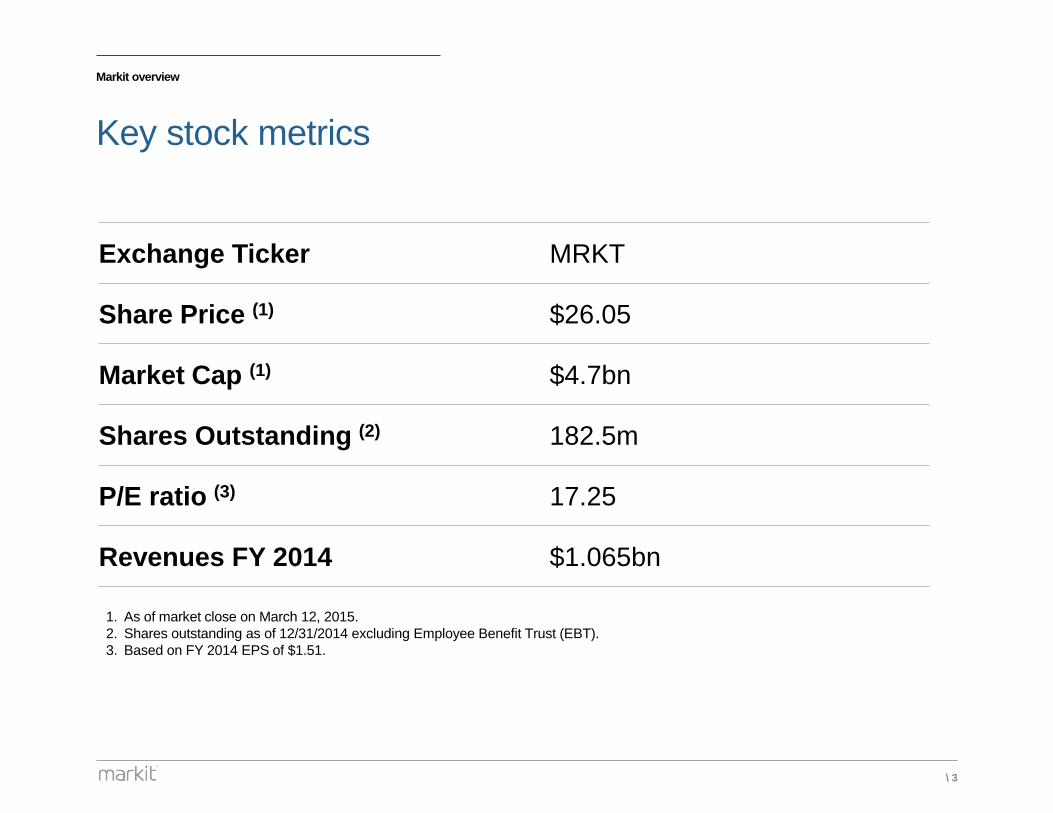
Key stock metrics
Exchange Ticker MRKT
Share Price (1) $26.05
Market Cap (1) $4.7bn
Shares Outstanding (2) 182.5m
P/E ratio (3) 17.25
Revenues FY 2014 $1.065bn
1. As of market close on March 12, 2015.
2. Shares outstanding as of 12/31/2014 excluding Employee Benefit Trust (EBT).
3. Based on FY 2014 EPS of $1.51.
\ 4
2014 overview
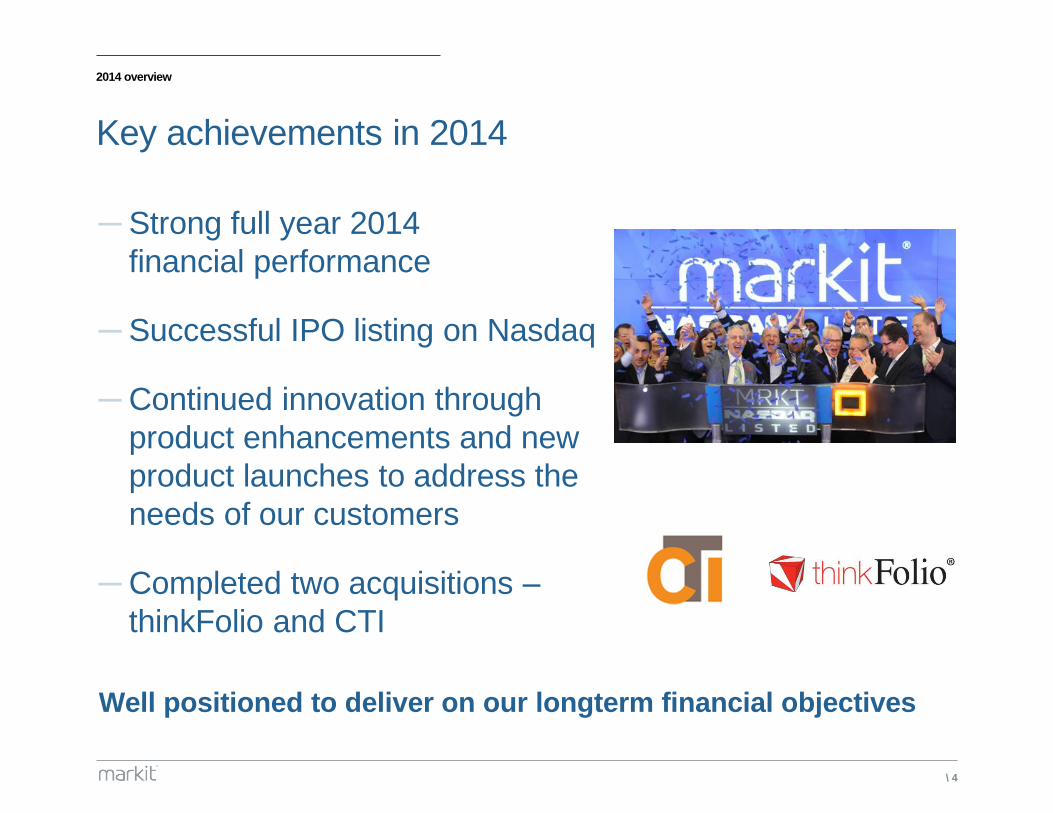
Key achievements in 2014
─ Strong full year 2014
financial performance
─ Successful IPO listing on Nasdaq
─ Continued innovation through
product enhancements and new
product launches to address the
needs of our customers
─ Completed two acquisitions –
thinkFolio and CTI
Well positioned to deliver on our longterm financial objectives
\ 5
Markit at a glance
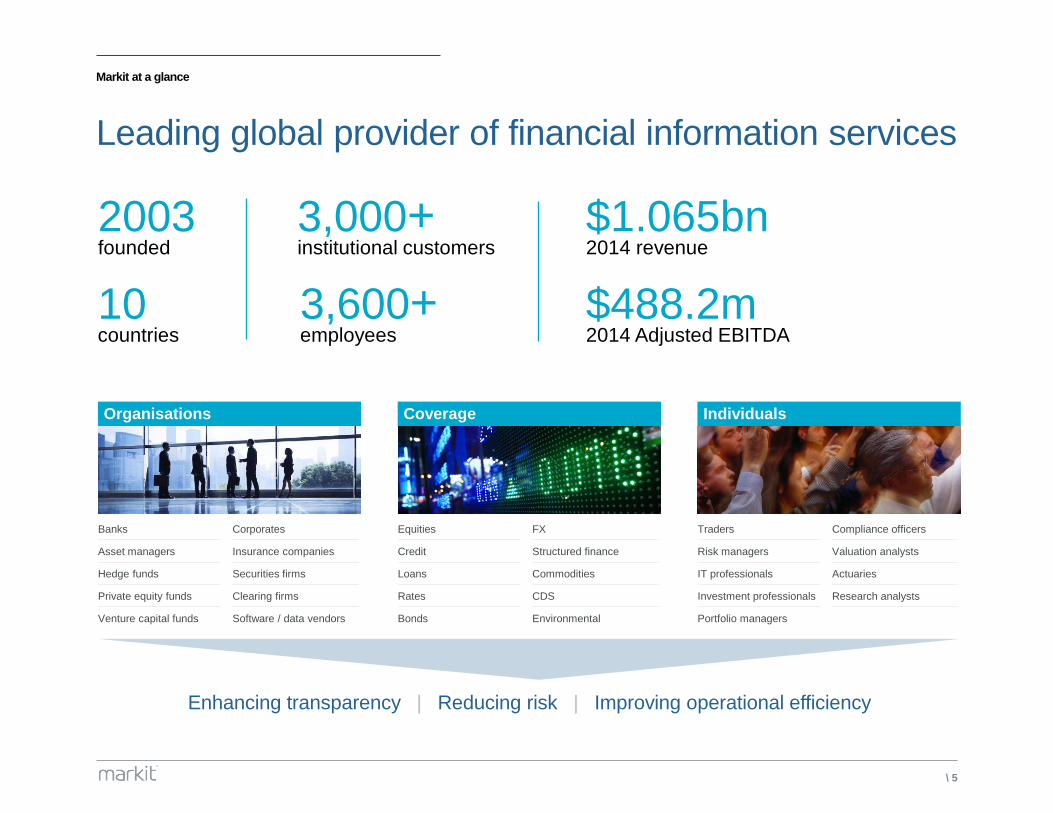
Leading global provider of financial information services
Enhancing transparency | Reducing risk | Improving operational efficiency
Organisations Individuals Coverage
Banks Corporates
Asset managers Insurance companies
Hedge funds Securities firms
Private equity funds Clearing firms
Venture capital funds Software / data vendors
Equities FX
Credit Structured finance
Loans Commodities
Rates CDS
Bonds Environmental
Traders Compliance officers
Risk managers Valuation analysts
IT professionals Actuaries
Investment professionals Research analysts
Portfolio managers
2003 founded
10 countries
3,000+ institutional customers
3,600+ employees
$1.065bn 2014 revenue
$488.2m 2014 Adjusted EBITDA
\ 6
Our divisions
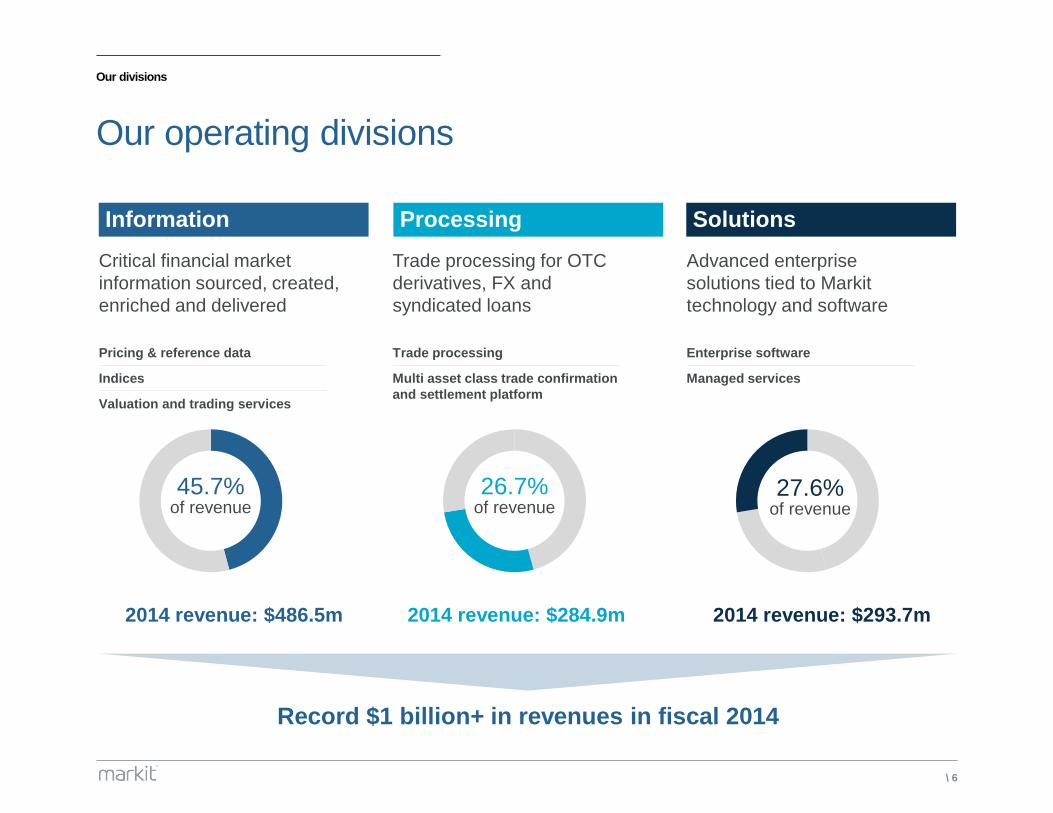
Our operating divisions
Critical financial market
information sourced, created,
enriched and delivered
Trade processing for OTC
derivatives, FX and
syndicated loans
Advanced enterprise
solutions tied to Markit
technology and software
Information Processing Solutions
45.7% of revenue
26.7% of revenue
27.6% of revenue
Pricing & reference data
Indices
Valuation and trading services
Trade processing
Multi asset class trade confirmation
and settlement platform
Enterprise software
Managed services
2014 revenue: $486.5m 2014 revenue: $284.9m 2014 revenue: $293.7m
Record $1 billion+ in revenues in fiscal 2014
\ 7
Customer focus
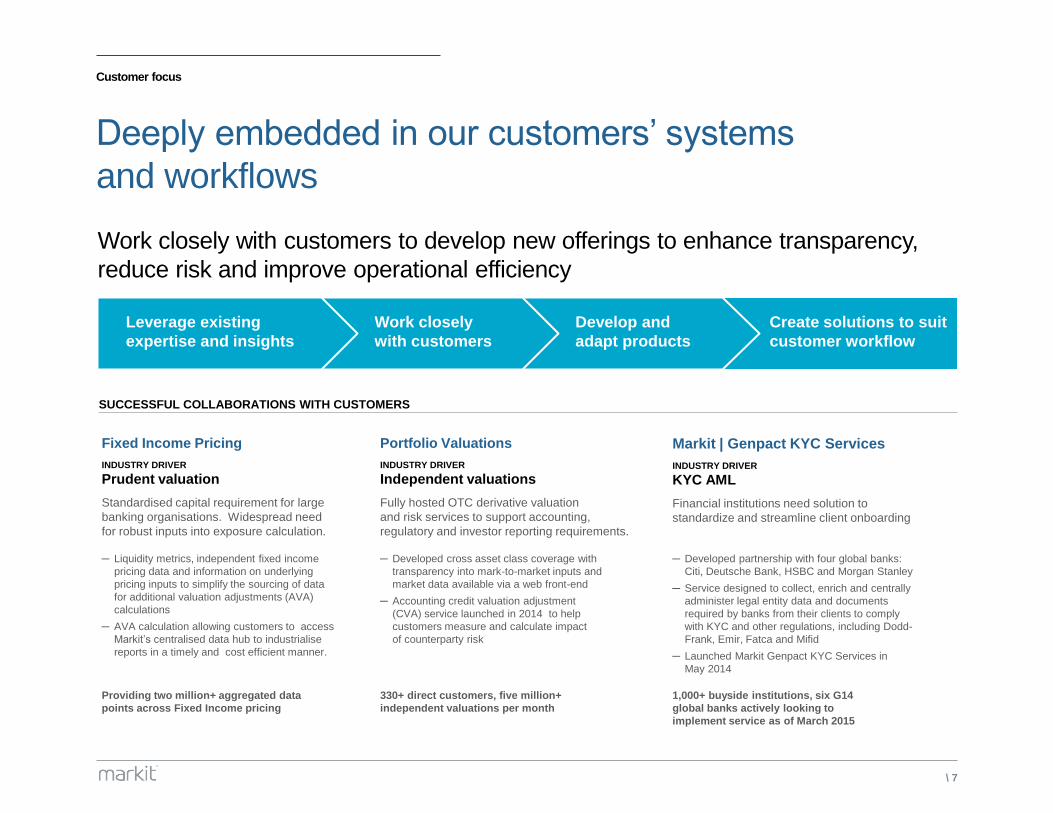
Deeply embedded in our customers’ systems
and workflows
Create solutions to suit
customer workflow
Develop and
adapt products
Work closely
with customers
Leverage existing
expertise and insights
Work closely with customers to develop new offerings to enhance transparency,
reduce risk and improve operational efficiency
SUCCESSFUL COLLABORATIONS WITH CUSTOMERS
Fixed Income Pricing
INDUSTRY DRIVER
Prudent valuation
Standardised capital requirement for large
banking organisations. Widespread need
for robust inputs into exposure calculation.
Portfolio Valuations
INDUSTRY DRIVER
Independent valuations
Fully hosted OTC derivative valuation
and risk services to support accounting,
regulatory and investor reporting requirements.
Markit | Genpact KYC Services
INDUSTRY DRIVER
KYC AML
Financial institutions need solution to
standardize and streamline client onboarding
─ Liquidity metrics, independent fixed income
pricing data and information on underlying
pricing inputs to simplify the sourcing of data
for additional valuation adjustments (AVA)
calculations
─ AVA calculation allowing customers to access
Markit’s centralised data hub to industrialise
reports in a timely and cost efficient manner.
─ Developed cross asset class coverage with
transparency into mark-to-market inputs and
market data available via a web front-end
─ Accounting credit valuation adjustment
(CVA) service launched in 2014 to help
customers measure and calculate impact
of counterparty risk
─ Developed partnership with four global banks:
Citi, Deutsche Bank, HSBC and Morgan Stanley
─ Service designed to collect, enrich and centrally
administer legal entity data and documents
required by banks from their clients to comply
with KYC and other regulations, including Dodd-
Frank, Emir, Fatca and Mifid
─ Launched Markit Genpact KYC Services in
May 2014
Providing two million+ aggregated data
points across Fixed Income pricing
330+ direct customers, five million+
independent valuations per month
1,000+ buyside institutions, six G14
global banks actively looking to
implement service as of March 2015
\ 8
Industry trends
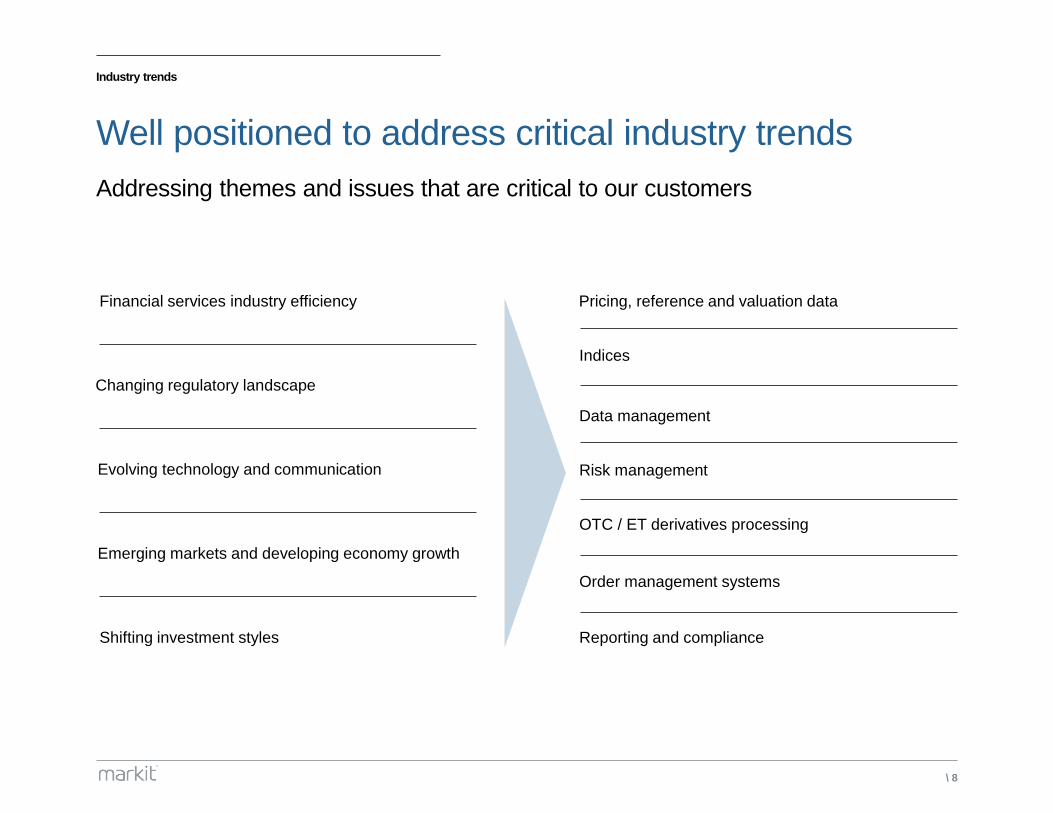
Well positioned to address critical industry trends
Addressing themes and issues that are critical to our customers
Financial services industry efficiency
Emerging markets and developing economy growth
Shifting investment styles
Changing regulatory landscape
Evolving technology and communication
OTC / ET derivatives processing
Reporting and compliance
Data management
Risk management
Order management systems
Indices
Pricing, reference and valuation data
\ 9
Management team
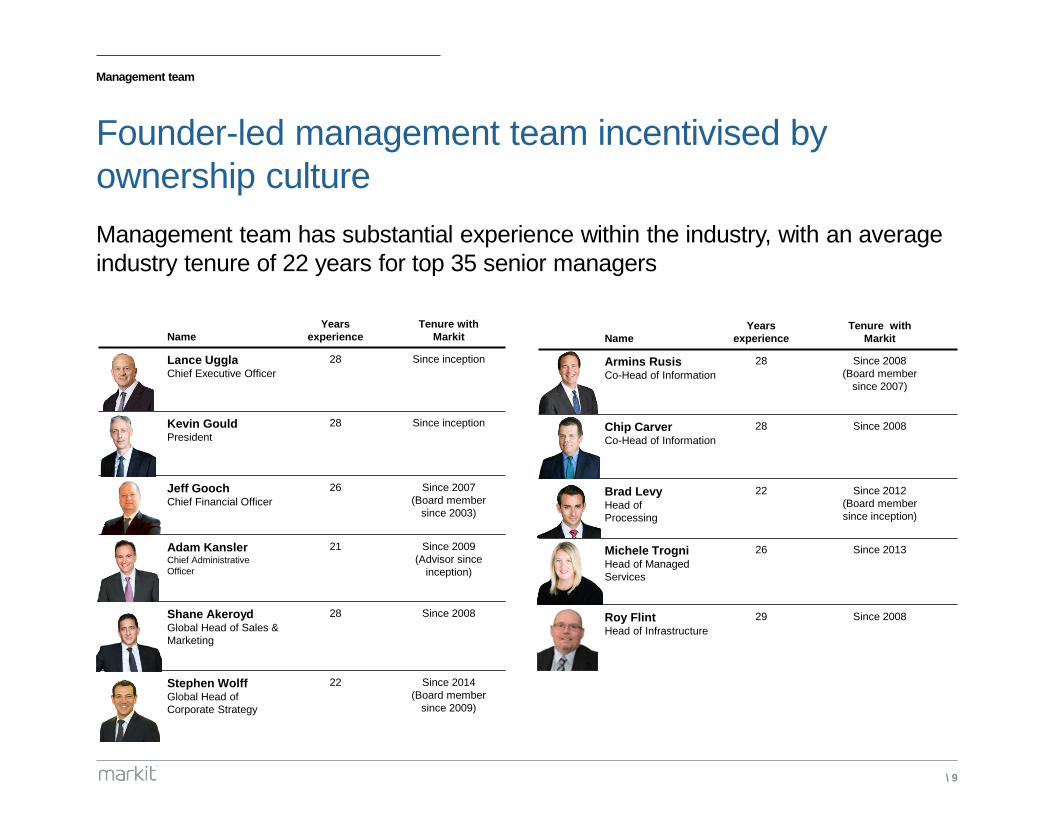
Founder-led management team incentivised by
ownership culture
Management team has substantial experience within the industry, with an average
industry tenure of 22 years for top 35 senior managers
Name
Years
experience
Tenure with
Markit
Armins Rusis Co-Head of Information
28 Since 2008
(Board member
since 2007)
Chip Carver Co-Head of Information
28 Since 2008
Brad Levy Head of
Processing
22 Since 2012
(Board member
since inception)
Michele Trogni Head of Managed
Services
26 Since 2013
Roy Flint Head of Infrastructure
29 Since 2008
Name
Years
experience
Tenure with
Markit
Lance Uggla Chief Executive Officer
28 Since inception
Kevin Gould President
28 Since inception
Jeff Gooch Chief Financial Officer
26 Since 2007
(Board member
since 2003)
Adam Kansler Chief Administrative
Officer
21 Since 2009
(Advisor since
inception)
Shane Akeroyd Global Head of Sales &
Marketing
28 Since 2008
Stephen Wolff Global Head of
Corporate Strategy
22 Since 2014
(Board member
since 2009)
\ 10
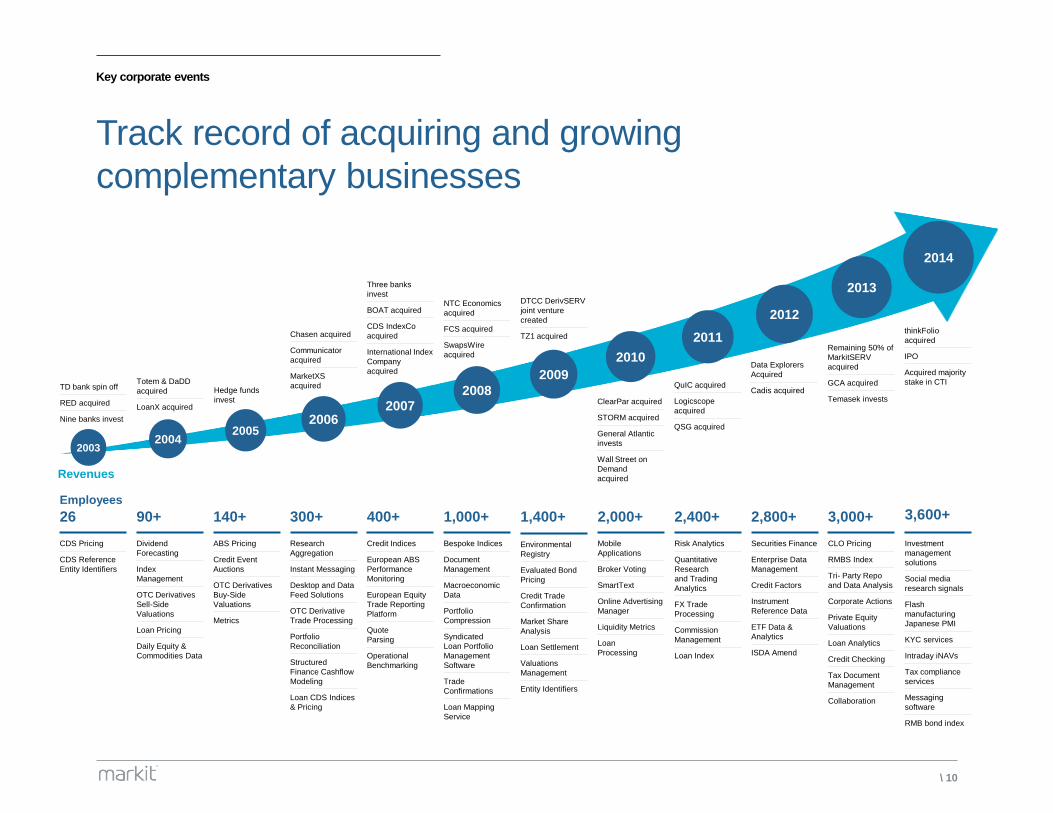
Key corporate events
Track record of acquiring and growing
complementary businesses
CDS Pricing
CDS Reference
Entity Identifiers
Dividend
Forecasting
Index
Management
OTC Derivatives
Sell-Side
Valuations
Loan Pricing
Daily Equity &
Commodities Data
ABS Pricing
Credit Event
Auctions
OTC Derivatives
Buy-Side
Valuations
Metrics
Research
Aggregation
Instant Messaging
Desktop and Data
Feed Solutions
OTC Derivative
Trade Processing
Portfolio
Reconciliation
Structured
Finance Cashflow
Modeling
Loan CDS Indices
& Pricing
Bespoke Indices
Document
Management
Macroeconomic
Data
Portfolio
Compression
Syndicated
Loan Portfolio
Management
Software
Trade
Confirmations
Loan Mapping
Service
Environmental
Registry
Evaluated Bond
Pricing
Credit Trade
Confirmation
Market Share
Analysis
Loan Settlement
Valuations
Management
Entity Identifiers
Mobile
Applications
Broker Voting
SmartText
Online Advertising
Manager
Liquidity Metrics
Loan
Processing
Risk Analytics
Quantitative
Research
and Trading
Analytics
FX Trade
Processing
Commission
Management
Loan Index
Securities Finance
Enterprise Data
Management
Credit Factors
Instrument
Reference Data
ETF Data &
Analytics
ISDA Amend
TD bank spin off
RED acquired
Nine banks invest
Totem & DaDD
acquired
LoanX acquired
Hedge funds
invest
Chasen acquired
Communicator
acquired
MarketXS
acquired
Three banks
invest
BOAT acquired
CDS IndexCo
acquired
International Index
Company
acquired
NTC Economics
acquired
FCS acquired
SwapsWire
acquired
DTCC DerivSERV
joint venture
created
TZ1 acquired
ClearPar acquired
STORM acquired
General Atlantic
invests
Wall Street on
Demand
acquired
QuIC acquired
Logicscope
acquired
QSG acquired
Data Explorers
Acquired
Cadis acquired
26 90+ 140+ 300+ 400+ 1,000+ 1,400+ 2,000+ 2,400+ 2,800+ 3,000+
CLO Pricing
RMBS Index
Tri- Party Repo
and Data Analysis
Corporate Actions
Private Equity
Valuations
Loan Analytics
Credit Checking
Tax Document
Management
Collaboration
Remaining 50% of
MarkitSERV
acquired
GCA acquired
Temasek invests
Credit Indices
European ABS
Performance
Monitoring
European Equity
Trade Reporting
Platform
Quote
Parsing
Operational
Benchmarking
2004 2005
2006
2008
2009
2011
2012
2013
2007
2010
2003
Investment
management
solutions
Social media
research signals
Flash
manufacturing
Japanese PMI
KYC services
Intraday iNAVs
Tax compliance
services
Messaging
software
RMB bond index
2014
thinkFolio
acquired
IPO
Acquired majority
stake in CTI
3,600+ Employees
Revenues
\ 11
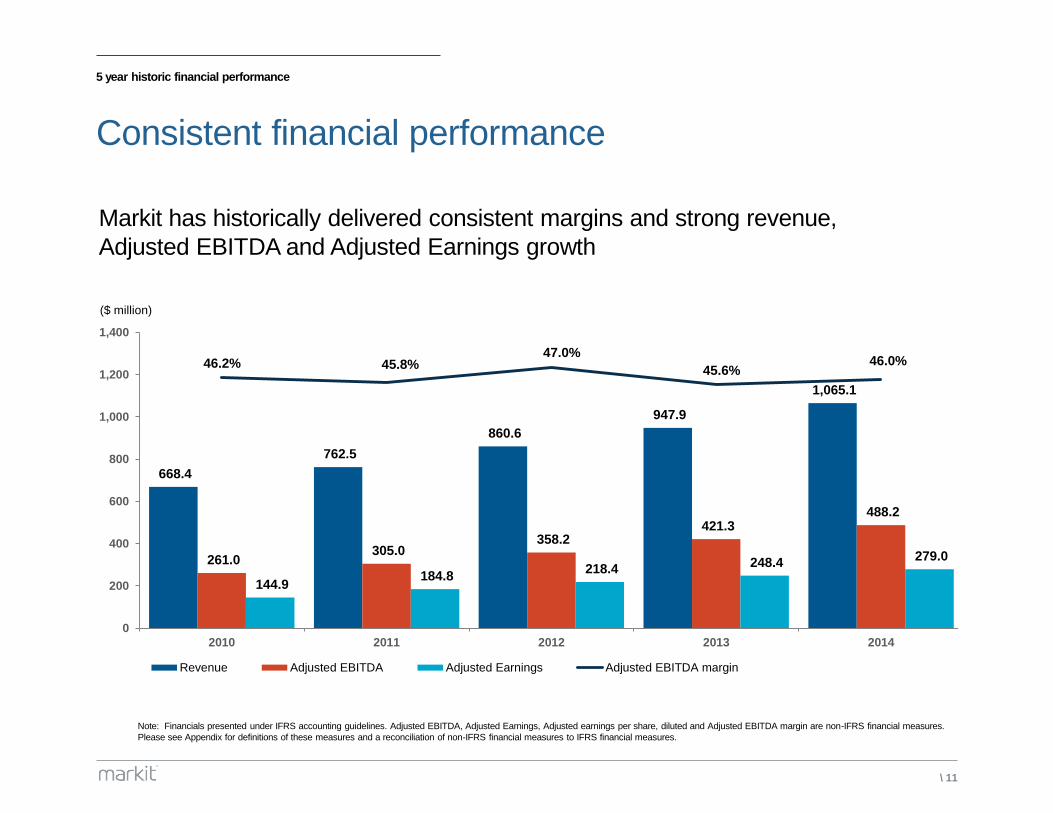
5 year historic financial performance
Consistent financial performance
Note: Financials presented under IFRS accounting guidelines. Adjusted EBITDA, Adjusted Earnings, Adjusted earnings per share, diluted and Adjusted EBITDA margin are non-IFRS financial measures.
Please see Appendix for definitions of these measures and a reconciliation of non-IFRS financial measures to IFRS financial measures.
($ million)
668.4
762.5
860.6
947.9
1,065.1
261.0 305.0
358.2 421.3
488.2
144.9 184.8
218.4 248.4
279.0
46.2% 45.8% 47.0%
45.6% 46.0%
25%
30%
35%
40%
45%
50%
0
200
400
600
800
1,000
1,200
1,400
2010 2011 2012 2013 2014
Revenue Adjusted EBITDA Adjusted Earnings Adjusted EBITDA margin
Markit has historically delivered consistent margins and strong revenue,
Adjusted EBITDA and Adjusted Earnings growth
\ 12
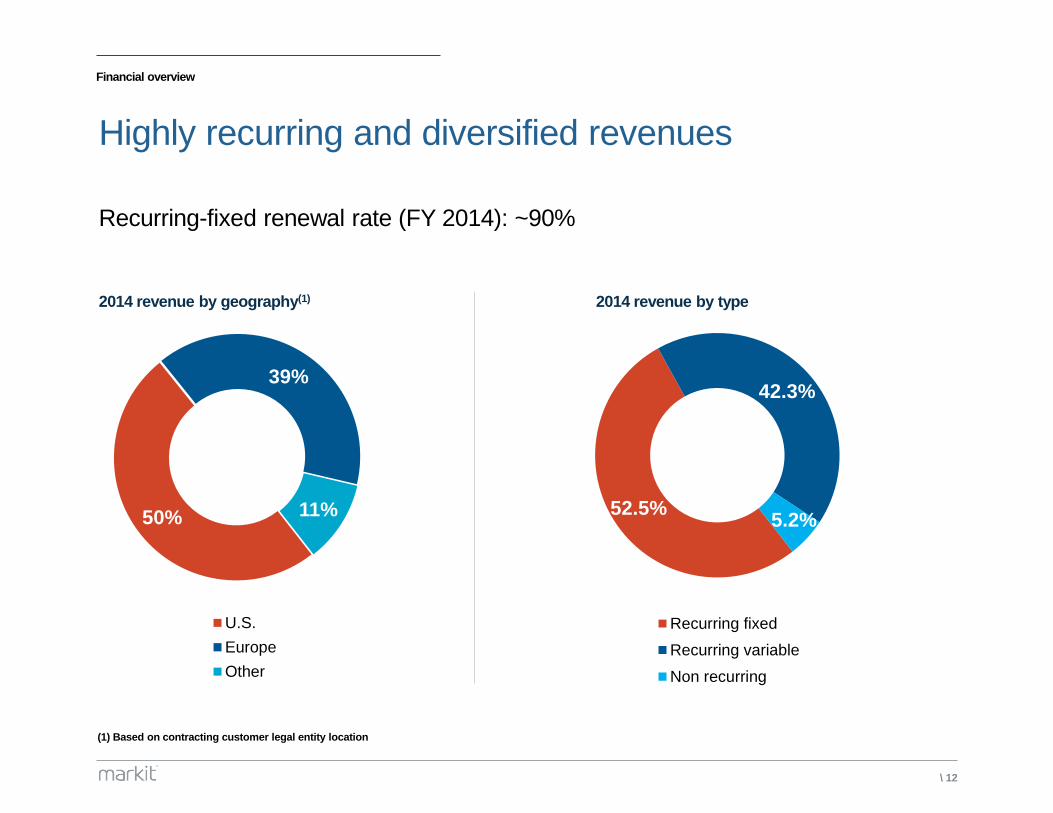
Financial overview
Highly recurring and diversified revenues
Recurring-fixed renewal rate (FY 2014): ~90%
(1) Based on contracting customer legal entity location
52.5%
42.3%
5.2%
Recurring fixed
Recurring variable
Non recurring
50%
39%
11%
U.S.
Europe
Other
2014 revenue by type 2014 revenue by geography(1)
\ 13
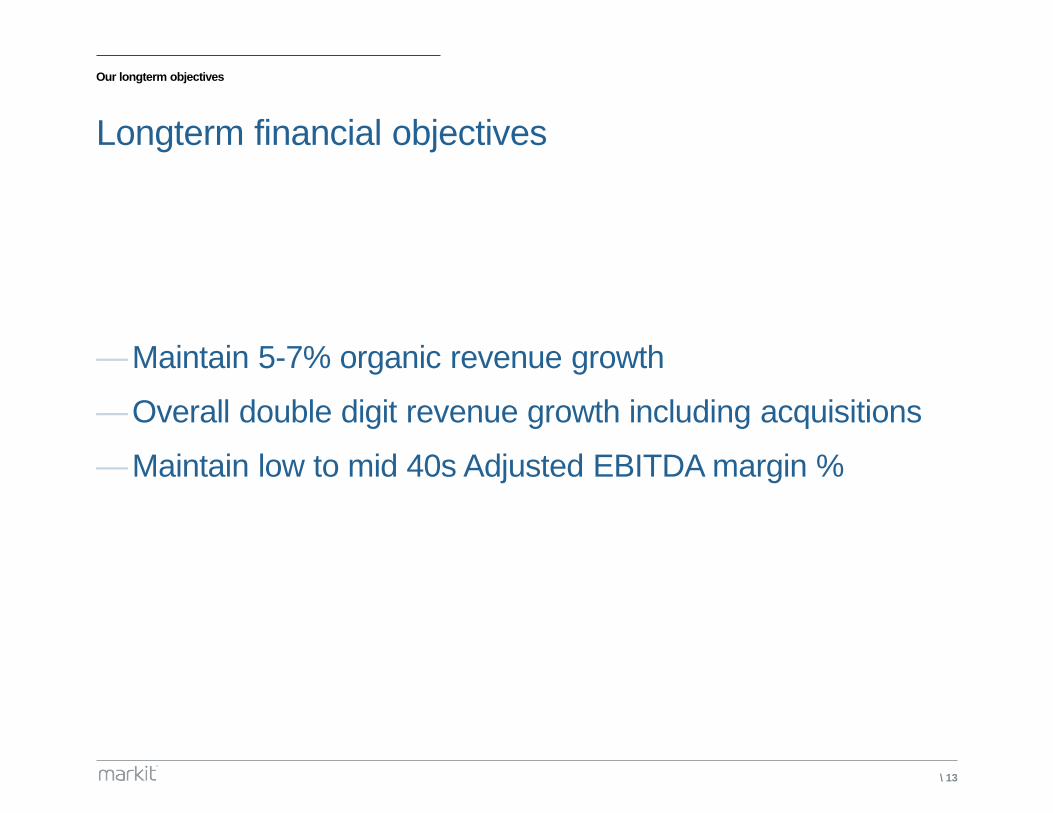
Our longterm objectives
Longterm financial objectives
—Maintain 5-7% organic revenue growth
—Overall double digit revenue growth including acquisitions
—Maintain low to mid 40s Adjusted EBITDA margin %
\ 14
Key investment highlights
Why invest in Markit?
— Trusted partner for diversified, global customer base
— Well positioned to address critical industry trends
— Founder-led experienced management team incentivised
by ownership culture
— Demonstrated ability for product innovation and
accretive acquisitions
— Attractive financial model

\ 15
Business segment overview
\ 16
Divisions
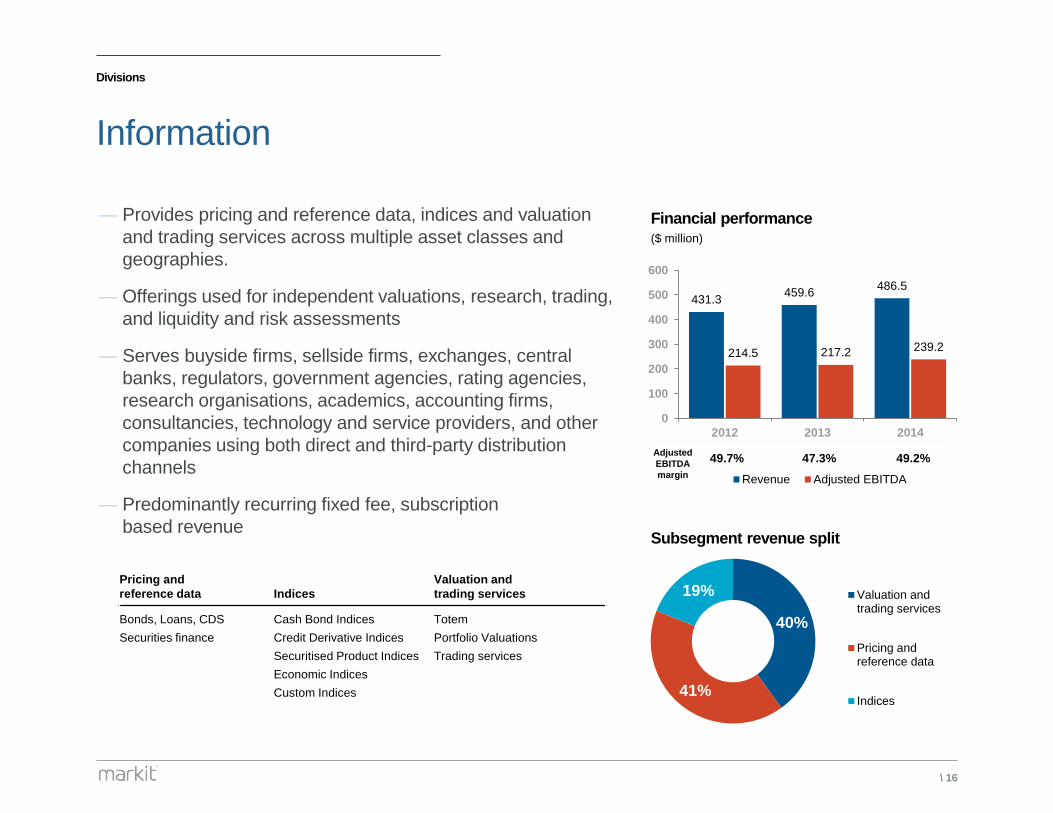
Information
431.3 459.6
486.5
214.5 217.2 239.2
0
100
200
300
400
500
600
2012 2013 2014
Revenue Adjusted EBITDA
— Provides pricing and reference data, indices and valuation
and trading services across multiple asset classes and
geographies.
— Offerings used for independent valuations, research, trading,
and liquidity and risk assessments
— Serves buyside firms, sellside firms, exchanges, central
banks, regulators, government agencies, rating agencies,
research organisations, academics, accounting firms,
consultancies, technology and service providers, and other
companies using both direct and third-party distribution
channels
— Predominantly recurring fixed fee, subscription
based revenue
49.7% 47.3% 49.2%
Financial performance ($ million)
40%
41%
19% Valuation andtrading services
Pricing andreference data
Indices
Subsegment revenue split
Pricing and
reference data Indices
Valuation and
trading services
Bonds, Loans, CDS
Securities finance
Cash Bond Indices
Credit Derivative Indices
Securitised Product Indices
Economic Indices
Custom Indices
Totem
Portfolio Valuations
Trading services
Adjusted
EBITDA
margin
\ 17
Divisions
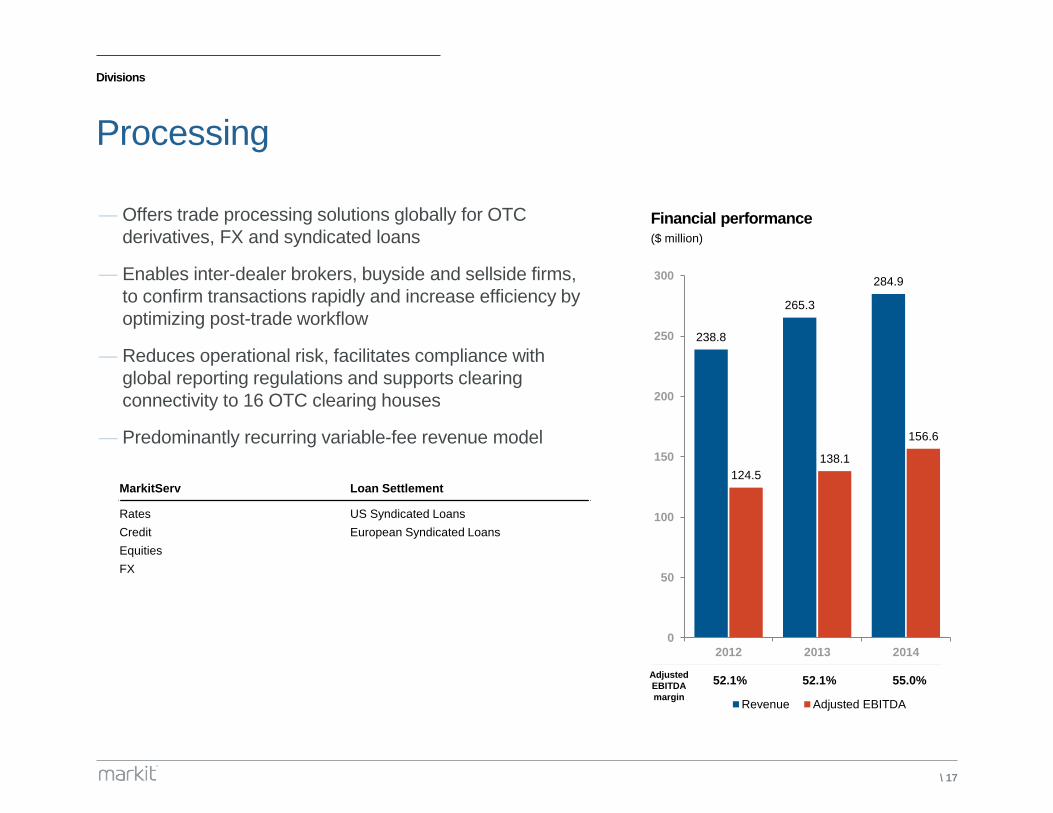
Processing
— Offers trade processing solutions globally for OTC
derivatives, FX and syndicated loans
— Enables inter-dealer brokers, buyside and sellside firms,
to confirm transactions rapidly and increase efficiency by
optimizing post-trade workflow
— Reduces operational risk, facilitates compliance with
global reporting regulations and supports clearing
connectivity to 16 OTC clearing houses
— Predominantly recurring variable-fee revenue model
MarkitServ Loan Settlement
Rates
Credit
Equities
FX
US Syndicated Loans
European Syndicated Loans
238.8
265.3
284.9
124.5
138.1
156.6
0
50
100
150
200
250
300
2012 2013 2014
Revenue Adjusted EBITDA
Financial performance ($ million)
52.1% 52.1% 55.0% Adjusted
EBITDA
margin
\ 18
Divisions
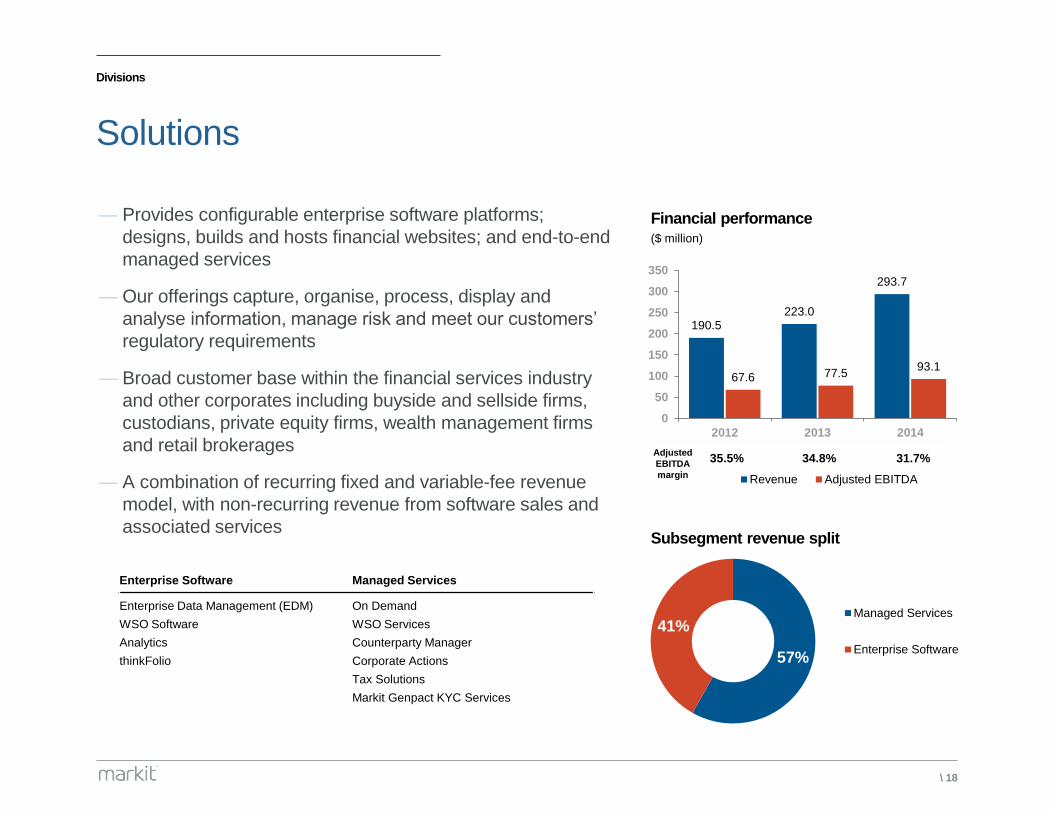
Solutions
190.5 223.0
293.7
67.6 77.5 93.1
0
50
100
150
200
250
300
350
2012 2013 2014
Revenue Adjusted EBITDA
— Provides configurable enterprise software platforms;
designs, builds and hosts financial websites; and end-to-end
managed services
— Our offerings capture, organise, process, display and
analyse information, manage risk and meet our customers’
regulatory requirements
— Broad customer base within the financial services industry
and other corporates including buyside and sellside firms,
custodians, private equity firms, wealth management firms
and retail brokerages
— A combination of recurring fixed and variable-fee revenue
model, with non-recurring revenue from software sales and
associated services
Financial performance ($ million)
57%
41% Managed Services
Enterprise Software
Subsegment revenue split
Enterprise Software Managed Services
Enterprise Data Management (EDM)
WSO Software
Analytics
thinkFolio
On Demand
WSO Services
Counterparty Manager
Corporate Actions
Tax Solutions
Markit Genpact KYC Services
35.5% 34.8% 31.7% Adjusted
EBITDA
margin
\ 19
Sub-segment revenue summary
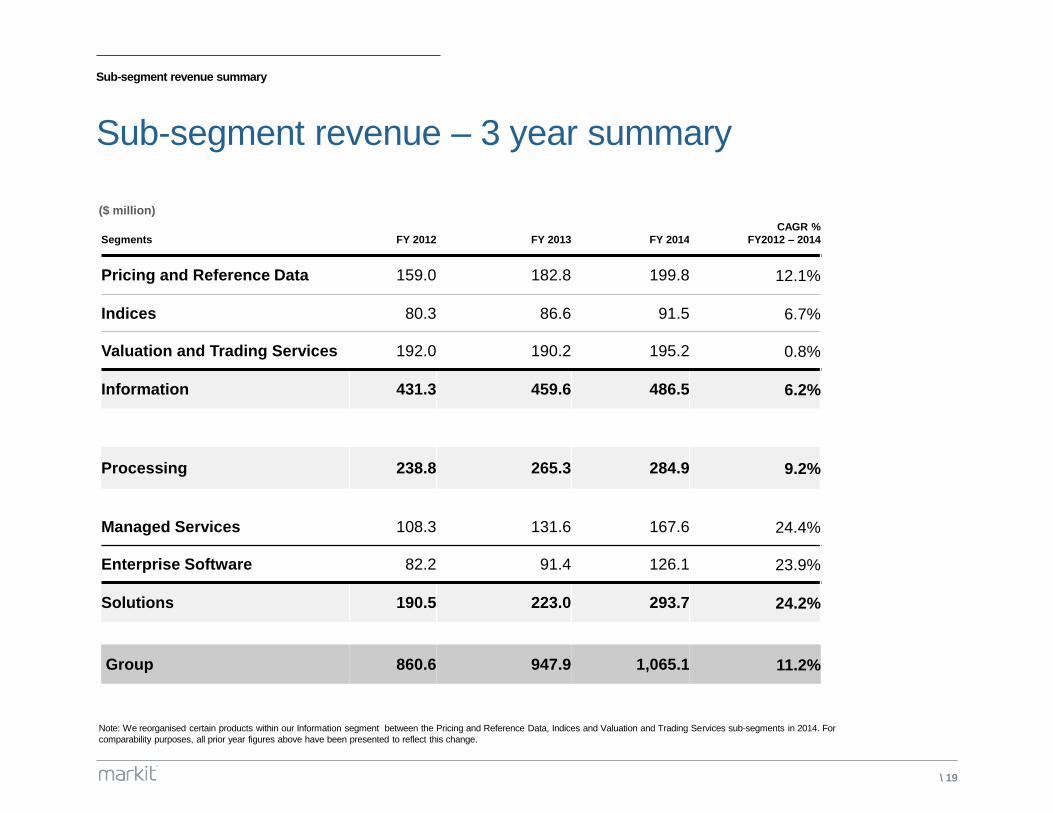
Sub-segment revenue – 3 year summary
Segments FY 2012 FY 2013 FY 2014
CAGR %
FY2012 – 2014
Pricing and Reference Data 159.0 182.8 199.8 12.1%
Indices 80.3 86.6 91.5 6.7%
Valuation and Trading Services 192.0 190.2 195.2 0.8%
Information 431.3 459.6 486.5 6.2%
Processing 238.8 265.3 284.9 9.2%
Managed Services 108.3 131.6 167.6 24.4%
Enterprise Software 82.2 91.4 126.1 23.9%
Solutions 190.5 223.0 293.7 24.2%
Group 860.6 947.9 1,065.1 11.2%
Note: We reorganised certain products within our Information segment between the Pricing and Reference Data, Indices and Valuation and Trading Services sub-segments in 2014. For
comparability purposes, all prior year figures above have been presented to reflect this change.
($ million)
\ 20
Q4 and FY 2014 financial results
\ 21
Q4 and FY 2014 financial results
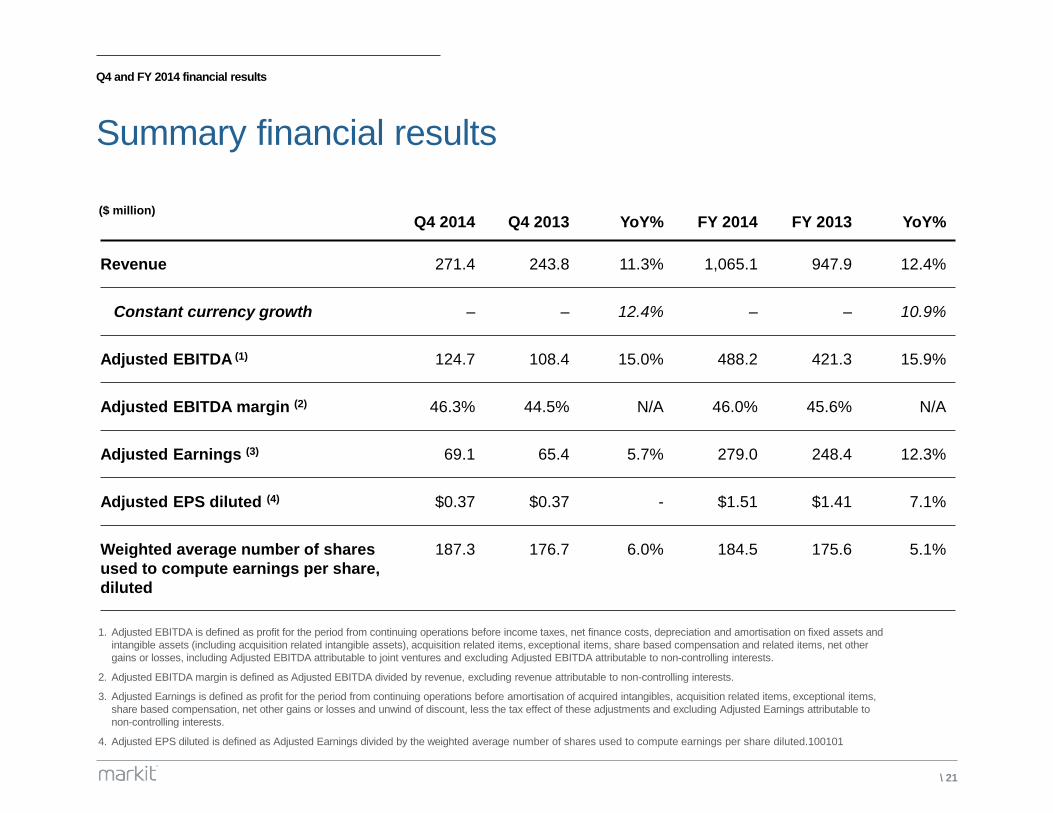
Summary financial results
1. Adjusted EBITDA is defined as profit for the period from continuing operations before income taxes, net finance costs, depreciation and amortisation on fixed assets and
intangible assets (including acquisition related intangible assets), acquisition related items, exceptional items, share based compensation and related items, net other
gains or losses, including Adjusted EBITDA attributable to joint ventures and excluding Adjusted EBITDA attributable to non-controlling interests.
2. Adjusted EBITDA margin is defined as Adjusted EBITDA divided by revenue, excluding revenue attributable to non-controlling interests.
3. Adjusted Earnings is defined as profit for the period from continuing operations before amortisation of acquired intangibles, acquisition related items, exceptional items,
share based compensation, net other gains or losses and unwind of discount, less the tax effect of these adjustments and excluding Adjusted Earnings attributable to
non-controlling interests.
4. Adjusted EPS diluted is defined as Adjusted Earnings divided by the weighted average number of shares used to compute earnings per share diluted.100101
Q4 2014 Q4 2013 YoY% FY 2014 FY 2013 YoY%
Revenue 271.4 243.8 11.3% 1,065.1 947.9 12.4%
Constant currency growth – – 12.4% – – 10.9%
Adjusted EBITDA (1) 124.7 108.4 15.0% 488.2 421.3 15.9%
Adjusted EBITDA margin (2) 46.3% 44.5% N/A 46.0% 45.6% N/A
Adjusted Earnings (3) 69.1 65.4 5.7% 279.0 248.4 12.3%
Adjusted EPS diluted (4) $0.37 $0.37 - $1.51 $1.41 7.1%
Weighted average number of shares
used to compute earnings per share,
diluted
187.3 176.7 6.0% 184.5 175.6 5.1%
($ million)
\ 22
Q4 and FY 2014 financial results
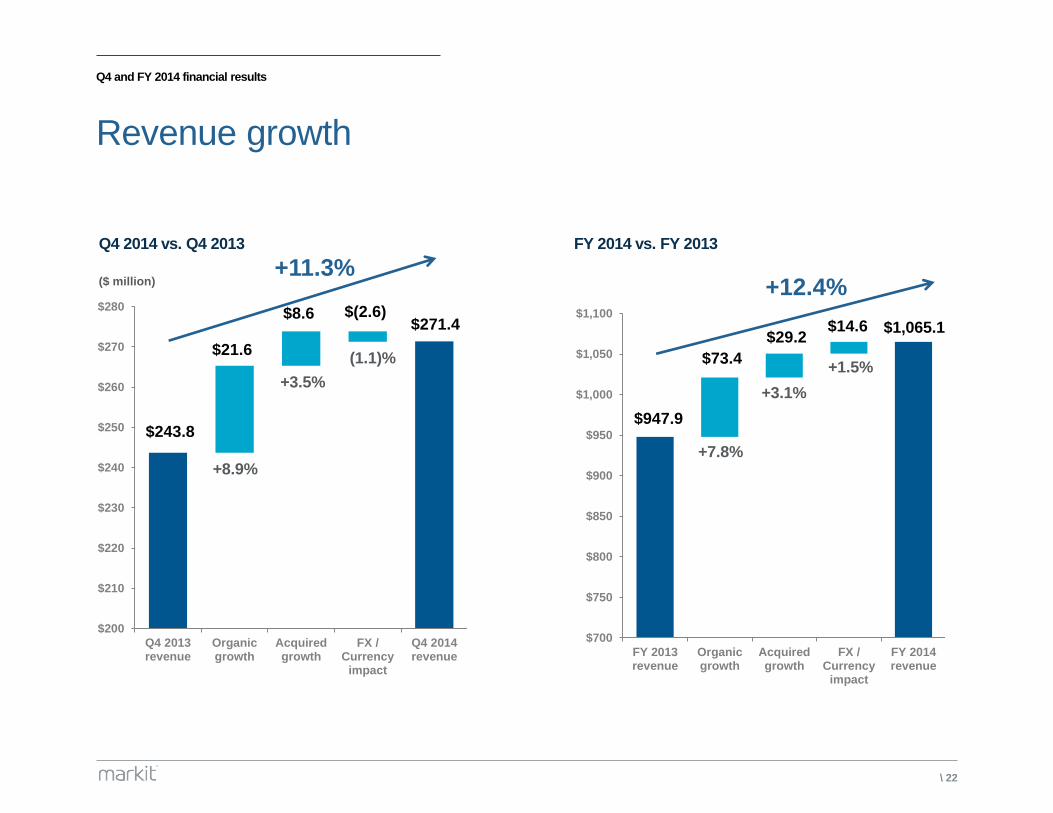
Revenue growth
$243.8
$21.6
$8.6 $(2.6) $271.4
$200
$210
$220
$230
$240
$250
$260
$270
$280
Q4 2013revenue
Organicgrowth
Acquiredgrowth
FX /Currency
impact
Q4 2014revenue
+8.9%
+3.5%
(1.1)%
+11.3%
$947.9
$73.4
$29.2 $14.6
$700
$750
$800
$850
$900
$950
$1,000
$1,050
$1,100
FY 2013revenue
Organicgrowth
Acquiredgrowth
FX /Currency
impact
FY 2014revenue
+7.8%
+3.1%
+1.5%
+12.4%
Q4 2014 vs. Q4 2013 FY 2014 vs. FY 2013
$1,065.1
($ million)
\ 23
Q4 and FY 2014 financial results
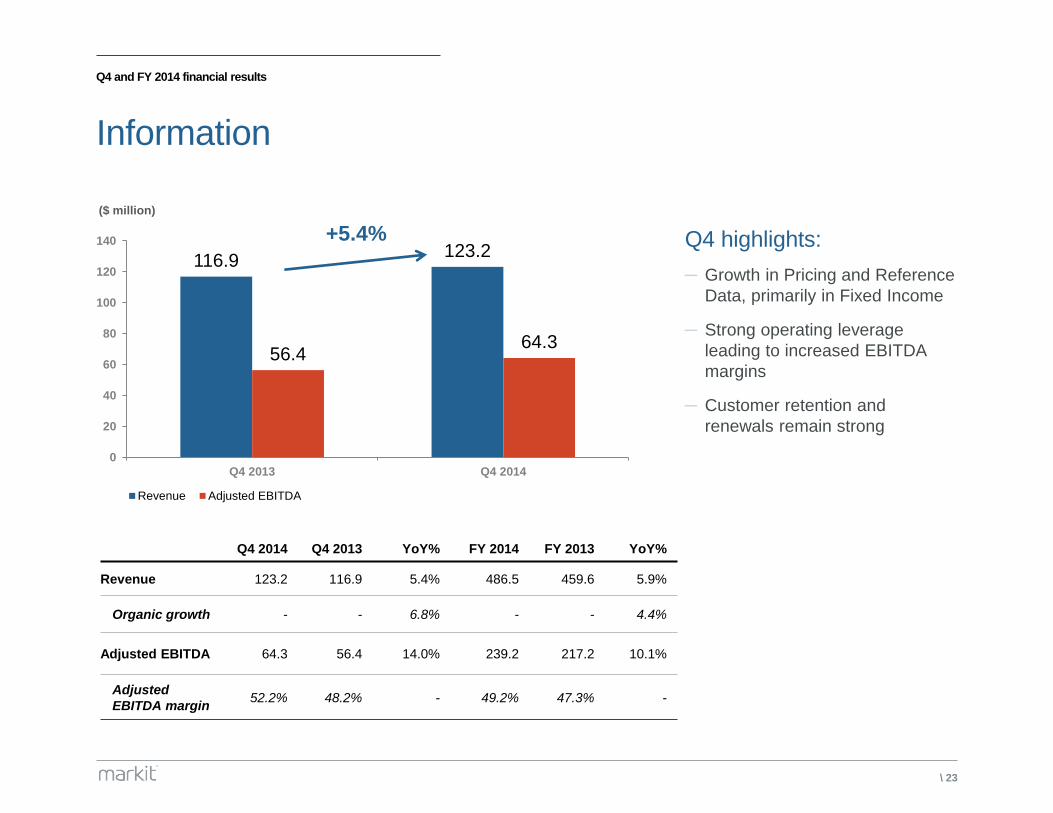
Information
116.9 123.2
56.4 64.3
0
20
40
60
80
100
120
140
Q4 2013 Q4 2014
Revenue Adjusted EBITDA
+5.4% Q4 highlights:
─ Growth in Pricing and Reference
Data, primarily in Fixed Income
─ Strong operating leverage
leading to increased EBITDA
margins
─ Customer retention and
renewals remain strong
($ million)
Q4 2014 Q4 2013 YoY% FY 2014 FY 2013 YoY%
Revenue 123.2 116.9 5.4% 486.5 459.6 5.9%
Organic growth - - 6.8% - - 4.4%
Adjusted EBITDA 64.3 56.4 14.0% 239.2 217.2 10.1%
Adjusted
EBITDA margin 52.2% 48.2% - 49.2% 47.3% -

\ 24
Q4 and FY 2014 financial results
Processing
Q4 highlights:
─ Derivatives processing revenue
benefitted from higher volumes
─ Limited revenue impact from
SEF regulations
─ Cost savings are starting be to
delivered
65.0 68.5
29.8 36.5
0
10
20
30
40
50
60
70
80
Q4 2013 Q4 2014
Revenue Adjusted EBITDA
+5.4%
Q4 2014 Q4 2013 YoY% FY 2014 FY 2013 YoY%
Revenue 68.5 65.0 5.4% 284.9 265.3 7.4%
Organic growth - - 6.2% - - 5.1%
Adjusted EBITDA 36.5 29.8 22.5% 156.6 138.1 13.4%
Adjusted
EBITDA margin 53.3% 45.8% - 55.0% 52.1% -
($ million)
\ 25
Q4 and FY 2014 financial results
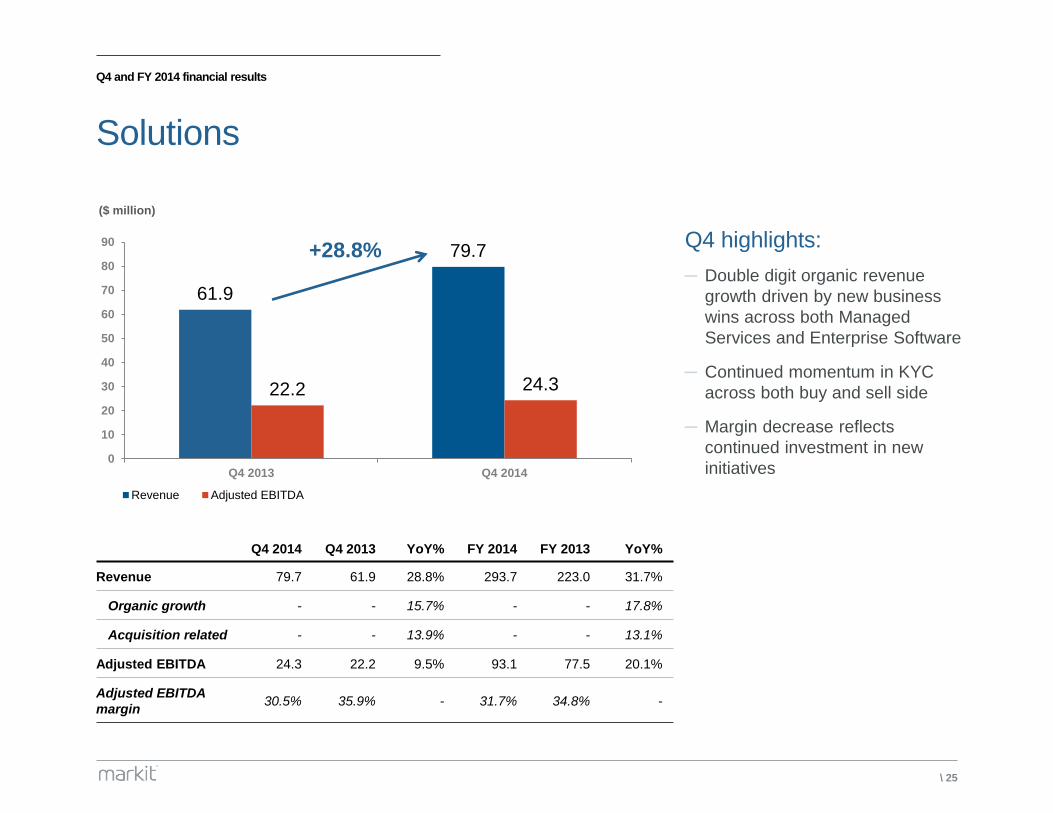
Solutions
61.9
79.7
22.2 24.3
0
10
20
30
40
50
60
70
80
90
Q4 2013 Q4 2014
Revenue Adjusted EBITDA
+28.8%
Q4 2014 Q4 2013 YoY% FY 2014 FY 2013 YoY%
Revenue 79.7 61.9 28.8% 293.7 223.0 31.7%
Organic growth - - 15.7% - - 17.8%
Acquisition related - - 13.9% - - 13.1%
Adjusted EBITDA 24.3 22.2 9.5% 93.1 77.5 20.1%
Adjusted EBITDA
margin 30.5% 35.9% - 31.7% 34.8% -
Q4 highlights:
─ Double digit organic revenue
growth driven by new business
wins across both Managed
Services and Enterprise Software
─ Continued momentum in KYC
across both buy and sell side
─ Margin decrease reflects
continued investment in new
initiatives
($ million)
\ 26
Q4 and FY 2014 financial results
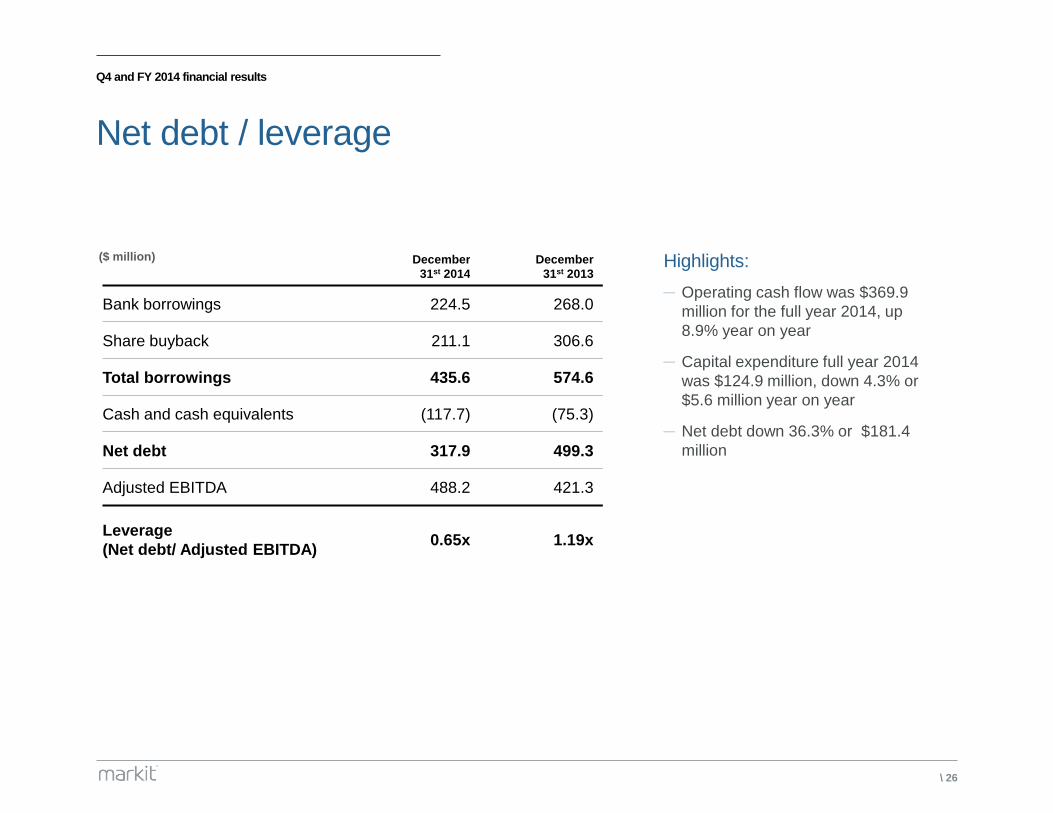
Net debt / leverage
December
31st 2014
December
31st 2013
Bank borrowings 224.5 268.0
Share buyback 211.1 306.6
Total borrowings 435.6 574.6
Cash and cash equivalents (117.7) (75.3)
Net debt 317.9 499.3
Adjusted EBITDA 488.2 421.3
Leverage
(Net debt/ Adjusted EBITDA) 0.65x 1.19x
Highlights:
─ Operating cash flow was $369.9
million for the full year 2014, up
8.9% year on year
─ Capital expenditure full year 2014
was $124.9 million, down 4.3% or
$5.6 million year on year
─ Net debt down 36.3% or $181.4
million
($ million)
\ 27
Q4 and FY 2014 financial results
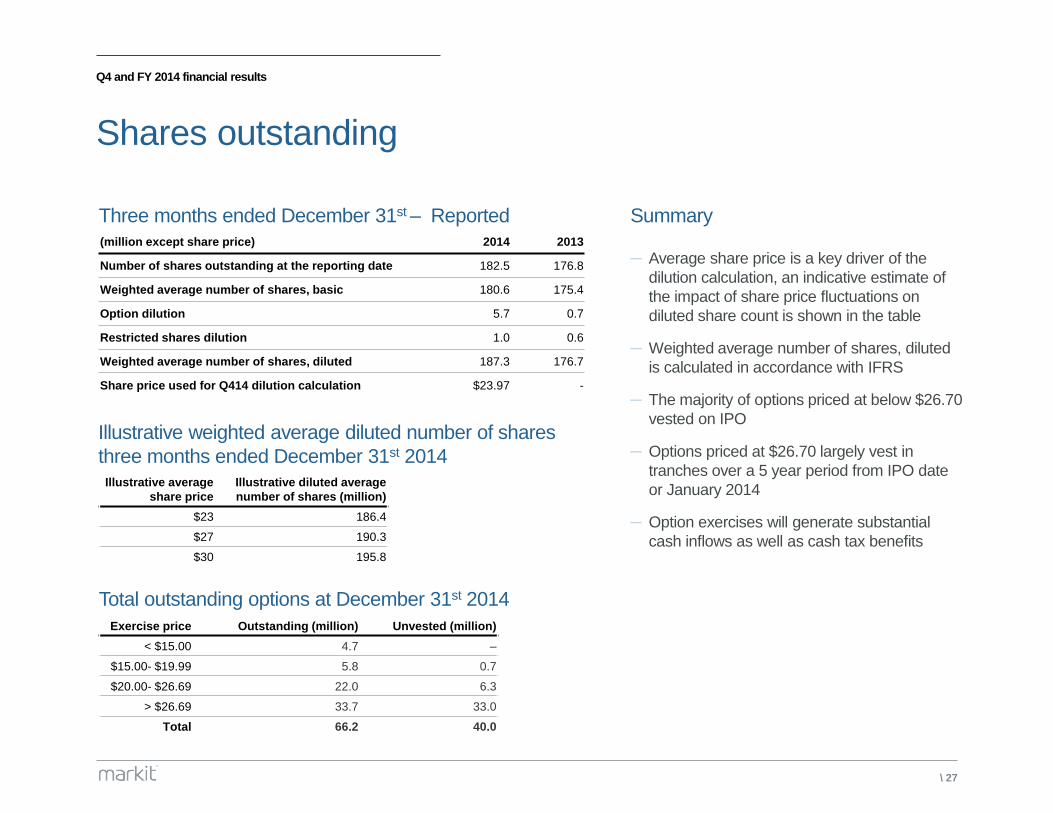
Shares outstanding
Summary
─ Average share price is a key driver of the
dilution calculation, an indicative estimate of
the impact of share price fluctuations on
diluted share count is shown in the table
─ Weighted average number of shares, diluted
is calculated in accordance with IFRS
─ The majority of options priced at below $26.70
vested on IPO
─ Options priced at $26.70 largely vest in
tranches over a 5 year period from IPO date
or January 2014
─ Option exercises will generate substantial
cash inflows as well as cash tax benefits
(million except share price) 2014 2013
Number of shares outstanding at the reporting date 182.5 176.8
Weighted average number of shares, basic 180.6 175.4
Option dilution 5.7 0.7
Restricted shares dilution 1.0 0.6
Weighted average number of shares, diluted 187.3 176.7
Share price used for Q414 dilution calculation $23.97 -
Illustrative average
share price
Illustrative diluted average
number of shares (million)
$23 186.4
$27 190.3
$30 195.8
Exercise price Outstanding (million) Unvested (million)
< $15.00 4.7 –
$15.00- $19.99 5.8 0.7
$20.00- $26.69 22.0 6.3
> $26.69 33.7 33.0
Total 66.2 40.0
Three months ended December 31st – Reported
Illustrative weighted average diluted number of shares
three months ended December 31st 2014
Total outstanding options at December 31st 2014
\ 28
Appendix
\ 29
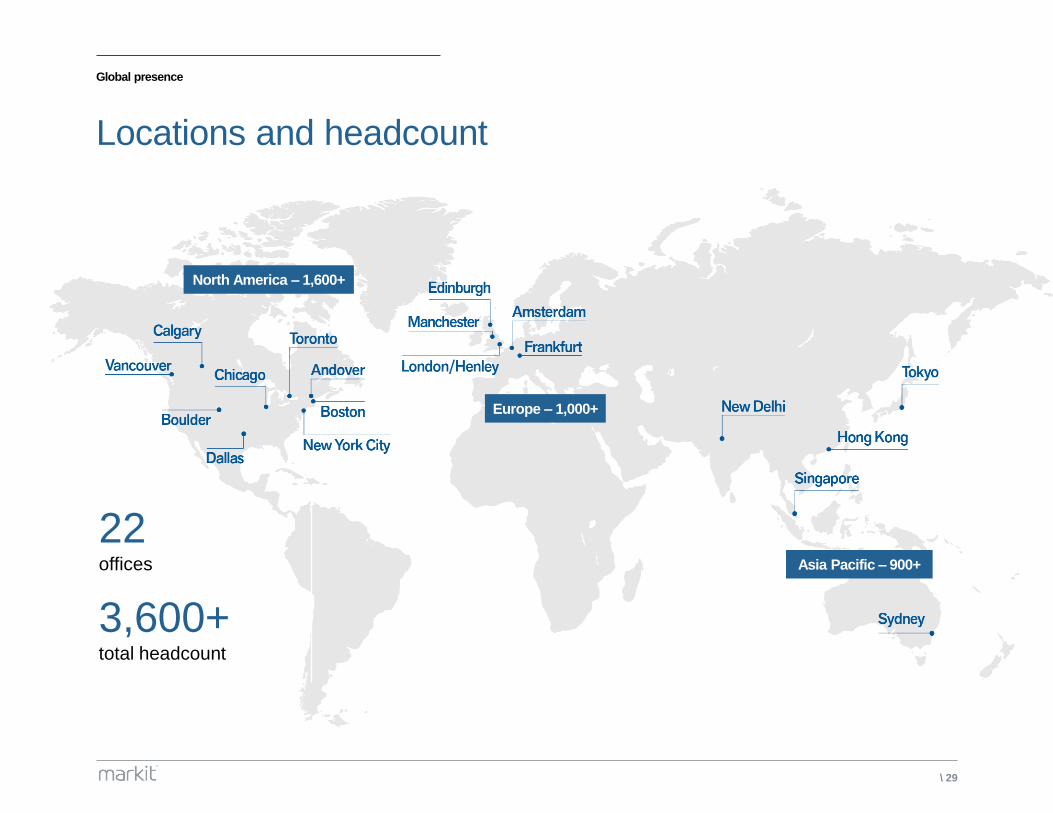
North America – 1,600+
Europe – 1,000+
Asia Pacific – 900+
Global presence
22 offices
3,600+ total headcount
Locations and headcount
\ 30
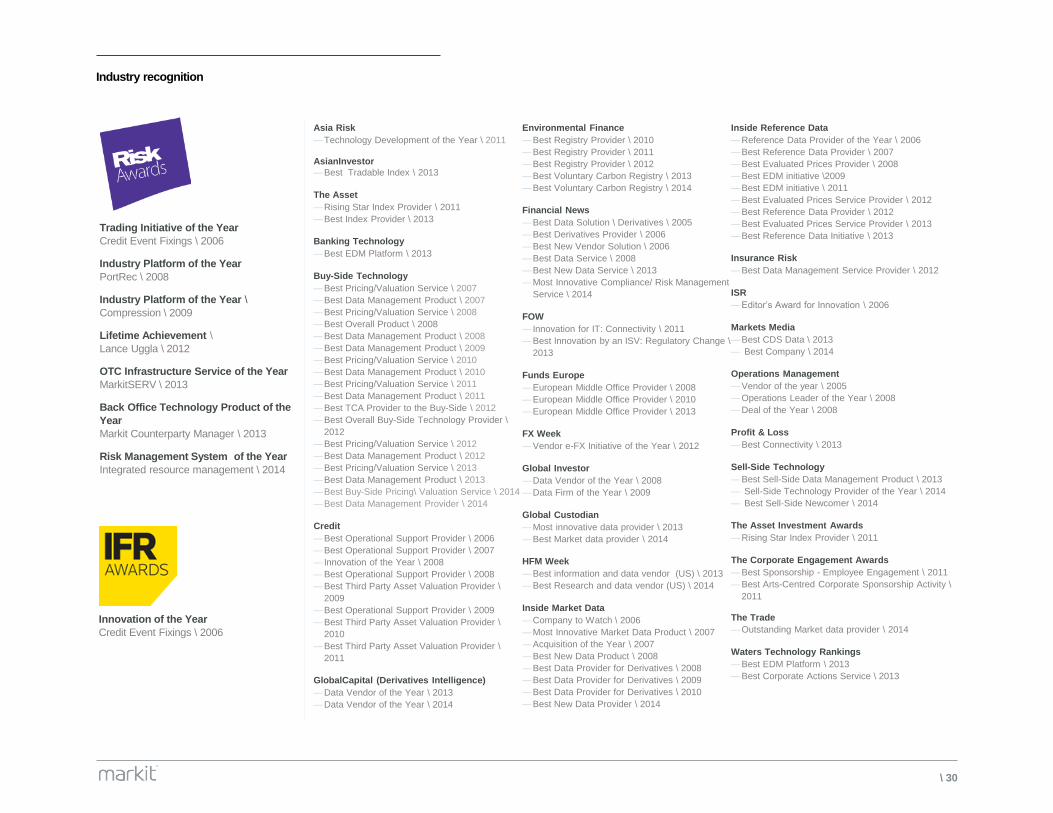
Industry recognition
Innovation of the Year
Credit Event Fixings \ 2006
Trading Initiative of the Year
Credit Event Fixings \ 2006
Industry Platform of the Year
PortRec \ 2008
Industry Platform of the Year \
Compression \ 2009
Lifetime Achievement \
Lance Uggla \ 2012
OTC Infrastructure Service of the Year
MarkitSERV \ 2013
Back Office Technology Product of the
Year
Markit Counterparty Manager \ 2013
Risk Management System of the Year
Integrated resource management \ 2014
Asia Risk
—Technology Development of the Year \ 2011
AsianInvestor
—Best Tradable Index \ 2013
The Asset
—Rising Star Index Provider \ 2011
—Best Index Provider \ 2013
Banking Technology
—Best EDM Platform \ 2013
Buy-Side Technology
—Best Pricing/Valuation Service \ 2007
—Best Data Management Product \ 2007
—Best Pricing/Valuation Service \ 2008
—Best Overall Product \ 2008
—Best Data Management Product \ 2008
—Best Data Management Product \ 2009
—Best Pricing/Valuation Service \ 2010
—Best Data Management Product \ 2010
—Best Pricing/Valuation Service \ 2011
—Best Data Management Product \ 2011
—Best TCA Provider to the Buy-Side \ 2012
—Best Overall Buy-Side Technology Provider \
2012
—Best Pricing/Valuation Service \ 2012
—Best Data Management Product \ 2012
—Best Pricing/Valuation Service \ 2013
—Best Data Management Product \ 2013
—Best Buy-Side Pricing\ Valuation Service \ 2014
—Best Data Management Provider \ 2014
Credit
—Best Operational Support Provider \ 2006
—Best Operational Support Provider \ 2007
— Innovation of the Year \ 2008
—Best Operational Support Provider \ 2008
—Best Third Party Asset Valuation Provider \
2009
—Best Operational Support Provider \ 2009
—Best Third Party Asset Valuation Provider \
2010
—Best Third Party Asset Valuation Provider \
2011
GlobalCapital (Derivatives Intelligence)
—Data Vendor of the Year \ 2013
—Data Vendor of the Year \ 2014
Environmental Finance
—Best Registry Provider \ 2010
—Best Registry Provider \ 2011
—Best Registry Provider \ 2012
—Best Voluntary Carbon Registry \ 2013
—Best Voluntary Carbon Registry \ 2014
Financial News
—Best Data Solution \ Derivatives \ 2005
—Best Derivatives Provider \ 2006
—Best New Vendor Solution \ 2006
—Best Data Service \ 2008
—Best New Data Service \ 2013
—Most Innovative Compliance/ Risk Management
Service \ 2014
FOW
— Innovation for IT: Connectivity \ 2011
—Best Innovation by an ISV: Regulatory Change \
2013
Funds Europe
—European Middle Office Provider \ 2008
—European Middle Office Provider \ 2010
—European Middle Office Provider \ 2013
FX Week
—Vendor e-FX Initiative of the Year \ 2012
Global Investor
—Data Vendor of the Year \ 2008
—Data Firm of the Year \ 2009
Global Custodian
—Most innovative data provider \ 2013
—Best Market data provider \ 2014
HFM Week
—Best information and data vendor (US) \ 2013
—Best Research and data vendor (US) \ 2014
Inside Market Data
—Company to Watch \ 2006
—Most Innovative Market Data Product \ 2007
—Acquisition of the Year \ 2007
—Best New Data Product \ 2008
—Best Data Provider for Derivatives \ 2008
—Best Data Provider for Derivatives \ 2009
—Best Data Provider for Derivatives \ 2010
—Best New Data Provider \ 2014
Inside Reference Data
—Reference Data Provider of the Year \ 2006
—Best Reference Data Provider \ 2007
—Best Evaluated Prices Provider \ 2008
—Best EDM initiative \2009
—Best EDM initiative \ 2011
—Best Evaluated Prices Service Provider \ 2012
—Best Reference Data Provider \ 2012
—Best Evaluated Prices Service Provider \ 2013
—Best Reference Data Initiative \ 2013
Insurance Risk
—Best Data Management Service Provider \ 2012
ISR
—Editor’s Award for Innovation \ 2006
Markets Media
—Best CDS Data \ 2013
— Best Company \ 2014
Operations Management
—Vendor of the year \ 2005
—Operations Leader of the Year \ 2008
—Deal of the Year \ 2008
Profit & Loss
—Best Connectivity \ 2013
Sell-Side Technology
—Best Sell-Side Data Management Product \ 2013
— Sell-Side Technology Provider of the Year \ 2014
— Best Sell-Side Newcomer \ 2014
The Asset Investment Awards
—Rising Star Index Provider \ 2011
The Corporate Engagement Awards
—Best Sponsorship - Employee Engagement \ 2011
—Best Arts-Centred Corporate Sponsorship Activity \
2011
The Trade
—Outstanding Market data provider \ 2014
Waters Technology Rankings
—Best EDM Platform \ 2013
—Best Corporate Actions Service \ 2013
\ 31
Reconciliation
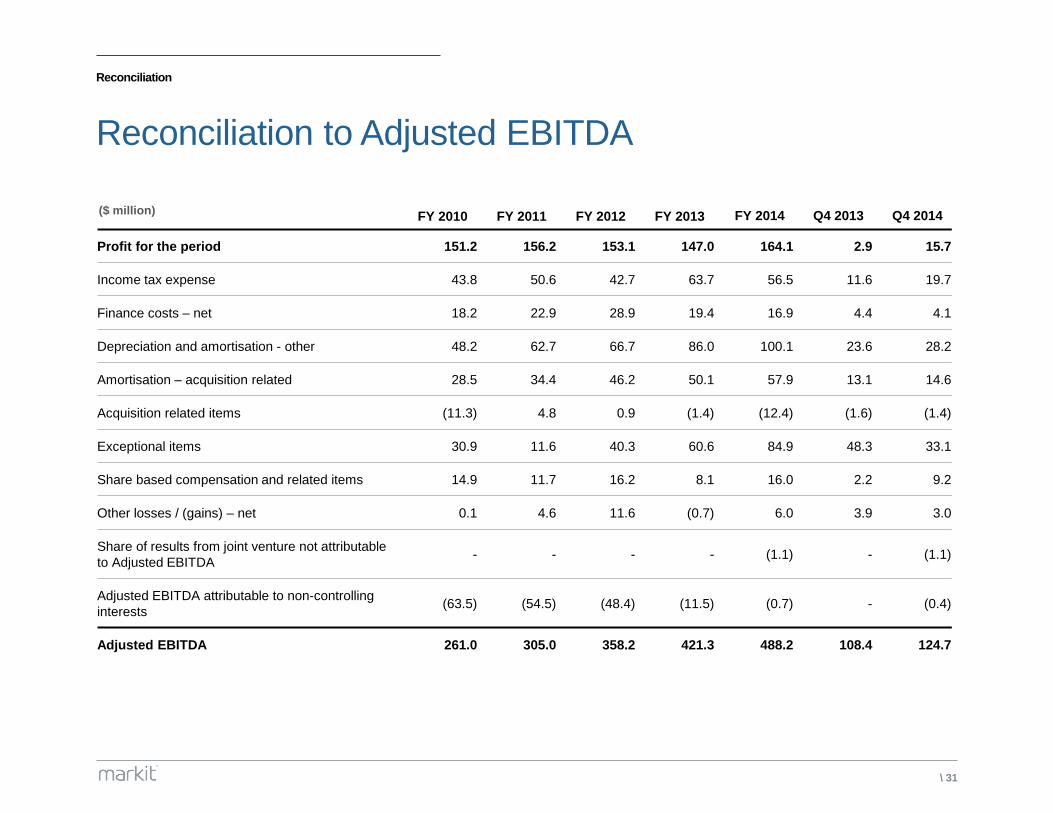
Reconciliation to Adjusted EBITDA
FY 2010 FY 2011 FY 2012 FY 2013 FY 2014 Q4 2013 Q4 2014
Profit for the period 151.2 156.2 153.1 147.0 164.1 2.9 15.7
Income tax expense 43.8 50.6 42.7 63.7 56.5 11.6 19.7
Finance costs – net 18.2 22.9 28.9 19.4 16.9 4.4 4.1
Depreciation and amortisation - other 48.2 62.7 66.7 86.0 100.1 23.6 28.2
Amortisation – acquisition related 28.5 34.4 46.2 50.1 57.9 13.1 14.6
Acquisition related items (11.3) 4.8 0.9 (1.4) (12.4) (1.6) (1.4)
Exceptional items 30.9 11.6 40.3 60.6 84.9 48.3 33.1
Share based compensation and related items 14.9 11.7 16.2 8.1 16.0 2.2 9.2
Other losses / (gains) – net 0.1 4.6 11.6 (0.7) 6.0 3.9 3.0
Share of results from joint venture not attributable
to Adjusted EBITDA - - - - (1.1) - (1.1)
Adjusted EBITDA attributable to non-controlling
interests (63.5) (54.5) (48.4) (11.5) (0.7) - (0.4)
Adjusted EBITDA 261.0 305.0 358.2 421.3 488.2 108.4 124.7
($ million)
\ 32
Reconciliation
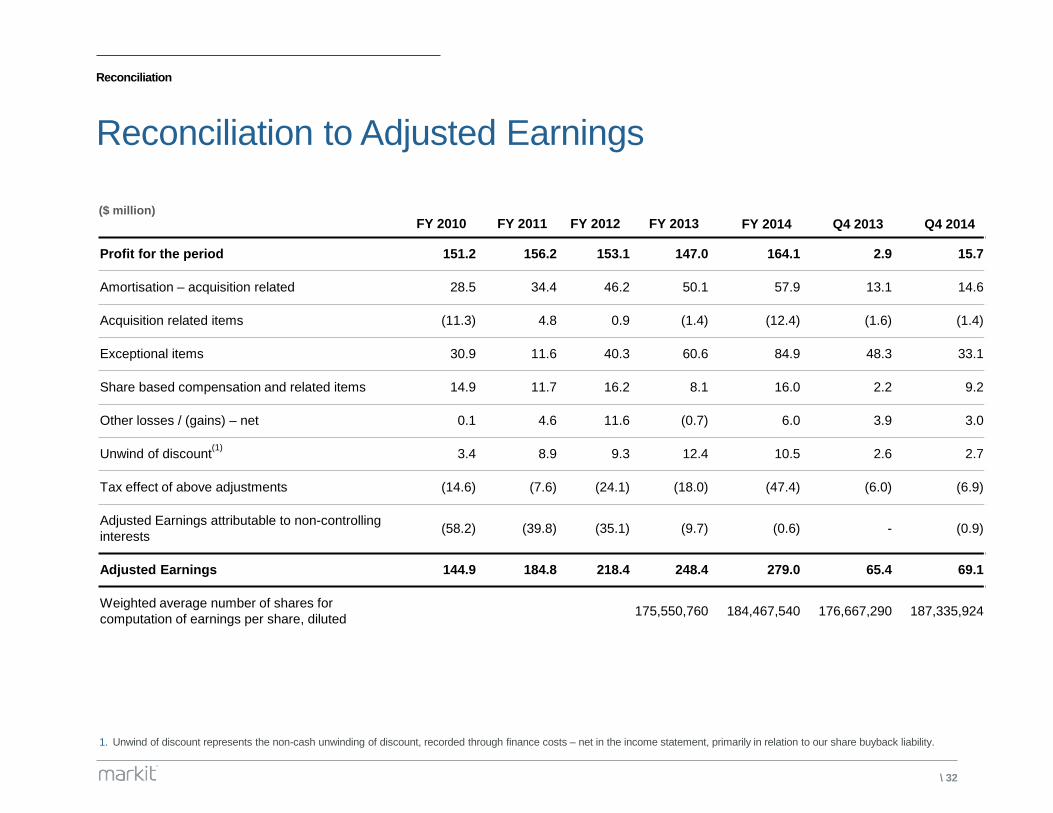
Reconciliation to Adjusted Earnings
1. Unwind of discount represents the non-cash unwinding of discount, recorded through finance costs – net in the income statement, primarily in relation to our share buyback liability.
FY 2010 FY 2011 FY 2012 FY 2013 FY 2014 Q4 2013 Q4 2014
Profit for the period 151.2 156.2 153.1 147.0 164.1 2.9 15.7
Amortisation – acquisition related 28.5 34.4 46.2 50.1 57.9 13.1 14.6
Acquisition related items (11.3) 4.8 0.9 (1.4) (12.4) (1.6) (1.4)
Exceptional items 30.9 11.6 40.3 60.6 84.9 48.3 33.1
Share based compensation and related items 14.9 11.7 16.2 8.1 16.0 2.2 9.2
Other losses / (gains) – net 0.1 4.6 11.6 (0.7) 6.0 3.9 3.0
Unwind of discount(1)
3.4 8.9 9.3 12.4 10.5 2.6 2.7
Tax effect of above adjustments (14.6) (7.6) (24.1) (18.0) (47.4) (6.0) (6.9)
Adjusted Earnings attributable to non-controlling
interests (58.2) (39.8) (35.1) (9.7) (0.6) - (0.9)
Adjusted Earnings 144.9 184.8 218.4 248.4 279.0 65.4 69.1
Weighted average number of shares for
computation of earnings per share, diluted 175,550,760 184,467,540 176,667,290 187,335,924
($ million)
\ 33
Q4 and FY 2014 financial results
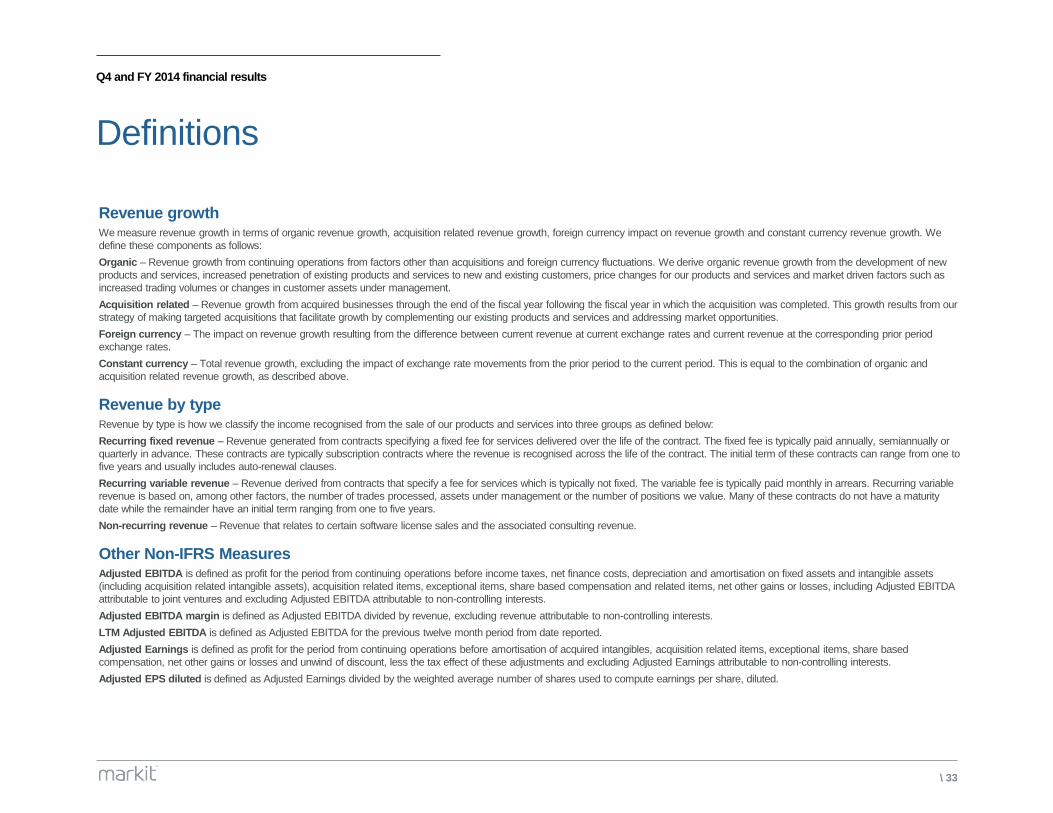
Definitions
Revenue growth We measure revenue growth in terms of organic revenue growth, acquisition related revenue growth, foreign currency impact on revenue growth and constant currency revenue growth. We
define these components as follows:
Organic – Revenue growth from continuing operations from factors other than acquisitions and foreign currency fluctuations. We derive organic revenue growth from the development of new
products and services, increased penetration of existing products and services to new and existing customers, price changes for our products and services and market driven factors such as
increased trading volumes or changes in customer assets under management.
Acquisition related – Revenue growth from acquired businesses through the end of the fiscal year following the fiscal year in which the acquisition was completed. This growth results from our
strategy of making targeted acquisitions that facilitate growth by complementing our existing products and services and addressing market opportunities.
Foreign currency – The impact on revenue growth resulting from the difference between current revenue at current exchange rates and current revenue at the corresponding prior period
exchange rates.
Constant currency – Total revenue growth, excluding the impact of exchange rate movements from the prior period to the current period. This is equal to the combination of organic and
acquisition related revenue growth, as described above.
Revenue by type Revenue by type is how we classify the income recognised from the sale of our products and services into three groups as defined below:
Recurring fixed revenue – Revenue generated from contracts specifying a fixed fee for services delivered over the life of the contract. The fixed fee is typically paid annually, semiannually or
quarterly in advance. These contracts are typically subscription contracts where the revenue is recognised across the life of the contract. The initial term of these contracts can range from one to
five years and usually includes auto-renewal clauses.
Recurring variable revenue – Revenue derived from contracts that specify a fee for services which is typically not fixed. The variable fee is typically paid monthly in arrears. Recurring variable
revenue is based on, among other factors, the number of trades processed, assets under management or the number of positions we value. Many of these contracts do not have a maturity
date while the remainder have an initial term ranging from one to five years.
Non-recurring revenue – Revenue that relates to certain software license sales and the associated consulting revenue.
Other Non-IFRS Measures Adjusted EBITDA is defined as profit for the period from continuing operations before income taxes, net finance costs, depreciation and amortisation on fixed assets and intangible assets
(including acquisition related intangible assets), acquisition related items, exceptional items, share based compensation and related items, net other gains or losses, including Adjusted EBITDA
attributable to joint ventures and excluding Adjusted EBITDA attributable to non-controlling interests.
Adjusted EBITDA margin is defined as Adjusted EBITDA divided by revenue, excluding revenue attributable to non-controlling interests.
LTM Adjusted EBITDA is defined as Adjusted EBITDA for the previous twelve month period from date reported.
Adjusted Earnings is defined as profit for the period from continuing operations before amortisation of acquired intangibles, acquisition related items, exceptional items, share based
compensation, net other gains or losses and unwind of discount, less the tax effect of these adjustments and excluding Adjusted Earnings attributable to non-controlling interests.
Adjusted EPS diluted is defined as Adjusted Earnings divided by the weighted average number of shares used to compute earnings per share, diluted.