Embed Size (px)
Citation preview
Where Are They Now?
Tracking Angel Oregon Alumni
Robert E Wiltbank, PhD
Prof. Wade T Brooks
2004
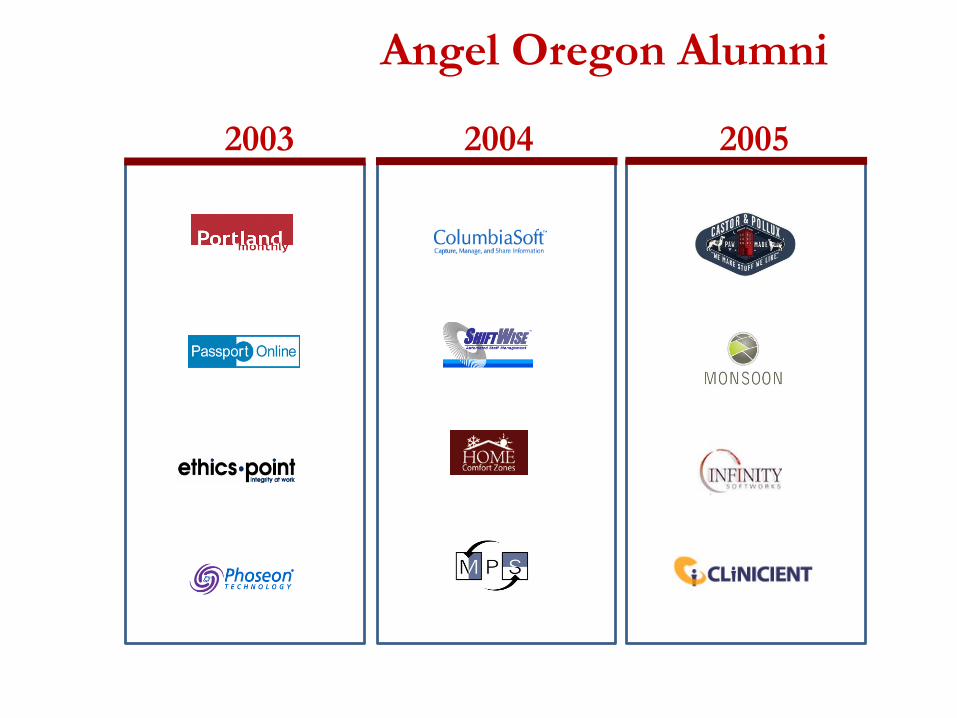
Angel Oregon Alumni
2003 2005
2007
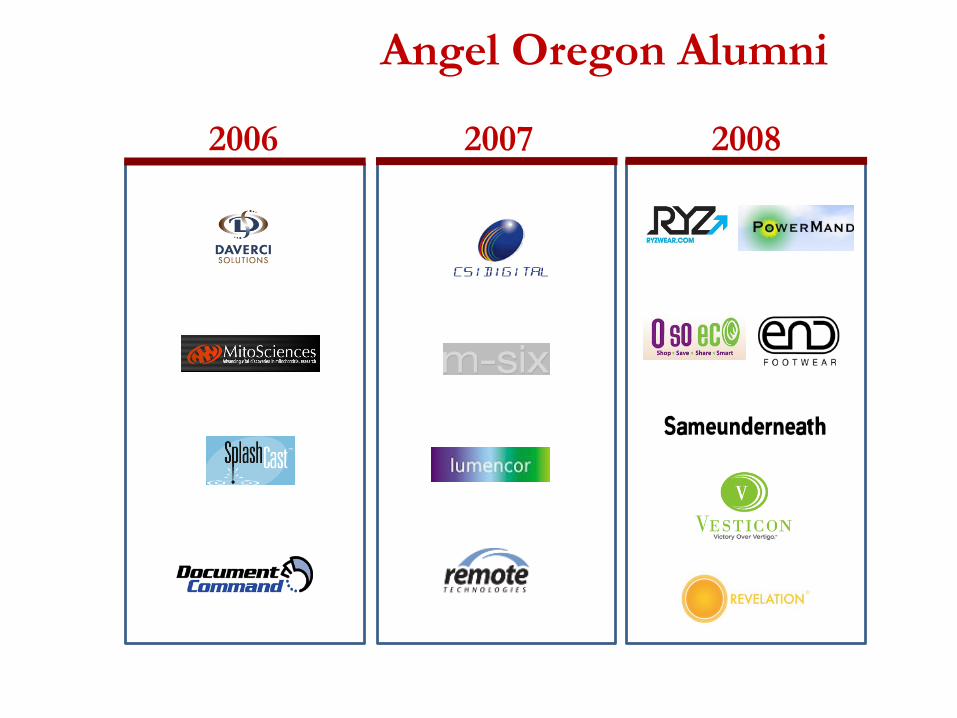
Angel Oregon Alumni
2006 2008
2010
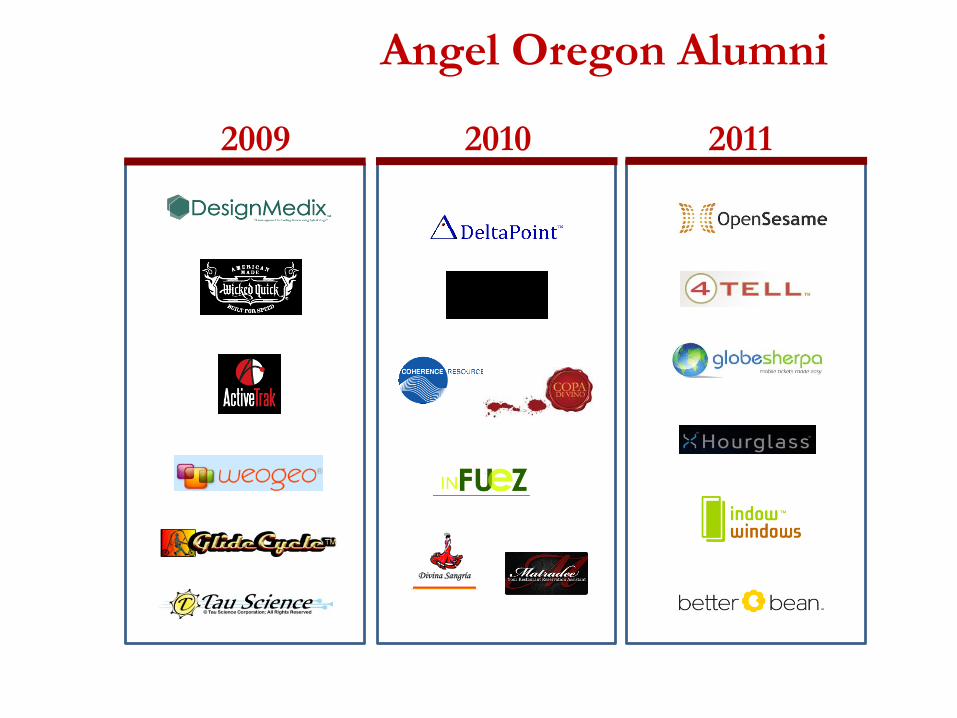
Angel Oregon Alumni
2009 2011
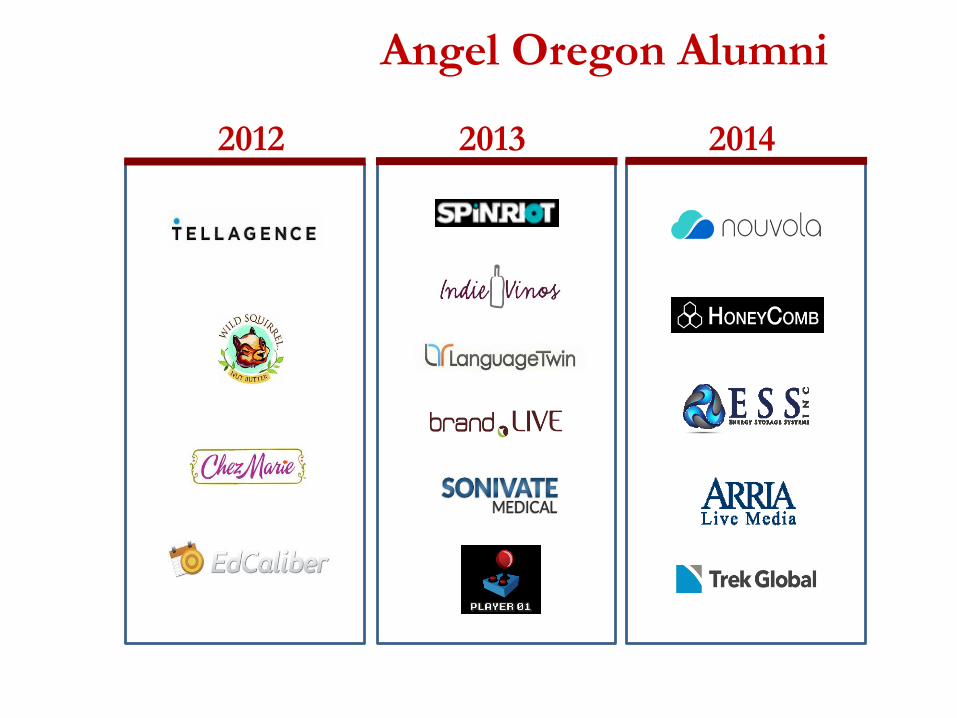
2013
Angel Oregon Alumni
2012 2014
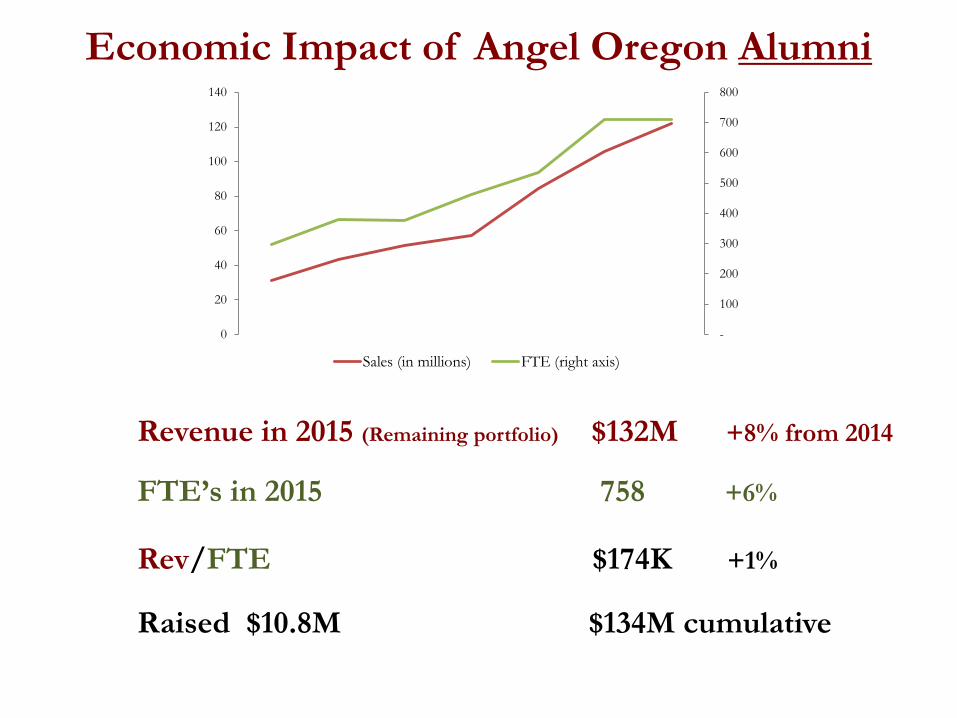
Rev/FTE $174K +1%
FTE’s in 2015 758 +6%
Economic Impact of Angel Oregon Alumni
Revenue in 2015 (Remaining portfolio) $132M +8% from 2014
Raised $10.8M $134M cumulative
-
100
200
300
400
500
600
700
800
0
20
40
60
80
100
120
140
Sales (in millions) FTE (right axis)
Realized Multiple
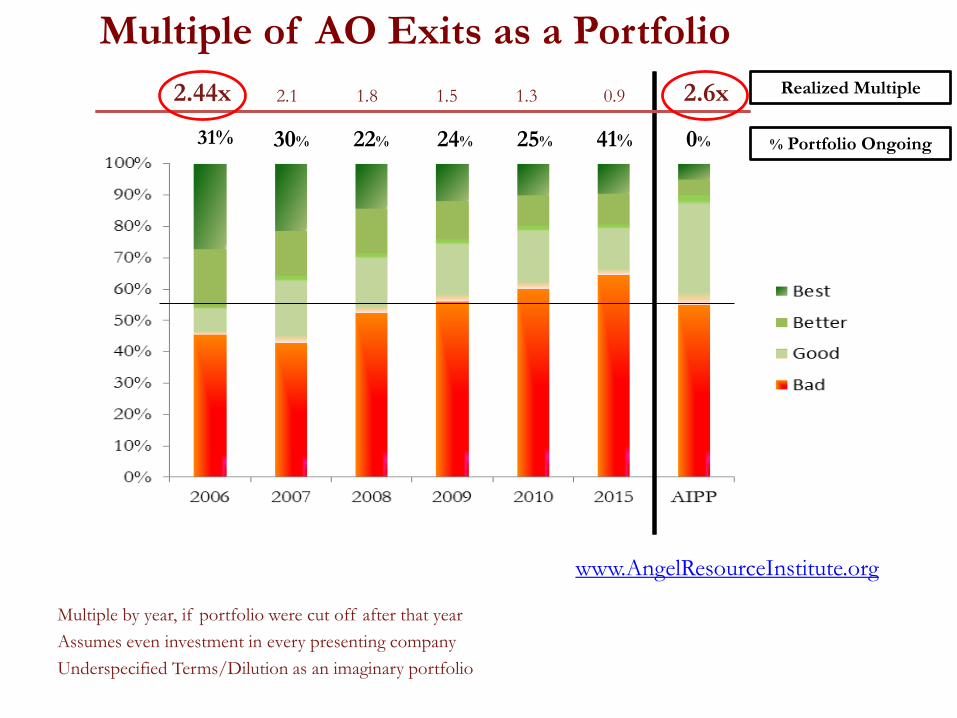
Multiple of AO Exits as a Portfolio
2.44x 2.1 1.8 1.5 1.3 0.9 2.6x
30% 24% 25% 41%31% 0% % Portfolio Ongoing
Multiple by year, if portfolio were cut off after that year
Assumes even investment in every presenting company
Underspecified Terms/Dilution as an imaginary portfolio
22% 0%
www.AngelResourceInstitute.org
2015Presents the
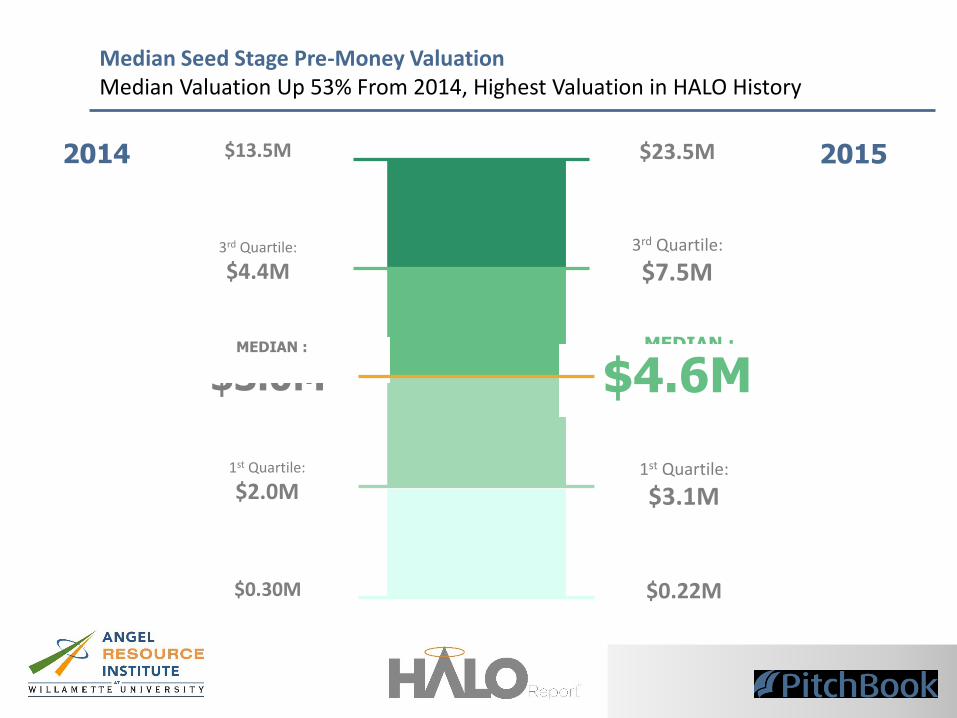
Median Seed Stage Pre-Money ValuationMedian Valuation Up 53% From 2014, Highest Valuation in HALO History
$0.22M
$23.5M
MEDIAN :
$4.6M
3rd Quartile:
$7.5M
1st Quartile:
$3.1M
$13.5M
3rd Quartile:
$4.4M
$3.0MMEDIAN :
1st Quartile:
$2.0M
$0.30M
2014 2015
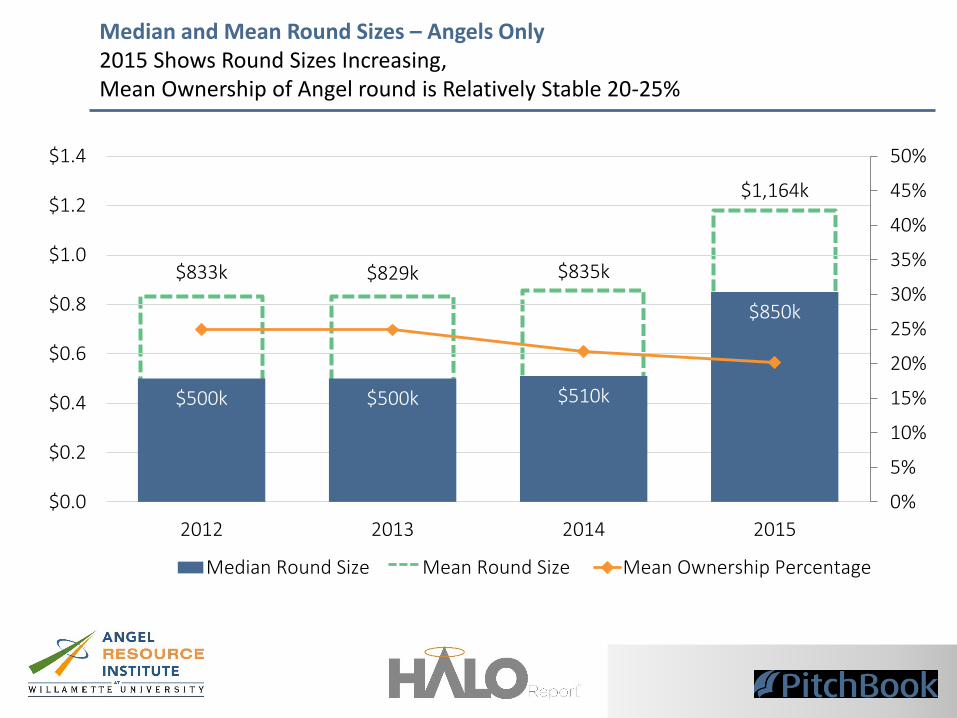
$500k $500k $510k
$850k
$833k $829k $835k
$1,164k
0%
5%
10%
15%
20%
25%
30%
35%
40%
45%
50%
$0.0
$0.2
$0.4
$0.6
$0.8
$1.0
$1.2
$1.4
2012 2013 2014 2015
Median Round Size Mean Round Size Mean Ownership Percentage
Median and Mean Round Sizes – Angels Only2015 Shows Round Sizes Increasing, Mean Ownership of Angel round is Relatively Stable 20-25%