Embed Size (px)
Citation preview
Page
Erste Group posts net profit of EUR 968.2m in 2015 (ROTE: 10.8%) on return of volume growth to CEE, normalisation in risk costs and reduced one-offs – solid capital position underpins dividend proposal of EUR 0.5 per share Andreas Treichl, CEO Erste Group Gernot Mittendorfer, CFO Erste Group Andreas Gottschling, CRO Erste Group
26 February 2016
Erste Group investor presentation FY 2015 preliminary results
Page
Disclaimer – Cautionary note regarding forward-looking statements
2
• THE INFORMATION CONTAINED IN THIS DOCUMENT HAS NOT BEEN INDEPENDENTLY VERIFIED AND NO REPRESENTATION OR WARRANTY EXPRESSED OR IMPLIED IS MADE AS TO, AND NO RELIANCE SHOULD BE PLACED ON, THE FAIRNESS, ACCURACY, COMPLETENESS OR CORRECTNESS OF THIS INFORMATION OR OPINIONS CONTAINED HEREIN.
• CERTAIN STATEMENTS CONTAINED IN THIS DOCUMENT MAY BE STATEMENTS OF FUTURE EXPECTATIONS AND OTHER FORWARD-LOOKING STATEMENTS THAT ARE BASED ON MANAGEMENT’S CURRENT VIEWS AND ASSUMPTIONS AND INVOLVE KNOWN AND UNKNOWN RISKS AND UNCERTAINTIES THAT COULD CAUSE ACTUAL RESULTS, PERFORMANCE OR EVENTS TO DIFFER MATERIALLY FROM THOSE EXPRESSED OR IMPLIED IN SUCH STATEMENTS.
• NONE OF ERSTE GROUP OR ANY OF ITS AFFILIATES, ADVISORS OR REPRESENTATIVES SHALL HAVE ANY LIABILITY WHATSOEVER (IN NEGLIGENCE OR OTHERWISE) FOR ANY LOSS HOWSOEVER ARISING FROM ANY USE OF THIS DOCUMENT OR ITS CONTENT OR OTHERWISE ARISING IN CONNECTION WITH THIS DOCUMENT.
• THIS DOCUMENT DOES NOT CONSTITUTE AN OFFER OR INVITATION TO PURCHASE OR SUBSCRIBE FOR ANY SHARES AND NEITHER IT NOR ANY PART OF IT SHALL FORM THE BASIS OF OR BE RELIED UPON IN CONNECTION WITH ANY CONTRACT OR COMMITMENT WHATSOEVER.

Page
Presentation topics
3
• Executive summary • Business environment • Business performance • Assets and liabilities • Outlook • Additional information
Page
Executive summary – Group income statement performance
QoQ net profit reconciliation (EUR m)
YoY net profit reconciliation (EUR m)
4
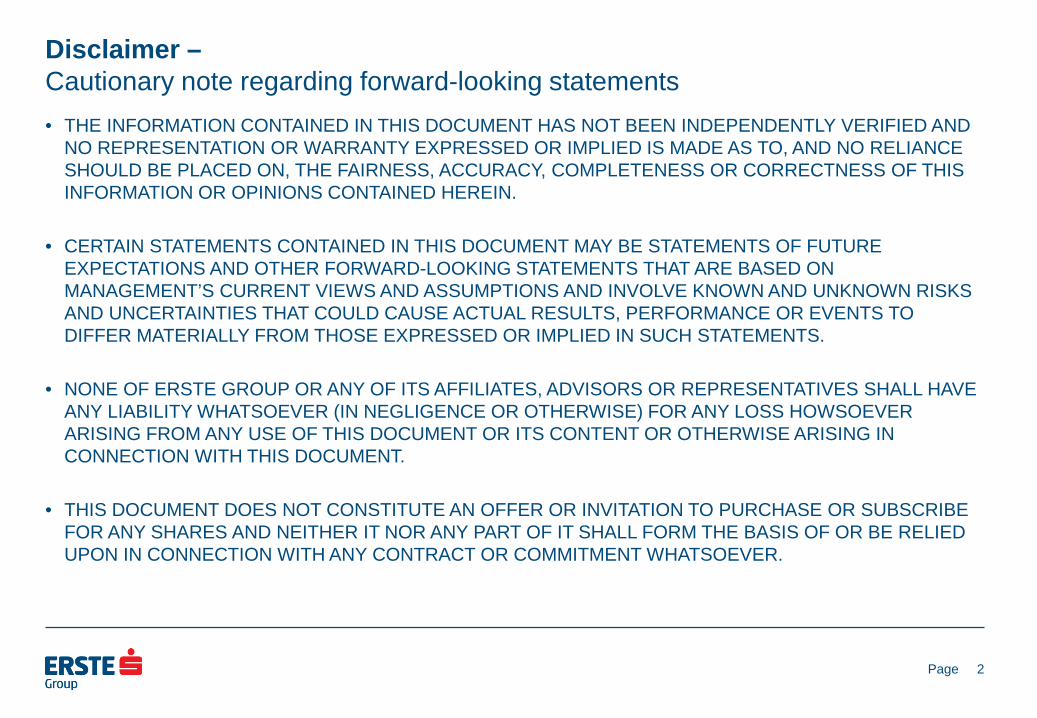
• Erste Group Q4 15 net profit declined to EUR 204.0m qoq due to higher risk provisions and weaker other result (negative one-offs of EUR 121.0m in Q4 15, related to Romania and Hungary), partly offset by lower tax charge
• Q4 15 also impacted by seasonally higher operating expenses and negative fair value impact in net trading and fair value result, NII stable, fees seasonally up
• Erste Group 2015 net profit equalled EUR 968.2m; turnaround driven by significantly lower risk costs, strongly improved other result (reduced one-offs compared to 2014) and lower tax charge
• Decline in operating performance, as revenues (NII, trading & FV result) impacted by low interest rate environment; costs up slightly
• Historically high minority charge due to exceptional risk performance at the savings banks and turnaround in Romania
61
66
6287
40
204
277
Q4 15 Minorities Taxes on income
Other result
Risk costs Operating expenses
Operating income
11
Q3 15
158 174 968
-1.383
Minorities 2015 Taxes on income
Other result
1.200
Risk costs
1.355
Operating expenses
82
Operating income
106
2014
Page
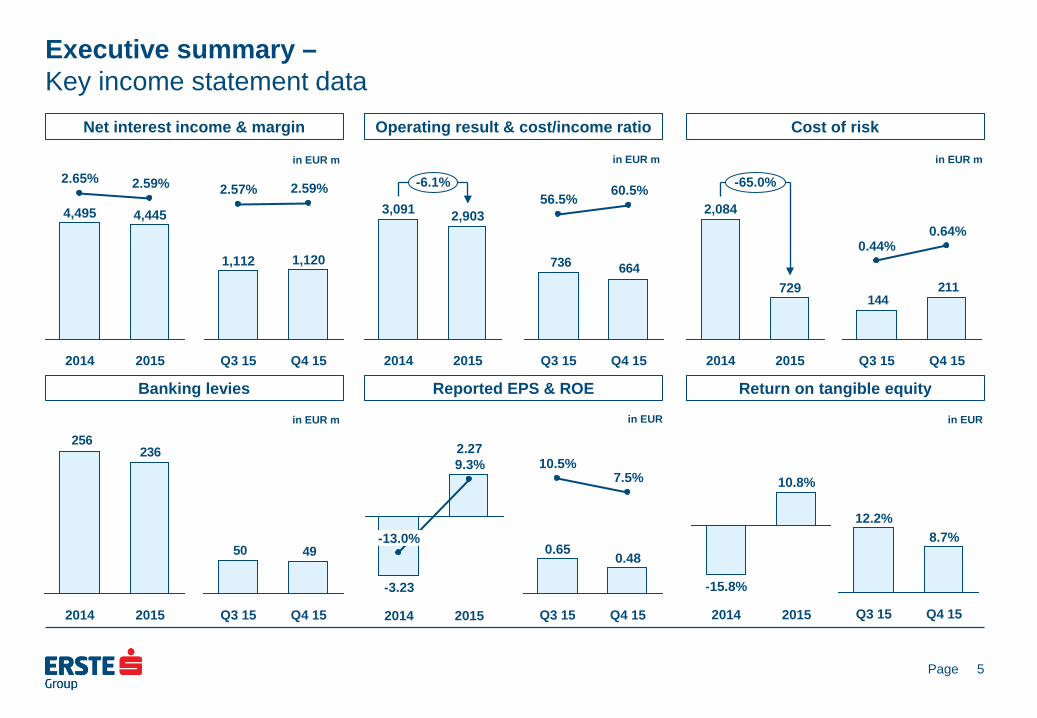
Executive summary – Key income statement data
Net interest income & margin
5
Operating result & cost/income ratio Cost of risk
Banking levies
Reported EPS & ROE
Return on tangible equity
-6.1%
2015
2,903
2014
3,091
211144
Q4 15
0.64%
Q3 15
0.44%
-65.0%
2015
729
2014
2,084
664736
Q4 15
60.5%
Q3 15
56.5%
Q4 15
1,120
2.59%
Q3 15
1,112
2.57%
4950
Q4 15 Q3 15
236256
2015 2014 2015
2.27 9.3%
2014
-3.23
-13.0%
Q4 15
0.48
7.5%
Q3 15
0.65
10.5%
2015
4,445
2.59%
2014
4,495
2.65% in EUR m
in EUR m
in EUR m in EUR m
in EUR in EUR
2015
10.8%
2014
-15.8%
Q4 15
8.7%
Q3 15
12.2%
Page
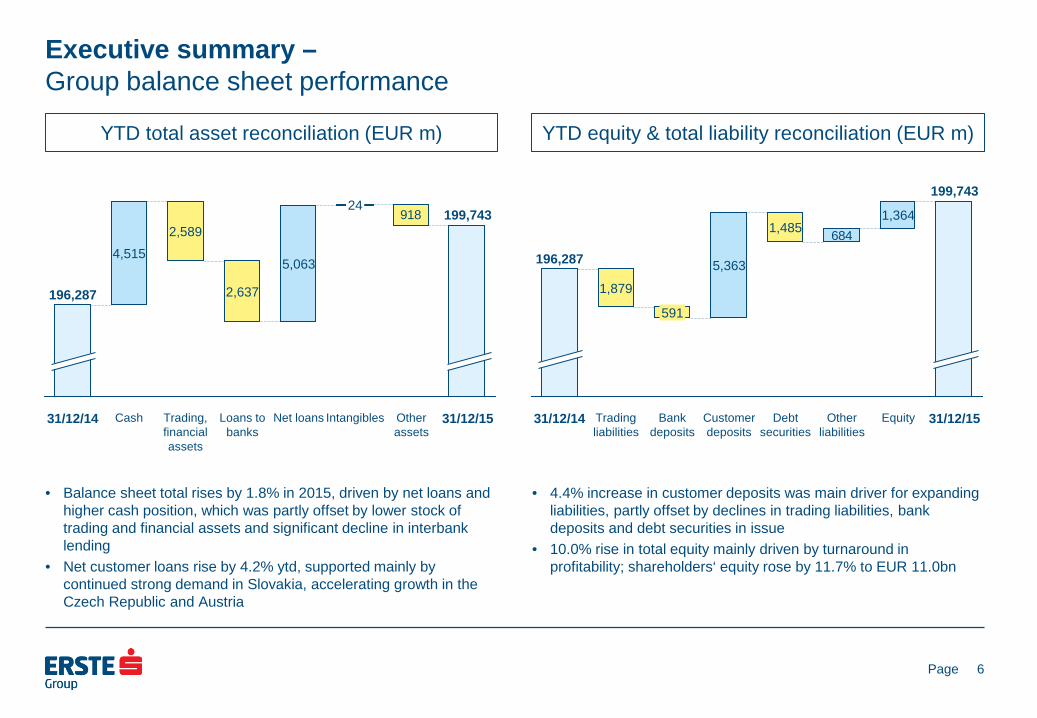
Executive summary – Group balance sheet performance
YTD total asset reconciliation (EUR m)
YTD equity & total liability reconciliation (EUR m)
6
• Balance sheet total rises by 1.8% in 2015, driven by net loans and higher cash position, which was partly offset by lower stock of trading and financial assets and significant decline in interbank lending
• Net customer loans rise by 4.2% ytd, supported mainly by continued strong demand in Slovakia, accelerating growth in the Czech Republic and Austria
• 4.4% increase in customer deposits was main driver for expanding liabilities, partly offset by declines in trading liabilities, bank deposits and debt securities in issue
• 10.0% rise in total equity mainly driven by turnaround in profitability; shareholders‘ equity rose by 11.7% to EUR 11.0bn
918
31/12/15
199,743
Other assets
Intangibles
24
Net loans
5,063
Loans to banks
2,637
Trading, financial assets
2,589
Cash
4,515
31/12/14
196,287
684
31/12/15
199,743
Equity
1,364
Other liabilities
Debt securities
1,485
Customer deposits
5,363
Bank deposits
591
Trading liabilities
1,879
31/12/14
196,287
Page
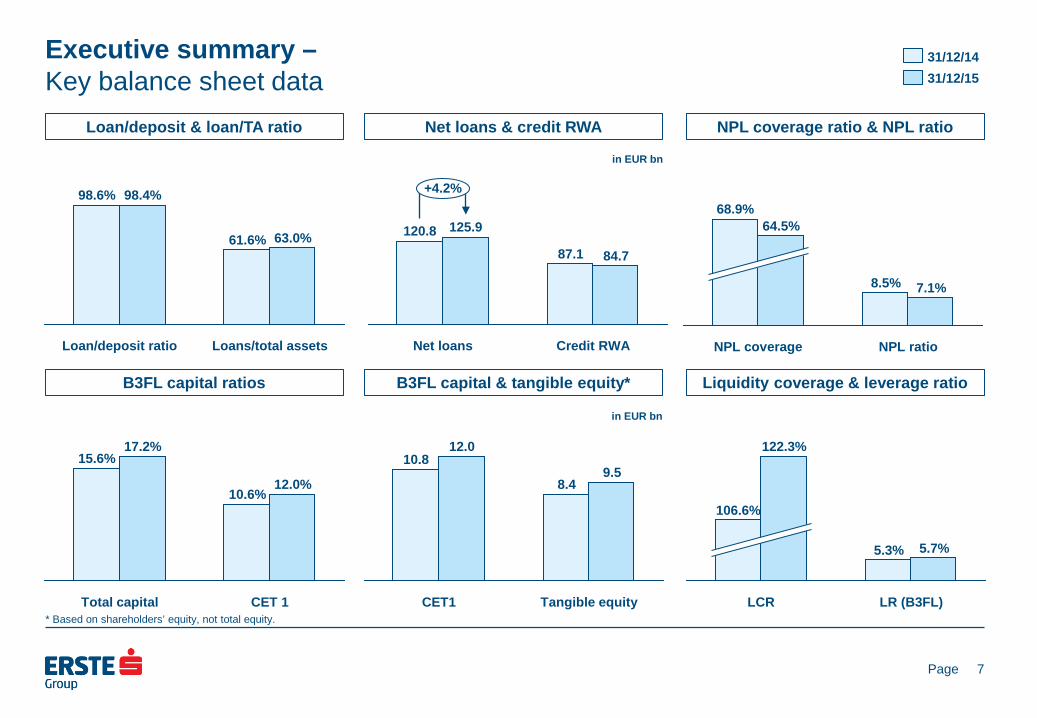
Executive summary – Key balance sheet data
Loan/deposit & loan/TA ratio
7
Net loans & credit RWA NPL coverage ratio & NPL ratio
B3FL capital ratios
B3FL capital & tangible equity*
Liquidity coverage & leverage ratio
+4.2%
Credit RWA
84.7 87.1
Net loans
125.9 120.8
31/12/15 31/12/14
NPL ratio
7.1% 8.5%
NPL coverage
64.5% 68.9%
Loans/total assets
63.0% 61.6%
Loan/deposit ratio
98.4% 98.6%
Tangible equity
9.5 8.4
CET1
12.0 10.8
CET 1
12.0% 10.6%
Total capital
17.2% 15.6%
* Based on shareholders’ equity, not total equity. LR (B3FL)
5.7% 5.3%
LCR
122.3%
106.6%
in EUR bn
in EUR bn

Page
Presentation topics
8
• Executive summary • Business environment • Business performance • Assets and liabilities • Outlook • Additional information
Page
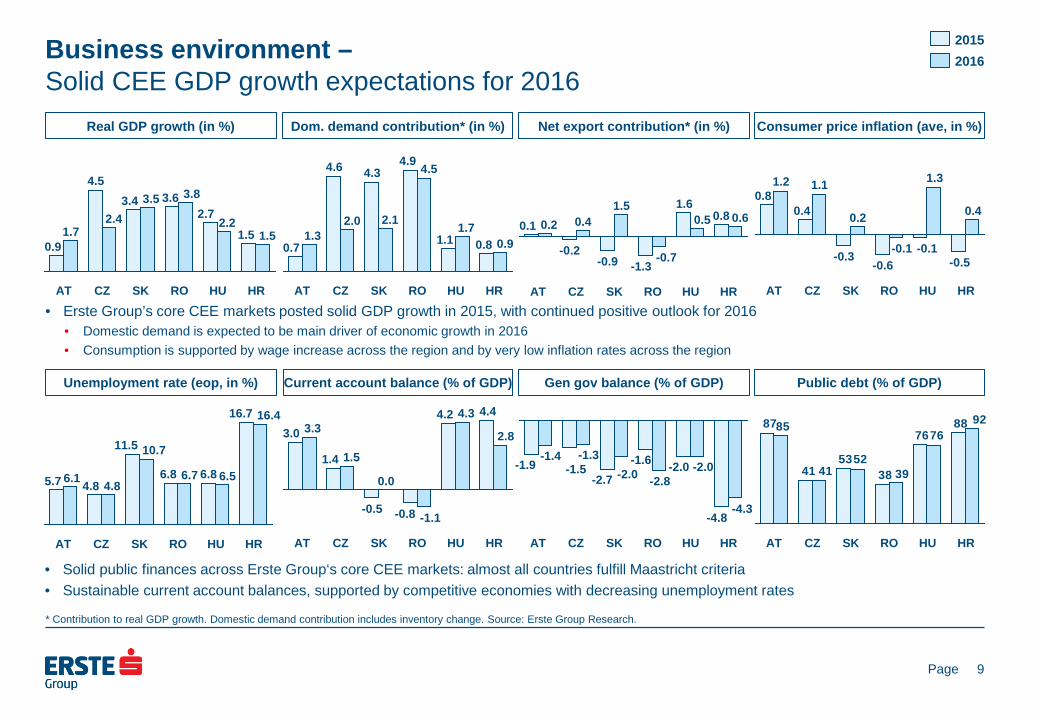
Business environment – Solid CEE GDP growth expectations for 2016
Real GDP growth (in %)
9
Dom. demand contribution* (in %) Net export contribution* (in %)
Unemployment rate (eop, in %)
Current account balance (% of GDP)
Gen gov balance (% of GDP)
Consumer price inflation (ave, in %)
Public debt (% of GDP)
• Erste Group’s core CEE markets posted solid GDP growth in 2015, with continued positive outlook for 2016 • Domestic demand is expected to be main driver of economic growth in 2016 • Consumption is supported by wage increase across the region and by very low inflation rates across the region
• Solid public finances across Erste Group‘s core CEE markets: almost all countries fulfill Maastricht criteria • Sustainable current account balances, supported by competitive economies with decreasing unemployment rates
HR
0.9 0.8
HU
1.7 1.1
RO
4.5 4.9
SK
2.1
4.3
CZ
2.0
4.6
AT
1.3 0.7
2016 2015
HR
1.5 1.5
HU
2.2 2.7
RO
3.8 3.6
SK
3.5 3.4
CZ
2.4
4.5
AT
1.7 0.9
HR
0.4
-0.5
HU
1.3
-0.1
RO
-0.1 -0.6
SK
0.2
-0.3
CZ
1.1
0.4
AT
1.2 0.8
HR
16.4 16.7
HU
6.5 6.8
RO
6.7 6.8
SK
10.7 11.5
CZ
4.8 4.8
AT
6.1 5.7
HR
2.8
4.4
HU
4.3 4.2
RO
-1.1 -0.8
SK
0.0
-0.5
CZ
1.5 1.4
AT
3.3 3.0
-2.0
RO
-2.8
-1.6
SK
-2.0 -2.7
CZ
-1.3 -1.5
AT
-1.4 -1.9
HR
-4.3 -4.8
HU
-2.0
8876
3853
41
87 9276
3952
41
85
HR HU RO SK CZ AT
* Contribution to real GDP growth. Domestic demand contribution includes inventory change. Source: Erste Group Research.
SK
-0.2
RO
-1.3
1.6
HR AT
0.2
CZ
-0.9
1.5
HU
0.1 0.8
-0.7
0.4 0.5 0.6
Page
Business environment – Decline in market interest rates continued in Q4 15
Austria
10
Czech Republic Romania
Slovakia
Hungary
Croatia
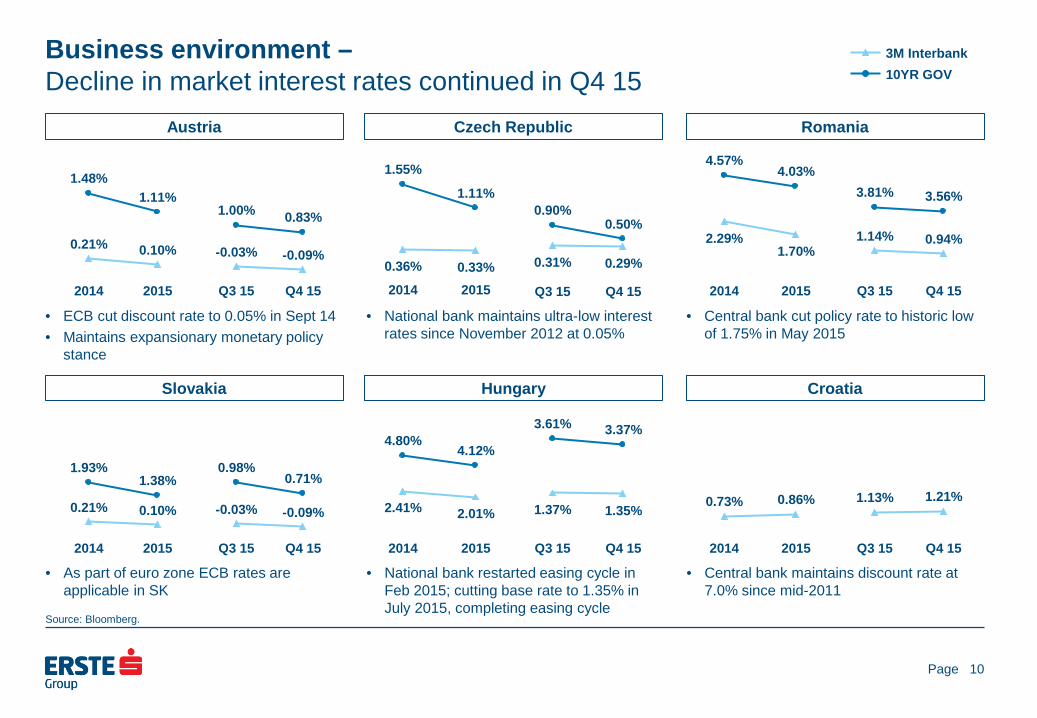
• ECB cut discount rate to 0.05% in Sept 14 • Maintains expansionary monetary policy
stance
• National bank maintains ultra-low interest rates since November 2012 at 0.05%
• Central bank cut policy rate to historic low of 1.75% in May 2015
• As part of euro zone ECB rates are applicable in SK
• National bank restarted easing cycle in Feb 2015; cutting base rate to 1.35% in July 2015, completing easing cycle
• Central bank maintains discount rate at 7.0% since mid-2011
2014 2015
1.11%
0.10%
1.48%
0.21%
10YR GOV 3M Interbank
2015 2014
1.11%
0.33%
1.55%
0.36%
2015 2014
4.03%
1.70%
4.57%
2.29%
2014 2015
1.38%
0.10%
1.93%
0.21%
2014 2015
4.12%
2.01%
4.80%
2.41%
2014 2015
0.86% 0.73%
Q4 15
0.83%
-0.09%
Q3 15
1.00%
-0.03%
Q4 15
0.50%
0.29%
Q3 15
0.90%
0.31%
Q4 15
3.56%
0.94%
Q3 15
3.81%
1.14%
Q4 15
0.71%
-0.09%
Q3 15
0.98%
-0.03%
Q4 15
3.37%
1.35%
Q3 15
3.61%
1.37%
Q4 15
1.21%
Q3 15
1.13%
Source: Bloomberg.
Page
Business environment – Limited currency volatility in CEE
EUR/CZK
11
EUR/RON
EUR/HUF
EUR/HRK
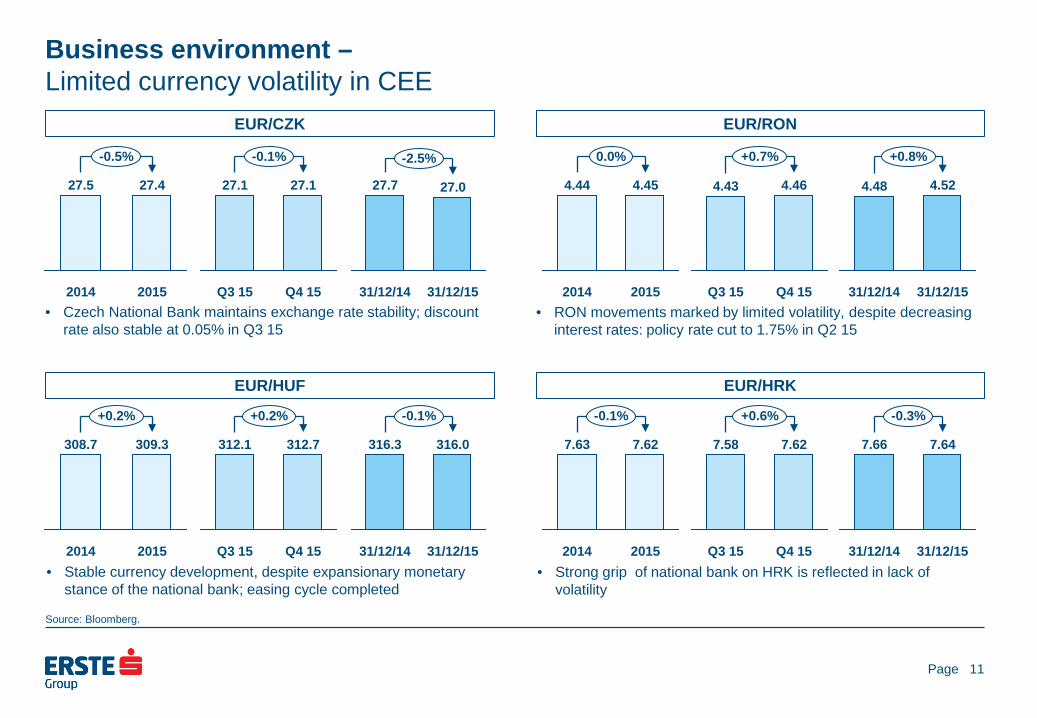
• Czech National Bank maintains exchange rate stability; discount rate also stable at 0.05% in Q3 15
• RON movements marked by limited volatility, despite decreasing interest rates: policy rate cut to 1.75% in Q2 15
• Stable currency development, despite expansionary monetary stance of the national bank; easing cycle completed
• Strong grip of national bank on HRK is reflected in lack of volatility
-0.5%
2015
27.4
2014
27.5
-0.1%
Q4 15
27.1
Q3 15
27.1
-2.5%
31/12/15
27.0
31/12/14
27.7
0.0%
2015
4.45
2014
4.44
+0.7%
Q4 15
4.46
Q3 15
4.43 4.52
31/12/14
4.48
+0.8%
31/12/15
+0.2%
2015
309.3
2014
308.7
+0.2%
Q4 15
312.7
Q3 15
312.1
-0.1%
31/12/15
316.0
31/12/14
316.3
-0.1%
2015
7.62
2014
7.63
+0.6%
Q4 15
7.62
Q3 15
7.58
31/12/14
7.66
-0.3%
31/12/15
7.64
Source: Bloomberg.
Page
Business environment – Market shares: mostly stable, RO impacted by NPL sales, write-offs
Gross retail loans
12
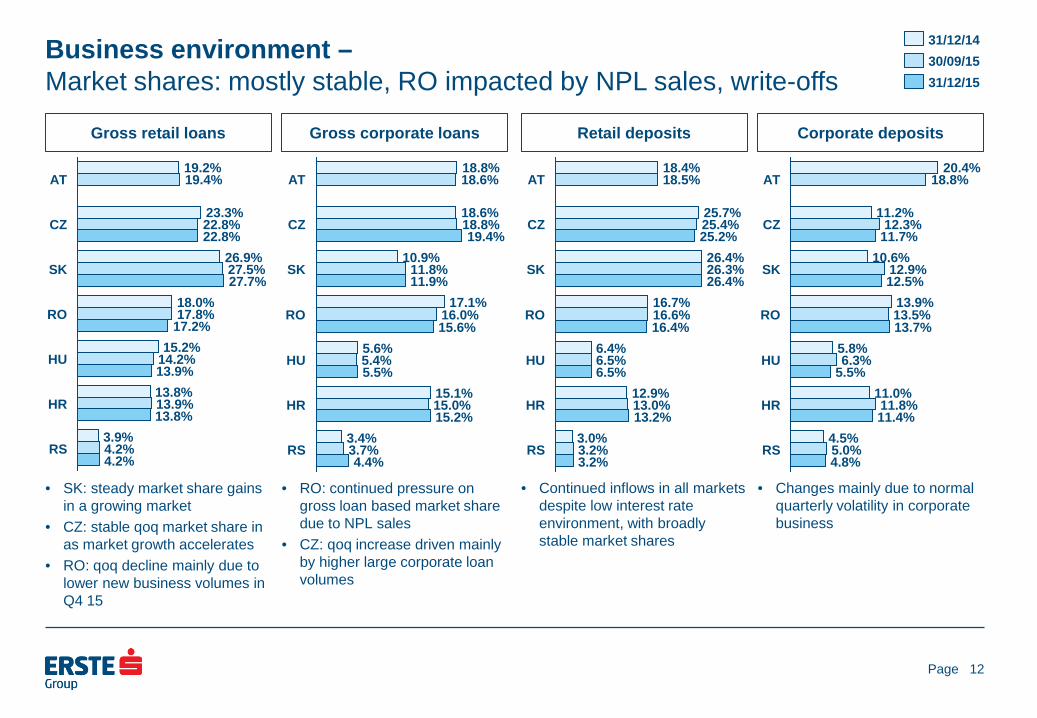
• SK: steady market share gains in a growing market
• CZ: stable qoq market share in as market growth accelerates
• RO: qoq decline mainly due to lower new business volumes in Q4 15
Gross corporate loans
• RO: continued pressure on gross loan based market share due to NPL sales
• CZ: qoq increase driven mainly by higher large corporate loan volumes
Retail deposits
• Continued inflows in all markets despite low interest rate environment, with broadly stable market shares
Corporate deposits
• Changes mainly due to normal quarterly volatility in corporate business
RS 4.2% 4.2% 3.9%
HR 13.8% 13.9% 13.8%
HU 13.9% 14.2% 15.2%
RO 17.2% 17.8% 18.0%
SK 27.7% 27.5% 26.9%
CZ 22.8% 22.8% 23.3%
AT 19.4% 19.2%
31/12/15 30/09/15 31/12/14
RS 4.4%
3.7% 3.4%
HR 15.2% 15.0% 15.1%
HU 5.5% 5.4% 5.6%
RO 15.6% 16.0%
17.1%
SK 11.9% 11.8%
10.9%
CZ 19.4%
18.8% 18.6%
AT 18.6% 18.8%
RS 3.2% 3.2% 3.0%
HR 13.2% 13.0% 12.9%
HU 6.5% 6.5% 6.4%
RO 16.4% 16.6% 16.7%
SK 26.4% 26.3% 26.4%
CZ 25.2% 25.4% 25.7%
AT 18.5% 18.4%
5.0% 4.8%
RS 4.5%
5.5%
HR 11.4% 11.8%
11.0%
HU 6.3% 5.8%
SK
RO 13.7% 13.5% 13.9%
12.5% 12.9%
10.6%
CZ 11.7% 12.3%
11.2%
AT 18.8% 20.4%

Page
Presentation topics
13
• Executive summary • Business environment • Business performance • Assets and liabilities • Outlook • Additional information
Page
Business performance: performing loan stock & growth – Performing loan volume increases by 4.4% yoy, up 0.9% qoq
Business line view (BL)
Geographic view (geo)
14
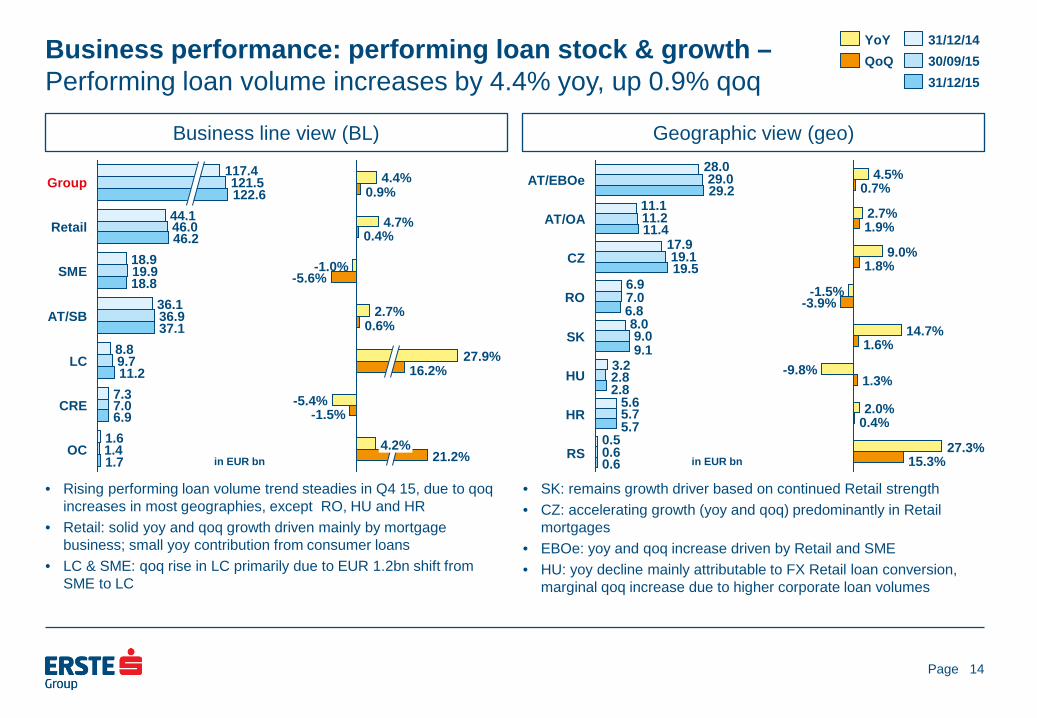
• Rising performing loan volume trend steadies in Q4 15, due to qoq increases in most geographies, except RO, HU and HR
• Retail: solid yoy and qoq growth driven mainly by mortgage business; small yoy contribution from consumer loans
• LC & SME: qoq rise in LC primarily due to EUR 1.2bn shift from SME to LC
• SK: remains growth driver based on continued Retail strength • CZ: accelerating growth (yoy and qoq) predominantly in Retail
mortgages • EBOe: yoy and qoq increase driven by Retail and SME • HU: yoy decline mainly attributable to FX Retail loan conversion,
marginal qoq increase due to higher corporate loan volumes
RS 0.6 0.6 0.5
HR 5.7 5.7 5.6
HU 2.8 2.8 3.2
SK 9.1 9.0
8.0
RO 6.8 7.0 6.9
CZ 19.5 19.1
17.9
AT/OA 11.4 11.2 11.1
AT/EBOe 29.2 29.0
28.0
OC 1.7 1.4 1.6
CRE 6.9 7.0 7.3
LC 11.2 9.7 8.8
AT/SB 37.1 36.9 36.1
SME 18.8 19.9 18.9
Retail 46.2 46.0 44.1
Group 122.6 121.5
117.4
21.2% 4.2%
-1.5% -5.4%
16.2% 27.9%
0.6% 2.7%
-5.6% -1.0%
0.4% 4.7%
0.9% 4.4%
15.3%
2.0%
14.7%
-3.9%
0.4%
27.3%
1.6%
-9.8% 1.3%
-1.5%
1.8% 9.0%
1.9% 2.7%
0.7% 4.5%
YoY QoQ
in EUR bn in EUR bn
31/12/15
31/12/14 30/09/15
Page
Business performance: customer deposit stock & growth – Deposits grow by 4.4% yoy, up 2.0% qoq
Business line view (BL)
Geographic view (geo)
15
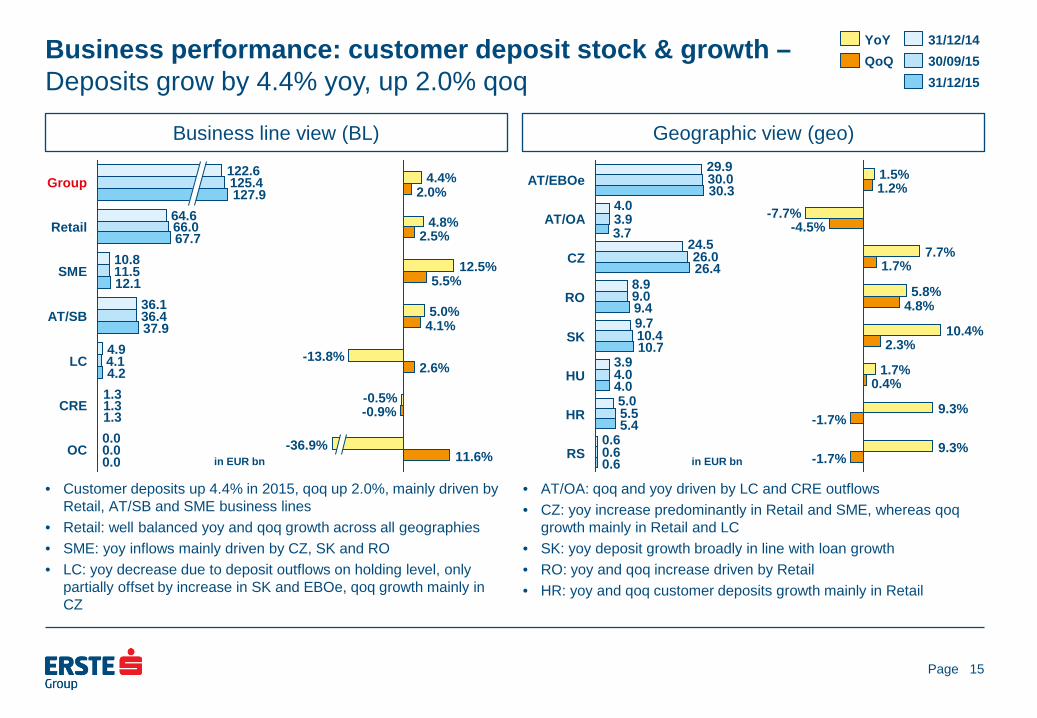
• Customer deposits up 4.4% in 2015, qoq up 2.0%, mainly driven by Retail, AT/SB and SME business lines
• Retail: well balanced yoy and qoq growth across all geographies • SME: yoy inflows mainly driven by CZ, SK and RO • LC: yoy decrease due to deposit outflows on holding level, only
partially offset by increase in SK and EBOe, qoq growth mainly in CZ
• AT/OA: qoq and yoy driven by LC and CRE outflows • CZ: yoy increase predominantly in Retail and SME, whereas qoq
growth mainly in Retail and LC • SK: yoy deposit growth broadly in line with loan growth • RO: yoy and qoq increase driven by Retail • HR: yoy and qoq customer deposits growth mainly in Retail
RS 0.6 0.6 0.6
HR 5.4 5.5 5.0
HU 4.0 4.0 3.9
SK 10.7 10.4 9.7
RO 9.4 9.0 8.9
CZ 26.4 26.0
24.5
AT/OA 3.7 3.9 4.0
AT/EBOe 30.3 30.0 29.9
OC 0.0 0.0 0.0
CRE 1.3 1.3 1.3
LC 4.2 4.1 4.9
AT/SB 37.9 36.4 36.1
SME 12.1 11.5 10.8
Retail 67.7 66.0 64.6
Group 127.9 125.4 122.6
-0.9% -0.5%
2.6% -13.8%
4.1% 5.0%
5.5% 12.5%
2.5% 4.8%
2.0% 4.4%
11.6% -36.9%
-1.7% 9.3%
-1.7% 9.3%
0.4% 1.7%
2.3% 10.4%
4.8% 5.8%
1.7% 7.7%
-4.5% -7.7%
1.2% 1.5%
QoQ YoY
in EUR bn in EUR bn
31/12/15 30/09/15 31/12/14
Page
Business performance: NII and NIM – Stable yoy and qoq NII in Q4 15 supported by loan growth, stable NIM
Business line view (BL)
Geographic view (geo)
16
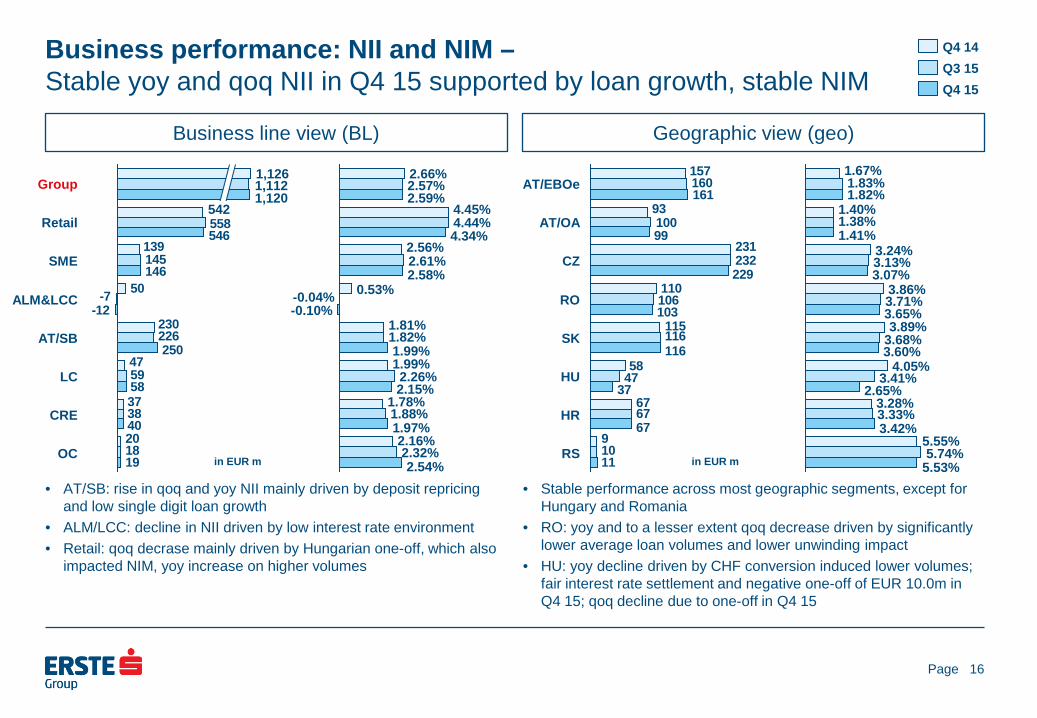
• AT/SB: rise in qoq and yoy NII mainly driven by deposit repricing and low single digit loan growth
• ALM/LCC: decline in NII driven by low interest rate environment • Retail: qoq decrase mainly driven by Hungarian one-off, which also
impacted NIM, yoy increase on higher volumes
• Stable performance across most geographic segments, except for Hungary and Romania
• RO: yoy and to a lesser extent qoq decrease driven by significantly lower average loan volumes and lower unwinding impact
• HU: yoy decline driven by CHF conversion induced lower volumes; fair interest rate settlement and negative one-off of EUR 10.0m in Q4 15; qoq decline due to one-off in Q4 15
58
9
67
115
110
231
93
157
10
67
47
116
106
232
100
160
11
67
37
116
103
229
99
161
RS
HR
HU
SK
RO
CZ
AT/OA
AT/EBOe
58
20
37
47
230
50
139
18
38
59
226
-7
145
558
19
40
250
-12
146
546
OC
CRE
LC
AT/SB
ALM&LCC
SME
Retail 542
Group 1,120 1,112 1,126
Q4 15 Q3 15 Q4 14
2.54% 2.32%
2.16% 1.97% 1.88% 1.78%
2.15% 2.26%
1.99% 1.99%
1.82% 1.81%
-0.10% -0.04% 0.53%
2.58% 2.61% 2.56%
4.34% 4.44% 4.45%
2.59% 2.57% 2.66%
5.74% 5.53%
5.55% 3.42% 3.33% 3.28%
2.65% 3.41%
4.05% 3.60% 3.68% 3.89%
3.65% 3.71% 3.86%
3.07% 3.13% 3.24%
1.41% 1.38% 1.40%
1.82% 1.83% 1.67%
in EUR m in EUR m
Page
Business performance: operating income – Q4 15 operating income stable qoq, down yoy on trading & FV result
Business line view (BL)
Geographic view (geo)
17
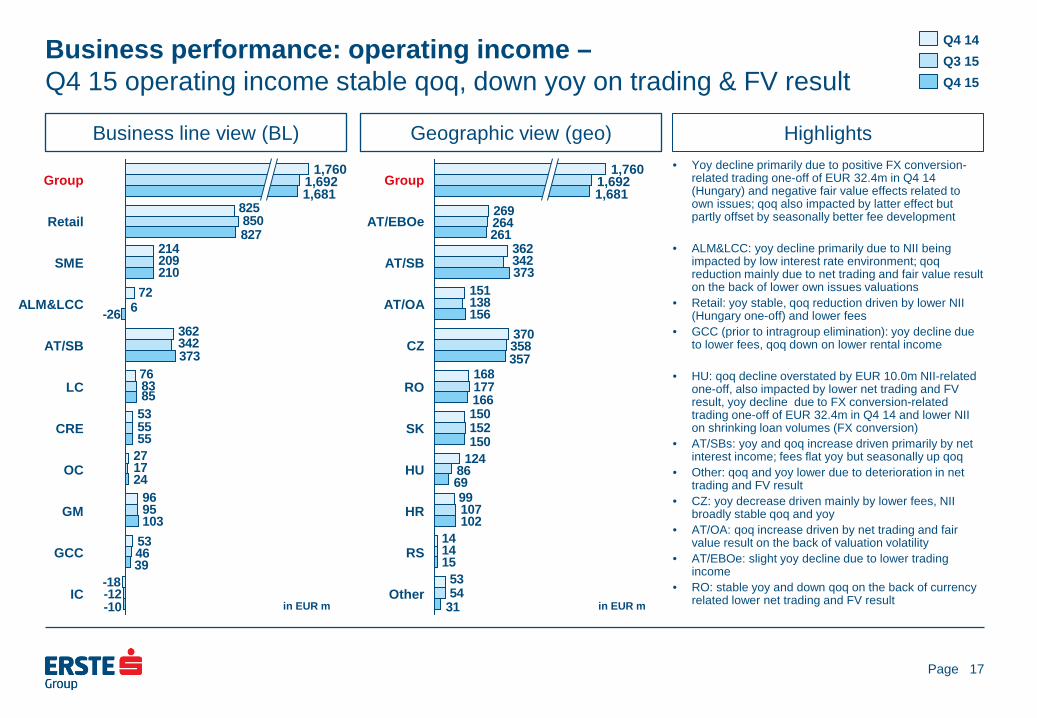
Highlights • Yoy decline primarily due to positive FX conversion-
related trading one-off of EUR 32.4m in Q4 14 (Hungary) and negative fair value effects related to own issues; qoq also impacted by latter effect but partly offset by seasonally better fee development
• ALM&LCC: yoy decline primarily due to NII being impacted by low interest rate environment; qoq reduction mainly due to net trading and fair value result on the back of lower own issues valuations
• Retail: yoy stable, qoq reduction driven by lower NII (Hungary one-off) and lower fees
• GCC (prior to intragroup elimination): yoy decline due to lower fees, qoq down on lower rental income
• HU: qoq decline overstated by EUR 10.0m NII-related
one-off, also impacted by lower net trading and FV result, yoy decline due to FX conversion-related trading one-off of EUR 32.4m in Q4 14 and lower NII on shrinking loan volumes (FX conversion)
• AT/SBs: yoy and qoq increase driven primarily by net interest income; fees flat yoy but seasonally up qoq
• Other: qoq and yoy lower due to deterioration in net trading and FV result
• CZ: yoy decrease driven mainly by lower fees, NII broadly stable qoq and yoy
• AT/OA: qoq increase driven by net trading and fair value result on the back of valuation volatility
• AT/EBOe: slight yoy decline due to lower trading income
• RO: stable yoy and down qoq on the back of currency related lower net trading and FV result
177
152
54
156
1553
14
99
124
150
168
370
151
362
269
14
107
86
358
138
342
264
31
102
69
150
166
357
373
261
Other
RS
HR
HU
SK
RO
CZ
AT/OA
AT/SB
AT/EBOe
Group 1,681 1,692
1,760
373
103
-18
53
96
27
53
76
362
72
214
825
-12
46
95
17
55
83
342
6
209
850
-10
39
24
55
85
-26
210
827
IC
GCC
GM
OC
CRE
LC
AT/SB
ALM&LCC
SME
Retail
Group 1,681 1,692
1,760
Q4 15 Q3 15 Q4 14
in EUR m in EUR m
Page
Business performance: operating expenses – Q4 15 costs stable yoy, up qoq on seasonally higher costs
Business line view (BL)
Geographic view (geo)
18
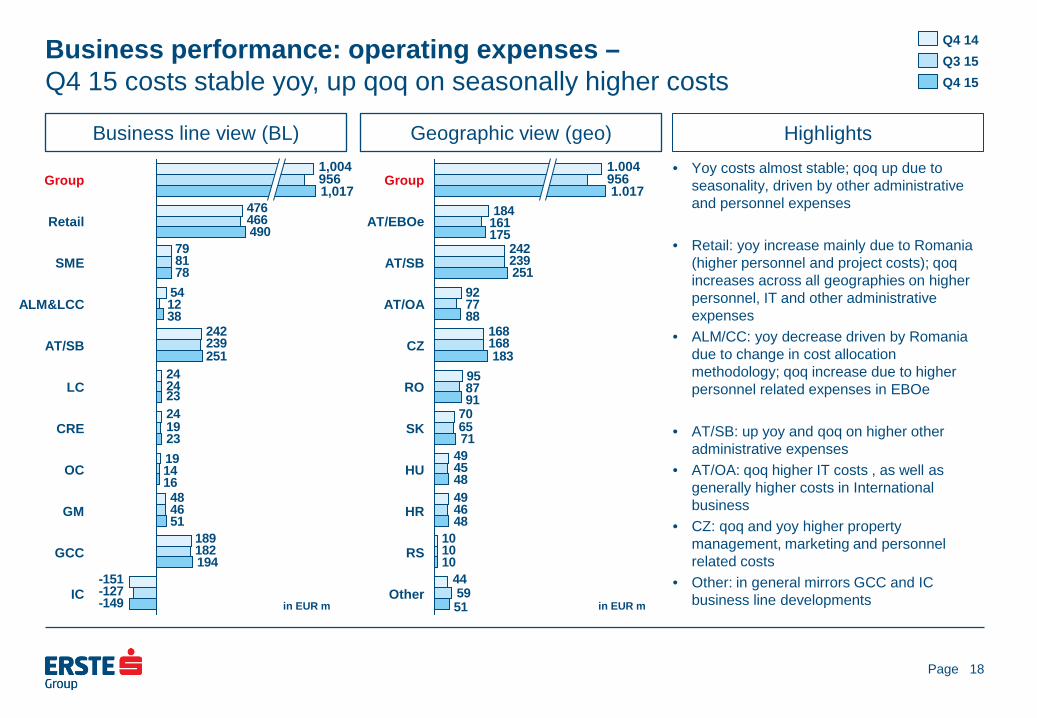
Highlights • Yoy costs almost stable; qoq up due to
seasonality, driven by other administrative and personnel expenses
• Retail: yoy increase mainly due to Romania (higher personnel and project costs); qoq increases across all geographies on higher personnel, IT and other administrative expenses
• ALM/CC: yoy decrease driven by Romania due to change in cost allocation methodology; qoq increase due to higher personnel related expenses in EBOe
• AT/SB: up yoy and qoq on higher other administrative expenses
• AT/OA: qoq higher IT costs , as well as generally higher costs in International business
• CZ: qoq and yoy higher property management, marketing and personnel related costs
• Other: in general mirrors GCC and IC business line developments
95
1044
10
49
49
70
168
92
242
184
59
10
46
45
65
87
168
77
239
161
51
48
48
71
91
183
88
251
175
Other
RS
HR
HU
SK
RO
CZ
AT/OA
AT/SB
AT/EBOe
Group 1.017
956 1.004
490
251
51
-151
189
48
19
24
24
242
54
79
476
-127
182
46
14
19
24
239
12
81
466
-149
194
16
23
23
38
78
IC
GCC
GM
OC
CRE
LC
AT/SB
ALM&LCC
SME
Retail
Group 1,017 956 1,004
Q4 15 Q3 15 Q4 14
in EUR m in EUR m
Page
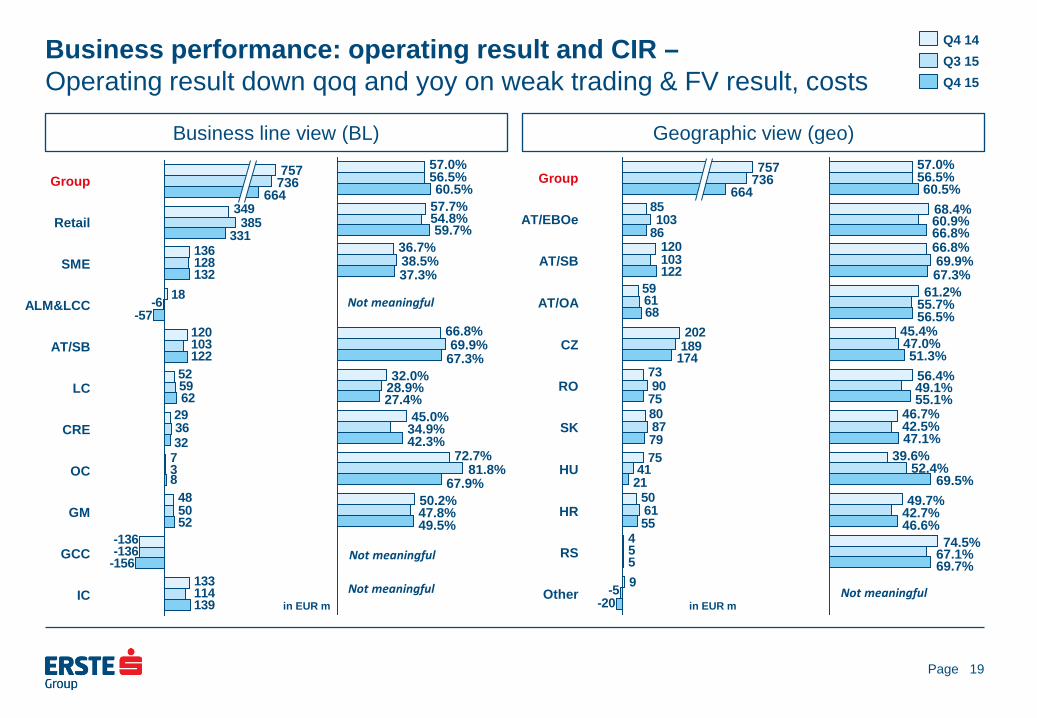
Business performance: operating result and CIR – Operating result down qoq and yoy on weak trading & FV result, costs
Business line view (BL)
Geographic view (geo)
19
122
9
4
50
75
80
73
202
59
120
85
-5
5
61
41
87
90
189
61
103
103
-20
5
55
21
79
75
174
68
86
Other
RS
HR
HU
SK
RO
CZ
AT/OA
AT/SB
AT/EBOe
Group 664
736 757
18
52
139
133
-136
48
7
29
52
120
136
349
114
-136
50
3
36
59
103
-6
128
385
-156
8
32
62
122
-57
132
331
IC
GCC
GM
OC
CRE
LC
AT/SB
ALM&LCC
SME
Retail
Group 664
736 757
Q4 15 Q3 15 Q4 14
69.7% 67.1% 74.5%
46.6% 42.7% 49.7%
69.5% 52.4%
39.6% 47.1% 42.5% 46.7%
55.1% 49.1% 56.4%
51.3% 47.0% 45.4%
56.5% 55.7% 61.2%
67.3% 69.9%
66.8% 66.8% 60.9% 68.4%
60.5% 56.5% 57.0%
49.5% 47.8% 50.2%
67.9% 81.8%
72.7% 42.3% 34.9% 45.0%
27.4% 28.9% 32.0%
67.3% 69.9%
66.8%
37.3% 38.5% 36.7%
59.7% 54.8% 57.7% 60.5%
56.5% 57.0%
in EUR m in EUR m
Not meaningful
Not meaningful
Not meaningful Not meaningful
Page
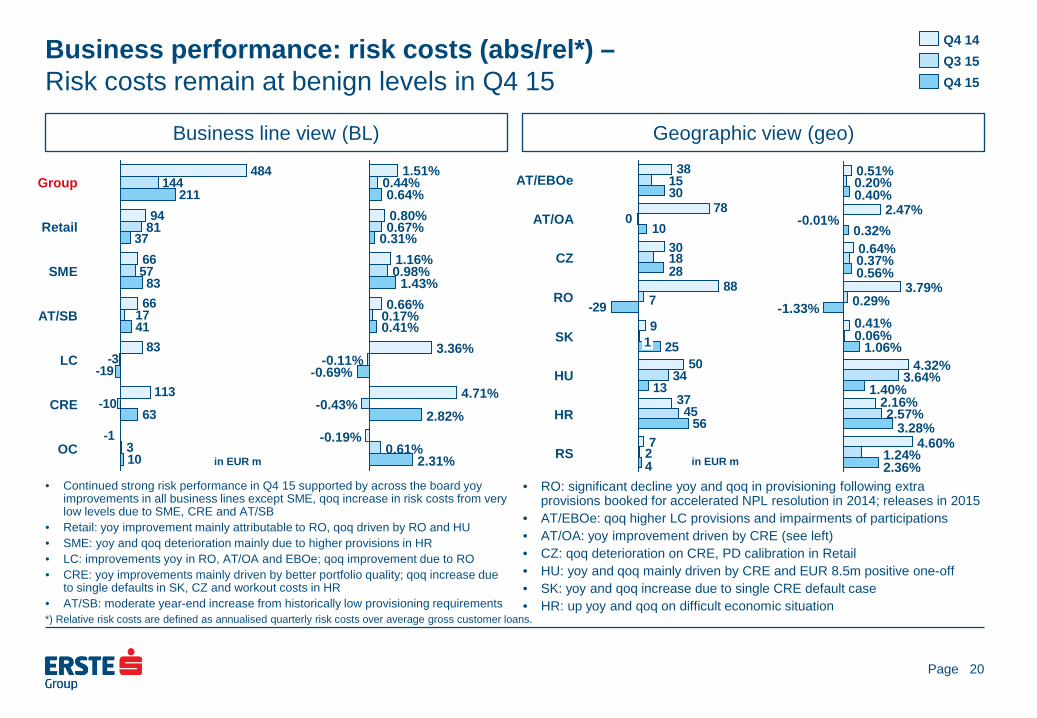
Business performance: risk costs (abs/rel*) – Risk costs remain at benign levels in Q4 15
Business line view (BL)
Geographic view (geo)
20
• Continued strong risk performance in Q4 15 supported by across the board yoy improvements in all business lines except SME, qoq increase in risk costs from very low levels due to SME, CRE and AT/SB
• Retail: yoy improvement mainly attributable to RO, qoq driven by RO and HU • SME: yoy and qoq deterioration mainly due to higher provisions in HR • LC: improvements yoy in RO, AT/OA and EBOe; qoq improvement due to RO • CRE: yoy improvements mainly driven by better portfolio quality; qoq increase due
to single defaults in SK, CZ and workout costs in HR • AT/SB: moderate year-end increase from historically low provisioning requirements
• RO: significant decline yoy and qoq in provisioning following extra provisions booked for accelerated NPL resolution in 2014; releases in 2015
• AT/EBOe: qoq higher LC provisions and impairments of participations • AT/OA: yoy improvement driven by CRE (see left) • CZ: qoq deterioration on CRE, PD calibration in Retail • HU: yoy and qoq mainly driven by CRE and EUR 8.5m positive one-off • SK: yoy and qoq increase due to single CRE default case • HR: up yoy and qoq on difficult economic situation
30
925
7
37
50
88
78
38
2
45
34
18
15
7
0
4
56
13
28
10
30
-29
RS
HR
HU
SK 1
RO
CZ
AT/OA
AT/EBOe 484
144
57
211
37
83
41
-1
113
83
66
66
94
3
-10
-3
17
10
63
-19
OC
CRE
LC
AT/SB
SME
Retail 81
Group
2.31% 0.61%
-0.19% 2.82%
-0.43% 4.71%
-0.69% -0.11%
3.36% 0.41% 0.17% 0.66%
1.43% 0.98% 1.16%
0.31% 0.67% 0.80% 0.64%
0.44% 1.51%
2.36% 1.24%
4.60% 3.28%
2.57% 2.16%
1.40% 3.64%
4.32% 1.06%
0.06% 0.41%
-1.33% 0.29% 3.79%
0.56% 0.37% 0.64%
0.32% -0.01%
2.47% 0.40% 0.20% 0.51%
Q3 15 Q4 14
Q4 15
in EUR m in EUR m
*) Relative risk costs are defined as annualised quarterly risk costs over average gross customer loans.
Page
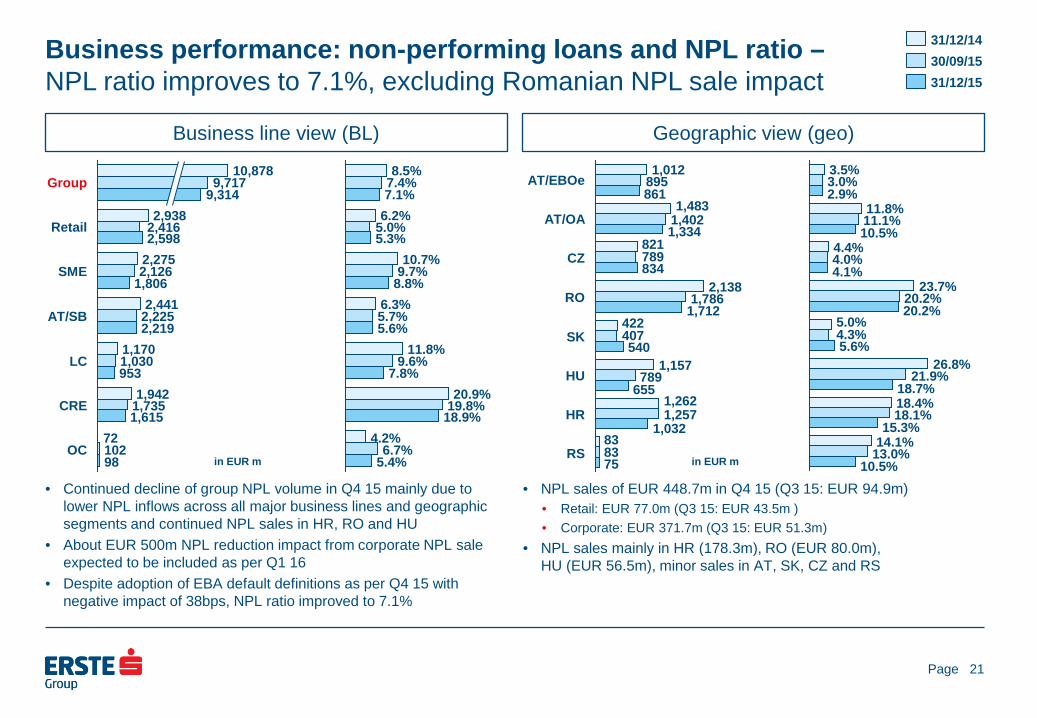
Business performance: non-performing loans and NPL ratio – NPL ratio improves to 7.1%, excluding Romanian NPL sale impact
Business line view (BL)
Geographic view (geo)
21
• Continued decline of group NPL volume in Q4 15 mainly due to lower NPL inflows across all major business lines and geographic segments and continued NPL sales in HR, RO and HU
• About EUR 500m NPL reduction impact from corporate NPL sale expected to be included as per Q1 16
• Despite adoption of EBA default definitions as per Q4 15 with negative impact of 38bps, NPL ratio improved to 7.1%
• NPL sales of EUR 448.7m in Q4 15 (Q3 15: EUR 94.9m) • Retail: EUR 77.0m (Q3 15: EUR 43.5m ) • Corporate: EUR 371.7m (Q3 15: EUR 51.3m)
• NPL sales mainly in HR (178.3m), RO (EUR 80.0m), HU (EUR 56.5m), minor sales in AT, SK, CZ and RS
RS 75 83 83
HR 1,032
1,257 1,262
HU 655 789
1,157
SK 540
407 422
RO 1,712 1,786
2,138
CZ 834 789 821
AT/OA 1,334 1,402 1,483
AT/EBOe 861 895 1,012
OC 98 102 72
CRE 1,615 1,735 1,942
LC 953 1,030 1,170
AT/SB 2,219 2,225 2,441
SME 1,806 2,126 2,275
Retail 2,598 2,416 2,938
Group 9,314 9,717
10,878
5.4% 6.7%
4.2% 18.9% 19.8% 20.9%
7.8% 9.6%
11.8% 5.6% 5.7% 6.3%
8.8% 9.7% 10.7%
5.3% 5.0% 6.2% 7.1% 7.4% 8.5%
18.7%
4.0%
10.5% 13.0% 14.1%
18.4%
4.4%
18.1% 15.3%
21.9% 26.8%
5.6% 4.3% 5.0%
23.7% 4.1%
20.2% 20.2%
10.5% 11.1% 11.8%
2.9% 3.0% 3.5%
31/12/15 30/09/15 31/12/14
in EUR m in EUR m
Page
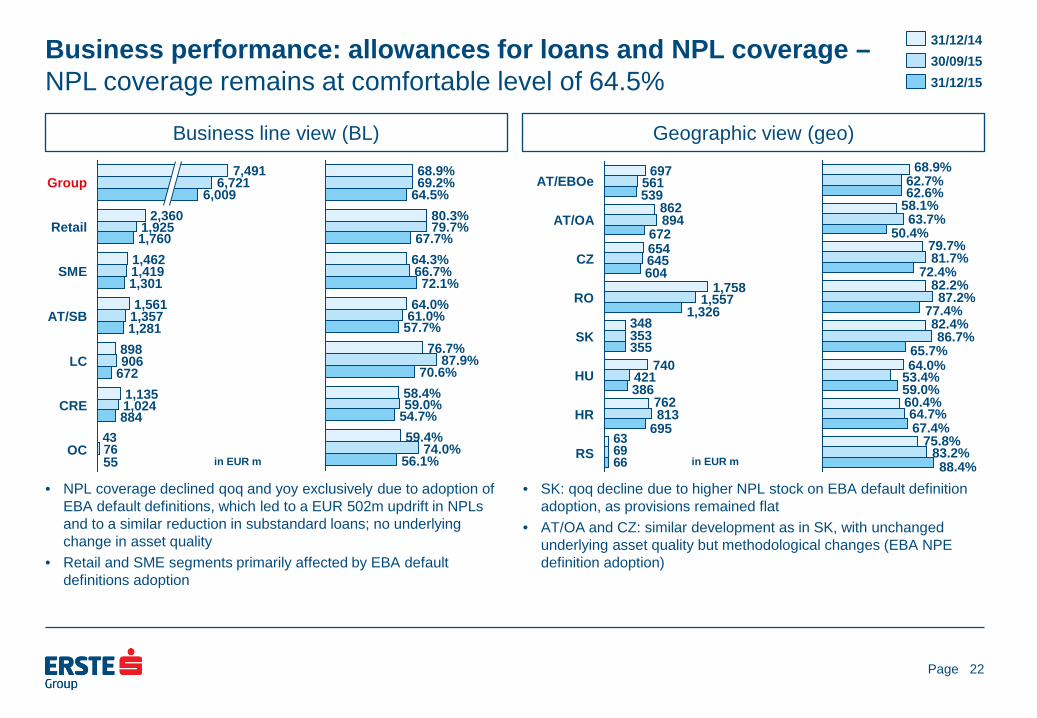
Business performance: allowances for loans and NPL coverage – NPL coverage remains at comfortable level of 64.5%
Business line view (BL)
Geographic view (geo)
22
• NPL coverage declined qoq and yoy exclusively due to adoption of EBA default definitions, which led to a EUR 502m updrift in NPLs and to a similar reduction in substandard loans; no underlying change in asset quality
• Retail and SME segments primarily affected by EBA default definitions adoption
• SK: qoq decline due to higher NPL stock on EBA default definition adoption, as provisions remained flat
• AT/OA and CZ: similar development as in SK, with unchanged underlying asset quality but methodological changes (EBA NPE definition adoption)
636966RS
HR 695 813 762
HU 386 421
740
SK 355 353 348
RO 1,326
1,557 1,758
CZ 604 645 654
AT/OA 672
894 862
AT/EBOe 539 561
697
4376OC 55
CRE 884 1,024 1,135
LC 672 906 898
AT/SB 1,281 1,357 1,561
SME 1,301 1,419 1,462
Retail 1,760 1,925
2,360
Group 6,009
6,721 7,491
56.1% 74.0%
59.4% 54.7% 59.0% 58.4%
70.6% 87.9%
76.7% 57.7% 61.0% 64.0%
72.1% 66.7% 64.3% 67.7%
79.7% 80.3%
64.5% 69.2% 68.9%
88.4% 83.2%
75.8% 67.4% 64.7%
60.4% 59.0% 53.4% 64.0% 65.7%
86.7% 82.4%
77.4% 87.2%
82.2% 72.4%
81.7% 79.7%
50.4% 63.7%
58.1% 62.6% 62.7%
68.9%
31/12/15 30/09/15 31/12/14
in EUR m in EUR m
Page
Business performance: other result – Q4 15 other result burdened by one-offs, mainly related to Romania
Business line view
Geographic view
23
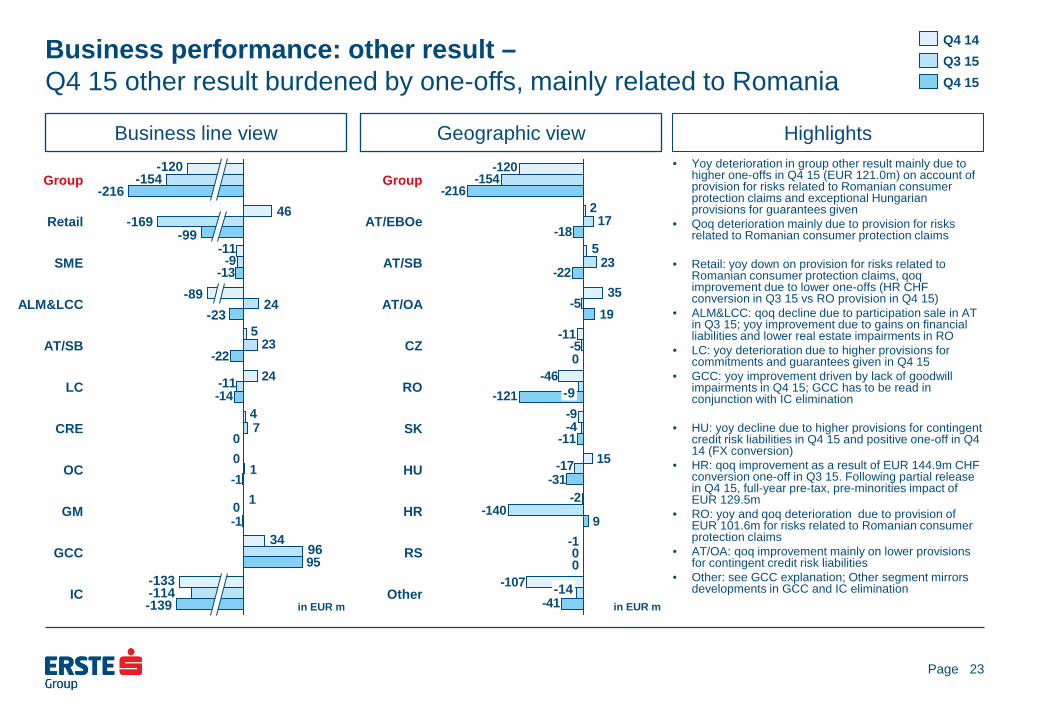
Highlights • Yoy deterioration in group other result mainly due to
higher one-offs in Q4 15 (EUR 121.0m) on account of provision for risks related to Romanian consumer protection claims and exceptional Hungarian provisions for guarantees given
• Qoq deterioration mainly due to provision for risks related to Romanian consumer protection claims
• Retail: yoy down on provision for risks related to Romanian consumer protection claims, qoq improvement due to lower one-offs (HR CHF conversion in Q3 15 vs RO provision in Q4 15)
• ALM&LCC: qoq decline due to participation sale in AT in Q3 15; yoy improvement due to gains on financial liabilities and lower real estate impairments in RO
• LC: yoy deterioration due to higher provisions for commitments and guarantees given in Q4 15
• GCC: yoy improvement driven by lack of goodwill impairments in Q4 15; GCC has to be read in conjunction with IC elimination
• HU: yoy decline due to higher provisions for contingent credit risk liabilities in Q4 15 and positive one-off in Q4 14 (FX conversion)
• HR: qoq improvement as a result of EUR 144.9m CHF conversion one-off in Q3 15. Following partial release in Q4 15, full-year pre-tax, pre-minorities impact of EUR 129.5m
• RO: yoy and qoq deterioration due to provision of EUR 101.6m for risks related to Romanian consumer protection claims
• AT/OA: qoq improvement mainly on lower provisions for contingent credit risk liabilities
• Other: see GCC explanation; Other segment mirrors developments in GCC and IC elimination
15
23
9
-107
-1
-2
-9
-46
-11
35
5
2
-120
0
-140
-17
-4
-5
-5
17
-154
-41
0
-31
-11
-121
0
19
-22
-18
-216
Other -14
RS
HR
HU
SK
RO -9
CZ
AT/OA
AT/SB
AT/EBOe
Group
24
95
1
0
4
5
-11
0
1
7
-11
23
-9
-1
-1
0
-14
-22
-13
GCC 96 34
GM
OC
CRE
LC
AT/SB
IC -139 -114 -133
ALM&LCC -23
24 -89
SME
Retail -99
-169 46
Group -216
-154 -120
Q4 15
Q4 14 Q3 15
in EUR m in EUR m
Page
Business performance: net result – Q4 15 net result up yoy on lower risk costs, down qoq
Net result by business line
Net result by geography
24
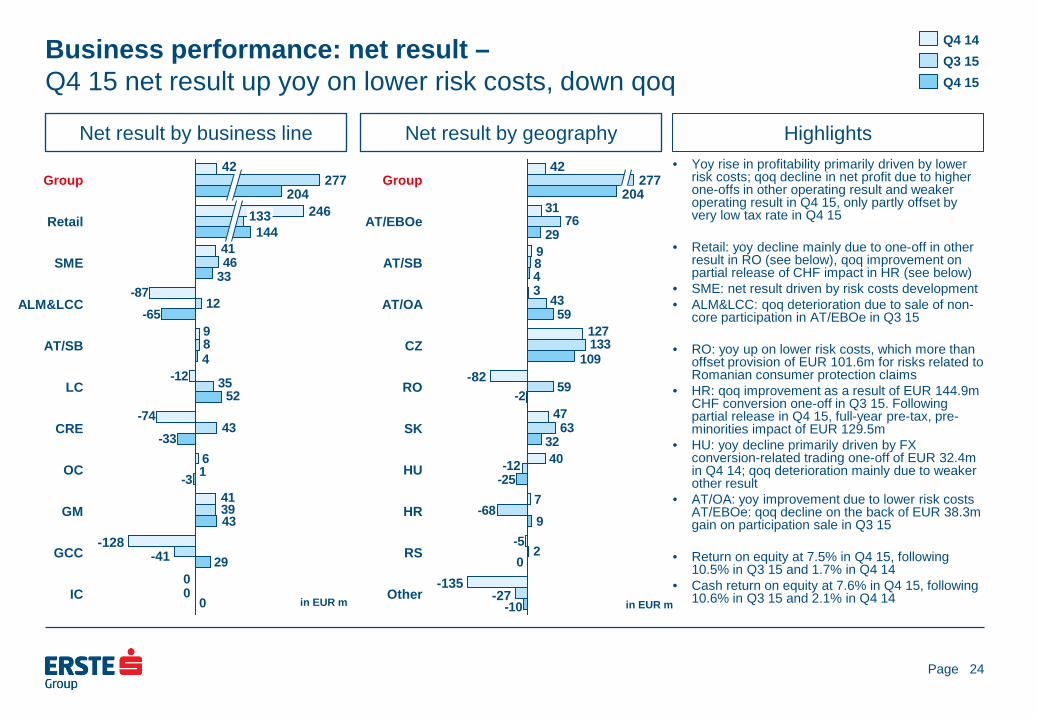
Highlights • Yoy rise in profitability primarily driven by lower
risk costs; qoq decline in net profit due to higher one-offs in other operating result and weaker operating result in Q4 15, only partly offset by very low tax rate in Q4 15
• Retail: yoy decline mainly due to one-off in other result in RO (see below), qoq improvement on partial release of CHF impact in HR (see below)
• SME: net result driven by risk costs development • ALM&LCC: qoq deterioration due to sale of non-
core participation in AT/EBOe in Q3 15
• RO: yoy up on lower risk costs, which more than offset provision of EUR 101.6m for risks related to Romanian consumer protection claims
• HR: qoq improvement as a result of EUR 144.9m CHF conversion one-off in Q3 15. Following partial release in Q4 15, full-year pre-tax, pre-minorities impact of EUR 129.5m
• HU: yoy decline primarily driven by FX conversion-related trading one-off of EUR 32.4m in Q4 14; qoq deterioration mainly due to weaker other result
• AT/OA: yoy improvement due to lower risk costs AT/EBOe: qoq decline on the back of EUR 38.3m gain on participation sale in Q3 15
• Return on equity at 7.5% in Q4 15, following 10.5% in Q3 15 and 1.7% in Q4 14
• Cash return on equity at 7.6% in Q4 15, following 10.6% in Q3 15 and 2.1% in Q4 14
40
7
59
59
-5
47
127
3
9
31
2
-68
-12
63
133
43
8
76
-10
0
9
-25
32
-2
109
4
29
Other -27 -135
RS
HR
HU
SK
RO -82
CZ
AT/OA
AT/SB
AT/EBOe
Group 204
277 42
6
46
290
41
-74
-12
9
-87
41
0
39
1
43
35
8
12
0
43
-3
-33
52
4
-65
33
IC
GCC -41 -128
GM
OC
CRE
LC
AT/SB
ALM&LCC
SME
Retail 144
133 246
Group 204
277 42
Q4 15 Q3 15 Q4 14
in EUR m in EUR m

Page
Presentation topics
25
• Executive summary • Business environment • Business performance • Assets and liabilities • Outlook • Additional information
Page
Assets and liabilities: YTD overview – Loan/deposit ratio stable at 98.4% (Dec 14: 98.6%)
Assets (EUR bn)
26
Assets (in %)
Liabilities & equity (EUR bn)
Liabilities & equity (in %)
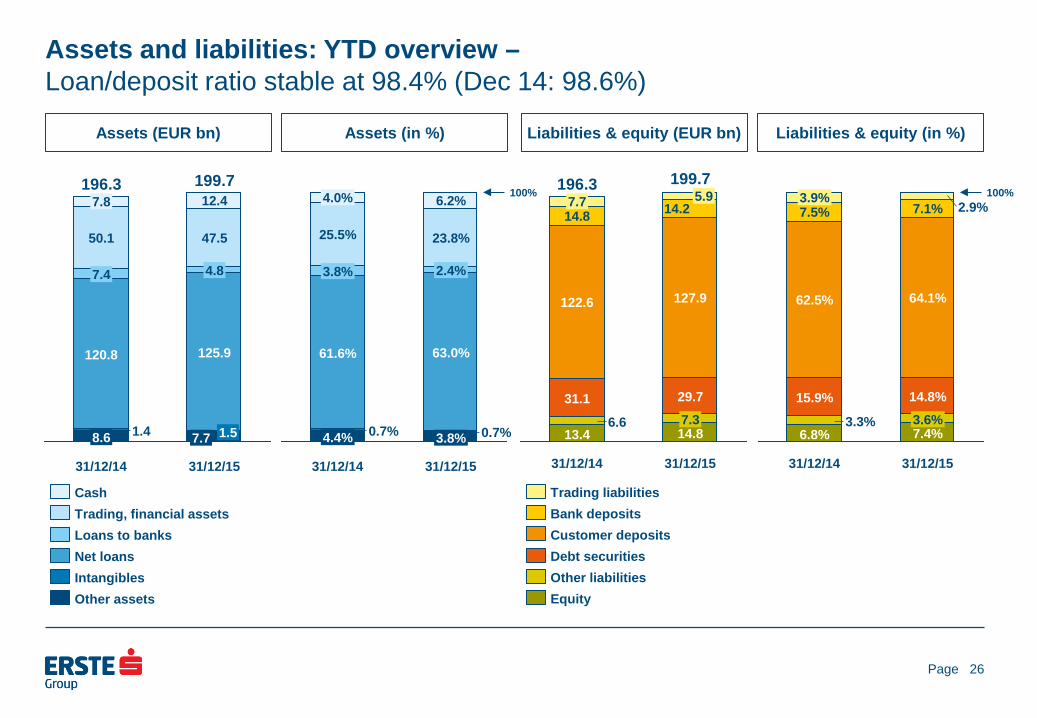
31/12/15
199.7
7.7 1.5
125.9
4.8
47.5
12.4
31/12/14
196.3
8.6 1.4
120.8
7.4
50.1
7.8
Other assets Intangibles Net loans Loans to banks Trading, financial assets Cash
31/12/15
199.7
14.8 7.3 29.7
127.9
14.2 5.9
31/12/14
196.3
13.4 6.6
31.1
122.6
14.8 7.7
Equity Other liabilities Debt securities Customer deposits Bank deposits Trading liabilities
100%
31/12/15
3.8% 0.7%
63.0%
2.4%
23.8%
6.2%
31/12/14
4.4% 0.7%
61.6%
3.8%
25.5%
4.0% 100%
31/12/15
7.4% 3.6% 14.8%
64.1%
7.1% 2.9%
31/12/14
6.8% 3.3%
15.9%
62.5%
7.5% 3.9%
Page
Assets and liabilities: customer loans by country of risk – Performing loans up 4.4% yoy, NPLs down 14.4%
Net customer loans (EUR bn)
Performing loans (EUR bn)
27
Non-performing loans (EUR bn)
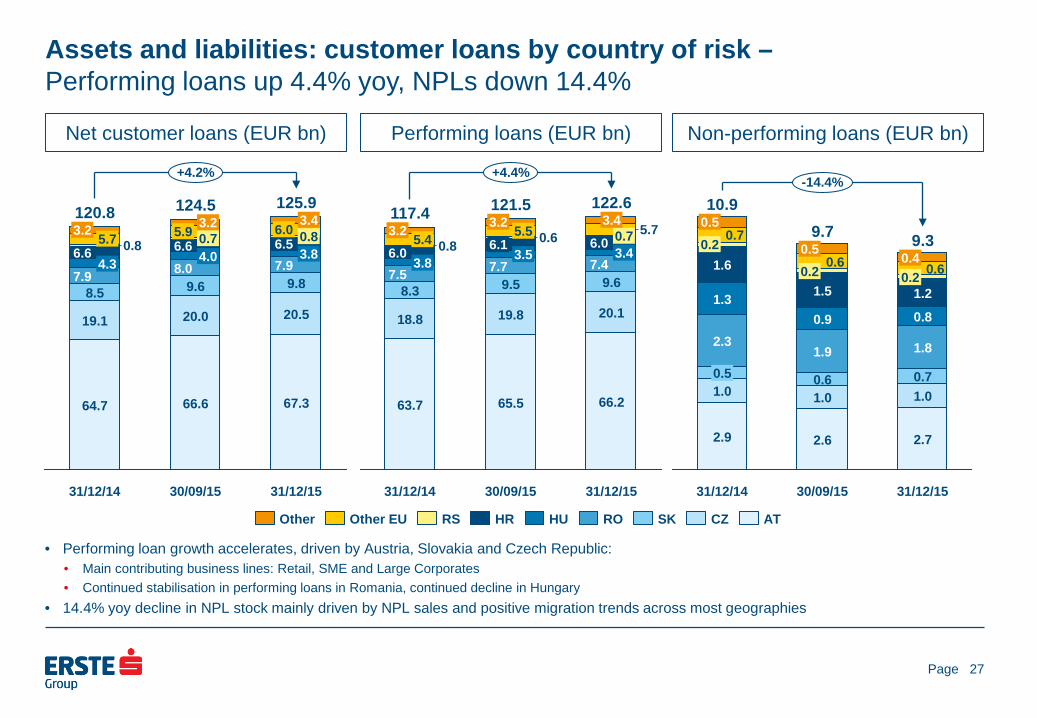
• Performing loan growth accelerates, driven by Austria, Slovakia and Czech Republic: • Main contributing business lines: Retail, SME and Large Corporates • Continued stabilisation in performing loans in Romania, continued decline in Hungary
• 14.4% yoy decline in NPL stock mainly driven by NPL sales and positive migration trends across most geographies
+4.2%
31/12/15
125.9
67.3
20.5
9.8 7.9
3.8 6.5 0.8 6.0
3.4
30/09/15
124.5
66.6
20.0
8.0 4.0
6.6 0.7 5.9 3.2
31/12/14
120.8
64.7
19.1
8.5 7.9
4.3 6.6 0.8 5.7 3.2
9.6
AT CZ SK RO HU HR RS Other EU Other
+4.4%
31/12/15
122.6
66.2
20.1
9.6 7.4
3.4 6.0 0.7 5.7
3.4
30/09/15
121.5
65.5
19.8
9.5 7.7
3.5 6.1 0.6 5.5 3.2
31/12/14
117.4
63.7
18.8
8.3 7.5
3.8 6.0 0.8 5.4 3.2
0.6 0.4
30/09/15
9.7
2.6
1.0 0.6
1.9
0.9
1.5 0.2
0.6 0.5
31/12/14
10.9
2.9
1.0 0.5
2.3
1.3
1.6 0.2
0.7 0.5
31/12/15
-14.4%
9.3
2.7
1.0 0.7
1.8
0.8
1.2 0.2
Page
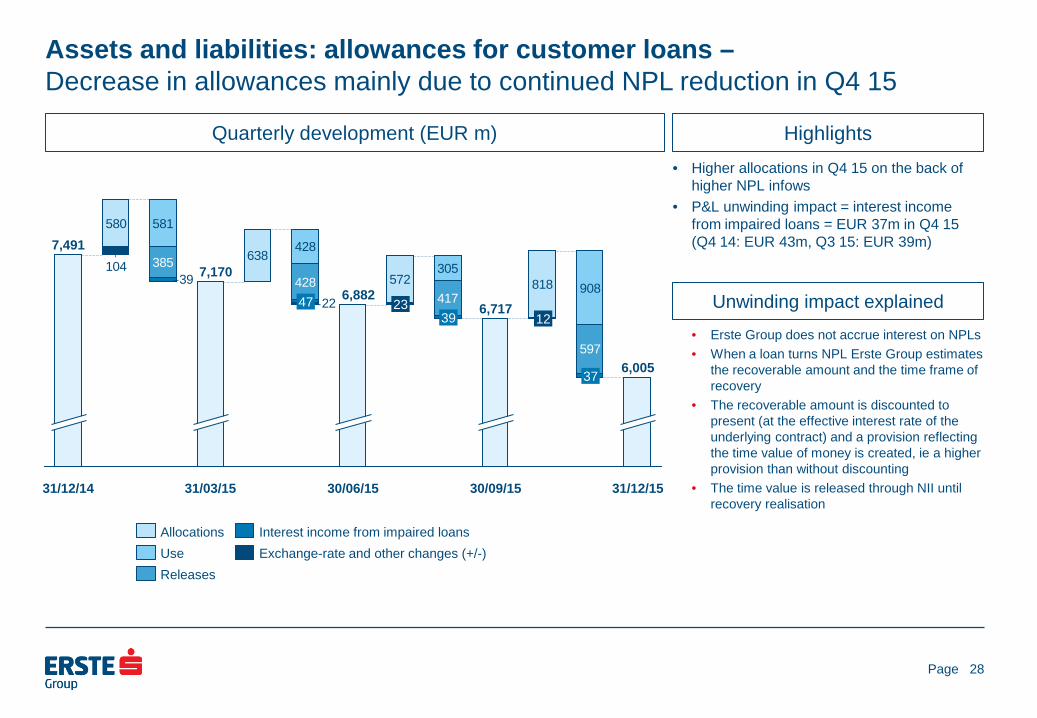
Assets and liabilities: allowances for customer loans – Decrease in allowances mainly due to continued NPL reduction in Q4 15
Quarterly development (EUR m)
28
Highlights • Higher allocations in Q4 15 on the back of
higher NPL infows • P&L unwinding impact = interest income
from impaired loans = EUR 37m in Q4 15 (Q4 14: EUR 43m, Q3 15: EUR 39m)
572 818104
22
638
39
580
597
417
385
908305
428
581
428
7,170
31/12/14
7,491
23
30/06/15
6,882 47
31/03/15 31/12/15
6,005 37
12
30/09/15
6,717 39
Releases Exchange-rate and other changes (+/-) Interest income from impaired loans
Use Allocations
• Erste Group does not accrue interest on NPLs • When a loan turns NPL Erste Group estimates
the recoverable amount and the time frame of recovery
• The recoverable amount is discounted to present (at the effective interest rate of the underlying contract) and a provision reflecting the time value of money is created, ie a higher provision than without discounting
• The time value is released through NII until recovery realisation
Unwinding impact explained
Page
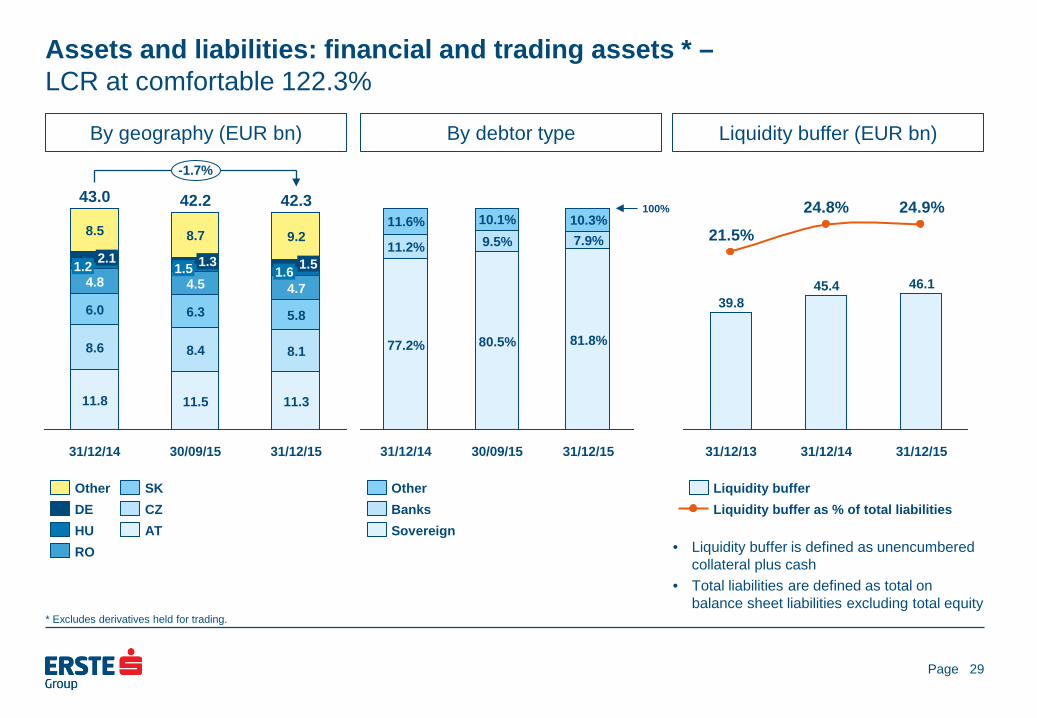
Assets and liabilities: financial and trading assets * – LCR at comfortable 122.3%
By geography (EUR bn)
By debtor type
29
Liquidity buffer (EUR bn)
• Liquidity buffer is defined as unencumbered collateral plus cash
• Total liabilities are defined as total on balance sheet liabilities excluding total equity
9.2
30/09/15
42.2
11.5
8.4
6.3
4.5 1.5 1.3
-1.7%
31/12/14
43.0
11.8
8.6
6.0
4.8 1.2 2.1
8.5
31/12/15
42.3
11.3
8.1
5.8
4.7 1.6 1.5
8.7
AT CZ SK
RO HU DE Other
100%
31/12/15
81.8%
7.9% 10.3%
30/09/15
80.5%
9.5% 10.1%
31/12/14
77.2%
11.2%
11.6%
Sovereign Banks Other
31/12/15
46.1
24.9%
31/12/14
45.4
24.8%
31/12/13
39.8
21.5%
Liquidity buffer as % of total liabilities Liquidity buffer
* Excludes derivatives held for trading.
Page
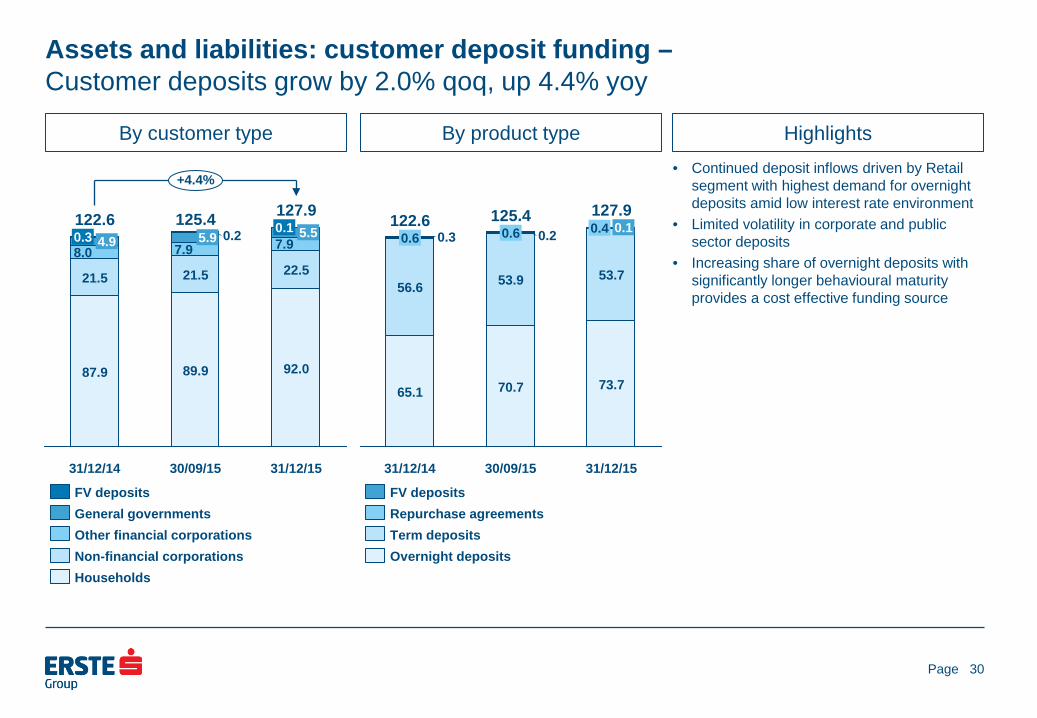
Assets and liabilities: customer deposit funding – Customer deposits grow by 2.0% qoq, up 4.4% yoy
By customer type
By product type
30
Highlights • Continued deposit inflows driven by Retail
segment with highest demand for overnight deposits amid low interest rate environment
• Limited volatility in corporate and public sector deposits
• Increasing share of overnight deposits with significantly longer behavioural maturity provides a cost effective funding source
31/12/15
127.9
73.7
53.7
0.4 0.1
30/09/15
125.4
70.7
53.9
0.6 0.2
31/12/14
122.6
65.1
56.6
0.6 0.3
Overnight deposits Term deposits Repurchase agreements FV deposits
+4.4%
31/12/15
127.9
92.0
22.5
7.9 5.5 0.1
30/09/15
125.4
89.9
21.5
7.9 5.9 0.2
31/12/14
122.6
87.9
21.5
8.0 4.9 0.3
Households Non-financial corporations Other financial corporations General governments FV deposits
Page
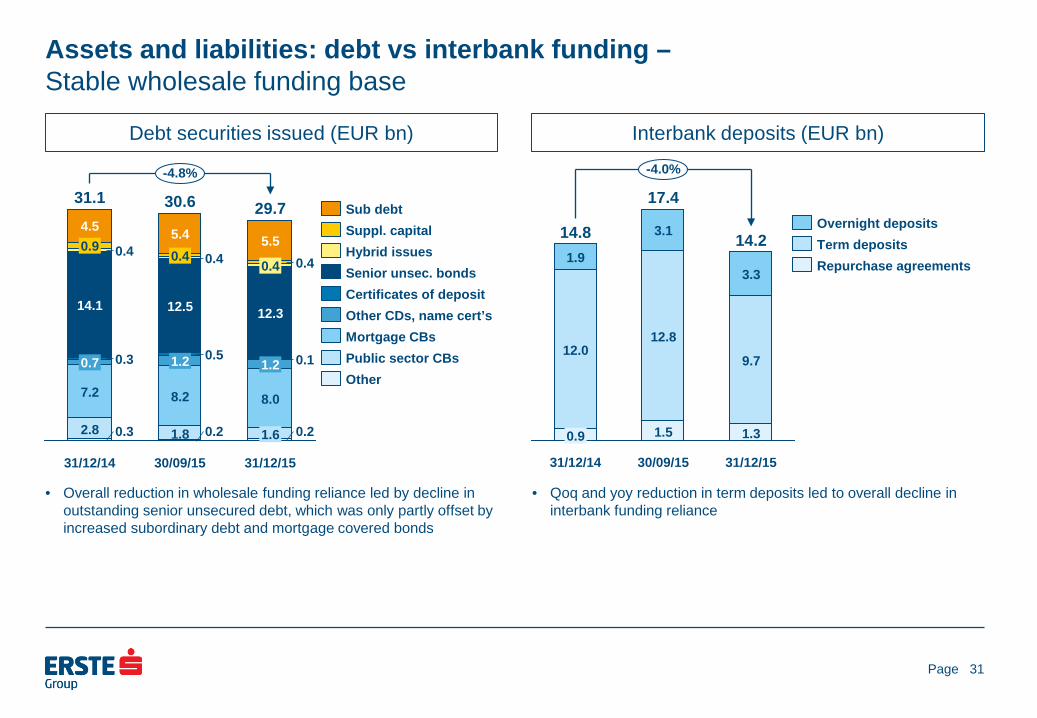
Assets and liabilities: debt vs interbank funding – Stable wholesale funding base
Debt securities issued (EUR bn)
Interbank deposits (EUR bn)
31
• Overall reduction in wholesale funding reliance led by decline in outstanding senior unsecured debt, which was only partly offset by increased subordinary debt and mortgage covered bonds
• Qoq and yoy reduction in term deposits led to overall decline in interbank funding reliance
31/12/15
29.7
0.2 1.6
8.0
1.2 0.1
12.3
0.4 0.4 5.5
30/09/15
30.6
0.2 1.8
8.2
1.2 0.5
12.5
0.4 0.4 5.4
31/12/14
-4.8%
0.3 2.8
7.2
0.7
31.1
14.1
0.4 0.9 4.5
0.3 Other Public sector CBs Mortgage CBs Other CDs, name cert’s Certificates of deposit Senior unsec. bonds Hybrid issues Suppl. capital Sub debt
-4.0%
31/12/15
14.2
1.3
9.7
3.3
30/09/15
17.4
1.5
12.8
3.1
31/12/14
14.8
0.9
12.0
1.9 Repurchase agreements Term deposits Overnight deposits
Page
Assets and liabilities: LT funding – Limited LT funding needs
Maturity profile of debt (EUR bn)
32
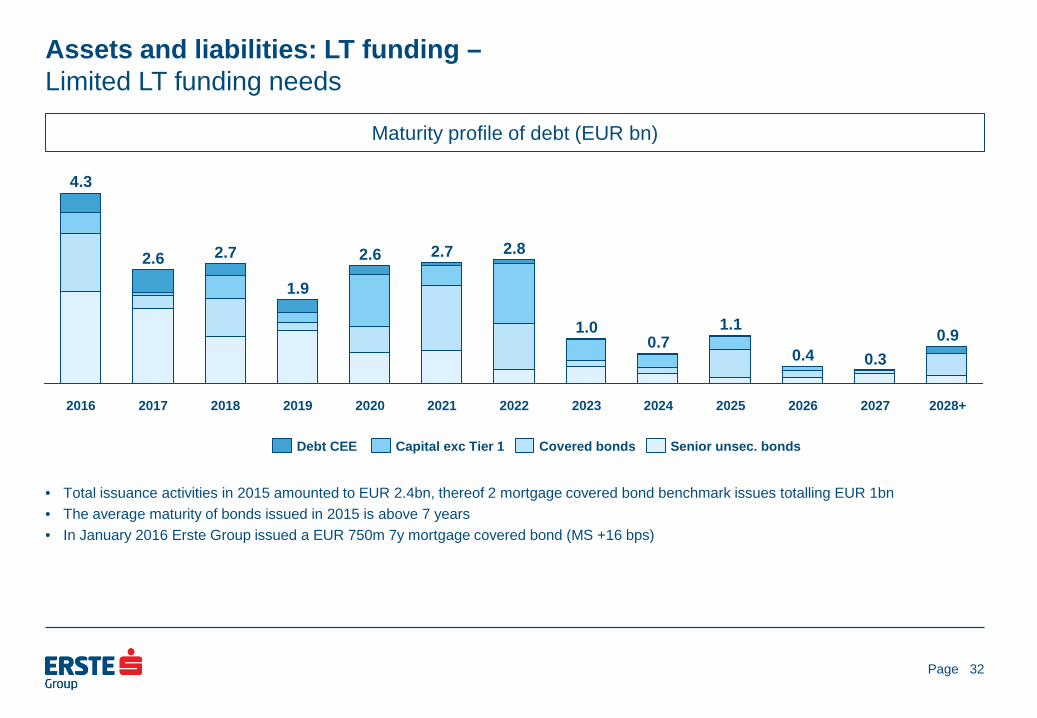
• Total issuance activities in 2015 amounted to EUR 2.4bn, thereof 2 mortgage covered bond benchmark issues totalling EUR 1bn • The average maturity of bonds issued in 2015 is above 7 years • In January 2016 Erste Group issued a EUR 750m 7y mortgage covered bond (MS +16 bps)
2028+
0.9
2027
0.3
2026
0.4
2025
1.1
2024
0.7
2023
1.0
2022
2.8
2021
2.7
2020
2.6
2019
1.9
2018
2.7
2017
2.6
2016
4.3
Senior unsec. bonds Covered bonds Debt CEE Capital exc Tier 1
Page
Assets and liabilities: capital position – B3FL CET1 ratio advances to 12.0%, driven primarily by capital build-up
Basel 3 capital (phased-in)
Risk-weighted assets (phased-in)
33
Basel 3 capital ratios (phased-in)
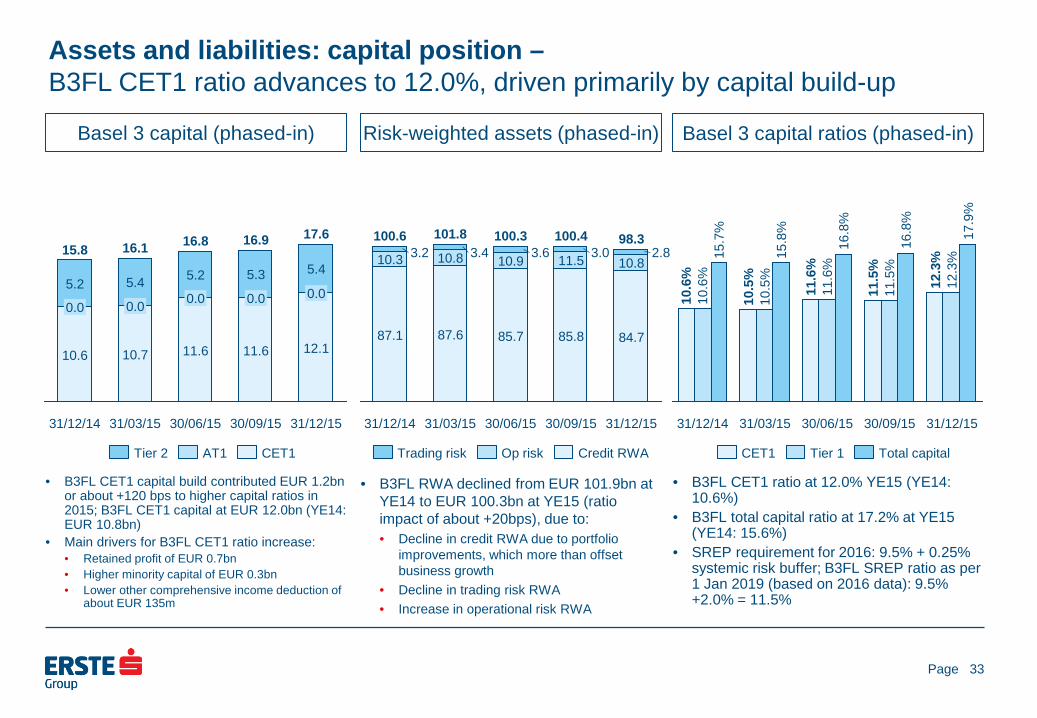
• B3FL CET1 capital build contributed EUR 1.2bn or about +120 bps to higher capital ratios in 2015; B3FL CET1 capital at EUR 12.0bn (YE14: EUR 10.8bn)
• Main drivers for B3FL CET1 ratio increase: • Retained profit of EUR 0.7bn • Higher minority capital of EUR 0.3bn • Lower other comprehensive income deduction of
about EUR 135m
• B3FL RWA declined from EUR 101.9bn at YE14 to EUR 100.3bn at YE15 (ratio impact of about +20bps), due to: • Decline in credit RWA due to portfolio
improvements, which more than offset business growth
• Decline in trading risk RWA • Increase in operational risk RWA
• B3FL CET1 ratio at 12.0% YE15 (YE14: 10.6%)
• B3FL total capital ratio at 17.2% at YE15 (YE14: 15.6%)
• SREP requirement for 2016: 9.5% + 0.25% systemic risk buffer; B3FL SREP ratio as per 1 Jan 2019 (based on 2016 data): 9.5% +2.0% = 11.5%
30/09/15
16.9
11.6
0.0
5.3
30/06/15
16.8
11.6
0.0
5.2
31/03/15
16.1
10.7
0.0
5.4
31/12/14
15.8
10.6
0.0
5.2
31/12/15
17.6
12.1
0.0
5.4
CET1 AT1 Tier 2
30/09/15
100.4
85.8
11.5 3.0
30/06/15
100.3
85.7
10.9 3.6
31/03/15
101.8
87.6
10.8 3.4
31/12/14
100.6
87.1
10.3 3.2
31/12/15
98.3
84.7
10.8 2.8
Credit RWA Op risk Trading risk
30/09/15
16.8
%
11.5
%
11.5
%
30/06/15
16.8
%
11.6
%
11.6
%
31/03/15
15.8
%
10.5
%
10.5
%
31/12/14
15.7
%
10.6
%
10.6
%
31/12/15
12.3
%
12.3
%
17.9
%
Total capital Tier 1 CET1

Page
Presentation topics
34
• Executive summary • Business environment • Business performance • Assets and liabilities • Outlook • Additional information
Page
Conclusion – Outlook 2016 • CEE economic environment anticipated to be conducive to credit expansion
• Real GDP growth of between 1.5-3.8% expected in 2016 in all major CEE markets, including Austria • Real GDP growth to be driven by solid domestic demand
• Return on tangible equity (ROTE) expected at about 10-11% in 2016 underpinning continued
dividend payout • Support factors: re-emerging loan growth; continued improvement in asset quality amid a benign risk
environment; positive one-off related to VISA sale in the amount of about EUR 127m pre-tax • Headwinds: persistent low interest rate environment affecting group operating income, primarily NII;
lower operating results in Hungary (lower volumes) and Romania (following asset re-pricing); banking levies (total of banking taxes, FTT, resolution fund and deposit insurance fund contributions) expected at about EUR 360m pre-tax in 2016 • Banking taxes and FTT booked pro rata in other operating result, except HU banking tax (booked upfront in Q1 16) • Resolution fund contributions expected to be booked upfront in Q1 16 in other operating result • Deposit insurance contributions expected to be booked partly pro rata and partly upfront in Q1 16 in operating expenses
• Risks to guidance
• Geopolitical risks and global economic risks • Impact from negative interest rates • Consumer protection initiatives
35

Page
Presentation topics
36
• Executive summary • Business environment • Business performance • Assets and liabilities • Outlook • Additional information
Page
Additional information: segmentation – Business line and geographic view
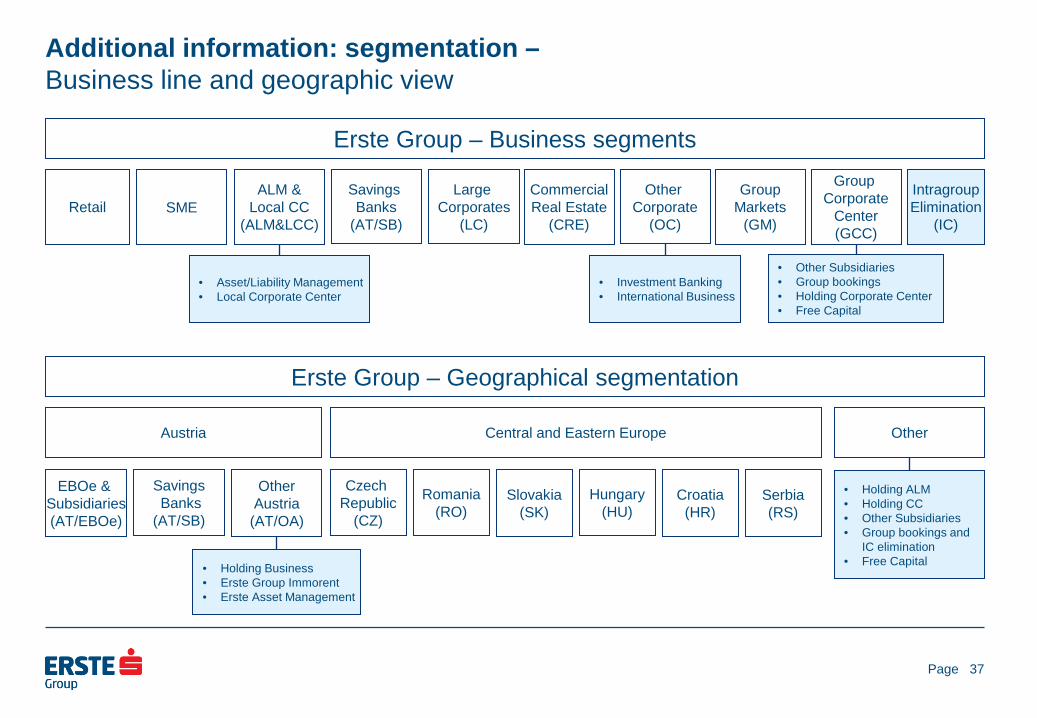
Retail
Erste Group – Business segments
SME ALM &
Local CC (ALM&LCC)
Savings Banks
(AT/SB)
Large Corporates
(LC)
Commercial Real Estate
(CRE)
Other Corporate
(OC)
Group Markets
(GM)
Group Corporate
Center (GCC)
Intragroup Elimination
(IC)
Erste Group – Geographical segmentation
Austria Central and Eastern Europe Other
EBOe & Subsidiaries (AT/EBOe)
Savings Banks (AT/SB)
Other Austria
(AT/OA)
Czech Republic
(CZ)
Romania (RO)
Slovakia (SK)
Hungary (HU)
Croatia (HR)
Serbia (RS)
• Holding Business • Erste Group Immorent • Erste Asset Management
• Asset/Liability Management • Local Corporate Center
• Investment Banking • International Business
• Other Subsidiaries • Group bookings • Holding Corporate Center • Free Capital
• Holding ALM • Holding CC • Other Subsidiaries • Group bookings and
IC elimination • Free Capital
37
Page
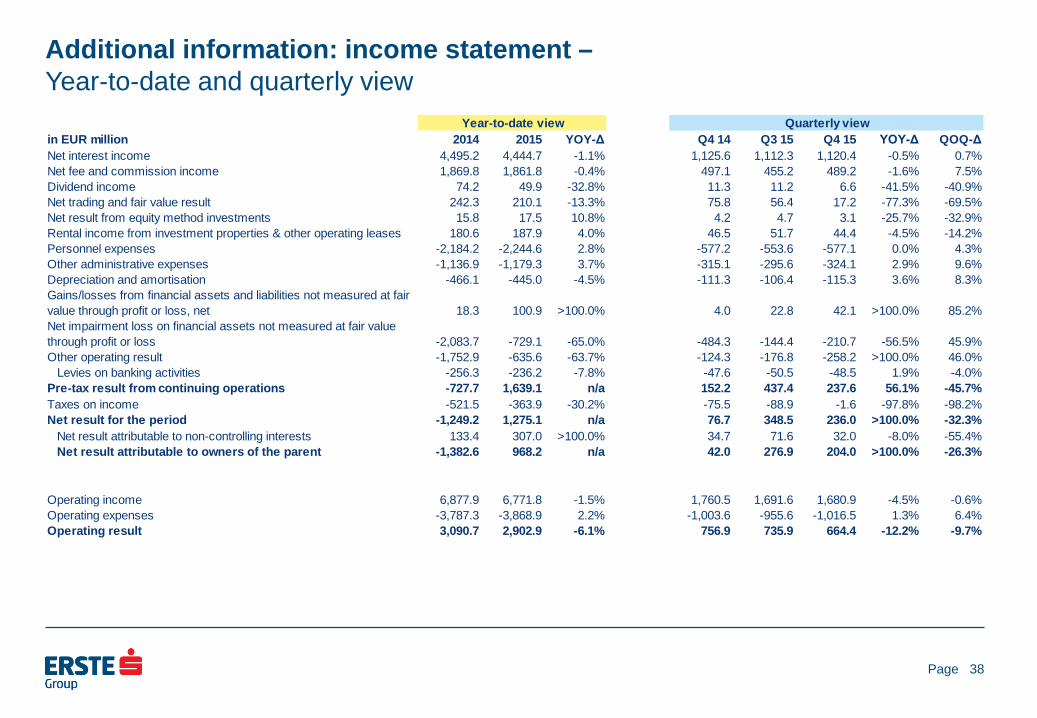
Additional information: income statement – Year-to-date and quarterly view
38
in EUR million 2014 2015 YOY-Δ Q4 14 Q3 15 Q4 15 YOY-Δ QOQ-ΔNet interest income 4,495.2 4,444.7 -1.1% 1,125.6 1,112.3 1,120.4 -0.5% 0.7%Net fee and commission income 1,869.8 1,861.8 -0.4% 497.1 455.2 489.2 -1.6% 7.5%Dividend income 74.2 49.9 -32.8% 11.3 11.2 6.6 -41.5% -40.9%Net trading and fair value result 242.3 210.1 -13.3% 75.8 56.4 17.2 -77.3% -69.5%Net result from equity method investments 15.8 17.5 10.8% 4.2 4.7 3.1 -25.7% -32.9%Rental income from investment properties & other operating leases 180.6 187.9 4.0% 46.5 51.7 44.4 -4.5% -14.2%Personnel expenses -2,184.2 -2,244.6 2.8% -577.2 -553.6 -577.1 0.0% 4.3%Other administrative expenses -1,136.9 -1,179.3 3.7% -315.1 -295.6 -324.1 2.9% 9.6%Depreciation and amortisation -466.1 -445.0 -4.5% -111.3 -106.4 -115.3 3.6% 8.3%Gains/losses from financial assets and liabilities not measured at fair value through profit or loss, net 18.3 100.9 >100.0% 4.0 22.8 42.1 >100.0% 85.2%Net impairment loss on financial assets not measured at fair value through profit or loss -2,083.7 -729.1 -65.0% -484.3 -144.4 -210.7 -56.5% 45.9%Other operating result -1,752.9 -635.6 -63.7% -124.3 -176.8 -258.2 >100.0% 46.0%
Levies on banking activities -256.3 -236.2 -7.8% -47.6 -50.5 -48.5 1.9% -4.0%Pre-tax result from continuing operations -727.7 1,639.1 n/a 152.2 437.4 237.6 56.1% -45.7%Taxes on income -521.5 -363.9 -30.2% -75.5 -88.9 -1.6 -97.8% -98.2%Net result for the period -1,249.2 1,275.1 n/a 76.7 348.5 236.0 >100.0% -32.3%
Net result attributable to non-controlling interests 133.4 307.0 >100.0% 34.7 71.6 32.0 -8.0% -55.4%Net result attributable to owners of the parent -1,382.6 968.2 n/a 42.0 276.9 204.0 >100.0% -26.3%
Operating income 6,877.9 6,771.8 -1.5% 1,760.5 1,691.6 1,680.9 -4.5% -0.6%Operating expenses -3,787.3 -3,868.9 2.2% -1,003.6 -955.6 -1,016.5 1.3% 6.4%Operating result 3,090.7 2,902.9 -6.1% 756.9 735.9 664.4 -12.2% -9.7%
Year-to-date view Quarterly view
Page
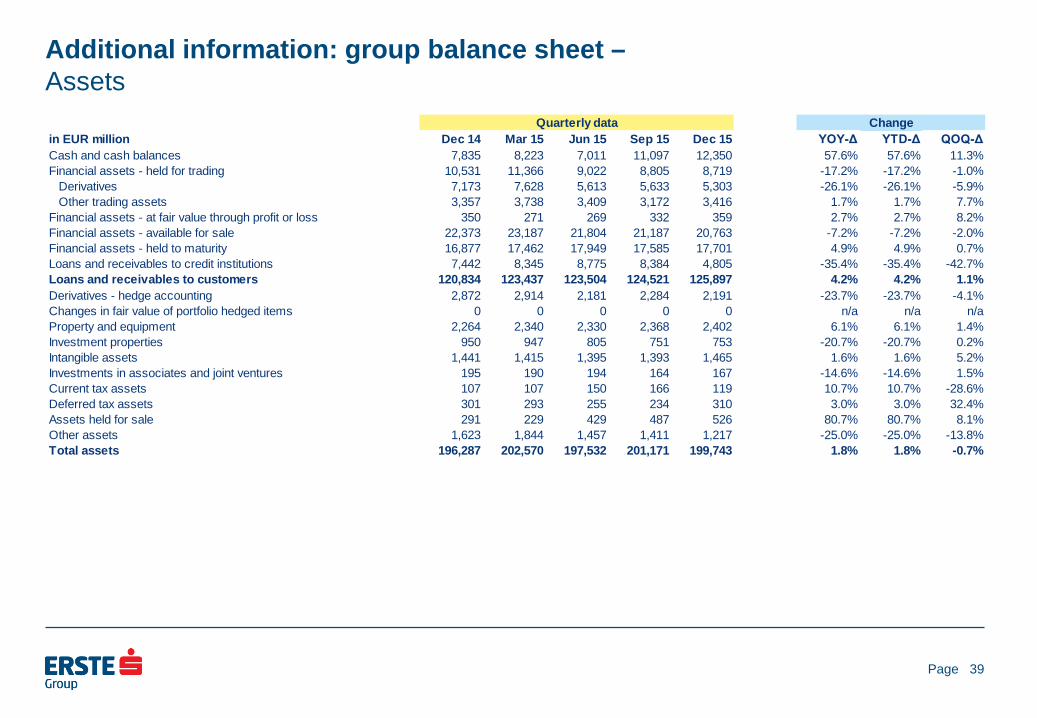
Additional information: group balance sheet – Assets
39
in EUR million Dec 14 Mar 15 Jun 15 Sep 15 Dec 15 YOY-Δ YTD-Δ QOQ-ΔCash and cash balances 7,835 8,223 7,011 11,097 12,350 57.6% 57.6% 11.3%Financial assets - held for trading 10,531 11,366 9,022 8,805 8,719 -17.2% -17.2% -1.0%
Derivatives 7,173 7,628 5,613 5,633 5,303 -26.1% -26.1% -5.9%Other trading assets 3,357 3,738 3,409 3,172 3,416 1.7% 1.7% 7.7%
Financial assets - at fair value through profit or loss 350 271 269 332 359 2.7% 2.7% 8.2%Financial assets - available for sale 22,373 23,187 21,804 21,187 20,763 -7.2% -7.2% -2.0%Financial assets - held to maturity 16,877 17,462 17,949 17,585 17,701 4.9% 4.9% 0.7%Loans and receivables to credit institutions 7,442 8,345 8,775 8,384 4,805 -35.4% -35.4% -42.7%Loans and receivables to customers 120,834 123,437 123,504 124,521 125,897 4.2% 4.2% 1.1%Derivatives - hedge accounting 2,872 2,914 2,181 2,284 2,191 -23.7% -23.7% -4.1%Changes in fair value of portfolio hedged items 0 0 0 0 0 n/a n/a n/aProperty and equipment 2,264 2,340 2,330 2,368 2,402 6.1% 6.1% 1.4%Investment properties 950 947 805 751 753 -20.7% -20.7% 0.2%Intangible assets 1,441 1,415 1,395 1,393 1,465 1.6% 1.6% 5.2%Investments in associates and joint ventures 195 190 194 164 167 -14.6% -14.6% 1.5%Current tax assets 107 107 150 166 119 10.7% 10.7% -28.6%Deferred tax assets 301 293 255 234 310 3.0% 3.0% 32.4%Assets held for sale 291 229 429 487 526 80.7% 80.7% 8.1%Other assets 1,623 1,844 1,457 1,411 1,217 -25.0% -25.0% -13.8%Total assets 196,287 202,570 197,532 201,171 199,743 1.8% 1.8% -0.7%
Quarterly data Change
Page
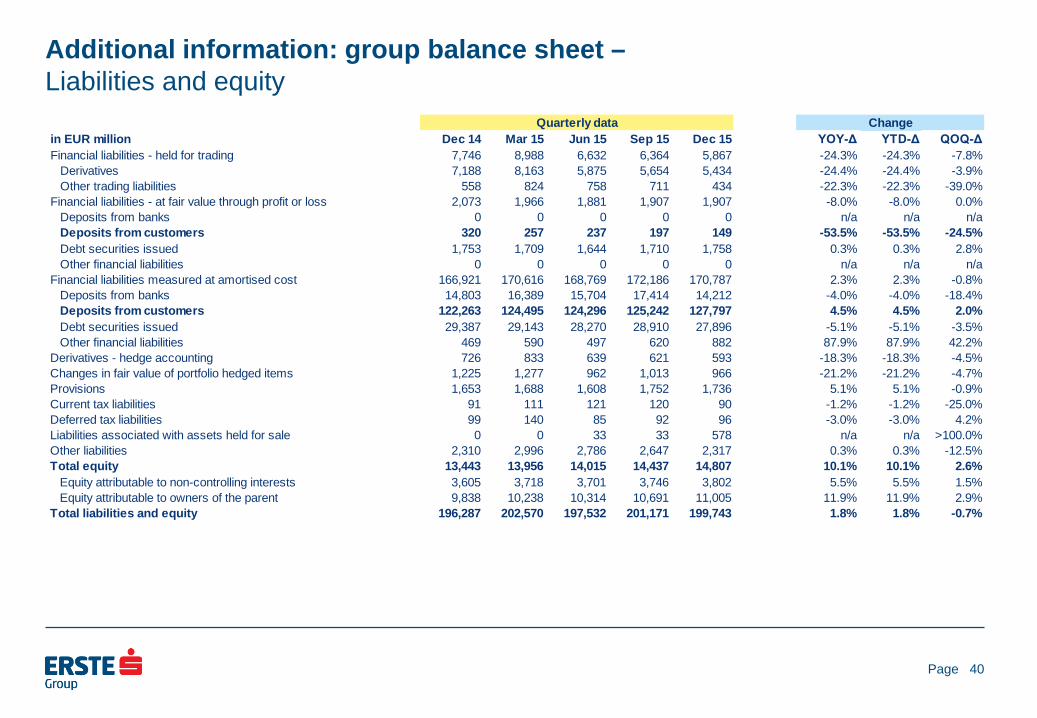
Additional information: group balance sheet – Liabilities and equity
40
in EUR million Dec 14 Mar 15 Jun 15 Sep 15 Dec 15 YOY-Δ YTD-Δ QOQ-ΔFinancial liabilities - held for trading 7,746 8,988 6,632 6,364 5,867 -24.3% -24.3% -7.8%
Derivatives 7,188 8,163 5,875 5,654 5,434 -24.4% -24.4% -3.9%Other trading liabilities 558 824 758 711 434 -22.3% -22.3% -39.0%
Financial liabilities - at fair value through profit or loss 2,073 1,966 1,881 1,907 1,907 -8.0% -8.0% 0.0%Deposits from banks 0 0 0 0 0 n/a n/a n/aDeposits from customers 320 257 237 197 149 -53.5% -53.5% -24.5%Debt securities issued 1,753 1,709 1,644 1,710 1,758 0.3% 0.3% 2.8%Other financial liabilities 0 0 0 0 0 n/a n/a n/a
Financial liabilities measured at amortised cost 166,921 170,616 168,769 172,186 170,787 2.3% 2.3% -0.8%Deposits from banks 14,803 16,389 15,704 17,414 14,212 -4.0% -4.0% -18.4%Deposits from customers 122,263 124,495 124,296 125,242 127,797 4.5% 4.5% 2.0%Debt securities issued 29,387 29,143 28,270 28,910 27,896 -5.1% -5.1% -3.5%Other financial liabilities 469 590 497 620 882 87.9% 87.9% 42.2%
Derivatives - hedge accounting 726 833 639 621 593 -18.3% -18.3% -4.5%Changes in fair value of portfolio hedged items 1,225 1,277 962 1,013 966 -21.2% -21.2% -4.7%Provisions 1,653 1,688 1,608 1,752 1,736 5.1% 5.1% -0.9%Current tax liabilities 91 111 121 120 90 -1.2% -1.2% -25.0%Deferred tax liabilities 99 140 85 92 96 -3.0% -3.0% 4.2%Liabilities associated with assets held for sale 0 0 33 33 578 n/a n/a >100.0%Other liabilities 2,310 2,996 2,786 2,647 2,317 0.3% 0.3% -12.5%Total equity 13,443 13,956 14,015 14,437 14,807 10.1% 10.1% 2.6%
Equity attributable to non-controlling interests 3,605 3,718 3,701 3,746 3,802 5.5% 5.5% 1.5%Equity attributable to owners of the parent 9,838 10,238 10,314 10,691 11,005 11.9% 11.9% 2.9%
Total liabilities and equity 196,287 202,570 197,532 201,171 199,743 1.8% 1.8% -0.7%
Quarterly data Change
Page
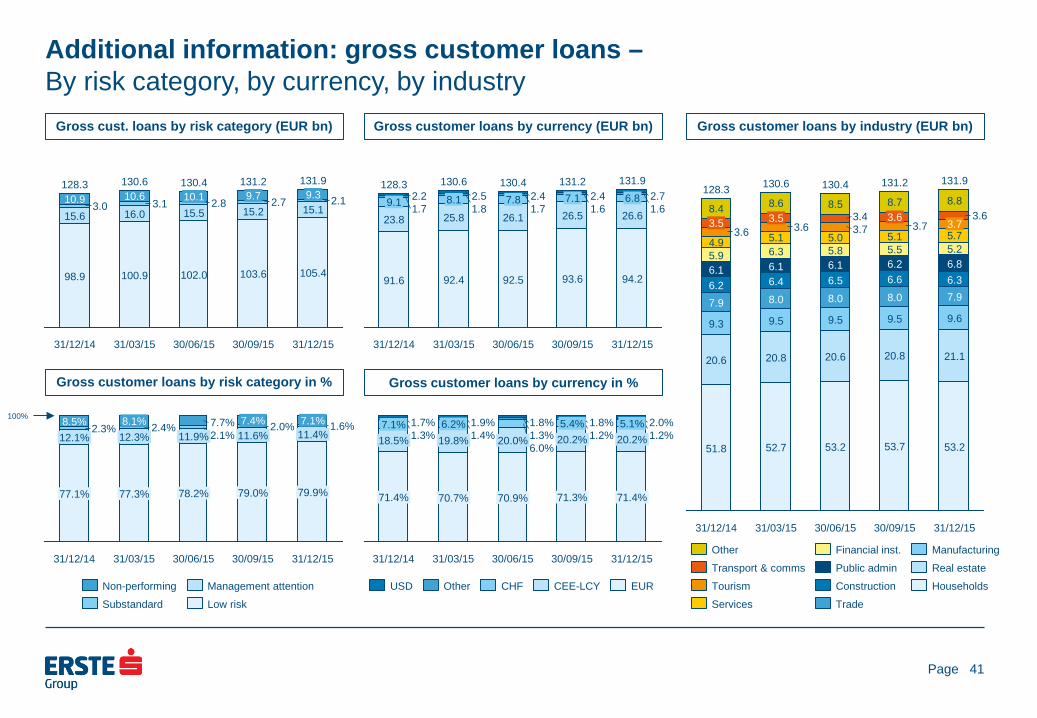
Additional information: gross customer loans – By risk category, by currency, by industry
Gross cust. loans by risk category (EUR bn)
41
Gross customer loans by currency (EUR bn) Gross customer loans by industry (EUR bn)
Gross customer loans by risk category in %
Gross customer loans by currency in %
30/09/15
131.2
103.6
15.2 2.7 9.7
30/06/15
130.4
102.0
15.5 2.8 10.1
31/03/15
130.6
100.9
16.0 3.1 3.0 10.9
31/12/15
131.9
105.4
15.1 2.1 9.3
31/12/14
128.3
98.9
15.6
10.6
Low risk
Management attention
Substandard
Non-performing
100%
30/09/15
79.0%
11.6% 2.0% 7.4%
30/06/15
78.2%
11.9% 2.1% 7.7%
31/03/15
77.3%
12.3% 2.4% 8.1%
31/12/14
77.1%
12.1% 2.3% 8.5%
31/12/15
79.9%
11.4% 1.6% 7.1%
30/09/15
131.2
93.6
26.5 7.1
1.6 2.4
30/06/15
130.4
92.5
26.1
7.8 1.7 2.4
31/03/15
130.6
92.4
25.8
8.1 1.8 2.5
31/12/14
128.3
91.6
23.8 9.1 1.7
2.2
31/12/15
131.9
94.2
26.6 6.8
1.6 2.7
EUR CEE-LCY CHF Other USD
30/09/15
71.3%
20.2% 5.4%
1.2% 1.8%
30/06/15
70.9%
20.0% 6.0% 1.3% 1.8%
31/03/15
70.7%
19.8% 6.2%
1.4% 1.9%
31/12/14
71.4%
18.5% 7.1%
1.3% 1.7%
31/12/15
71.4%
20.2% 5.1%
1.2% 2.0%
131.2
53.7
20.8
9.5
8.0
6.6
30/09/15
6.2 5.5 5.1
3.7 3.6 8.7
30/06/15
130.4
53.2
20.6
9.5
8.0
6.5 6.1 5.8 5.0
3.7 3.4
8.5
31/03/15
130.6
52.7
20.8
9.5
8.0
6.4 6.1 6.3 5.1
3.6 3.5 8.6
31/12/14
128.3
51.8
20.6
9.3
7.9 6.2 6.1 5.9 4.9
3.6 3.5 8.4
31/12/15
131.9
53.2
21.1
9.6
7.9 6.3 6.8 5.2 5.7 3.7
3.6 8.8
Households
Real estate
Manufacturing
Trade
Construction
Public admin
Financial inst.
Services
Tourism
Transport & comms
Other
Page
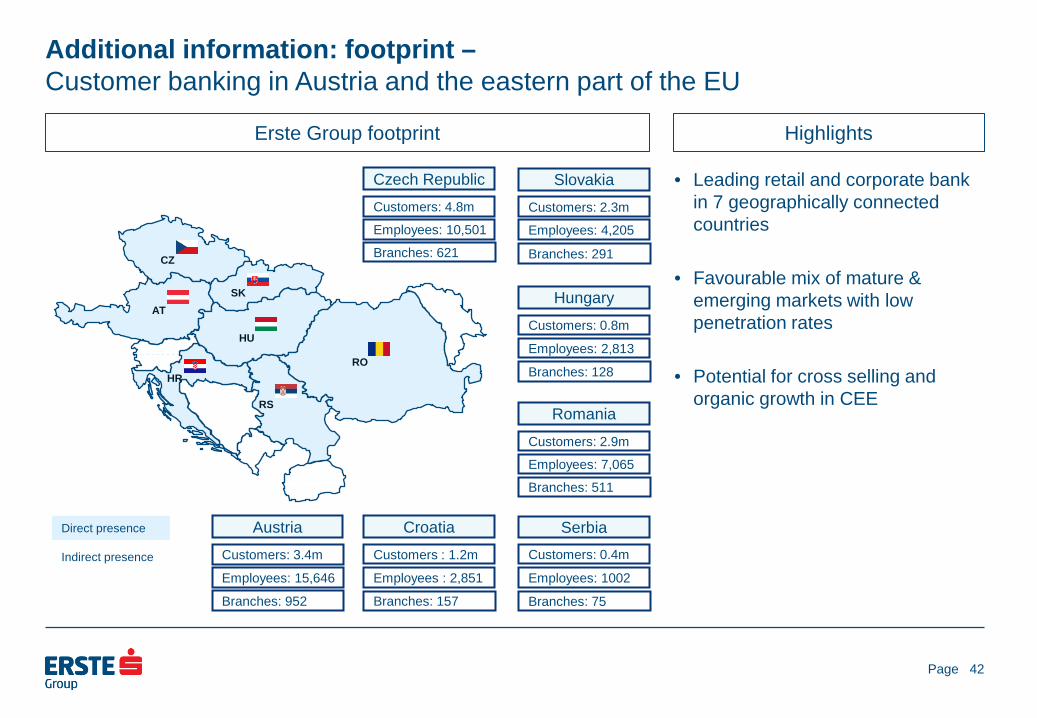
• Leading retail and corporate bank in 7 geographically connected countries
• Favourable mix of mature & emerging markets with low penetration rates
• Potential for cross selling and organic growth in CEE
Additional information: footprint – Customer banking in Austria and the eastern part of the EU
Erste Group footprint Highlights
42
Direct presence
Indirect presence
Customers: 0.8m
Hungary
Employees: 2,813
Branches: 128
Customers: 2.9m
Romania
Employees: 7,065
Branches: 511
Customers: 0.4m
Serbia
Employees: 1002
Branches: 75
Customers : 1.2m
Croatia
Employees : 2,851
Branches: 157
Customers: 4.8m
Czech Republic
Employees: 10,501
Branches: 621
Customers: 2.3m
Slovakia
Employees: 4,205
Branches: 291
Customers: 3.4m
Austria
Employees: 15,646
Branches: 952
AT
CZ
SK
HU
RO HR
RS
Page
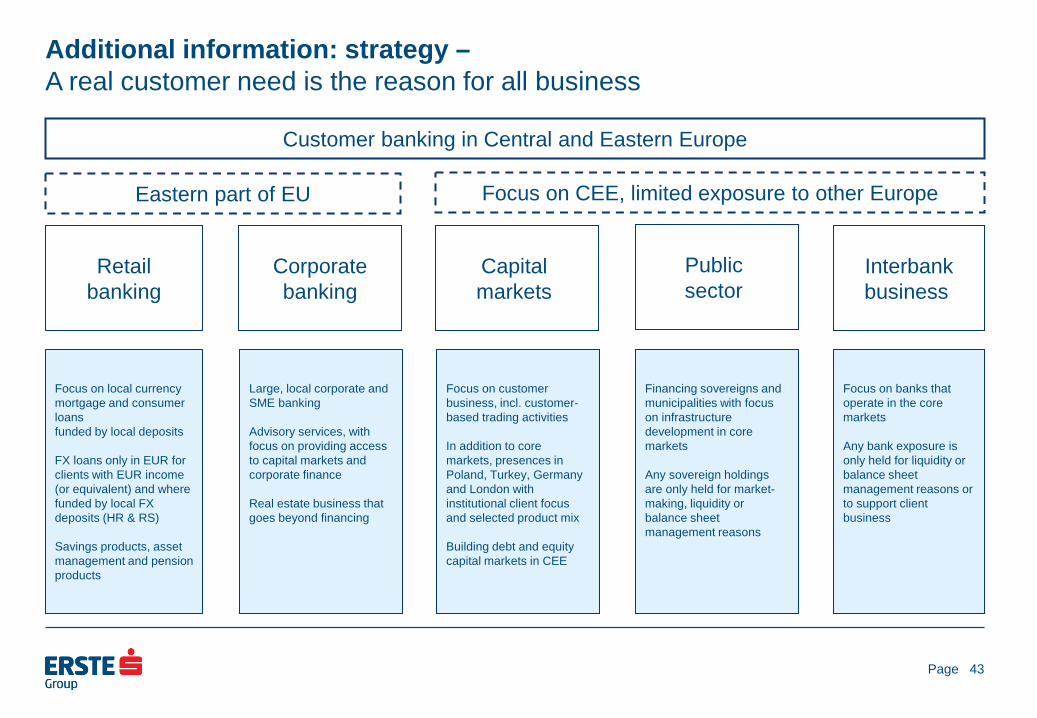
Additional information: strategy – A real customer need is the reason for all business
Retail banking
Corporate banking
Capital markets
Public sector
Interbank business
Customer banking in Central and Eastern Europe
Eastern part of EU Focus on CEE, limited exposure to other Europe
Focus on local currency mortgage and consumer loans funded by local deposits FX loans only in EUR for clients with EUR income (or equivalent) and where funded by local FX deposits (HR & RS) Savings products, asset management and pension products
Focus on customer business, incl. customer-based trading activities In addition to core markets, presences in Poland, Turkey, Germany and London with institutional client focus and selected product mix Building debt and equity capital markets in CEE
Financing sovereigns and municipalities with focus on infrastructure development in core markets Any sovereign holdings are only held for market-making, liquidity or balance sheet management reasons
Large, local corporate and SME banking Advisory services, with focus on providing access to capital markets and corporate finance Real estate business that goes beyond financing
Focus on banks that operate in the core markets Any bank exposure is only held for liquidity or balance sheet management reasons or to support client business
43
Page
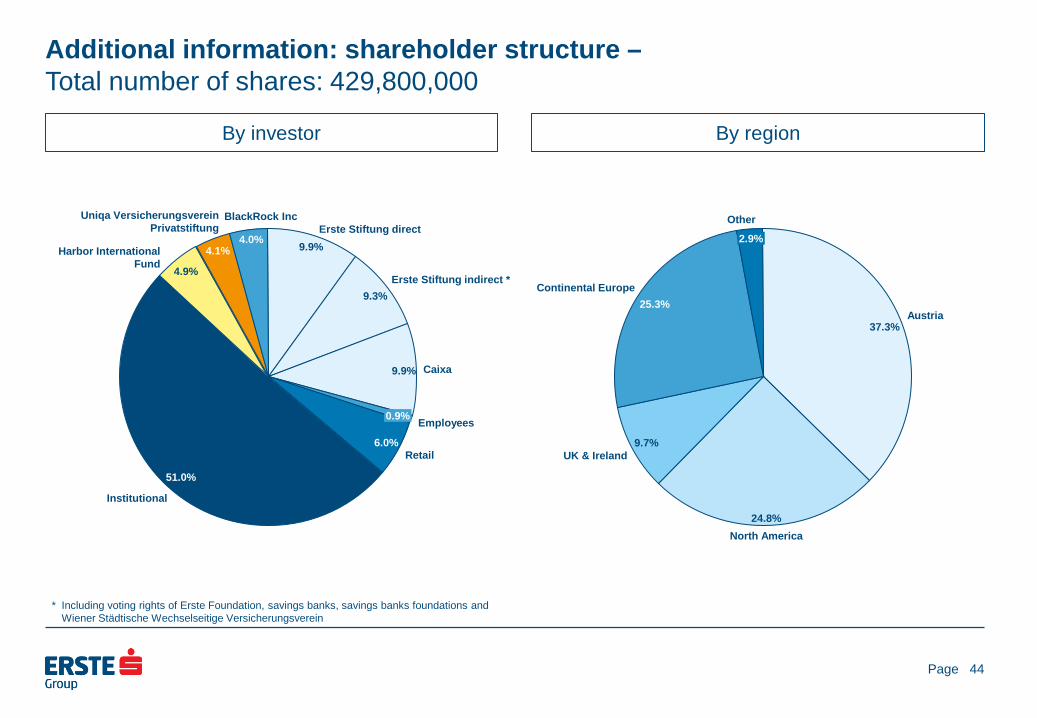
Additional information: shareholder structure – Total number of shares: 429,800,000
By investor By region
44
* Including voting rights of Erste Foundation, savings banks, savings banks foundations and Wiener Städtische Wechselseitige Versicherungsverein
Uniqa Versicherungsverein Privatstiftung
4.1% Harbor International Fund
4.9%
Institutional
51.0%
Retail 6.0%
Employees 0.9%
Caixa 9.9%
Erste Stiftung indirect * 9.3%
Erste Stiftung direct 9.9% 4.0%
BlackRock Inc Other
2.9%
Continental Europe 25.3%
UK & Ireland 9.7%
North America 24.8%
Austria 37.3%
Page
Investor relations details
• Erste Group Bank AG, Am Belvedere 1, 1100 Vienna E-mail: [email protected] Internet: http://www.erstegroup.com/investorrelations
http://twitter.com/ErsteGroupIR http://www.slideshare.net/Erste_Group Erste Group IR App for iPad, iPhone and Android http://www.erstegroup.com/de/Investoren/IR_App
Reuters: ERST.VI Bloomberg: EBS AV Datastream: O:ERS ISIN: AT0000652011
• Contacts Thomas Sommerauer Tel: +43 (0)5 0100 17326 e-mail: [email protected] Peter Makray Tel: +43 (0)5 0100 16878 e-mail: [email protected] Simone Pilz Tel: +43 (0)5 0100 13036 e-mail: [email protected] Gerald Krames Tel: +43 (0)5 0100 12751 e-mail: [email protected]
45