Embed Size (px)
Citation preview
PRESENTATION OF INTERIM FINANCIAL RESULTS
AGENDA
STRATEGIC AND OPERATIONAL UPDATE FINANCIAL REVIEW LOOKING FOWARD

STRATEGIC AND OPERATIONAL UPDATE
4
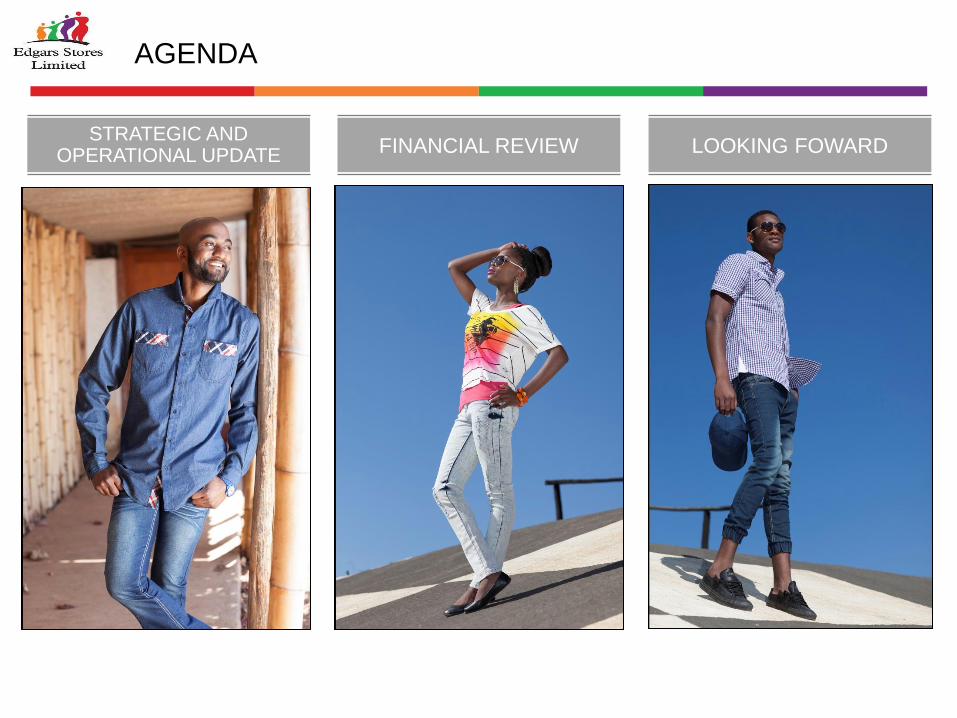
KEY STRATEGIC LEVERS
Sales Growth
• Credit in Jet Chain
• Improved assortments, compelling prices and product
differentiation within the chains
• Promotions
• Expanded overlay products
• Financial Inclusion: credit options to customers in the informal
and SME sector
Improved support
function efficiencies
• ERP implementation to increase efficiency once complete
• Cost reduction
• Productivity push
Working capital
management
• Closely monitored stock levels
• Positive operational cash flows and reduced gearing
• Tightening credit policies
5
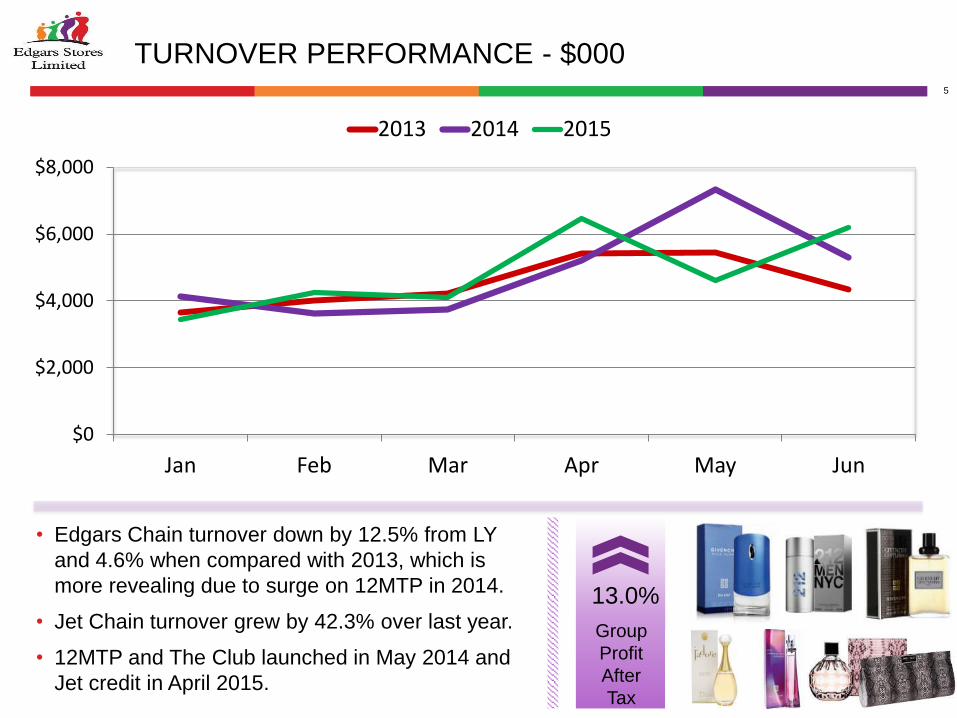
TURNOVER PERFORMANCE - $000
• Edgars Chain turnover down by 12.5% from LY
and 4.6% when compared with 2013, which is
more revealing due to surge on 12MTP in 2014.
• Jet Chain turnover grew by 42.3% over last year.
• 12MTP and The Club launched in May 2014 and
Jet credit in April 2015.
Group
Profit
After
Tax
13.0%
$0
$2,000
$4,000
$6,000
$8,000
Jan Feb Mar Apr May Jun
2013 2014 2015

TURNOVER SPLIT
CASH vs CREDIT BY CHAIN
• Cash Sales growth of 5.6% for the first half of the year.
• Decrease in Edgars Chain credit sales of 13.9% over
last year.
• Average purchasing accounts per month increase
of 4.0% over last year.
Group
Credit
Sales
3.3%
Credit Sales 71.5%
Cash Sales 28.5%
Edgars Credit Sales
63.3% Jet Credit Sales 8.2%
Edgars Cash Sales 9.3%
Jet Cash Sales 19.1%
7
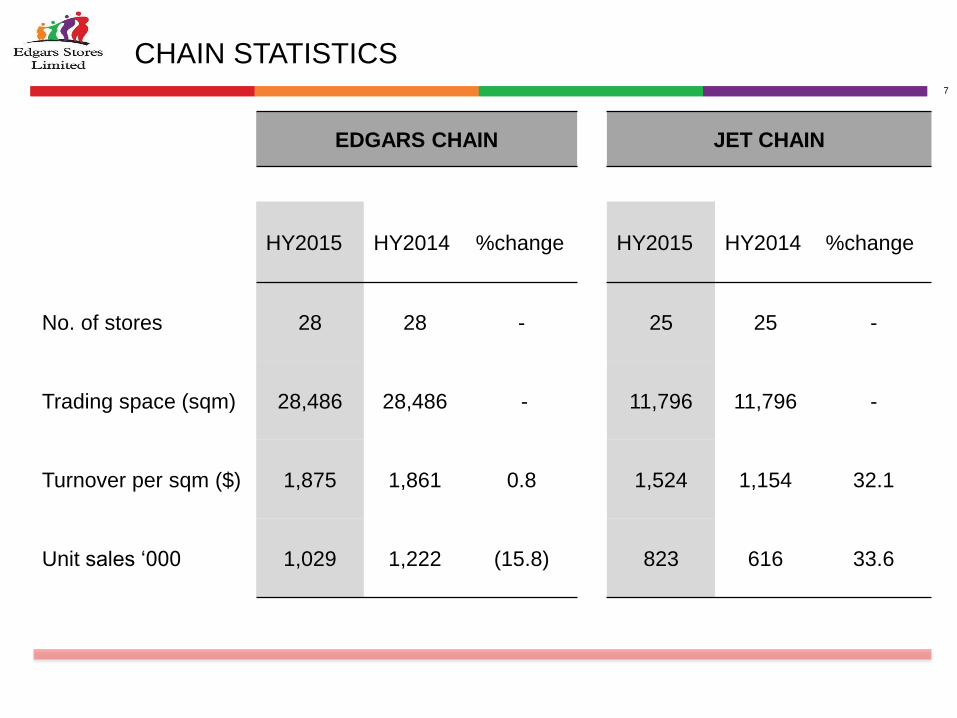
CHAIN STATISTICS
EDGARS CHAIN JET CHAIN
HY2015 HY2014 %change HY2015 HY2014 %change
No. of stores 28 28 - 25 25 -
Trading space (sqm) 28,486 28,486 - 11,796 11,796 -
Turnover per sqm ($) 1,875 1,861 0.8 1,524 1,154 32.1
Unit sales ‘000 1,029 1,222 (15.8) 823 616 33.6
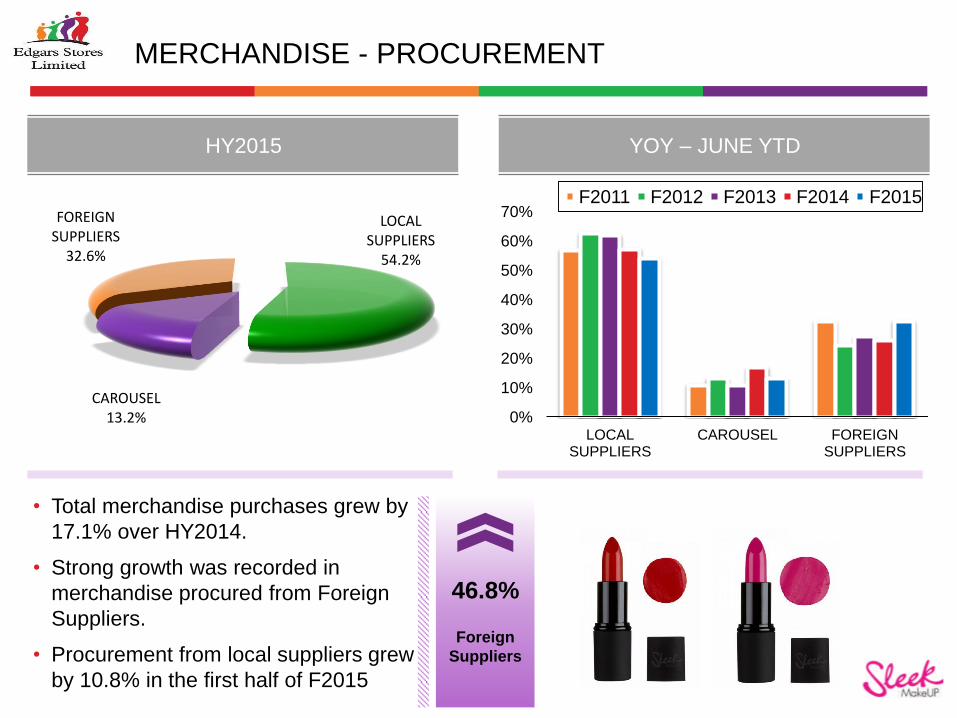
MERCHANDISE - PROCUREMENT
HY2015 YOY – JUNE YTD
• Total merchandise purchases grew by
17.1% over HY2014.
• Strong growth was recorded in
merchandise procured from Foreign
Suppliers.
• Procurement from local suppliers grew
by 10.8% in the first half of F2015
Foreign
Suppliers
46.8%
LOCAL SUPPLIERS
54.2%
CAROUSEL 13.2%
FOREIGN SUPPLIERS
32.6%
0%
10%
20%
30%
40%
50%
60%
70%
LOCAL SUPPLIERS
CAROUSEL FOREIGN SUPPLIERS
F2011 F2012 F2013 F2014 F2015

ACCOUNTS PERFORMANCE
ACTIVE ACCOUNTS %AGE TOTAL ACCOUNTS (000s)
• Accounts growth spurred by the launch of 12MTP and Jet Credit.
Total
Accounts
18.7%
60%
70%
80%
90%
100%
2010 2011 2012 2013 2014 2015
-
50.0
100.0
150.0
200.0
250.0
300.0
Number of accounts 2015 2014
Edgars 217 370 203 728
Jet 25 761 1 064
243 131 204 792
10
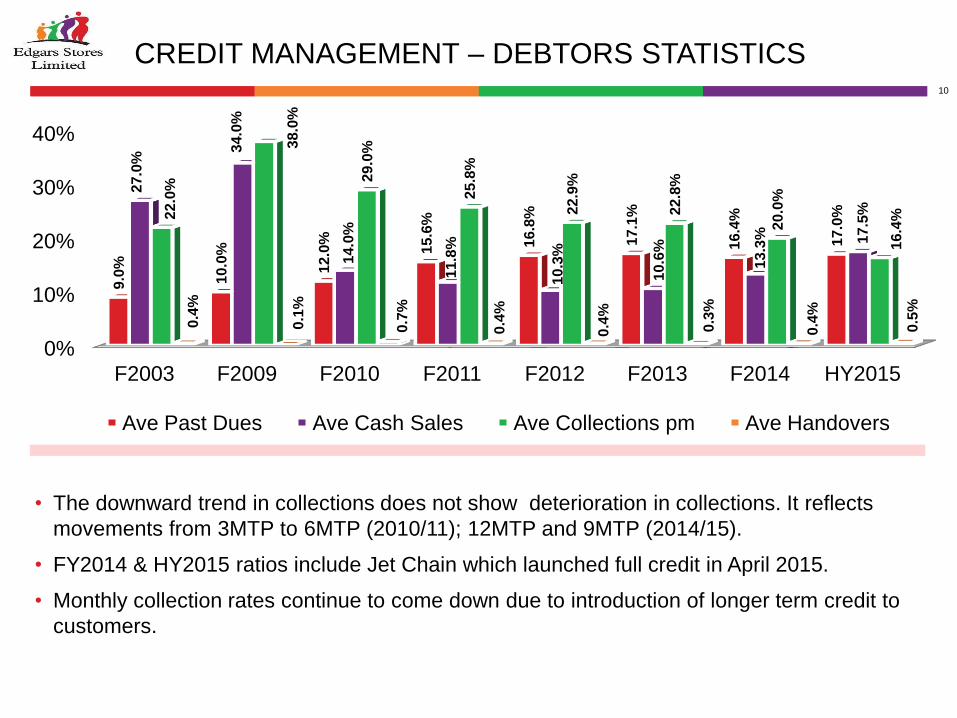
CREDIT MANAGEMENT – DEBTORS STATISTICS
• The downward trend in collections does not show deterioration in collections. It reflects
movements from 3MTP to 6MTP (2010/11); 12MTP and 9MTP (2014/15).
• FY2014 & HY2015 ratios include Jet Chain which launched full credit in April 2015.
• Monthly collection rates continue to come down due to introduction of longer term credit to
customers.
0%
10%
20%
30%
40%
F2003 F2009 F2010 F2011 F2012 F2013 F2014 HY2015
9.0
%
10.0
%
12.0
%
15.6
%
16.8
%
17.1
%
16.4
%
17.0
%
27.0
% 34.0
%
14
.0%
11.8
%
10.3
%
10.6
%
13.3
%
17
.5%
22.0
%
38
.0%
29.0
%
25.8
%
22.9
%
22.8
%
20.0
%
16.4
%
0.4
%
0.1
%
0.7
%
0.4
%
0.4
%
0.3
%
0.4
%
0.5
%
Ave Past Dues Ave Cash Sales Ave Collections pm Ave Handovers

11
UNIT SALES ‘000
Group unit sales grew by 0.8% over HY2014.
• Edgars Chain was 15.8% below last year.
• Jet Chain sold 33.6% more units than last year.
-
125
250
375
500
Jan Feb Mar Apr May Jun
2014 2015

FINANCIAL REVIEW

13
FINANCIAL HIGHLIGHTS
HY2015 HY2014 % change
Retail Sales 29,268,372 29,497,625 (0.8)
Net Profit Margin % 4.0 3.5 14.3
Earnings per Share (cents) 0.46 0.44 4.5
Trade and Other Receivables $ 31,376,086 22,707,233 38.2
No. of Accounts 243,131 204 792
18.7
Gearing (Gross) 1.00 0.94 (6.4)
Net Equity per Share (cents) 9.05 6.93 30.6
Cash flow from operations $ (1,597,364) 299,199 (633.9)
Borrowings @ period end $
23,199,551 16,730,179 (38.7)
14
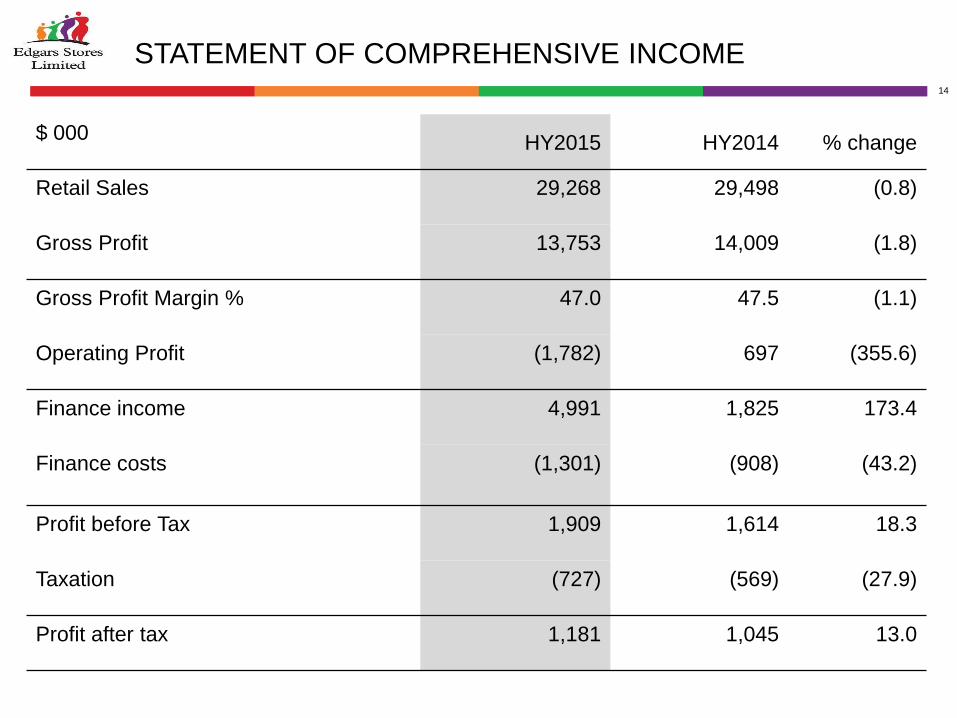
STATEMENT OF COMPREHENSIVE INCOME
$ 000 HY2015 HY2014 % change
Retail Sales 29,268 29,498 (0.8)
Gross Profit 13,753 14,009 (1.8)
Gross Profit Margin % 47.0 47.5 (1.1)
Operating Profit (1,782) 697 (355.6)
Finance income 4,991 1,825 173.4
Finance costs
(1,301) (908) (43.2)
Profit before Tax 1,909 1,614 18.3
Taxation (727) (569) (27.9)
Profit after tax 1,181 1,045 13.0
15
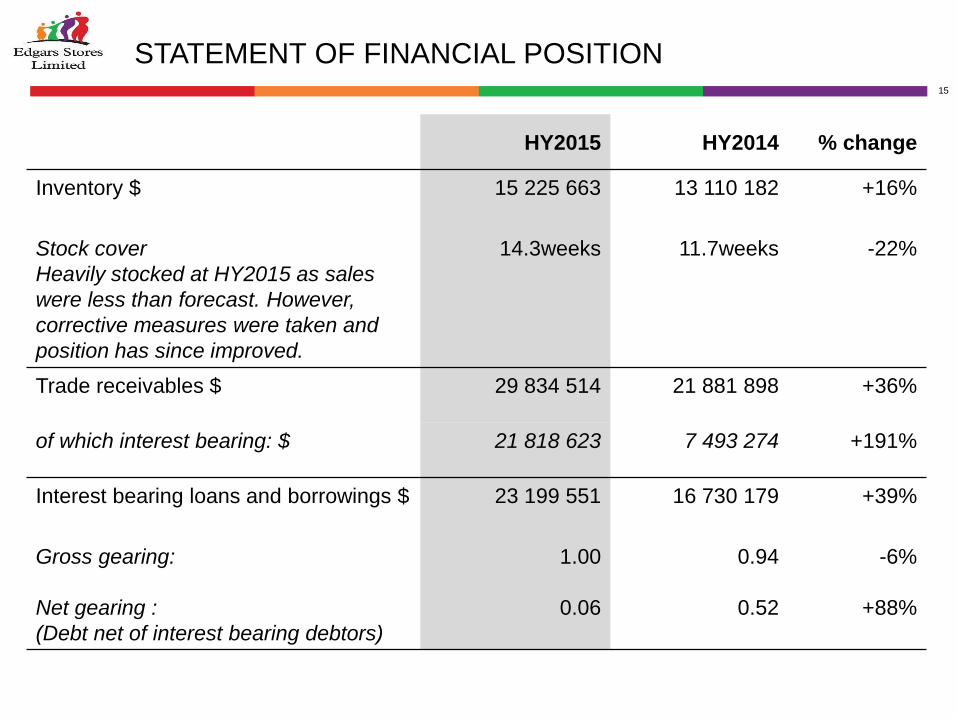
STATEMENT OF FINANCIAL POSITION
HY2015 HY2014 % change
Inventory $ 15 225 663
13 110 182 +16%
Stock cover
Heavily stocked at HY2015 as sales
were less than forecast. However,
corrective measures were taken and
position has since improved.
14.3weeks
11.7weeks
-22%
Trade receivables $ 29 834 514 21 881 898 +36%
of which interest bearing: $ 21 818 623 7 493 274 +191%
Interest bearing loans and borrowings $ 23 199 551
16 730 179 +39%
Gross gearing:
Net gearing :
(Debt net of interest bearing debtors)
1.00
0.06
0.94
0.52
-6%
+88%

LOOKING FOWARD
17
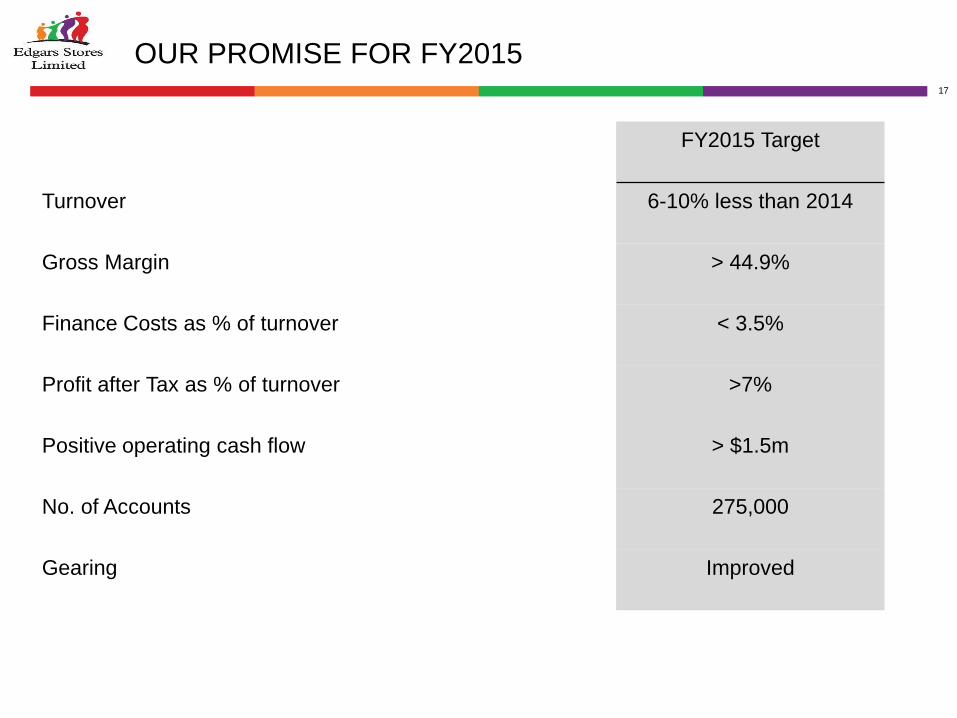
OUR PROMISE FOR FY2015
FY2015 Target
Turnover 6-10% less than 2014
Gross Margin > 44.9%
Finance Costs as % of turnover < 3.5%
Profit after Tax as % of turnover >7%
Positive operating cash flow > $1.5m
No. of Accounts 275,000
Gearing Improved