Embed Size (px)
Citation preview

PRESENTATION OF FINANCIAL RESULTS

The Elephant in the Room……
2

The Year after Extended Credit ……..
3
TRUWORTHS EDGARS
CALENDER
YEAR*
Turnover
Growth %
PAT
Growth %
Turnover
Growth %
PAT
Growth %
F2012 9.8 16.8 17.8 8.7
F2013 2.5 9.8 7.6 11.6
F2014 (18.1) (152.6) 11.3 22.3
F2015 9.9 162.9 (13.6) (11.9)
*For January to December.

STRATEGIC AND OPERATIONAL
UPDATE
AGENDA:

KEY FEATURES OF THE YEAR
SA
LE
S
Challenging
economic
environment plus
High Base
following
Extended Credit
• Retail Sales
• Cash Sales
• Credit sales
• Unit Sales
13.6%
7.9%
15.8%
8.9%
RE
SU
LT
S Profit for the year
of $3.9m.
Positive Operating
Cash flow - $4.1m
• Gross profit
• Profit After Tax
• Operating Cash
flow
14.2%
11.9%
284%
ST
RA
TE
GY
Focus on
Customer
Centricity & Value
Preservation.
• Differentiation of Chains &
Products.
• Improved Product
assortments.
• Business Process Re-
Engineering.
• Reducing Costs.
• Leaner Business Model by
0617 5
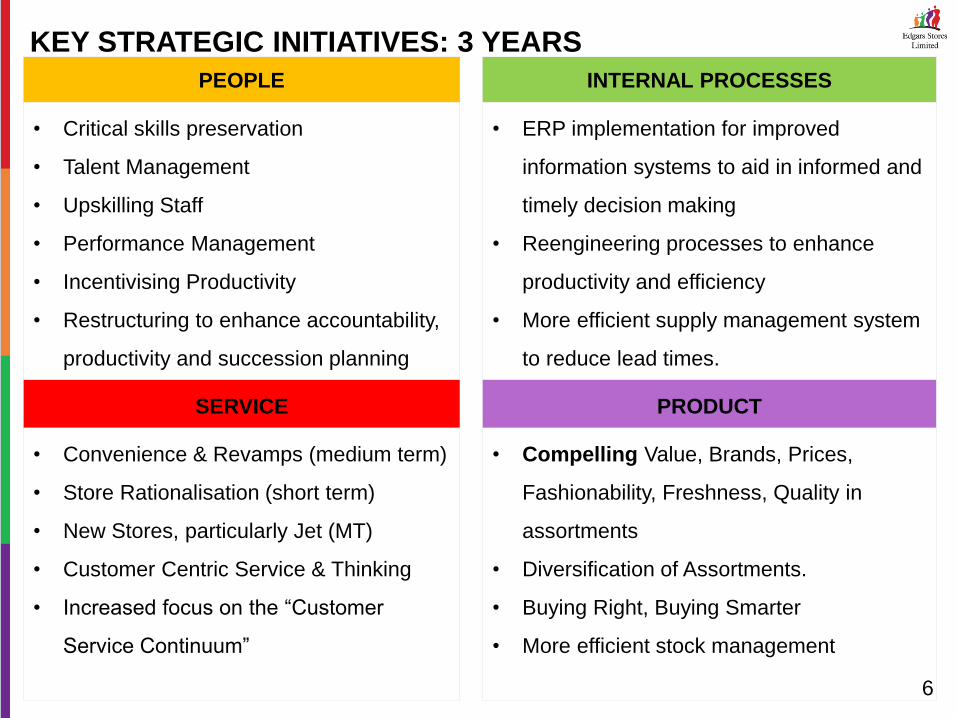
KEY STRATEGIC INITIATIVES: 3 YEARS
PEOPLE INTERNAL PROCESSES
• Critical skills preservation
• Talent Management
• Upskilling Staff
• Performance Management
• Incentivising Productivity
• Restructuring to enhance accountability,
productivity and succession planning
• ERP implementation for improved
information systems to aid in informed and
timely decision making
• Reengineering processes to enhance
productivity and efficiency
• More efficient supply management system
to reduce lead times.
SERVICE PRODUCT
• Convenience & Revamps (medium term)
• Store Rationalisation (short term)
• New Stores, particularly Jet (MT)
• Customer Centric Service & Thinking
• Increased focus on the “Customer
Service Continuum”
• Compelling Value, Brands, Prices,
Fashionability, Freshness, Quality in
assortments
• Diversification of Assortments.
• Buying Right, Buying Smarter
• More efficient stock management
6

NEW PRODUCTS & BUSINESS - F2015
In 2015, the Group launched the following products:
• Jet credit was rolled out to all stores across the chain.
• Rollout of credit for the informal sector in Jet chain.
In 2014 Edgars Chain introduced Extended Credit which boosted sales but
provided a very high base for the chain in 2015
7

THE CLUB & CSR
CLUB – Corporate Social Responsibility
• $ 12,000 in cash and $ 12,600 in Gift
Vouchers were won by Club members.
• Each Club member who won selected a rural
school of choice for the Club to make a
donation in every issue.
In total, more than $145000 CSR spend on:
• Boreholes for waterless communities
• Anti Litter campaigns
• Environment and wildlife
• Orphanages
• Feeding the hungry
• Education
We also nurtured and trained young
Zimbabwean Designers
Number of Issues 5
Number of Schools 15
Value of Donations $ 50,000
8

SEGMENT ANALYSIS – TURNOVER CONTRIBUTION
Unconsolidated Consolidated
• Jet Chain contribution grew 8.9% with
the full rollout of credit in F2015
• Edgars chain contribution declined.
• Carousel third party sales grew by
10.7% over F2014.
9
EDGARS 63.6%
JET 28.6% CAROUSEL
7.8%
EDGARS 68.5%
JET 30.8%
CAROUSEL 0.7%

TURNOVER SPLIT
CASH vs CREDIT BY CHAIN
• Credit Sales decline of
15.8%.
• Cash Sales were lower
than last year by 7.9%
Average Dollar
Purchase per Account
-14.5%
CASH SALES 28.9%
CREDIT SALES 71.1%
EDGARS CREDIT SALES 59.8%
EDGARS CASH SALES 9.1%
JET CREDIT SALES 11.2%
JET CASH SALES 19.8%
10 5.9%
F2015 F2014

MERCHANDISE - PROCUREMENT
• Total merchandise purchases declined
by 9.1% over F2014.
• Merchandise purchases from foreign
suppliers grew by 11.8% over F2014.
• Procurement from local, external
suppliers remained in the same range
as last year.
Carousel
Purchases
-31.6%
LOCAL SUPPLIERS
54.8%
CAROUSEL 13.7%
FOREIGN SUPPLIERS
31.5%
0%
20%
40%
60%
80%
LOCALSUPPLIERS
CAROUSEL FOREIGNSUPPLIERS
F2011 F2012 F2013 F2014 F2015
11

ACCOUNTS PERFORMANCE
ACTIVE ACCOUNTS %AGE TOTAL ACCOUNTS (000s)
• Average number of new accounts per month = 3,975 accounts ( 7.6%
growth).
• Accounts growth spurred by the full roll out of Jet Credit.
• Average active accounts percentage = 71.2%
• Our SME. financial Inclusion project performed within expectations
Total
Accounts
11.6%
60%
70%
80%
F2012 F2013 F2014 F2015
0
50
100
150
200
250
300
12

CREDIT MANAGEMENT – DEBTORS STATISTICS
• F2014 and F2015 ratios include Jet Chain which launched full credit in
F2015.
• Overall collection rates came down due to introduction of longer term
credit to customers. Collections grew 3.3%
• Doubtful Debt Provisions increased from 2% to 6% YOY
13
0%
10%
20%
30%
F2012 F2013 F2014 F2015
16
.8%
17
.1%
16
.4%
19
.2%
26
.6%
28
.1%
27
.1%
28
.9%
22
.9%
22
.8%
20
.0%
16
.6%
0.4
%
0.3
%
0.4
%
0.6
%
Ave Past Dues Ave Cash Sales Ave Collections pm Ave Handovers
3.3%
$ COLLECTIONS

DEBTORS AND STATISTICS
Edgars 85%
Jet 15%
F2015
Edgars 95%
Jet 5%
F2014
DEBTORS SPLIT BY CHAIN
14
FINANCIAL REVIEW
AGENDA:

CHAIN STATISTICS
EDGARS CHAIN JET CHAIN
F2015 F2014 %
change F2015 F2014
%
change
No. of stores 28 28 - 25 25 -
Trading space (sqm) 28,486 28,486 - 11,796 11,796 -
Turnover per sqm ($) 1,498 1,968 (23.9) 1,628 1,322 23.1
Turnover per Employee ($) 120,570 121,093 (0.4) 95,055 74,972 26.8
Unit sales ‘000 2,159 2,862 (24.6) 2,091 1,806 15.8
16
10.8%
CANNIBALISATION

FINANCIAL HIGHLIGHTS
FY2015 FY2014 %
change
Retail Sales 62,272,354 72,071,863 (13.6)
Net Profit Margin % 6.4 7.2 (11.6)
Earnings per Share (cents) 1.77 2.02 (12.3)
Trade and Other Receivables $ 32,344,417 34,315,693 (5.7)
No. of Accounts 257,003 230,381 11.6
Gearing 0.66 0.89 26.2
Net Equity per Share (cents) 9.07 7.48 21.3
Cash flow from operations $ 4,102,291 (2,231,255) 283.9
Borrowings @ year end $ 18,024,941 20,342,034 (11.4)
17

STATEMENT OF COMPREHENSIVE INCOME
$ 000 FY2015 FY2014 % change
Retail Sales 62,272 72,072 (13.6)
Gross Profit 28,669 33,421 (14.2)
Gross Profit Margin % 46.0 46.4 (0.8)
Other (Losses)/Gains (24) (28) 12.2
Credit Management & Debt Collections (6,104) (3,788) (61.1)
Store Expenses (12,620) (13,286) 5.0
Depreciation (1,213) (994) (22.1)
Other Operating Expenses (10,409) (11,029) 5.6
Finance income 10,511 5,123 105.2
Finance costs (2,735) (1,944) (40.7)
Profit before Tax 6,073 7,475 (18.8)
Taxation (2,108) (2,292) 8.0
Profit after tax 3,964 5,184 (23.5)
Other Comprehensive Income 605 - 100.0
Total Comprehensive Income for the
period 4,569 5,184 (11.9)
18

LOOKING FOWARD
AGENDA:

OUR FORECAST FOR 2016
2016 Targets
Turnover Growth
Around 0% or more but
dependent on Civil Service
Layoffs / Bonuses
Finance Costs < 4.2%
Borrowings @ year
end
+/- $17m
No. of Accounts 300,000
Gearing +/-0.60
20