Embed Size (px)
Citation preview
GROUP
COMPANY
STATEMENT OF COMPREHENSIVEINCOME Unaudited
Unaudited
Audited
Unaudited
Unaudited
Audited
6 months
6 months
12 months
6 months
6 months
12 months
Jun-15
Jun-14
Dec-14
Jun-15
Jun-14
Dec-14
P'000
P'000
P'000
P'000
P'000
P'000
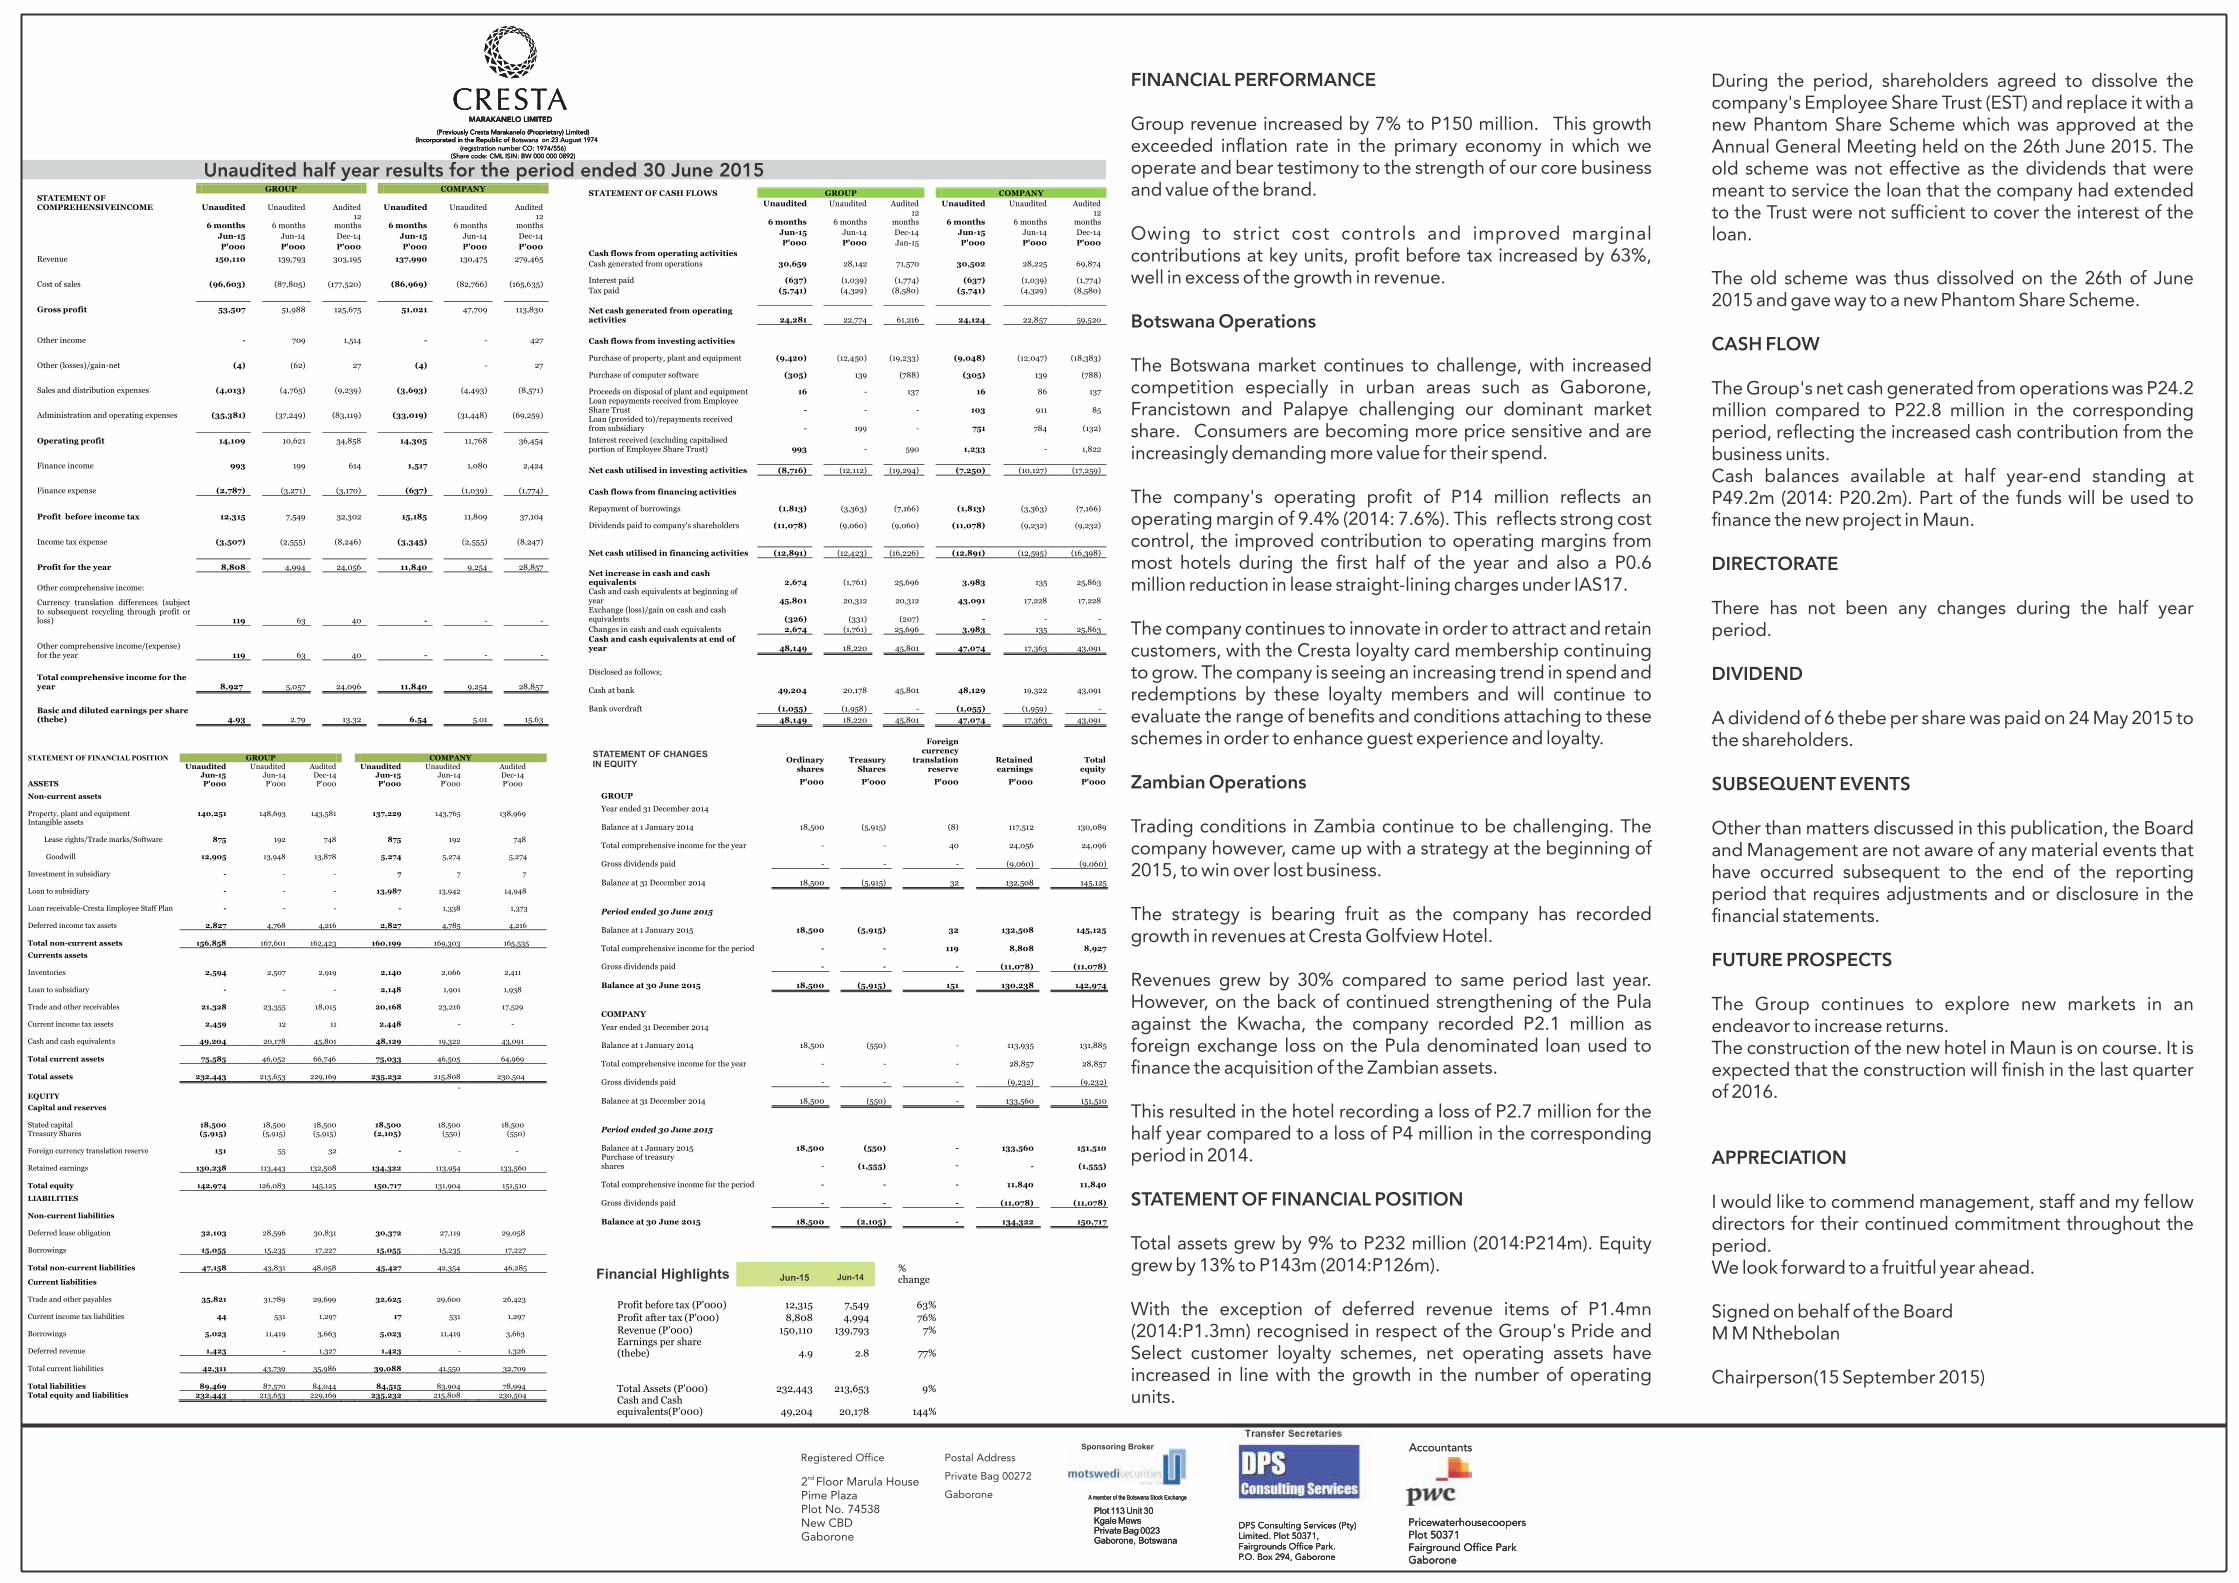
Revenue 150,110
139,793
303,195
137,990
130,475
279,465
Cost of sales (96,603)
(87,805)
(177,520)
(86,969)
(82,766)
(165,635)
Gross profit 53,507
51,988
125,675
51,021
47,709
113,830
Other income
-
709
1,514
-
-
427
Other (losses)/gain-net (4)
(62)
27
(4)
-
27
Sales and distribution expenses (4,013)
(4,765)
(9,239)
(3,693)
(4,493)
(8,571)
Administration and operating expenses (35,381)
(37,249)
(83,119)
(33,019)
(31,448)
(69,259)
Operating profit 14,109
10,621
34,858
14,305
11,768
36,454
Finance income 993
199
614
1,517
1,080
2,424
Finance expense (2,787)
(3,271)
(3,170)
(637)
(1,039)
(1,774)
Profit before income tax 12,315
7,549
32,302
15,185
11,809
37,104
Income tax expense (3,507)
(2,555)
(8,246)
(3,345)
(2,555)
(8,247)
Profit for the year 8,808
4,994
24,056
11,840
9,254
28,857
Other comprehensive income:
Currency translation differences (subject to subsequent recycling through profit or loss) 119
63
40
-
-
-
Other comprehensive income/(expense) for the year 119
63
40
-
-
-
Total comprehensive income for the year 8,927
5,057
24,096
11,840
9,254
28,857
Basic and diluted earnings per share (thebe)
4.93
2.79
13.32
6.54
5.01
15.63
STATEMENT OF CASH FLOWS GROUP
COMPANY
Unaudited
Unaudited
Audited
Unaudited
Unaudited
Audited
6 months
6 months
12 months
6 months
6 months
12 months
Jun-15
Jun-14
Dec-14
Jun-15
Jun-14
Dec-14
P'000
P'000
Jan-15
P'000
P'000
P'000
Cash flows from operating activities Cash generated from operations 30,659
28,142
71,570
30,502
28,225
69,874
Interest paid (637)
(1,039)
(1,774)
(637)
(1,039)
(1,774)
Tax paid (5,741)
(4,329)
(8,580)
(5,741)
(4,329)
(8,580)
Net cash generated from operating activities 24,281
22,774
61,216
24,124
22,857 59,520
Cash flows from investing activities
Purchase of property, plant and equipment (9,420)
(12,450)
(19,233)
(9,048)
(12,047)
(18,383)
Purchase of computer software (305)
139
(788)
(305)
139
(788)
Proceeds on disposal of plant and equipment 16
-
137
16
86
137 Loan repayments received from Employee Share Trust
-
-
-
103
911
85
Loan (provided to)/repayments received from subsidiary
-
199
-
751
784
(132)
Interest received (excluding capitalised portion of Employee Share Trust) 993
-
590
1,233
-
1,822
Net cash utilised in investing activities (8,716)
(12,112)
(19,294)
(7,250)
(10,127) (17,259)
Cash flows from financing activities
Repayment of borrowings (1,813)
(3,363)
(7,166)
(1,813)
(3,363)
(7,166)
Dividends paid to company's shareholders (11,078)
(9,060)
(9,060)
(11,078)
(9,232)
(9,232)
Net cash utilised in financing activities (12,891)
(12,423)
(16,226)
(12,891) (12,595) (16,398)
Net increase in cash and cash equivalents 2,674
(1,761)
25,696
3,983
135
25,863
Cash and cash equivalents at beginning of year 45,801
20,312
20,312
43,091
17,228
17,228
Exchange (loss)/gain on cash and cash equivalents (326)
(331)
(207)
-
-
-
Changes in cash and cash equivalents 2,674
(1,761)
25,696
3,983
135
25,863 Cash and cash equivalents at end of year 48,149
18,220
45,801
47,074
17,363 43,091
Disclosed as follows;
Cash at bank
49,204
20,178
45,801
48,129
19,322
43,091
Bank overdraft
(1,055)
(1,958)
-
(1,055)
(1,959)
-
48,149
18,220
45,801
47,074
17,363
43,091
{ Ç! Ç9 a 9 b Ç h C / I ! b D9 { Lb EQUITY
Ordinary shares
Treasury Shares
Foreign currency
translation reserve
Retained earnings
Total equity
P'000
P'000
P'000
P'000
P'000
GROUP Year ended 31 December 2014
Balance at 1 January 2014
18,500
(5,915)
(8)
117,512
130,089
Total comprehensive income for the year
-
-
40
24,056
24,096
Gross dividends paid
-
-
-
(9,060)
(9,060)
Balance at 31 December 2014
18,500
(5,915)
32
132,508
145,125
Period ended 30 June 2015
Balance at 1 January 2015
18,500
(5,915)
32
132,508
145,125
Total comprehensive income for the period
-
-
119
8,808
8,927
Gross dividends paid
-
-
-
(11,078)
(11,078)
Balance at 30 June 2015
18,500
(5,915)
151
130,238
142,974
COMPANY Year ended 31 December 2014
Balance at 1 January 2014
18,500
(550)
-
113,935
131,885
Total comprehensive income for the year
-
-
-
28,857
28,857
Gross dividends paid
-
-
-
(9,232)
(9,232)
Balance at 31 December 2014
18,500
(550)
-
133,560
151,510
Period ended 30 June 2015
Balance at 1 January 2015
18,500
(550)
-
133,560
151,510
Purchase of treasury shares -
(1,555)
-
-
(1,555)
Total comprehensive income for the period
-
-
-
11,840
11,840
Gross dividends paid
-
-
-
(11,078)
(11,078)
Balance at 30 June 2015
18,500
(2,105)
-
134,322
150,717
CLb ! b / L! [ I LDI [ LDI Ç{
WΡŧ -15 WΡŧ -14
% change
Profit before tax (P'000) 12,315 7,549
63%
Profit after tax (P'000) 8,808 4,994
76% Revenue (P'000) 150,110 139,793
7%
Earnings per share (thebe) 4.9 2.8
77%
Total Assets (P'000)
232,443
213,653
9%
Cash and Cash equivalents(P’000)
49,204
20,178
144%
STATEMENT OF FINANCIAL POSITION
GROUP
COMPANY
Unaudited
Unaudited
Audited
Unaudited
Unaudited
Audited
Jun-15
Jun-14
Dec-14
Jun-15
Jun-14
Dec-14
ASSETS
P'000
P'000
P'000
P'000
P'000
P'000
Non-current assets
Property, plant and equipment
140,251
148,693
143,581
137,229
143,765
138,969
Intangible assets
Lease
rights/Trade marks/Software
875
192
748
875
192
748
Goodwill
12,905
13,948
13,878
5,274
5,274
5,274
Investment in subsidiary
-
-
-
7
7
7
Loan to subsidiary
-
-
-
13,987
13,942
14,948
Loan receivable-Cresta Employee Staff Plan
-
-
-
-
1,338
1,373
Deferred income tax assets
2,827
4,768
4,216
2,827
4,785
4,216
Total non-current assets
156,858
167,601
162,423
160,199
169,303
165,535
Currents assets
Inventories
2,594
2,507
2,919
2,140
2,066
2,411
Loan to subsidiary
-
-
-
2,148
1,901
1,938
Trade and other receivables
21,328
23,355
18,015
20,168
23,216
17,529
Current income tax assets
2,459
12
11
2,448
-
-
Cash and cash equivalents
49,204
20,178
45,801
48,129
19,322
43,091
Total current assets
75,585
46,052
66,746
75,033
46,505
64,969
Total assets
232,443
213,653
229,169
235,232
215,808
230,504
-
EQUITY
Capital and reserves
Stated capital
18,500
18,500
18,500
18,500
18,500
18,500
Treasury Shares
(5,915)
(5,915)
(5,915)
(2,105)
(550)
(550)
Foreign currency translation reserve
151
55
32
-
-
-
Retained earnings
130,238
113,443
132,508
134,322
113,954
133,560
Total equity
142,974
126,083
145,125
150,717
131,904
151,510
LIABILITIES
Non-current liabilities
Deferred lease obligation
32,103
28,596
30,831
30,372
27,119
29,058
Borrowings
15,055
15,235
17,227
15,055
15,235
17,227
Total non-current liabilities
47,158
43,831
48,058
45,427
42,354
46,285
Current liabilities
Trade and other payables
35,821
31,789
29,699
32,625
29,600
26,423
Current income tax liabilities
44
531
1,297
17
531
1,297
Borrowings
5,023
11,419
3,663
5,023
11,419
3,663
Deferred revenue
1,423
-
1,327
1,423
-
1,326
Total current liabilities
42,311
43,739
35,986
39,088
41,550
32,709
Total liabilities
89,469
87,570
84,044
84,515
83,904
78,994
Total equity and liabilities 232,443 213,653 229,169 235,232 215,808 230,504