1
GROUP COMPANY Unaudited Unaudited Audited Unaudited Unaudited Audited 6 months 6 months 12 months 6 months 6 months 12 months Jun-16 Jun-15 Dec-15 Jun-16 Jun-15 Dec-15 P'000 P'000 P'000 P'000 P'000 P'000 Revenue 159,939 150,110 319,603 147,975 137,990 296,279 Cost of sales (102,713) (96,603) (190,482) (93,149) (86,969) (178,475) Gross profit 57,226 53,507 129,121 54,826 51,021 117,804 Other income - - 1,065 - - - Other gains/(losses) 25 (4) 39 (25) (4) 39 Sales and distribution expenses (3,732) (4,013) (7,689) (3,519) (3,693) (7,159) Administration and operating expenses (37,164) (35,381) (81,448) (34,744) (33,019) (69,830) Operating profit 16,355 14,109 41,088 16,538 14,305 40,854 Finance income 2,328 993 1,933 1,170 1,517 2,899 Finance expense (444) (2,787) (6,798) (444) (637) (1,152) Profit before income tax 18,239 12,315 36,223 17,264 15,185 42,601 Income tax expense (3,943) (3,507) (9,462) (3,943) (3,345) (9,462) Profit for the period 14,296 8,808 26,761 13,321 11,840 33,139 Other comprehensive income: Currency translation differences (subject to subsequent recycling through profit or loss) (1,210) 119 2,199 - - - Other comprehensive income/(expense) for the period (1,210) 119 2,199 - - - Total comprehensive income for the period 13,086 8,927 28,960 13,321 11,840 33,139 Basic and diluted earnings per share (thebe) 7.23 4.93 16.01 7.36 6.54 18.32 Dwh Üt COMPANY Unaudited Unaudited Audited Unaudited Unaudited Audited Jun-16 Jun-15 Dec-15 Jun-16 Jun-15 Dec-15 P'000 P'000 P'000 P'000 P'000 P'000 ASSETS Non-current assets Property, plant and equipment 146,704 140,251 142,576 143,563 137,229 139,204 Intangible assets Lease rights/Trademarks/Software 950 875 781 836 875 781 Goodwill 11,456 12,905 11,335 5,274 5,274 5,274 Investment in subsidiary - - - 15,339 7 7 Loan to subsidiary - - - - 13,987 13,300 Deferred income tax assets 2,244 2,827 4,284 2,244 2,827 4,284 Total non-current assets 161,354 156,858 158,976 167,256 160,199 162,850 Currents assets Inventories 2,856 2,594 2,852 2,571 2,140 2,540 Loan to subsidiary - - - - 2,148 2,258 Trade and other receivables 21,782 21,328 20,959 21,213 20,168 20,216 Current income tax assets 3,207 2,459 479 3,146 2,448 470 Cash and cash equivalents 58,862 49,204 61,835 57,978 48,129 61,064 Total current assets 86,707 75,585 86,125 84,908 75,033 86,548 Total assets 248,061 232,443 245,101 252,164 235,232 249,398 EQUITY Capital and reserves Stated capital 18,500 18,500 18,500 18,500 18,500 18,500 Treasury shares (5,915) (5,915) (5,915) (2,105) (2,105) (2,105) Foreign currency translation reserve 1,021 151 2,231 - - - Retained earnings 149,563 130,238 148,191 156,018 134,322 155,621 Total equity 163,169 142,974 163,007 172,413 150,717 172,016 LIABILITIES Non-current liabilities Deferred lease obligation 29,429 30,244 30,589 27,784 28,935 29,209 Borrowings 10,679 15,055 12,856 10,679 15,055 12,856 Total non-current liabilities 40,108 45,299 43,445 38,463 43,990 42,065 Current liabilities Trade and other payables 35,197 35,821 31,276 31,764 32,625 28,134 Current income tax liabilities - 44 - - 17 - Borrowings 4,989 5,023 4,277 4,989 5,023 4,277 Deferred revenue 1,822 1,423 1,615 1,822 1,423 1,615 Deferred lease obligation 2,776 1,859 1,481 2,713 1,437 1,291 Total current liabilities 44,784 44,170 38,649 41,288 40,525 35,317 Total liabilities 84,892 89,469 82,094 79,751 84,515 77,382 Total equity and liabilities 248,061 232,443 245,101 252,164 235,232 249,398 Ordinary shares Treasury shares Foreign currency translation reserve Retained earnings Total equity P'000 P'000 P'000 P'000 P'000 GROUP Year ended 31 December 2015 Balance at 1 January 2015 18,500 (5,915) 32 132,508 145,125 Profit for the period - - - 26,761 26,761 Other comprehensive income for the year - - 2,199 - 2,199 Total comprehensive income for the year - - 2,199 26,761 28,960 Transaction with owners of the company: Gross dividends paid - - - (11,078) (11,078) - - - (11,078) (11,078) Balance at 31 December 2015 18,500 (5,915) 2,231 148,191 163,007 Period ended 30 June 2016 Balance at 1 January 2016 18,500 (5,915) 2,231 148,191 163,007 Profit for the period - - - 14,296 14,296 Other comprehensive income for the period - - (1,210) - (1,210) Total comprehensive income for the period - - (1,210) 14,296 13,086 Transaction with owners of the company: Gross dividends paid - - - (12,924) (12,924) - - - (12,924) (12,924) Balance at 30 June 2016 18,500 (5,915) 1,021 149,563 163,169 COMPANY Year ended 31 December 2015 Balance at 1 January 2015 18,500 (550) - 133,560 151,510 Profit for the year - - - 33,139 33,139 Other comprehensive income for the year - - - - - Total comprehensive income for the year - - - 33,139 33,139 Transaction with owners of the company: Gross dividends paid - - - (11,078) (11,078) Acquisition of treasury shares - (1,555) - (1,555) - (1,555) - (11,078) (12,633) Balance at 31 December 2015 18,500 (2,105) - 155,621 172,016 Period ended 30 June 2016 Balance at 1 January 2016 18,500 (2,105) - 155,621 172,016 Profit for the period - - - 13,321 13,321 Other comprehensive income for the period - - - - - Total comprehensive income for the period - - - 13,321 13,321 Transaction with owners of the company: Gross dividends paid - - - (12,924) (12,924) - - - (12,924) (12,924) Balance at 30 June 2016 18,500 (2,105) - 156,018 172,413 GROUP COMPANY Unaudited Unaudited Audited Unaudited Unaudited Audited 6 months 6 months 12 months 6 months 6 months 12 months Jun-16 Jun-15 Dec-15 Jun-16 Jun-15 Dec-15 P'000 P'000 P'000 P'000 P'000 P'000 Cash flows from operating activities Cash generated from operations 30,803 30,659 67,730 29,907 30,502 65,508 Interest paid (444) (637) (1,152) (444) (637) (1,152) Tax paid (4,410) (5,741) (11,299) (4,410) (5,741) (11,299) Net cash generated from operating activities 25,949 24,281 55,279 25,053 24,124 53,057 Cash flows from investing activities Purchase of property, plant and equipment (14,935) (9,420) (25,910) (14,747) (9,048) (23,958) Purchase of computer software (410) (305) (406) (277) (305) (406) Proceeds on disposal of plant and equipment 75 16 70 17 16 70 Loan repayments received from Employee Share Trust - - - - 103 102 Loan repayments received from subsidiary - - - 226 751 1,328 Interest received 876 993 1,934 1,031 1,233 2,615 Net cash utilised in investing activities (14,394) (8,716) (24,312) (13,750) (7,250) (20,249) Cash flows from financing activities Repayment of borrowings (2,061) (1,813) (3,857) (2,061) (1,813) (3,857) Dividends paid to company's shareholders (12,924) (11,078) (11,078) (12,924) (11,078) (11,078) Net cash utilised in financing activities (14,985) (12,891) (14,935) (14,985) (12,891) (14,935) Net (decrease)/increase in cash and cash equivalents (3,430) 2,674 16,032 (3,682) 3,983 17,873 Cash and cash equivalents at beginning of year 61,735 45,801 45,801 60,964 43,091 43,091 Exchange loss on cash and cash equivalents (139) (326) (98) - - - Cash and cash equivalents at end of year 58,166 48,149 61,735 57,282 47,074 60,964 Disclosed as follows; Cash at bank 58,862 49,204 61,835 57,978 48,129 61,064 Bank overdraft (696) (1,055) (100) (696) (1,055) (100) 58,166 48,149 61,735 57,282 47,074 60,964 WΡŧś 2016 WΡŧś % change P’000 P’000 Profit before tax 18,239 12,315 48% Total comprehensive income 13,086 8,927 47% Operating profit 16,355 14,109 16% Revenues 159,939 150,110 7% Total Assets 248,061 232,443 7% Cash and cash equivalents 58,862 49,204 20% Earnings per Share(thebe) 7.23 4.93 47% GROUP

Cresta Marakanelo Limited HY 2016 financial results

Embed Size (px)

Citation preview

GROUP

COMPANY

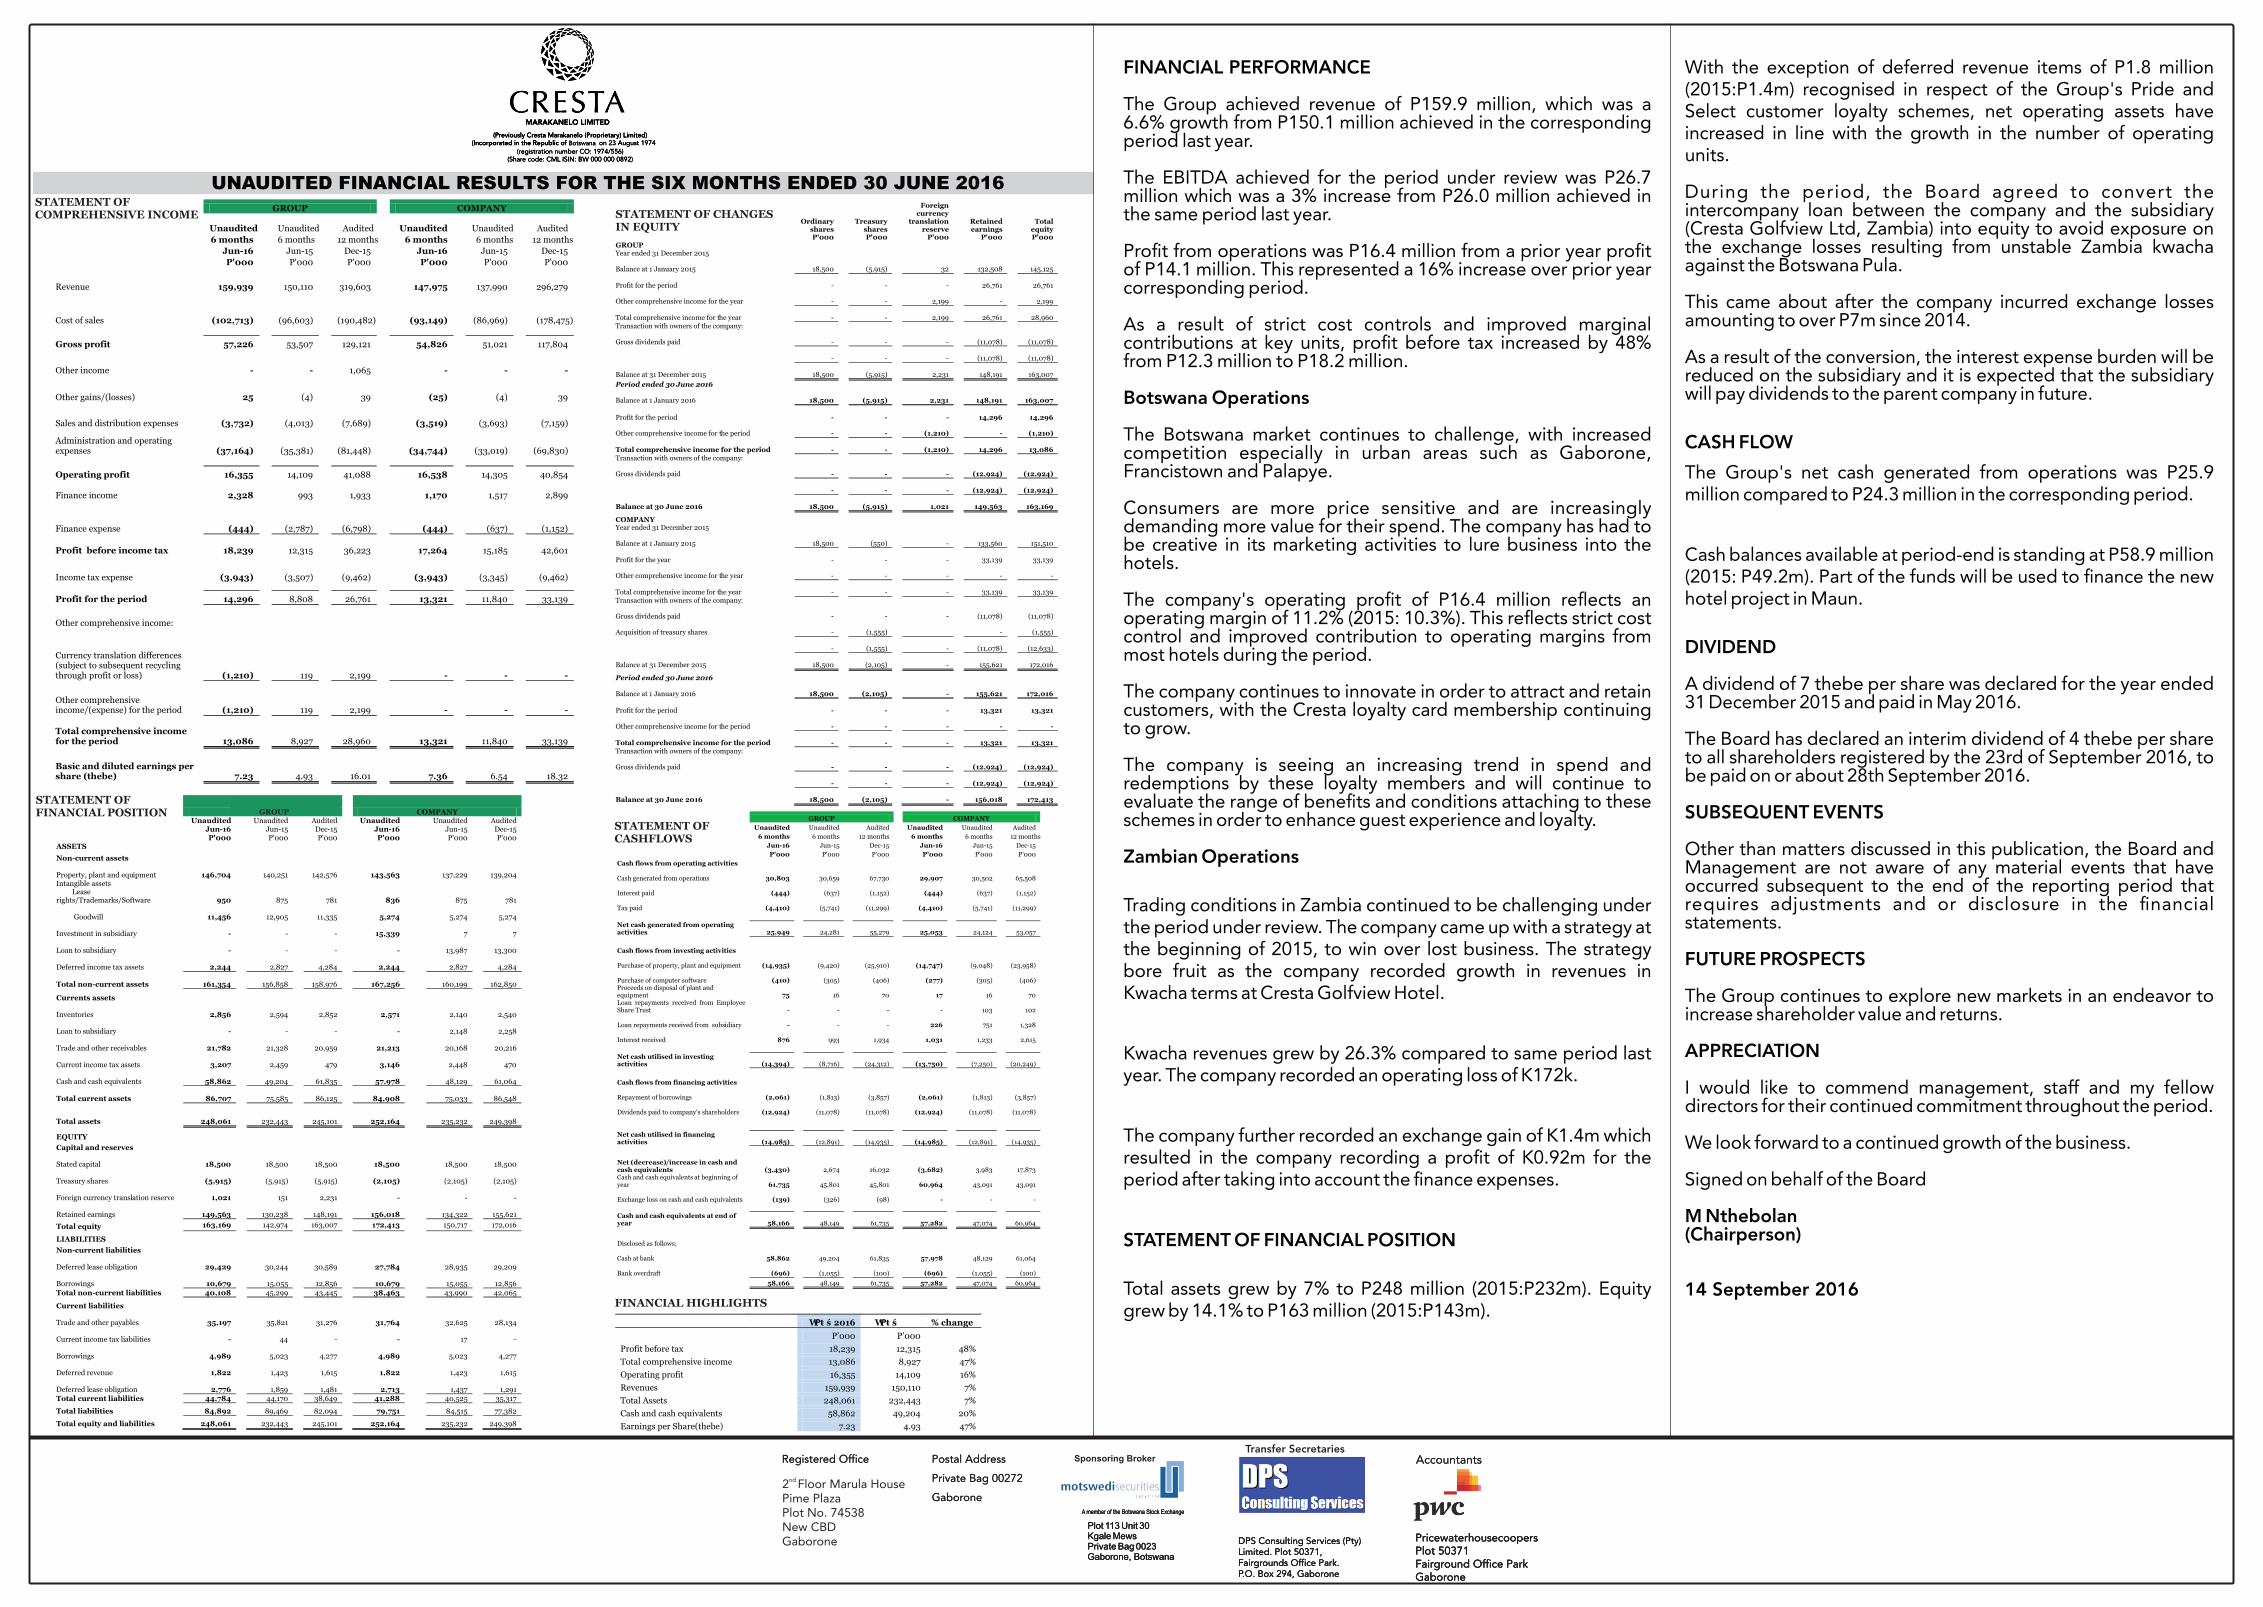
STATEMENT OF COMPREHENSIVE INCOME Unaudited

Unaudited

Audited

Unaudited

Unaudited

Audited

6 months

6 months

12 months

6 months

6 months

12 months

Jun-16

Jun-15

Dec-15

Jun-16

Jun-15

Dec-15

P'000

P'000

P'000

P'000

P'000

P'000

Revenue 159,939

150,110

319,603

147,975

137,990

296,279

Cost of sales

(102,713)

(96,603)

(190,482)

(93,149)

(86,969)

(178,475)

Gross profit 57,226

53,507

129,121

54,826

51,021

117,804

Other income

-

-

1,065

-

-

-

Other gains/(losses)

25

(4)

39

(25)

(4)

39

Sales and distribution expenses

(3,732)

(4,013)

(7,689)

(3,519)

(3,693)

(7,159)

Administration and operating expenses

(37,164)

(35,381)

(81,448)

(34,744)

(33,019)

(69,830)

Operating profit 16,355

14,109

41,088

16,538

14,305

40,854

Finance income 2,328

993

1,933

1,170

1,517

2,899

Finance expense

(444)

(2,787)

(6,798)

(444)

(637)

(1,152)

Profit before income tax 18,239

12,315

36,223

17,264

15,185

42,601

Income tax expense

(3,943)

(3,507)

(9,462)

(3,943)

(3,345)

(9,462)

Profit for the period 14,296

8,808

26,761

13,321

11,840

33,139

Other comprehensive income:

Currency translation differences (subject to subsequent recycling through profit or loss)

(1,210)

119

2,199

-

-

-

Other comprehensive income/(expense) for the period

(1,210)

119

2,199

-

-

-

Total comprehensive income for the period 13,086

8,927

28,960

13,321

11,840

33,139

Basic and diluted earnings per share (thebe) 7.23

4.93

16.01

7.36

6.54

18.32

{ Ç! Ç9 a 9 b Ç h C FINANCIAL POSITION Dwh Üt

COMPANY

Unaudited

Unaudited

Audited

Unaudited

Unaudited

Audited

Jun-16

Jun-15

Dec-15

Jun-16

Jun-15

Dec-15

P'000

P'000

P'000

P'000

P'000

P'000

ASSETS Non-current assets

Property, plant and equipment 146,704

140,251

142,576

143,563

137,229

139,204

Intangible assets Lease

rights/Trademarks/Software 950

875

781

836

875

781

Goodwill 11,456

12,905

11,335

5,274

5,274

5,274

Investment in subsidiary -

-

-

15,339

7

7

Loan to subsidiary -

-

-

-

13,987

13,300

Deferred income tax assets 2,244

2,827

4,284

2,244

2,827

4,284

Total non-current assets 161,354

156,858

158,976

167,256

160,199

162,850

Currents assets

Inventories 2,856

2,594

2,852

2,571

2,140

2,540

Loan to subsidiary -

-

-

-

2,148

2,258

Trade and other receivables 21,782

21,328

20,959

21,213

20,168

20,216

Current income tax assets 3,207

2,459

479

3,146

2,448

470

Cash and cash equivalents 58,862

49,204

61,835

57,978

48,129

61,064

Total current assets 86,707

75,585

86,125

84,908

75,033

86,548

Total assets 248,061

232,443

245,101

252,164

235,232

249,398

EQUITY Capital and reserves

Stated capital 18,500

18,500

18,500

18,500

18,500

18,500

Treasury shares (5,915)

(5,915)

(5,915)

(2,105)

(2,105)

(2,105)

Foreign currency translation reserve

1,021

151

2,231

-

-

-

Retained earnings 149,563

130,238

148,191

156,018

134,322

155,621

Total equity 163,169

142,974

163,007

172,413

150,717

172,016

LIABILITIES Non-current liabilities

Deferred lease obligation 29,429

30,244

30,589

27,784

28,935

29,209

Borrowings 10,679

15,055

12,856

10,679

15,055

12,856

Total non-current liabilities 40,108

45,299

43,445

38,463

43,990

42,065

Current liabilities

Trade and other payables 35,197

35,821

31,276

31,764

32,625

28,134

Current income tax liabilities -

44

-

-

17

-

Borrowings 4,989

5,023

4,277

4,989

5,023

4,277

Deferred revenue 1,822

1,423

1,615

1,822

1,423

1,615

Deferred lease obligation 2,776

1,859

1,481

2,713

1,437

1,291

Total current liabilities 44,784

44,170

38,649

41,288

40,525

35,317

Total liabilities 84,892

89,469

82,094

79,751

84,515

77,382

Total equity and liabilities 248,061

232,443

245,101

252,164

235,232

249,398

STATEMENT OF CHANGES IN EQUITY

Ordinary shares

Treasury shares

Foreign currency

translation reserve

Retained earnings

Total equity

P'000

P'000

P'000

P'000

P'000

GROUP Year ended 31 December 2015

Balance at 1 January 2015

18,500

(5,915)

32

132,508

145,125

Profit for the period

-

-

-

26,761

26,761

Other comprehensive income for the year

-

-

2,199

-

2,199

Total comprehensive income for the year

-

-

2,199

26,761

28,960

Transaction with owners of the company:

Gross dividends paid

-

-

-

(11,078)

(11,078)

-

-

-

(11,078)

(11,078)

Balance at 31 December 2015

18,500

(5,915)

2,231

148,191

163,007

Period ended 30 June 2016

Balance at 1 January 2016

18,500

(5,915)

2,231

148,191

163,007

Profit for the period

-

-

-

14,296

14,296

Other comprehensive income for the period

-

-

(1,210)

-

(1,210)

Total comprehensive income for the period

-

-

(1,210)

14,296

13,086

Transaction with owners of the company:

Gross dividends paid

-

-

-

(12,924)

(12,924)

-

-

-

(12,924)

(12,924)

Balance at 30 June 2016

18,500

(5,915)

1,021

149,563

163,169

COMPANY Year ended 31 December 2015

Balance at 1 January 2015

18,500

(550)

-

133,560

151,510

Profit for the year

-

-

-

33,139

33,139

Other comprehensive income for the year

-

-

-

-

-

Total comprehensive income for the year

-

-

-

33,139

33,139

Transaction with owners of the company:

Gross dividends paid

-

-

-

(11,078)

(11,078)

Acquisition of treasury shares

-

(1,555)

-

(1,555)

-

(1,555)

-

(11,078)

(12,633)

Balance at 31 December 2015

18,500

(2,105)

-

155,621

172,016

Period ended 30 June 2016

Balance at 1 January 2016

18,500

(2,105)

-

155,621

172,016

Profit for the period

-

-

-

13,321

13,321

Other comprehensive income for the period

-

-

-

-

-

Total comprehensive income for the period

-

-

-

13,321

13,321

Transaction with owners of the company:

Gross dividends paid

-

-

-

(12,924)

(12,924)

-

-

-

(12,924)

(12,924)

Balance at 30 June 2016

18,500

(2,105)

-

156,018

172,413

GROUP

COMPANY

STATEMENT OF CASHFLOWS Unaudited

Unaudited

Audited

Unaudited

Unaudited

Audited

6 months

6 months

12 months

6 months

6 months

12 months

Jun-16

Jun-15

Dec-15

Jun-16

Jun-15

Dec-15

P'000

P'000

P'000

P'000

P'000

P'000

Cash flows from operating activities

Cash generated from operations 30,803

30,659

67,730

29,907

30,502

65,508

Interest paid

(444)

(637)

(1,152)

(444)

(637)

(1,152)

Tax paid

(4,410)

(5,741)

(11,299)

(4,410)

(5,741)

(11,299)

Net cash generated from operating activities 25,949

24,281

55,279

25,053

24,124

53,057

Cash flows from investing activities

Purchase of property, plant and equipment

(14,935)

(9,420)

(25,910)

(14,747)

(9,048)

(23,958)

Purchase of computer software

(410)

(305)

(406)

(277)

(305)

(406)

Proceeds on disposal of plant and equipment

75

16

70

17

16

70

Loan repayments received from Employee Share Trust

-

-

-

-

103

102

Loan repayments received from subsidiary

-

-

-

226

751

1,328

Interest received 876

993

1,934

1,031

1,233

2,615

Net cash utilised in investing activities

(14,394)

(8,716)

(24,312)

(13,750)

(7,250)

(20,249)

Cash flows from financing activities

Repayment of borrowings

(2,061)

(1,813)

(3,857)

(2,061)

(1,813)

(3,857)

Dividends paid to company's shareholders

(12,924)

(11,078)

(11,078)

(12,924)

(11,078)

(11,078)

Net cash utilised in financing activities

(14,985)

(12,891)

(14,935)

(14,985)

(12,891)

(14,935)

Net (decrease)/increase in cash and cash equivalents

(3,430)

2,674

16,032

(3,682)

3,983

17,873

Cash and cash equivalents at beginning of year 61,735

45,801

45,801

60,964

43,091

43,091

Exchange loss on cash and cash equivalents

(139)

(326)

(98)

-

-

-

Cash and cash equivalents at end of year 58,166

48,149

61,735

57,282

47,074

60,964

Disclosed as follows;

Cash at bank

58,862

49,204

61,835

57,978

48,129

61,064

Bank overdraft

(696)

(1,055)

(100)

(696)

(1,055)

(100)

58,166

48,149

61,735

57,282

47,074

60,964

CLb ! b / L! [ I LDI [ LDI Ç{

WΡŧ ś 2016 WΡŧ ś ���� % change

P’000 P’000

Profit before tax

18,239 12,315 48%

Total comprehensive income 13,086 8,927 47%

Operating profit

16,355 14,109 16%

Revenues

159,939 150,110 7%

Total Assets

248,061 232,443 7%

Cash and cash equivalents 58,862 49,204 20%

Earnings per Share(thebe)

7.23 4.93 47%

GROUP