Embed Size (px)
Citation preview

1
DisclaimerForward-Looking Statements
This presentation includes “forward-looking statements” within the meaning of the Securities Act of 1933, as amended (the “Securities Act”), the Securities Exchange Act of 1934,
as amended and “forward-looking information” within the meaning of Canadian securities laws. Forward-looking statements and information are not based on historical information
and include, without limitation, statements and information regarding our future financial condition and results of operations, cash flows, business strategy and plans and objectives
of management for future operations. Forward-looking statements and information reflect our current views with respect to future events. The words “may,” “will,” “expect,” “intend,”
“anticipate,” “believe,” “project,” “estimate” and similar expressions identify forward-looking statements and information. These forward-looking statements and information are
based upon estimates and assumptions made by us or our officials that, although believed to be reasonable, are subject to certain known and unknown risks and uncertainties that
could cause actual results to differ materially and adversely as compared to those contemplated or implied by such forward-looking statements and information. All forward-looking
statements and information involve risks, assumptions and uncertainties. You should not rely upon forward-looking statements or information as predictors of future events. The
occurrence of the events described, and the achievement of the expected results, depend on many factors, some or all of which are not predictable or within our control. Actual
results may differ materially from expected results. See the sections “Risk Factors,” “Forward-Looking Statements, “Management’s Discussion and Analysis of Financial Condition
and Results of Operations” and elsewhere in our Annual Report on Form 10-K for the year ended December 31, 2015 filed on March 24, 2016 with the Securities and Exchange
Commission (the “SEC”) and on SEDAR for a more complete discussion of these risks, assumptions and uncertainties and for other risks and uncertainties. These risks,
assumptions and uncertainties are not necessarily all for the important factors that could cause actual results to differ materially from those expressed in any of our forward-looking
statements and information. Other unknown or unpredictable factors also could harm our results. All of the forward-looking statements and information we have included in this
presentation are based on information available to us on the date of this presentation. We undertake no obligation, and specifically decline any obligation, to update publicly or
revise any forward-looking statements or information, whether as a result of new information, future events or otherwise. In light of these risks, uncertainties and assumptions, the
forward-looking events discussed in this presentation might not occur.
Industry and Market Data
This presentation includes references to certain industry and market data included in our initial public offering prospectus and our Annual Report on Form 10-K for the year ended
December 31, 2015, which was derived from reports prepared by First Annapolis Consulting. For additional information, please see our Annual Report on Form 10-K for the year
ended December 31, 2015 filed on March 24, 2016 with the SEC and on SEDAR.
Non-GAAP Financial Information
Generally Accepted Accounting Principles (“GAAP”) is the term used to refer to the standard framework of guidelines for financial accounting. GAAP includes the standards,
conventions and rules accountants follow in recording and summarizing transactions and in the preparation of financial statements. In addition to reporting financial results in
accordance with GAAP, CPI has provided certain non-GAAP financial measures, including Adjusted EBITDA, Adjusted Net Income, Free Cash Flow, and Adjusted Free Cash
Flow. CPI defines Adjusted EBITDA as net income from continuing operations before interest expense, net, provision for income taxes, and depreciation and amortization, plus
adjustments for restructuring and other charges, stock-based compensation expense, including non-cash compensation expense related to our phantom stock plan that was
terminated in connection our IPO, performance bonuses earned in connection with the EFT Source acquisition, loss on debt modification and early extinguishment, investment
banking and related fees, the impact of legal costs incurred in connection with patent litigation, and foreign currency gain or loss. Adjusted Net Income is defined as net income
from continuing operations, excluding restructuring and other costs associated with the closure of the Petersfield U.K. facility, amortization of intangible assets, accelerated
amortization of debt issuance costs in connection with term loan principle payments, stock-based compensation expense, including non-cash compensation expense related to our
phantom stock plan that was terminated in connection our IPO, loss on debt modification and early extinguishment, EFT Source acquisition performance payments, the impact of
legal costs incurred in connection with patent litigation, and investment banking and related fees, all net of their income tax impact. Adjusted earnings per share (calculated on a
diluted basis) is computed using adjusted net income as previously defined on a per share basis. The tax rates used to calculate Adjusted Net Income and Adjusted Earnings per
Share are based on the Company’s long-term expected effective tax rate estimate for each period presented. Adjusted EBITDA and Adjusted Net Income should not be
considered an alternative to net income, income before income taxes, cash flows from operating activities, or any other measure of financial performance calculated in accordance
with GAAP as those items are used to measure operating performance, liquidity or the ability to service debt obligations. CPI believes that Adjusted EBITDA and Adjusted Net
Income present a transparent view of its recurring operating performance and allows management to readily view operating trends, perform analytical comparisons and identify
strategies to improve operating performance. Further, Adjusted EBITDA and Adjusted Net Income, as CPI defines them, may not be comparable to Adjusted EBITDA and Adjusted
Net Income or similarly titled measures used by other entities. Free cash flow is defined as cash flow from operations less capital expenditures. Adjusted Free Cash Flow is Free
Cash Flow adjusted for the cash payment related to the settlement of the Phantom Stock Plan in conjunction with the IPO. We use this metric in analyzing our ability to service
and repay our debt and to forecast future periods. However, this measure does not represent funds available for investment or other discretionary uses since it does not deduct
cash used to service our debt. For a reconciliation of Adjusted EBITDA, Adjusted Net Income to net income from continuing operations, the most comparable GAAP measure, Free
Cash Flow and Adjusted Free Cash Flow, please refer to our supplemental GAAP to Non-GAAP reconciliation slide in the appendix of this presentation, our Annual Report on
Form 10-K filed for the year ended December 31, 2015 filed on March 24, 2016 with the SEC and on SEDAR, and our earnings press releases on our Investor Relations website at
http://www.cpicardgroup.com/investor-relations.
2
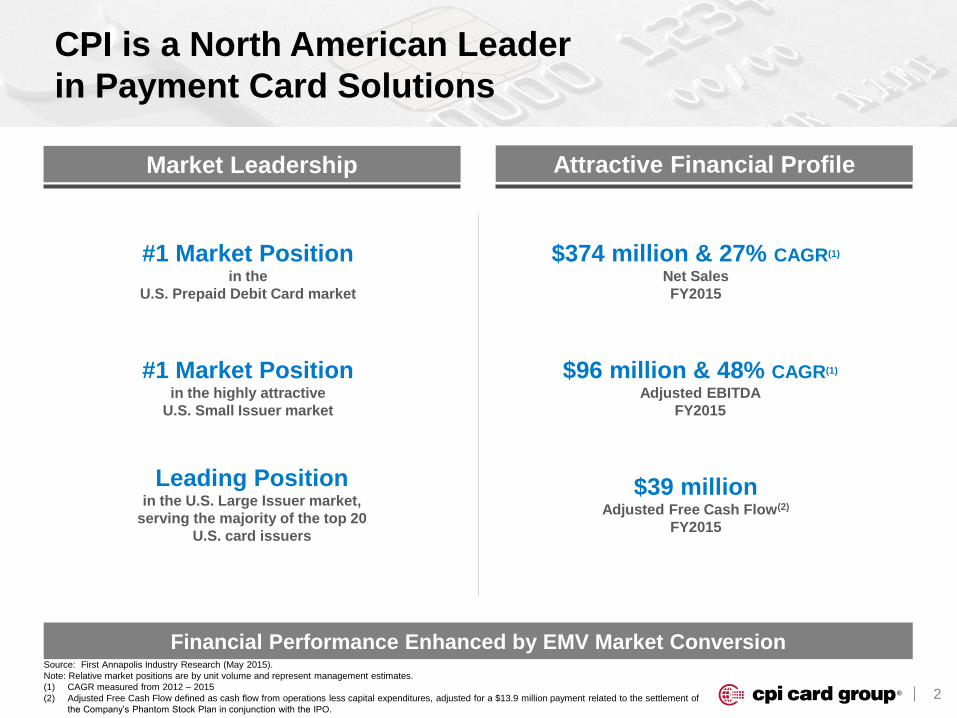
CPI is a North American Leader
in Payment Card Solutions
#1 Market Position in the
U.S. Prepaid Debit Card market
Leading Position in the U.S. Large Issuer market,
serving the majority of the top 20
U.S. card issuers
#1 Market Position in the highly attractive
U.S. Small Issuer market
$374 million & 27% CAGR(1)
Net Sales
FY2015
$96 million & 48% CAGR(1)
Adjusted EBITDA
FY2015
Market Leadership Attractive Financial Profile
Financial Performance Enhanced by EMV Market Conversion
$39 millionAdjusted Free Cash Flow(2)
FY2015
Source: First Annapolis Industry Research (May 2015).
Note: Relative market positions are by unit volume and represent management estimates.
(1) CAGR measured from 2012 – 2015
(2) Adjusted Free Cash Flow defined as cash flow from operations less capital expenditures, adjusted for a $13.9 million payment related to the settlement of
the Company’s Phantom Stock Plan in conjunction with the IPO.
3
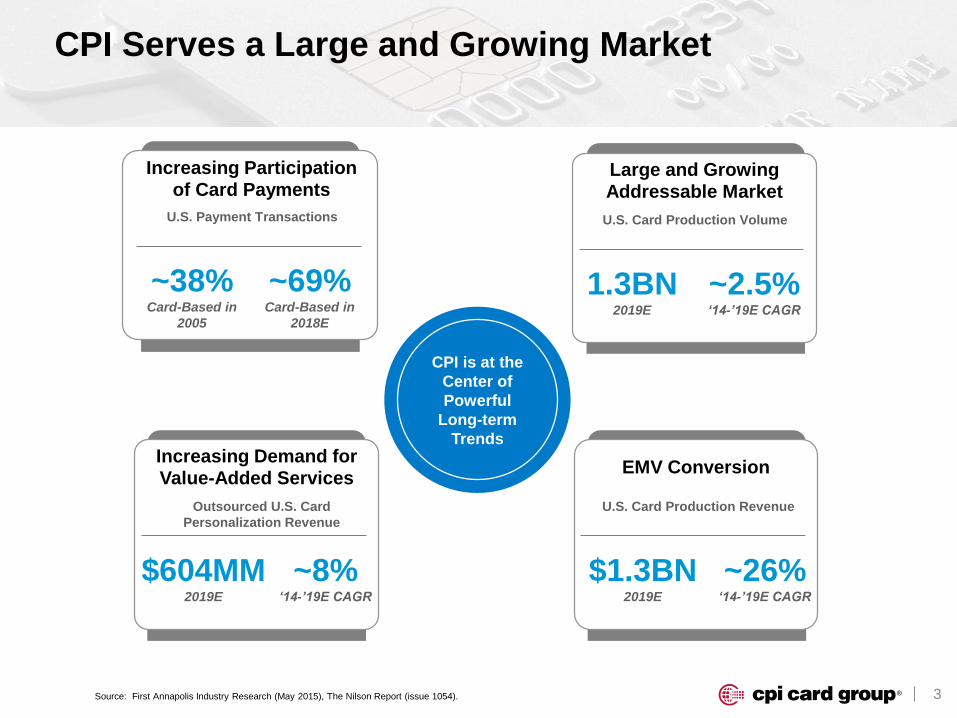
Large and Growing Addressable Market
U.S. Card Production Volume
1.3BN 2019E
~2.5% ‘14-’19E CAGR
Increasing Demand for Value-Added Services
Outsourced U.S. Card
Personalization Revenue
$604MM 2019E
~8% ‘14-’19E CAGR
Increasing Participation of Card Payments
U.S. Payment Transactions
~69% Card-Based in
2018E
~38% Card-Based in
2005
EMV Conversion
U.S. Card Production Revenue
$1.3BN 2019E
~26% ‘14-’19E CAGR
CPI Serves a Large and Growing Market
CPI is at the
Center of
Powerful
Long-term
Trends
Source: First Annapolis Industry Research (May 2015), The Nilson Report (issue 1054).
4
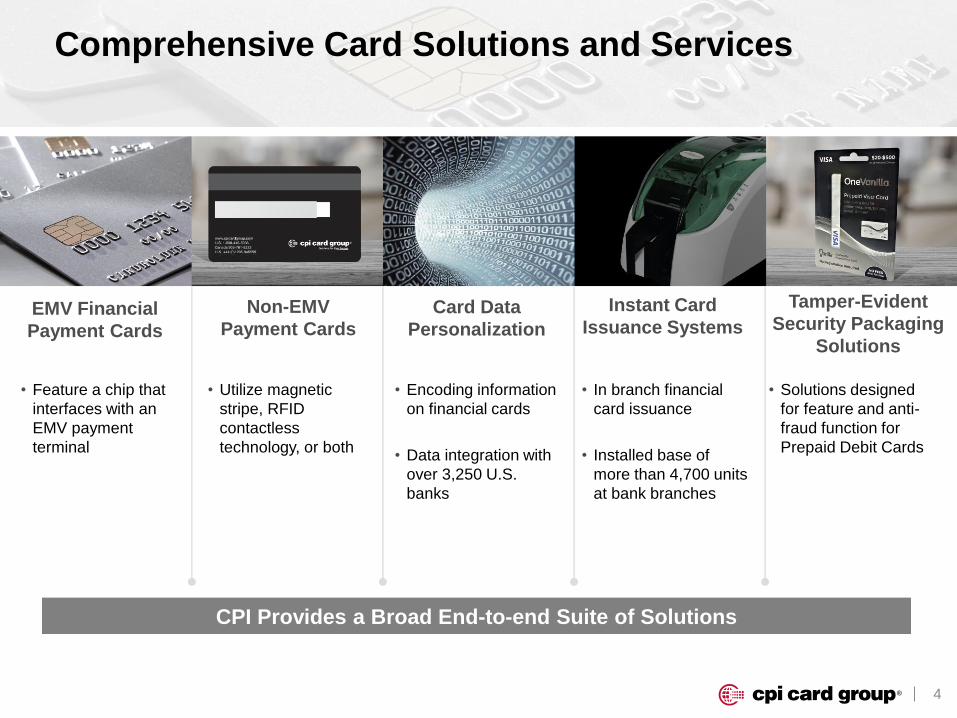
Comprehensive Card Solutions and Services
Instant Card
Issuance Systems EMV Financial
Payment Cards
Non-EMV
Payment Cards
Tamper-Evident
Security Packaging
Solutions
Card Data
Personalization
• Feature a chip that
interfaces with an
EMV payment
terminal
• Utilize magnetic
stripe, RFID
contactless
technology, or both
• Encoding information
on financial cards
• Data integration with
over 3,250 U.S.
banks
• In branch financial
card issuance
• Installed base of
more than 4,700 units
at bank branches
• Solutions designed
for feature and anti-
fraud function for
Prepaid Debit Cards
CPI Provides a Broad End-to-end Suite of Solutions
5
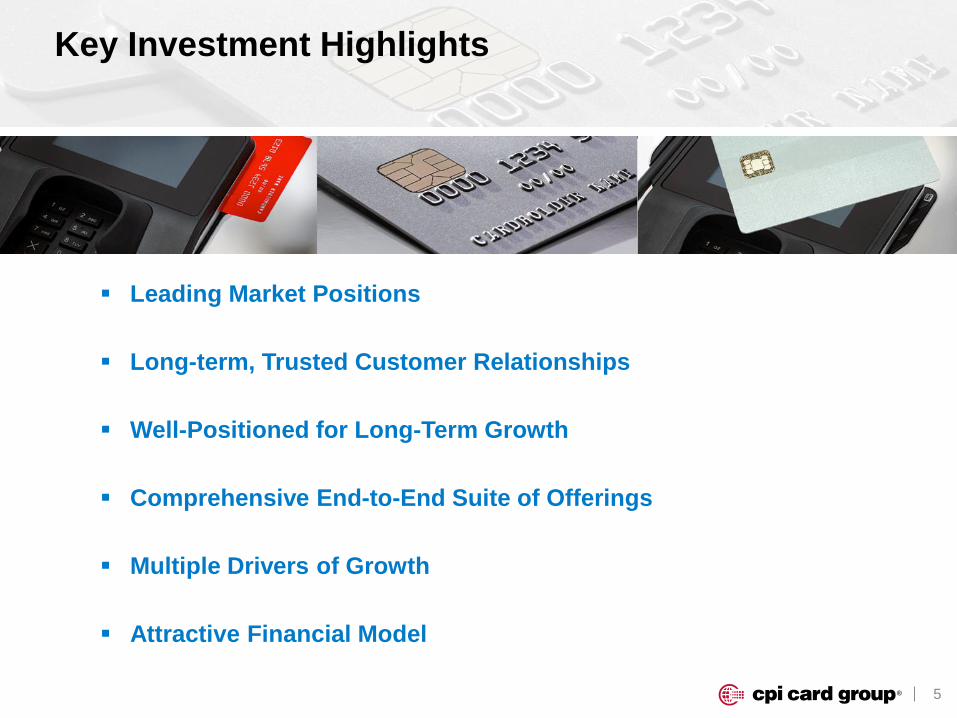
Key Investment Highlights
Leading Market Positions
Well-Positioned for Long-Term Growth
Comprehensive End-to-End Suite of Offerings
Long-term, Trusted Customer Relationships
Multiple Drivers of Growth
Attractive Financial Model
6
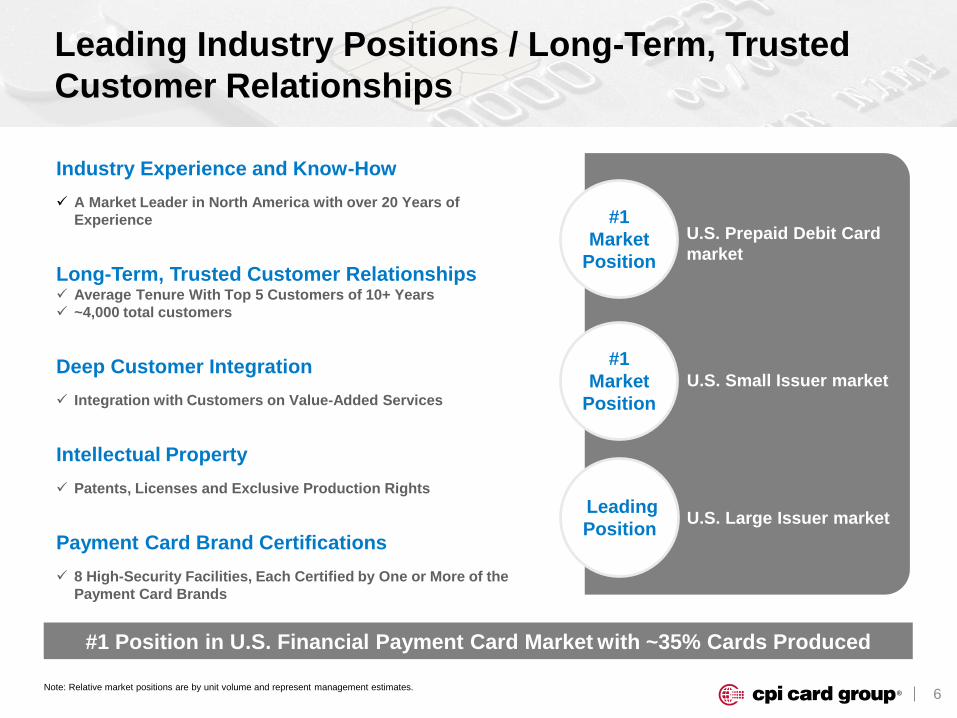
Leading Industry Positions / Long-Term, Trusted
Customer Relationships
Industry Experience and Know-How
A Market Leader in North America with over 20 Years of
Experience
Long-Term, Trusted Customer Relationships Average Tenure With Top 5 Customers of 10+ Years
~4,000 total customers
Deep Customer Integration
Integration with Customers on Value-Added Services
Intellectual Property
Patents, Licenses and Exclusive Production Rights
Payment Card Brand Certifications
8 High-Security Facilities, Each Certified by One or More of the
Payment Card Brands
U.S. Prepaid Debit Card
market
U.S. Large Issuer market
U.S. Small Issuer market
#1
Market
Position
#1
Market
Position
Leading
Position
Note: Relative market positions are by unit volume and represent management estimates.
#1 Position in U.S. Financial Payment Card Market with ~35% Cards Produced
7
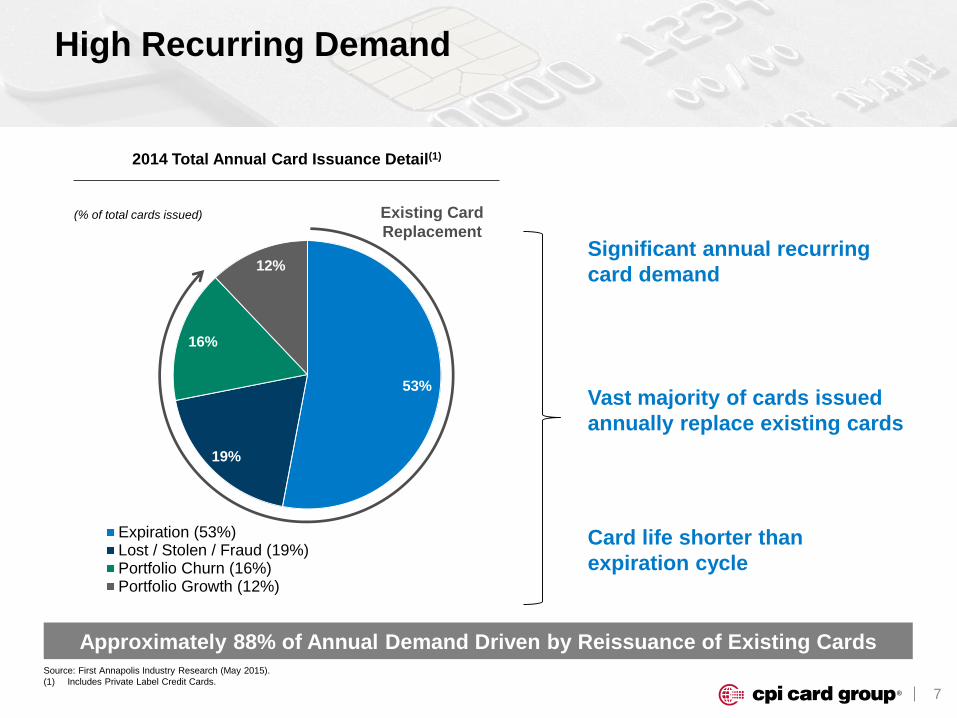
High Recurring Demand
53%
19%
16%
12%
Expiration (53%)Lost / Stolen / Fraud (19%)Portfolio Churn (16%)Portfolio Growth (12%)
(% of total cards issued)
2014 Total Annual Card Issuance Detail(1)
Existing Card
Replacement
Significant annual recurring
card demand
Card life shorter than
expiration cycle
Vast majority of cards issued
annually replace existing cards
Source: First Annapolis Industry Research (May 2015).
(1) Includes Private Label Credit Cards.
Approximately 88% of Annual Demand Driven by Reissuance of Existing Cards
8
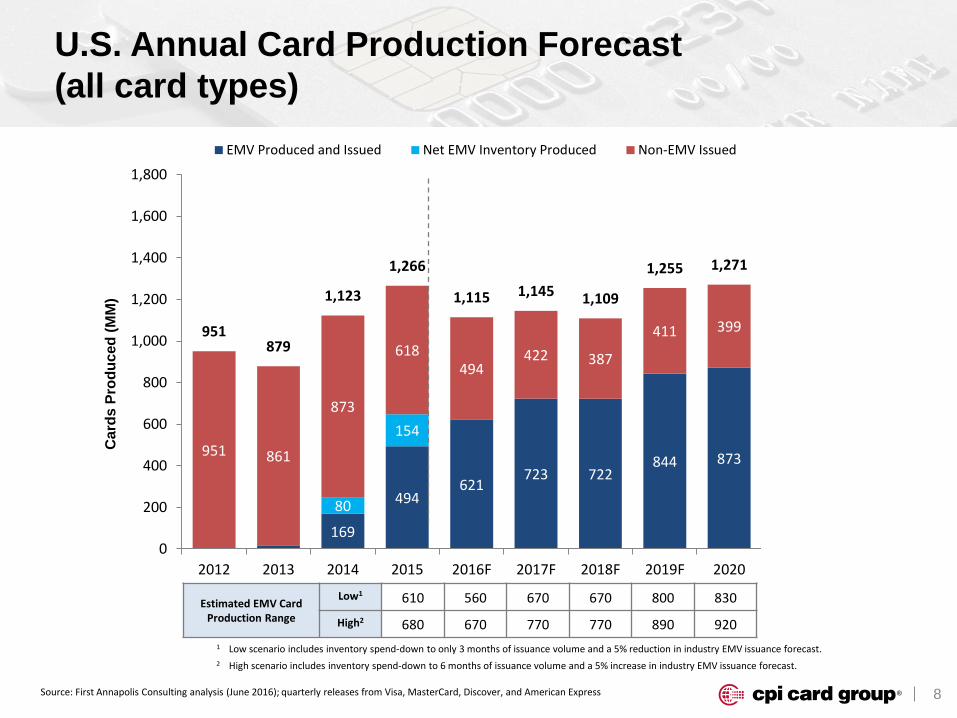
U.S. Annual Card Production Forecast
(all card types)
169
494621
723 722844 873
80
154951 861
873
618494
422 387
411 399951879
1,123
1,266
1,115 1,145 1,109
1,255 1,271
0
200
400
600
800
1,000
1,200
1,400
1,600
1,800
2012 2013 2014 2015 2016F 2017F 2018F 2019F 2020
EMV Produced and Issued Net EMV Inventory Produced Non-EMV Issued
Source: First Annapolis Consulting analysis (June 2016); quarterly releases from Visa, MasterCard, Discover, and American Express
Estimated EMV Card Production Range
Low1 610 560 670 670 800 830
High2 680 670 770 770 890 920
1 Low scenario includes inventory spend-down to only 3 months of issuance volume and a 5% reduction in industry EMV issuance forecast.
2 High scenario includes inventory spend-down to 6 months of issuance volume and a 5% increase in industry EMV issuance forecast.
Ca
rds P
rod
uc
ed
(M
M)
9
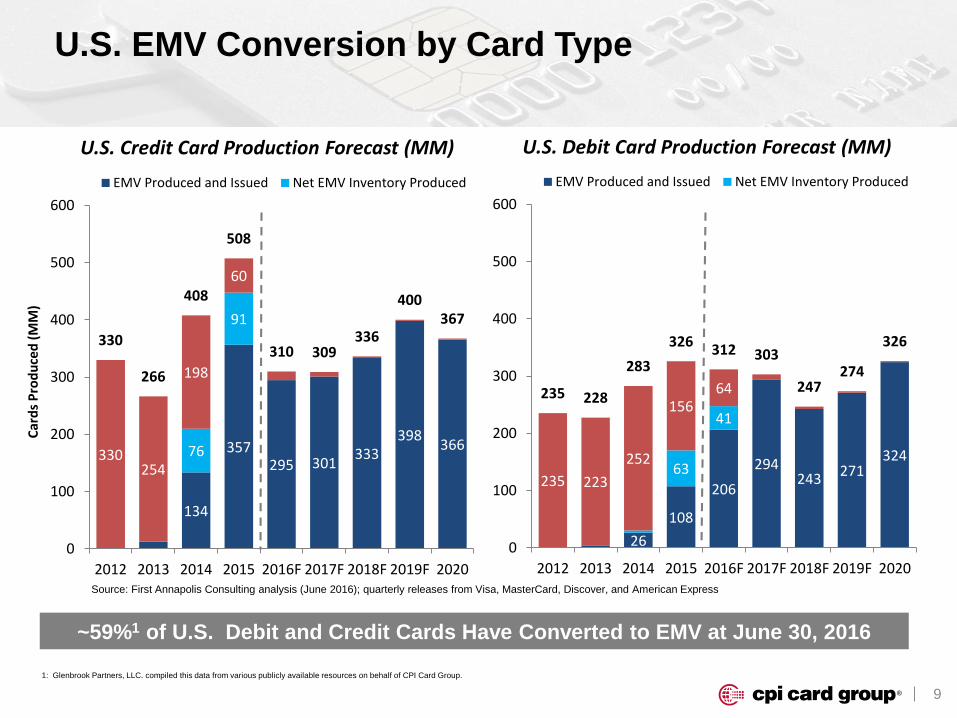
U.S. EMV Conversion by Card Type
134
357295 301
333398
36676
91
330254
198
60
330
266
408
508
310 309336
400367
0
100
200
300
400
500
600
2012 2013 2014 2015 2016F 2017F 2018F 2019F 2020
EMV Produced and Issued Net EMV Inventory Produced
U.S. Credit Card Production Forecast (MM)
Car
ds
Pro
du
ced
(M
M)
26
108
206
294243
271324
63
41
235 223
252
15664235 228
283
326312 303
247274
326
0
100
200
300
400
500
600
2012 2013 2014 2015 2016F 2017F 2018F 2019F 2020
EMV Produced and Issued Net EMV Inventory Produced
U.S. Debit Card Production Forecast (MM)
Source: First Annapolis Consulting analysis (June 2016); quarterly releases from Visa, MasterCard, Discover, and American Express
~59%1 of U.S. Debit and Credit Cards Have Converted to EMV at June 30, 2016
1: Glenbrook Partners, LLC. compiled this data from various publicly available resources on behalf of CPI Card Group.
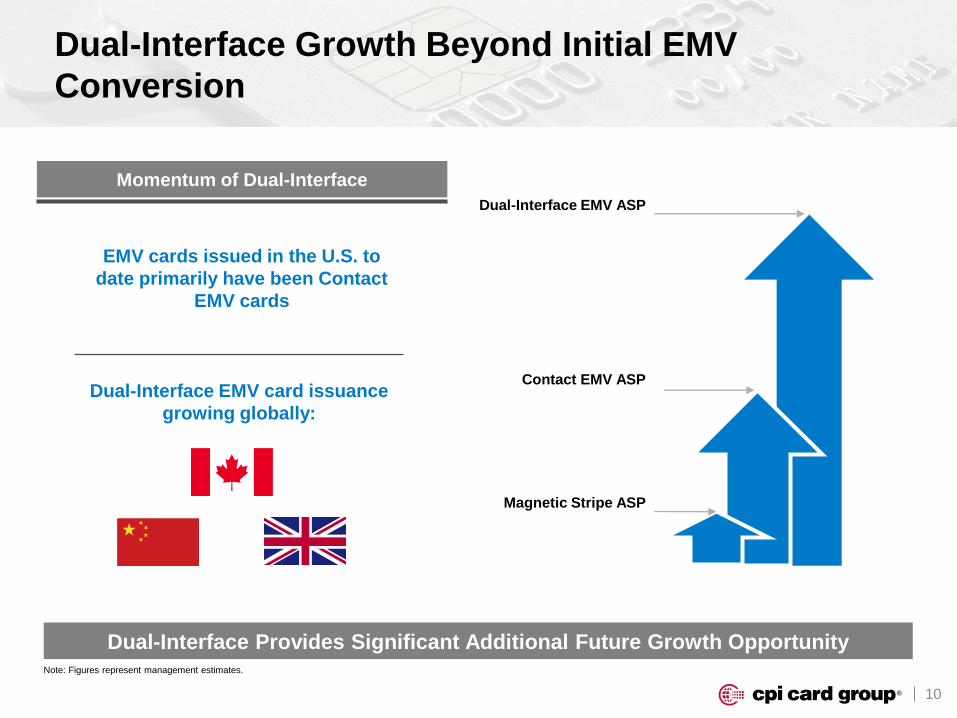
10
EMV cards issued in the U.S. to
date primarily have been Contact
EMV cards
Dual-Interface Growth Beyond Initial EMV
Conversion
Magnetic Stripe ASP
Contact EMV ASP
Dual-Interface EMV ASP
Dual-Interface EMV card issuance
growing globally:
Note: Figures represent management estimates.
Dual-Interface Provides Significant Additional Future Growth Opportunity
Momentum of Dual-Interface
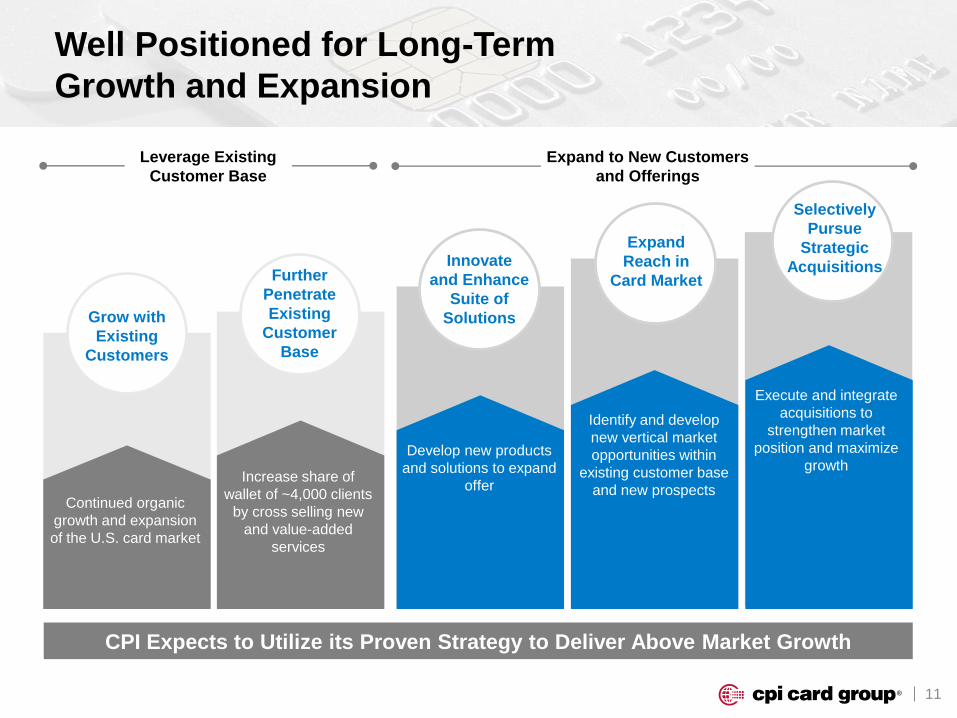
11
Well Positioned for Long-Term
Growth and Expansion
Continued organic
growth and expansion
of the U.S. card market
Increase share of
wallet of ~4,000 clients
by cross selling new
and value-added
services
Develop new products
and solutions to expand
offer
Identify and develop
new vertical market
opportunities within
existing customer base
and new prospects
Execute and integrate
acquisitions to
strengthen market
position and maximize
growth
Leverage Existing
Customer Base
Expand to New Customers
and Offerings
Grow with
Existing
Customers
Further
Penetrate
Existing
Customer
Base
Innovate
and Enhance
Suite of
Solutions
Selectively
Pursue
Strategic
Acquisitions
Expand
Reach in
Card Market
CPI Expects to Utilize its Proven Strategy to Deliver Above Market Growth
12
Long-term, Trusted Customer Relationships
Substantial Cross-Selling Opportunities
EMV Financial Payment Cards
Non-EMV Financial Payment
Cards and Retail Gift Cards
Instant Card Issuance Systems
Card Data Personalization
Tamper-Evident Security
Packaging Solutions
Instant Card Issuance Services
Comprehensive End-to-End Solutions
Expected to Continue to Enhance CPI’s Market Share Positions
Small Issuers
and
Group Service
Providers
Large
Issuers
Prepaid
Issuers and
Program
Managers
13
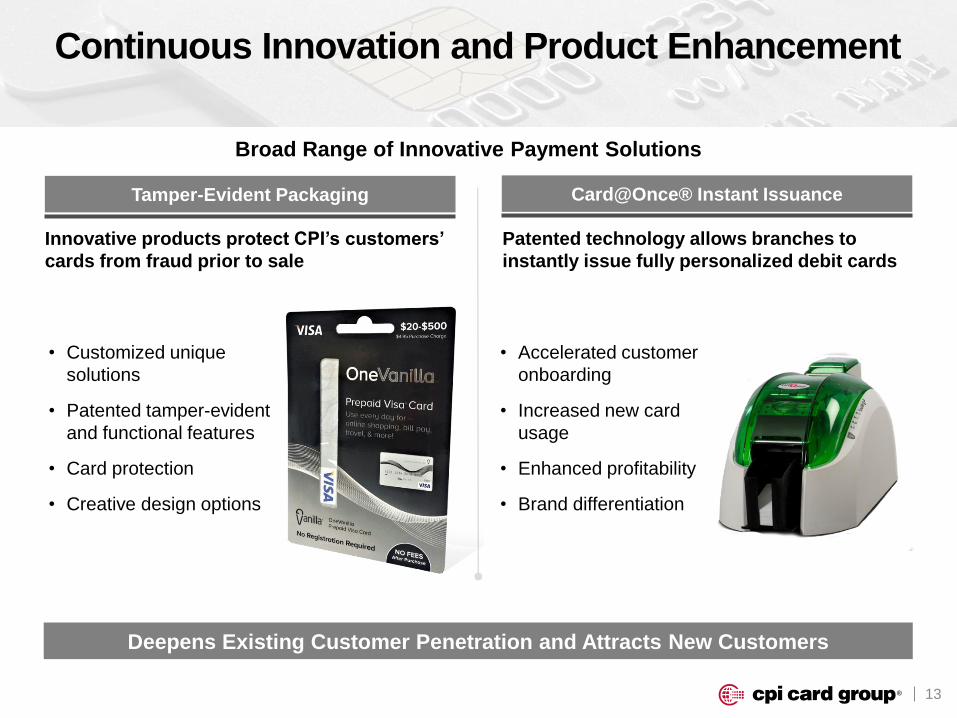
Tamper-Evident Packaging
Continuous Innovation and Product Enhancement
• Accelerated customer
onboarding
• Increased new card
usage
• Enhanced profitability
• Brand differentiation
Patented technology allows branches to
instantly issue fully personalized debit cards
• Customized unique
solutions
• Patented tamper-evident
and functional features
• Card protection
• Creative design options
Innovative products protect CPI’s customers’
cards from fraud prior to sale
Broad Range of Innovative Payment Solutions
Card@Once® Instant Issuance
Deepens Existing Customer Penetration and Attracts New Customers
14
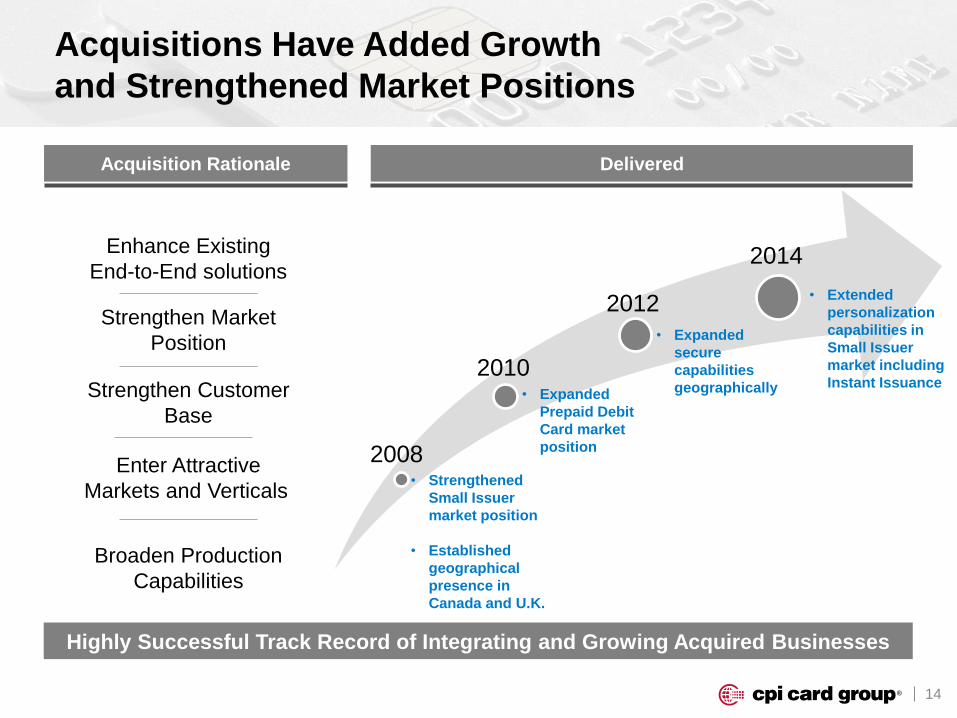
2008
2010
2012
2014
Acquisitions Have Added Growth
and Strengthened Market Positions
Enhance Existing
End-to-End solutions
Enter Attractive
Markets and Verticals
Broaden Production
Capabilities
• Extended
personalization
capabilities in
Small Issuer
market including
Instant Issuance • Expanded
Prepaid Debit
Card market
position
• Strengthened
Small Issuer
market position
• Established
geographical
presence in
Canada and U.K.
Acquisition Rationale Delivered
Strengthen Market
Position
Strengthen Customer
Base
• Expanded
secure
capabilities
geographically
Highly Successful Track Record of Integrating and Growing Acquired Businesses
15
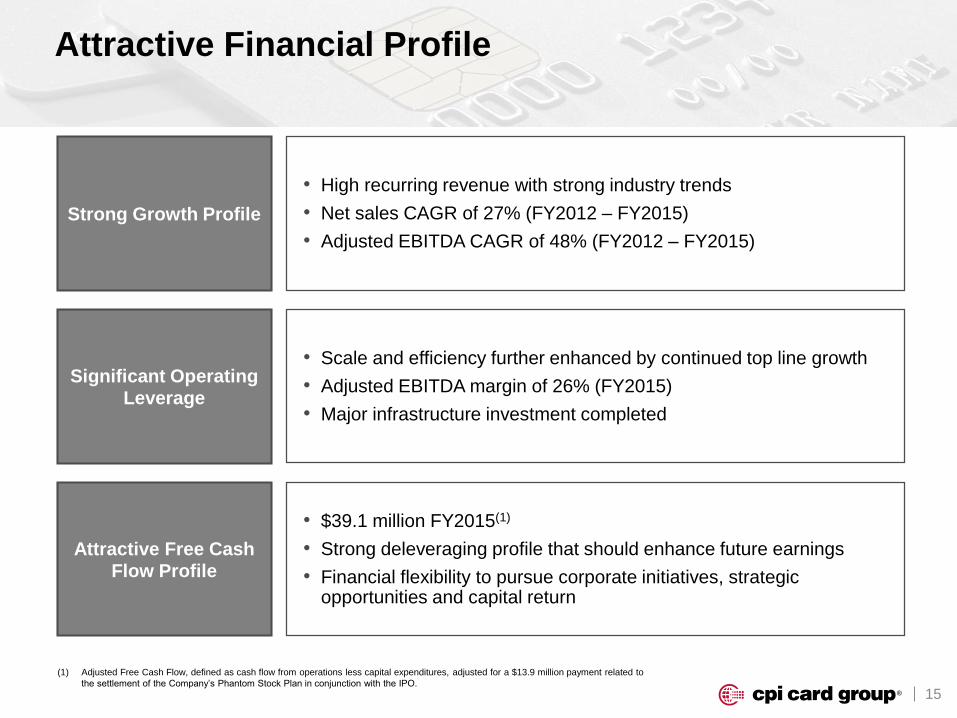
Attractive Financial Profile
Strong Growth Profile
• High recurring revenue with strong industry trends
• Net sales CAGR of 27% (FY2012 – FY2015)
• Adjusted EBITDA CAGR of 48% (FY2012 – FY2015)
Significant Operating Leverage
• Scale and efficiency further enhanced by continued top line growth
• Adjusted EBITDA margin of 26% (FY2015)
• Major infrastructure investment completed
Attractive Free CashFlow Profile
• $39.1 million FY2015(1)
• Strong deleveraging profile that should enhance future earnings
• Financial flexibility to pursue corporate initiatives, strategic opportunities and capital return
(1) Adjusted Free Cash Flow, defined as cash flow from operations less capital expenditures, adjusted for a $13.9 million payment related to
the settlement of the Company’s Phantom Stock Plan in conjunction with the IPO.
16
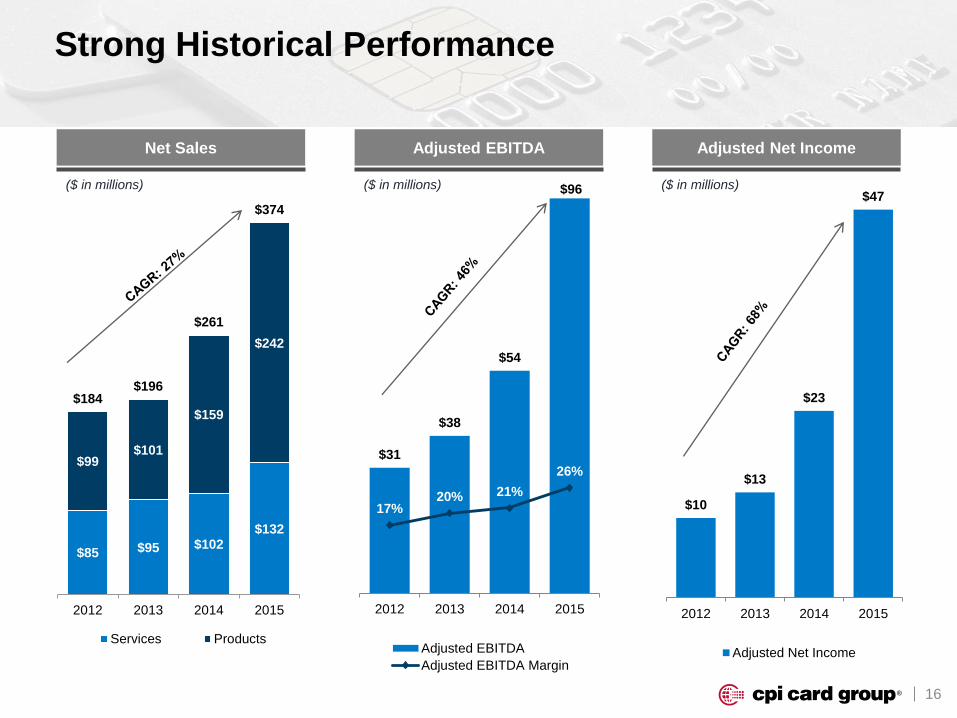
Net Sales Adjusted EBITDA Adjusted Net Income
$85 $95 $102$132
$99$101
$159
$242
$184$196
$261
$374
2012 2013 2014 2015
Services Products
Strong Historical Performance
($ in millions) ($ in millions)
$31
$38
$54
$96
17% 20% 21%
26%
2012 2013 2014 2015
Adjusted EBITDA
Adjusted EBITDA Margin
($ in millions)
$10
$13
$23
$47
2012 2013 2014 2015
Adjusted Net Income
17
2016 Outlook
• EMV conversions1 for Credit and Debit cards continues
• ~59% of branded U.S. Credit and Debit card market had converted to EMV as of June 30, 2016
• ~ 65% of Credit cards (lead by large issuer banks)
• ~ 51%3 of Debit cards (driven by small and mid-sized issuers)
• Services businesses continue to perform as expected
• Personalization and fulfillment achieved strong growth in Q2 2016
• Expected to continue to benefit from ongoing EMV migration
• Ended Q2 with over 4,775 Card@Once installations, up from 4,000 at YE 2015.
• Current 2016 guidance2 reflects near-term headwinds in the US Debit and Credit businesses
• Slower 2016 demand from large issuers as a result of 2015 EMV card inventory carry-over
• EMV conversion pace for small and mid-sized issuers temporarily impacted by initial system conversions
• Pricing pressure in large issuer segment
1. Management estimate
2. Issued August 10, 2016
3. Excludes prepaid debit cards

18
Appendix
19
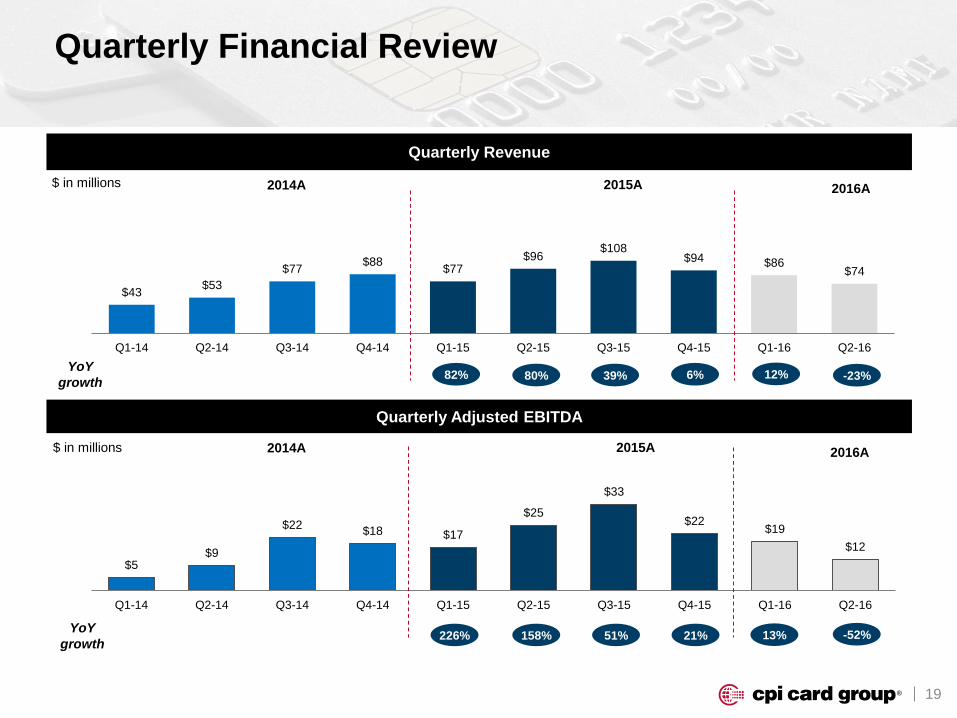
Quarterly Financial Review
$43$53
$77$88
$77$96
$108$94 $86
$74
Q1-14 Q2-14 Q3-14 Q4-14 Q1-15 Q2-15 Q3-15 Q4-15 Q1-16 Q2-16
Quarterly Adjusted EBITDA
Quarterly Revenue
$5$9
$22$18 $17
$25
$33
$22$19
$12
Q1-14 Q2-14 Q3-14 Q4-14 Q1-15 Q2-15 Q3-15 Q4-15 Q1-16 Q2-16
$ in millions
$ in millions
YoY
growth
YoY
growth 158%
80%
2014A
2014A
2015A
2015A
82%
226%
39%
51%
6%
21%
12%
2016A
2016A
13%
-23%
-52%
20
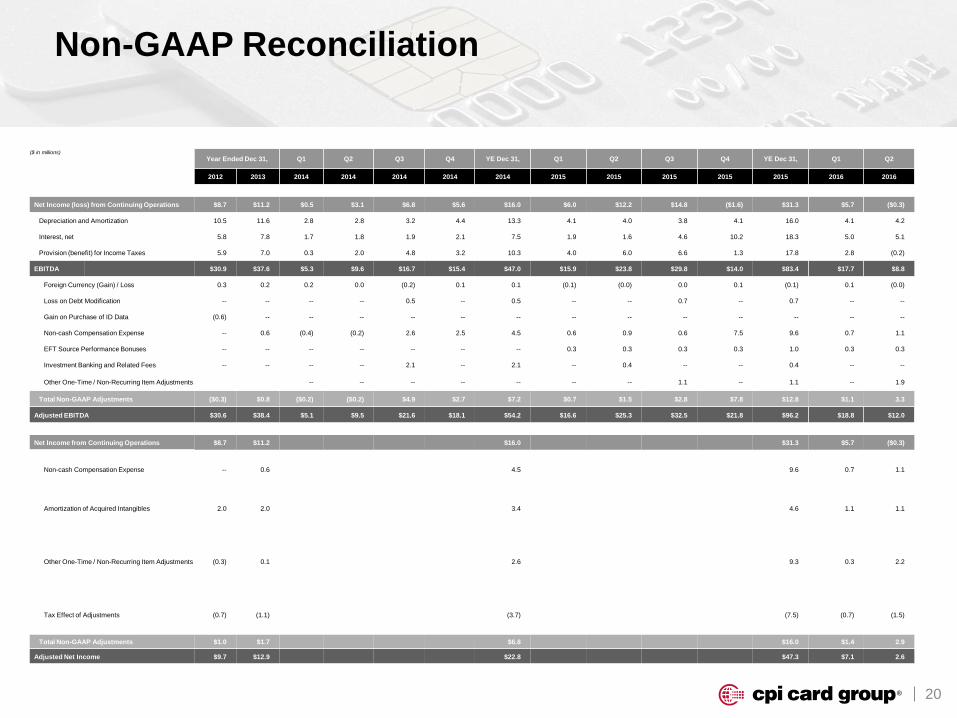
Non-GAAP Reconciliation
($ in millions)
Year Ended Dec 31, Q1 Q2 Q3 Q4 YE Dec 31, Q1 Q2 Q3 Q4 YE Dec 31, Q1 Q2
2012 2013 2014 2014 2014 2014 2014 2015 2015 2015 2015 2015 2016 2016
Net Income (loss) from Continuing Operations $8.7 $11.2 $0.5 $3.1 $6.8 $5.6 $16.0 $6.0 $12.2 $14.8 ($1.6) $31.3 $5.7 ($0.3)
Depreciation and Amortization 10.5 11.6 2.8 2.8 3.2 4.4 13.3 4.1 4.0 3.8 4.1 16.0 4.1 4.2
Interest, net 5.8 7.8 1.7 1.8 1.9 2.1 7.5 1.9 1.6 4.6 10.2 18.3 5.0 5.1
Provision (benefit) for Income Taxes 5.9 7.0 0.3 2.0 4.8 3.2 10.3 4.0 6.0 6.6 1.3 17.8 2.8 (0.2)
EBITDA $30.9 $37.6 $5.3 $9.6 $16.7 $15.4 $47.0 $15.9 $23.8 $29.8 $14.0 $83.4 $17.7 $8.8
Foreign Currency (Gain) / Loss 0.3 0.2 0.2 0.0 (0.2) 0.1 0.1 (0.1) (0.0) 0.0 0.1 (0.1) 0.1 (0.0)
Loss on Debt Modification -- -- -- -- 0.5 -- 0.5 -- -- 0.7 -- 0.7 -- --
Gain on Purchase of ID Data (0.6) -- -- -- -- -- -- -- -- -- -- -- -- --
Non-cash Compensation Expense -- 0.6 (0.4) (0.2) 2.6 2.5 4.5 0.6 0.9 0.6 7.5 9.6 0.7 1.1
EFT Source Performance Bonuses -- -- -- -- -- -- -- 0.3 0.3 0.3 0.3 1.0 0.3 0.3
Investment Banking and Related Fees -- -- -- -- 2.1 -- 2.1 -- 0.4 -- -- 0.4 -- --
Other One-Time / Non-Recurring Item Adjustments -- -- -- -- -- -- -- 1.1 -- 1.1 -- 1.9
Total Non-GAAP Adjustments ($0.3) $0.8 ($0.2) ($0.2) $4.9 $2.7 $7.2 $0.7 $1.5 $2.8 $7.8 $12.8 $1.1 3.3
Adjusted EBITDA $30.6 $38.4 $5.1 $9.5 $21.6 $18.1 $54.2 $16.6 $25.3 $32.5 $21.8 $96.2 $18.8 $12.0
Net Income from Continuing Operations $8.7 $11.2 $16.0 $31.3 $5.7 ($0.3)
Non-cash Compensation Expense -- 0.6 4.5 9.6 0.7 1.1
Amortization of Acquired Intangibles 2.0 2.0 3.4 4.6 1.1 1.1
Other One-Time / Non-Recurring Item Adjustments (0.3) 0.1 2.6 9.3 0.3 2.2
Tax Effect of Adjustments (0.7) (1.1) (3.7) (7.5) (0.7) (1.5)
Total Non-GAAP Adjustments $1.0 $1.7 $6.8 $16.0 $1.4 2.9
Adjusted Net Income $9.7 $12.9 $22.8 $47.3 $7.1 2.6
21
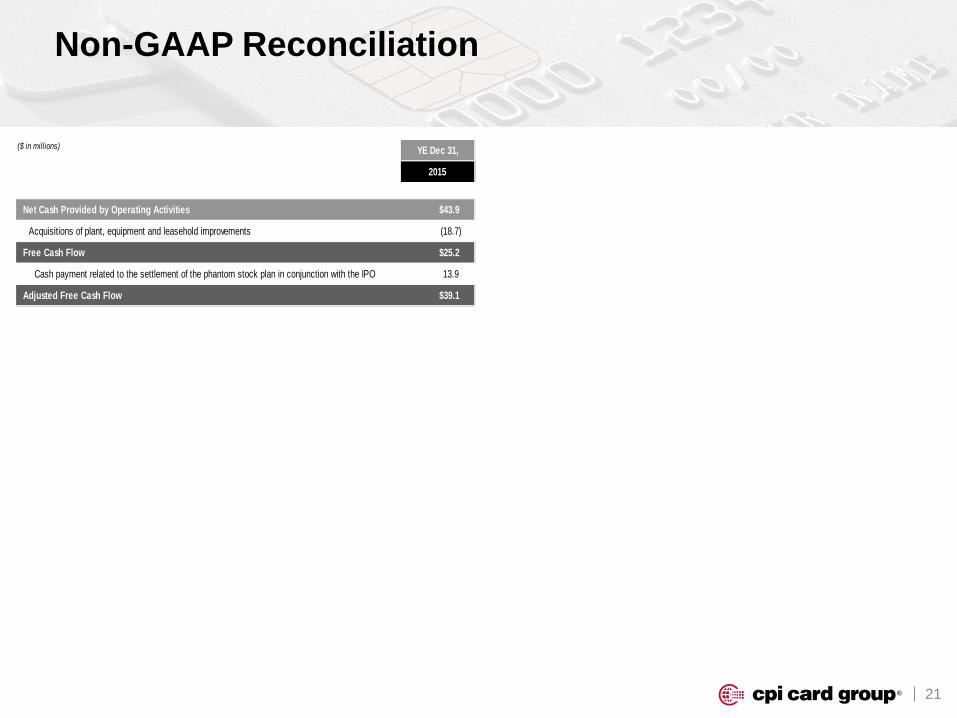
Non-GAAP Reconciliation
($ in millions) YE Dec 31,
2015
Net Cash Provided by Operating Activities $43.9
Acquisitions of plant, equipment and leasehold improvements (18.7)
Free Cash Flow $25.2
Cash payment related to the settlement of the phantom stock plan in conjunction with the IPO 13.9
Adjusted Free Cash Flow $39.1


![Illuminating OpenMP + MPI Performance€¦ · cpi-mpi.c:48 cpi-mpi.c:84 cpi-mpi.c:109 cpi-mpi.c:97 1.0% cpi-mpi [program] main main [OpenMP region O] MPI Finalize MPI Reduce Showing](https://img.pdfslide.us/doc/110x75/6022cc2b9a65990f6b41506f/illuminating-openmp-mpi-performance-cpi-mpic48-cpi-mpic84-cpi-mpic109-cpi-mpic97.jpg)