Embed Size (px)
Citation preview
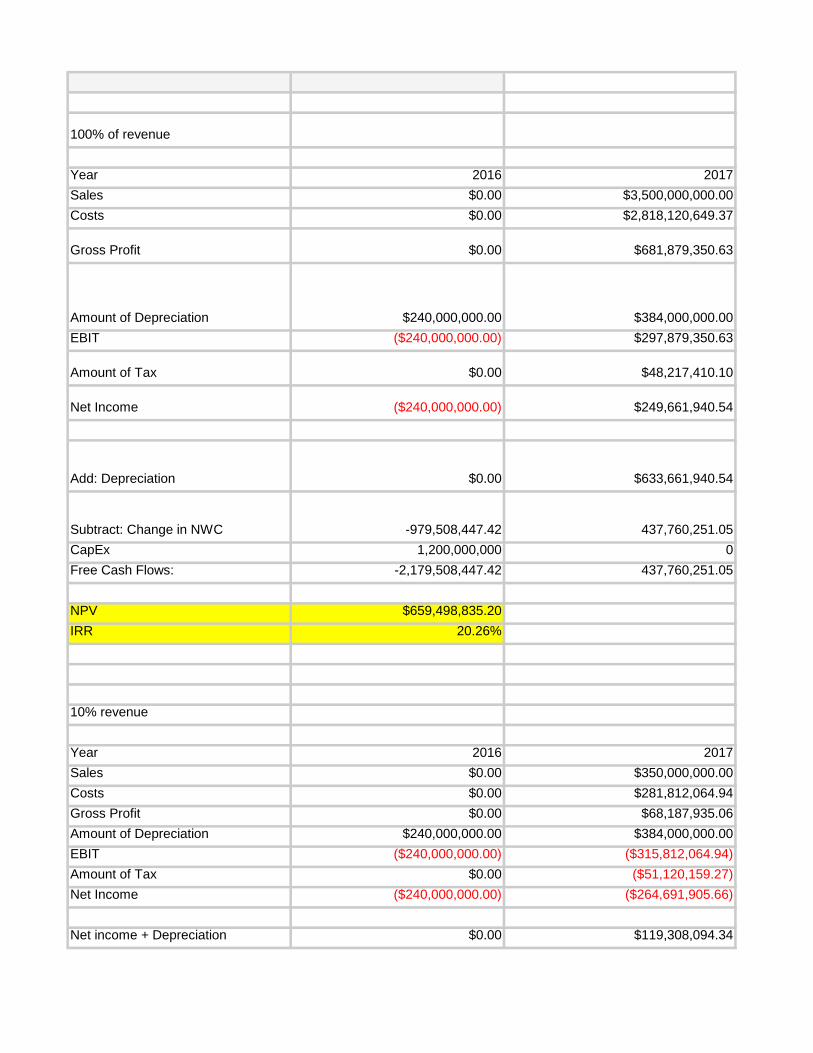
100% of revenue
Year 2016 2017
Sales $0.00 $3,500,000,000.00
Costs $0.00 $2,818,120,649.37
Gross Profit $0.00 $681,879,350.63
Amount of Depreciation $240,000,000.00 $384,000,000.00
EBIT ($240,000,000.00) $297,879,350.63
Amount of Tax $0.00 $48,217,410.10
Net Income ($240,000,000.00) $249,661,940.54
Add: Depreciation $0.00 $633,661,940.54
Subtract: Change in NWC -979,508,447.42 437,760,251.05
CapEx 1,200,000,000 0
Free Cash Flows: -2,179,508,447.42 437,760,251.05
NPV $659,498,835.20
IRR 20.26%
10% revenue
Year 2016 2017
Sales $0.00 $350,000,000.00
Costs $0.00 $281,812,064.94
Gross Profit $0.00 $68,187,935.06
Amount of Depreciation $240,000,000.00 $384,000,000.00
EBIT ($240,000,000.00) ($315,812,064.94)
Amount of Tax $0.00 ($51,120,159.27)
Net Income ($240,000,000.00) ($264,691,905.66)
Net income + Depreciation $0.00 $119,308,094.34

Net income + deprectiaon - change
in NWC -97,950,844.74 99,717,925.39
CapEx 1,200,000,000 0
Free Cash Flows (A36-CapEx) -1,297,950,845 99,717,925
NPV ($900,315,607.48)
20%
Year 2016 2017
Sales $0.00 $700,000,000.00
Costs $0.00 $563,624,129.87
Gross Profit $0.00 $136,375,870.13
Amount of Depreciation $240,000,000.00 $384,000,000.00
EBIT ($240,000,000.00) ($247,624,129.87)
Amount of Tax $0.00 ($40,082,651.56)
Net Income ($240,000,000.00) ($207,541,478.31)
Net income + Depreciation $0.00 $176,458,521.69
Net income + deprectiaon - change
in NWC -195,901,689.48 137,278,183.79
CapEx 1,200,000,000 0
Free Cash Flows (A36-CapEx) -1,395,901,689 137,278,184
NPV ($727,002,891.62)

30%
Year 2016 2017
Sales $0.00 $1,050,000,000.00
Costs $0.00 $845,436,194.81
Gross Profit $0.00 $204,563,805.19
Amount of Depreciation $240,000,000.00 $384,000,000.00
EBIT ($240,000,000.00) ($179,436,194.81)
Amount of Tax $0.00 ($29,045,143.86)
Net Income ($240,000,000.00) ($150,391,050.95)
Net income + Depreciation $0.00 $233,608,949.05
Net income + deprectiaon - change
in NWC -293,852,534.22 174,838,442.20
CapEx 1,200,000,000 0
Free Cash Flows (A36-CapEx) -1,493,852,534 174,838,442
NPV ($553,690,175.77)
40% of revenue
Year 2016 2017
Sales $0.00 $1,400,000,000.00
Costs $0.00 $1,127,248,259.75
Gross Profit $0.00 $272,751,740.25
Amount of Depreciation $240,000,000.00 $384,000,000.00
EBIT ($240,000,000.00) ($111,248,259.75)
Amount of Tax $0.00 ($18,007,636.15)
Net Income ($240,000,000.00) ($93,240,623.60)
Net income + Depreciation $0.00 $290,759,376.40
Net income + deprectiaon - change
in NWC -391,803,378.97 212,398,700.61
CapEx 1,200,000,000 0
Free Cash Flows (A36-CapEx) -1,591,803,379 212,398,701

NPV ($380,377,459.91)
50% revenue
Year 2016 2017
Sales $0.00 $1,750,000,000.00
Costs $0.00 $1,409,060,324.68
Gross Profit $0.00 $340,939,675.32
Amount of Depreciation $240,000,000.00 $384,000,000.00
EBIT ($240,000,000.00) ($43,060,324.68)
Amount of Tax $0.00 ($6,970,128.44)
Net Income ($240,000,000.00) ($36,090,196.24)
Net income + Depreciation $0.00 $347,909,803.76
Net income + deprectiaon - change
in NWC -489,754,223.71 249,958,959.02
CapEx 1,200,000,000 0
Free Cash Flows (A36-CapEx) -1,689,754,224 249,958,959
NPV ($207,064,744.05)
60%
Year 2016 2017
Sales $0.00 $2,100,000,000.00
Costs $0.00 $1,690,872,389.62

Gross Profit $0.00 $409,127,610.38
Amount of Depreciation $240,000,000.00 $384,000,000.00
EBIT ($240,000,000.00) $25,127,610.38
Amount of Tax $0.00 $4,067,379.27
Net Income ($240,000,000.00) $21,060,231.11
Net income + Depreciation $0.00 $405,060,231.11
Net income + deprectiaon - change
in NWC -587,705,068.45 287,519,217.42
CapEx 1,200,000,000 0
Free Cash Flows (A36-CapEx) -1,787,705,068 287,519,217
NPV ($33,752,028.20)
70%
Year 2016 2017
Sales $0.00 $2,450,000,000.00
Costs $0.00 $1,972,684,454.56
Gross Profit $0.00 $477,315,545.44
Amount of Depreciation $240,000,000.00 $384,000,000.00
EBIT ($240,000,000.00) $93,315,545.44
Amount of Tax $0.00 $15,104,886.97
Net Income ($240,000,000.00) $78,210,658.47
Net income + Depreciation $0.00 $462,210,658.47
Net income + deprectiaon - change
in NWC -685,655,913.19 325,079,475.83
CapEx 1,200,000,000 0
Free Cash Flows (A36-CapEx) -1,885,655,913 325,079,476
NPV $139,560,687.66
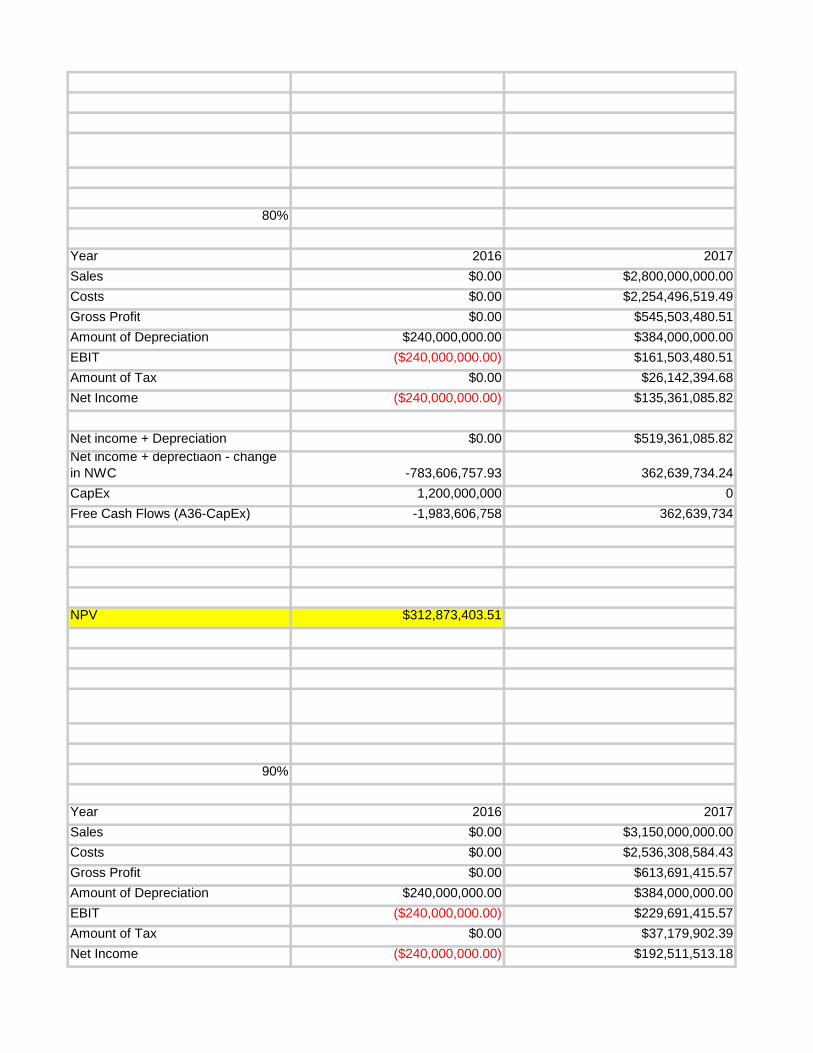
80%
Year 2016 2017
Sales $0.00 $2,800,000,000.00
Costs $0.00 $2,254,496,519.49
Gross Profit $0.00 $545,503,480.51
Amount of Depreciation $240,000,000.00 $384,000,000.00
EBIT ($240,000,000.00) $161,503,480.51
Amount of Tax $0.00 $26,142,394.68
Net Income ($240,000,000.00) $135,361,085.82
Net income + Depreciation $0.00 $519,361,085.82
Net income + deprectiaon - change
in NWC -783,606,757.93 362,639,734.24
CapEx 1,200,000,000 0
Free Cash Flows (A36-CapEx) -1,983,606,758 362,639,734
NPV $312,873,403.51
90%
Year 2016 2017
Sales $0.00 $3,150,000,000.00
Costs $0.00 $2,536,308,584.43
Gross Profit $0.00 $613,691,415.57
Amount of Depreciation $240,000,000.00 $384,000,000.00
EBIT ($240,000,000.00) $229,691,415.57
Amount of Tax $0.00 $37,179,902.39
Net Income ($240,000,000.00) $192,511,513.18

Net income + Depreciation $0.00 $576,511,513.18
Net income + deprectiaon - change
in NWC -881,557,602.67 400,199,992.65
CapEx 1,200,000,000 0
Free Cash Flows (A36-CapEx) -2,081,557,603 400,199,993
NPV $486,186,119.37
100%
Year 2016 2017
Sales $0.00 $3,500,000,000.00
Costs $0.00 $2,818,120,649.37
Gross Profit $0.00 $681,879,350.63
Amount of Depreciation $240,000,000.00 $384,000,000.00
EBIT ($240,000,000.00) $297,879,350.63
Amount of Tax $0.00 $48,217,410.10
Net Income ($240,000,000.00) $249,661,940.54
Net income + Depreciation $0.00 $633,661,940.54
Net income + deprectiaon - change
in NWC -979,508,447.41 437,760,251.05
CapEx 1,200,000,000 0
Free Cash Flows (A36-CapEx) -2,179,508,447 437,760,251
NPV $659,498,835.22

110%
Year 2016 2017
Sales $0.00 $3,850,000,000.00
Costs $0.00 $3,099,932,714.30
Gross Profit $0.00 $750,067,285.70
Amount of Depreciation $240,000,000.00 $384,000,000.00
EBIT ($240,000,000.00) $366,067,285.70
Amount of Tax $0.00 $59,254,917.80
Net Income ($240,000,000.00) $306,812,367.89
Net income + Depreciation $0.00 $690,812,367.89
Net income + deprectiaon - change
in NWC -1,077,459,292.15 475,320,509.46
CapEx 1,200,000,000 0
Free Cash Flows (A36-CapEx) -2,277,459,292 475,320,509
NPV $832,811,551.08
120%
Year 2016 2017
Sales $0.00 $4,200,000,000.00
Costs $0.00 $3,381,744,779.24
Gross Profit $0.00 $818,255,220.76
Amount of Depreciation $240,000,000.00 $384,000,000.00
EBIT ($240,000,000.00) $434,255,220.76
Amount of Tax $0.00 $70,292,425.51
Net Income ($240,000,000.00) $363,962,795.25
Net income + Depreciation $0.00 $747,962,795.25
Net income + deprectiaon - change
in NWC -1,175,410,136.90 512,880,767.87
CapEx 1,200,000,000 0

Free Cash Flows (A36-CapEx) -2,375,410,137 512,880,768
NPV $1,006,124,266.93
130%
Year 2016 2017
Sales $0.00 $4,550,000,000.00
Costs $0.00 $3,663,556,844.18
Gross Profit $0.00 $886,443,155.82
Amount of Depreciation $240,000,000.00 $384,000,000.00
EBIT ($240,000,000.00) $502,443,155.82
Amount of Tax $0.00 $81,329,933.22
Net Income ($240,000,000.00) $421,113,222.60
Net income + Depreciation $0.00 $805,113,222.60
Net income + deprectiaon - change
in NWC -1,273,360,981.64 550,441,026.28
CapEx 1,200,000,000 0
Free Cash Flows (A36-CapEx) -2,473,360,982 550,441,026
NPV $1,179,436,982.79
140%

Year 2016 2017
Sales $0.00 $4,900,000,000.00
Costs $0.00 $3,945,368,909.12
Gross Profit $0.00 $954,631,090.88
Amount of Depreciation $240,000,000.00 $384,000,000.00
EBIT ($240,000,000.00) $570,631,090.88
Amount of Tax $0.00 $92,367,440.93
Net Income ($240,000,000.00) $478,263,649.96
Net income + Depreciation $0.00 $862,263,649.96
Net income + deprectiaon - change
in NWC -1,371,311,826.38 588,001,284.68
CapEx 1,200,000,000 0
Free Cash Flows (A36-CapEx) -2,571,311,826 588,001,285
NPV $1,352,749,698.64

2018 2019 2020
$4,200,000,000.00 $3,990,000,000.00 $3,391,500,000.00
$3,381,744,779.24 $3,212,657,540.28 $2,730,758,909.24
$818,255,220.76 $777,342,459.72 $660,741,090.76
$230,400,000.00 $138,240,000.00 $138,240,000.00
$587,855,220.76 $639,102,459.72 $522,501,090.76
$95,155,492.30 $103,450,827.75 $84,576,689.57
$492,699,728.45 $535,651,631.97 $437,924,401.19
$723,099,728.45 $673,891,631.97 $576,164,401.19
781,870,235.30 841,387,576.47 1,145,650,612.51
0 0 0
781,870,235.30 841,387,576.47 1,145,650,612.51
2018 2019 2020
$420,000,000.00 $399,000,000.00 $339,150,000.00
$338,174,477.92 $321,265,754.03 $273,075,890.92
$81,825,522.08 $77,734,245.97 $66,074,109.08
$230,400,000.00 $138,240,000.00 $138,240,000.00
($148,574,477.92) ($60,505,754.03) ($72,165,890.92)
($24,049,590.94) ($9,794,001.33) ($11,681,415.14)
($124,524,886.99) ($50,711,752.70) ($60,484,475.78)
$105,875,113.01 $87,528,247.30 $77,755,524.22

111,752,163.70 104,277,841.75 134,704,145.35
0 0 0
111,752,164 104,277,842 134,704,145
Year 2016 2017
Projected Sales $0.00 $350,000,000.00
Net Working Capital
Needed $97,950,844.74 $117,541,013.69
Change in NWC $97,950,844.74 $19,590,168.95
2018 2019 2020
$840,000,000.00 $798,000,000.00 $678,300,000.00
$676,348,955.85 $642,531,508.06 $546,151,781.85
$163,651,044.15 $155,468,491.94 $132,148,218.15
$230,400,000.00 $138,240,000.00 $138,240,000.00
($66,748,955.85) $17,228,491.94 ($6,091,781.85)
($10,804,581.69) $2,788,757.46 ($986,070.18)
($55,944,374.16) $14,439,734.48 ($5,105,711.67)
$174,455,625.84 $152,679,734.48 $133,134,288.33
186,209,727.21 186,178,923.39 247,031,530.59
0 0 0
186,209,727 186,178,923 247,031,531
Year 2016 2017
Projected Sales $0.00 $700,000,000.00
Net Working Capital
Needed $195,901,689.48 $235,082,027.38
Change in NWC $195,901,689.48 $39,180,337.90

2018 2019 2020
$1,260,000,000.00 $1,197,000,000.00 $1,017,450,000.00
$1,014,523,433.77 $963,797,262.08 $819,227,672.77
$245,476,566.23 $233,202,737.92 $198,222,327.23
$230,400,000.00 $138,240,000.00 $138,240,000.00
$15,076,566.23 $94,962,737.92 $59,982,327.23
$2,440,427.56 $15,371,516.25 $9,709,274.79
$12,636,138.67 $79,591,221.67 $50,273,052.44
$243,036,138.67 $217,831,221.67 $188,513,052.44
260,667,290.72 268,080,005.02 359,358,915.83
0 0 0
260,667,291 268,080,005 359,358,916
Year 2016 2017
Projected Sales $0.00 $1,050,000,000.00
Net Working Capital
Needed $293,852,534.22 $352,623,041.07
Change in NWC $293,852,534.22 $58,770,506.84
2018 2019 2020
$1,680,000,000.00 $1,596,000,000.00 $1,356,600,000.00
$1,352,697,911.70 $1,285,063,016.11 $1,092,303,563.70
$327,302,088.30 $310,936,983.89 $264,296,436.30
$230,400,000.00 $138,240,000.00 $138,240,000.00
$96,902,088.30 $172,696,983.89 $126,056,436.30
$15,685,436.81 $27,954,275.03 $20,404,619.76
$81,216,651.49 $144,742,708.85 $105,651,816.54
$311,616,651.49 $282,982,708.85 $243,891,816.54
335,124,854.23 349,981,086.66 471,686,301.07
0 0 0
335,124,854 349,981,087 471,686,301

Year 2016 2017
Projected Sales $0.00 $1,400,000,000.00
Net Working Capital
Needed $391,803,378.97 $470,164,054.76
Change in NWC $391,803,378.97 $78,360,675.79
2018 2019 2020
$2,100,000,000.00 $1,995,000,000.00 $1,695,750,000.00
$1,690,872,389.62 $1,606,328,770.14 $1,365,379,454.62
$409,127,610.38 $388,671,229.86 $330,370,545.38
$230,400,000.00 $138,240,000.00 $138,240,000.00
$178,727,610.38 $250,431,229.86 $192,130,545.38
$28,930,446.06 $40,537,033.82 $31,099,964.73
$149,797,164.32 $209,894,196.04 $161,030,580.65
$380,197,164.32 $348,134,196.04 $299,270,580.65
409,582,417.74 431,882,168.29 584,013,686.31
0 0 0
409,582,418 431,882,168 584,013,686
Year 2016 2017
Projected Sales $0.00 $1,750,000,000.00
Net Working Capital
Needed $489,754,223.71 $587,705,068.45
Change in NWC $489,754,223.71 $97,950,844.74
2018 2019 2020
$2,520,000,000.00 $2,394,000,000.00 $2,034,900,000.00
$2,029,046,867.55 $1,927,594,524.17 $1,638,455,345.54

$490,953,132.45 $466,405,475.83 $396,444,654.46
$230,400,000.00 $138,240,000.00 $138,240,000.00
$260,553,132.45 $328,165,475.83 $258,204,654.46
$42,175,455.31 $53,119,792.61 $41,795,309.70
$218,377,677.15 $275,045,683.22 $216,409,344.76
$448,777,677.15 $413,285,683.22 $354,649,344.76
484,039,981.26 513,783,249.93 696,341,071.55
0 0 0
484,039,981 513,783,250 696,341,072
Year 2016 2017
Projected Sales $0.00 $2,100,000,000.00
Net Working Capital
Needed $587,705,068.45 $705,246,082.14
Change in NWC $587,705,068.45 $117,541,013.69
2018 2019 2020
$2,940,000,000.00 $2,793,000,000.00 $2,374,050,000.00
$2,367,221,345.47 $2,248,860,278.20 $1,911,531,236.47
$572,778,654.53 $544,139,721.80 $462,518,763.53
$230,400,000.00 $138,240,000.00 $138,240,000.00
$342,378,654.53 $405,899,721.80 $324,278,763.53
$55,420,464.56 $65,702,551.39 $52,490,654.67
$286,958,189.97 $340,197,170.41 $271,788,108.87
$517,358,189.97 $478,437,170.41 $410,028,108.87
558,497,544.77 595,684,331.57 808,668,456.79
0 0 0
558,497,545 595,684,332 808,668,457
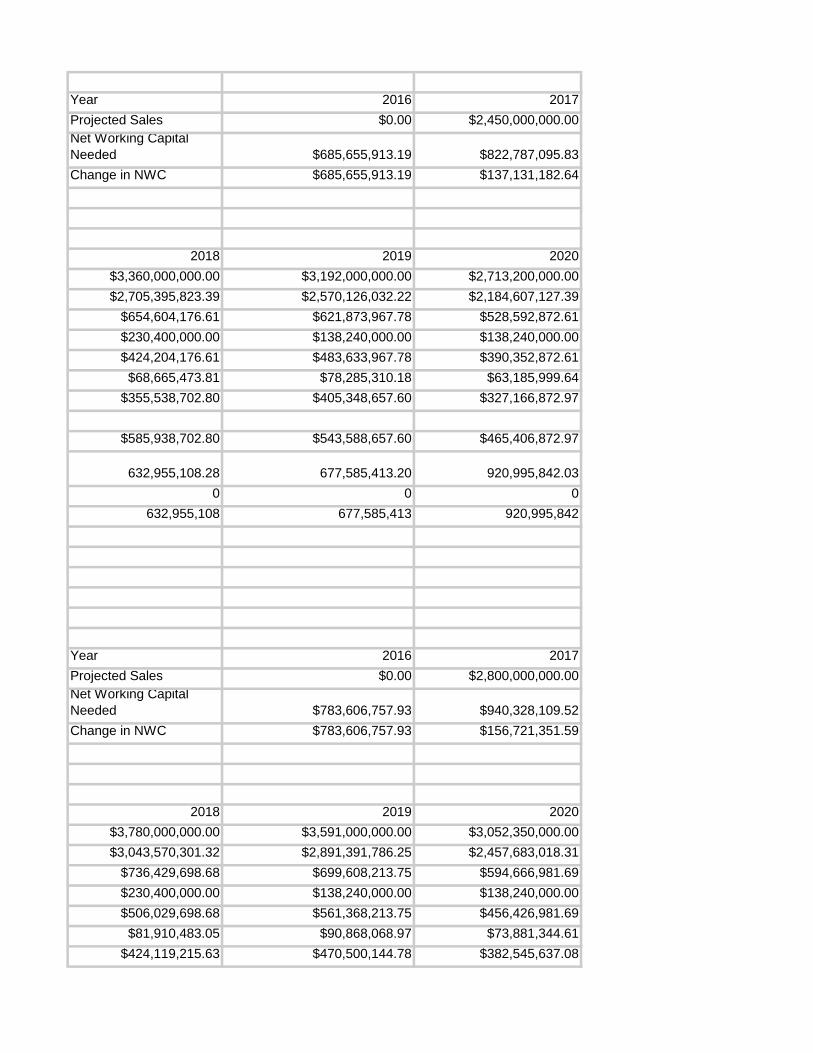
Year 2016 2017
Projected Sales $0.00 $2,450,000,000.00
Net Working Capital
Needed $685,655,913.19 $822,787,095.83
Change in NWC $685,655,913.19 $137,131,182.64
2018 2019 2020
$3,360,000,000.00 $3,192,000,000.00 $2,713,200,000.00
$2,705,395,823.39 $2,570,126,032.22 $2,184,607,127.39
$654,604,176.61 $621,873,967.78 $528,592,872.61
$230,400,000.00 $138,240,000.00 $138,240,000.00
$424,204,176.61 $483,633,967.78 $390,352,872.61
$68,665,473.81 $78,285,310.18 $63,185,999.64
$355,538,702.80 $405,348,657.60 $327,166,872.97
$585,938,702.80 $543,588,657.60 $465,406,872.97
632,955,108.28 677,585,413.20 920,995,842.03
0 0 0
632,955,108 677,585,413 920,995,842
Year 2016 2017
Projected Sales $0.00 $2,800,000,000.00
Net Working Capital
Needed $783,606,757.93 $940,328,109.52
Change in NWC $783,606,757.93 $156,721,351.59
2018 2019 2020
$3,780,000,000.00 $3,591,000,000.00 $3,052,350,000.00
$3,043,570,301.32 $2,891,391,786.25 $2,457,683,018.31
$736,429,698.68 $699,608,213.75 $594,666,981.69
$230,400,000.00 $138,240,000.00 $138,240,000.00
$506,029,698.68 $561,368,213.75 $456,426,981.69
$81,910,483.05 $90,868,068.97 $73,881,344.61
$424,119,215.63 $470,500,144.78 $382,545,637.08
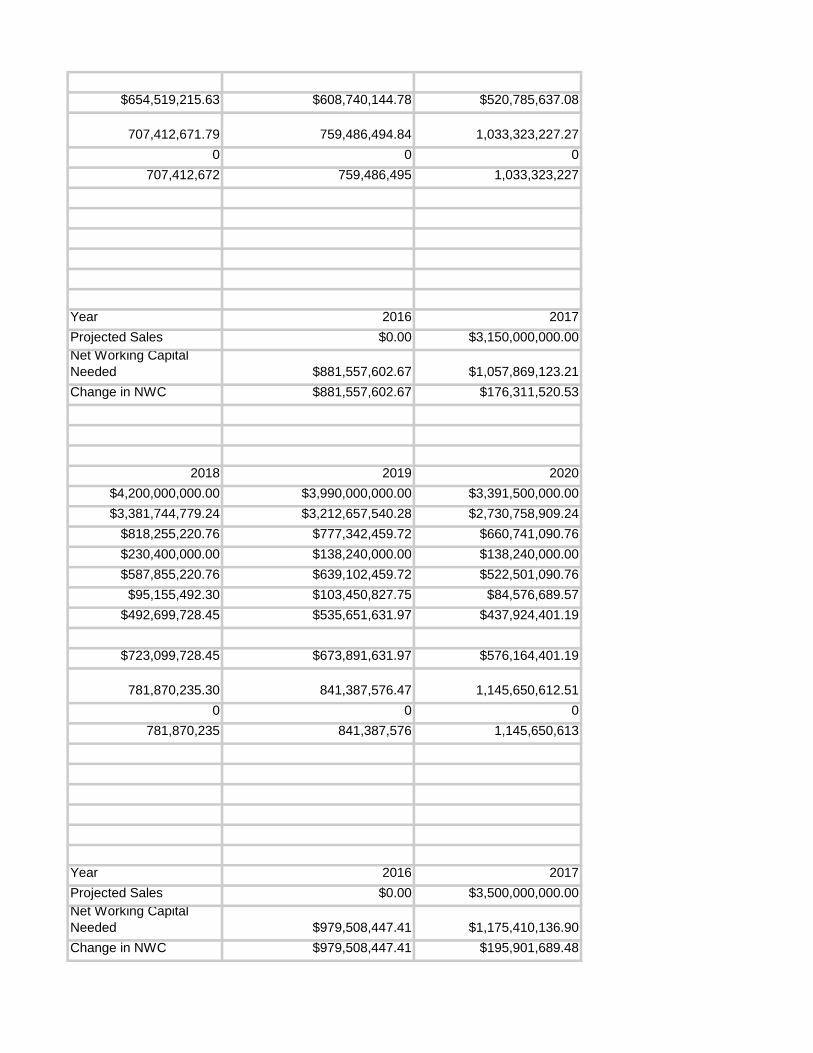
$654,519,215.63 $608,740,144.78 $520,785,637.08
707,412,671.79 759,486,494.84 1,033,323,227.27
0 0 0
707,412,672 759,486,495 1,033,323,227
Year 2016 2017
Projected Sales $0.00 $3,150,000,000.00
Net Working Capital
Needed $881,557,602.67 $1,057,869,123.21
Change in NWC $881,557,602.67 $176,311,520.53
2018 2019 2020
$4,200,000,000.00 $3,990,000,000.00 $3,391,500,000.00
$3,381,744,779.24 $3,212,657,540.28 $2,730,758,909.24
$818,255,220.76 $777,342,459.72 $660,741,090.76
$230,400,000.00 $138,240,000.00 $138,240,000.00
$587,855,220.76 $639,102,459.72 $522,501,090.76
$95,155,492.30 $103,450,827.75 $84,576,689.57
$492,699,728.45 $535,651,631.97 $437,924,401.19
$723,099,728.45 $673,891,631.97 $576,164,401.19
781,870,235.30 841,387,576.47 1,145,650,612.51
0 0 0
781,870,235 841,387,576 1,145,650,613
Year 2016 2017
Projected Sales $0.00 $3,500,000,000.00
Net Working Capital
Needed $979,508,447.41 $1,175,410,136.90
Change in NWC $979,508,447.41 $195,901,689.48

2018 2019 2020
$4,620,000,000.00 $4,389,000,000.00 $3,730,650,000.00
$3,719,919,257.17 $3,533,923,294.31 $3,003,834,800.16
$900,080,742.83 $855,076,705.69 $726,815,199.84
$230,400,000.00 $138,240,000.00 $138,240,000.00
$669,680,742.83 $716,836,705.69 $588,575,199.84
$108,400,501.55 $116,033,586.54 $95,272,034.54
$561,280,241.28 $600,803,119.15 $493,303,165.30
$791,680,241.28 $739,043,119.15 $631,543,165.30
856,327,798.81 923,288,658.11 1,257,977,997.75
0 0 0
856,327,799 923,288,658 1,257,977,998
Year 2016 2017
Projected Sales $0.00 $3,850,000,000.00
Net Working Capital
Needed $1,077,459,292.15 $1,292,951,150.59
Change in NWC $1,077,459,292.15 $215,491,858.43
2018 2019 2020
$5,040,000,000.00 $4,788,000,000.00 $4,069,800,000.00
$4,058,093,735.09 $3,855,189,048.34 $3,276,910,691.09
$981,906,264.91 $932,810,951.66 $792,889,308.91
$230,400,000.00 $138,240,000.00 $138,240,000.00
$751,506,264.91 $794,570,951.66 $654,649,308.91
$121,645,510.80 $128,616,345.33 $105,967,379.51
$629,860,754.11 $665,954,606.34 $548,681,929.40
$860,260,754.11 $804,194,606.34 $686,921,929.40
930,785,362.32 1,005,189,739.75 1,370,305,382.99
0 0 0

930,785,362 1,005,189,740 1,370,305,383
Year 2016 2017
Projected Sales $0.00 $4,200,000,000.00
Net Working Capital
Needed $1,175,410,136.90 $1,410,492,164.27
Change in NWC $1,175,410,136.90 $235,082,027.38
2018 2019 2020
$5,460,000,000.00 $5,187,000,000.00 $4,408,950,000.00
$4,396,268,213.01 $4,176,454,802.36 $3,549,986,582.01
$1,063,731,786.99 $1,010,545,197.64 $858,963,417.99
$230,400,000.00 $138,240,000.00 $138,240,000.00
$833,331,786.99 $872,305,197.64 $720,723,417.99
$134,890,520.05 $141,199,104.11 $116,662,724.48
$698,441,266.93 $731,106,093.52 $604,060,693.51
$928,841,266.93 $869,346,093.52 $742,300,693.51
1,005,242,925.83 1,087,090,821.38 1,482,632,768.23
0 0 0
1,005,242,926 1,087,090,821 1,482,632,768
Year 2016 2017
Projected Sales $0.00 $4,550,000,000.00
Net Working Capital
Needed $1,273,360,981.64 $1,528,033,177.96
Change in NWC $1,273,360,981.64 $254,672,196.33

2018 2019 2020
$5,880,000,000.00 $5,586,000,000.00 $4,748,100,000.00
$4,734,442,690.94 $4,497,720,556.39 $3,823,062,472.93
$1,145,557,309.06 $1,088,279,443.61 $925,037,527.07
$230,400,000.00 $138,240,000.00 $138,240,000.00
$915,157,309.06 $950,039,443.61 $786,797,527.07
$148,135,529.30 $153,781,862.90 $127,358,069.45
$767,021,779.76 $796,257,580.71 $659,439,457.62
$997,421,779.76 $934,497,580.71 $797,679,457.62
1,079,700,489.34 1,168,991,903.02 1,594,960,153.47
0 0 0
1,079,700,489 1,168,991,903 1,594,960,153
Year 2016 2017
Projected Sales $0.00 $4,900,000,000.00
Net Working Capital
Needed $1,371,311,826.38 $1,645,574,191.65
Change in NWC $1,371,311,826.38 $274,262,365.28

2021
$1,356,600,000.00
$1,092,303,563.70
$264,296,436.30
$69,120,000.00
$195,176,436.30
$31,592,999.82
$163,583,436.49
$232,703,436.49
612,360,910.70
0
612,360,910.70
2021
$135,660,000.00
$109,230,356.37
$26,429,643.63
$69,120,000.00
($42,690,356.37)
($6,910,242.07)
($35,780,114.30)
$33,339,885.70

71,305,633.12
0
71,305,633.12
2018 2019 2020 2021
$420,000,000.00 ######## ######## ########
$111,663,963.01 ######## ######## $0.00
($5,877,050.68) ######## ######## ########
2021
$271,320,000.00
$218,460,712.74
$52,859,287.26
$69,120,000.00
($16,260,712.74)
($2,632,104.08)
($13,628,608.66)
$55,491,391.34
131,422,886.19
0
131,422,886.19
2018 2019 2020 2021
$840,000,000.00 ######## ######## ########
$223,327,926.01 ######## ######## $0.00
($11,754,101.37) ######## ######## ########

2021
$406,980,000.00
$327,691,069.11
$79,288,930.89
$69,120,000.00
$10,168,930.89
$1,646,033.91
$8,522,896.99
$77,642,896.99
191,540,139.25
0
191,540,139.25
2018 2019 2020 2021
$1,260,000,000.00 ######## ######## ########
$334,991,889.02 ######## ######## $0.00
($17,631,152.05) ######## ######## ########
2021
$542,640,000.00
$436,921,425.48
$105,718,574.52
$69,120,000.00
$36,598,574.52
$5,924,171.89
$30,674,402.63
$99,794,402.63
251,657,392.32
0
251,657,392.32

2018 2019 2020 2021
$1,680,000,000.00 ######## ######## ########
$446,655,852.02 ######## ######## $0.00
($23,508,202.74) ######## ######## ########
2021
$678,300,000.00
$546,151,781.85
$132,148,218.15
$69,120,000.00
$63,028,218.15
$10,202,309.88
$52,825,908.27
$121,945,908.27
311,774,645.38
0
311,774,645.38
2018 2019 2020 2021
$2,100,000,000.00 ######## ######## ########
$558,319,815.03 ######## ######## $0.00
($29,385,253.42) ######## ######## ########
2021
$813,960,000.00
$655,382,138.22

$158,577,861.78
$69,120,000.00
$89,457,861.78
$14,480,447.87
$74,977,413.91
$144,097,413.91
371,891,898.44
0
371,891,898.44
2018 2019 2020 2021
$2,520,000,000.00 ######## ######## ########
$669,983,778.03 ######## ######## $0.00
($35,262,304.11) ######## ######## ########
2021
$949,620,000.00
$764,612,494.59
$185,007,505.41
$69,120,000.00
$115,887,505.41
$18,758,585.86
$97,128,919.56
$166,248,919.56
432,009,151.51
0
432,009,151.51

2018 2019 2020 2021
$2,940,000,000.00 ######## ######## ########
$781,647,741.04 ######## ######## $0.00
($41,139,354.79) ######## ######## ########
2021
$1,085,280,000.00
$873,842,850.96
$211,437,149.04
$69,120,000.00
$142,317,149.04
$23,036,723.84
$119,280,425.20
$188,400,425.20
492,126,404.57
0
492,126,404.57
2018 2019 2020 2021
$3,360,000,000.00 ######## ######## ########
$893,311,704.04 ######## ######## $0.00
($47,016,405.48) ######## ######## ########
2021
$1,220,940,000.00
$983,073,207.33
$237,866,792.67
$69,120,000.00
$168,746,792.67
$27,314,861.83
$141,431,930.84

$210,551,930.84
552,243,657.64
0
552,243,657.64
2018 2019 2020 2021
$3,780,000,000.00 ######## ######## ########
$1,004,975,667.05 ######## ######## $0.00
($52,893,456.16) ######## ######## ########
2021
$1,356,600,000.00
$1,092,303,563.70
$264,296,436.30
$69,120,000.00
$195,176,436.30
$31,592,999.82
$163,583,436.49
$232,703,436.49
612,360,910.70
0
612,360,910.70
2018 2019 2020 2021
$4,200,000,000.00 ######## ######## ########
$1,116,639,630.05 ######## ######## $0.00
($58,770,506.84) ######## ######## ########

2021
$1,492,260,000.00
$1,201,533,920.06
$290,726,079.94
$69,120,000.00
$221,606,079.94
$35,871,137.81
$185,734,942.13
$254,854,942.13
672,478,163.77
0
672,478,163.77
2018 2019 2020 2021
$4,620,000,000.00 ######## ######## ########
$1,228,303,593.06 ######## ######## $0.00
($64,647,557.53) ######## ######## ########
2021
$1,627,920,000.00
$1,310,764,276.43
$317,155,723.57
$69,120,000.00
$248,035,723.57
$40,149,275.79
$207,886,447.77
$277,006,447.77
732,595,416.83
0

732,595,416.83
2018 2019 2020 2021
$5,040,000,000.00 ######## ######## ########
$1,339,967,556.06 ######## ######## $0.00
($70,524,608.21) ######## ######## ########
2021
$1,763,580,000.00
$1,419,994,632.80
$343,585,367.20
$69,120,000.00
$274,465,367.20
$44,427,413.78
$230,037,953.42
$299,157,953.42
792,712,669.90
0
792,712,669.90
2018 2019 2020 2021
$5,460,000,000.00 ######## ######## ########
$1,451,631,519.07 ######## ######## $0.00
($76,401,658.90) ######## ######## ########

2021
$1,899,240,000.00
$1,529,224,989.17
$370,015,010.83
$69,120,000.00
$300,895,010.83
$48,705,551.77
$252,189,459.06
$321,309,459.06
852,829,922.96
0
852,829,922.96
2018 2019 2020 2021
$5,880,000,000.00 ######## ######## ########
$1,563,295,482.07 ######## ######## $0.00
($82,278,709.58) ######## ######## ########