Embed Size (px)
Citation preview
1
PresentersDeon Stockert, Cory Chorne and Eric Dodds
Capital Budgetingfor MunicipalitiesCapital Budgetingfor Municipalities
Presented byNorth Dakota Rural Water Systems & AE2S
In conjunction with the NDLOC Regional MeetingsApril 18, 19, 20, 25, 26 and 27 2006
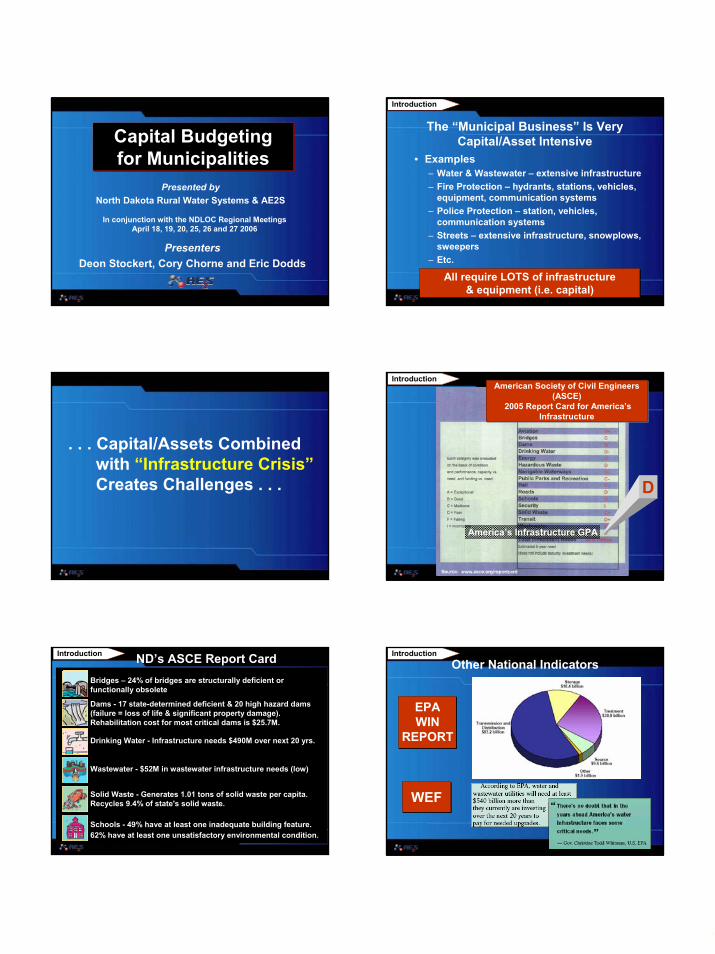
The “Municipal Business” Is Very Capital/Asset Intensive
• Examples– Water & Wastewater – extensive infrastructure– Fire Protection – hydrants, stations, vehicles,
equipment, communication systems– Police Protection – station, vehicles,
communication systems– Streets – extensive infrastructure, snowplows,
sweepers– Etc.
Introduction
All require LOTS of infrastructure& equipment (i.e. capital)
All require LOTS of infrastructure& equipment (i.e. capital)
. . . Capital/Assets Combined with “Infrastructure Crisis”Creates Challenges . . .
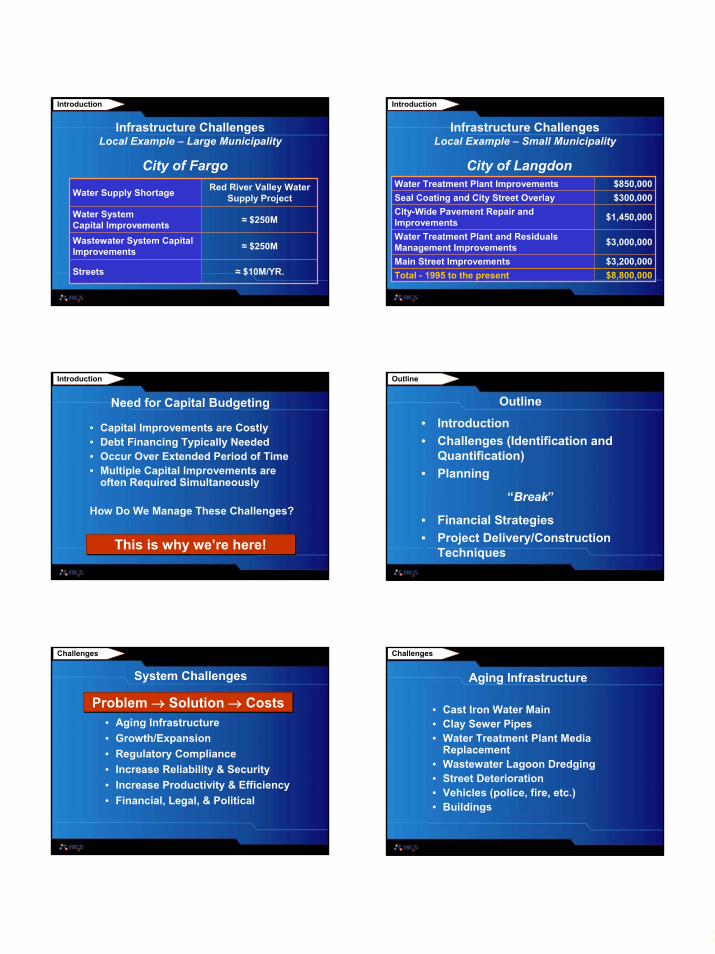
American Society of Civil Engineers(ASCE)
2005 Report Card for America’s Infrastructure
American Society of Civil Engineers(ASCE)
2005 Report Card for America’s Infrastructure
D
America’s Infrastructure GPA
Introduction
Bridges – 24% of bridges are structurally deficient or functionally obsolete
Dams - 17 state-determined deficient & 20 high hazard dams (failure = loss of life & significant property damage). Rehabilitation cost for most critical dams is $25.7M.
Introduction
Drinking Water - Infrastructure needs $490M over next 20 yrs.
Wastewater - $52M in wastewater infrastructure needs (low)
Solid Waste - Generates 1.01 tons of solid waste per capita. Recycles 9.4% of state's solid waste.
ND’s ASCE Report Card
Schools - 49% have at least one inadequate building feature. 62% have at least one unsatisfactory environmental condition.
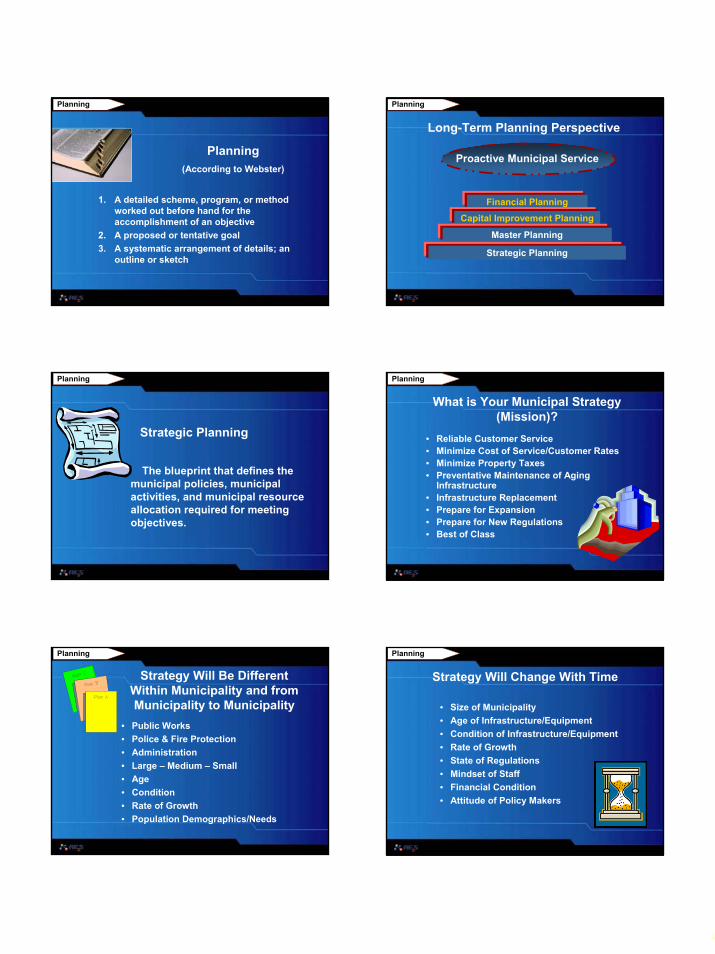
Other National Indicators
EPA WIN
REPORT
Introduction
WEF
2
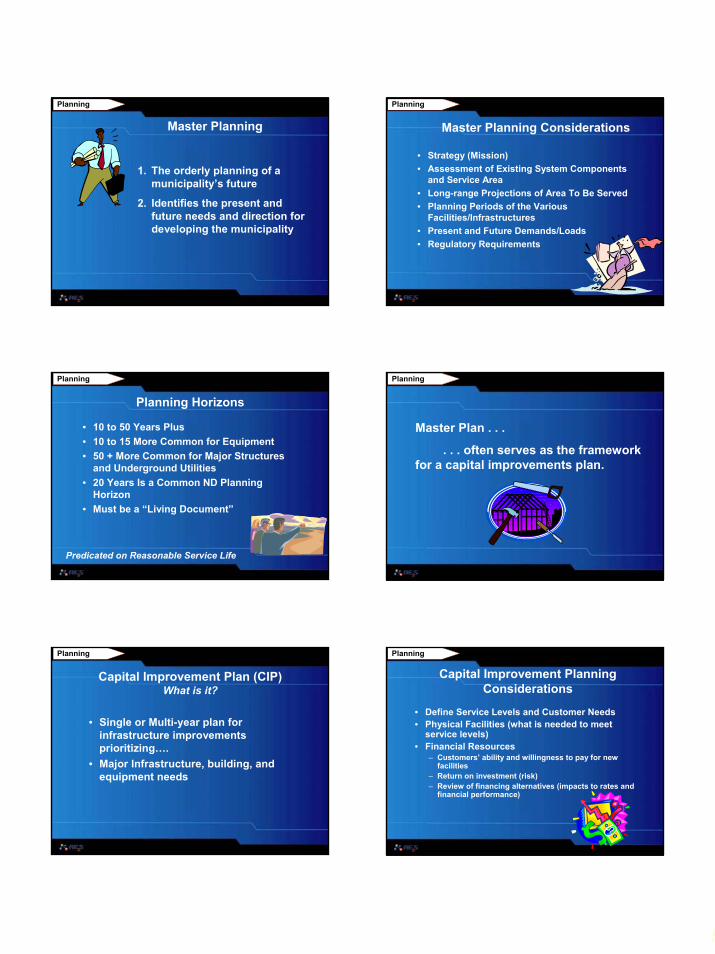
Infrastructure ChallengesLocal Example – Large Municipality
Water Supply Shortage Red River Valley Water Supply Project
Streets ≈ $10M/YR.
Water SystemCapital Improvements ≈ $250M
Wastewater System Capital Improvements ≈ $250M
City of Fargo
Introduction
Infrastructure ChallengesLocal Example – Small Municipality
Water Treatment Plant Improvements $850,000
Water Treatment Plant and Residuals Management Improvements $3,000,000
Main Street Improvements $3,200,000 Total - 1995 to the present $8,800,000
Seal Coating and City Street Overlay $300,000 City-Wide Pavement Repair and Improvements $1,450,000
City of Langdon
Introduction
Need for Capital Budgeting
• Capital Improvements are Costly• Debt Financing Typically Needed• Occur Over Extended Period of Time• Multiple Capital Improvements are
often Required Simultaneously
How Do We Manage These Challenges?
Introduction
This is why we’re here!This is why we’re here!
• Introduction• Challenges (Identification and
Quantification)• Planning
“Break”
• Financial Strategies• Project Delivery/Construction
Techniques
Outline
Outline
• Aging Infrastructure• Growth/Expansion• Regulatory Compliance• Increase Reliability & Security• Increase Productivity & Efficiency• Financial, Legal, & Political
System Challenges
Problem → Solution → CostsProblem → Solution → Costs
Challenges
• Cast Iron Water Main• Clay Sewer Pipes• Water Treatment Plant Media
Replacement• Wastewater Lagoon Dredging• Street Deterioration• Vehicles (police, fire, etc.)• Buildings
Aging Infrastructure
Challenges

3
• Low Water Pressure (ends of system)• Collection System Overflows• Capacity Upgrades• Traffic Signals• New Landfill• Another Police Car/Fire Truck
(e.g. Moorhead, MN: 2 new fire trucks ≈ $1M
Growth/ExpansionExamples
Challenges
• Drinking Water Treatment– Long Term 2 Enhanced Surface Water Rule– Stage 2 Disinfection By-Products Rule– Groundwater Rule– Arsenic Rule
• Wastewater– Peak Wet Weather Flow By-Pass Rule
• Security Requirements• Other . . .
Regulatory ComplianceExamples
Challenges
• New Pumps/Pump Replacement• Cast Iron Pipe• Water Tower Maintenance• Technology Upgrades• Fencing• Access & Overflow Structures on
Water System• Chemical Vulnerability
Reliability & SecurityExamples
Challenges
• Properly Functioning Equipment• Functional Facilities• Control Systems• Automation• Overcoming staffing shortages
Productivity & EfficiencyExamples
Challenges
• $$$ don’t grow on trees• Who benefits from improvements?• “Utilities should be self-sufficient”• Environmental activist challenges
(e.g. Moratorium on wastewater permits in Minnesota)
• Divided councils/commissioners• Other . . .
Financial, Legal, & Political
Challenges
Overcoming These Challenges
How do we overcome these challenges while operating an efficient, healthy municipality?
√ Identify Solutions
√ Quantify Costs
√ Prioritization of Challenges
√ Start with Proper Planning
Challenges
4
1. A detailed scheme, program, or method worked out before hand for the accomplishment of an objective
2. A proposed or tentative goal3. A systematic arrangement of details; an
outline or sketch
Planning (According to Webster)
Planning
Long-Term Planning Perspective
Proactive Municipal Service
Financial Planning
Capital Improvement Planning
Master Planning
Strategic Planning
Planning
The blueprint that defines the municipal policies, municipal activities, and municipal resource allocation required for meeting objectives.
Strategic Planning
Planning
• Reliable Customer Service• Minimize Cost of Service/Customer Rates• Minimize Property Taxes• Preventative Maintenance of Aging
Infrastructure• Infrastructure Replacement• Prepare for Expansion• Prepare for New Regulations• Best of Class
What is Your Municipal Strategy (Mission)?
Planning
• Public Works• Police & Fire Protection• Administration• Large – Medium – Small• Age• Condition• Rate of Growth• Population Demographics/Needs
Strategy Will Be Different Within Municipality and from Municipality to Municipality
Planning
Strategy Will Change With Time
• Size of Municipality• Age of Infrastructure/Equipment• Condition of Infrastructure/Equipment• Rate of Growth• State of Regulations• Mindset of Staff• Financial Condition• Attitude of Policy Makers
Planning
5
1. The orderly planning of a municipality’s future
2. Identifies the present and future needs and direction for developing the municipality
Master Planning
Planning
• Strategy (Mission) • Assessment of Existing System Components
and Service Area• Long-range Projections of Area To Be Served• Planning Periods of the Various
Facilities/Infrastructures• Present and Future Demands/Loads• Regulatory Requirements
Master Planning Considerations
Planning
• 10 to 50 Years Plus• 10 to 15 More Common for Equipment• 50 + More Common for Major Structures
and Underground Utilities • 20 Years Is a Common ND Planning
Horizon• Must be a “Living Document”
Planning Horizons
Predicated on Reasonable Service Life
Planning
Master Plan . . .
. . . often serves as the framework for a capital improvements plan.
Planning
Capital Improvement Plan (CIP)What is it?
• Single or Multi-year plan for infrastructure improvements prioritizing….
• Major Infrastructure, building, and equipment needs
Planning
• Define Service Levels and Customer Needs• Physical Facilities (what is needed to meet
service levels)• Financial Resources
– Customers’ ability and willingness to pay for new facilities
– Return on investment (risk)– Review of financing alternatives (impacts to rates and
financial performance)
Capital Improvement Planning Considerations
Planning
6
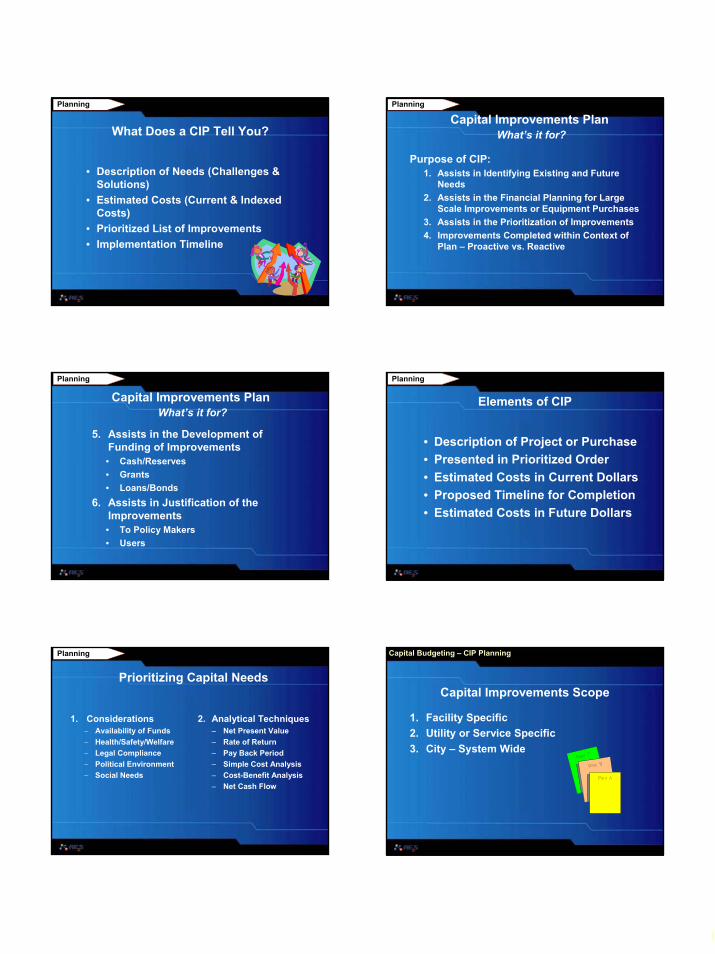
What Does a CIP Tell You?
• Description of Needs (Challenges & Solutions)
• Estimated Costs (Current & Indexed Costs)
• Prioritized List of Improvements• Implementation Timeline
Planning
Capital Improvements PlanWhat’s it for?
Purpose of CIP:1. Assists in Identifying Existing and Future
Needs2. Assists in the Financial Planning for Large
Scale Improvements or Equipment Purchases3. Assists in the Prioritization of Improvements4. Improvements Completed within Context of
Plan – Proactive vs. Reactive
Planning
5. Assists in the Development of Funding of Improvements • Cash/Reserves• Grants• Loans/Bonds
6. Assists in Justification of the Improvements• To Policy Makers• Users
Planning
Capital Improvements PlanWhat’s it for?
Elements of CIP
• Description of Project or Purchase• Presented in Prioritized Order• Estimated Costs in Current Dollars• Proposed Timeline for Completion• Estimated Costs in Future Dollars
Planning
Prioritizing Capital Needs
1. Considerations− Availability of Funds− Health/Safety/Welfare− Legal Compliance− Political Environment− Social Needs
2. Analytical Techniques– Net Present Value– Rate of Return– Pay Back Period– Simple Cost Analysis– Cost-Benefit Analysis– Net Cash Flow
Planning
Capital Improvements Scope
1. Facility Specific2. Utility or Service Specific3. City – System Wide
Capital Budgeting – CIP Planning
7
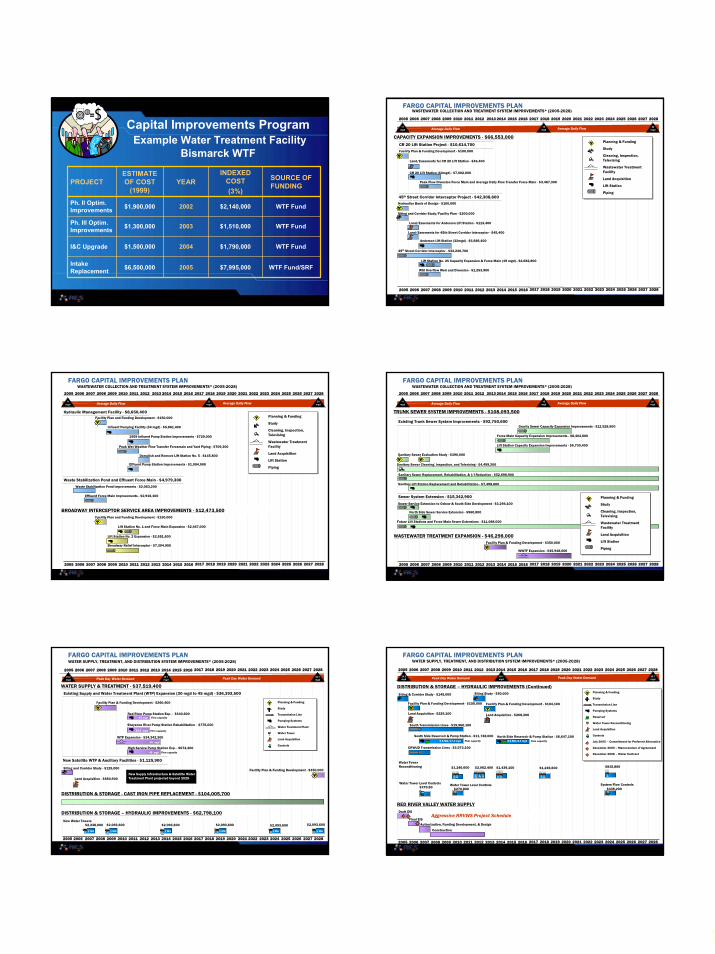
PROJECTESTIMATE OF COST
(1999)YEAR
INDEXED COST(3%)
SOURCE OF FUNDING
2002
2003
I&C Upgrade $1,500,000 2004 $1,790,000 WTF Fund
2005
Ph. II Optim. Improvements $1,900,000 $2,140,000 WTF Fund
Ph. III Optim. Improvements $1,300,000 $1,510,000 WTF Fund
Intake Replacement $6,500,000 $7,995,000 WTF Fund/SRF
Capital Improvements ProgramExample Water Treatment Facility
Bismarck WTF
FARGO CAPITAL IMPROVEMENTS PLANWASTEWATER COLLECTION AND TREATMENT SYSTEM IMPROVEMENTS* (2005-2028)
CAPACITY EXPANSION IMPROVEMENTS - $66,553,000
CR 20 Lift Station (44mgd) - $7,002,000
Peak Flow Diversion Force Main and Average Daily Flow Transfer Force Main - $3,467,300
Hydraulics Basis of Design - $100,000
Facility Plan & Funding Development - $100,000
Siting and Corridor Study/Facility Plan - $200,000
45th Street Corridor Interceptor Project - $42,308,600
Land/Easements for CR 20 Lift Station - $45,400
Land/Easements for 45th Street Corridor Interceptor - $45,400
Anderson Lift Station (32mgd) - $5,686,400
Land/Easements for Anderson Lift Station - $113,400
CR 20 Lift Station Project - $10,614,700
45th Street Corridor Interceptor - $32,226,700
Lift Station No. 25 Capacity Expansion & Force Main (19 mgd) - $2,682,800
WSI Overflow Weir and Diversion - $1,253,900
2005 2006 2007 2008 2009 2010 2011 2012 2013 2014 2015 2016 2017 2018 2019 2020 2021 2022 2023 2024 2025 2026 2027 2028
2005 2006 2007 2008 2009 2010 2011 2012 2013 2014 2015 2016 2017 2018 2019 2020 2021 2022 2023 2024 2025 2026 2027 2028
Average Daily FlowAverage Daily Flow20
mgd15
mgd11
mgd
Planning & Funding
Study
Cleaning, Inspection, Televising
Wastewater Treatment Facility
Land Acquisition
Lift Station
Piping
WWTF
*All costs are presented in December 2004 dollars. Excludes gravity sewer system extensions, annual planning budget, wastewater collection geographical information system (GIS), and master plan updates. Approximately $4.3M will be required over the 24-year period to fund the annual planning, wastewater GIS, and master plan updates. Gravity sewer system extensions are special assessed in their entirety.
Demolish and Remove Lift Station No. 5 - $145,800
FARGO CAPITAL IMPROVEMENTS PLANWASTEWATER COLLECTION AND TREATMENT SYSTEM IMPROVEMENTS* (2005-2028)
Facility Plan and Funding Development - $150,000
1959 Influent Pump Station Improvements - $729,000
Peak Wet Weather Flow Transfer Forcemain and Yard Piping - $709,300
2005 2006 2007 2008 2009 2010 2011 2012 2013 2014 2015 2016 2017 2018 2019 2020 2021 2022 2023 2024 2025 2026 2027 2028
2005 2006 2007 2008 2009 2010 2011 2012 2013 2014 2015 2016 2017 2018 2019 2020 2021 2022 2023 2024 2025 2026 2027 2028
Influent Pumping Facility (34 mgd) - $5,861,400
Peak Day Water DemandAverage Daily FlowAverage Daily Flow20
mgd15
mgd11
mgd
Hydraulic Management Facility - $8,650,400
Waste Stabilization Pond and Effluent Force Main - $4,979,300
Waste Stabilization Pond Improvements - $2,063,200
Effluent Force Main Improvements - $2,916,100
Facility Plan and Funding Development - $150,000
Lift Station No. 1 and Force Main Expansion - $2,467,000
Lift Station No. 2 Expansion - $2,551,600
Broadway Relief Interceptor - $7,304,900
Effluent Pump Station Improvements - $1,054,900
BROADWAY INTERCEPTOR SERVICE AREA IMPROVEMENTS - $12,473,500
Planning & Funding
Study
Cleaning, Inspection, Televising
Wastewater Treatment Facility
Land Acquisition
Lift Station
Piping
WWTF
*All costs are presented in December 2004 dollars. Excludes gravity sewer system extensions, annual planning budget, wastewater collection geographical information system (GIS), and master plan updates. Approximately $4.3M will be required over the 24-year period to fund the annual planning, wastewater GIS, and master plan updates. Gravity sewer system extensions are special assessed in their entirety.
FARGO CAPITAL IMPROVEMENTS PLANWASTEWATER COLLECTION AND TREATMENT SYSTEM IMPROVEMENTS* (2005-2028)
Peak Day Water Demand
Existing Trunk Sewer System Improvements - $92,750,600
TRUNK SEWER SYSTEM IMPROVEMENTS - $108,093,500
Gravity Sewer Capacity Expansion Improvements - $12,528,900
Force Main Capacity Expansion Improvements - $8,404,600
Lift Station Capacity Expansion Improvements - $6,730,400
Sanitary Sewer Evaluation Study - $390,000
Sanitary Sewer Cleaning, Inspection, and Televising - $4,499,200
Sanitary Sewer Replacement, Rehabilitation, & I/I Reduction - $52,698,900
Sanitary Lift Station Replacement and Rehabilitation - $7,498,600
Sewer System Extension - $15,342,900
Sewer Service Extension to Oxbow & South Side Development - $3,294,100
North Side Sewer Service Extension - $960,800
Future Lift Stations and Force Main Sewer Extensions - $11,088,000
WASTEWATER TREATMENT EXPANSION - $46,298,000
WWTF Expansion - $45,948,000
Facility Plan & Funding Development - $350,000
2005 2006 2007 2008 2009 2010 2011 2012 2013 2014 2015 2016 2017 2018 2019 2020 2021 2022 2023 2024 2025 2026 2027 2028
2005 2006 2007 2008 2009 2010 2011 2012 2013 2014 2015 2016 2017 2018 2019 2020 2021 2022 2023 2024 2025 2026 2027 2028
Average Daily FlowAverage Daily Flow20
mgd15
mgd11
mgd
WWTF
Planning & Funding
Study
Cleaning, Inspection, Televising
Wastewater Treatment Facility
Land Acquisition
Lift Station
Piping
WWTF
*All costs are presented in December 2004 dollars. Excludes gravity sewer system extensions, annual planning budget, wastewater collection geographical information system (GIS), and master plan updates. Approximately $4.3M will be required over the 24-year period to fund the annual planning, wastewater GIS, and master plan updates. Gravity sewer system extensions are special assessed in their entirety.
FARGO CAPITAL IMPROVEMENTS PLANWATER SUPPLY, TREATMENT, AND DISTRIBUTION SYSTEM IMPROVEMENTS* (2005-2028)
WATER SUPPLY & TREATMENT - $37,519,400
WTP
Sheyenne River Pump Station Rehabilitation - $776,000
WTP Expansion - $34,342,300
Siting and Corridor Study - $125,000
Existing Supply and Water Treatment Plant (WTP) Expansion (30 mgd to 45 mgd) - $36,393,500
High Service Pump Station Exp. - $674,200
Facility Plan & Funding Development - $260,400
Land Acquisition - $650,900New Supply Infrastructure & Satellite Water Treatment Plant projected beyond 2028.
New Satellite WTP & Ancillary Facilities - $1,125,900
2005 2006 2007 2008 2009 2010 2011 2012 2013 2014 2015 2016 2017 2018 2019 2020 2021 2022 2023 2024 2025 2026 2027 2028
Red River Pump Station Exp. - $340,600
DISTRIBUTION & STORAGE - CAST IRON PIPE REPLACEMENT - $104,005,700
2005 2006 2007 2008 2009 2010 2011 2012 2013 2014 2015 2016 2017 2018 2019 2020 2021 2022 2023 2024 2025 2026 2027 2028
Peak Day Water DemandPeak Day Water Demand 39.7mgd
30.1mgd
25.2mgd
45 mgd Firm capacity
16.2 mgd Firm capacity
45 mgd
45 mgd Firm capacity
Facility Plan & Funding Development - $350,000
DISTRIBUTION & STORAGE – HYDRAULIC IMPROVEMENTS - $62,798,100
New Water Towers$2,093,600
1 MG1 MG
$2,238,000
1 MG 1 MG 1 MG
$2,093,600$2,093,600$2,093,600
Planning & Funding
Study
Transmission Line
Pumping Systems
Water Treatment Plant
Water Tower
Land Acquisition
Controls
WTP
$2,093,600
1 MG1 MG 1 MG1 MG
*All costs are presented in December 2004 dollars. Excludes system extensions, annual planning budget, water distribution geographical information system (GIS), and master plan updates. Approximately $4.3M will be required over the 24-year period to fund the annual planning, water GIS, and master plan updates. Approximately $14M will be required over the 24-year period to fund system extensions.
Authorization, Funding Development, & Design
Siting & Corridor Study - $145,000
FARGO CAPITAL IMPROVEMENTS PLANWATER SUPPLY, TREATMENT, AND DISTRIBUTION SYSTEM IMPROVEMENTS* (2005-2028)
CRWUD Transmission Lines - $3,073,100
South Transmission Lines - $19,960,100
South Side Reservoir & Pump Station - $11,738,000
Facility Plan & Funding Development - $150,000
Land Acquisition - $229,100 Land Acquisition - $208,300
Facility Plan & Funding Development - $104,100
Water Tower Level Controls
Siting Study - $50,000
2005 2006 2007 2008 2009 2010 2011 2012 2013 2014 2015 2016 2017 2018 2019 2020 2021 2022 2023 2024 2025 2026 2027 2028
2005 2006 2007 2008 2009 2010 2011 2012 2013 2014 2015 2016 2017 2018 2019 2020 2021 2022 2023 2024 2025 2026 2027 2028
$270,800
$270,800
RED RIVER VALLEY WATER SUPPLY
Construction
Aggressive RRVWS Project Schedule1 2
3
Draft EIS
Final EIS
Peak Day Water DemandPeak Day Water Demand
5.5 MG/17.3 mgd Firm capacityNorth Side Reservoir & Pump Station - $6,647,100
3.0 MG/4.3 mgd Firm capacity
$435,200Water Tower Level Controls System Flow Controls
Peak Day Water DemandPeak Day Water Demand 39.7mgd
30.1mgd
25.2mgd
$1,246,600 $2,062,400 $1,439,100
Water Tower Reconditioning $1,246,600 $815,800
Planning & Funding
Study
Transmission Line
Pumping Systems
Reservoir
Water Tower Reconditioning
Land Acquisition
Controls
July 2005 – Commitment for Preferred Alternative
December 2005 – Memorandum of Agreement
December 2006 – Water Contract
1
2
3
*All costs are presented in December 2004 dollars. Excludes system extensions, annual planning budget, water distribution geographical information system (GIS), and master plan updates. Approximately $4.3M will be required over the 24-year period to fund the annual planning, water GIS, and master plan updates. Approximately $14M will be required over the 24-year period to fund system extensions.
DISTRIBUTION & STORAGE – HYDRAULIC IMPROVEMENTS (Continued)
8
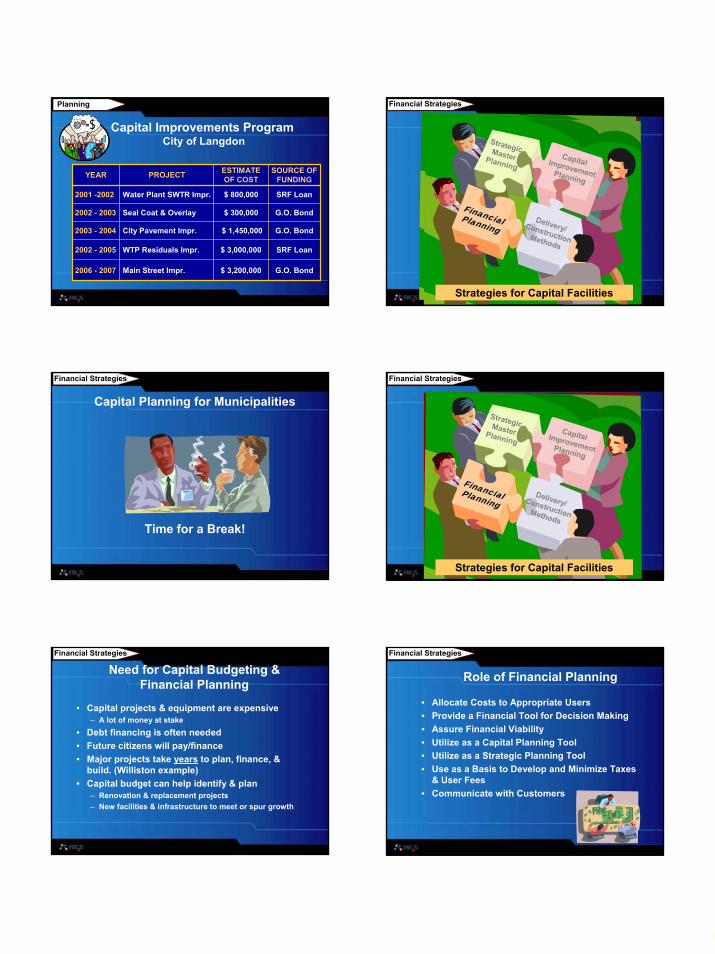
YEAR PROJECT ESTIMATE OF COST
SOURCE OF FUNDING
2002 - 2005 WTP Residuals Impr. $ 3,000,000 SRF Loan
2001 -2002 Water Plant SWTR Impr. $ 800,000 SRF Loan
2002 - 2003 Seal Coat & Overlay $ 300,000 G.O. Bond
2003 - 2004 City Pavement Impr. $ 1,450,000 G.O. Bond
2006 - 2007 Main Street Impr. $ 3,200,000 G.O. Bond
Capital Improvements ProgramCity of Langdon
Planning
Capital Improvement Planning
Delivery/ Construction Methods
Financial Planning
Strategies for Capital Facilities
Strategic Strategic Master Master Planning
PlanningCapital Improvement Planning
Delivery/ Construction Methods
Financial Financial PlanningPlanning
Strategies for Capital Facilities
Strategic Master Planning
Financial Strategies
Capital Planning for Municipalities
Financial Strategies
Time for a Break!
Capital Improvement Planning
Delivery/ Construction Methods
Financial Financial PlanningPlanning
Strategies for Capital Facilities
Strategic Master Planning
Financial Strategies
Need for Capital Budgeting & Financial Planning
• Capital projects & equipment are expensive– A lot of money at stake
• Debt financing is often needed• Future citizens will pay/finance• Major projects take years to plan, finance, &
build. (Williston example)• Capital budget can help identify & plan
– Renovation & replacement projects– New facilities & infrastructure to meet or spur growth
Financial Strategies
• Allocate Costs to Appropriate Users• Provide a Financial Tool for Decision Making• Assure Financial Viability• Utilize as a Capital Planning Tool• Utilize as a Strategic Planning Tool• Use as a Basis to Develop and Minimize Taxes
& User Fees• Communicate with Customers
Role of Financial Planning
Financial Strategies
9
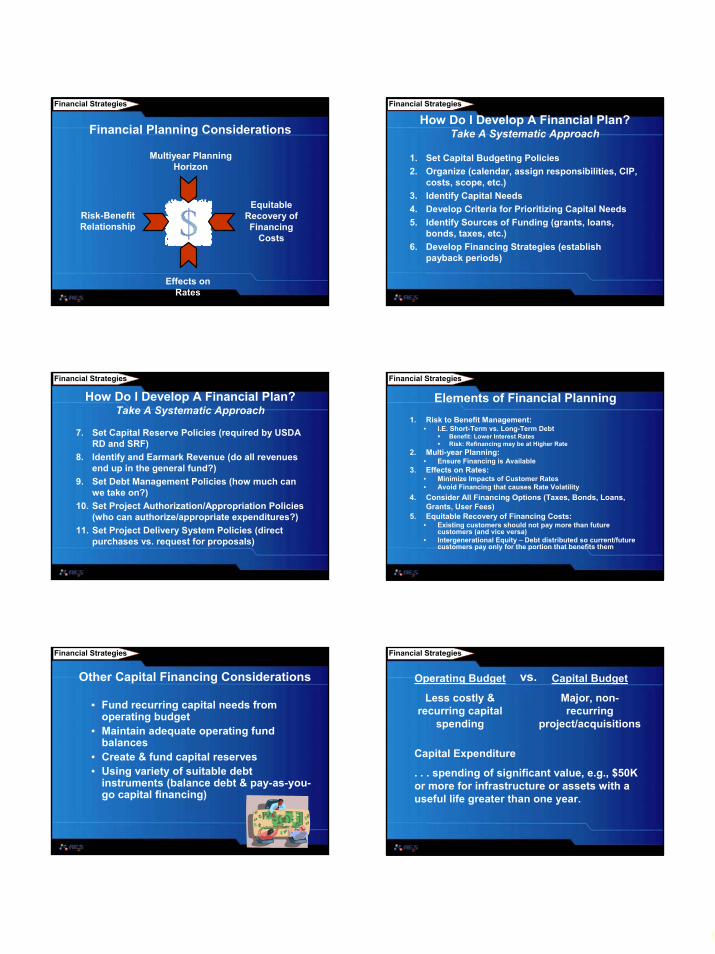
Financial Planning Considerations
Risk-Benefit Relationship
Effects on Rates
Equitable Recovery of Financing
Costs
Multiyear Planning Horizon
Financial Strategies
How Do I Develop A Financial Plan?Take A Systematic Approach
1. Set Capital Budgeting Policies2. Organize (calendar, assign responsibilities, CIP,
costs, scope, etc.)3. Identify Capital Needs4. Develop Criteria for Prioritizing Capital Needs5. Identify Sources of Funding (grants, loans,
bonds, taxes, etc.)6. Develop Financing Strategies (establish
payback periods)
Financial Strategies
How Do I Develop A Financial Plan?Take A Systematic Approach
7. Set Capital Reserve Policies (required by USDA RD and SRF)
8. Identify and Earmark Revenue (do all revenues end up in the general fund?)
9. Set Debt Management Policies (how much can we take on?)
10. Set Project Authorization/Appropriation Policies (who can authorize/appropriate expenditures?)
11. Set Project Delivery System Policies (direct purchases vs. request for proposals)
Financial Strategies
Elements of Financial Planning1. Risk to Benefit Management:
• I.E. Short-Term vs. Long-Term DebtBenefit: Lower Interest RatesRisk: Refinancing may be at Higher Rate
2. Multi-year Planning:• Ensure Financing is Available
3. Effects on Rates:• Minimize Impacts of Customer Rates• Avoid Financing that causes Rate Volatility
4. Consider All Financing Options (Taxes, Bonds, Loans, Grants, User Fees)
5. Equitable Recovery of Financing Costs:• Existing customers should not pay more than future
customers (and vice versa)• Intergenerational Equity – Debt distributed so current/future
customers pay only for the portion that benefits them
Financial Strategies
• Fund recurring capital needs from operating budget
• Maintain adequate operating fund balances
• Create & fund capital reserves• Using variety of suitable debt
instruments (balance debt & pay-as-you-go capital financing)
Other Capital Financing Considerations
Financial Strategies
Capital Expenditure
. . . spending of significant value, e.g., $50K or more for infrastructure or assets with a useful life greater than one year.
Operating Budget
Less costly & recurring capital
spending
Capital Budget
Major, non-recurring
project/acquisitions
vs.
Financial Strategies
10
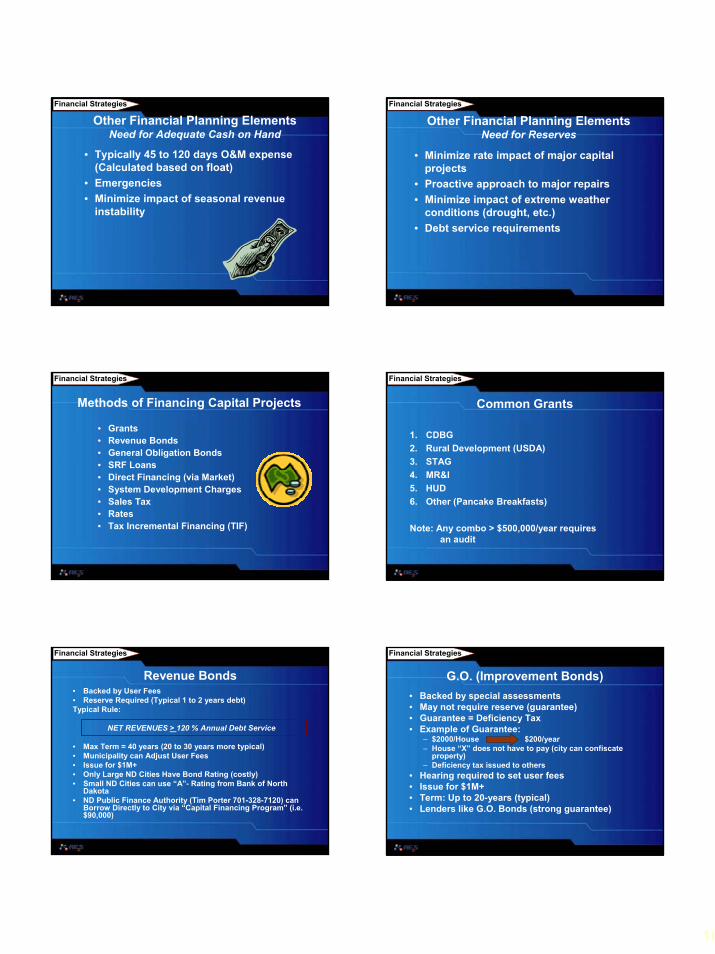
Other Financial Planning ElementsNeed for Adequate Cash on Hand
• Typically 45 to 120 days O&M expense (Calculated based on float)
• Emergencies• Minimize impact of seasonal revenue
instability
Financial Strategies
Other Financial Planning ElementsNeed for Reserves
• Minimize rate impact of major capital projects
• Proactive approach to major repairs• Minimize impact of extreme weather
conditions (drought, etc.)• Debt service requirements
Financial Strategies
• Grants• Revenue Bonds• General Obligation Bonds• SRF Loans• Direct Financing (via Market)• System Development Charges• Sales Tax• Rates• Tax Incremental Financing (TIF)
Methods of Financing Capital Projects
Financial Strategies
Common Grants
1. CDBG2. Rural Development (USDA)3. STAG4. MR&I5. HUD6. Other (Pancake Breakfasts)
Note: Any combo > $500,000/year requires an audit
Financial Strategies
Revenue Bonds• Backed by User Fees• Reserve Required (Typical 1 to 2 years debt)Typical Rule:
NET REVENUES > 120 % Annual Debt Service
• Max Term = 40 years (20 to 30 years more typical)• Municipality can Adjust User Fees• Issue for $1M+• Only Large ND Cities Have Bond Rating (costly)• Small ND Cities can use “A”- Rating from Bank of North
Dakota• ND Public Finance Authority (Tim Porter 701-328-7120) can
Borrow Directly to City via “Capital Financing Program” (i.e. $90,000)
Financial Strategies
G.O. (Improvement Bonds)• Backed by special assessments• May not require reserve (guarantee)• Guarantee = Deficiency Tax• Example of Guarantee:
– $2000/House $200/year– House “X” does not have to pay (city can confiscate
property)– Deficiency tax issued to others
• Hearing required to set user fees• Issue for $1M+• Term: Up to 20-years (typical)• Lenders like G.O. Bonds (strong guarantee)
Financial Strategies
11
Financial Strategies
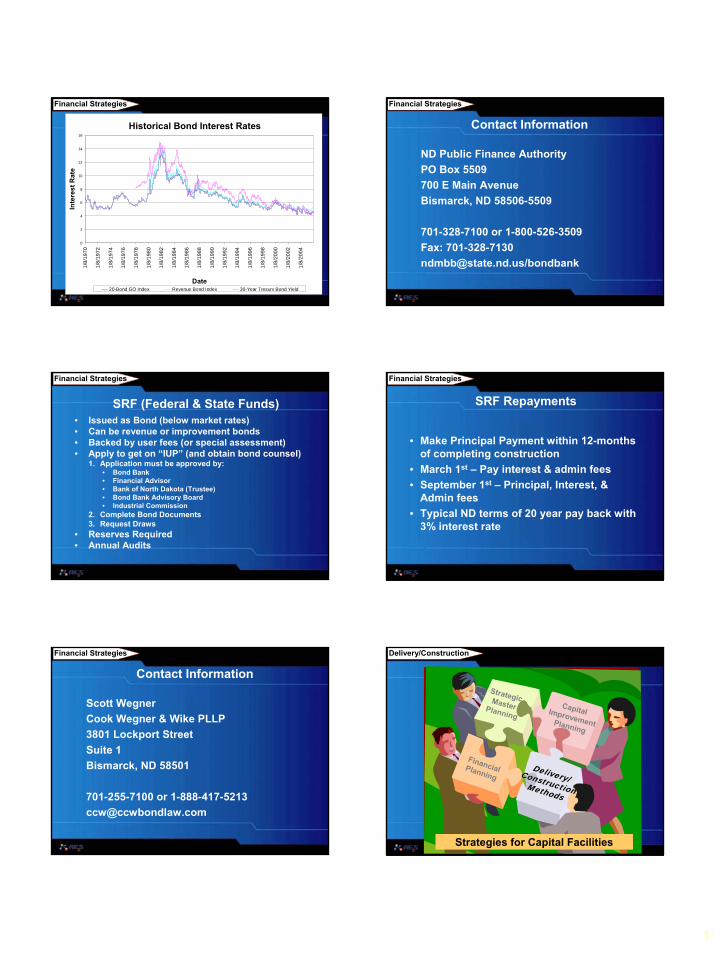
Historical Bond Interest Rates
0
2
4
6
8
10
12
14
16
1/8/
1970
1/8/
1972
1/8/
1974
1/8/
1976
1/8/
1978
1/8/
1980
1/8/
1982
1/8/
1984
1/8/
1986
1/8/
1988
1/8/
1990
1/8/
1992
1/8/
1994
1/8/
1996
1/8/
1998
1/8/
2000
1/8/
2002
1/8/
2004
Date
Inte
rest
Rat
e
20-Bond GO Index Revenue Bond Index 30-Year Tresury Bond Yield
Historical Bond Interest Rates Contact Information
ND Public Finance AuthorityPO Box 5509700 E Main AvenueBismarck, ND 58506-5509
701-328-7100 or 1-800-526-3509Fax: [email protected]/bondbank
Financial Strategies
SRF (Federal & State Funds)• Issued as Bond (below market rates)• Can be revenue or improvement bonds• Backed by user fees (or special assessment)• Apply to get on “IUP” (and obtain bond counsel)
1. Application must be approved by:• Bond Bank• Financial Advisor• Bank of North Dakota (Trustee)• Bond Bank Advisory Board• Industrial Commission
2. Complete Bond Documents3. Request Draws
• Reserves Required• Annual Audits
Financial Strategies
SRF Repayments
• Make Principal Payment within 12-months of completing construction
• March 1st – Pay interest & admin fees• September 1st – Principal, Interest, &
Admin fees• Typical ND terms of 20 year pay back with
3% interest rate
Financial Strategies
Contact Information
Scott WegnerCook Wegner & Wike PLLP3801 Lockport StreetSuite 1Bismarck, ND 58501
701-255-7100 or [email protected]
Financial Strategies Delivery/Construction
Project Delivery Methods
Capital Improvement Planning
Delivery/ Delivery/ Construction
Construction MethodsMethods
Financial Planning
Strategies for Capital Facilities
Strategic Master Planning
12
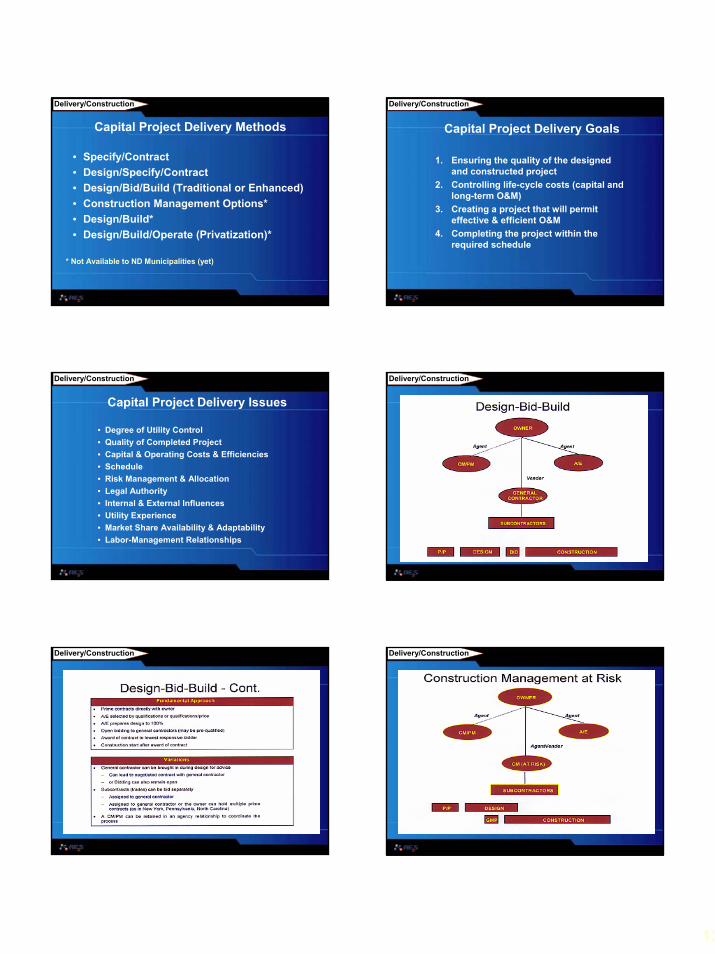
Capital Project Delivery Methods
• Specify/Contract• Design/Specify/Contract• Design/Bid/Build (Traditional or Enhanced)• Construction Management Options*• Design/Build*• Design/Build/Operate (Privatization)*
* Not Available to ND Municipalities (yet)
Delivery/Construction
1. Ensuring the quality of the designed and constructed project
2. Controlling life-cycle costs (capital and long-term O&M)
3. Creating a project that will permit effective & efficient O&M
4. Completing the project within the required schedule
Capital Project Delivery Goals
Delivery/Construction
• Degree of Utility Control• Quality of Completed Project• Capital & Operating Costs & Efficiencies• Schedule• Risk Management & Allocation• Legal Authority• Internal & External Influences• Utility Experience• Market Share Availability & Adaptability• Labor-Management Relationships
Capital Project Delivery Issues
Delivery/Construction Delivery/Construction
Delivery/Construction Delivery/Construction
13
Delivery/Construction Delivery/Construction
Delivery/Construction Delivery/Construction
Delivery/Construction
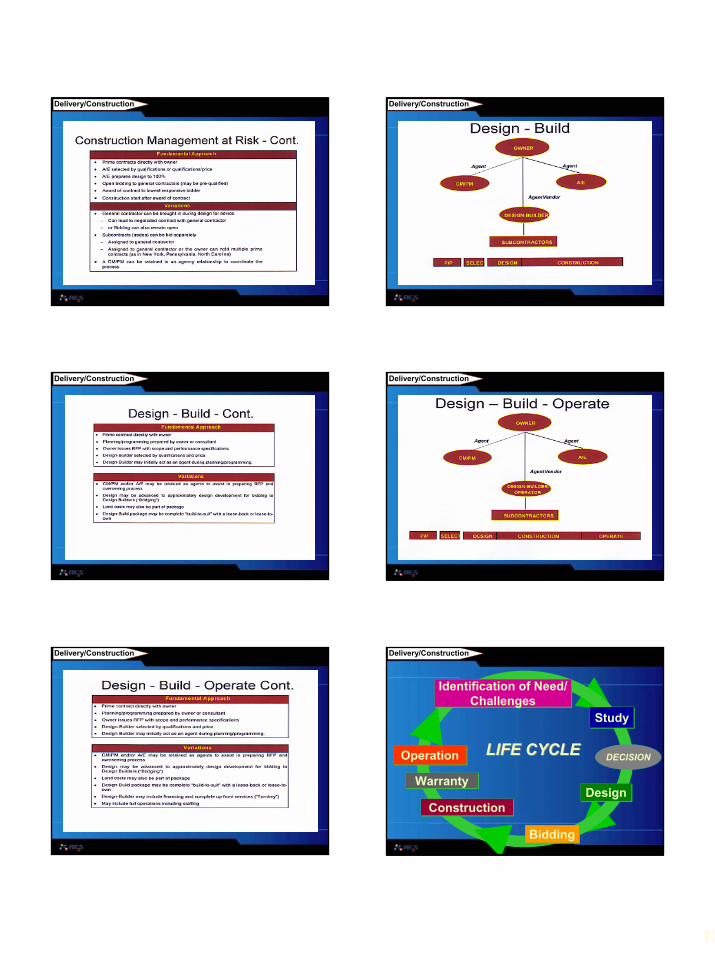
Identification of Need/Challenges
Identification of Need/Challenges
StudyStudy
DesignDesign
BiddingBidding
ConstructionConstruction
WarrantyWarranty
OperationOperation LIFE CYCLELIFE CYCLE DECISION
Delivery/Construction
14
• Concept Plans• Master Plans• Capital Improvement Plans• Preliminary Engineering Report• Facility Plans• Feasibility Study
Preliminary Reports
Delivery/Construction
Architectural Rendering
Larimore Water Treatment PlantLarimore Water Treatment Plant
Delivery/Construction
Goals of Design Process
• Develop a cost effective, constructible, and successful construction project that meets the needs of the client
• Prepare Bid Documents• Opinion of Probable Construction Costs• Owner Approval to Advertise• Review Agency Approval
Delivery/Construction
Construction DocumentsMain Components
• Project Manual– Bidding Requirements– Contract Forms– Contract Conditions– Specifications
• Drawings
Work Together
Delivery/Construction
Bidding Phase
• Publication of Invitation to Bid• 21 days (minimum advertisement
period)• Open Bids• Compilation of Bids• Evaluation of Bids• Engineer Award Recommendation
Delivery/Construction
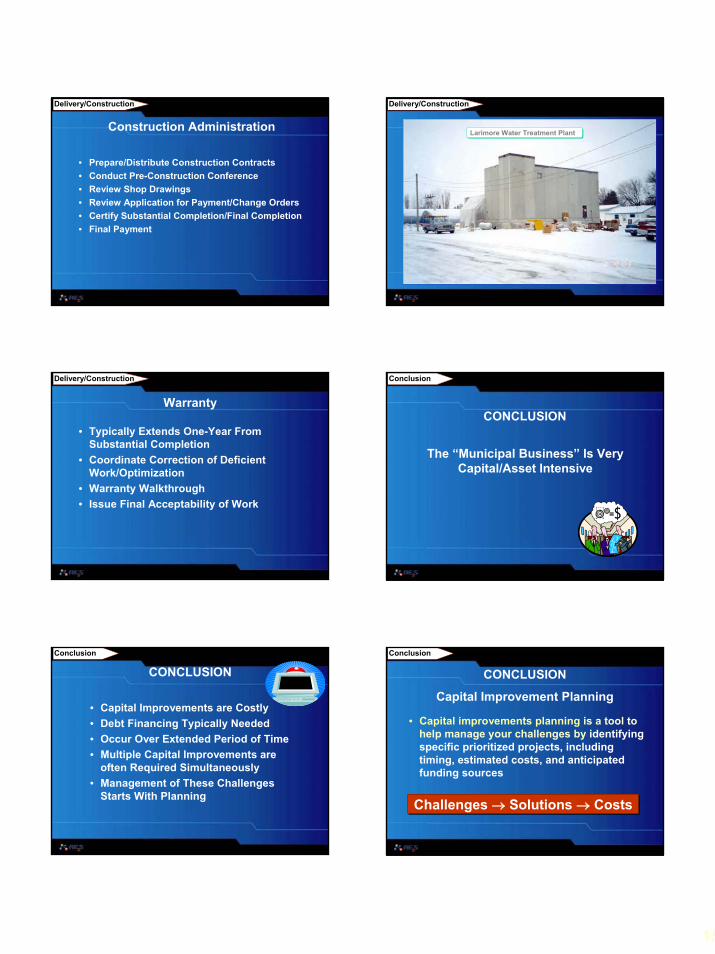
Larimore WTP Case Study
Schedule
Substantia
l Complet
ion
75% D
esign
Bidding Phase
100%
Des
ign
Study Phas
e
30% D
esign
Final Complet
ion
Dec 2001Aug 2001 Jun 2002 Jul 11 2002 Aug 2003 Oct 2003Mar 2003
Delivery/Construction
15
Construction Administration
• Prepare/Distribute Construction Contracts• Conduct Pre-Construction Conference• Review Shop Drawings• Review Application for Payment/Change Orders• Certify Substantial Completion/Final Completion• Final Payment
Delivery/Construction
Larimore Water Treatment PlantLarimore Water Treatment Plant
Delivery/Construction
• Typically Extends One-Year From Substantial Completion
• Coordinate Correction of Deficient Work/Optimization
• Warranty Walkthrough• Issue Final Acceptability of Work
Warranty
Delivery/Construction Conclusion
The “Municipal Business” Is Very Capital/Asset Intensive
CONCLUSION
Conclusion
CONCLUSION
• Capital Improvements are Costly• Debt Financing Typically Needed• Occur Over Extended Period of Time• Multiple Capital Improvements are
often Required Simultaneously• Management of These Challenges
Starts With Planning
Conclusion
Capital Improvement Planning
CONCLUSION
• Capital improvements planning is a tool to help manage your challenges by identifying specific prioritized projects, including timing, estimated costs, and anticipated funding sources
Challenges → Solutions → CostsChallenges → Solutions → Costs

16
Conclusion
Financial Planning
CONCLUSION
• Financial planning…– provides a framework for decision making to
meet the needs of your customers and a communication tool with customers
– provides a communication tool with your customers to justify decisions and policies
Conclusion
Proper Selection of a Project Delivery Method
CONCLUSION
• Ensures the quality of the finished projects or acquisitions
• Controls life-cycle costs
Questions?