Embed Size (px)
Citation preview
VEOLIA KEY FIGURES AS OF SEPTEMBER 30, 2014
Key figures for the period endingMarch 31, 2015
Conference call May 7, 2015Philippe Capron, CFO
VEOLIA KEY FIGURES AS OF MARCH 31, 2015
Veolia Environnement is a corporation listed on the Euronext Paris. This document contains “forward-looking statements” within the meaning of the provisions of the U.S. Private Securities Litigation Reform Act of 1995. Such forward-looking statements are not guarantees of future performance. Actual results may differ materially from the forward-looking statements as a result of a number of risks and uncertainties, many of which are outside our control, including but not limited to: the risk of suffering reduced profits or losses as a result of intense competition, the risk that changes in energy prices and taxes may reduce Veolia Environnement’s profits, the risk that governmental authorities could terminate or modify some of Veolia Environnement’s contracts, the risk that acquisitions may not provide the benefits that Veolia Environnement hopes to achieve, the risks related to customary provisions of divesture transactions, the risk that Veolia Environnement’s compliance with environmental laws may become more costly in the future, the risk that currency exchange rate fluctuations may negatively affect Veolia Environnement’s financial results and the price of its shares, the risk that Veolia Environnement may incur environmental liability in connection with its past, present and future operations, as well as the other risks described in the documents Veolia Environnement has filed with the Autorités des Marchés Financiers (French securities regulator). Veolia Environnement does not undertake, nor does it have, any obligation to provide updates or to revise any forward-looking statements. Investors and security holders may obtain from Veolia Environnement a free copy of documents it filed (www.veolia.com) with the Autorités des Marchés Financiers.
This document contains "non‐GAAP financial measures". These "non‐GAAP financial measures" might be defined differently from similar financial measures made public by other groups and should not replace GAAP financial measures prepared pursuant to IFRS standards.
Unaudited key figures
Disclaimer
2
VEOLIA KEY FIGURES AS OF MARCH 31, 2015
Strong resultsShow the benefits of continued significant cost cuttingSupport our annual targets
Benefit of the integration of Dalkia International
Favorable forex impact
No recovery in French Waste volumes yet
Context of lower energy prices in Europe and the US
Winter in Europe nearly as mild as 2014
1Q 2015 Highlights
3
VEOLIA KEY FIGURES AS OF MARCH 31, 2015
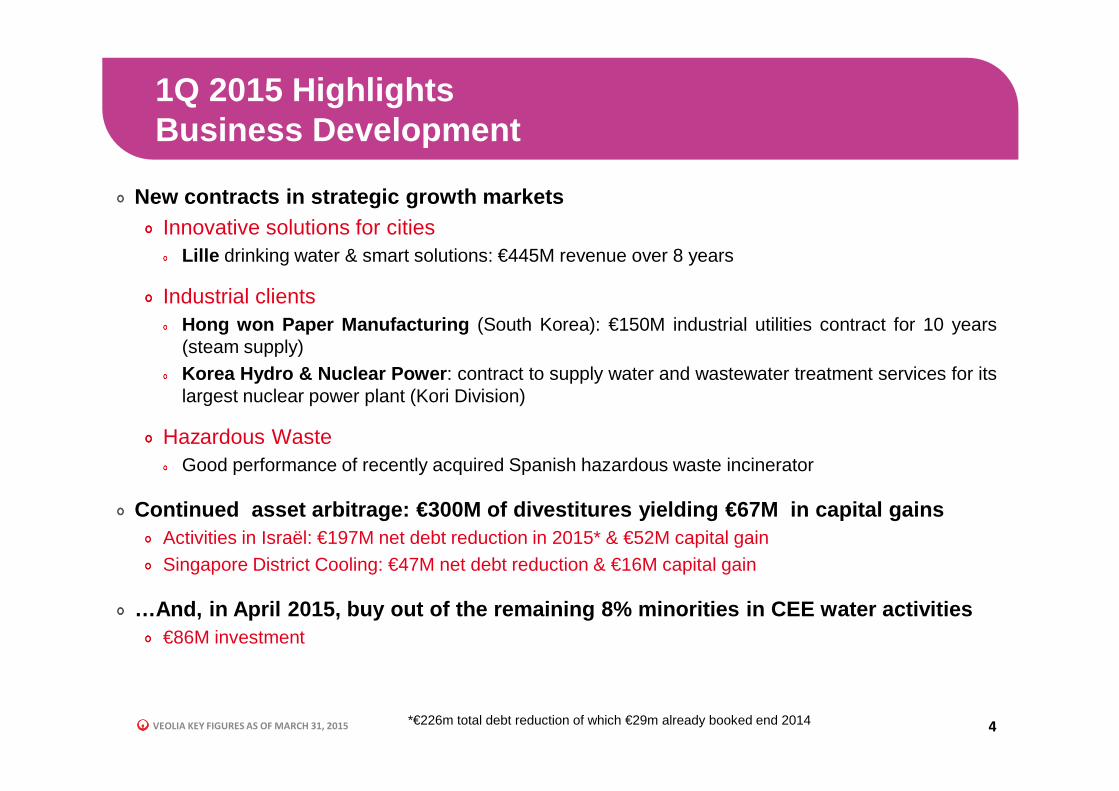
New contracts in strategic growth marketsInnovative solutions for cities
Lille drinking water & smart solutions: €445M revenue over 8 years
Industrial clientsHong won Paper Manufacturing (South Korea): €150M industrial utilities contract for 10 years(steam supply)Korea Hydro & Nuclear Power : contract to supply water and wastewater treatment services for itslargest nuclear power plant (Kori Division)
Hazardous WasteGood performance of recently acquired Spanish hazardous waste incinerator
Continued asset arbitrage: €300M of divestitures yielding €67M in capital gainsActivities in Israël: €197M net debt reduction in 2015* & €52M capital gainSingapore District Cooling: €47M net debt reduction & €16M capital gain
…And, in April 2015, buy out of the remaining 8% minorities in C EE water activities€86M investment
1Q 2015 HighlightsBusiness Development
4*€226m total debt reduction of which €29m already booked end 2014
VEOLIA KEY FIGURES AS OF MARCH 31, 2015
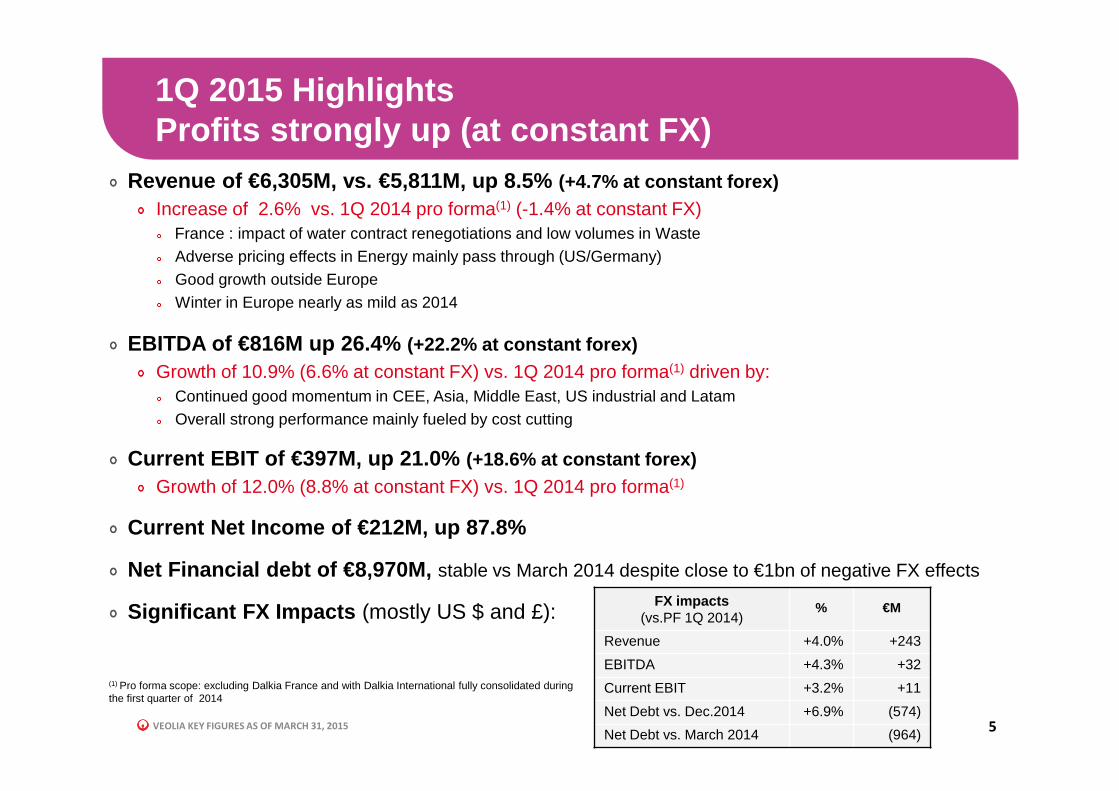
Revenue of €6,305M, vs. €5,811M, up 8.5% (+4.7% at constant forex)Increase of 2.6% vs. 1Q 2014 pro forma(1) (-1.4% at constant FX)
France : impact of water contract renegotiations and low volumes in WasteAdverse pricing effects in Energy mainly pass through (US/Germany)Good growth outside EuropeWinter in Europe nearly as mild as 2014
EBITDA of €816M up 26.4% (+22.2% at constant forex)Growth of 10.9% (6.6% at constant FX) vs. 1Q 2014 pro forma(1) driven by:
Continued good momentum in CEE, Asia, Middle East, US industrial and LatamOverall strong performance mainly fueled by cost cutting
Current EBIT of €397M, up 21.0% (+18.6% at constant forex)Growth of 12.0% (8.8% at constant FX) vs. 1Q 2014 pro forma(1)
Current Net Income of €212M, up 87.8%
Net Financial debt of €8,970M, stable vs March 2014 despite close to €1bn of negative FX effects
Significant FX Impacts (mostly US $ and £):
1Q 2015 Highlights Profits strongly up (at constant FX)
5
(1) Pro forma scope: excluding Dalkia France and with Dalkia International fully consolidated during the first quarter of 2014
FX impacts (vs.PF 1Q 2014)
% €M
Revenue +4.0% +243
EBITDA +4.3% +32
Current EBIT +3.2% +11
Net Debt vs. Dec.2014 +6.9% (574)
Net Debt vs. March 2014 (964)
VEOLIA KEY FIGURES AS OF MARCH 31, 2015
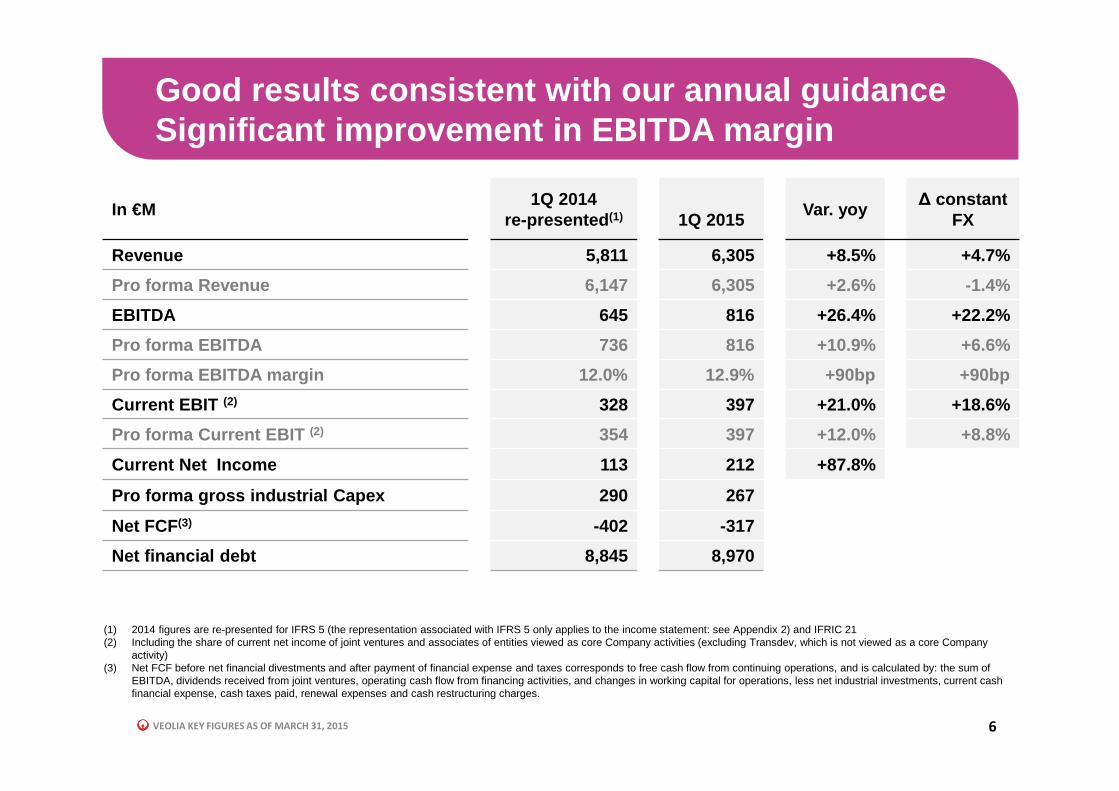
Good results consistent with our annual guidanceSignificant improvement in EBITDA margin
6
In €M 1Q 2014
re-presented (1) 1Q 2015 Var. yoy
∆ constant FX
Revenue 5,811 6,305 +8.5% +4.7%
Pro forma Revenue 6,147 6,305 +2.6% -1.4%
EBITDA 645 816 +26.4% +22.2%
Pro forma EBITDA 736 816 +10.9% +6.6%
Pro forma EBITDA margin 12.0% 12.9% +90bp +90bp
Current EBIT (2) 328 397 +21.0% +18.6%
Pro forma Current EBIT (2) 354 397 +12.0% +8.8%
Current Net Income 113 212 +87.8%
Pro forma gross industrial Capex 290 267
Net FCF(3) -402 -317
Net financial debt 8,845 8,970
(1) 2014 figures are re-presented for IFRS 5 (the representation associated with IFRS 5 only applies to the income statement: see Appendix 2) and IFRIC 21(2) Including the share of current net income of joint ventures and associates of entities viewed as core Company activities (excluding Transdev, which is not viewed as a core Company
activity)(3) Net FCF before net financial divestments and after payment of financial expense and taxes corresponds to free cash flow from continuing operations, and is calculated by: the sum of
EBITDA, dividends received from joint ventures, operating cash flow from financing activities, and changes in working capital for operations, less net industrial investments, current cash financial expense, cash taxes paid, renewal expenses and cash restructuring charges.
VEOLIA KEY FIGURES AS OF MARCH 31, 2015
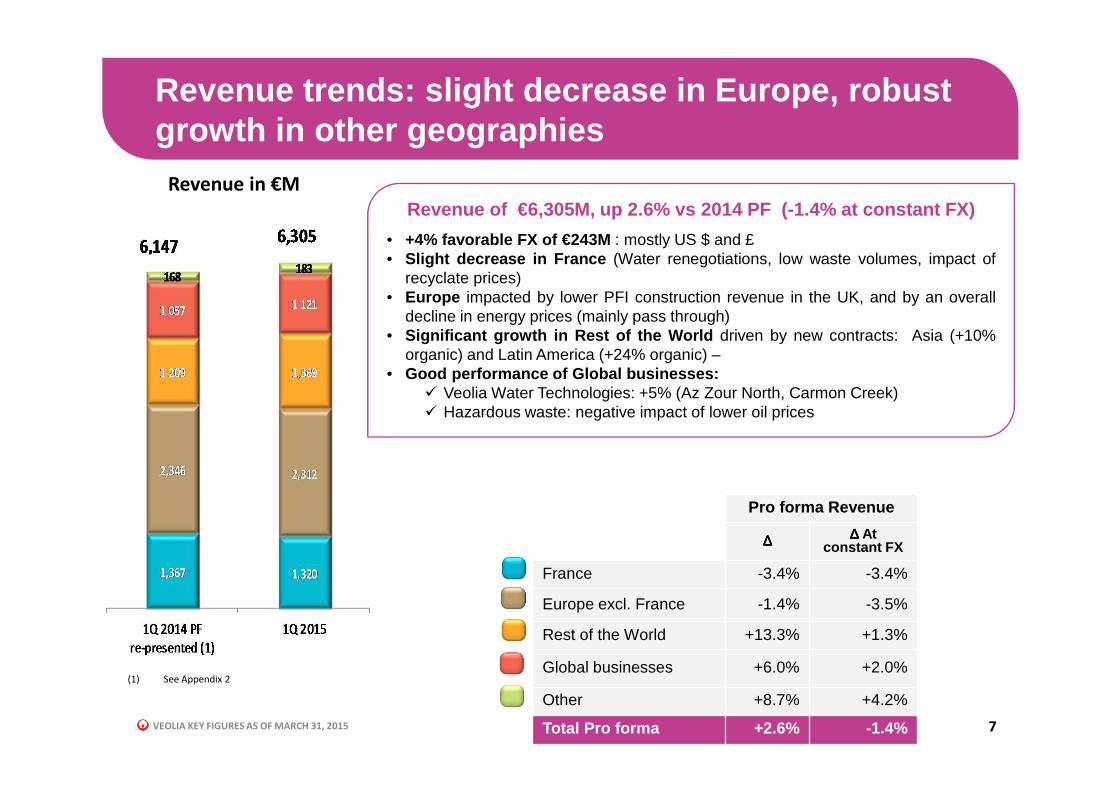
Revenue trends: slight decrease in Europe, robust growth in other geographies
7
Pro forma Revenue
∆∆∆∆ ∆∆∆∆ At constant FX
France -3.4% -3.4%
Europe excl. France -1.4% -3.5%
Rest of the World +13.3% +1.3%
Global businesses +6.0% +2.0%
Other +8.7% +4.2%
Total Pro forma +2.6% -1.4%
(1) See Appendix 2
Revenue in €M
Revenue of €6,305M, up 2.6% vs 2014 PF (-1.4% at constant FX)
• +4% favorable FX of €243M : mostly US $ and £• Slight decrease in France (Water renegotiations, low waste volumes, impact of
recyclate prices)• Europe impacted by lower PFI construction revenue in the UK, and by an overall
decline in energy prices (mainly pass through)• Significant growth in Rest of the World driven by new contracts: Asia (+10%
organic) and Latin America (+24% organic) –• Good performance of Global businesses:
� Veolia Water Technologies: +5% (Az Zour North, Carmon Creek)� Hazardous waste: negative impact of lower oil prices
VEOLIA KEY FIGURES AS OF MARCH 31, 2015
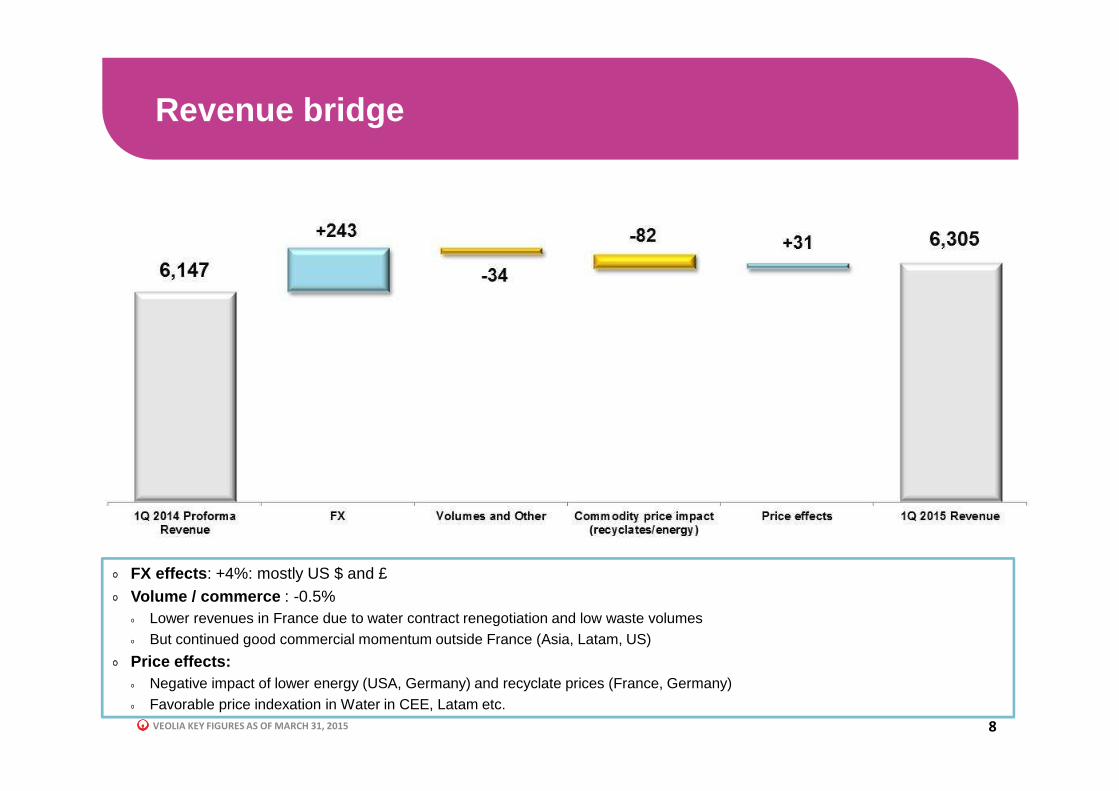
Revenue bridge
8
FX effects : +4%: mostly US $ and £Volume / commerce : -0.5%
Lower revenues in France due to water contract renegotiation and low waste volumesBut continued good commercial momentum outside France (Asia, Latam, US)
Price effects:Negative impact of lower energy (USA, Germany) and recyclate prices (France, Germany)Favorable price indexation in Water in CEE, Latam etc.
VEOLIA KEY FIGURES AS OF MARCH 31, 2015
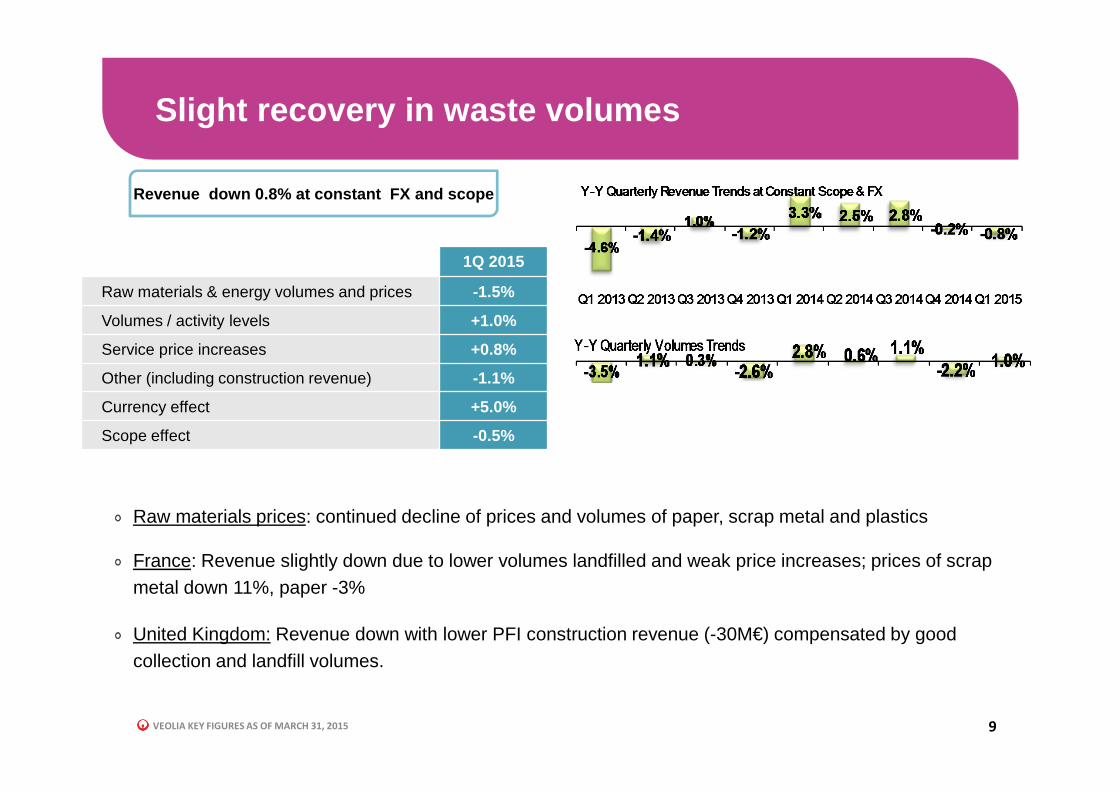
Slight recovery in waste volumes
9
1Q 2015
Raw materials & energy volumes and prices -1.5%
Volumes / activity levels +1.0%
Service price increases +0.8%
Other (including construction revenue) -1.1%
Currency effect +5.0%
Scope effect -0.5%
Raw materials prices: continued decline of prices and volumes of paper, scrap metal and plastics
France: Revenue slightly down due to lower volumes landfilled and weak price increases; prices of scrap metal down 11%, paper -3%
United Kingdom: Revenue down with lower PFI construction revenue (-30M€) compensated by good collection and landfill volumes.
Revenue down 0.8% at constant FX and scope
VEOLIA KEY FIGURES AS OF MARCH 31, 2015
A strong start to the year: EBITDA up 10.9% on PF 2014 (1/2)
10
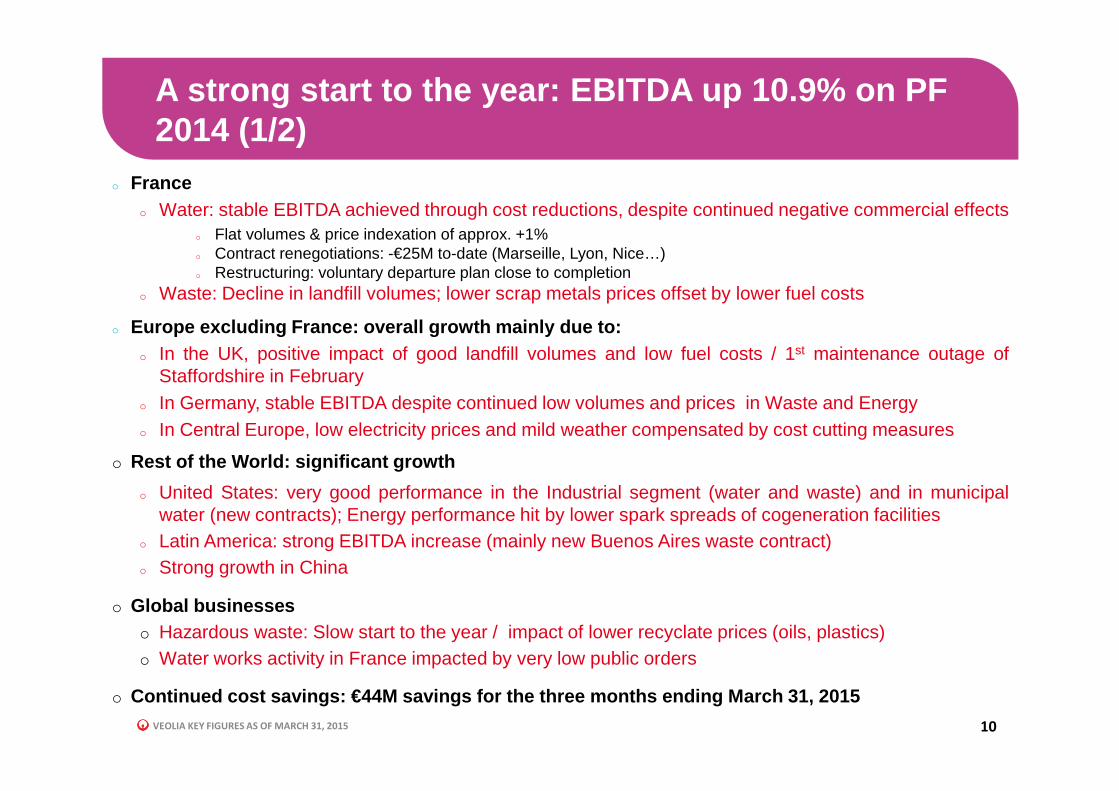
o Franceo Water: stable EBITDA achieved through cost reductions, despite continued negative commercial effects
o Flat volumes & price indexation of approx. +1%o Contract renegotiations: -€25M to-date (Marseille, Lyon, Nice…)o Restructuring: voluntary departure plan close to completion
o Waste: Decline in landfill volumes; lower scrap metals prices offset by lower fuel costs
o Europe excluding France: overall growth mainly due to:o In the UK, positive impact of good landfill volumes and low fuel costs / 1st maintenance outage of
Staffordshire in Februaryo In Germany, stable EBITDA despite continued low volumes and prices in Waste and Energyo In Central Europe, low electricity prices and mild weather compensated by cost cutting measures
o Rest of the World: significant growth
o United States: very good performance in the Industrial segment (water and waste) and in municipalwater (new contracts); Energy performance hit by lower spark spreads of cogeneration facilities
o Latin America: strong EBITDA increase (mainly new Buenos Aires waste contract)o Strong growth in China
o Global businesseso Hazardous waste: Slow start to the year / impact of lower recyclate prices (oils, plastics)o Water works activity in France impacted by very low public orders
o Continued cost savings: €44M savings for the three months en ding March 31, 2015
VEOLIA KEY FIGURES AS OF MARCH 31, 2015
A strong start to the year: EBITDA up 10.9% on PF 2014 (2/2)
11
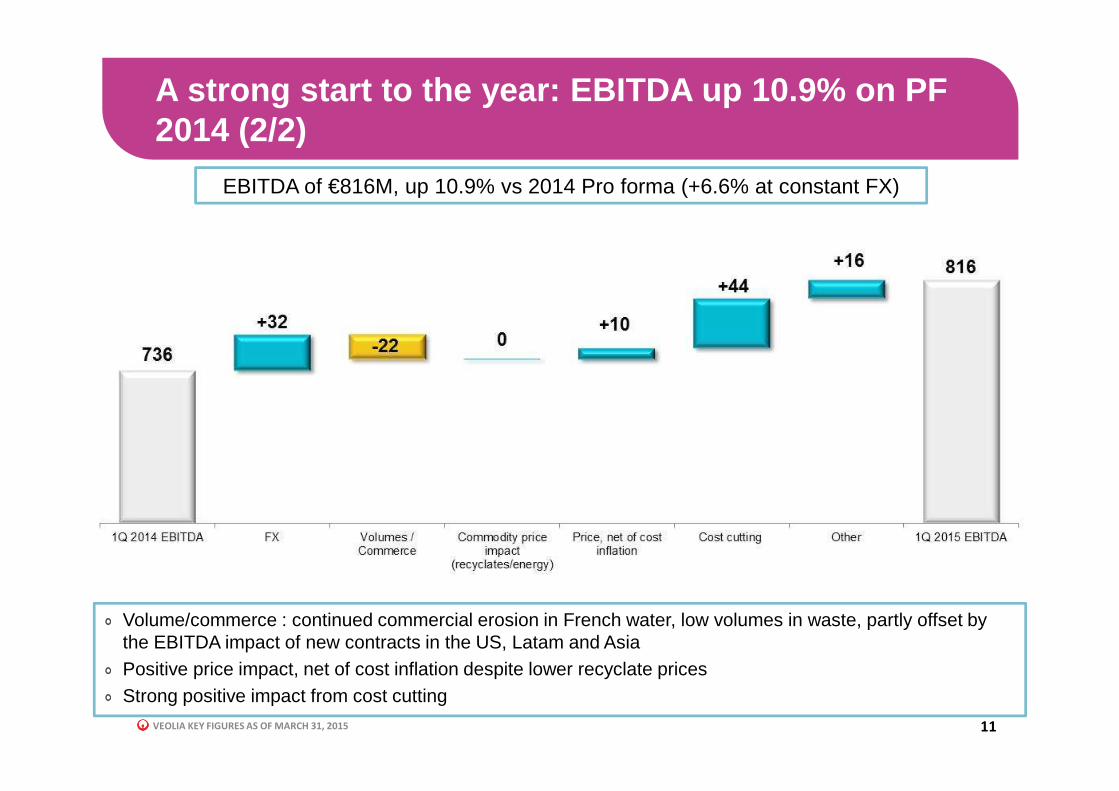
Volume/commerce : continued commercial erosion in French water, low volumes in waste, partly offset by the EBITDA impact of new contracts in the US, Latam and AsiaPositive price impact, net of cost inflation despite lower recyclate pricesStrong positive impact from cost cutting
EBITDA of €816M, up 10.9% vs 2014 Pro forma (+6.6% at constant FX)
VEOLIA KEY FIGURES AS OF MARCH 31, 2015
Cost savings: delivery on track
12
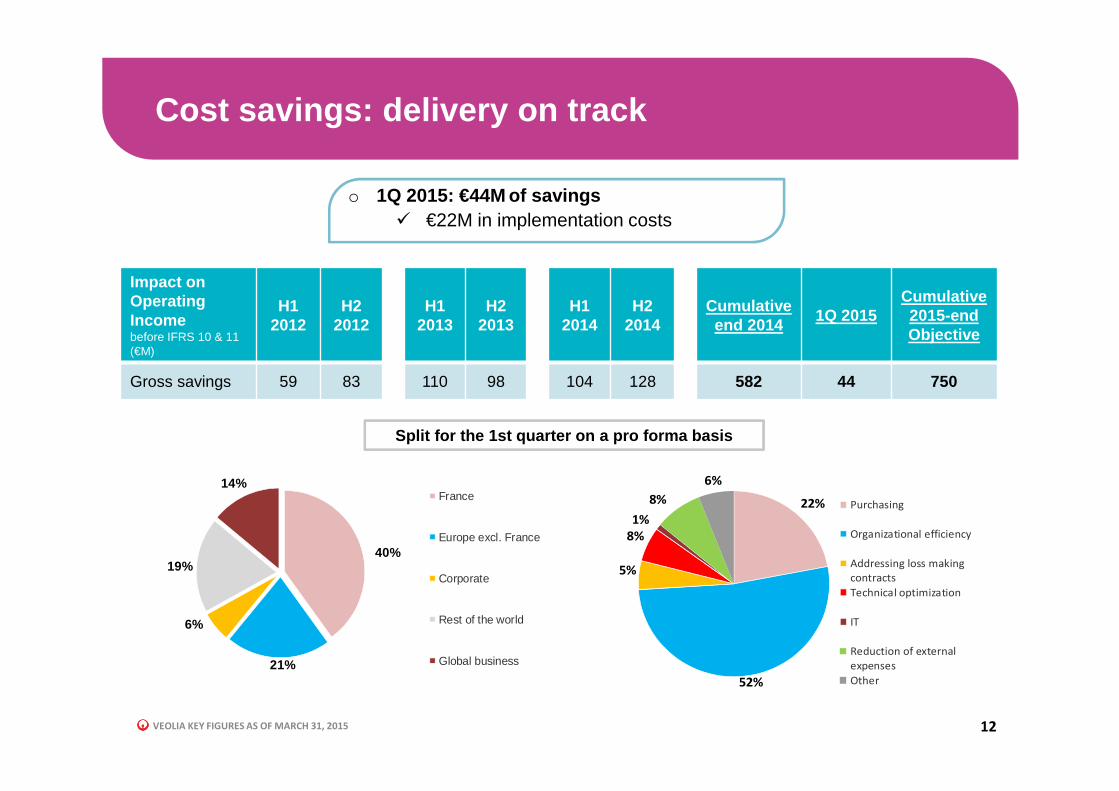
o 1Q 2015: €44M of savings � €22M in implementation costs
22%
52%
5%
8%
1%
8%
6%
Purchasing
Organizational efficiency
Addressing loss making
contracts
Technical optimization
IT
Reduction of external
expenses
Other
Split for the 1st quarter on a pro forma basis
Impact on Operating Income before IFRS 10 & 11 (€M)
H1 2012
H2 2012
H1 2013
H2 2013
H1 2014
H2 2014
Cumulative end 2014
1Q 2015Cumulative 2015-end Objective
Gross savings 59 83 110 98 104 128 582 44 750
40%
21%
6%
19%
14%France
Europe excl. France
Corporate
Rest of the world
Global business
VEOLIA KEY FIGURES AS OF MARCH 31, 2015
A good start to the year: Current EBIT up 12.0% -Current Net Income up 87.8% vs. 2014
13
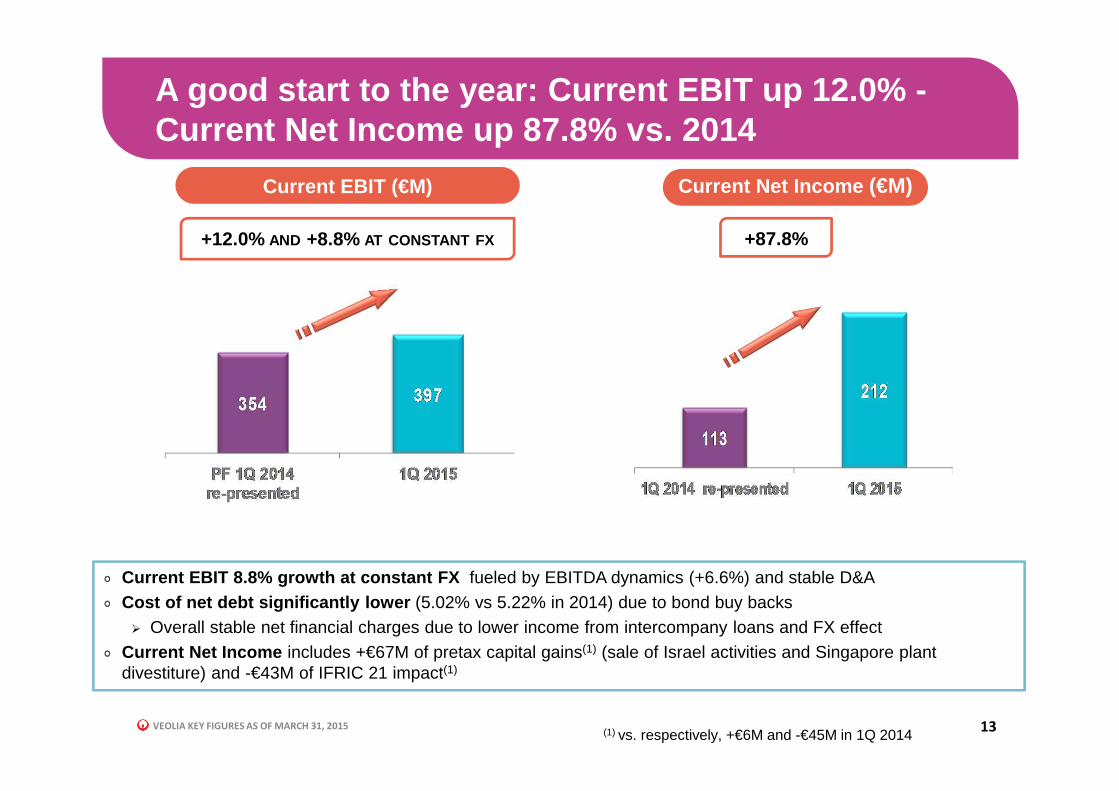
+87.8%+12.0% AND +8.8% AT CONSTANT FX
Current EBIT (€M) Current Net Income (€M)
Current EBIT 8.8% growth at constant FX fueled by EBITDA dynamics (+6.6%) and stable D&A Cost of net debt significantly lower (5.02% vs 5.22% in 2014) due to bond buy backs� Overall stable net financial charges due to lower income from intercompany loans and FX effect
Current Net Income includes +€67M of pretax capital gains(1) (sale of Israel activities and Singapore plant divestiture) and -€43M of IFRIC 21 impact(1)
(1) vs. respectively, +€6M and -€45M in 1Q 2014
VEOLIA KEY FIGURES AS OF MARCH 31, 2015
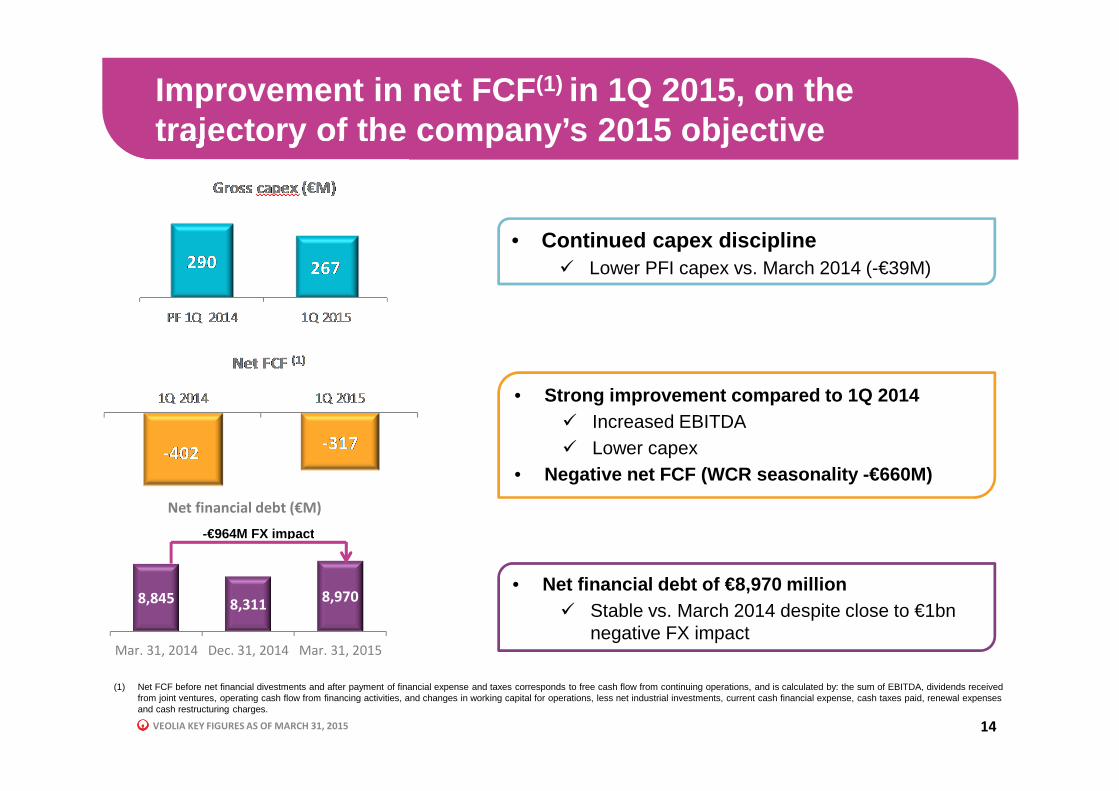
Improvement in net FCF (1) in 1Q 2015, on the trajectory of the company’s 2015 objective
14
• Continued capex discipline� Lower PFI capex vs. March 2014 (-€39M)
• Strong improvement compared to 1Q 2014� Increased EBITDA� Lower capex
• Negative net FCF (WCR seasonality -€660M)
• Net financial debt of €8,970 million� Stable vs. March 2014 despite close to €1bn
negative FX impact
(1) Net FCF before net financial divestments and after payment of financial expense and taxes corresponds to free cash flow from continuing operations, and is calculated by: the sum of EBITDA, dividends received from joint ventures, operating cash flow from financing activities, and changes in working capital for operations, less net industrial investments, current cash financial expense, cash taxes paid, renewal expenses and cash restructuring charges.
8,845 8,3118,970
Mar. 31, 2014 Dec. 31, 2014 Mar. 31, 2015
Net financial debt (€M)
-€964M FX impact
VEOLIA KEY FIGURES AS OF MARCH 31, 2015
Continued successful debt management
15
Veolia continues to manage its debt profile via proactive bo nd buybacksand refinancing…
Successful tender offer for €515M of portion of bonds maturing in 2019, 2021 and2022, following €2.7bn over the last 3 yearsSimultaneous issuance of new €500M bond maturing in 2028 with a 1.59% coupon,the lowest in the company’s history
…allowing the company to smooth its debt profile, increase av erage debtmaturity, all while reducing net financing costs.
Average maturity of net financial debt now 9.3 years, versus 9.0 years at the end of2014
This week S&P reiterated its A-2 / BBB rating for Veolia, and i mproved itsoutlook from negative to stable.
Recognition of the company’s restructuring efforts, improved results, the benefits fromactive debt management and confidence in the company’s strategic outlook.
VEOLIA KEY FIGURES AS OF MARCH 31, 2015
VEOLIA KEY FIGURES AS OF MARCH 31, 2015
2015 Guidance confirmed
16
� Revenue growth
� EBITDA and Current EBIT growth � Continued strong operational performance� Cost savings benefit: continued execution of the €750M cost savings plan
� Continued capex discipline
� 2015 objective confirmed: the dividend and hybrid c oupon payment to be covered by Current Net Income and paid by Free C ash Flow excluding net financial divestments
� Net financial debt under control
VEOLIA KEY FIGURES AS OF MARCH 31, 2015
Appendices
VEOLIA KEY FIGURES AS OF MARCH 31, 2015
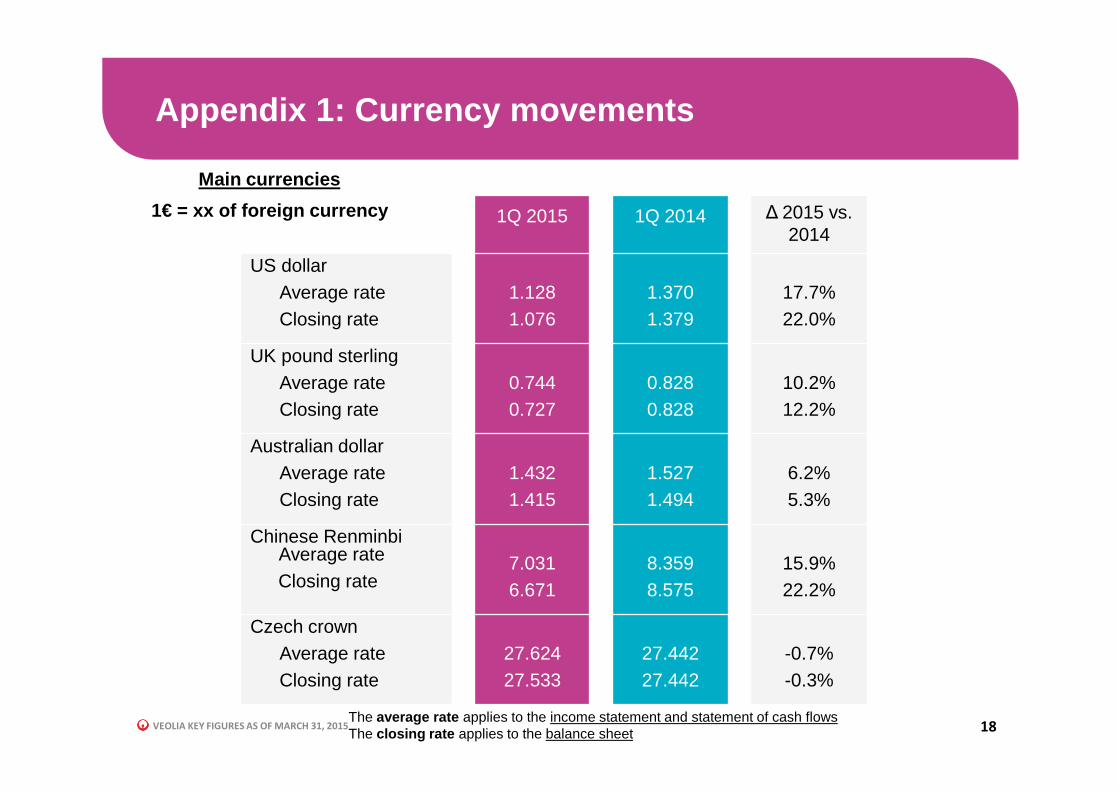
Appendix 1: Currency movements
18
Main currencies
1€ = xx of foreign currency 1Q 2015 1Q 2014 ∆ 2015 vs. 2014
US dollarAverage rateClosing rate
1.1281.076
1.3701.379
17.7%22.0%
UK pound sterlingAverage rateClosing rate
0.7440.727
0.8280.828
10.2%12.2%
Australian dollarAverage rateClosing rate
1.4321.415
1.5271.494
6.2%5.3%
Chinese RenminbiAverage rateClosing rate
7.0316.671
8.3598.575
15.9%22.2%
Czech crownAverage rateClosing rate
27.62427.533
27.44227.442
-0.7%-0.3%
The average rate applies to the income statement and statement of cash flowsThe closing rate applies to the balance sheet
VEOLIA KEY FIGURES AS OF MARCH 31, 2015
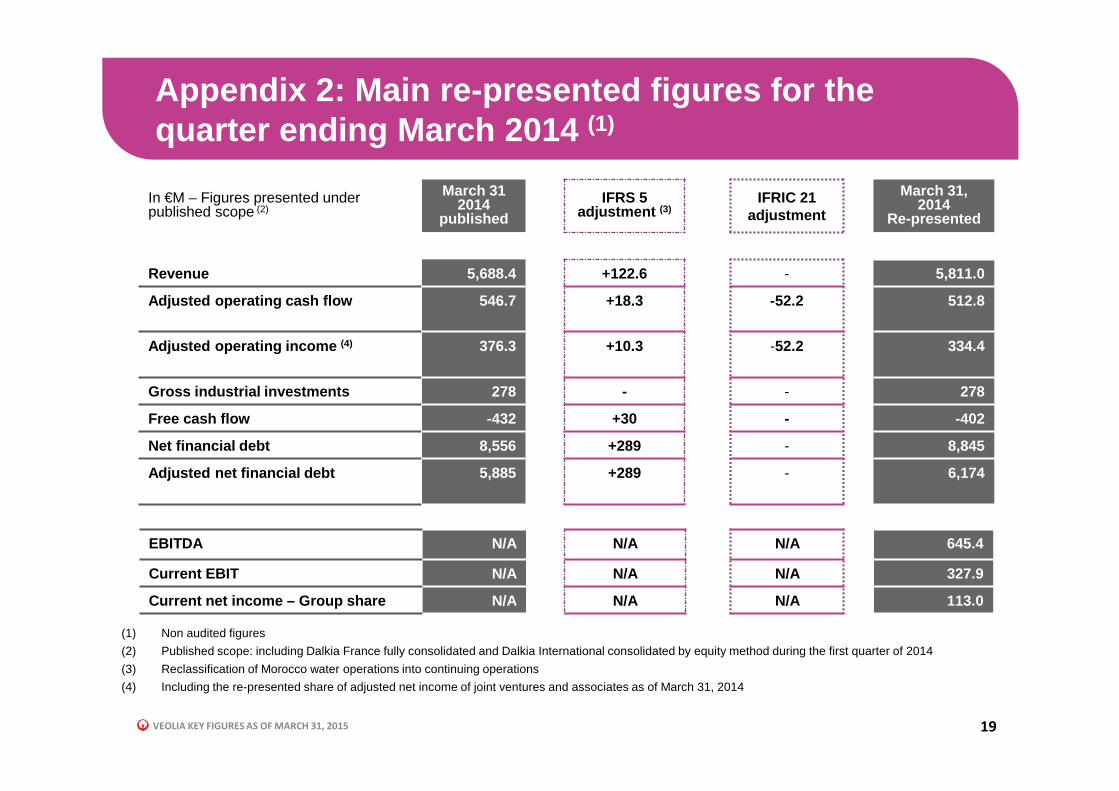
Appendix 2: Main re-presented figures for the quarter ending March 2014 (1)
19
In €M – Figures presented under published scope (2)
March 31 2014
publishedIFRS 5
adjustment (3)IFRIC 21
adjustment
March 31, 2014
Re-presented
Revenue 5,688.4 +122.6 - 5,811.0
Adjusted operating cash flow 546.7 +18.3 -52.2 512.8
Adjusted operating income (4) 376.3 +10.3 -52.2 334.4
Gross industrial investments 278 - - 278
Free cash flow -432 +30 - -402
Net financial debt 8,556 +289 - 8,845
Adjusted net financial debt 5,885 +289 - 6,174
EBITDA N/A N/A N/A 645.4
Current EBIT N/A N/A N/A 327.9
Current net income – Group share N/A N/A N/A 113.0
(1) Non audited figures
(2) Published scope: including Dalkia France fully consolidated and Dalkia International consolidated by equity method during the first quarter of 2014
(3) Reclassification of Morocco water operations into continuing operations
(4) Including the re-presented share of adjusted net income of joint ventures and associates as of March 31, 2014
VEOLIA KEY FIGURES AS OF MARCH 31, 2015
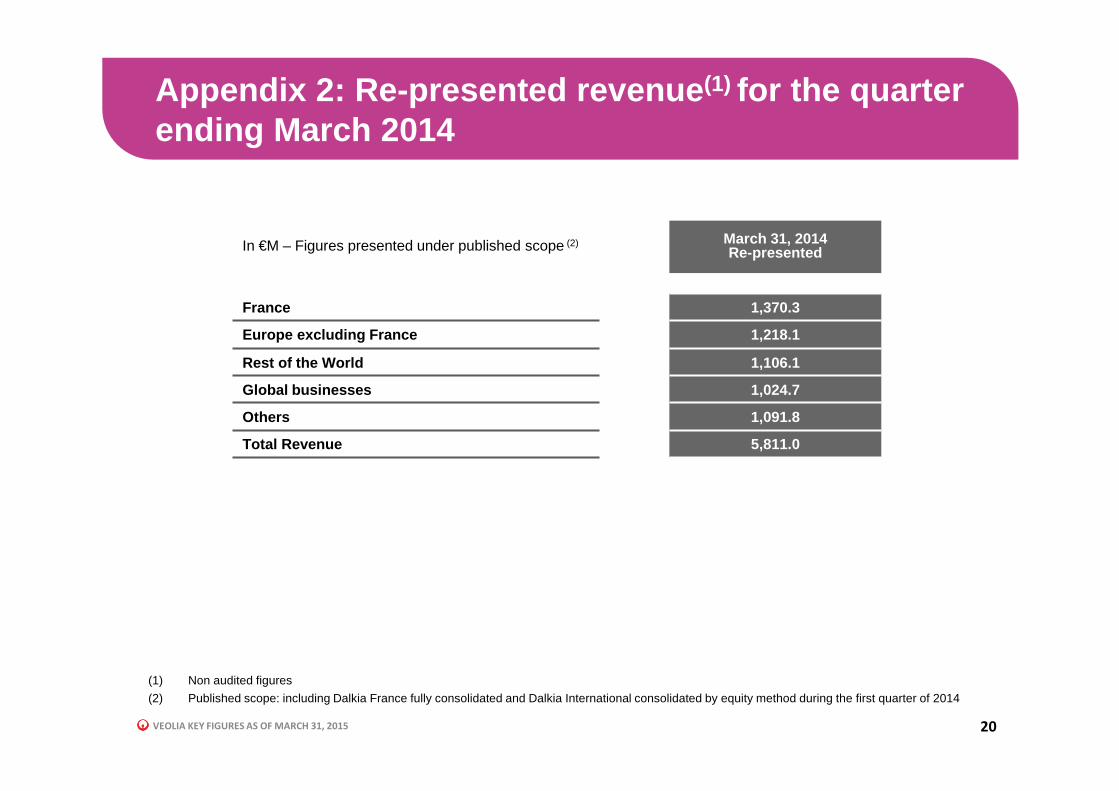
Appendix 2: Re-presented revenue (1) for the quarter ending March 2014
20
In €M – Figures presented under published scope (2) March 31, 2014Re-presented
France 1,370.3
Europe excluding France 1,218.1
Rest of the World 1,106.1
Global businesses 1,024.7
Others 1,091.8
Total Revenue 5,811.0
(1) Non audited figures
(2) Published scope: including Dalkia France fully consolidated and Dalkia International consolidated by equity method during the first quarter of 2014
VEOLIA KEY FIGURES AS OF MARCH 31, 2015
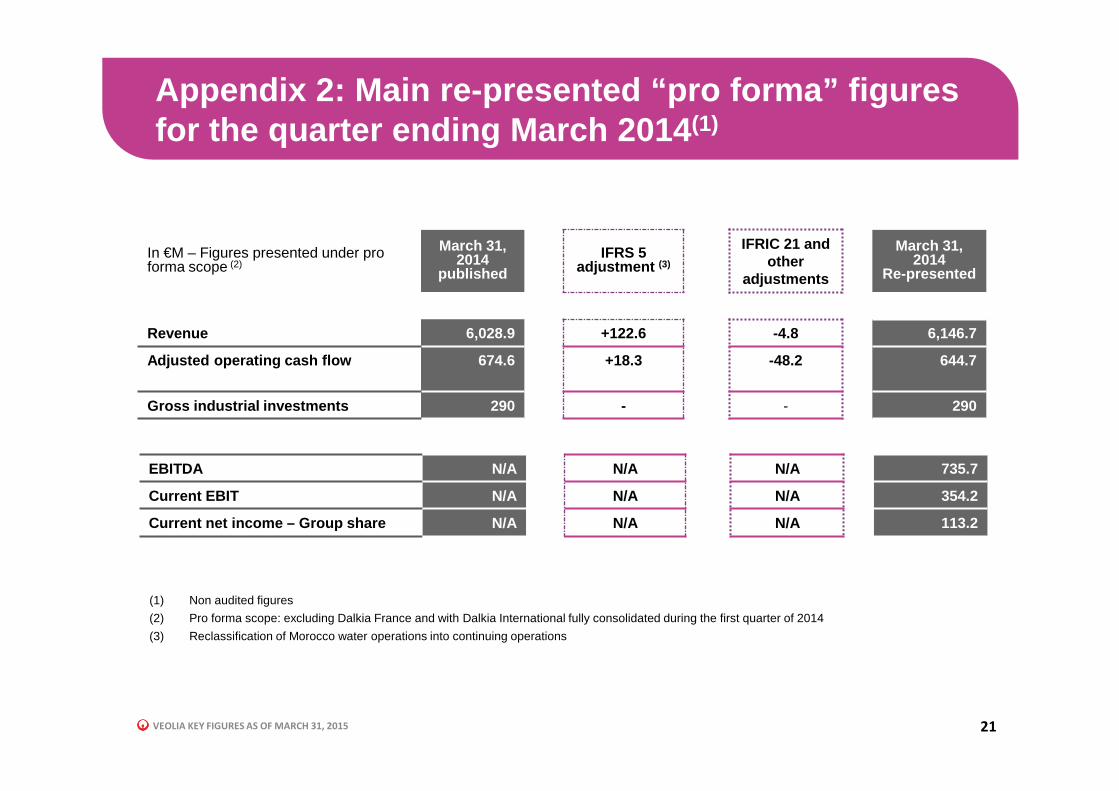
Appendix 2: Main re-presented “pro forma” figures for the quarter ending March 2014 (1)
21
In €M – Figures presented under pro forma scope (2)
March 31, 2014
publishedIFRS 5
adjustment (3)
IFRIC 21 and other
adjustments
March 31, 2014
Re-presented
Revenue 6,028.9 +122.6 -4.8 6,146.7
Adjusted operating cash flow 674.6 +18.3 -48.2 644.7
Gross industrial investments 290 - - 290
EBITDA N/A N/A N/A 735.7
Current EBIT N/A N/A N/A 354.2
Current net income – Group share N/A N/A N/A 113.2
(1) Non audited figures
(2) Pro forma scope: excluding Dalkia France and with Dalkia International fully consolidated during the first quarter of 2014
(3) Reclassification of Morocco water operations into continuing operations
VEOLIA KEY FIGURES AS OF MARCH 31, 2015
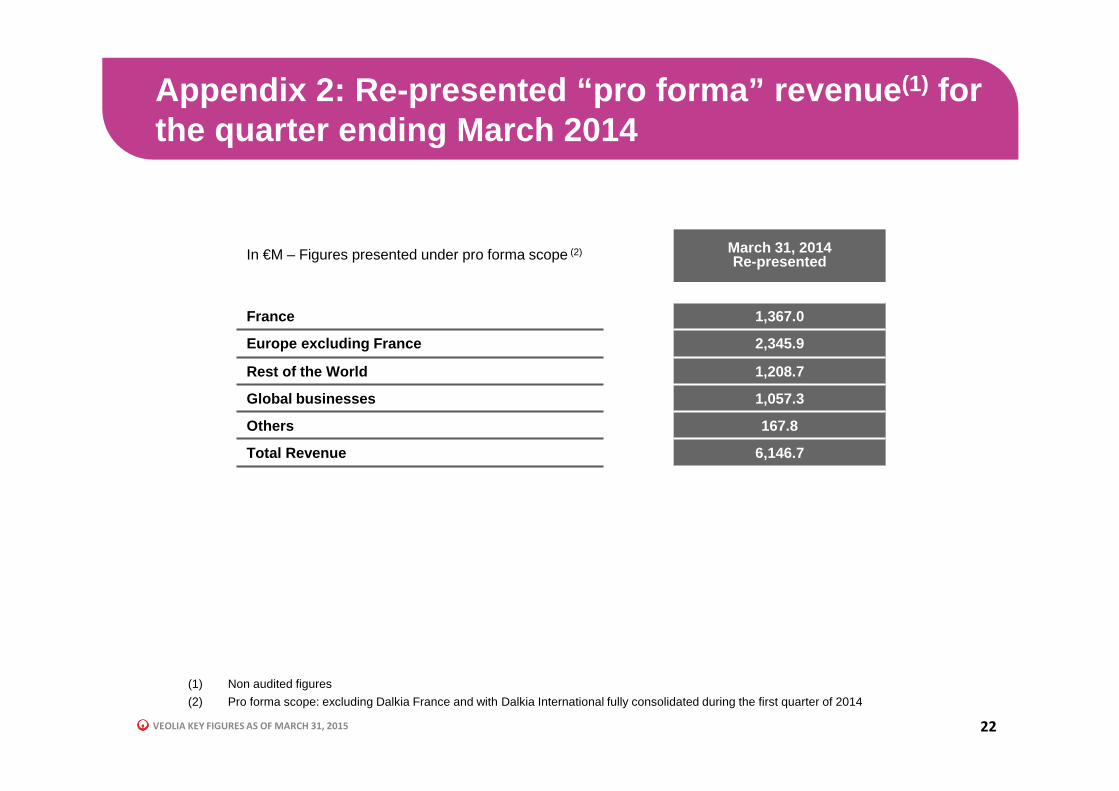
Appendix 2: Re-presented “pro forma” revenue (1) for the quarter ending March 2014
22
In €M – Figures presented under pro forma scope (2) March 31, 2014Re-presented
France 1,367.0
Europe excluding France 2,345.9
Rest of the World 1,208.7
Global businesses 1,057.3
Others 167.8
Total Revenue 6,146.7
(1) Non audited figures
(2) Pro forma scope: excluding Dalkia France and with Dalkia International fully consolidated during the first quarter of 2014
VEOLIA KEY FIGURES AS OF MARCH 31, 2015
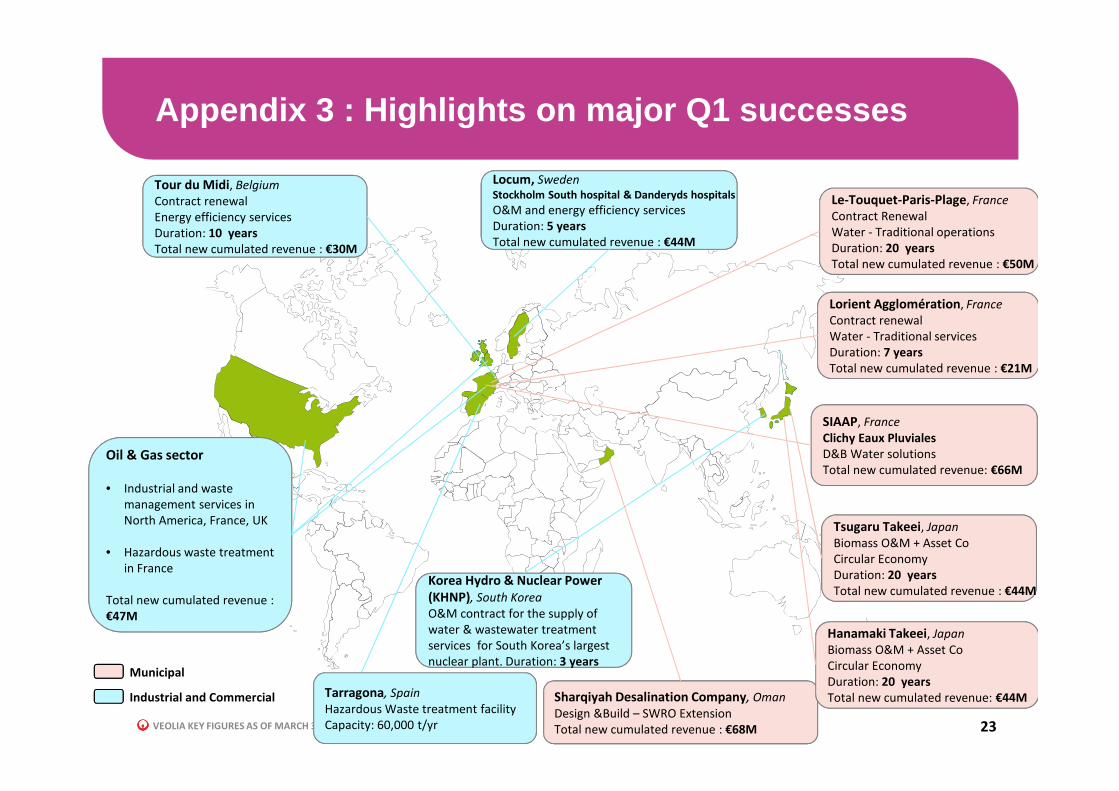
Appendix 3 : Highlights on major Q1 successes
23
Oil & Gas sector
• Industrial and waste
management services in
North America, France, UK
• Hazardous waste treatment
in France
Total new cumulated revenue :
€47M
44M
Tsugaru Takeei, Japan
Biomass O&M + Asset Co
Circular Economy
Duration: 20 years
Total new cumulated revenue : €44M
Sharqiyah Desalination Company, Oman
Design &Build – SWRO Extension
Total new cumulated revenue : €68M
Hanamaki Takeei, Japan
Biomass O&M + Asset Co
Circular Economy
Duration: 20 years
Total new cumulated revenue: €44M
Tour du MidiTour du Midi, Belgium
Contract renewal
Energy efficiency services
Duration: 10 years
Total new cumulated revenue : €30M
SIAAP, France
Clichy Eaux Pluviales
D&B Water solutions
Total new cumulated revenue: €66M
50M
Le-Touquet-Paris-Plage, France
Contract Renewal
Water - Traditional operations
Duration: 20 years
Total new cumulated revenue : €50M
Locum, hospitals
Total new cumulated revenue : €44M
Locum, Sweden
Stockholm South hospital & Danderyds hospitals
O&M and energy efficiency services
Duration: 5 years
Total new cumulated revenue : €44M
Lorient Agglomération, France
Contract renewal
Water - Traditional services
Duration: 7 years
Total new cumulated revenue : €21M
Municipal
Industrial and Commercial Tarragona, Spain
Hazardous Waste treatment facility
Capacity: 60,000 t/yr
Korea Hydro & Nuclear Power
nuclear plant. Duration: 3 years
Korea Hydro & Nuclear Power
(KHNP), South Korea
O&M contract for the supply of
water & wastewater treatment
services for South Korea’s largest
nuclear plant. Duration: 3 years
VEOLIA KEY FIGURES AS OF MARCH 31, 2015
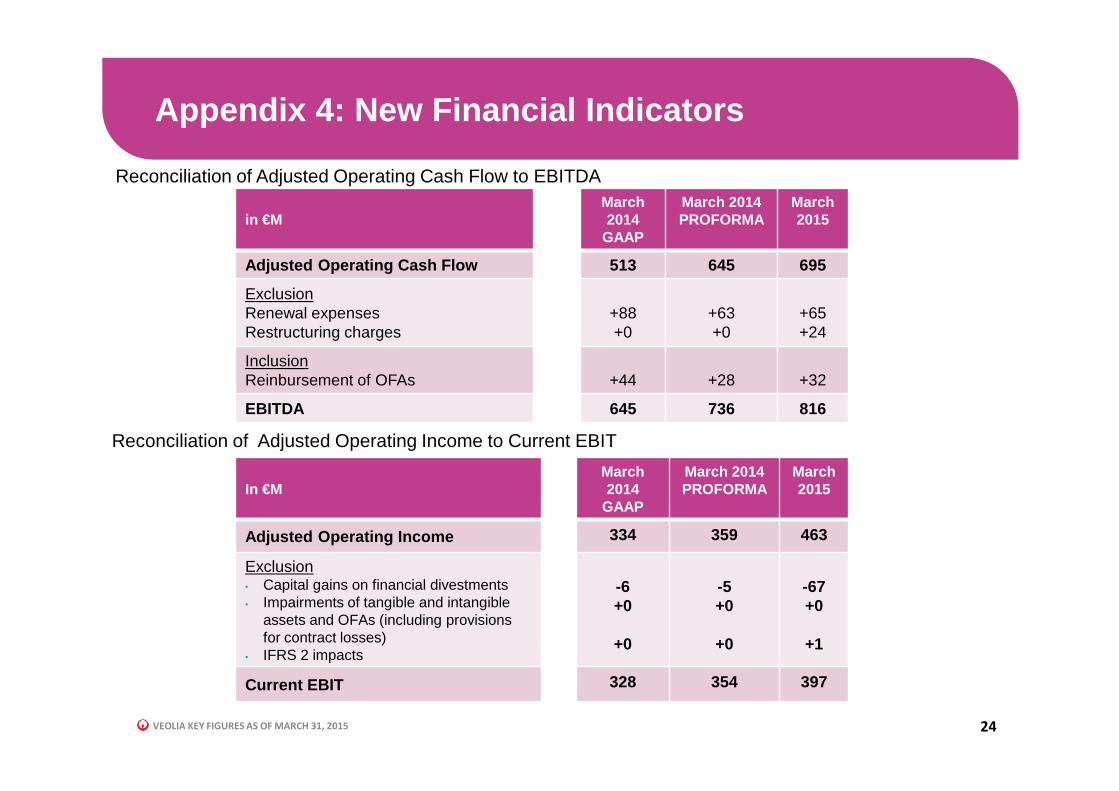
Appendix 4: New Financial Indicators
24
Reconciliation of Adjusted Operating Cash Flow to EBITDA
in €MMarch 2014
GAAP
March 2014 PROFORMA
March 2015
Adjusted Operating Cash Flow 513 645 695
ExclusionRenewal expensesRestructuring charges
+88+0
+63+0
+65+24
InclusionReinbursement of OFAs +44 +28 +32
EBITDA 645 736 816
In €MMarch 2014
GAAP
March 2014 PROFORMA
March2015
Adjusted Operating Income 334 359 463
Exclusion• Capital gains on financial divestments• Impairments of tangible and intangible
assets and OFAs (including provisions for contract losses)
• IFRS 2 impacts
-6+0
+0
-5+0
+0
-67+0
+1
Current EBIT 328 354 397
Reconciliation of Adjusted Operating Income to Current EBIT
VEOLIA KEY FIGURES AS OF MARCH 31, 2015
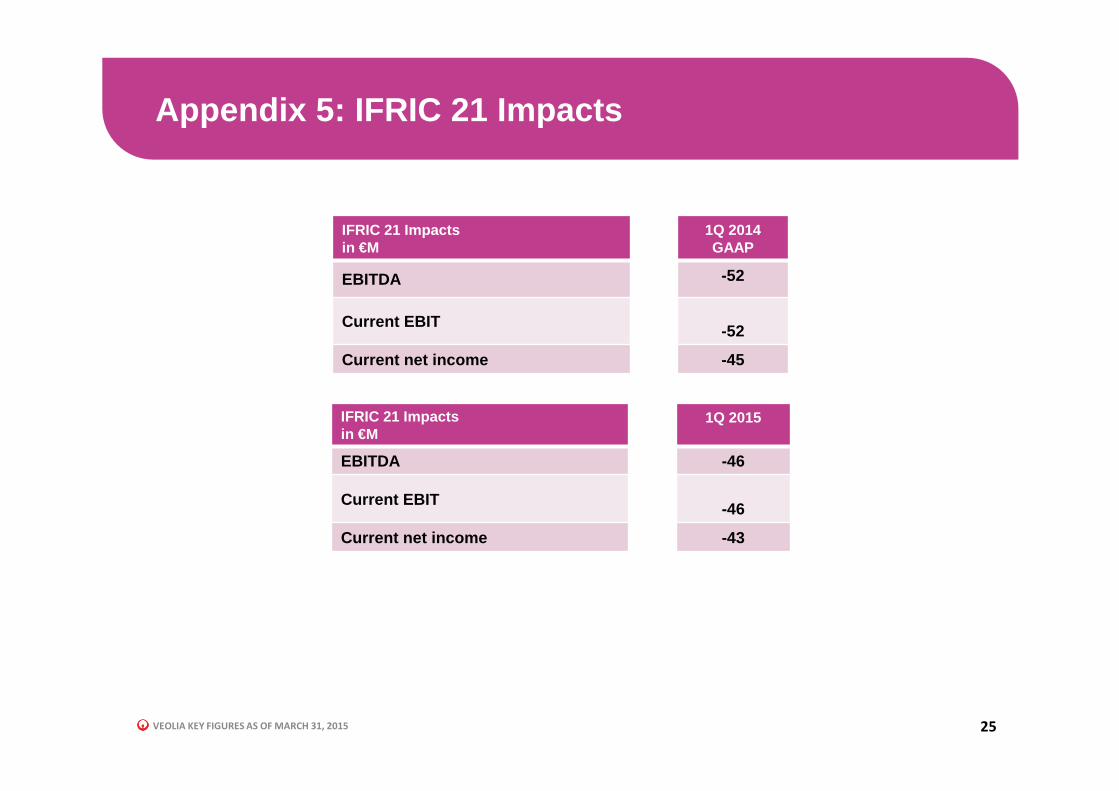
Appendix 5: IFRIC 21 Impacts
25
IFRIC 21 Impactsin €M
1Q 2014 GAAP
EBITDA -52
Current EBIT-52
Current net income -45
IFRIC 21 Impactsin €M
1Q 2015
EBITDA -46
Current EBIT-46
Current net income -43
VEOLIA KEY FIGURES AS OF MARCH 31, 2015
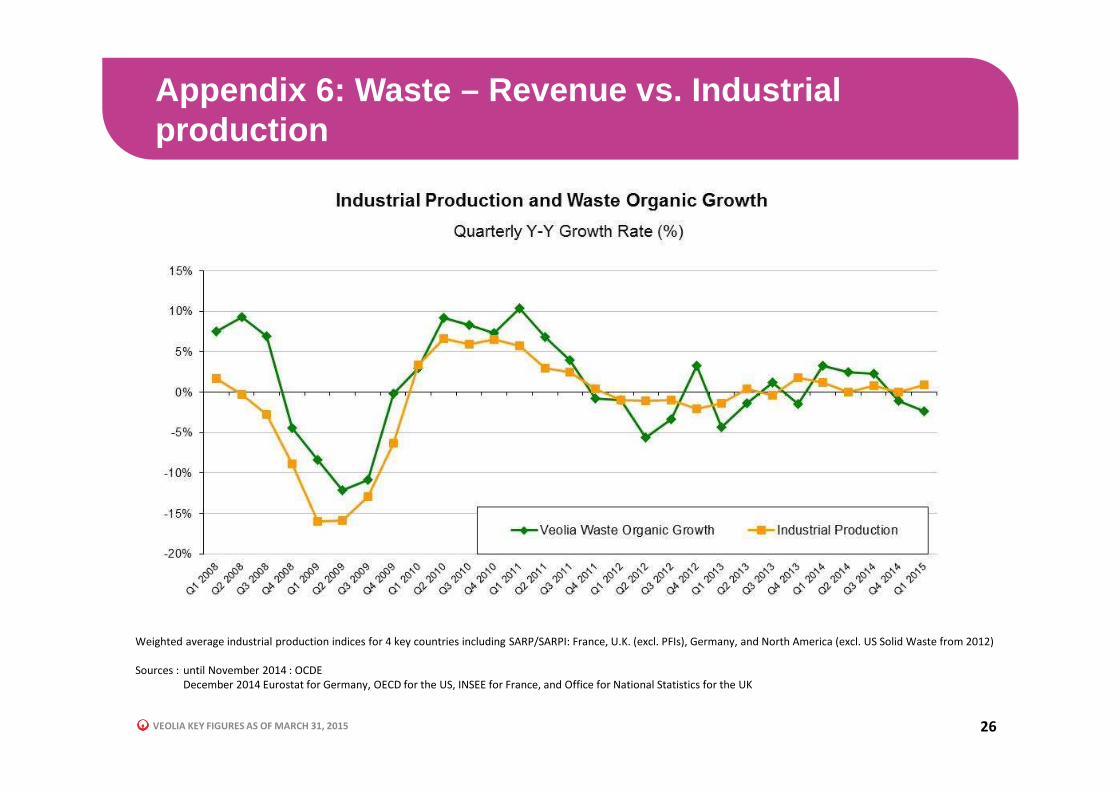
Appendix 6: Waste – Revenue vs. Industrial production
26
Weighted average industrial production indices for 4 key countries including SARP/SARPI: France, U.K. (excl. PFIs), Germany, and North America (excl. US Solid Waste from 2012)
Sources : until November 2014 : OCDE
December 2014 Eurostat for Germany, OECD for the US, INSEE for France, and Office for National Statistics for the UK
VEOLIA KEY FIGURES AS OF MARCH 31, 2015
0
50
100
150
200
250
300
350
400
450
500
0
20
40
60
80
100
120
140
160
180
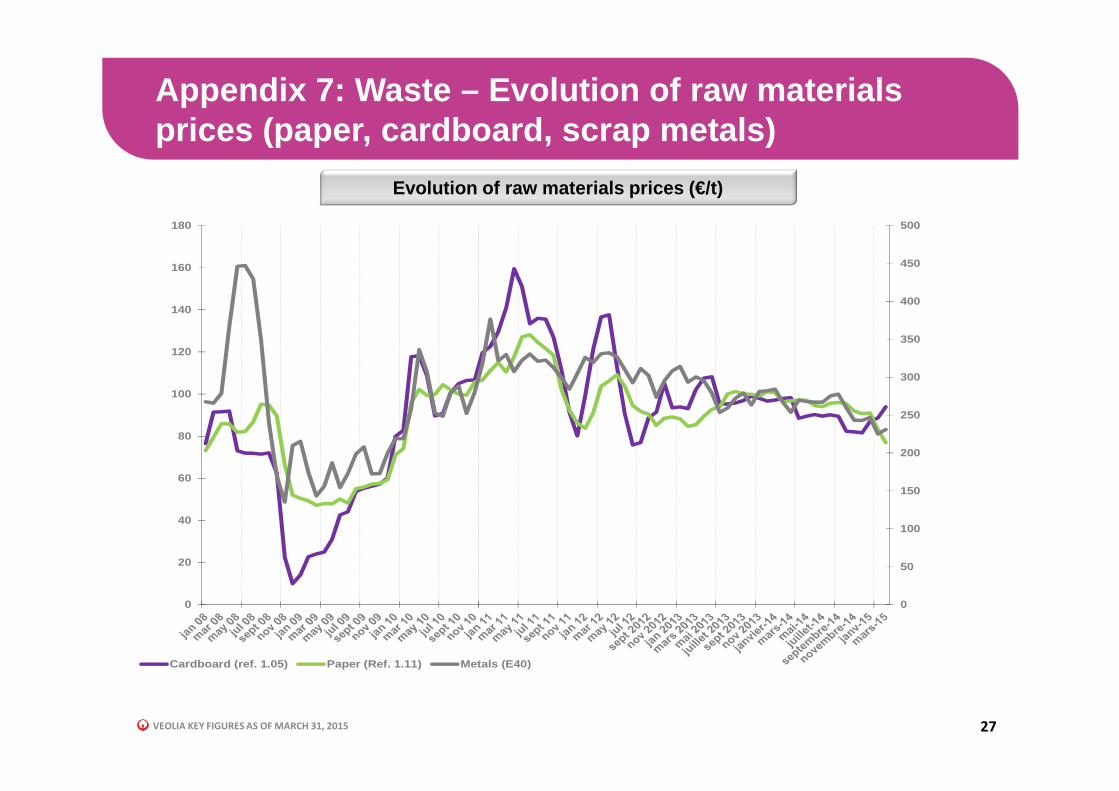
Cardboard (ref. 1.05) Paper (Ref. 1.11) Metals (E40)
Appendix 7: Waste – Evolution of raw materials prices (paper, cardboard, scrap metals)
27
Evolution of raw materials prices (€/t)
VEOLIA KEY FIGURES AS OF MARCH 31, 2015
Investor Relations contact information
28
http://www.finance.veolia.com
Terri Anne PowersDirector of North American Investor Relations
200 East Randolph Street, Suite 7900 - Chicago, IL 60601
Tel : +1 (312) 552 2890
Fax : +1 (312) 552 2866
e-mail : [email protected]
Ariane de Lamaze
Téléphone : +33 1 71 75 06 00
Fax : +33 1 71 75 10 12
e-mail : [email protected]
38, avenue Kléber - 75116 Paris - France
Ronald Wasylec
Senior Vice President, Investor Relations
Téléphone : +33 1 71 75 12 23
e-mail : [email protected]