Embed Size (px)
Citation preview
NYSE: AWK
American Water
Durgesh ChopraDirector Investor Relations
January 2015
NYSE: AWK www.amwater.com 2January 2015
Cautionary Statement Concerning Forward-Looking StatementsCertain statements in this presentation are forward-looking statements within the meaning of the safe harbor provisions of the Private Securities Litigation Reform Act of 1995. These forward-looking statements are predictions based on American Water’s current expectations and assumptions regarding future events and may relate to, among other things, its future financial performance, including earnings, growth and portfolio optimization strategies, its ability to finance current operations and growth initiatives, trends in its industry, regulatory or legal developments or rate adjustments. Actual results could differ materially because of factors such as the decisions of governmental and regulatory bodies, including decisions to raise or lower rates; thetimeliness of regulatory commissions’ actions concerning rates; changes in laws, governmental regulations and policies, including environmental, health and water quality, and public utility regulations and policies; the outcome of litigation andgovernment action related to the Freedom Industries chemical spill in West Virginia; weather conditions, patterns or events, including drought or abnormally high rainfall, strong winds and coastal and intercoastal flooding; changes in customer demandfor, and patterns of use of, water, such as may result from conservation efforts; its ability to appropriately maintain current infrastructure and manage the expansion of its business; its ability to obtain permits and other approvals for projects; changes in its capital requirements; its ability to control operating expenses and to achieve efficiencies in its operations; its ability to obtain adequate and cost-effective supplies of chemicals, electricity, fuel, water and other raw materials that are needed for its operations; its ability to successfully acquire and integrate water and wastewater systems that are complementary to its operations and the growth of its business, including, among other core growth opportunities, concession arrangements and agreements for the provision of water services in the unregulated shale arena; cost overruns relating to improvements or the expansion of its operations; changes in general economic, business and financial market conditions; access to sufficient capitalon satisfactory terms; fluctuations in interest rates; restrictive covenants in or changes to the credit ratings on the company’s current or future debt that could increase its financing costs or affect its ability to borrow, make payments on debt or pay dividends; fluctuations in the value of benefit plan assets and liabilities that could increase its cost and funding requirements; migration of customers into or out of its service territories; difficulty in obtaining insurance at acceptable rates and on acceptable terms and conditions; its ability to retain and attract qualified employees; cash impact if the National Labor Relations Board order requiring it to provide back pay to employees in connection with a dispute relating to its national benefits agreements with unions representing Regulated Businesses employees is upheld on appeal; labor actions including work stoppages and strikes; the incurrence of impairment charges; and civil disturbance, terrorist threats or acts, or public apprehension about future disturbances or terrorist threats or acts.
For further information regarding risks and uncertainties associated with American Water’s business, please refer to AmericanWater’s annual, quarterly and current SEC filings. The company undertakes no duty to update any forward-looking statement.
NYSE: AWK www.amwater.com 3January 2015
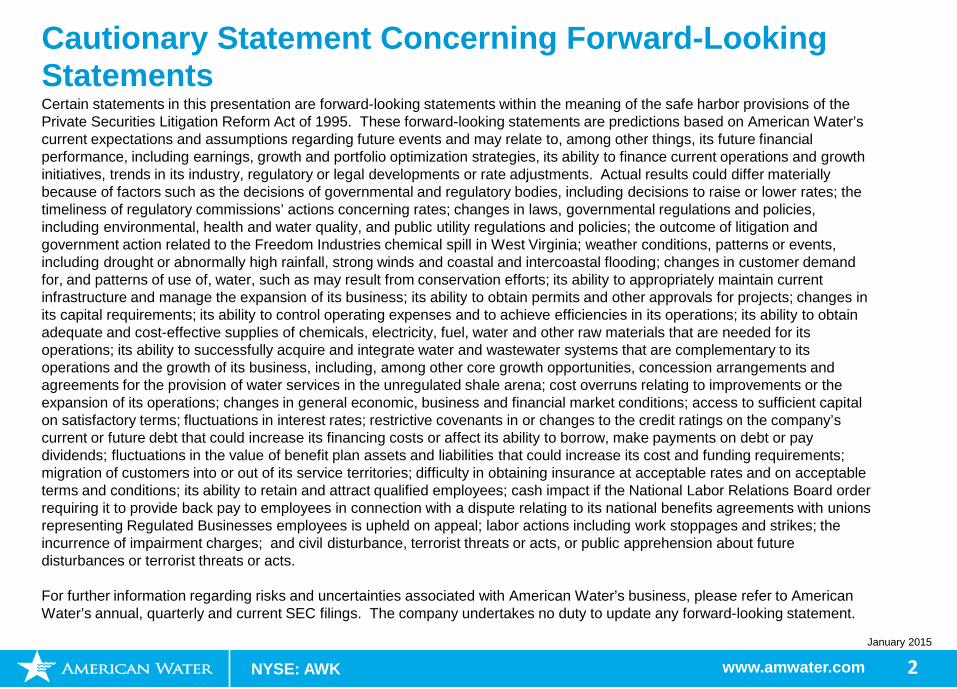
Water Industry Basics: The US Water Industry is highly fragmented and with limited Investor ownership
Percentage of Drinking Water Systems and Population served by Size Class (1)
(Based on 51,988 total water systems in US)
(1) Source: EPA, Drinking and Ground Water Statistics, 2008.
System Size by Population Served
Water
Wastewater
The majority of water systems in the US are owned by capital constrained entities
NYSE: AWK www.amwater.com 4January 2015
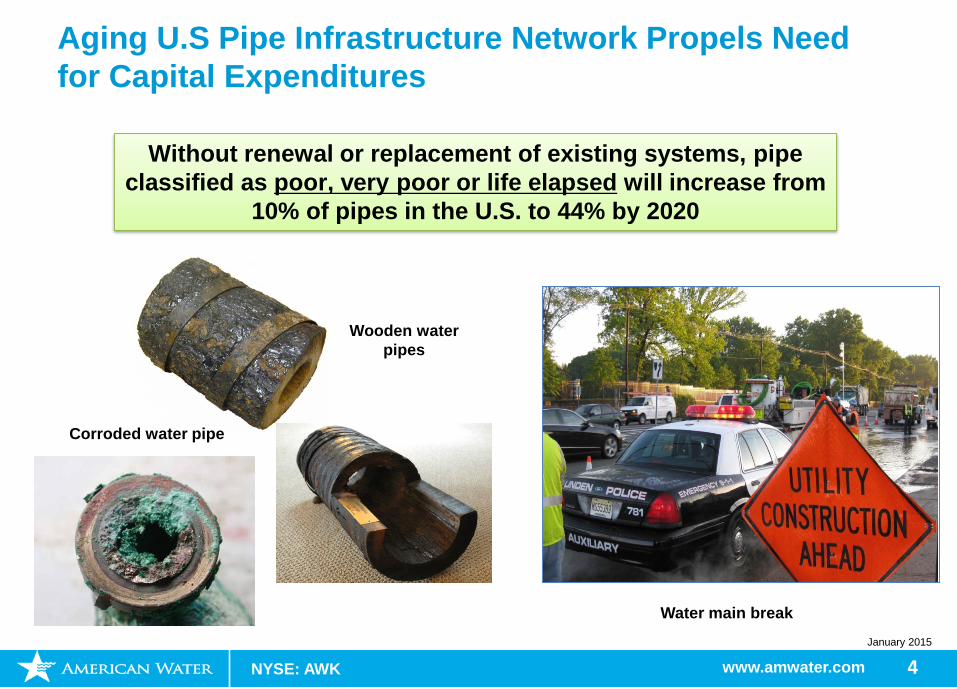
Aging U.S Pipe Infrastructure Network Propels Need for Capital Expenditures
Without renewal or replacement of existing systems, pipe classified as poor, very poor or life elapsed will increase from
10% of pipes in the U.S. to 44% by 2020
Wooden water pipes
Water main break
Corroded water pipe
NYSE: AWK www.amwater.com 5January 2015
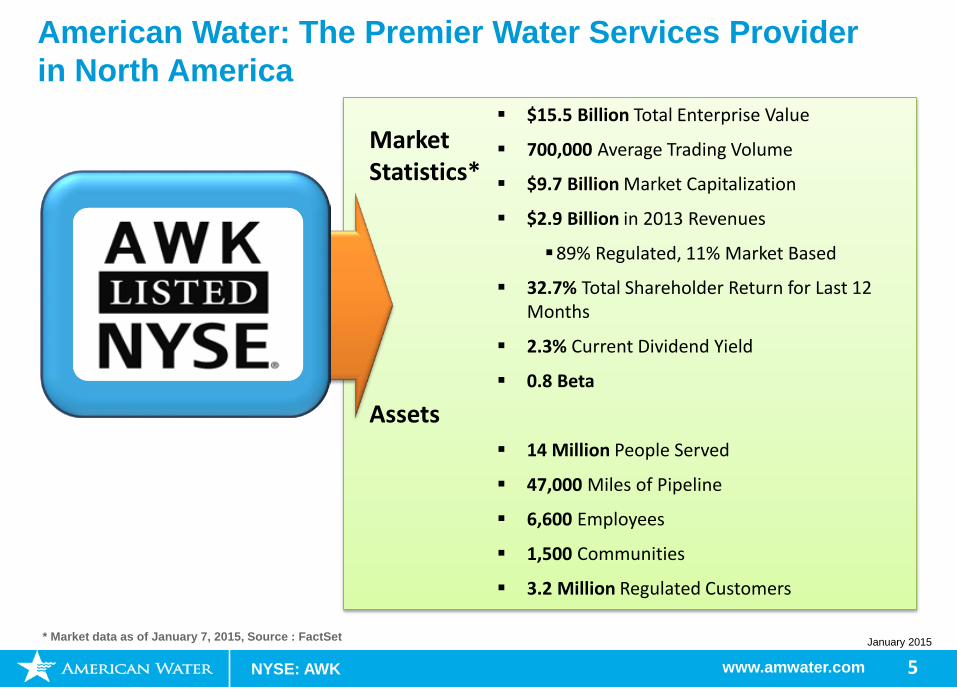
$15.5 Billion Total Enterprise Value
700,000 Average Trading Volume
$9.7 Billion Market Capitalization
$2.9 Billion in 2013 Revenues
89% Regulated, 11% Market Based
32.7% Total Shareholder Return for Last 12 Months
2.3% Current Dividend Yield
0.8 Beta
14 Million People Served
47,000 Miles of Pipeline
6,600 Employees
1,500 Communities
3.2 Million Regulated Customers
American Water: The Premier Water Services Provider in North America
Market Statistics*
Assets
* Market data as of January 7, 2015, Source : FactSet
NYSE: AWK www.amwater.com 6January 2015
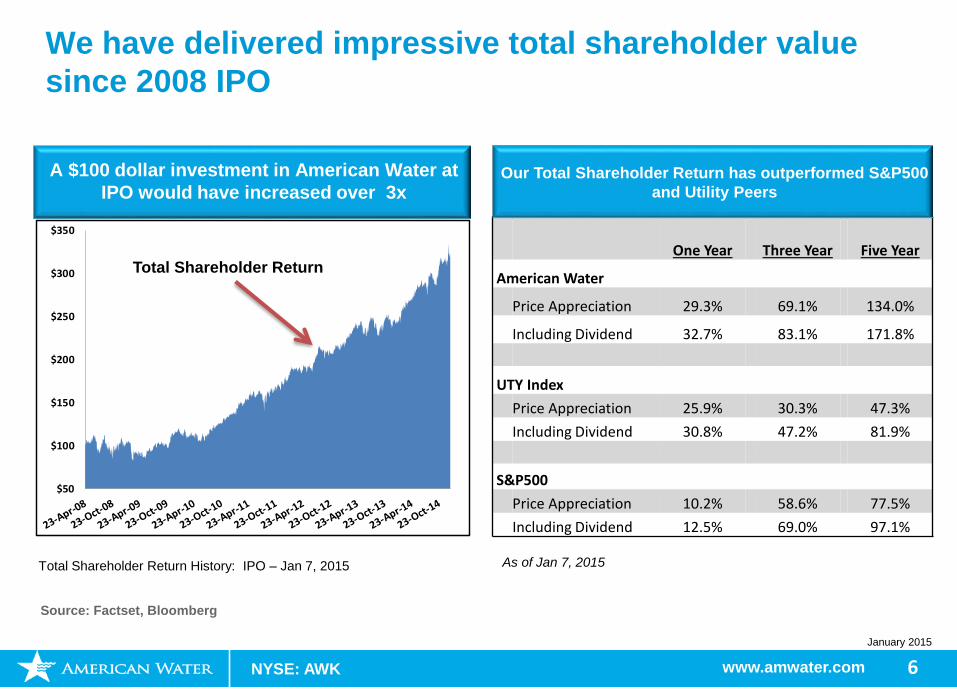
We have delivered impressive total shareholder value since 2008 IPO
Source: Factset, Bloomberg
Total Shareholder Return History: IPO – Jan 7, 2015
Our Total Shareholder Return has outperformed S&P500 and Utility Peers
As of Jan 7, 2015
One Year Three Year Five Year
American Water
Price Appreciation 29.3% 69.1% 134.0%
Including Dividend 32.7% 83.1% 171.8%
UTY IndexPrice Appreciation 25.9% 30.3% 47.3%Including Dividend 30.8% 47.2% 81.9%
S&P500Price Appreciation 10.2% 58.6% 77.5%Including Dividend 12.5% 69.0% 97.1%
A $100 dollar investment in American Water at IPO would have increased over 3x
$50
$100
$150
$200
$250
$300
$350
Total Shareholder Return
NYSE: AWK www.amwater.comJanuary 2015
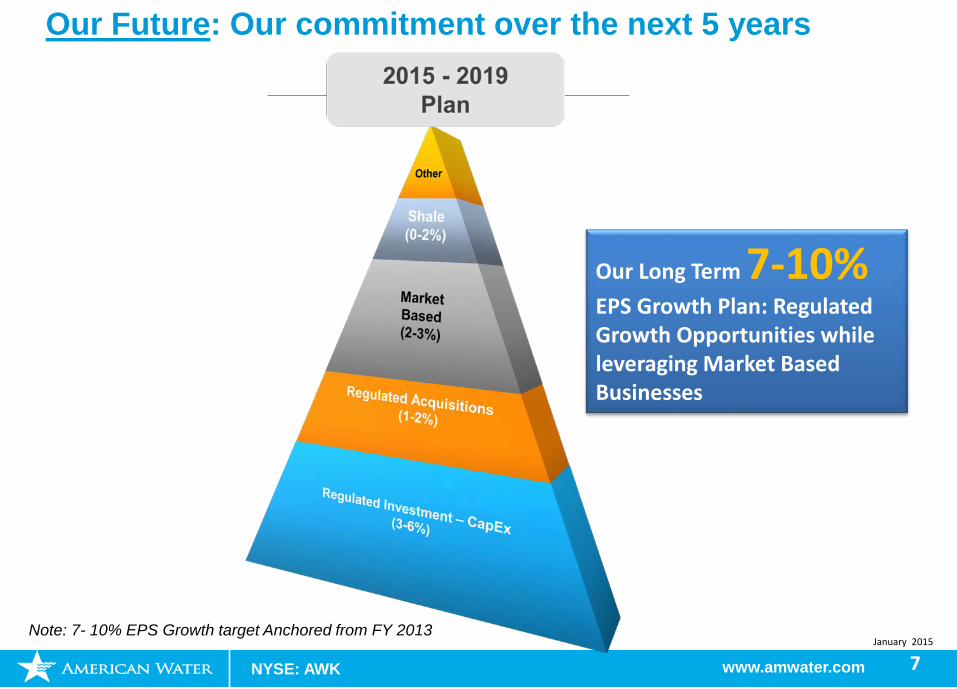
Note: 7- 10% EPS Growth target Anchored from FY 2013
Our Future: Our commitment over the next 5 years
Our Long Term 7-10% EPS Growth Plan: Regulated Growth Opportunities while leveraging Market Based Businesses
7
NYSE: AWK www.amwater.com 8January 2015
All Other
Iowa
New York
Virginia
Tennessee
Kentucky
West Virginia
California
Indiana
Illinois
Missouri
Pennsylvania
New Jersey
57,566195,824
361,864369,892
378,635483,876
549,892644,865
1.2 million1.2 million
1.5 million2.1 million
2.5 million
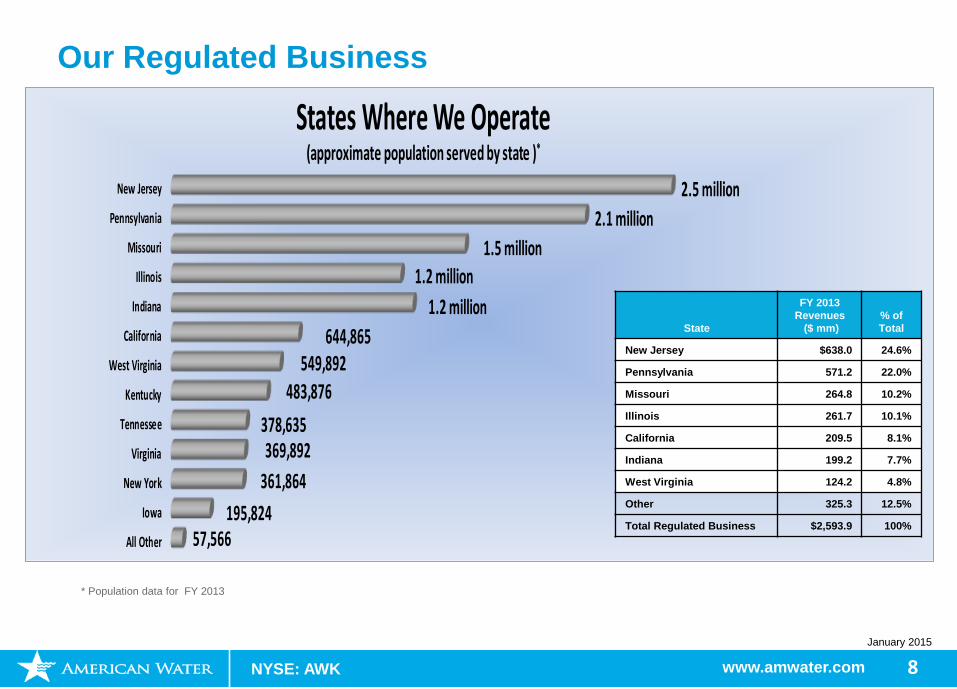
States Where We Operate(approximate population served by state )*
Our Regulated Business
* Population data for FY 2013
State
FY 2013Revenues
($ mm)% of Total
New Jersey $638.0 24.6%
Pennsylvania 571.2 22.0%
Missouri 264.8 10.2%
Illinois 261.7 10.1%
California 209.5 8.1%
Indiana 199.2 7.7%
West Virginia 124.2 4.8%
Other 325.3 12.5%
Total Regulated Business $2,593.9 100%
NYSE: AWK www.amwater.com 9January 2015
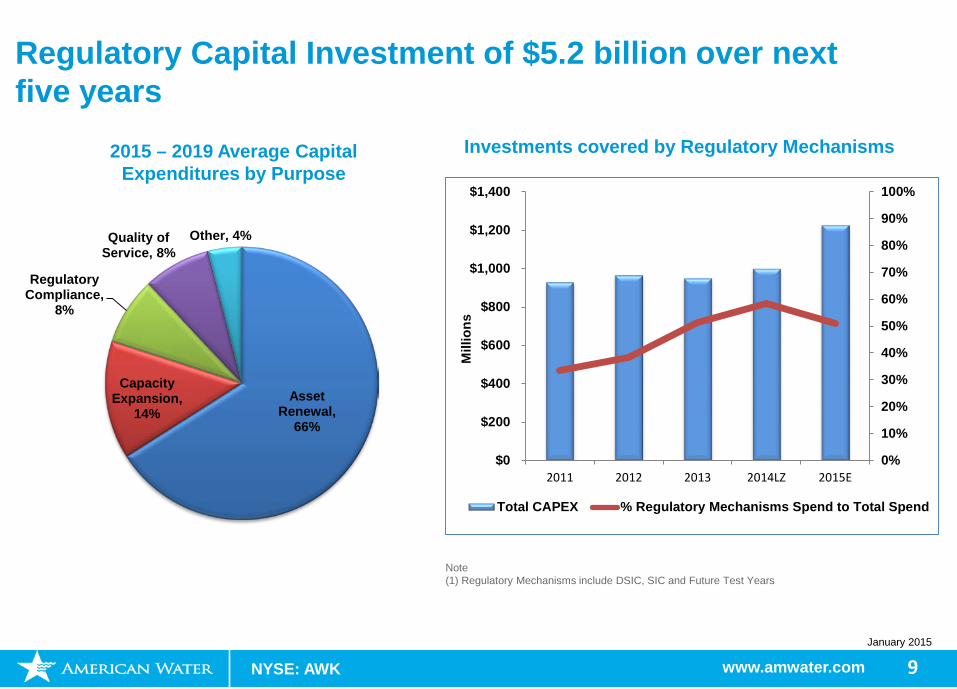
Regulatory Capital Investment of $5.2 billion over next five years
Note (1) Regulatory Mechanisms include DSIC, SIC and Future Test Years
Investments covered by Regulatory Mechanisms 2015 – 2019 Average Capital Expenditures by Purpose
Asset Renewal,
66%
Capacity Expansion,
14%
Regulatory Compliance,
8%
Quality of Service, 8%
Other, 4%
0%
10%
20%
30%
40%
50%
60%
70%
80%
90%
100%
$0
$200
$400
$600
$800
$1,000
$1,200
$1,400
2011 2012 2013 2014LZ 2015EM
illio
ns
Total CAPEX % Regulatory Mechanisms Spend to Total Spend
NYSE: AWK www.amwater.com 10January 2015
0
50
100
150
200
250
300
2010 2011 2012 2013 2014E
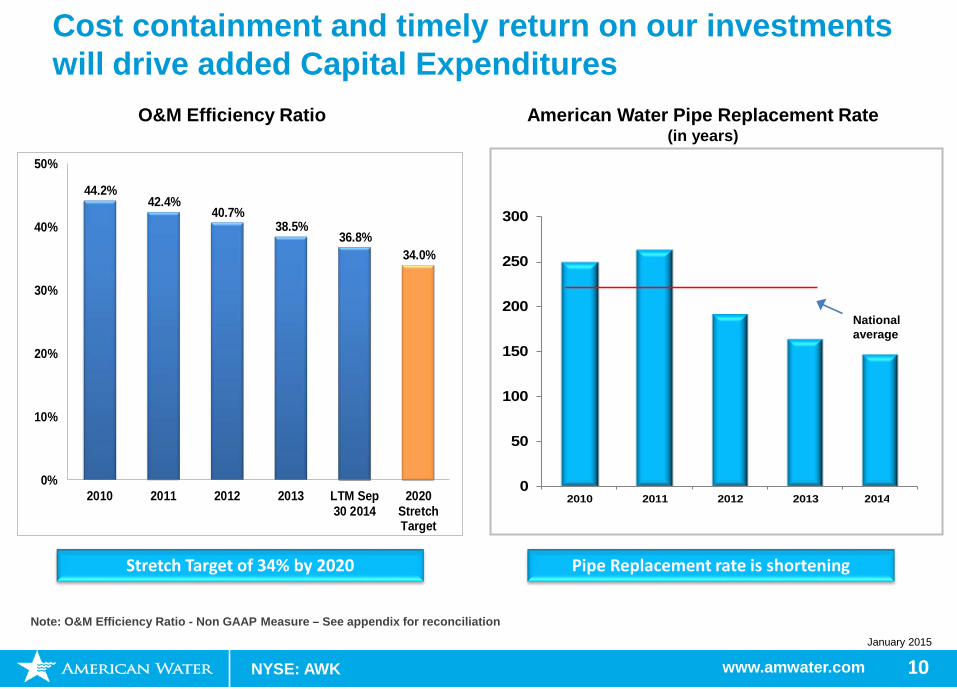
American Water Pipe Replacement Rate(in years)
National average
Stretch Target of 34% by 2020 Pipe Replacement rate is shortening
O&M Efficiency Ratio
44.2%42.4%
40.7%38.5%
36.8%34.0%
0%
10%
20%
30%
40%
50%
2010 2011 2012 2013 LTM Sep30 2014
2020StretchTarget
Note: O&M Efficiency Ratio - Non GAAP Measure – See appendix for reconciliation
Cost containment and timely return on our investments will drive added Capital Expenditures
NYSE: AWK www.amwater.com 11January 2015
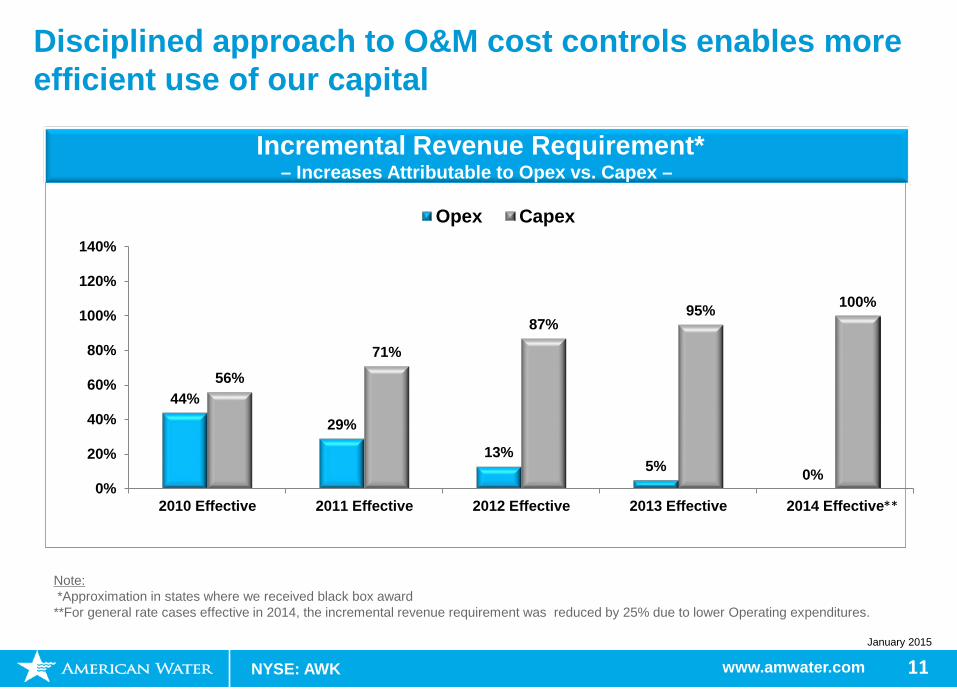
Disciplined approach to O&M cost controls enables more efficient use of our capital
Incremental Revenue Requirement*– Increases Attributable to Opex vs. Capex –
Note:*Approximation in states where we received black box award**For general rate cases effective in 2014, the incremental revenue requirement was reduced by 25% due to lower Operating expenditures.
44%
29%
13%5% 0%
56%
71%
87%95% 100%
0%
20%
40%
60%
80%
100%
120%
140%
2010 Effective 2011 Effective 2012 Effective 2013 Effective 2014 Effective
Opex Capex
**
NYSE: AWK www.amwater.com 12January 2015
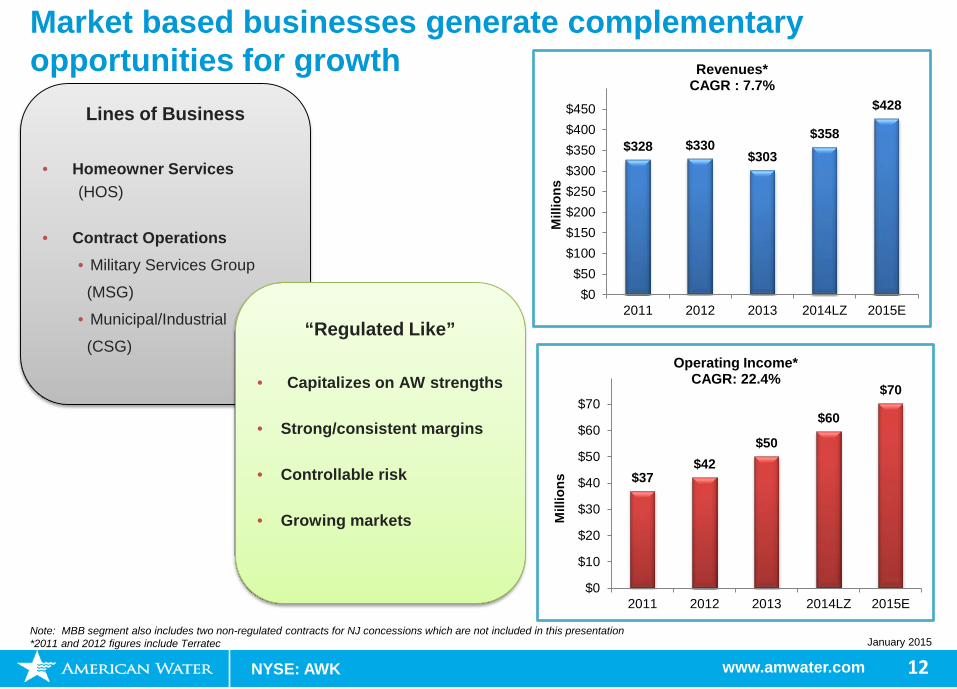
Lines of Business
• Homeowner Services (HOS)
• Contract Operations• Military Services Group
(MSG)
• Municipal/Industrial
(CSG)“Regulated Like”
• Capitalizes on AW strengths
• Strong/consistent margins
• Controllable risk
• Growing markets
Market based businesses generate complementary opportunities for growth
$328 $330$303
$358
$428
$0$50
$100$150$200$250$300$350$400$450
2011 2012 2013 2014LZ 2015E
Mill
ions
Revenues*CAGR : 7.7%
$37$42
$50
$60
$70
$0
$10
$20
$30
$40
$50
$60
$70
2011 2012 2013 2014LZ 2015E
Mill
ions
Operating Income*CAGR: 22.4%
Note: MBB segment also includes two non-regulated contracts for NJ concessions which are not included in this presentation *2011 and 2012 figures include Terratec
NYSE: AWK www.amwater.com 13January 2015
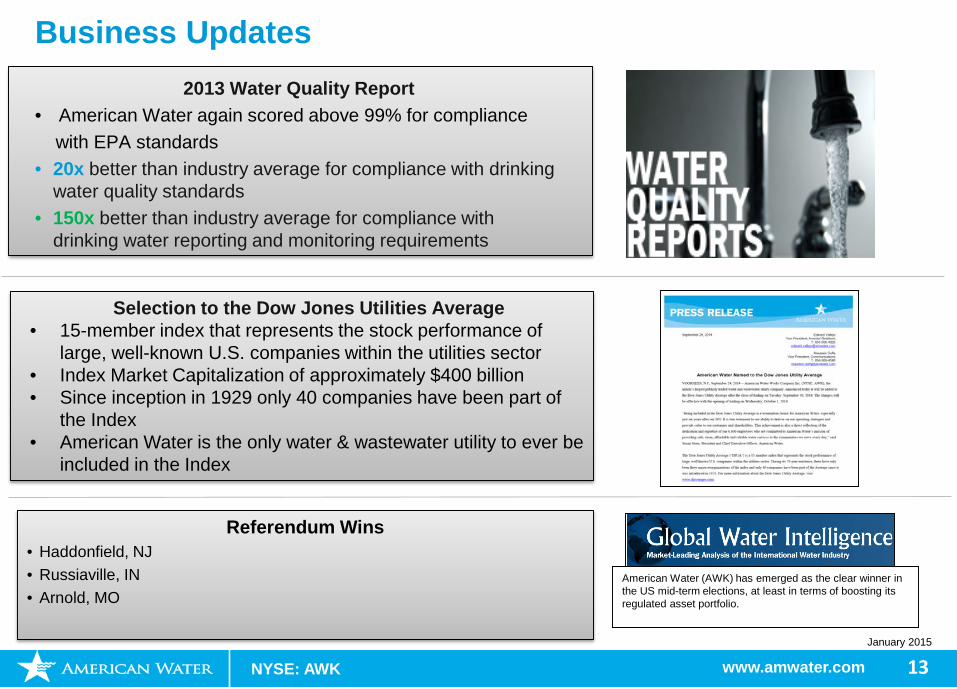
Business Updates2013 Water Quality Report
• American Water again scored above 99% for compliancewith EPA standards
• 20x better than industry average for compliance with drinking water quality standards
• 150x better than industry average for compliance with drinking water reporting and monitoring requirements
Selection to the Dow Jones Utilities Average• 15-member index that represents the stock performance of
large, well-known U.S. companies within the utilities sector• Index Market Capitalization of approximately $400 billion• Since inception in 1929 only 40 companies have been part of
the Index • American Water is the only water & wastewater utility to ever be
included in the Index
Referendum Wins• Haddonfield, NJ• Russiaville, IN• Arnold, MO
American Water (AWK) has emerged as the clear winner in the US mid-term elections, at least in terms of boosting its regulated asset portfolio.
NYSE: AWK www.amwater.com 14January 2015
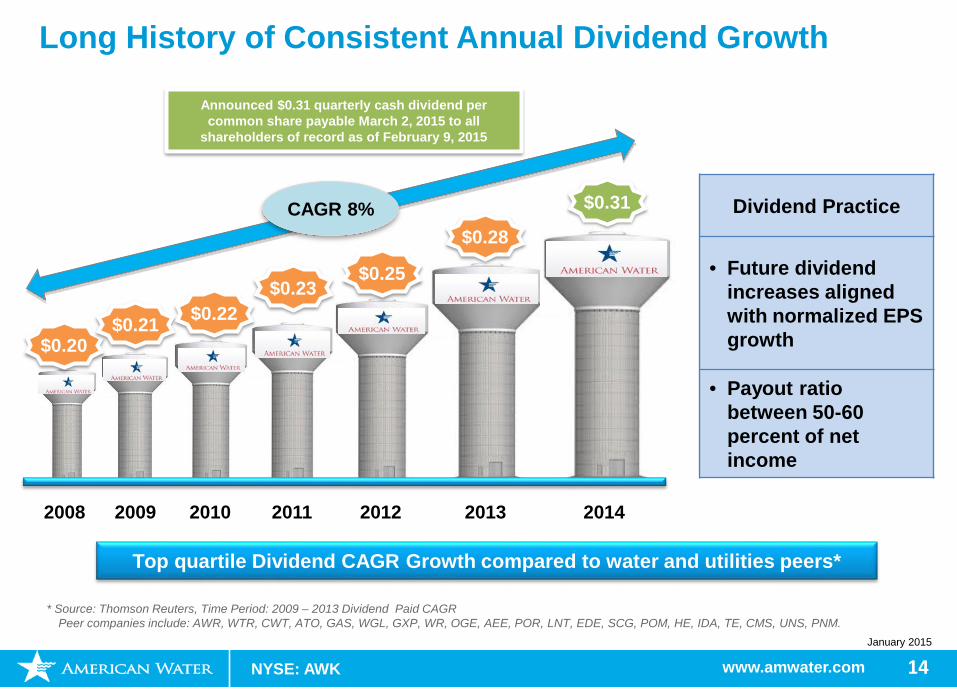
Long History of Consistent Annual Dividend Growth
* Source: Thomson Reuters, Time Period: 2009 – 2013 Dividend Paid CAGRPeer companies include: AWR, WTR, CWT, ATO, GAS, WGL, GXP, WR, OGE, AEE, POR, LNT, EDE, SCG, POM, HE, IDA, TE, CMS, UNS, PNM.
2008 2009 2010 2011 2012 2013 2014
$0.20$0.21 $0.22
$0.23$0.25
$0.28
$0.31
Announced $0.31 quarterly cash dividend per common share payable March 2, 2015 to all
shareholders of record as of February 9, 2015
CAGR 8%
Top quartile Dividend CAGR Growth compared to water and utilities peers*
Dividend Practice
• Future dividend increases aligned with normalized EPS growth
• Payout ratio between 50-60 percent of net income
NYSE: AWK www.amwater.com 15January 2015
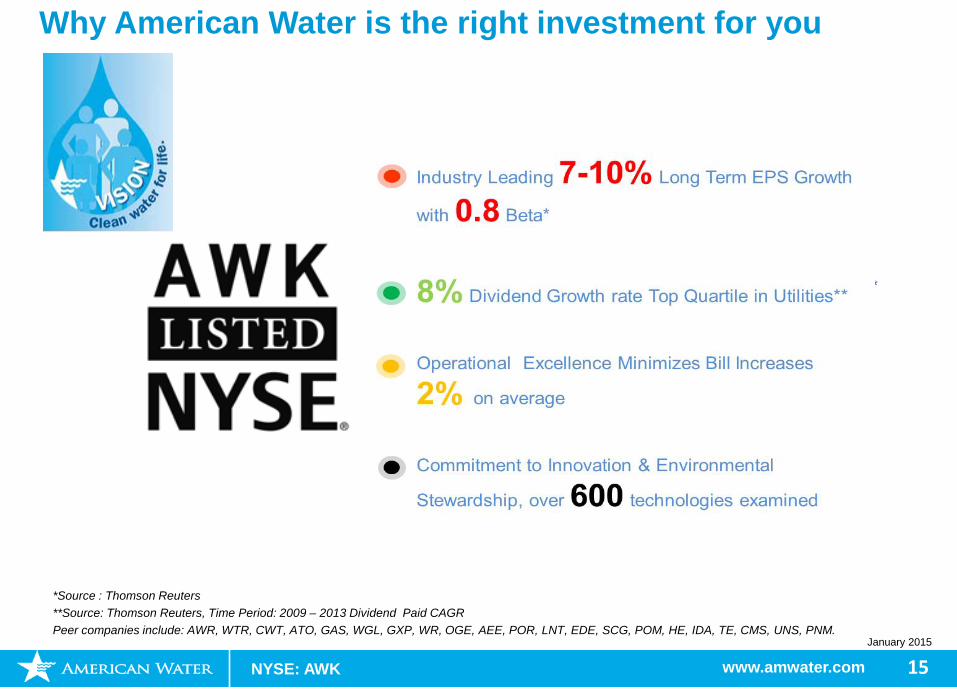
Why American Water is the right investment for you
*Source : Thomson Reuters**Source: Thomson Reuters, Time Period: 2009 – 2013 Dividend Paid CAGR Peer companies include: AWR, WTR, CWT, ATO, GAS, WGL, GXP, WR, OGE, AEE, POR, LNT, EDE, SCG, POM, HE, IDA, TE, CMS, UNS, PNM.
**
NYSE: AWK www.amwater.com 16January 2015
Investor Relations Team:
Durgesh ChopraDirector – Investor [email protected]
Ed Vallejo Vice President – Investor [email protected]
Tel: 856-566-4005Fax: 856-782-2782
NYSE: AWK
Appendix
NYSE: AWK www.amwater.com 18January 2015
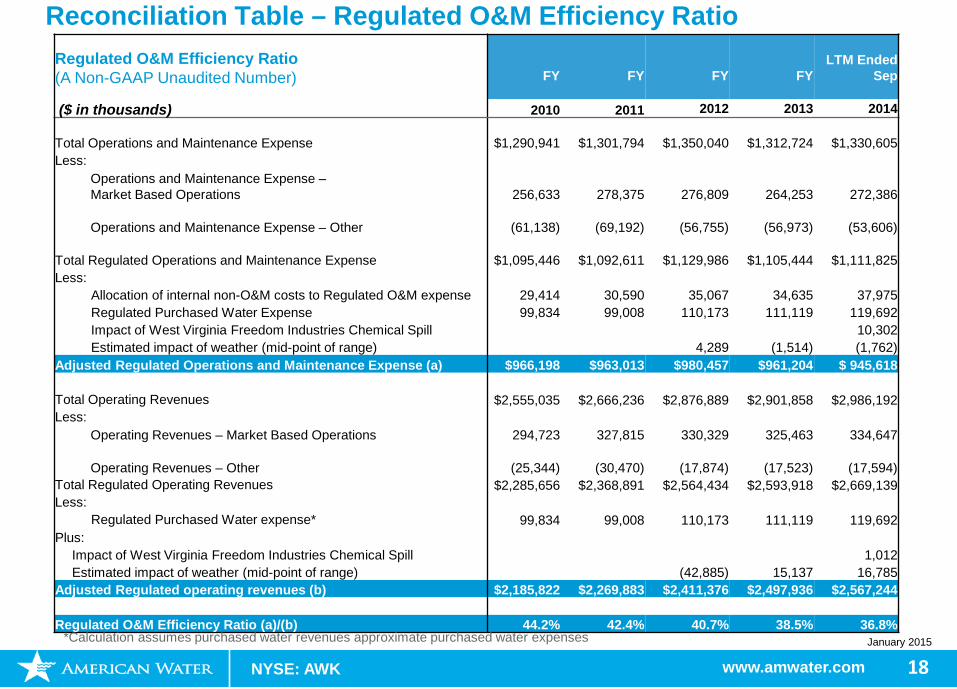
Reconciliation Table – Regulated O&M Efficiency RatioRegulated O&M Efficiency Ratio (A Non-GAAP Unaudited Number) FY FY FY FY
LTM Ended Sep
($ in thousands) 2010 2011 2012 2013 2014
Total Operations and Maintenance Expense $1,290,941 $1,301,794 $1,350,040 $1,312,724 $1,330,605 Less:
Operations and Maintenance Expense –Market Based Operations 256,633 278,375 276,809 264,253 272,386
Operations and Maintenance Expense – Other (61,138) (69,192) (56,755) (56,973) (53,606)
Total Regulated Operations and Maintenance Expense $1,095,446 $1,092,611 $1,129,986 $1,105,444 $1,111,825 Less:
Allocation of internal non-O&M costs to Regulated O&M expense 29,414 30,590 35,067 34,635 37,975 Regulated Purchased Water Expense 99,834 99,008 110,173 111,119 119,692 Impact of West Virginia Freedom Industries Chemical Spill 10,302Estimated impact of weather (mid-point of range) 4,289 (1,514) (1,762)
Adjusted Regulated Operations and Maintenance Expense (a) $966,198 $963,013 $980,457 $961,204 $ 945,618
Total Operating Revenues $2,555,035 $2,666,236 $2,876,889 $2,901,858 $2,986,192 Less:
Operating Revenues – Market Based Operations 294,723 327,815 330,329 325,463 334,647
Operating Revenues – Other (25,344) (30,470) (17,874) (17,523) (17,594)Total Regulated Operating Revenues $2,285,656 $2,368,891 $2,564,434 $2,593,918 $2,669,139 Less:
Regulated Purchased Water expense* 99,834 99,008 110,173 111,119 119,692 Plus:
Impact of West Virginia Freedom Industries Chemical Spill 1,012Estimated impact of weather (mid-point of range) (42,885) 15,137 16,785
Adjusted Regulated operating revenues (b) $2,185,822 $2,269,883 $2,411,376 $2,497,936 $2,567,244
Regulated O&M Efficiency Ratio (a)/(b) 44.2% 42.4% 40.7% 38.5% 36.8%*Calculation assumes purchased water revenues approximate purchased water expenses