Embed Size (px)
Citation preview

Color
Scheme
234 93 46
109 179 63
235 235 235
0 75 141
253 185 36
Accent
Color
31 179 179
192 0 0
“This presentation contains forward-looking statements. These statements are made under the “safe harbor” provisions established
by the U.S. Private Securities Litigation Reform Act of 1995. Forward-looking statements involve inherent risks and uncertainties.
The forward-looking statements in this presentation reflect the expectations of the Bank’s management and are based on currently
available data; however, actual experience with respect to these factors is subject to future events and uncertainties, which could
materially impact the Bank’s expectations. A number of factors could cause actual performance and results to differ materially from
those contained in any forward-looking statement, including but not limited to the following: the anticipated growth of the Bank’s
credit portfolio, including its trade finance portfolio; the continuation of the Bank’s preferred creditor status; the impact of increasing
interest rates and of the macroeconomic environment in the Region on the Bank’s financial condition; the execution of the Bank’s
strategies and initiatives, including its revenue diversification strategy; the adequacy of the Bank’s allowance for credit losses; the
need for additional provisions for credit losses; the Bank’s ability to achieve future growth, the Bank’s ability to reduce its liquidity
levels and increase its leverage; the Bank’s ability to maintain its investment-grade credit ratings; the availability and mix of future
sources of funding for the Bank’s lending operations; potential trading losses; the possibility of fraud; and the adequacy of the
Bank’s sources of liquidity to replace large deposit withdrawals.”
2
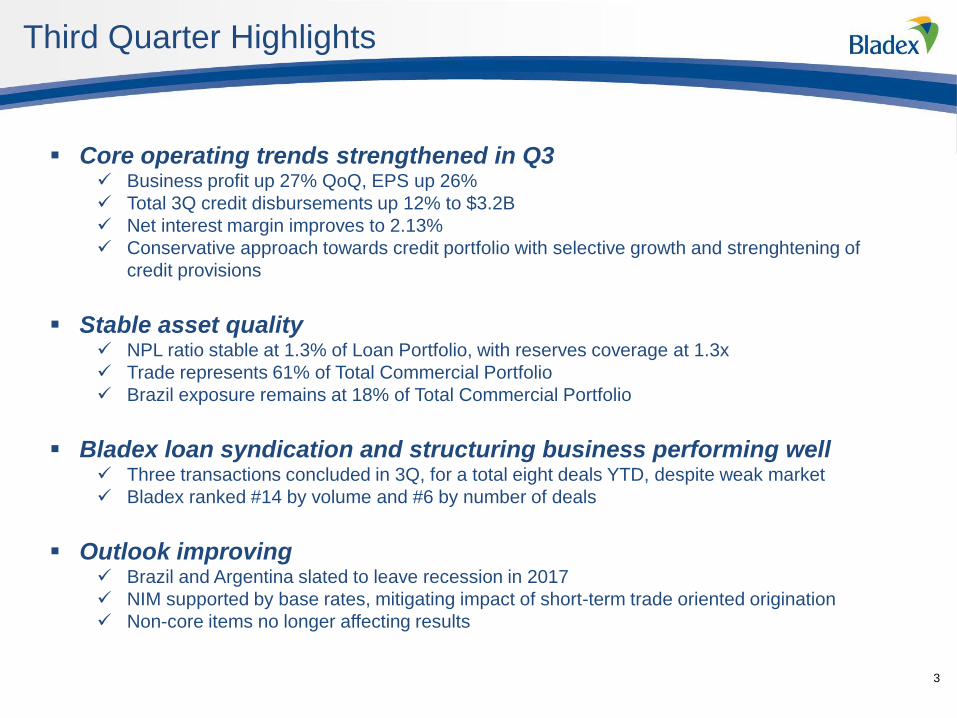
Third Quarter Highlights
3
Core operating trends strengthened in Q3 Business profit up 27% QoQ, EPS up 26%
Total 3Q credit disbursements up 12% to $3.2B
Net interest margin improves to 2.13%
Conservative approach towards credit portfolio with selective growth and strenghtening of
credit provisions
Stable asset quality NPL ratio stable at 1.3% of Loan Portfolio, with reserves coverage at 1.3x
Trade represents 61% of Total Commercial Portfolio
Brazil exposure remains at 18% of Total Commercial Portfolio
Bladex loan syndication and structuring business performing well Three transactions concluded in 3Q, for a total eight deals YTD, despite weak market
Bladex ranked #14 by volume and #6 by number of deals
Outlook improving Brazil and Argentina slated to leave recession in 2017
NIM supported by base rates, mitigating impact of short-term trade oriented origination
Non-core items no longer affecting results
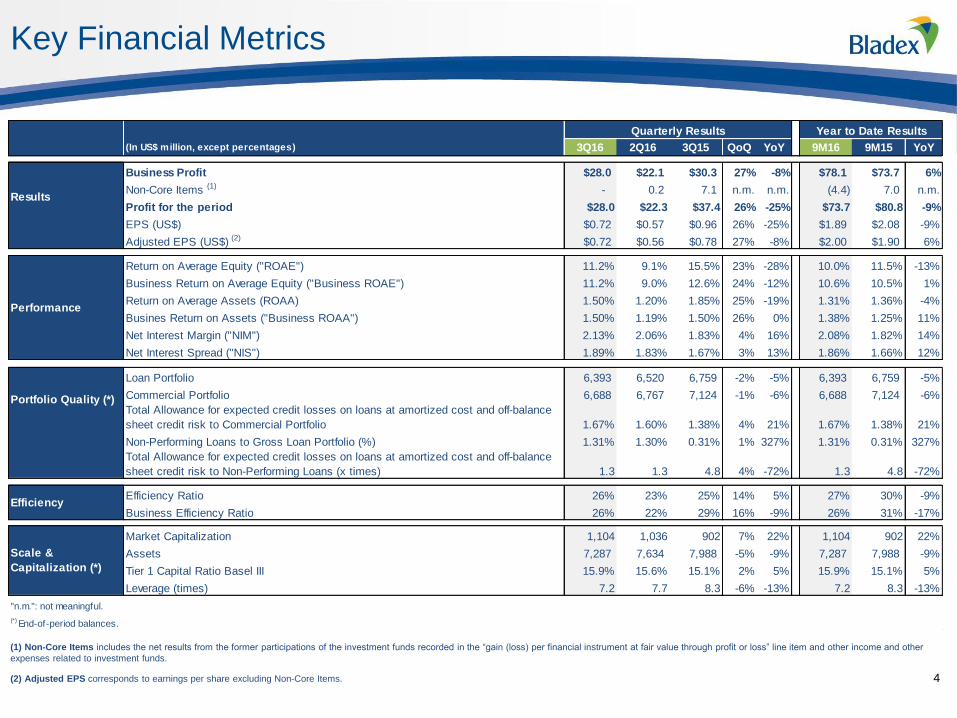
Key Financial Metrics
(1) Non-Core Items includes the net results from the former participations of the investment funds recorded in the “gain (loss) per financial instrument at fair value through profit or loss” line item and other income and other
expenses related to investment funds.
(2) Adjusted EPS corresponds to earnings per share excluding Non-Core Items. 4
Quarterly Results Year to Date Results
(In US$ million, except percentages) 3Q16 2Q16 3Q15 QoQ YoY 9M16 9M15 YoY
Business Profit $28.0 $22.1 $30.3 27% -8% $78.1 $73.7 6%
Non-Core Items (1) - 0.2 7.1 n.m. n.m. (4.4) 7.0 n.m.
Profit for the period $28.0 $22.3 $37.4 26% -25% $73.7 $80.8 -9%
EPS (US$) $0.72 $0.57 $0.96 26% -25% $1.89 $2.08 -9%
Adjusted EPS (US$) (2) $0.72 $0.56 $0.78 27% -8% $2.00 $1.90 6%
Return on Average Equity ("ROAE") 11.2% 9.1% 15.5% 23% -28% 10.0% 11.5% -13%
Business Return on Average Equity ("Business ROAE") 11.2% 9.0% 12.6% 24% -12% 10.6% 10.5% 1%
Return on Average Assets (ROAA) 1.50% 1.20% 1.85% 25% -19% 1.31% 1.36% -4%
Busines Return on Assets ("Business ROAA") 1.50% 1.19% 1.50% 26% 0% 1.38% 1.25% 11%
Net Interest Margin ("NIM") 2.13% 2.06% 1.83% 4% 16% 2.08% 1.82% 14%
Net Interest Spread ("NIS") 1.89% 1.83% 1.67% 3% 13% 1.86% 1.66% 12%
Loan Portfolio 6,393 6,520 6,759 -2% -5% 6,393 6,759 -5%
Commercial Portfolio 6,688 6,767 7,124 -1% -6% 6,688 7,124 -6%
Total Allowance for expected credit losses on loans at amortized cost and off-balance
sheet credit risk to Commercial Portfolio 1.67% 1.60% 1.38% 4% 21% 1.67% 1.38% 21%
Non-Performing Loans to Gross Loan Portfolio (%) 1.31% 1.30% 0.31% 1% 327% 1.31% 0.31% 327%
Total Allowance for expected credit losses on loans at amortized cost and off-balance
sheet credit risk to Non-Performing Loans (x times) 1.3 1.3 4.8 4% -72% 1.3 4.8 -72%
Efficiency Ratio 26% 23% 25% 14% 5% 27% 30% -9%
Business Efficiency Ratio 26% 22% 29% 16% -9% 26% 31% -17%
Market Capitalization 1,104 1,036 902 7% 22% 1,104 902 22%
Assets 7,287 7,634 7,988 -5% -9% 7,287 7,988 -9%
Tier 1 Capital Ratio Basel III 15.9% 15.6% 15.1% 2% 5% 15.9% 15.1% 5%
Leverage (times) 7.2 7.7 8.3 -6% -13% 7.2 8.3 -13%
"n.m.": not meaningful.
(*) End-of-period balances.
Results
Performance
Portfolio Quality (*)
Efficiency
Scale &
Capitalization (*)
Financial Performance Overview
3Q16
5
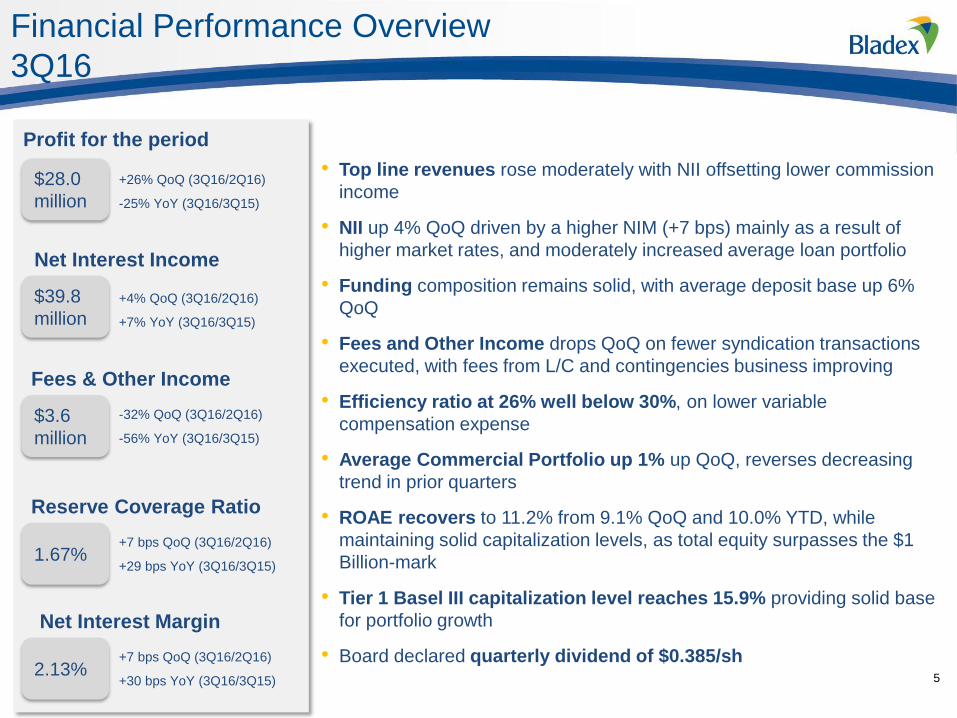
• Top line revenues rose moderately with NII offsetting lower commission
income
• NII up 4% QoQ driven by a higher NIM (+7 bps) mainly as a result of
higher market rates, and moderately increased average loan portfolio
• Funding composition remains solid, with average deposit base up 6%
QoQ
• Fees and Other Income drops QoQ on fewer syndication transactions
executed, with fees from L/C and contingencies business improving
• Efficiency ratio at 26% well below 30%, on lower variable
compensation expense
• Average Commercial Portfolio up 1% up QoQ, reverses decreasing
trend in prior quarters
• ROAE recovers to 11.2% from 9.1% QoQ and 10.0% YTD, while
maintaining solid capitalization levels, as total equity surpasses the $1
Billion-mark
• Tier 1 Basel III capitalization level reaches 15.9% providing solid base
for portfolio growth
• Board declared quarterly dividend of $0.385/sh
Profit for the period
$28.0
million
+26% QoQ (3Q16/2Q16)
-25% YoY (3Q16/3Q15)
$39.8
million
Net Interest Income
Fees & Other Income
$3.6
million
Reserve Coverage Ratio
+4% QoQ (3Q16/2Q16)
+7% YoY (3Q16/3Q15)
-32% QoQ (3Q16/2Q16)
-56% YoY (3Q16/3Q15)
1.67% +7 bps QoQ (3Q16/2Q16)
+29 bps YoY (3Q16/3Q15)
Net Interest Margin
2.13% +7 bps QoQ (3Q16/2Q16)
+30 bps YoY (3Q16/3Q15)
Profit Evolution & Quality of Earnings - QoQ
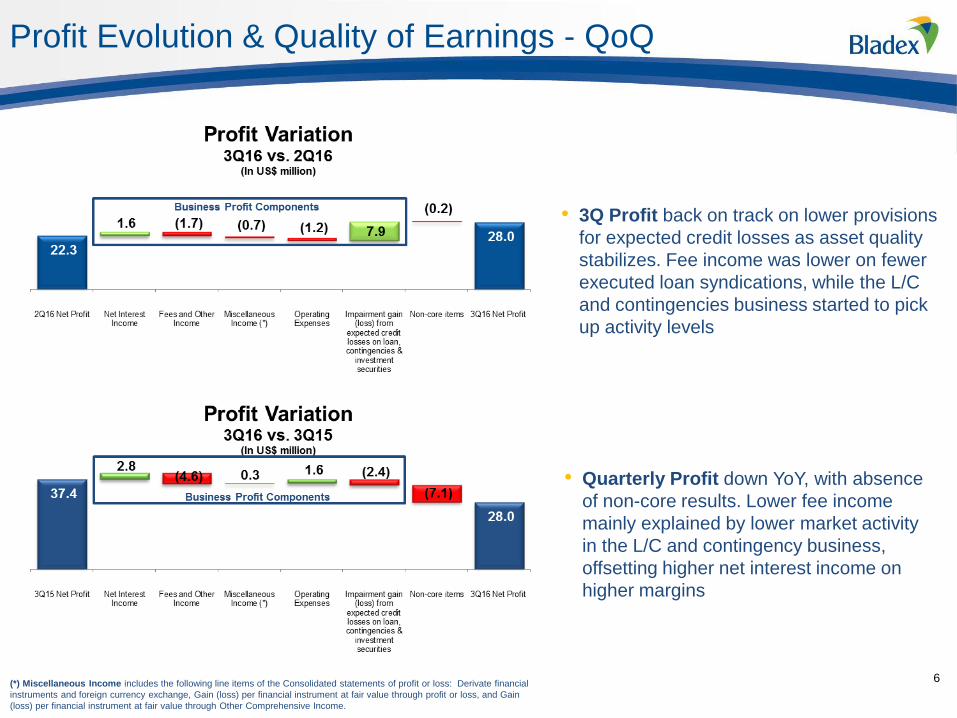
6 (*) Miscellaneous Income includes the following line items of the Consolidated statements of profit or loss: Derivate financial
instruments and foreign currency exchange, Gain (loss) per financial instrument at fair value through profit or loss, and Gain
(loss) per financial instrument at fair value through Other Comprehensive Income.
• 3Q Profit back on track on lower provisions
for expected credit losses as asset quality
stabilizes. Fee income was lower on fewer
executed loan syndications, while the L/C
and contingencies business started to pick
up activity levels
• Quarterly Profit down YoY, with absence
of non-core results. Lower fee income
mainly explained by lower market activity
in the L/C and contingency business,
offsetting higher net interest income on
higher margins
Financial Performance Overview
9M16
7 (*) Miscellaneous Income includes the following line items of the Consolidated statements of profit or loss: Derivate financial
instruments and foreign currency exchange, Gain (loss) per financial instrument at fair value through profit or loss, and Gain (loss) per
financial instrument at fair value through Other Comprehensive Income.
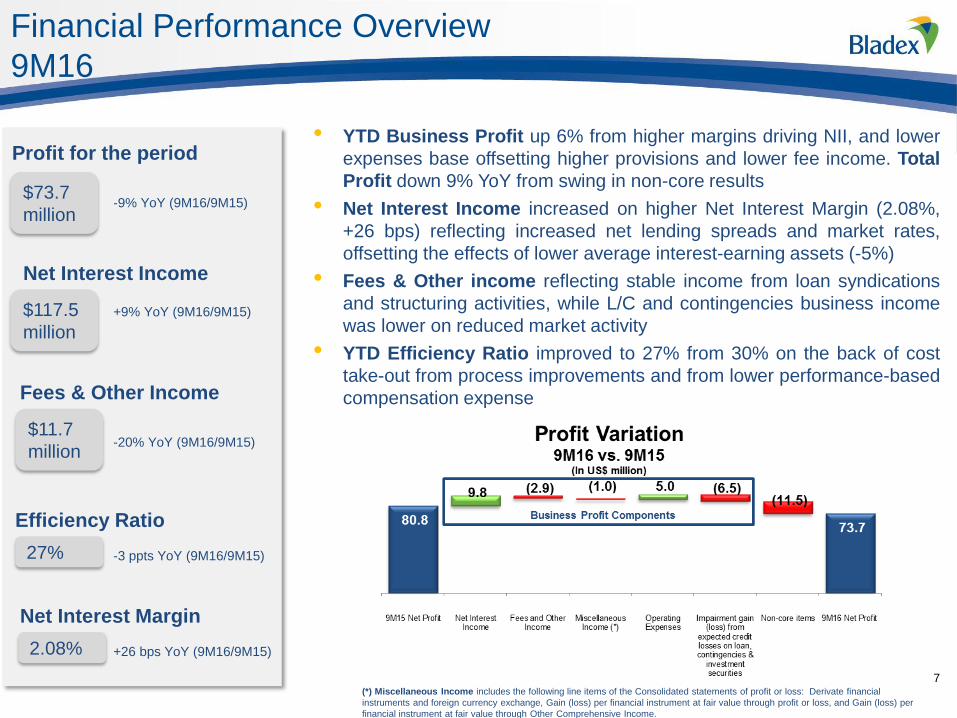
• YTD Business Profit up 6% from higher margins driving NII, and lower
expenses base offsetting higher provisions and lower fee income. Total
Profit down 9% YoY from swing in non-core results
• Net Interest Income increased on higher Net Interest Margin (2.08%,
+26 bps) reflecting increased net lending spreads and market rates,
offsetting the effects of lower average interest-earning assets (-5%)
• Fees & Other income reflecting stable income from loan syndications
and structuring activities, while L/C and contingencies business income
was lower on reduced market activity
• YTD Efficiency Ratio improved to 27% from 30% on the back of cost
take-out from process improvements and from lower performance-based
compensation expense
Profit for the period
$73.7
million -9% YoY (9M16/9M15)
$117.5
million
Net Interest Income
Fees & Other Income
$11.7
million
+9% YoY (9M16/9M15)
-20% YoY (9M16/9M15)
Net Interest Margin
2.08%
Efficiency Ratio
27% -3 ppts YoY (9M16/9M15)
+26 bps YoY (9M16/9M15)
Net Interest Income (NII) & Net Interest Margin (NIM)
8
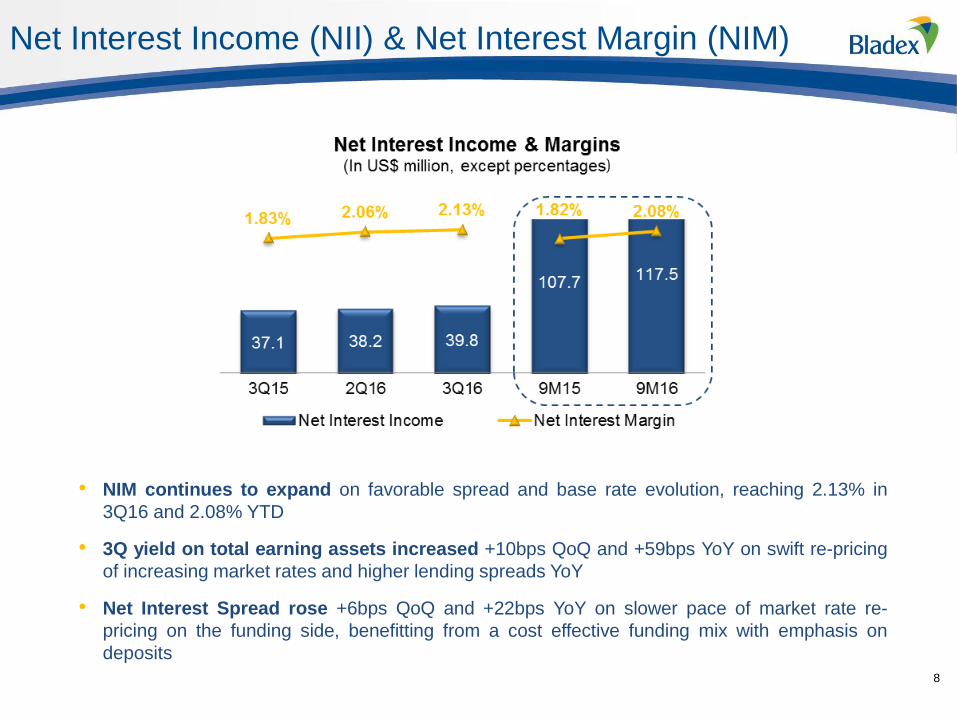
• NIM continues to expand on favorable spread and base rate evolution, reaching 2.13% in
3Q16 and 2.08% YTD
• 3Q yield on total earning assets increased +10bps QoQ and +59bps YoY on swift re-pricing
of increasing market rates and higher lending spreads YoY
• Net Interest Spread rose +6bps QoQ and +22bps YoY on slower pace of market rate re-
pricing on the funding side, benefitting from a cost effective funding mix with emphasis on
deposits
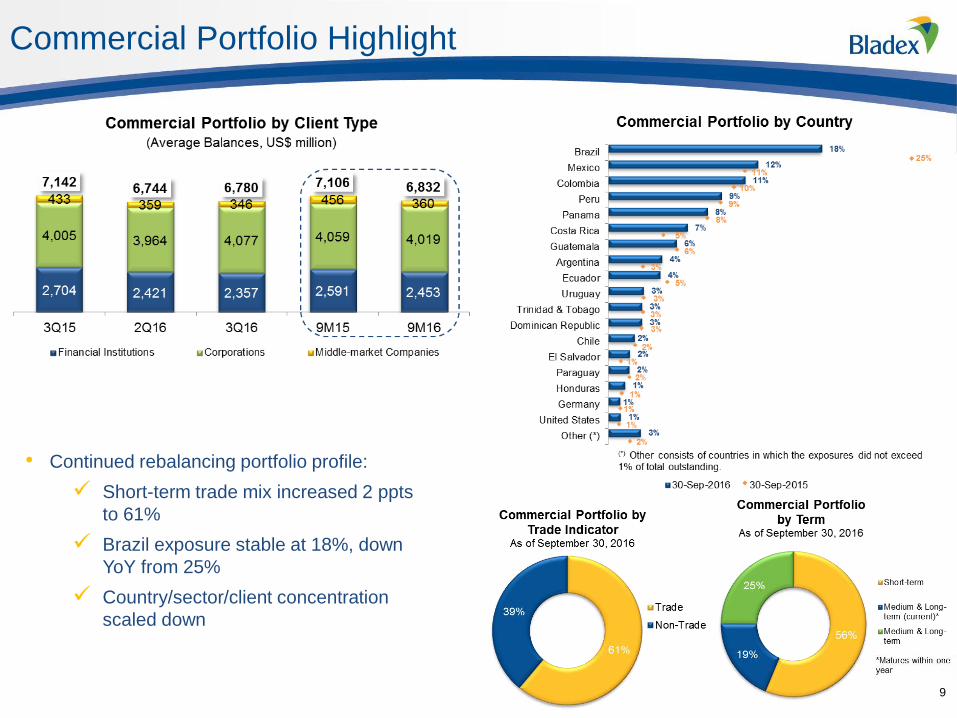
Commercial Portfolio Highlight
9
• Continued rebalancing portfolio profile:
Short-term trade mix increased 2 ppts
to 61%
Brazil exposure stable at 18%, down
YoY from 25%
Country/sector/client concentration
scaled down
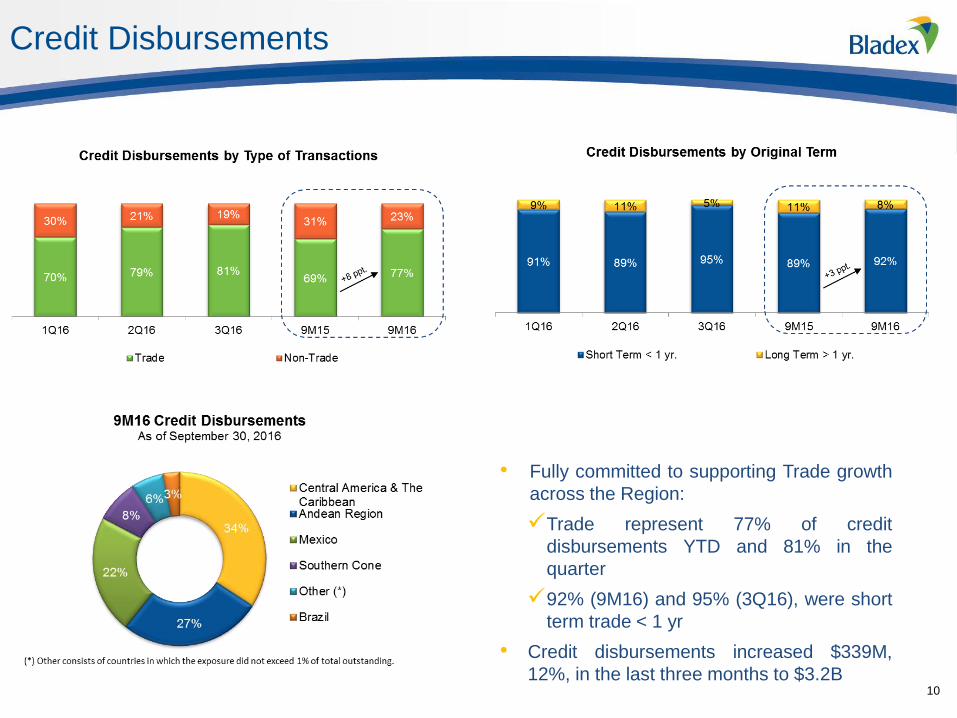
Credit Disbursements
10
• Fully committed to supporting Trade growth
across the Region:
Trade represent 77% of credit
disbursements YTD and 81% in the
quarter
92% (9M16) and 95% (3Q16), were short
term trade < 1 yr
• Credit disbursements increased $339M,
12%, in the last three months to $3.2B
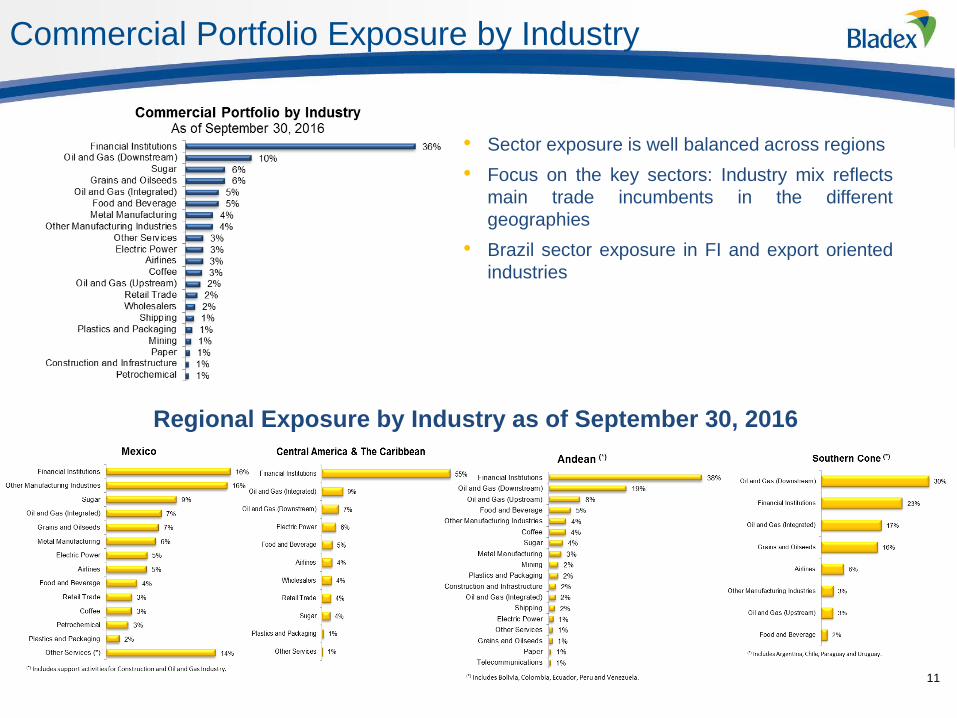
Commercial Portfolio Exposure by Industry
11
• Sector exposure is well balanced across regions
• Focus on the key sectors: Industry mix reflects
main trade incumbents in the different
geographies
• Brazil sector exposure in FI and export oriented
industries
Regional Exposure by Industry as of September 30, 2016
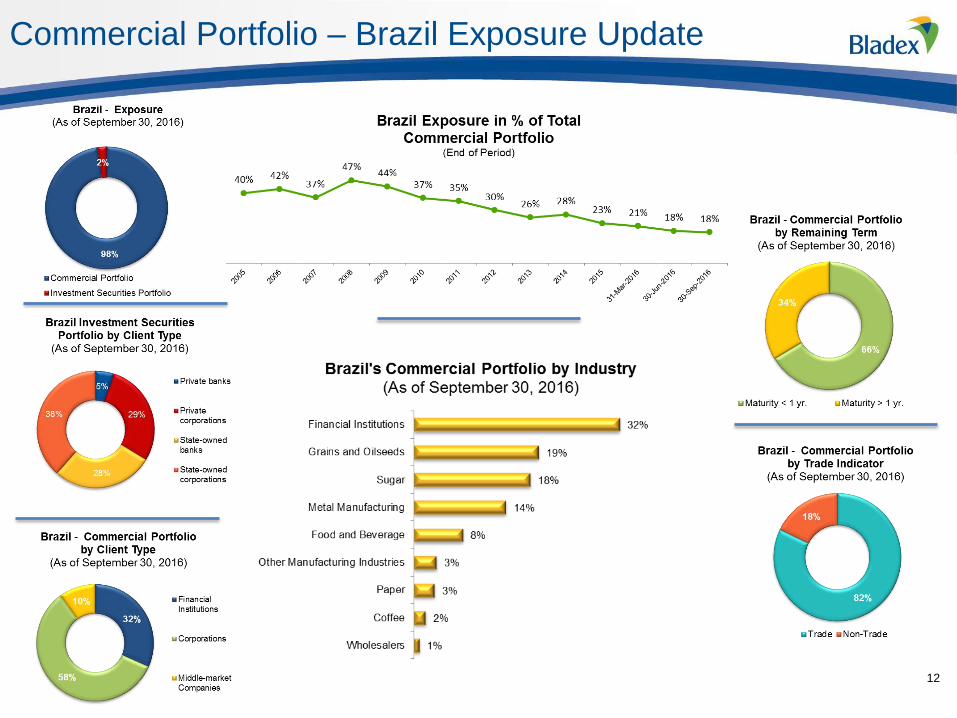
Commercial Portfolio – Brazil Exposure Update
12
Credit Quality
13
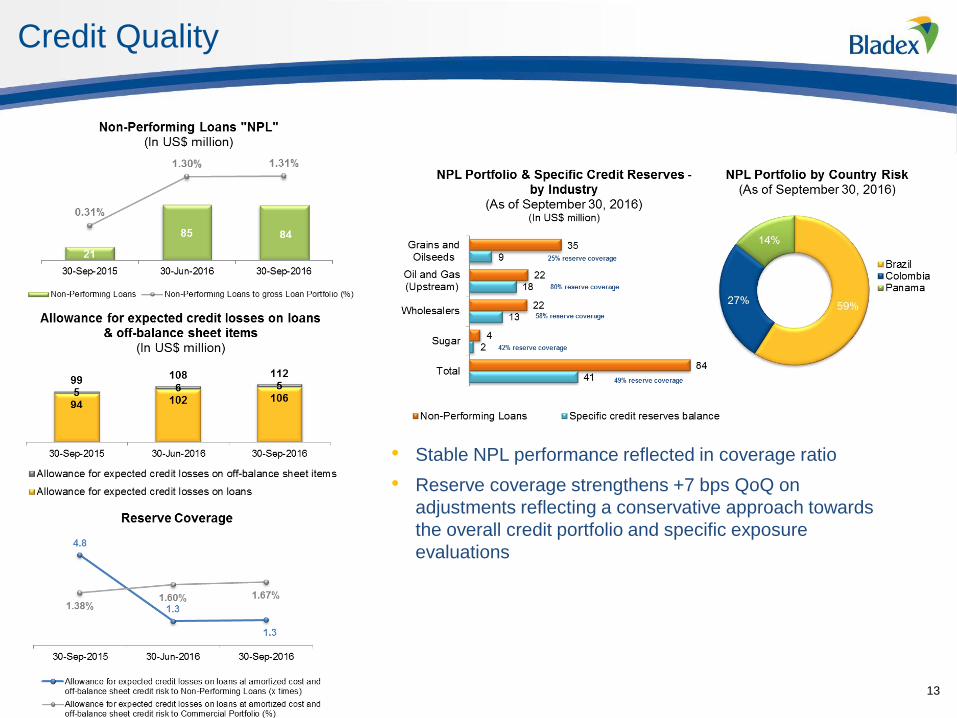
• Stable NPL performance reflected in coverage ratio
• Reserve coverage strengthens +7 bps QoQ on
adjustments reflecting a conservative approach towards
the overall credit portfolio and specific exposure
evaluations
Fee & Other Income Highlights
14
Sep 2016
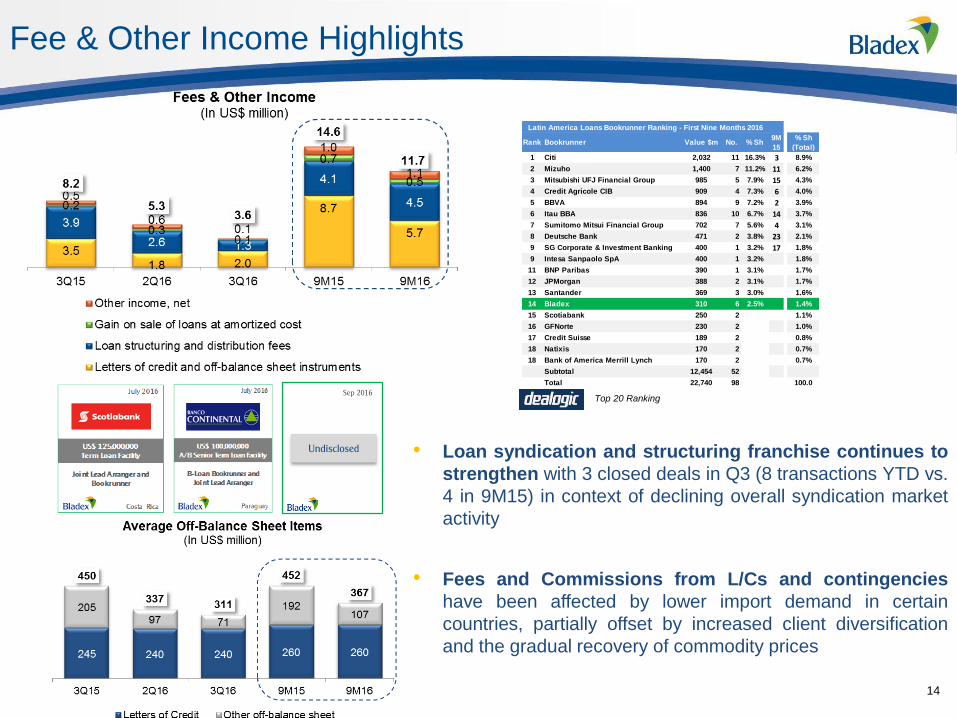
Undisclosed • Loan syndication and structuring franchise continues to
strengthen with 3 closed deals in Q3 (8 transactions YTD vs.
4 in 9M15) in context of declining overall syndication market
activity
• Fees and Commissions from L/Cs and contingencies
have been affected by lower import demand in certain
countries, partially offset by increased client diversification
and the gradual recovery of commodity prices
Rank Bookrunner Value $m No. % Sh9M
15
% Sh
(Total)
1 Citi 2,032 11 16.3% 3 8.9%
2 Mizuho 1,400 7 11.2% 11 6.2%
3 Mitsubishi UFJ Financial Group 985 5 7.9% 15 4.3%
4 Credit Agricole CIB 909 4 7.3% 6 4.0%
5 BBVA 894 9 7.2% 2 3.9%
6 Itau BBA 836 10 6.7% 14 3.7%
7 Sumitomo Mitsui Financial Group 702 7 5.6% 4 3.1%
8 Deutsche Bank 471 2 3.8% 23 2.1%
9 SG Corporate & Investment Banking 400 1 3.2% 17 1.8%
9 Intesa Sanpaolo SpA 400 1 3.2% 1.8%
11 BNP Paribas 390 1 3.1% 1.7%
12 JPMorgan 388 2 3.1% 1.7%
13 Santander 369 3 3.0% 1.6%
14 Bladex 310 6 2.5% 1.4%
15 Scotiabank 250 2 1.1%
16 GFNorte 230 2 1.0%
17 Credit Suisse 189 2 0.8%
18 Natixis 170 2 0.7%
18 Bank of America Merrill Lynch 170 2 0.7%
Subtotal 12,454 52
Total 22,740 98 100.0
Latin America Loans Bookrunner Ranking - First Nine Months 2016
Top 20 Ranking
Operating Expenses and Efficiency Ratios
15
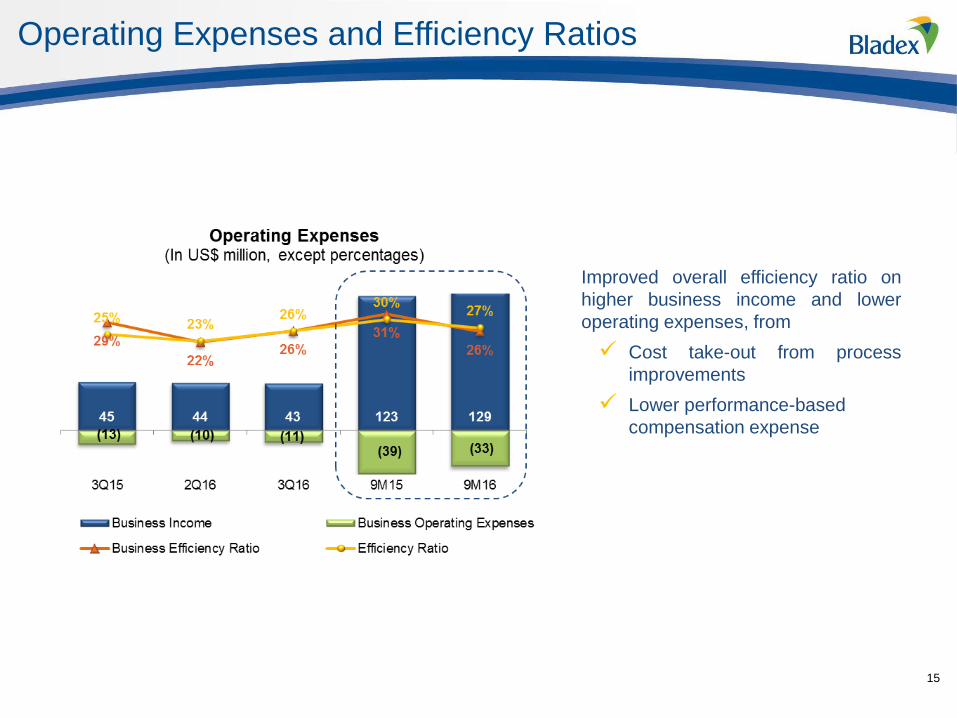
• Improved overall efficiency ratio on
higher business income and lower
operating expenses, from
Cost take-out from process
improvements
Lower performance-based
compensation expense
ROAE and Capitalization
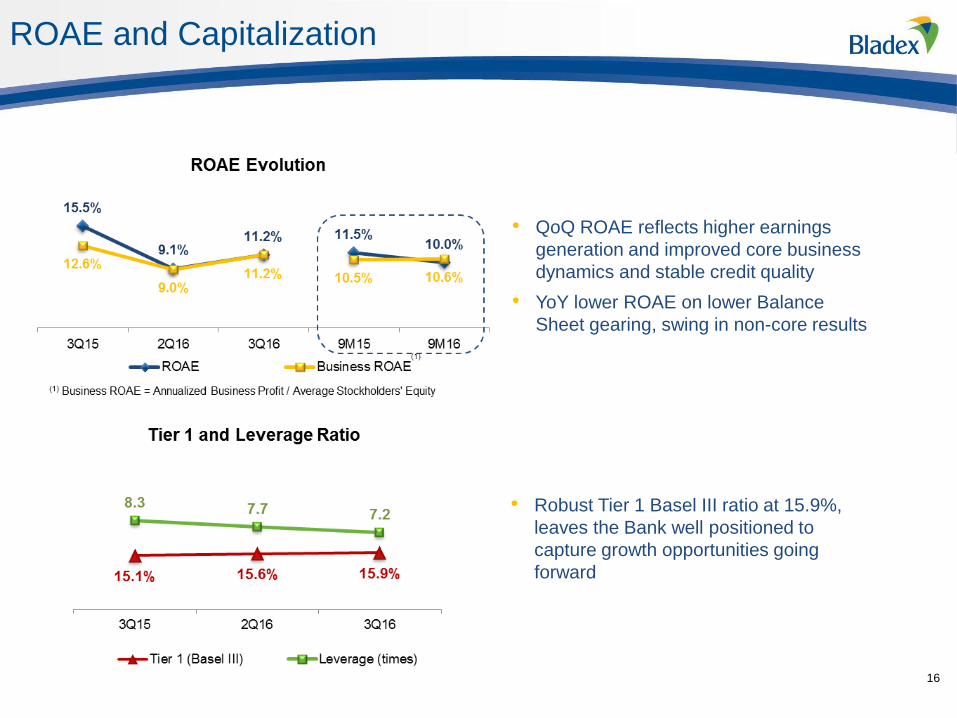
• QoQ ROAE reflects higher earnings
generation and improved core business
dynamics and stable credit quality
• YoY lower ROAE on lower Balance
Sheet gearing, swing in non-core results
• Robust Tier 1 Basel III ratio at 15.9%,
leaves the Bank well positioned to
capture growth opportunities going
forward
16
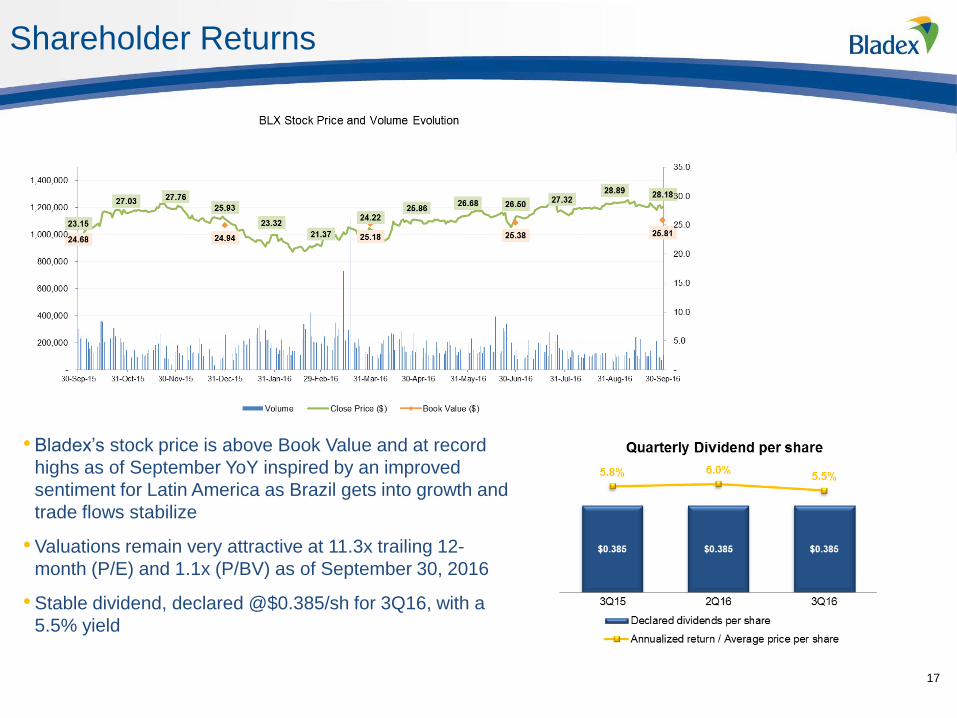
Shareholder Returns
• Bladex’s stock price is above Book Value and at record
highs as of September YoY inspired by an improved
sentiment for Latin America as Brazil gets into growth and
trade flows stabilize
• Valuations remain very attractive at 11.3x trailing 12-
month (P/E) and 1.1x (P/BV) as of September 30, 2016
• Stable dividend, declared @$0.385/sh for 3Q16, with a
5.5% yield
17

Questions & Answers
18
Thank You
19