Embed Size (px)
Citation preview

1
Earnings Release | Conference Call – 1Q13
May 7th, 2013

2
Agenda
Ricardo Ribeiro
Vice President
Carlos Wollenweber
CFO | IR Officer
1Q13 Highlights
Financial Highlights
1Q13 1Q12 D %
Launched PSV% Direcional
BRL million 420 143 193%
Contracted PSV% Direcional
BRL million 530 133 300%
Sales Over Supply (VSO) % PSV 40.7% 16.1% 24.6 p.p.
Net Revenues BRL million 389 344 13%
Adjusted¹ Net Income BRL million 57 54 5%
Adjusted¹ Net Margin % 14.7% 15.8% -1.1 p.p.
Main Figures
3 1 -Adjusted by non-cash expenses (Stock-Options Program).

4
Launches – 1Q13
143
+193%
1Q13
420
405
15
1Q12
MCMV Level 1
Development
MG5
AP
3
1
PA
4
2
Launched PSV
(R$ million)
Record launches in 1Q13;
Focus on the MCMV Level 1 segment.
Total
(R$'000)
% Direcional
(R$'000)
# of Units
Launched
Total Units
(All Phases)
1 Residencial São José January Macapá - AP 89,280 89,280 1,440 1,440 MCMV Level 1
2 Residencial Orgulho de Minas 2 February Belo Horizonte - MG 14,880 14,880 240 240 MCMV Level 1
3 Viver Melhor Marituba March Marituba - PA 264,000 264,000 4,000 4,000 MCMV Level 1
4 Unique Residence March Belo Horizonte - MG 15,201 15,201 36 36 Upper-Midle
5 Residencial Serras de Minas March Belo Horizonte - MG 36,436 36,436 580 580 MCMV Level 1
Total 1Q13 419,797 419,797 6,296 6,296
Units Launched
Segment1Q13 Projects Date City - State
PSV

5
Sales and VSO – 1Q13
1Q13
40.7%
15.2%
4Q12
55.4%
15.2%
3Q12
41.3%
18.7%
2Q12
36.5%
21.2%
1Q12
16.1% 16.1%
With MCMV Level 1 project
Without MCMV Level 1 project
1Q12 90%
10% 51% 22%
5%
2%
2Q12 94% 88%
3%
2%
1%
3Q12 97% 95% 1% 1%
4Q12 98% 98% 0%
1Q13 100%
3 M 6 M 9 M 12 M 15 M
+300%
1Q13
530
405
125
1Q12
133
133
Sales by Period of Launching - 1Q13
(% PSV – Ex-MCMV Level 1)
8%
2011
19%
<2011 34%
1Q12 3%
2Q12 8%
3Q12
4Q12
25% 1Q13
4%
Contracted PSV
(R$ million)
Sales-over-supply ratio (VSO)
(% Units)
Sales Speed
(% Units)
Record sales in 1Q13;
Sales were 26% higher than launched PSV;
SoS of 40.7%.
MCMV Level 1
Development

6
Inventory
1Q13
1%
2012 40%
2011
29%
2010 12%
<2010
2%
Concluded Units
16%
Midweast 17.8%
Southeast 33.0%
North 49.1%
Inventory Track Record
(R$ million)
Inventory by Launch Period
(% PSV)
Inventory Market Value by Region
(% PSV)
Reduction of 17% in total inventory;
Reduction of 18.6 % in inventory of completed units.
667 -7.5%
-16.7%
1Q13
561
106
2012
800
670
130
2011
721
668
53
Under Construction
Concluded Units
Under Construction 560.870 84,1% 1.848 78,6%
Finished Units 105.714 15,9% 502 21,4%
Total 666.584 100,0% 2.350 100,0%
Inventory % Units in Inventory %PSV in Inventory (BRL'000)
% Direcional

7
Carlos Wollenweber
CFO | IR Officer
Financial Highlights
1Q13 1Q12 D %
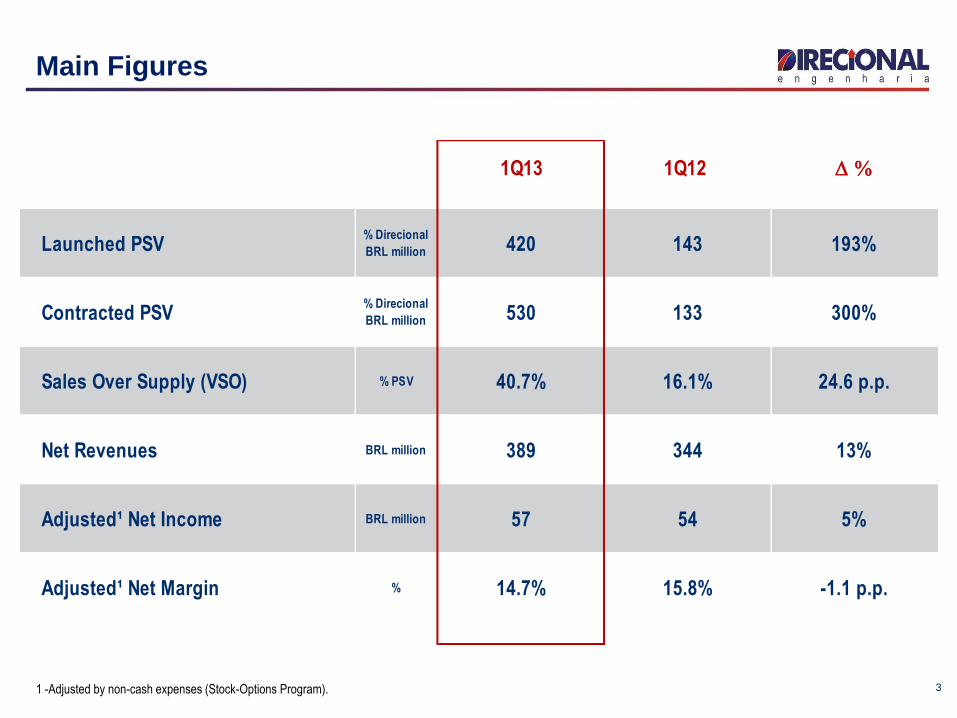
Units Under Construction 55,119 35,899 54%
% of Industrialization (# of units) 75% 50% 24 p.p.
Construction Sites 49 37 32.4%
Average # of Units by Construction Sites 1,125 970 16%
# of Cities 13 10 30%
8
Operational Consistency
8%
75%
1Q13
18%
50%
41%
7%
1Q12
Units Under Construction by Construction Method
(% units)
Industrial Construction²
Concrete Blocks
Conventional Structure
(Concrete Pillars)
Adjusted¹ Gross Profit
(R$ million)
112 +3.8%
1Q13
97
15
29%
1Q12
108
96
12
31%
Gross Profit
Interest capitalized in costs
Adjusted Gross Margin¹
Gross Revenue
(R$ million)
38%
28%
396 +10.9%
1Q13
246
150
1Q12
357
259
98
Revenues from Real Estate Sales
Revenues from Services
% from Services
1.Adjusted by non-cash expenses (Stock-Options Program). 2. Aluminum mold and concrete walls method
Adjusted¹ Net Income
(R$ million)
15%
16%
1Q13
+5%
57
1Q12
54
Adjusted¹ Net Income
Adjusted¹ Net Margin

9
“Repasse” and Cash Burn
1Q13
-30
4Q12
-5
3Q12
-43
2Q12
-50
1Q12
-75
Cash Burn
(R$ Million)
+33% 82.9 52.9
4Q12
136.2
63.4
72.8
1Q12
39.8
43.1
-19%
1Q13
110.3
57.4
Financing Transfer (“Repasses”)
(R$ million)
"Associativo"
SFH
Cash Burn – Adjusted by Accounts Receivable
(R$ milhões)
40.2
Net Cash Burn from
the increase on
Accounts Receivable
of Finished Units
Variation on
Accounts Receivable
of Finished Units
70.5
Cash Burn
-30.3
Seasonal reduction in the number of financing installments passed on to the banks impacted cash flow in 1Q13;
Net of accounts receivable from completed units, it represents cash flow of R$40 mn;
The increase in accounts receivable from completed units is due to the PSV of R$154 million delivered in the quarter.
BRL (Million) 1Q13 4Q12 D %
Accounts Receivable (BRL'000) -Development 1,450 1,375 5%
Concluded Units 577 506 14%
Under Construction 874 869 1%

1Q13 1Q13
Previous Method Current Method
Net Revenue 376.3 12.3 388.5
Gross Income 96.2 1.0 97.2
Net income Before Minority 55.4 1.5 56.9
Minority -0.6 -1.5 -2.1
Adjusted Net Income 57.0 0.0 57.0
Adjusted Net Margin 15.1% -0.5 p.p. 14.7%
Adjustments
1Q13 Results – Change in the Accounting Method¹
10
1 - With the adoption of IFRS 11, expected for the fiscal year ending on December 31, 2013, jointly-owned subsidiaries that are currently booked proportionately in the financial
statements will be booked under the equity income method, in compliance with IAS 28R – Investments in Associates, Subsidiaries and Joint Ventures.

Total issue amount
Term
Grace period
Rate
Coordinators
Early settlement option As of Nov/14, penalty 0.2% p.y.
R$ 200 million
4 years
2 years
CDI + 1% p.y.
Itau BBA, BB, Bradesco
Information on the debenture issue:
11

12
Disclosure
This presentation contains certain forward-looking statements concerning the business prospects,
projections of operating and financial results and growth potential of the Company, which are based on
management’s current expectations and estimates of the future performance of the Company. Although the
Company believes such forward-looking statements are based on reasonable assumptions, it can give no
assurance that its expectations will be achieved. Expectations and estimates that are based on the future
prospects of the Company are highly dependent upon market behavior, Brazil’s political and economic
situation, existing and future regulations of the industry and international markets and, therefore, are
subject to changes outside the Company’s and management’s control. The Company undertakes no
obligation to update any information contained herein or to revise any forward-looking statement as a result
of new information, future events or other information.

13
Contacts
Carlos Wollenweber CFO | IR Officer
Paulo Sousa IR Analyst
Luiz Felipe Almeida IR Analyst
www.direcional.com.b/ir
(55 31) 3214-6200
(55 31) 3214-6450


![RESULTS PRESENTATION - CaixaBank · 2014-02-06 · results presentation january - december [2013] 2 ... 4q13 1q13 2q13 3q13 4q13 63% 77% 66% 65% 61% 45% 48% 49% 49% 54% 4q12 1q13](https://img.pdfslide.us/doc/110x75/5f0a718a7e708231d42ba8e9/results-presentation-caixabank-2014-02-06-results-presentation-january-december.jpg)