Embed Size (px)
Citation preview

IoN HC Internet of Networks
(IoT, IoE, IoA) A New Chapter in Ligh6ng Services
Michael P To2en Senior Fellow, Rocky Mountain Ins>tute
Principal, AssetsforLife.net [email protected]
The Original, Biggest, Brightest, Cheapest & Longest-‐las6ng
Human-‐Centric LIGHT SOURCE Delivering 3.8 billion trillion (1021) photons per second per m2

Sun’s Human-‐Centric Ligh6ng Benefits
Sun’s Light, Energy & Heat makes existence possible Earth's surface temperature averages ~58°F (14.6°C) No solar electromagne>c waves. then Earth freezes
No water, no energy for plants, No atmosphere, biosphere, evolu>on ,
No human life to be centric about
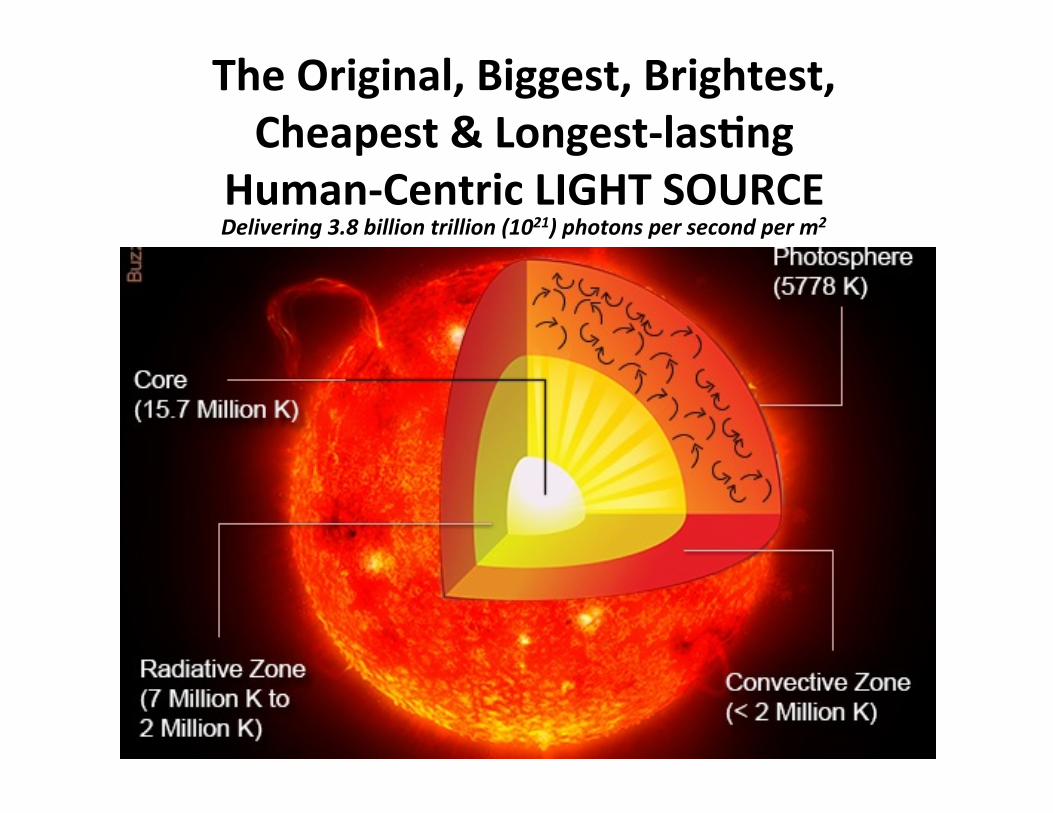
But Uncontrollable – Too Much, Too Long, Too Strong
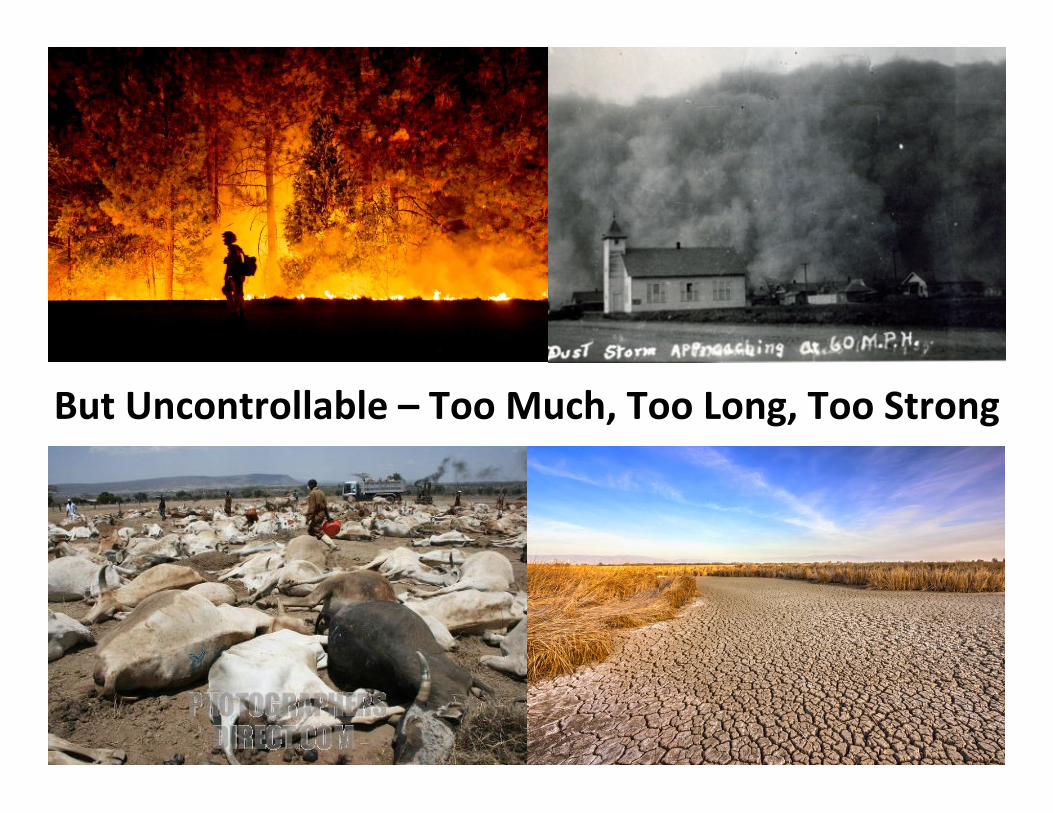
But Uncontrollable – Too LiLle, Too short, Too weak
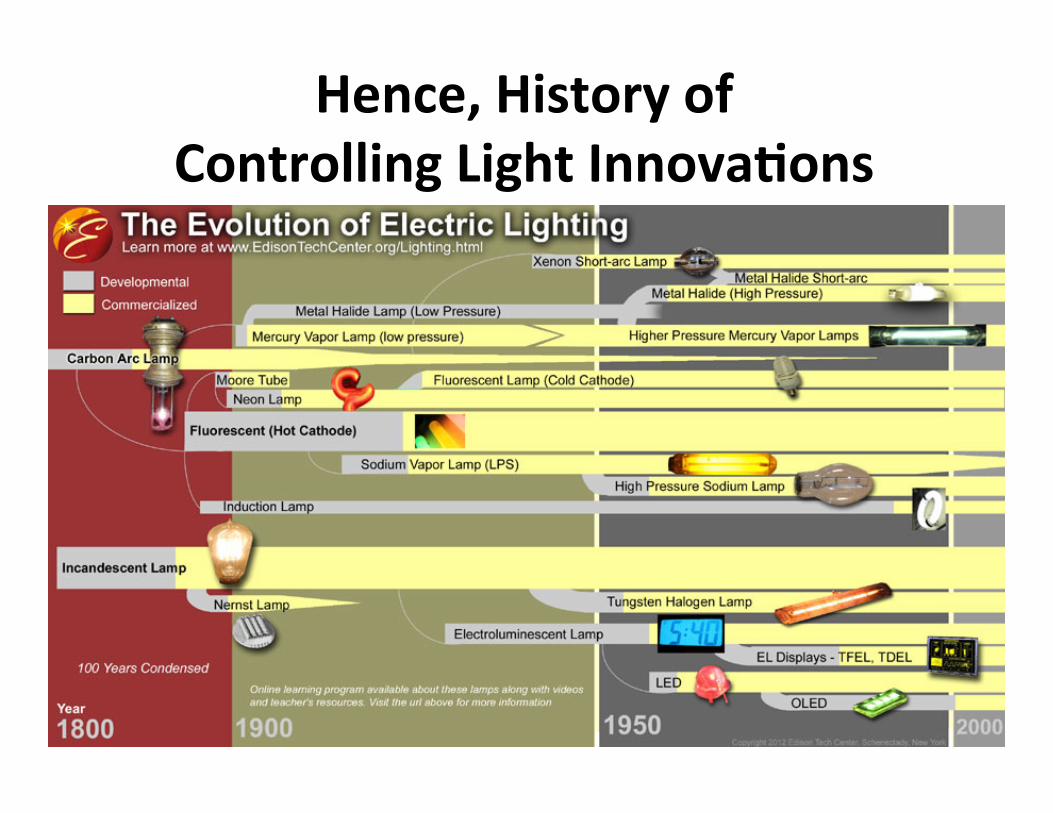
Hence, History of Controlling Light Innova6ons
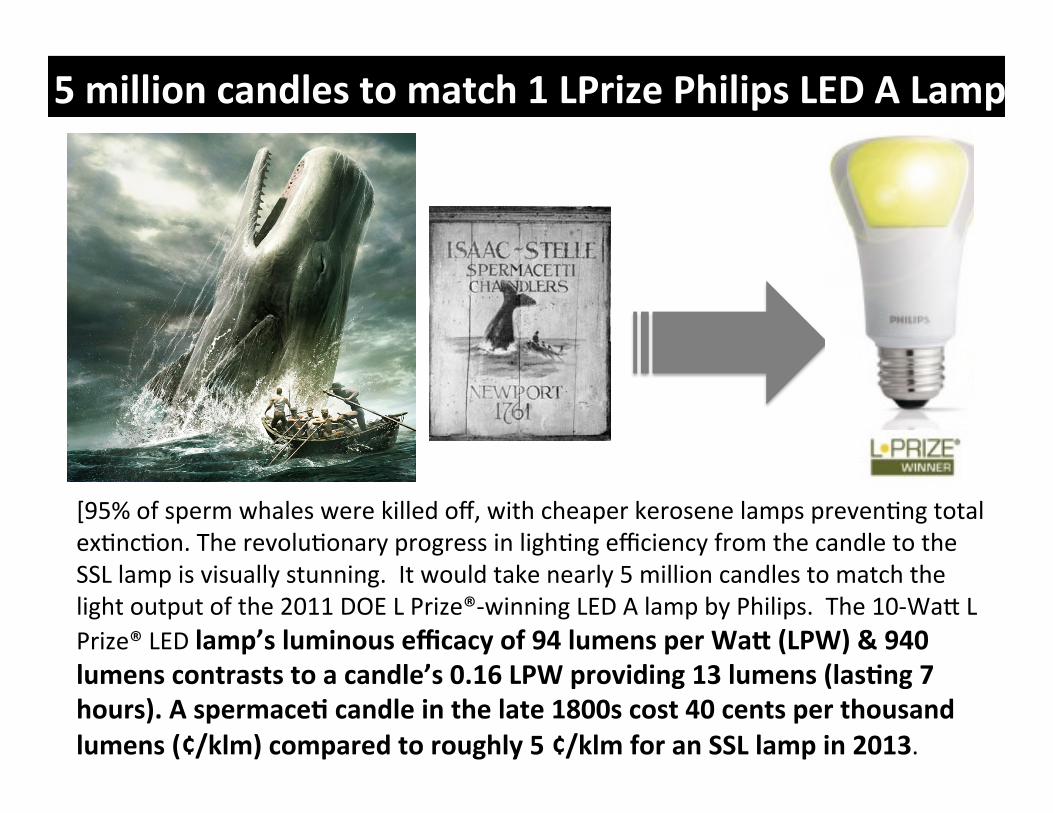
[95% of sperm whales were killed off, with cheaper kerosene lamps preven>ng total ex>nc>on. The revolu>onary progress in ligh>ng efficiency from the candle to the SSL lamp is visually stunning. It would take nearly 5 million candles to match the light output of the 2011 DOE L Prize®-‐winning LED A lamp by Philips. The 10-‐Wa2 L Prize® LED lamp’s luminous efficacy of 94 lumens per WaL (LPW) & 940 lumens contrasts to a candle’s 0.16 LPW providing 13 lumens (las6ng 7 hours). A spermace6 candle in the late 1800s cost 40 cents per thousand lumens (¢/klm) compared to roughly 5 ¢/klm for an SSL lamp in 2013.
5 million candles to match 1 LPrize Philips LED A Lamp
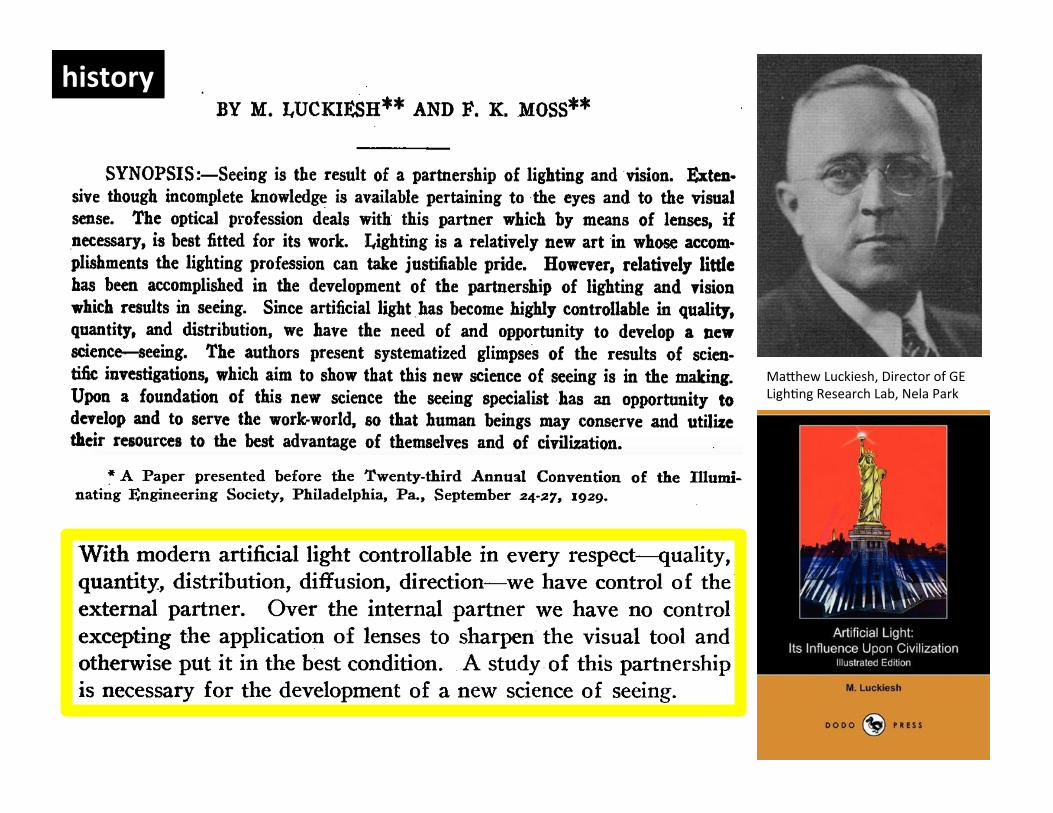
Ma2hew Luckiesh, Director of GE Ligh>ng Research Lab, Nela Park
history

Norman Macbeth, Editor, Ligh6ng Journal, response comments to “Science of Seeing”
September 27, 1929, 23rd IES Conven6on
October 29, 1929 Black Tuesday, Great Crash
history
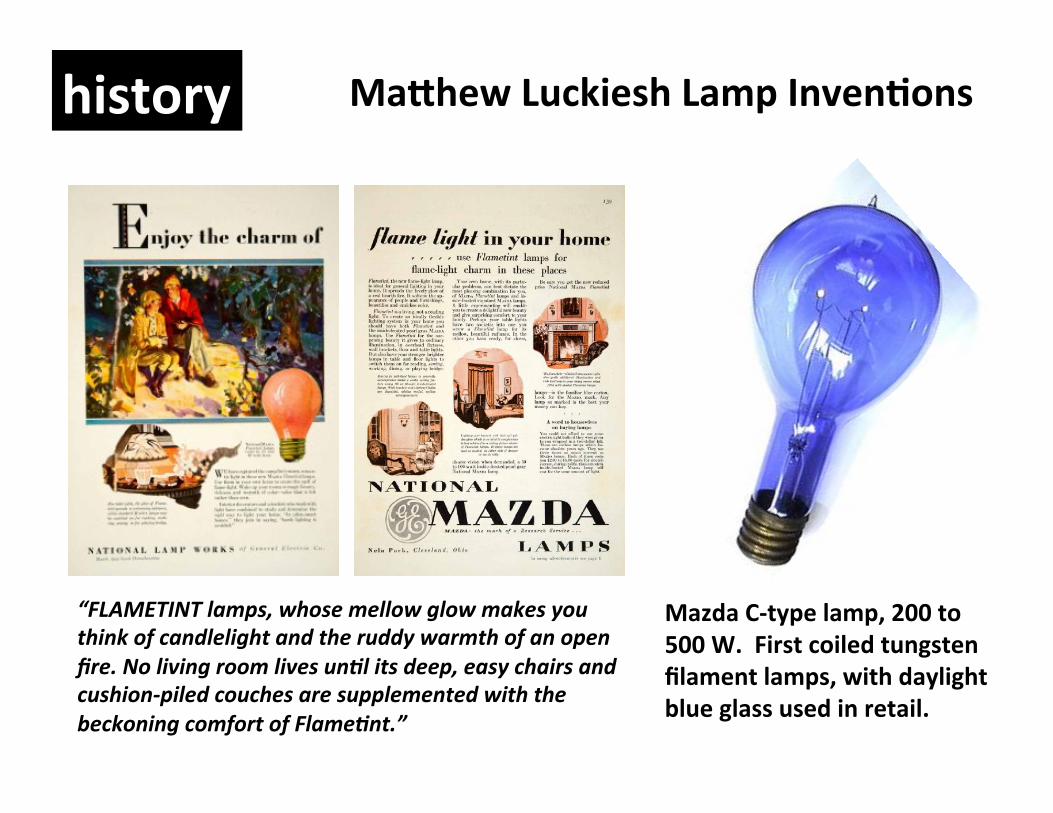
MaLhew Luckiesh Lamp Inven6ons
Mazda C-‐type lamp, 200 to 500 W. First coiled tungsten filament lamps, with daylight blue glass used in retail.
“FLAMETINT lamps, whose mellow glow makes you think of candlelight and the ruddy warmth of an open fire. No living room lives unLl its deep, easy chairs and cushion-‐piled couches are supplemented with the beckoning comfort of FlameLnt.”
history
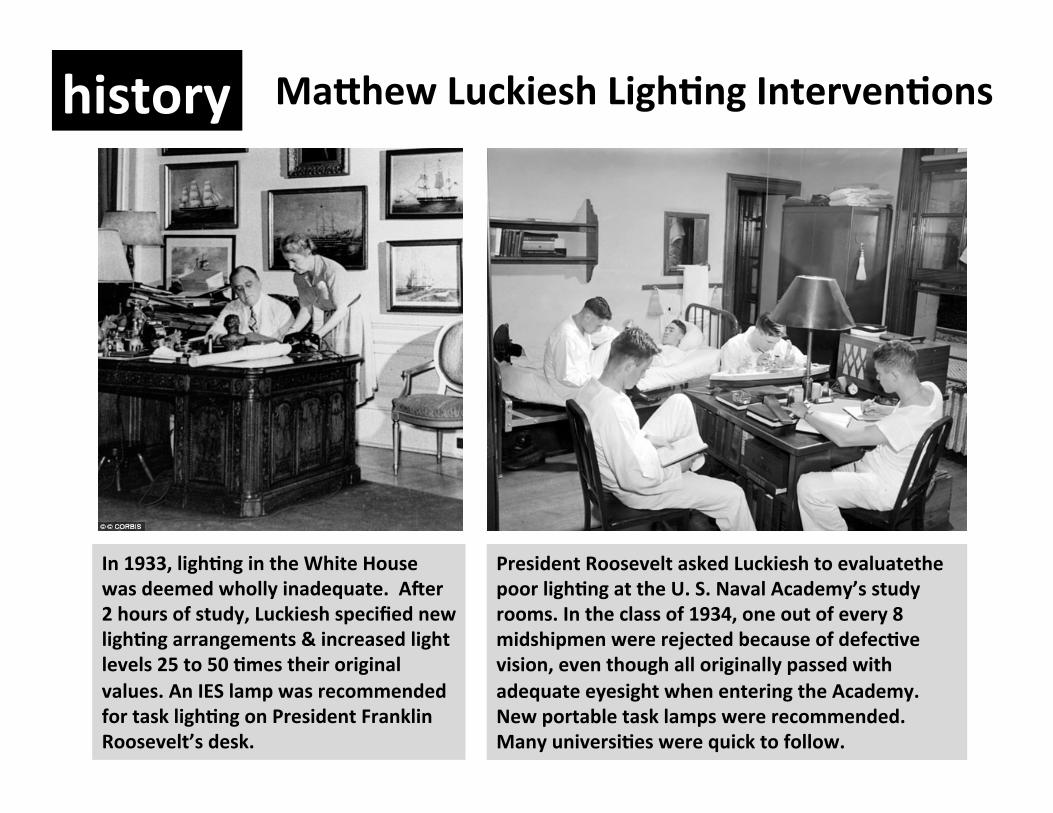
MaLhew Luckiesh Ligh6ng Interven6ons
In 1933, ligh6ng in the White House was deemed wholly inadequate. Aher 2 hours of study, Luckiesh specified new ligh6ng arrangements & increased light levels 25 to 50 6mes their original values. An IES lamp was recommended for task ligh6ng on President Franklin Roosevelt’s desk.
President Roosevelt asked Luckiesh to evaluatethe poor ligh6ng at the U. S. Naval Academy’s study rooms. In the class of 1934, one out of every 8 midshipmen were rejected because of defec6ve vision, even though all originally passed with adequate eyesight when entering the Academy. New portable task lamps were recommended. Many universi6es were quick to follow.
history

R&D Plan
Page 45
these light sources is also dangerous due to the risk of fires and toxicity of the fuel, which contains a high proportion of heavy particulates [45].
The rapid growth of the solar lantern market, which rose from $200 million in 2013 to $500 million in 2014, would have been impossible without LED sources. The increased efficacy leads to substantial reduction in the cost of solar panels and storage batteries, far outweighing the added cost of the LEDs. Moreover, the small size of LEDs enables the design of rugged devices with more effective optics in a wide range of form factors [46].
On a community level, the availability of highly efficient lights that can be driven easily by low voltage DC current is leading to affordable solar-powered streetlights and enabling evening classes in schools, extended operation of health clinics, and other social activities in rural communities that were previously impractical.
SSL will allow many countries to provide more adequate lighting with minimal additional energy requirements. Nevertheless, the latent demand for good lighting is so great in the developing world that the increased energy consumption may offset energy savings that are made through increased efficacies. In particular, demand for lighting in Africa and certain parts of Asia is likely to increase over the next decade as these economies grow. This scenario provides even greater motivation for the development of higher efficacy SSL sources, the more efficient utilization of light, and the increased adoption of controls to minimize unnecessary light production.
4.2 Economic Impact The impact of lighting on the global economy, as estimated by the International Solid State Lighting Alliance (ISA) is shown in Figure 4.5 [35].
Figure 4.5 Impact of Lighting on the Global Economy in 2014 Source: ISA, Global Solid State Lighting Industry Status Report and Market Trends 2014, 2014 [35]
Impact Ligh6ng Global Economy in 2014
Source: Intl SSL Alliance, Global Solid State Ligh7ng Industry Status Report and Market Trends 2014, hCp://isa-‐world.org/show.php?conten7d=243 i
now
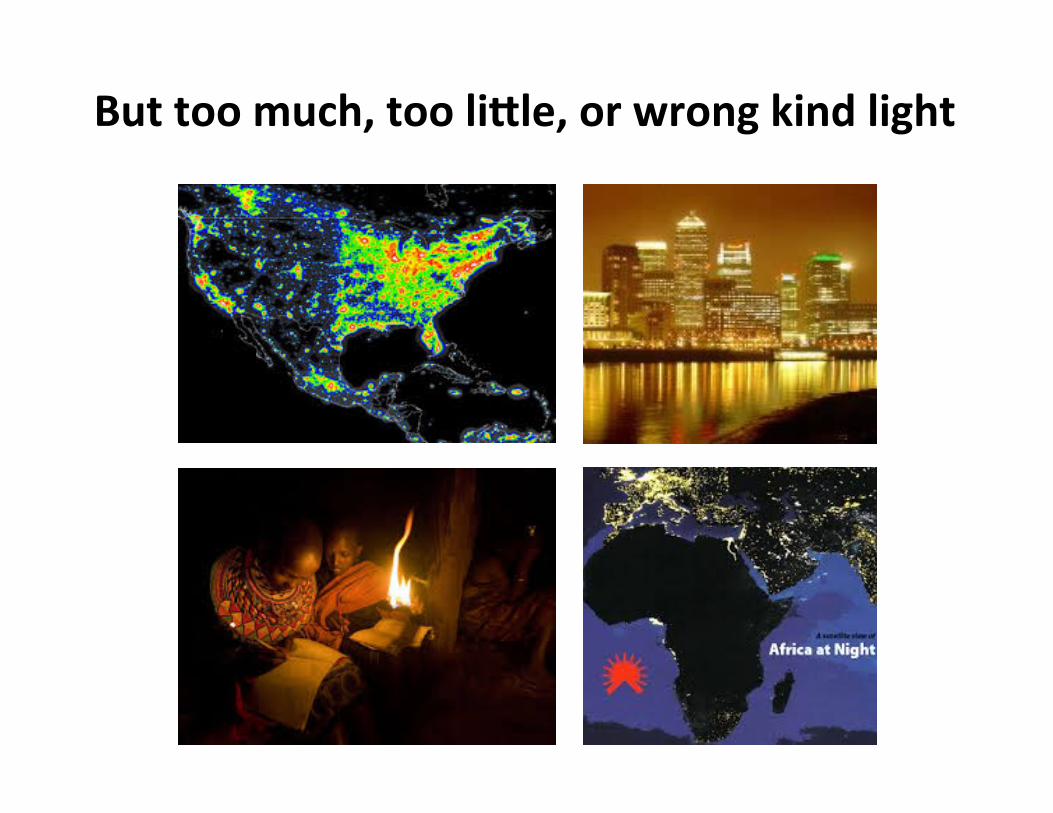
But too much, too liLle, or wrong kind light
would explain our observations that denervation of iBAT doesnot increase body weight. Only 24-h light exposure decreasessympathetic outflow to such an extent that mice increase sig-nificantly in body weight. Of note, the effects of light exposure onBAT are independent of melatonin secretion, because C57BL/6Jmice are genetically melatonin deficient (27). However, wecannot exclude the possibility that in humans melatonin doesplay a role in the association between light pollution and adi-posity as administration of melatonin increases BAT growth (28)and activity (29, 30) in hamsters and rats.Based on our collective data, we thus propose the following
mechanism by which prolonging daily light exposure increasesadiposity: prolonged day length dampens the SCN amplitude,thereby lowering sympathetic outflow toward BAT resulting indecreased β3-adrenergic signaling and thermogenesis in brownadipocytes. As a consequence, the uptake of VLDL-TG derivedfatty acids and glucose by BAT is reduced. The decreasedcombustion of fatty acids by BAT at equal energy intake thusresults in a positive energy balance and therefore storage oflipids in WAT (Fig. 5).Recent evidence suggests that BAT activity in humans is phys-
iologically regulated by the biological clock. The detectability ofBAT by [18F]fluorodeoxyglucose-PET-CT imaging at room tem-perature follows a circannual cycle, both in the northern andsouthern hemispheres (31–33), with low detectability of BAT insummer (i.e., short day) compared with winter (i.e., long day).Although differences in outside temperature over the year wouldbe a likely explanation for this phenomenon, the detectability ofBAT showed a stronger correlation with day length than with
outside temperature (31). Based on our present data, the dailylight exposure may thus well explain the circannual cycle of BATdetectability. Similarly, impaired BAT activity may also explain, atleast partly, the relationship between obesity and disturbances incircadian rhythmicity in humans by light pollution (2, 3, 34), andpossibly also by shift work (35–37) and sleep curtailment (1, 38, 39).Additionally, our data may provide the link in the relationshipbetween exposure to light in the bedroom and obesity (4). Thesuggested causal relationship has clear implications for the pre-vention of obesity in humans. Although the association betweenlight in the bedroom and BAT activity in humans remains to beinvestigated, future lifestyle advice could include instructing peopleto darken their bedroom.In conclusion, our study provides evidence that prolonged
daily light exposure increases body fat mass through reduction ofBAT activity. The present findings support the hypothesis thatthe relationship between disturbed circadian rhythmicity andadiposity in humans is mediated by impaired BAT activity.
Materials and MethodsAnimal Study. All animal experiments were approved by the institutionalethics committee on animal care and experimentation at Leiden UniversityMedical Center, Leiden, The Netherlands. Nine- to 12-wk-old male C57BL/6Jmice (Charles River) were single-housed in clear plastic cages within light-tight cabinets at constant room temperature of 22 °C. Stable temperatureinside the light-tight cabinets was verified in 12-h vs. 24-h light conditions.The cages were illuminated with white fluorescent light with an intensity of∼85 μW/cm2. Before start of the experiment, mice were kept on a regular 12:12light-dark cycle. Mice had ad libitum access to standard laboratory chow(Special Diets Services) and water throughout experiments. Mice were matchedon body weight and light intervention consisted of subjecting mice to either 12-,16-, or 24-h light exposure per day (i.e., 24 h) for the duration of 5 wk (n = 9).
In a second study, mice were randomized to either bilateral selectivesympathetic denervation (n = 17) of iBAT or sham surgery (n = 6). Mice wereanesthetized (isofluorane inhalation) and a midline incision of the skin wasmade, exposing both iBAT pads. Sympathetic branches were visualized andcut on both sides. Wounds were closed and mice received postoperativeanalgesia (0.03 mg/kg buprenorphine; Temgesic, Merck). Successful de-nervation was confirmed retrospectively by the absence of TH in iBAT sec-tions (see below). After 4 d of recovery, mice that underwent denervationwere randomized based on body weight and exposed to 12-, 16-, or 24-hlight per day for 5 wk; sham-operated mice were exposed to 12-h light perday and served as a reference group.
Body Composition, Food Intake, and Locomotor Activity. At the end of theexperiment, body weight was measured and body composition (i.e., lean massand fat mass) was determined in conscious mice using an EchoMRI-100(EchoMRI). Food intake was monitored by weighing food on lids either duringlast 2 wk of light intervention or throughout the 5 wk of light exposure(denervation experiment). Behavioral activity ofmicewas assessed with passiveinfrared detectors and recorded using Actimetrics software (Wilmette).
TG and Glucose Clearance. At the end of the experiments, the clearance of TGand glucose was assessed. Glycerol tri[3H]oleate ([3H]TO) labeled VLDL-likeemulsion particles (80 nm) were prepared as previously described (40) and[14C]deoxyglucose ([14C]DG) was added (ratio 3H:14C = 6:1). After 5 wk oflight intervention, mice were fasted for 4 h [9:00 AM to 1:00 PM clock time,corresponding to Zeitgeber time (ZT) 2–6 for 12 h group and ZT 4–8 for the16-h group] and intravenously injected with the radiolabeled emulsionparticles (1.0 mg TG in 200 μL PBS) and glucose via the tail vein. At timepoints t = 2, 5, 10, and 15 min after injection, blood was taken from the tailvein to determine the serum decay of both radiolabels. Immediately afterthe last blood withdrawal, mice were killed by cervical dislocation andperfused with ice-cold PBS for 5 min. Organs were harvested, weighed,and the uptake of 3H and 14C radioactivity was determined.
Histology. Formalin-fixed paraffin-embedded iBAT and gWAT sections werecut (5 μm). To determine gWAT cell size, sections were stained with Mayer’sH&E. White adipocyte size was quantified using ImageJ software. To de-termine sympathetic activation of iBAT a TH staining was performed. Sec-tions were rehydrated and incubated 15 min with 10 mM citrate buffer(pH 6.0) at 120 °C for antigen retrieval. Sections were blocked with 5% (wt/vol)BSA/PBS followed by overnight incubation with anti-TH antibody (1:2,000, AB-112;
Normal day length Prolonged day length
VLDL-TG / Glucose
- -
Adiposity
β3-AR
Ucp-1
NA
VLDL-TG / GlucoseDOPA
Tyr+ +
TG
FA
VLDL-TG / Glucose
HSLCREB
AMPK
TH
FA
Fig. 5. Proposed model on how light exposure modulates body fat massthrough BAT activity. Daily light-exposure duration is perceived by thesuprachiasmatic nucleus, which signals toward BAT via the sympatheticnervous system. At normal day length uptake of nutrients by BAT and WATis in balance, whereas increasing daily light exposure result in reduced BATactivation and subsequent storage of excess energy in WAT. The decrease innoradrenaline (NA) availability for stimulation of the β3-adrenergic receptor(B3-AR) leads to: (i) reduced phosphorylation of CREB, which decreasestranscription of UCP1; (ii) reduced phosphorylation of AMPK, resulting indecreased phosphorylation of HSL and thus decreased lipolysis.
Kooijman et al. PNAS Early Edition | 5 of 6
PHYS
IOLO
GY
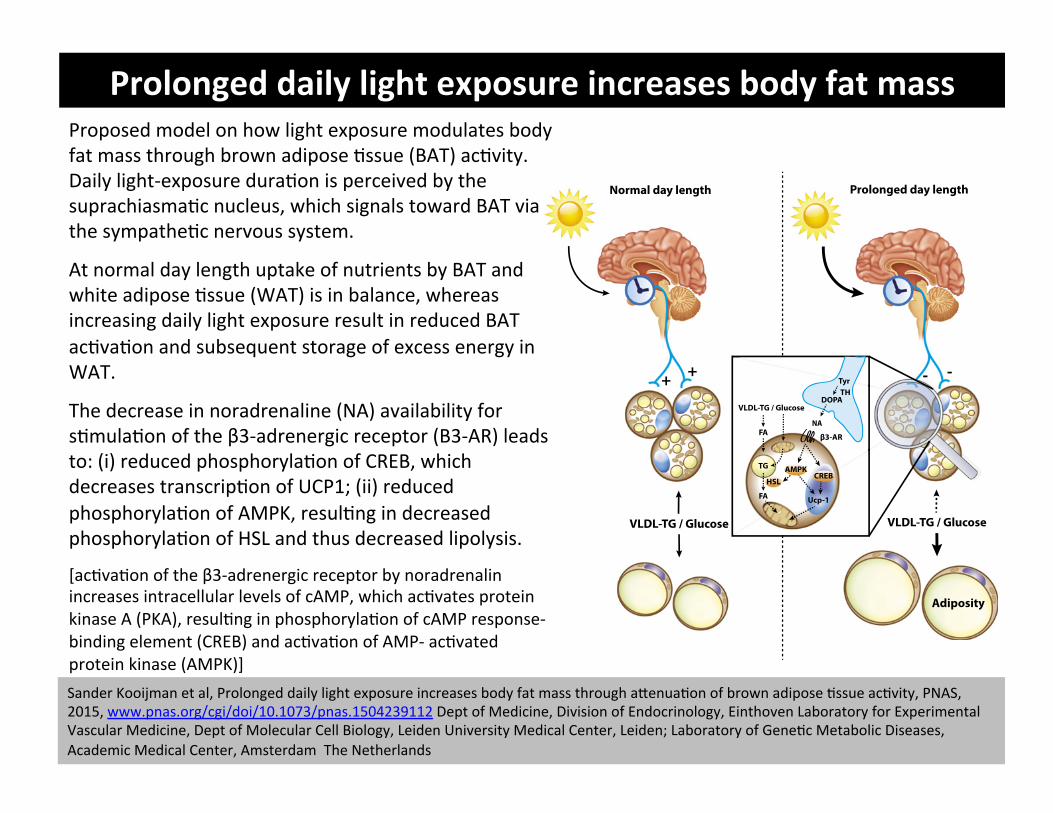
Proposed model on how light exposure modulates body fat mass through brown adipose >ssue (BAT) ac>vity. Daily light-‐exposure dura>on is perceived by the suprachiasma>c nucleus, which signals toward BAT via the sympathe>c nervous system.
At normal day length uptake of nutrients by BAT and white adipose >ssue (WAT) is in balance, whereas increasing daily light exposure result in reduced BAT ac>va>on and subsequent storage of excess energy in WAT.
The decrease in noradrenaline (NA) availability for s>mula>on of the β3-‐adrenergic receptor (B3-‐AR) leads to: (i) reduced phosphoryla>on of CREB, which decreases transcrip>on of UCP1; (ii) reduced phosphoryla>on of AMPK, resul>ng in decreased phosphoryla>on of HSL and thus decreased lipolysis.
[ac>va>on of the β3-‐adrenergic receptor by noradrenalin increases intracellular levels of cAMP, which ac>vates protein kinase A (PKA), resul>ng in phosphoryla>on of cAMP response-‐binding element (CREB) and ac>va>on of AMP-‐ ac>vated protein kinase (AMPK)] Sander Kooijman et al, Prolonged daily light exposure increases body fat mass through a2enua>on of brown adipose >ssue ac>vity, PNAS, 2015, www.pnas.org/cgi/doi/10.1073/pnas.1504239112 Dept of Medicine, Division of Endocrinology, Einthoven Laboratory for Experimental Vascular Medicine, Dept of Molecular Cell Biology, Leiden University Medical Center, Leiden; Laboratory of Gene>c Metabolic Diseases, Academic Medical Center, Amsterdam The Netherlands
Prolonged daily light exposure increases body fat mass
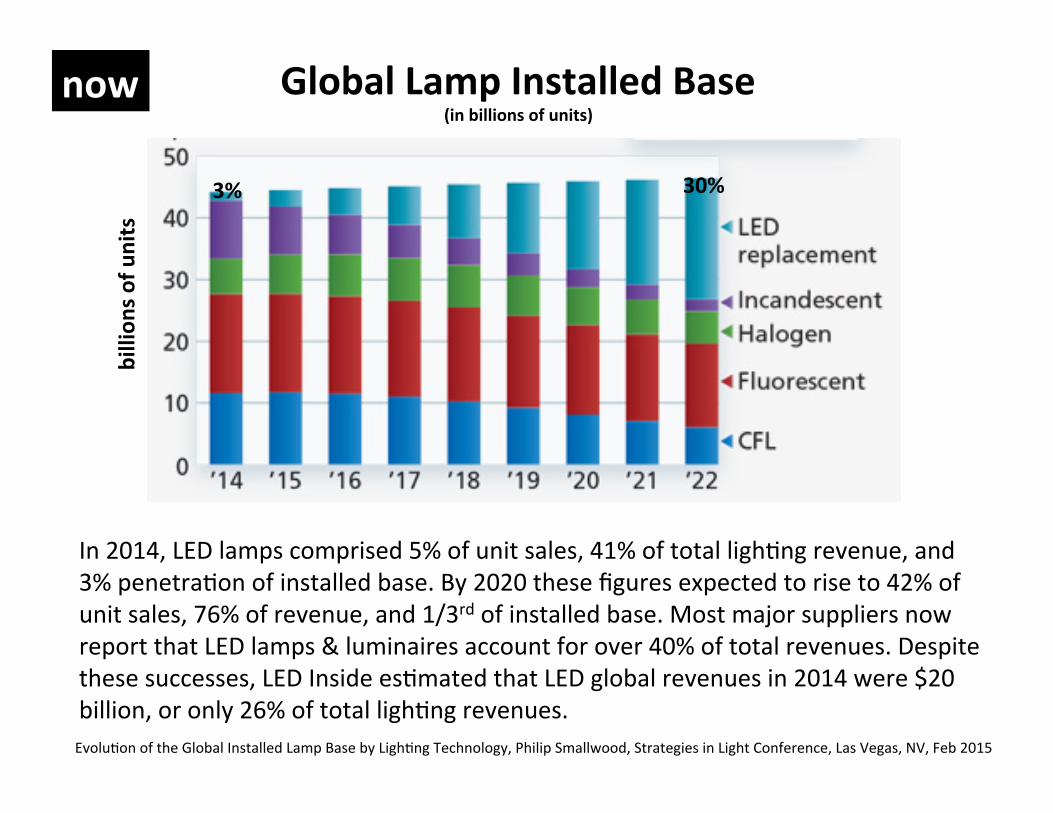
In 2014, LED lamps comprised 5% of unit sales, 41% of total ligh>ng revenue, and 3% penetra>on of installed base. By 2020 these figures expected to rise to 42% of unit sales, 76% of revenue, and 1/3rd of installed base. Most major suppliers now report that LED lamps & luminaires account for over 40% of total revenues. Despite these successes, LED Inside es>mated that LED global revenues in 2014 were $20 billion, or only 26% of total ligh>ng revenues. Evolu>on of the Global Installed Lamp Base by Ligh>ng Technology, Philip Smallwood, Strategies in Light Conference, Las Vegas, NV, Feb 2015
Global Lamp Installed Base (in billions of units) billions of u
nits
now
3% 30%
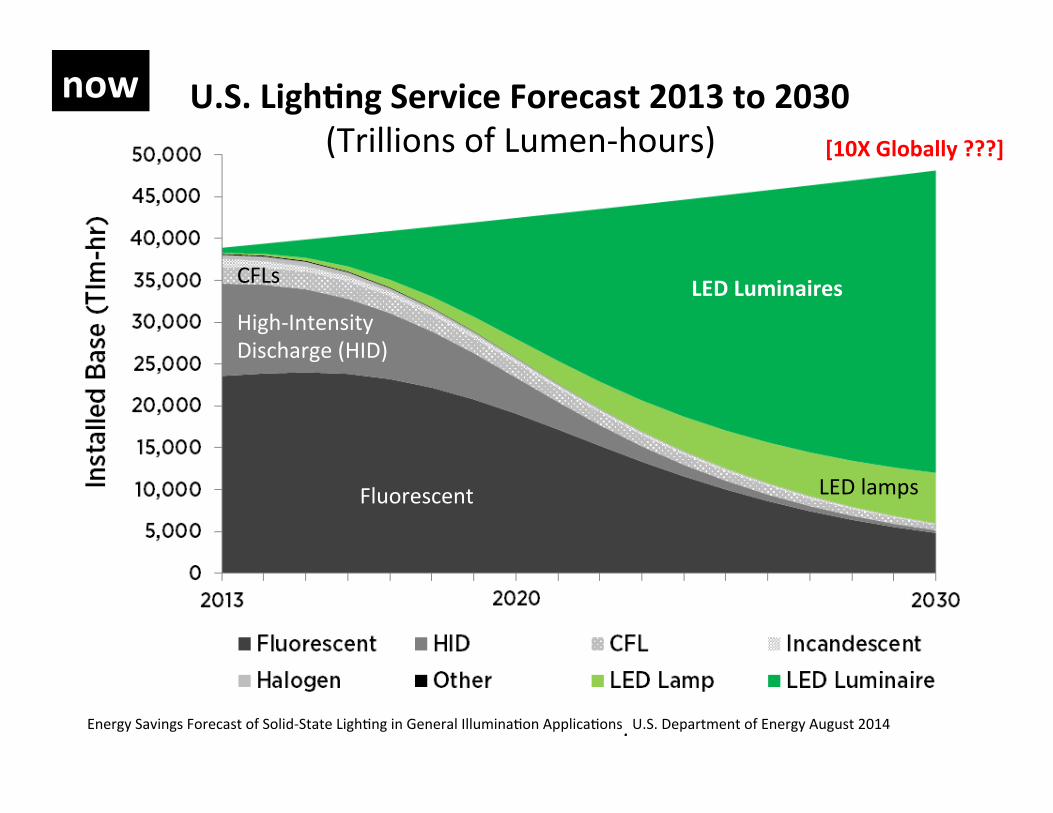
Energy(Savings(Forecast(of(SolidPState(LighNng(in(General(IlluminaNon(ApplicaNons,(U.S.(Department(of(Energy(August(2014(
Page 10
The following sections describe the major results of the forecast model for each of the lighting submarkets.
Residential, commercial, and industrial lighting employ many of the same lighting technologies in their indoor lighting applications. There are many similarities between the commercial and industrial sectors in terms of lighting technology and use trends, as lighting applications in these sectors are characterized by long operating hours (often greater than 10 hours per day) and higher lumen output requirements compared to the residential sector. Commercial and industrial lighting consumers are typically facility managers who are highly concerned with the lifetime costs of a lighting product. Therefore, technologies with high efficacy and long lifetime are more popular in these sectors, despite higher initial costs. Because of this distinct preference, both the commercial and industrial sectors are currently dominated by highly efficient and long lifetime linear fluorescent and HID technologies, which are primarily used in the linear fixture and low/high bay submarkets. Combined, the linear fixture and low/high bay submarkets represent 85% and 88% of the 2013 general illumination energy consumption in the commercial and industrial sectors, respectively.
LEDs are projected to only offer incremental improvement over linear fluorescent and HID technologies in the near-term; however, with expected performance and price improvements, LEDs hold great promise in the long-run for cutting energy consumption in the commercial and
U.S.'Ligh6ng'Service'Forecast'2013'to'2030'(Trillions(of(LumenPhours)(
Fluorescent(
HighPIntensity((Discharge((HID)(
LED'Luminaires'
LED(lamps(
CFLs(
[10X Globally ???]
now

Multi-Year Program Plan
Page 1
1 INTRODUCTION According to a recent United States (U.S.) Department of Energy (DOE) report, lighting consumed about 18 percent of the total site electricity use in 2010 in the U.S [1]. A second DOE report also finds that by 2025, solid-state lighting (SSL) technology offers the potential to save 217 terawatt-hours (TWh), or about one-third of current site electricity consumption used for lighting in the U.S. This projected savings in site energy consumption would correspond to about 2.5 quadrillion British thermal units (Btus), or “quads”, of primary energy generation, which is approximately equal to the projected electricity generation of wind power and twelve times that of solar power in 2025 (as shown in Figure 1.1). At a price of $0.10/kilowatt-hour, this would correspond to an annual dollar savings of $21.7 billion [2].
FIGURE 1.1 2025 PROJECTED ELECTRICITY SAVINGS FROM SSL [3]
This demonstrates that SSL provides a significant opportunity to reduce energy consumption, thereby improving domestic energy security and reducing greenhouse gas emissions. The U.S. Department of Energy has responded to this opportunity with the formation of the Solid-State Lighting Program.
The energy savings projections assume significant progress in efficient SSL sources, as well as widespread market adoption. Specifically, by 2025, this analysis assumes SSL sources will reach a
By 2025, the goal of the DOE SSL Program is to develop advanced solid-state lighting technologies that — compared to conventional lighting technologies — are much more energy efficient, longer lasting, and cost competitive by targeting a product system efficiency of 50 percent with lighting that accurately reproduces sunlight spectrum.
100%
2025 Projected Wind Power Electricity Generation
12X
2025 Projected Solar Power Electricity Generation
20 Million
U.S. Household Electricity Use
217 TWh
The 2025 Projected Electricity Savings from Solid-State Lighting
DOE,(SolidPState(LighNng(Research(and(Development,(MulNPYear(Program(Plan(,(MAY(2014(
Within'10'
years'
future

Law of Accelerating ReturnsInformation
technologies Communication
technologies
Miniaturized technologies
COIN technologies
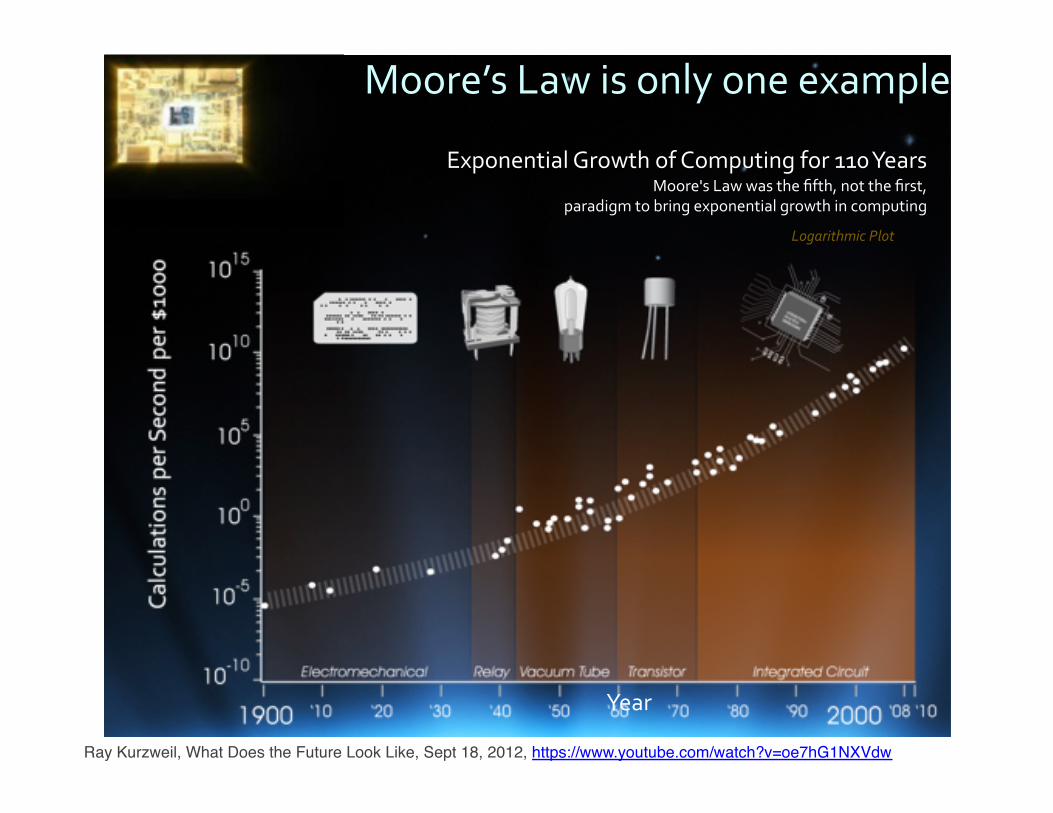
Moore’s)Law)is)only)one)example
Exponential)Growth)of)Computing)for)110)Years)Moore's)Law)was)the)fifth,)not)the)first,)
paradigm)to)bring)exponential)growth)in)computing
Year
Logarithmic+Plot
15Ray Kurzweil, What Does the Future Look Like, Sept 18, 2012, https://www.youtube.com/watch?v=oe7hG1NXVdw

Information Technologies (of all kinds) double their power (price performance,
capacity, bandwidth) every 1-2 years
Law of Accelerating Returns
Logarithmic+Plot Logarithmic+Plot
Logarithmic+Plot Logarithmic+Plot
16Ray Kurzweil, What Does the Future Look Like, Sept 18, 2012, https://www.youtube.com/watch?v=oe7hG1NXVdw
Doubling)(or)Halving)times)
• Dynamic RAM Memory “Half Pitch” Feature Size 5.4 years
• Dynamic RAM Memory (bits per dollar) 1.5 years
• Average Transistor Price 1.6 years
• Microprocessor Cost per Transistor Cycle 1.1 years
• Total Bits Shipped 1.1 years
• Processor Performance in MIPS 1.8 years
• Transistors in Intel Microprocessors 2.0 years
• Microprocessor Clock Speed 2.7 years
22

Law of Accelerating ReturnsCommunications technology 2nd exponential
trend, is doubling price-performance, bandwidth, capacity every 12-24 months
Ray Kurzweil, What Does the Future Look Like, Sept 18, 2012, https://www.youtube.com/watch?v=oe7hG1NXVdw
Logarithmic+Plot Logarithmic+Plot
27
Logarithmic+Plot Logarithmic+Plot
27
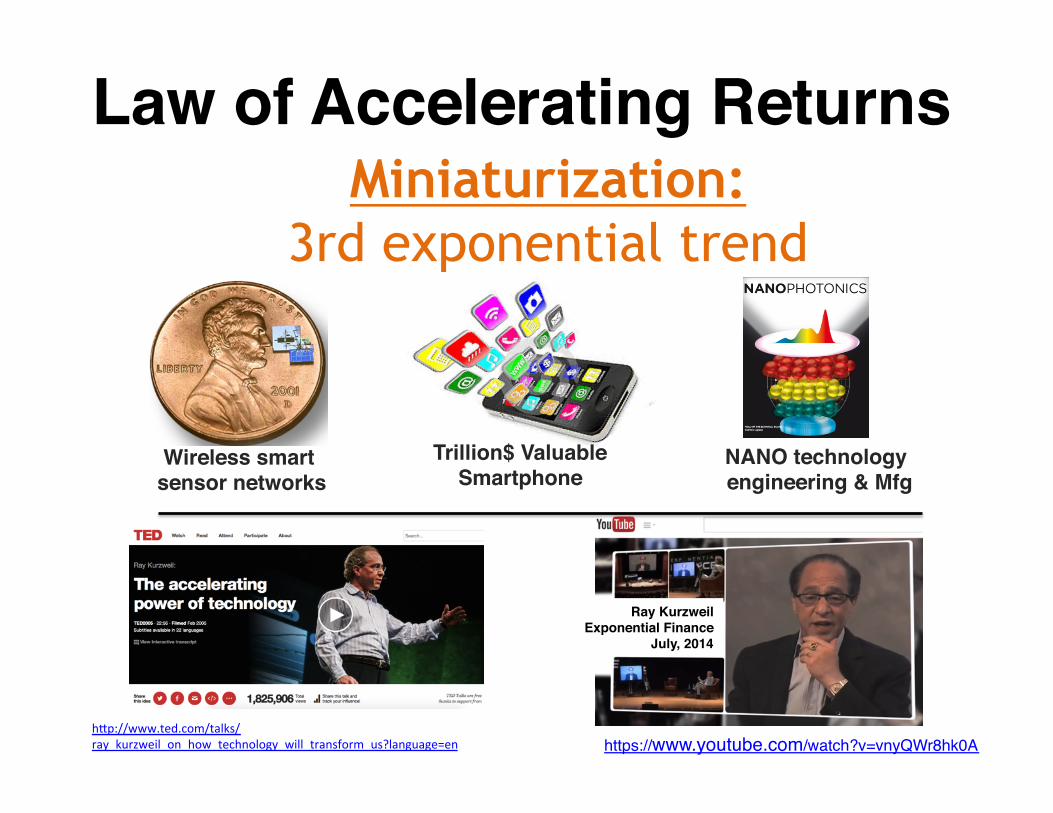
Law of Accelerating ReturnsMiniaturization:
3rd exponential trend
h2p://www.ted.com/talks/ray_kurzweil_on_how_technology_will_transform_us?language=en https://www.youtube.com/watch?v=vnyQWr8hk0A
Ray KurzweilExponential Finance
July, 2014
Wireless smart sensor networks
Trillion$ ValuableSmartphone
NANO technology engineering & Mfg

Copyright © 2014 IDTechEx | www.IDTechEx.com
Internet of Things
Transceiver 45%
Sensors 45%
Micro Proc 5%
Other 5%
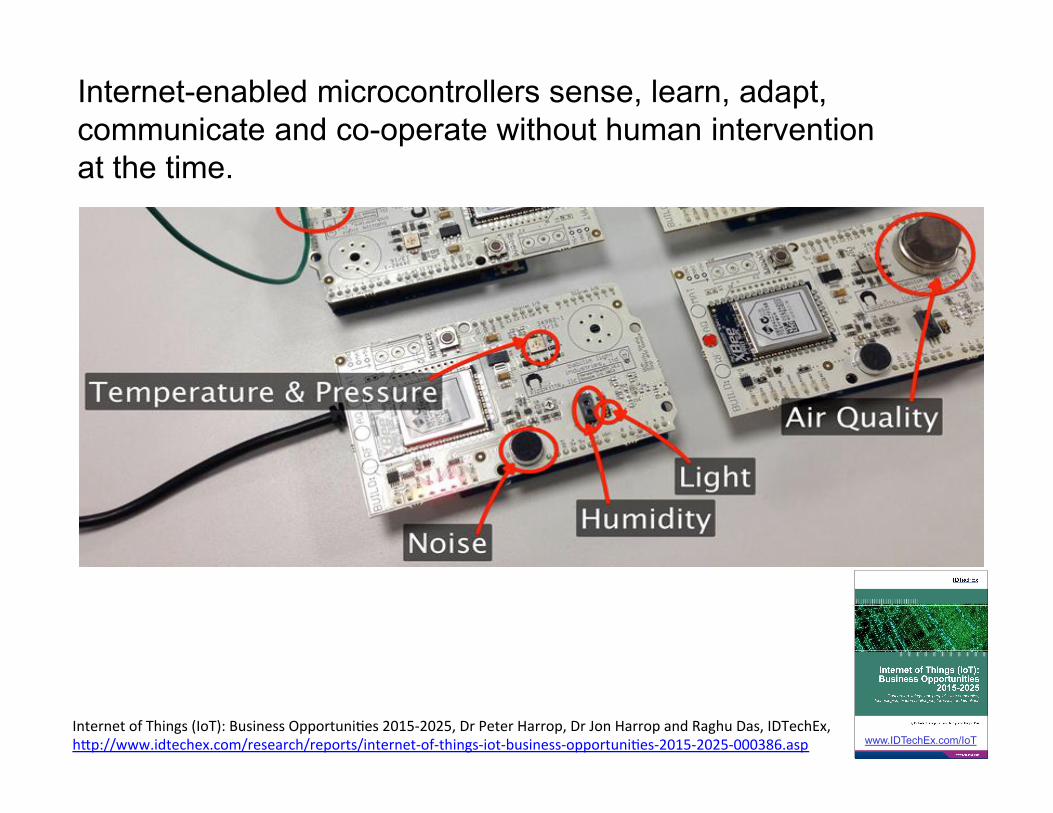
Microcontrollers with up to ten
sensors
Downloaded by Michael Totten - [email protected] 09 Jun 2015 21:44:46Internet of Things (IoT): Business Opportuni>es 2015-‐2025, Dr Peter Harrop, Dr Jon Harrop and Raghu Das, IDTechEx, h2p://www.idtechex.com/research/reports/internet-‐of-‐things-‐iot-‐business-‐opportuni>es-‐2015-‐2025-‐000386.asp
Copyright © 2014 IDTechEx | www.IDTechEx.com
For more on IoT and IoP see…
www.IDTechEx.com/IoT www.IDTechEx.com/IoP
Downloaded by Michael Totten - [email protected] 09 Jun 2015 21:44:46
Copyright © 2014 IDTechEx | www.IDTechEx.com
Internet of Things Internet-enabled microcontrollers sense, learn, adapt, communicate and co-operate without human intervention at the time.
Downloaded by Michael Totten - [email protected] 09 Jun 2015 21:44:46
Internet of Things (IoT): Business Opportuni>es 2015-‐2025, Dr Peter Harrop, Dr Jon Harrop and Raghu Das, IDTechEx, h2p://www.idtechex.com/research/reports/internet-‐of-‐things-‐iot-‐business-‐opportuni>es-‐2015-‐2025-‐000386.asp
Copyright © 2014 IDTechEx | www.IDTechEx.com
For more on IoT and IoP see…
www.IDTechEx.com/IoT www.IDTechEx.com/IoP
Downloaded by Michael Totten - [email protected] 09 Jun 2015 21:44:46

Law of Accelerating ReturnsCOllaborative Intelligence/Innovation
Networks (COINs) 4th exponential trend Wikipedia, the world’s largest and fastest growing encyclopedia, premier example of an open source COIN to date. It is one of the top 5 to 7 daily visited Internet sites in the world (monthly readership of ~500 million worldwide).
34 million free usable articles in 288 languages that have been written by over 50 million registered users and numerous anonymous contributors worldwide.
15,000 volumes equivalent to Encyclopedia Britannica.
100 million hours to create Wikipedia over the first decade. By comparison, Americans spend 132 million hours each day on Facebook (430 million hours each day worldwide); and Americans watch 100 million hours of TV ads every weekend.
There are thousands of open source COINs currently operating
Proliferation of Open Source COINsCollaborative Intelligence/Innovation Networks

Personal Pocket SuperComputers
SuperComputerNetworkers
Human & KnowledgeCapital
Social, Civic & IntelligenceCapital
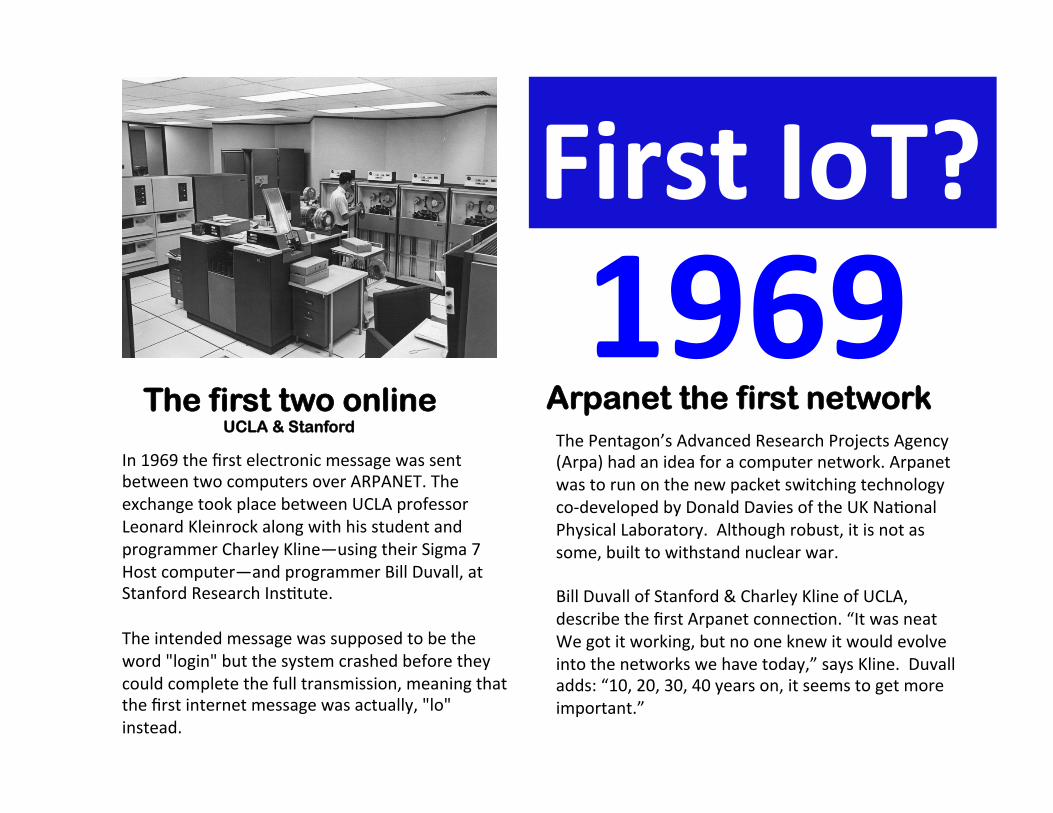
In 1969 the first electronic message was sent between two computers over ARPANET. The exchange took place between UCLA professor Leonard Kleinrock along with his student and programmer Charley Kline—using their Sigma 7 Host computer—and programmer Bill Duvall, at Stanford Research Ins>tute. The intended message was supposed to be the word "login" but the system crashed before they could complete the full transmission, meaning that the first internet message was actually, "lo" instead.
The Pentagon’s Advanced Research Projects Agency (Arpa) had an idea for a computer network. Arpanet was to run on the new packet switching technology co-‐developed by Donald Davies of the UK Na>onal Physical Laboratory. Although robust, it is not as some, built to withstand nuclear war. Bill Duvall of Stanford & Charley Kline of UCLA, describe the first Arpanet connec>on. “It was neat We got it working, but no one knew it would evolve into the networks we have today,” says Kline. Duvall adds: “10, 20, 30, 40 years on, it seems to get more important.”
The first two online UCLA & Stanford
1969 First IoT?
Arpanet the first network

5 Michael Enescu keynote – “From Cloud to Fog & The Internet of Things” – Chicago, LinuxCon 2014
7.2 6.8 7.6
50
2010 2015 2020
0
40
30
20
10
Bill
ions
of d
evic
es
25
12.5
Inflection point
Timeline
Source: Cisco IBSG, 2011
50 Billion smart devices Adoption 5x faster than electricity, telephony
Michael(Enescu,(CTO,(Open(Standards(IniNaNve((OSI)(keynote(–(“From(Cloud(to(Fog(&(The(Internet(of(Things”(–(Chicago,(LinuxCon(2014((
1 Michael Enescu keynote – “From Cloud to Fog & The Internet of Things” – Chicago, LinuxCon 2014 1
Michael Enescu CTO Open Source Initiatives
LinuxCon 2014 – August 21

24
Trillion Sensors�(TSensors)�Vision• Mobile�sensor�market�for�volumes�not�
envisioned by�leading�market�research�organizations�in�2007,�grew�exponentially�over�200%/y�between�2007�and�2012.��
• Several�organizations�presented�their�visions�for�a�continued�growth�to�trillion(s).
• Market�research�companies�don’t�yet�see�this�growth�(see�Yole’s forecast).
• So�the�explosion�to�trillion(s)�is�likely�to�be�driven�by�applications�not�yet�envisioned by�leading�market�research�organization.
• I�launched�TSensors�Roadmap�development*�to�improve�visibility�of�needed�sensors�to�enable�accelerated�development.• 1st step:�The�TRILLION�Sensor�Universe,�
Conference�at�BSAC,�March�6,�2013• 2nd Step:�TSensors�Summit�Conference�at�
Stanford�University�with�presentations�by�global�sensor�visionaries.
10,000,000
100,000,000
1,000,000,000
10,000,000,000
100,000,000,000
1,000,000,000,000
10,000,000,000,000
100,000,000,000,000
2007 2012 2017 2022 2027 2032 2037
Sensors/year
Trillion�Sensor�Visions
"Abundance"QCOM�Swarm�Lab,�UCBBoschHewlettͲPackardIntelTI�Internet�devicesYole�MEMS�Forecast,�2012TSensors�Bryzek's�Vision10�year�slopeMobile�Sensors�Explosion
Roadmap(to(the(Trillion(Sensor(Universe,(Dr.(Janusz(Bryzek,(VP(Development,(MEMS(and(Sensing(SoluNons(Fairchild(Semiconductor(Hayward,(CA,(iNEMI(Spring(Member(MeeNng(and(Webinar,(Berkeley,(CA,(April(2,(2013(
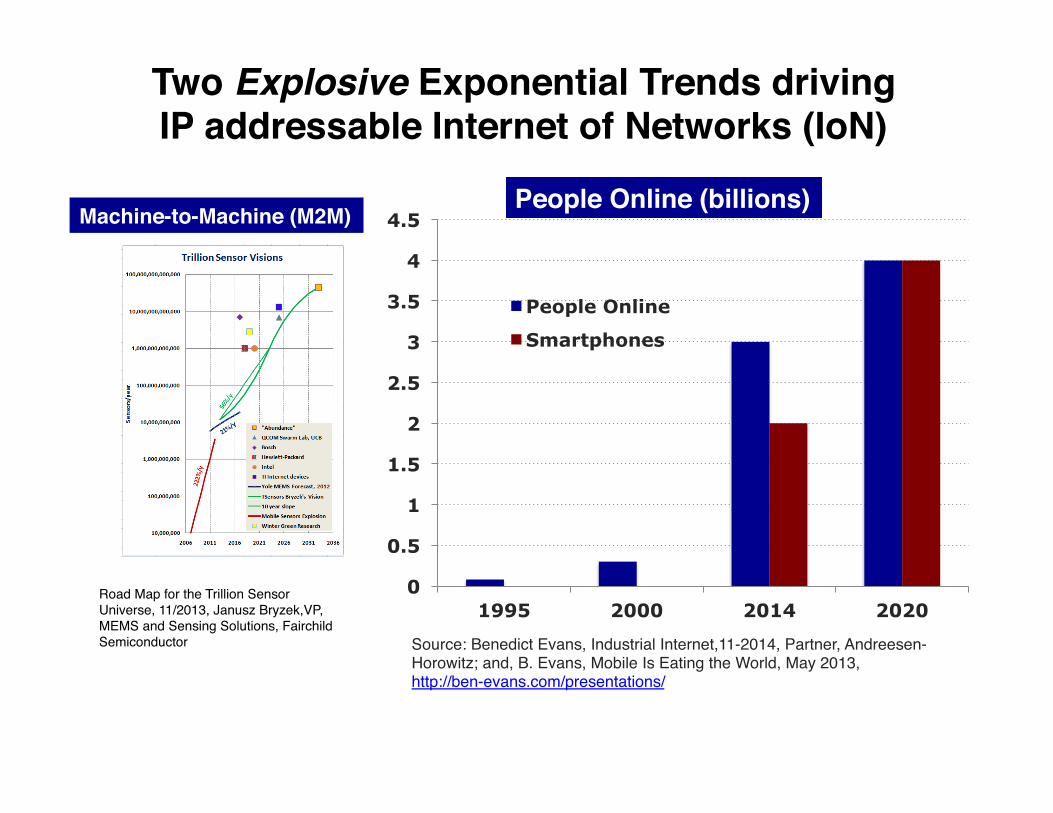
12 billion today to 50 trillion IPv6 sensors by 2032?
13
Trillion Sensors (TSensors) Visions• Mobile sensor market for volumes not
envisioned by leading market research organizations in 2007, grew exponentially 212%/y between 2007 and 2012.
• Several organizations created visions for a continued growth to trillion(s).• Market research companies don’t yet see it.• Explosion to trillion(s) is likely to be driven by new
applications not yet envisioned by leading market research organization.
• Forecasting thus needs visionaries!
0
0.5
1
1.5
2
2.5
3
3.5
4
4.5
1995 2000 2014 2020
People Online
Smartphones
People Online (billions)Machine-to-Machine (M2M)
Two Explosive Exponential Trends drivingIP addressable Internet of Networks (IoN)
Source: Benedict Evans, Industrial Internet,11-2014, Partner, Andreesen-Horowitz; and, B. Evans, Mobile Is Eating the World, May 2013, http://ben-evans.com/presentations/
Road Map for the Trillion Sensor Universe, 11/2013, Janusz Bryzek,VP, MEMS and Sensing Solutions, Fairchild Semiconductor

Digi Interna>onal, Device Cloud, h2p://www.digi.com/lp/internet-‐of-‐anything/
Internet-‐of-‐Networks
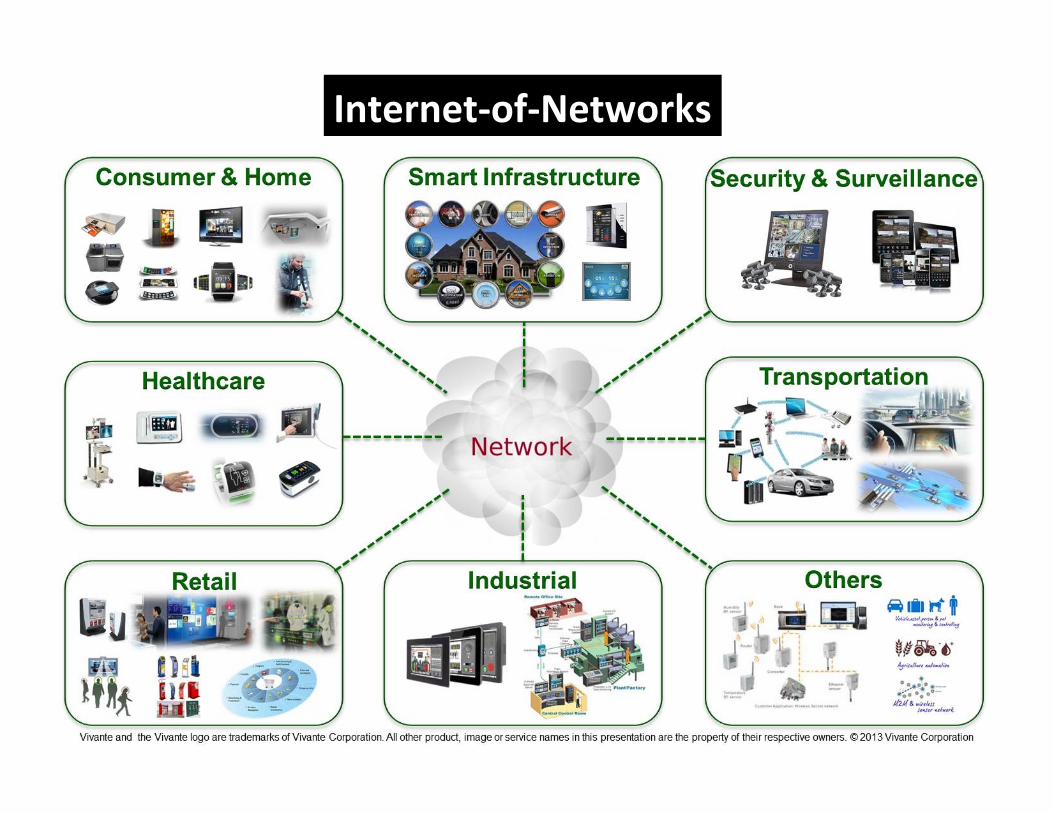
Internet-‐of-‐Networks
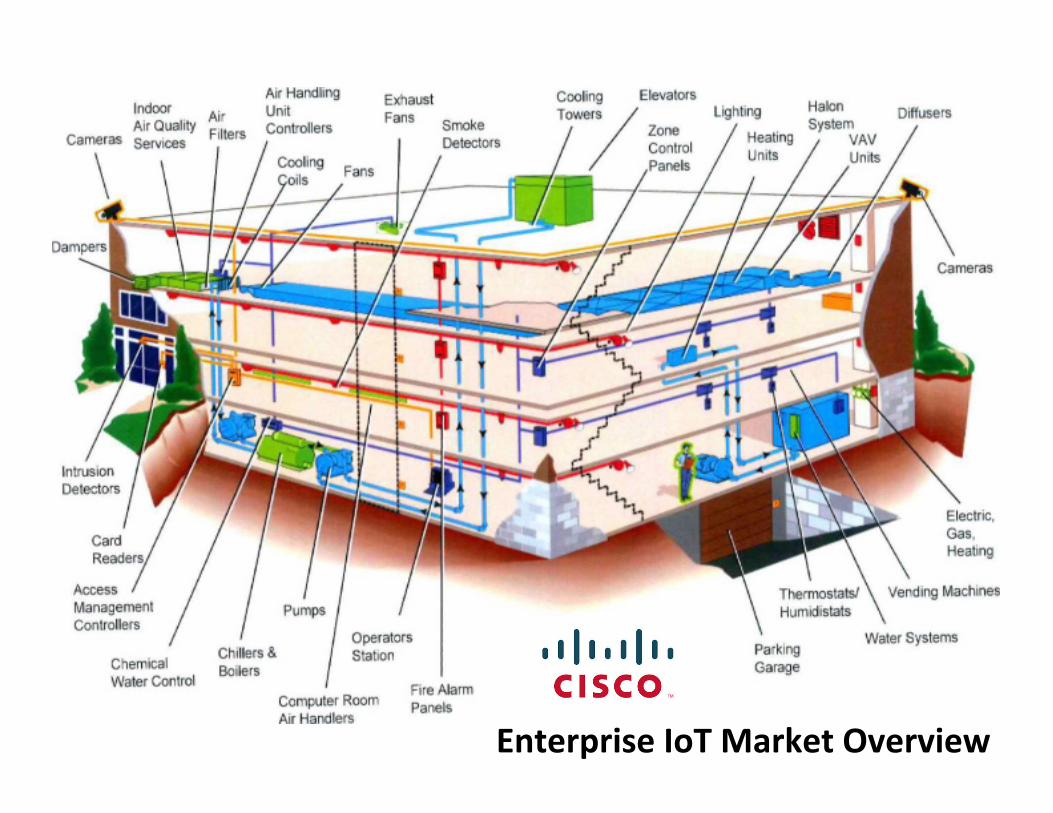
Enterprise IoT Market Overview
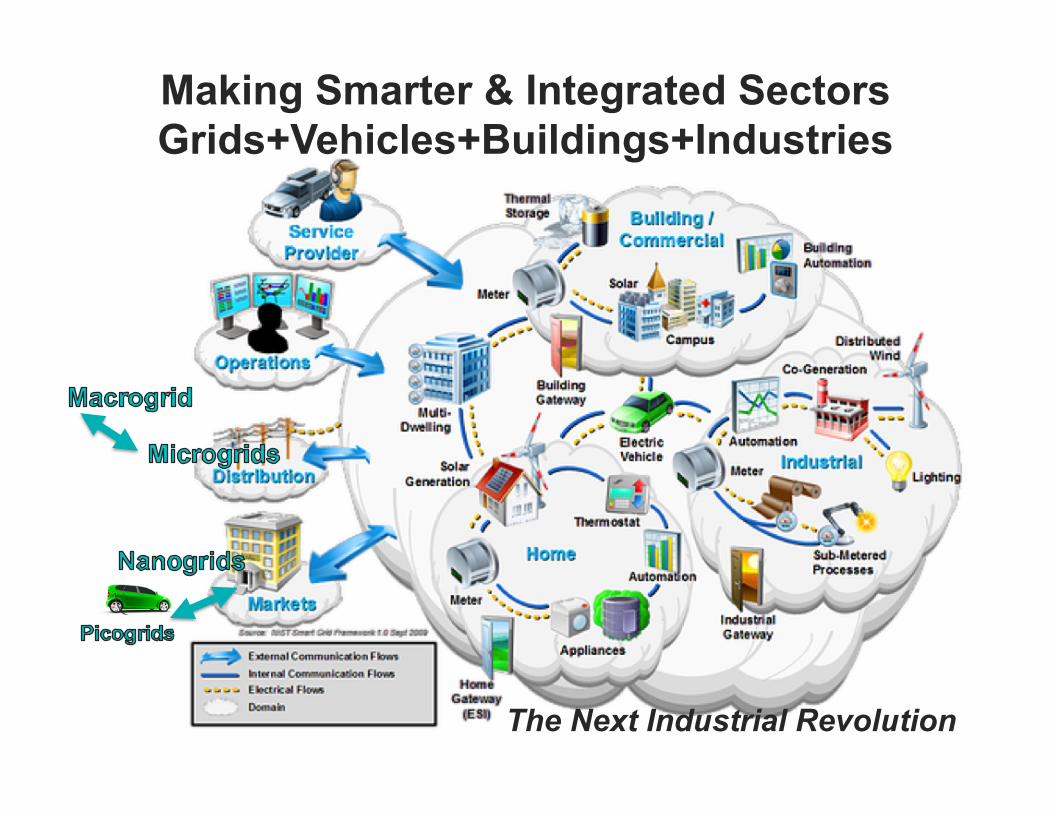
Making Smarter & Integrated Sectors Grids+Vehicles+Buildings+Industries
The Next Industrial Revolution

© 2015 Cisco and/or its affiliates. All rights reserved. Presentation_ID Cisco Public
IoE Hitting Inflection Point
“ Smart, connected products are changing how value is created…will affect the trajectory of the overall economy, giving rise to the next era of IT-driven productivity growth for companies, their customers, and the global economy…”
November 2014

Michael Porter & James Heppelmann , How Smart, Connected Products are Transforming Compe>>on, Harvard Business Review, Nov 2014, h2ps://hbr.org/2014/11/how-‐smart-‐connected-‐products-‐are-‐transforming-‐compe>>on
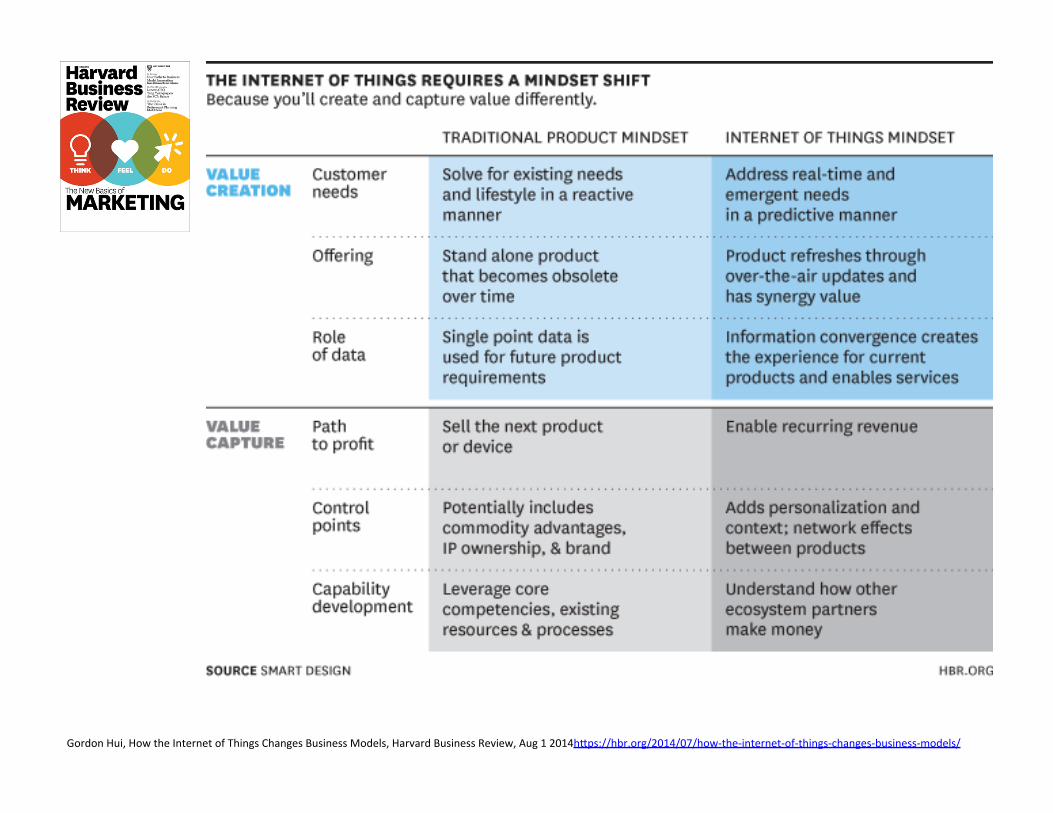
Gordon Hui, How the Internet of Things Changes Business Models, Harvard Business Review, Aug 1 2014h2ps://hbr.org/2014/07/how-‐the-‐internet-‐of-‐things-‐changes-‐business-‐models/
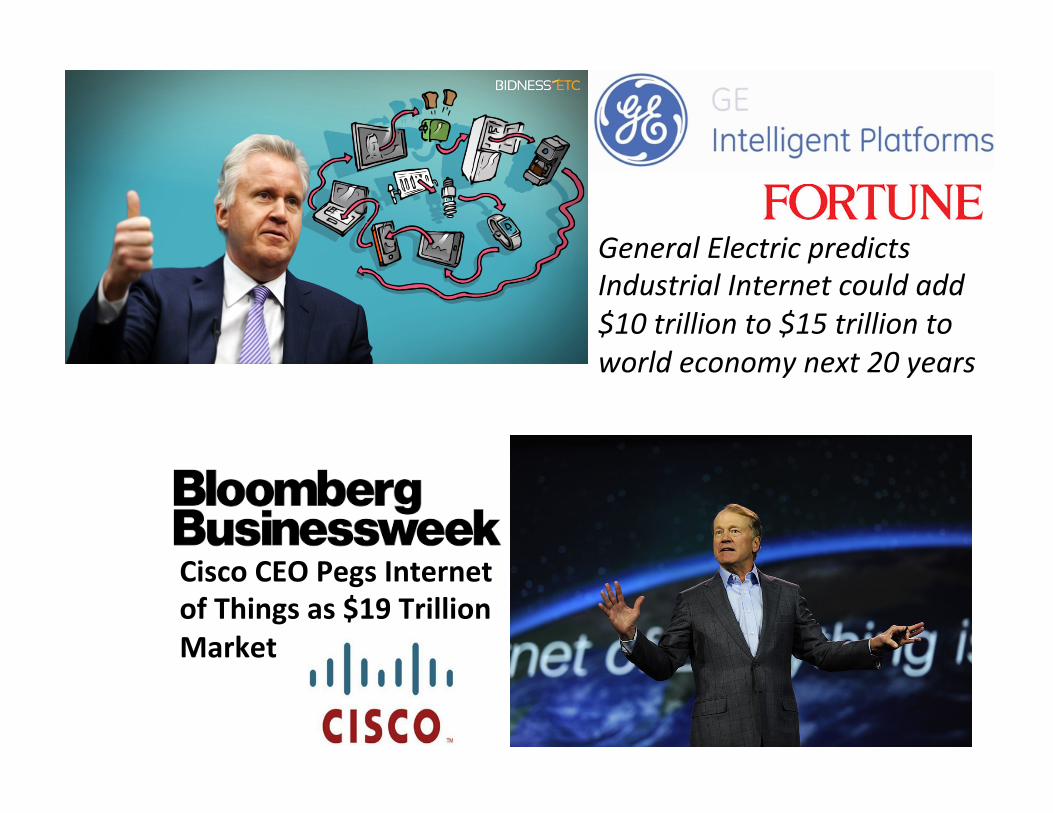
Cisco CEO Pegs Internet of Things as $19 Trillion Market
General Electric predicts Industrial Internet could add $10 trillion to $15 trillion to world economy next 20 years


Copyright © 2014 IDTechEx | www.IDTechEx.com
Silly season?
Cisco predicts $14 trillion IoT opportunity increasing global GDP by several percent. Suppliers and analysts predict up to 200 billion in place in 2020 against a few million now, but… …no one can name a company budgeting or even discussing a large order.
Downloaded by Michael Totten - [email protected] 09 Jun 2015 21:44:46Internet of Things (IoT): Business Opportuni>es 2015-‐2025, Dr Peter Harrop, Dr Jon Harrop and Raghu Das, IDTechEx, h2p://www.idtechex.com/research/reports/internet-‐of-‐things-‐iot-‐business-‐opportuni>es-‐2015-‐2025-‐000386.asp
Copyright © 2014 IDTechEx | www.IDTechEx.com
For more on IoT and IoP see…
www.IDTechEx.com/IoT www.IDTechEx.com/IoP
Downloaded by Michael Totten - [email protected] 09 Jun 2015 21:44:46

Copyright © 2014 IDTechEx | www.IDTechEx.com
IoT disagreements
Over 400 standards. Which of the new over-arching standards will win? Will we simply end up with 420 standards? Which applicational sector is most promising? Which organisation will place the large orders? Is this mainly a business for node makers, services, what? Will almost all the processing be done by the nodes or be Big Data managed centrally by IBM, Oracle etc
Downloaded by Michael Totten - [email protected] 09 Jun 2015 21:44:46Internet of Things (IoT): Business Opportuni>es 2015-‐2025, Dr Peter Harrop, Dr Jon Harrop and Raghu Das, IDTechEx, h2p://www.idtechex.com/research/reports/internet-‐of-‐things-‐iot-‐business-‐opportuni>es-‐2015-‐2025-‐000386.asp
Copyright © 2014 IDTechEx | www.IDTechEx.com
For more on IoT and IoP see…
www.IDTechEx.com/IoT www.IDTechEx.com/IoP
Downloaded by Michael Totten - [email protected] 09 Jun 2015 21:44:46

h2p://data-‐protec>on.safenet-‐inc.com/2015/02/2014-‐data-‐breaches-‐by-‐the-‐numbers-‐and-‐the-‐impact/

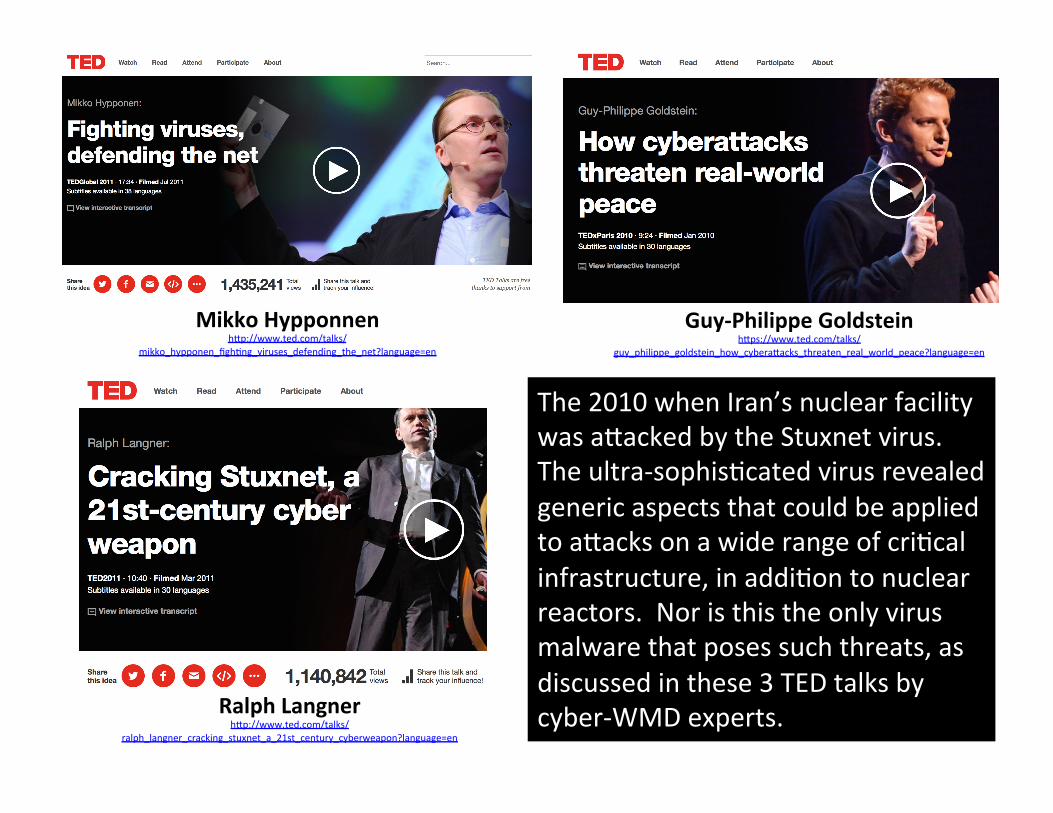
The 2010 when Iran’s nuclear facility was a2acked by the Stuxnet virus. The ultra-‐sophis>cated virus revealed generic aspects that could be applied to a2acks on a wide range of cri>cal infrastructure, in addi>on to nuclear reactors. Nor is this the only virus malware that poses such threats, as discussed in these 3 TED talks by cyber-‐WMD experts.
Guy-‐Philippe Goldsteinh2ps://www.ted.com/talks/
guy_philippe_goldstein_how_cybera2acks_threaten_real_world_peace?language=en
Mikko Hypponnen h2p://www.ted.com/talks/
mikko_hypponen_figh>ng_viruses_defending_the_net?language=en
Ralph Langner h2p://www.ted.com/talks/
ralph_langner_cracking_stuxnet_a_21st_century_cyberweapon?language=en
© ZigBee Alliance. All rights reserved.
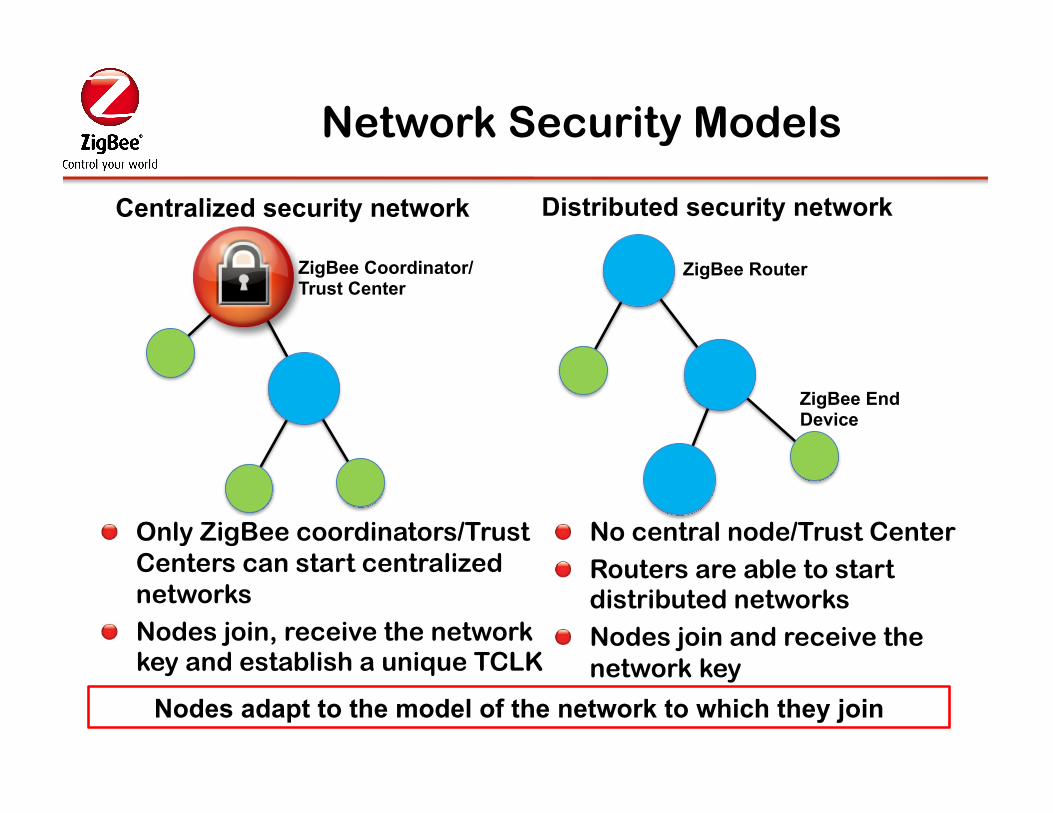
Network Security Models
12
! Only ZigBee coordinators/Trust Centers can start centralized networks
! Nodes join, receive the network key and establish a unique TCLK
! No central node/Trust Center ! Routers are able to start
distributed networks ! Nodes join and receive the
network key
Centralized security network Distributed security network
ZigBee Coordinator/ Trust Center
ZigBee Router
ZigBee End Device
Nodes adapt to the model of the network to which they join

Universal%Interoperability%Key$principles$from$Internet$Tech.$
Any$device$should$work$with$all$other$objects$in$any$space$$
• Across%building%types%– ResidenAal,%commercial,%vehicles,%…%
• Across%geography%– Countries,%language,%…%
• Across%Ame%– Worthy%of%durability%
• Across%end%uses%– CoordinaAon,%cooperaAon%
• Across%people%– Age,%disability,%culture,%acAvity,%context,%…%
Bruce(Nordman((LBNL),(IoOT(—(learning(from(the(first(13(billion*,(ET,(IoT(session,(2014(

IDC expects the global IoT installed base will be ~212 billion “things” by the end of 2020, including 30 billion “connected (autonomous)” things. Today, IoT devices connect to each other using mul>ple, o|en incompa>ble approaches. To achieve this scale, the industry will need both the collabora>on of the open source community and industry standards to drive interoperability of these devices. OIC seeks to define a common communica6on framework based on industry standard technologies to wirelessly connect and intelligently manage the flow of informa6on among devices, regardless of form factor, opera6ng system or service provider.
OIC -‐ Open Interconnect Consor6um

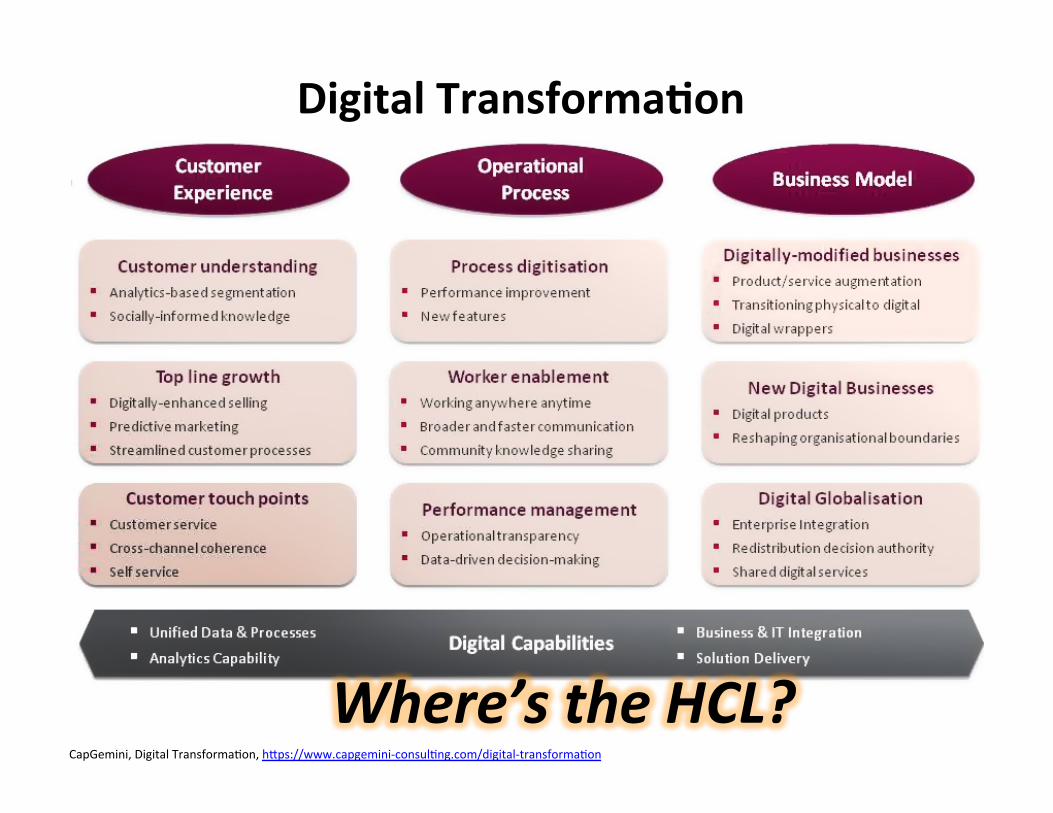
CapGemini, Digital Transforma>on, h2ps://www.capgemini-‐consul>ng.com/digital-‐transforma>on
Digital Transforma6on
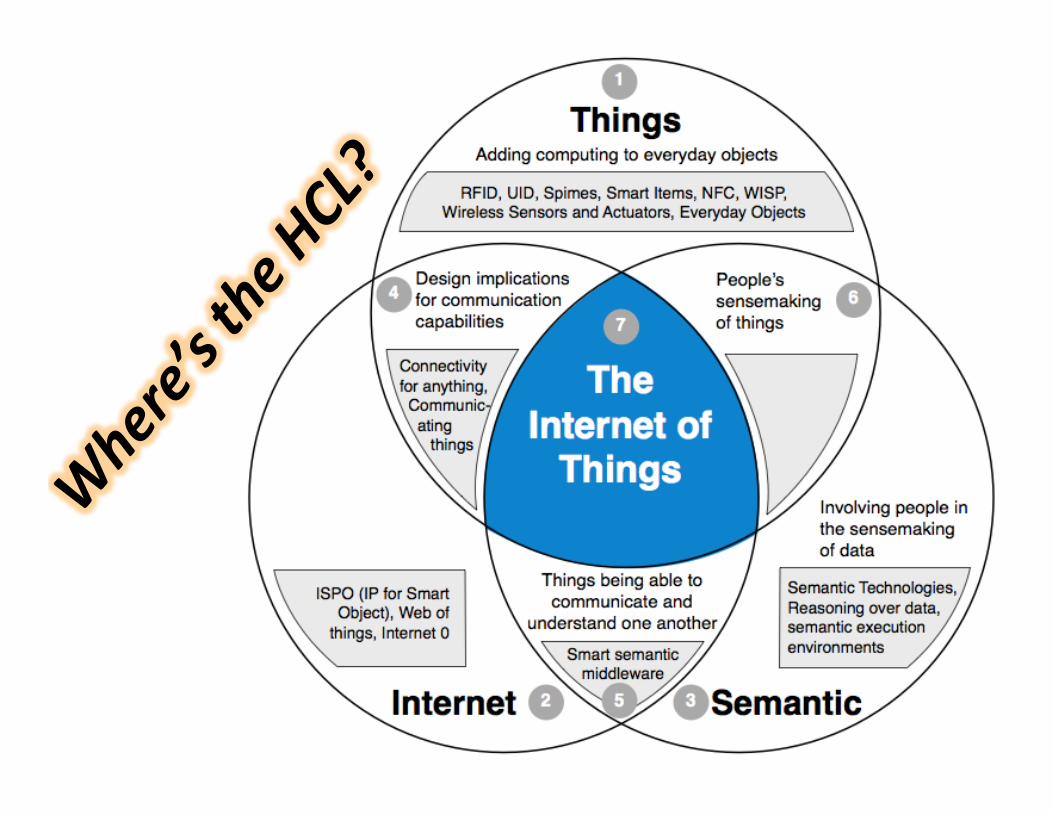
Where’s the HCL?
2
EXAMINING HCI-RELATED EFFORTS OF THE IOT This section discusses Atzori et al.’s original framework and our modifications to it (Figure 1). When using this framework to dialogue with the HCI literature we surveyed, we saw opportunities to modify the framework to make it useful for an HCI audience. While we kept Atzori et al.’s original annotations (so that readers can still view the original framework), we moved the annotations into a grey box within each category. We then added a summary description of prominent HCI efforts within each category. As we will discuss later, this modification allowed us to view Atzori et al.’s descriptive framework of IoT technologies as a tool for thinking about the design and evaluation of IoT efforts from an HCI perspective. Next we introduce and discuss the seven categories of the framework, putting HCI efforts in dialogue with Atzori et al.’s original framework.
Figure 1: Modified version of Atzori et al.’s (2010) ‘Internet of
Things’ paradigm.
1. Things. This category was used by Atzori et al. to refer to the physical components that would make up the IoT. That is, the sensors, actuators, technologies and objects that could be combined to create connected ‘things’. The HCI literature we reviewed were generally less concerned with the particular components used, and more interested in considering how computing could be added to everyday objects, and what this can enable. We see this as ‘adding computing to everyday objects’. For example, strapping sensors to the skin to enable the human body to control computers (Harrison et al. 2010), or embedding different sensors into clothing to digitise and measure their use (Rantala et al. 2011).
2. Internet. This referred to the various languages and protocols that can be used when transferring data between ‘things’ and other objects on the Internet. In response to various efforts that tried to develop separate networks and protocols specifically for the IoT, Atzori et al. highlighted the advantages of using common Internet languages as the basis for communicating between objects in the IoT. The HCI literature we reviewed did not deal in depth with the kinds of protocols and languages used to
communicate between objects. This perhaps reflects that such interests lie outside the scope of HCI.
3. Semantic. This category described the technologies to store, process and use data generated by the IoT. It referred to how semantic technologies could sort and begin to make meaning out of the potentially vast amount of information created by everyday objects which are beginning to sense and transmit data. HCI is only starting to engage with how technology could analyse and present the vast amount of data produced by connected objects (Davidoff et al. 2010). On the other hand, HCI researchers are increasingly aware that computers alone cannot clearly represent something as complex as human intention. This has resulted in a call for ‘involving people in the sensemaking of data’ (Chau et al. 2011).
Three additional categories are formed in Atzori et al.’s framework by the overlaps between Internet, Things and Semantic.
4. Internet/Things. This overlapping category referred to the notion that all ‘things’ should have the ability to communicate via the Internet. This notion is also embraced by HCI efforts. In particular, we see this as ‘design implications for communication capabilities’. HCI is interested in how properties and limitations of connectivity might impact the way we design things for the IoT. For example, transmitting data over longer distances using wi-fi often requires physically larger devices due to power needs. Whereas smaller devices can be used for shorter transmissions because we can use low-power technologies such as near-field communication (NFC). To work around connectivity constraints, Nakatsuma and Shinoda (2010) propose a way for different computing parts, such as storage, processing and display, to network together simply by being placed on a desk. This opens up the exciting possibility of separating computers into different parts (e.g. display, storage, input etc.), which can then be combined together on demand via the Internet to be most suited to any given task.
5. Semantic/Internet. This category contains ‘middleware’, software that is designed to allow communication between ‘things’ by translating data to different formats. HCI literature appeared less concerned with how such connections are achieved technically, and more interested in the potential for ‘things being able to communicate and understand one another’. For example, Woo and Lim (2012) explore the possibility of an emergent “accidentally smart home environment”, where new objects are added into the home one at a time. In this approach, they examine what would be needed to ensure the smooth addition of each new arrival.
6. Things/Semantic. This was only briefly discussed by Atzori et al. in regards to the need for scalable infrastructure to semantically process vast amounts of IoT data, and was not annotated in their original diagram. However, we found this area was well represented in HCI literature. Primarily, the efforts were centred around how data can affect ‘people’s sensemaking of things’, when everyday objects are embedded with computing. For example, how revealing usage data such as Internet
This framework: 1) Helps understand extent and focus of IoT related HCI efforts 2) Tool for thinking through HCI when designing for IoT 3) Draws aLen6on to lack of engagement with deeper human-‐centered perspec6ves of IoT
3 LIGHTING QUALITY
50
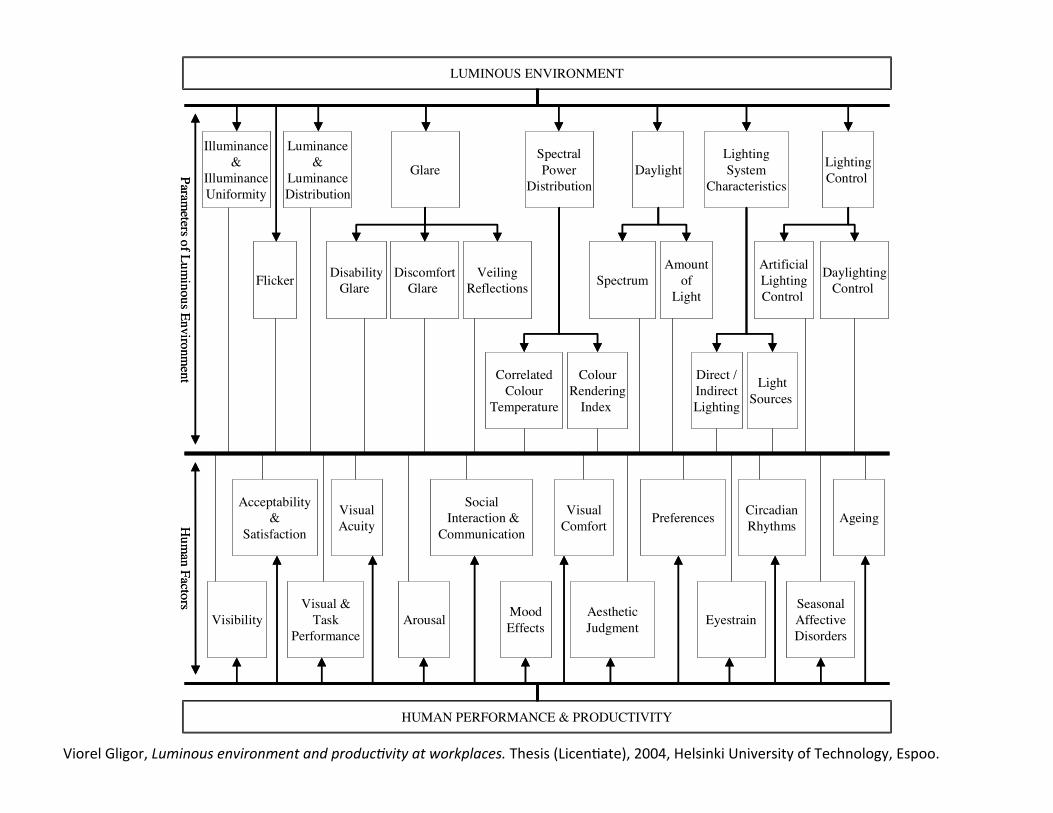
3.6 Lighting and productivity Lighting should be designed to provide people with the right visual conditions that help them to perform visual tasks efficiently, safely and comfortably. The luminous environment acts through a chain of mechanisms on human physiological and psychological factors, which further influence human performance and productivity (Gligor 2004).
Figure 3-5. Luminous environment and human performance. (Gligor 2004)
There have been several field studies on the effects of lighting conditions on productivity. The earliest studies were made in the 1920’s (Weston 1922, Weston and Taylor 1926) and indicated that lighting conditions can improve performance by providing adequate illuminance for the visual tasks. Since then a number of studies have been carried out. Their results are sometimes contradictory. For example, a study in clerical office work indicated that an increase in illuminance from 500 lx to 1500 lx could increase the performance of office workers by 9% (Hughes and McNelis 1978), while another study showed that lower illuminance levels (150 lx) tended to improve performance of a complex word categorisation task as compared to a higher level (1500 lx) (Baron et al. 1992). A field study in industrial environment measured direct productivity increases in the range from 0 to 7.7% due to changes in lighting (Juslén 2007). The literature includes more
Illuminance&
IlluminanceUniformity
LUMINOUS ENVIRONMENT
Glare
Luminance&
LuminanceDistribution
CorrelatedColour
Temperature
Daylight LightingSystem
Characteristics
HUMAN PERFORMANCE & PRODUCTIVITY
SocialInteraction &
Communication
VisibilityVisual &
TaskPerformance
VisualAcuity
Arousal MoodEffects
VisualComfort
Acceptability&
Satisfaction
AestheticJudgment
Preferences
Eyestrain
CircadianRhythms
SeasonalAffectiveDisorders
Ageing
DisabilityGlare
SpectralPower
Distribution
DiscomfortGlare
VeilingReflections
ColourRendering
Index
Flicker Spectrum Amount
ofLight
LightingControl
Direct /IndirectLighting
LightSources
ArtificialLightingControl
DaylightingControl
Parameters of Lum
inous Environment
Hum
an Factors
Viorel Gligor, Luminous environment and produc7vity at workplaces. Thesis (Licen>ate), 2004, Helsinki University of Technology, Espoo.
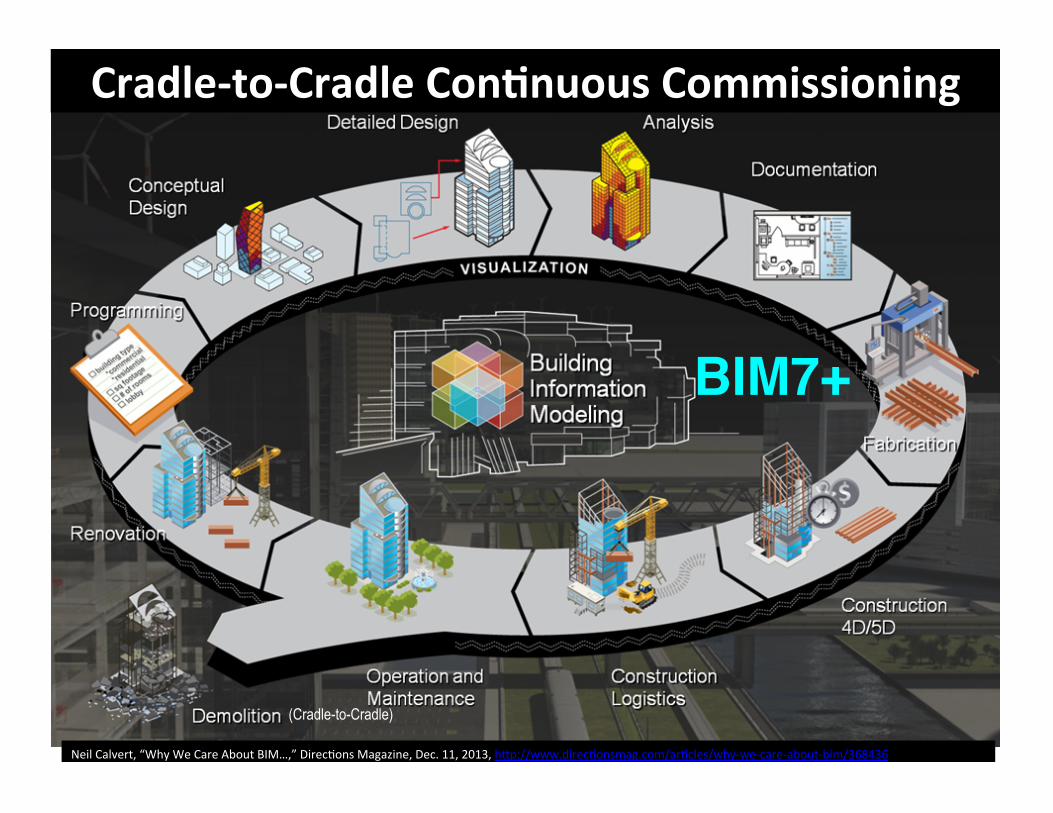
Neil(Calvert,(“Why(We(Care(About(BIM…,”(DirecNons(Magazine,(Dec.(11,(2013,(h,p://www.direcNonsmag.com/arNcles/whyPwePcarePaboutPbim/368436((
BIM7+
(Cradle-to-Cradle)
Cradle$to$Cradle'Con6nuous'Commissioning''
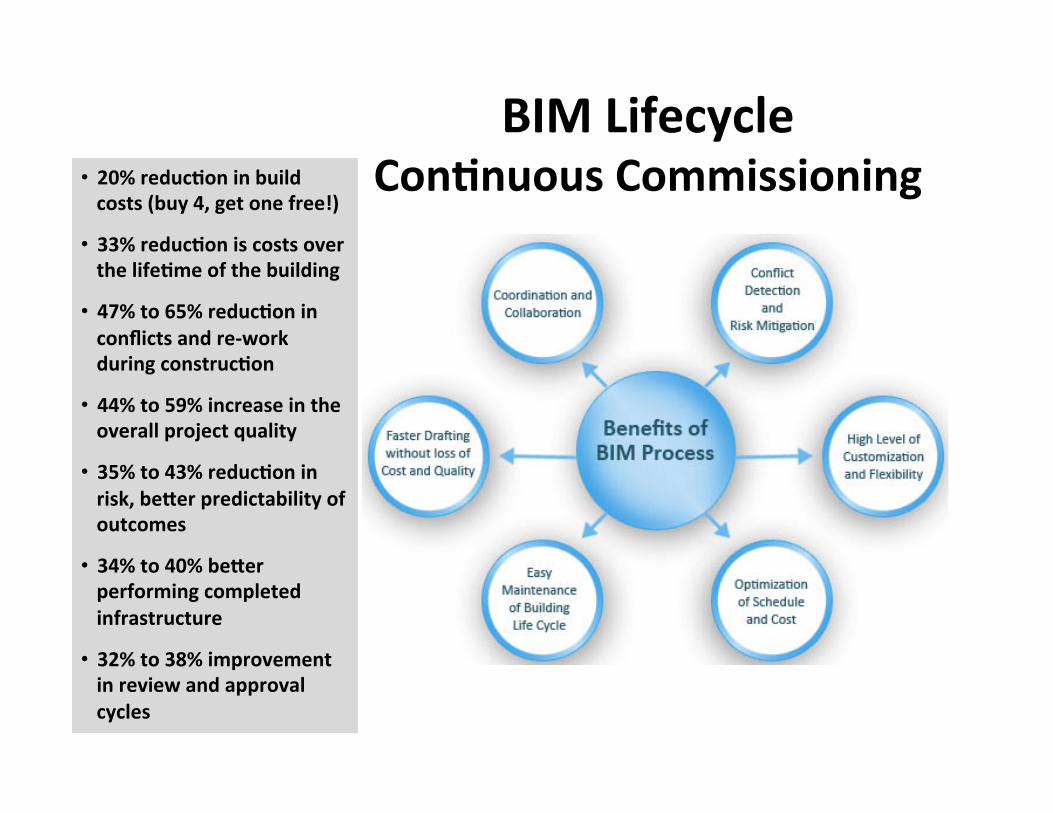
• 20%'reduc6on'in'build'costs'(buy'4,'get'one'free!)'
• 33%'reduc6on'is'costs'over'the'life6me'of'the'building'
• 47%'to'65%'reduc6on'in'conflicts'and're$work'during'construc6on'
• 44%'to'59%'increase'in'the'overall'project'quality'
• 35%'to'43%'reduc6on'in'risk,'beLer'predictability'of'outcomes'
• 34%'to'40%'beLer'performing'completed'infrastructure'
• 32%'to'38%'improvement'in'review'and'approval'cycles'
BIM'Lifecycle''Con6nuous'Commissioning'
6 | Building Analytics
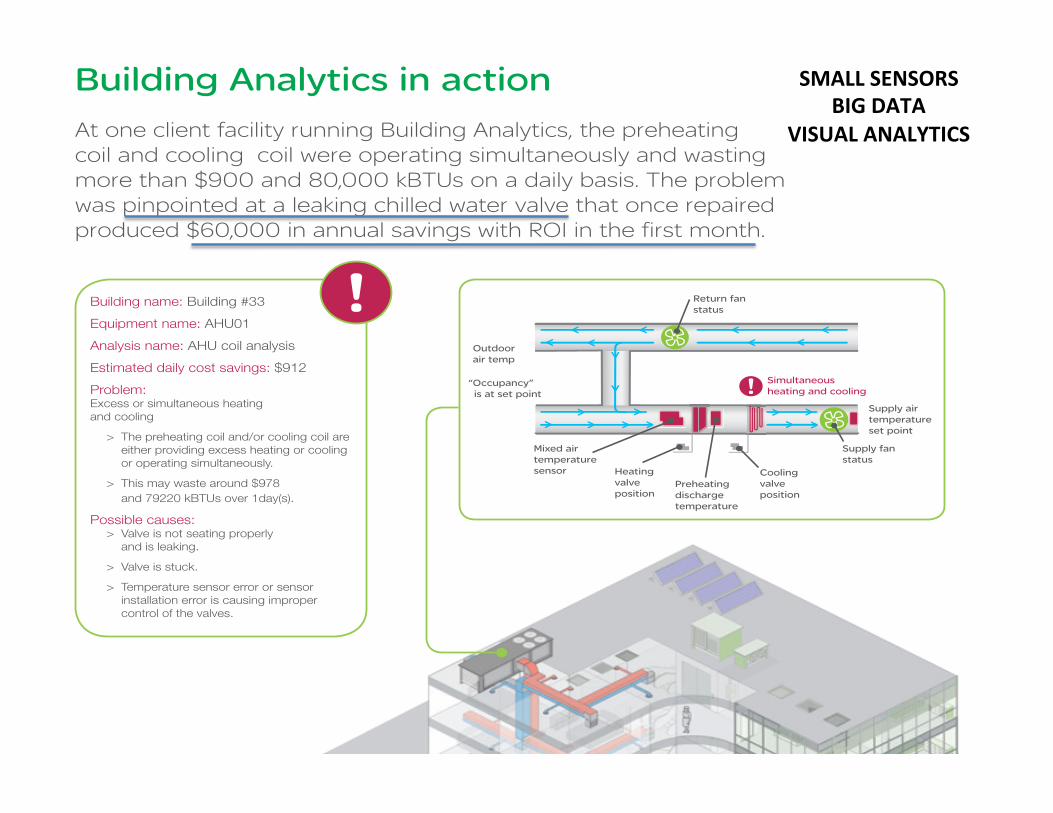
Building Analytics in actionAt one client facility running Building Analytics, the preheating coil and cooling coil were operating simultaneously and wasting more than $900 and 80,000 kBTUs on a daily basis. The problem was pinpointed at a leaking chilled water valve that once repaired produced $60,000 in annual savings with ROI in the first month.
Mixed air temperature sensor
Outdoor air temp
“ Occupancy” is at set point
Return fan status
Preheating discharge temperature
Heating valve position
Cooling valve position
Supply air temperature set point
Supply fan status
Simultaneous heating and cooling
Building name:
Equipment name:
Analysis name:
Estimated daily cost savings:
Problem: Excess or simultaneous heating and cooling
either providing excess heating or cooling or operating simultaneously.
Possible causes:
and is leaking.
> Temperature sensor error or sensor installation error is causing improper control of the valves.
SMALL'SENSORS'BIG'DATA'
VISUAL'ANALYTICS'

From Integrated designs to integrated operations
Building Lighting
HVAC low-side
Plug Loads
Computing
HVAC high-side
Realistic scenario
-variables
Occupancy
Operating hours
Occupant behavior
Weather
Loads
INTEGRATED DESINGS
INTEGRATED OPERATIONS
Design stage – most efficient/peak
36 Integrated'Designs'&'Integrated'Opera6ons'
Lifecycle(&(CradlePtoPCradle(
Punit(Desai,(Environmental(Sustainability(at(Infosys(Driven(by(values,(Powered(by(innovaNon,(InfoSys,(presentaNon(to(RMI,(Sept(15,(2014(
1
PRESS RELEASE
Infosys BPO awarded 5-Star Rating by Bureau of Energy Efficiency (BEE) 5-star rating signifies being the most energy efficient Bangalore, India - May 13, 2010: Infosys BPO, the business process outsourcing subsidiary of Infosys Technologies, today announced that it has been awarded the 5-star rating for energy efficiency by Bureau of Energy Efficiency (BEE) for its building located in its Phase 2 campus in Hinjewadi, Pune, India. The rating is under the “Star rating for BPO buildings” scheme of BEE that rates office buildings in India from which BPO services are rendered on a scale of 1 to 5 stars, where a 5-star rating signifies being the most energy efficient. The rating is valid for a period of 5 years. The eligibility criteria included the overall energy usage efficiency and minimization of operation costs of the BPO building. The 5-star rating was an outcome of using higher efficiency products that enabled reduction in the energy consumption in the building. The building spans a total area of 25,577 square metres and the annual energy consumption is approximately 2406199 kWh. Commenting on the rating, (Swami) Swaminathan, CEO & MD, Infosys BPO, said, “We are delighted to have received this prestigious rating. Obtaining the BEE 5-star rating highlights our commitment towards energy efficiency. We continue to focus on designing world-class green buildings with energy efficient designs, using solar heaters as well as efficient lighting systems. We are also focused on educating our employees to optimize energy consumption by shutting down computers and other electrical devices when not in use. We believe that these small steps can help address the larger concerns in India.” The Bureau of Energy Efficiency is a statutory body at the national level and functions under the Ministry of Power, Government of India. The organization has launched the “Star rating for BPO buildings” scheme to recognize energy conservation and efficiency of office buildings. About Infosys BPO: Infosys BPO Ltd. (www.infosys.com/bpo), the Business Process Outsourcing subsidiary of Infosys Technologies, was set up in April 2002. Infosys BPO focuses on integrated end-to-end outsourcing and delivers transformational benefits to its clients through reduced costs, ongoing productivity improvements, and process reengineering. Infosys BPO operates in India, the Czech Republic, China, the Philippines, Poland, Thailand, Mexico, USA and Brazil and as on March 31, 2010 employed approximately18, 610 people. It closed FY 2009-10 with revenues of $352.1 million. About Infosys Technologies Ltd. Infosys (NASDAQ: INFY) defines, designs and delivers IT-enabled business solutions that help Global 2000 companies win in a Flat World. These solutions focus on providing strategic differentiation and operational superiority to clients. As on March 31, 2010 Infosys employed about 113,800 employees in over 50 offices worldwide. Infosys is part of the NASDAQ-100 Index and The Global Dow. For more information, visit www.infosys.com.
36(Mc2'
buildings'
80% Savings!!
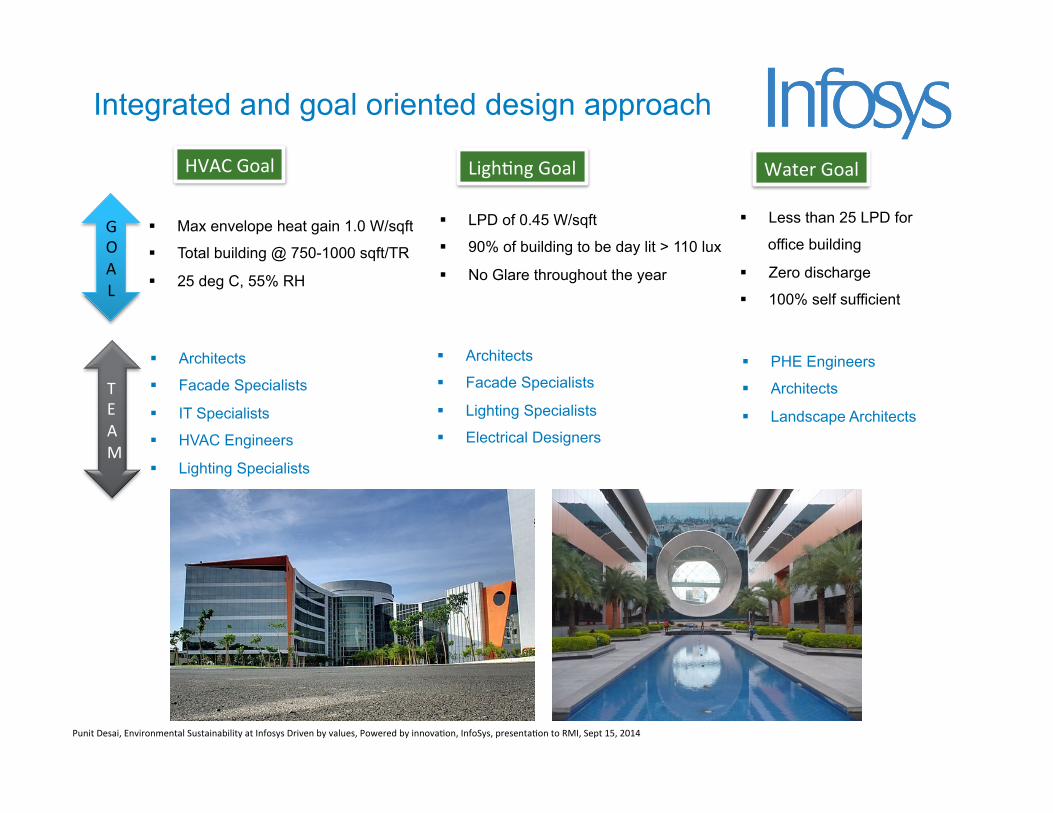
Integrated and goal oriented design approach
HVAC(Goal( Ligh3ng(Goal( Water(Goal(
! Max envelope heat gain 1.0 W/sqft
! Total building @ 750-1000 sqft/TR
! 25 deg C, 55% RH
! LPD of 0.45 W/sqft
! 90% of building to be day lit > 110 lux
! No Glare throughout the year
! Architects
! Facade Specialists
! IT Specialists
! HVAC Engineers
! Lighting Specialists
! Architects
! Facade Specialists
! Lighting Specialists
! Electrical Designers
! PHE Engineers
! Architects
! Landscape Architects
! Less than 25 LPD for
office building
! Zero discharge
! 100% self sufficient
TEAM
GOAL(
13
Punit(Desai,(�Environmental(Sustainability(at(Infosys(Driven(by(values,(Powered(by(innovaNon,(InfoSys,(presentaNon(to(RMI,(Sept(15,(2014(

BIG BIM, BIG DATA BIG CONTINUOUS RESULTS

http://www.oscre.org/

http://www.buildingsmart-tech.org /
© 2014 Cisco and/or its affiliates. All rights reserved. BRKIOT-1404 Cisco Public
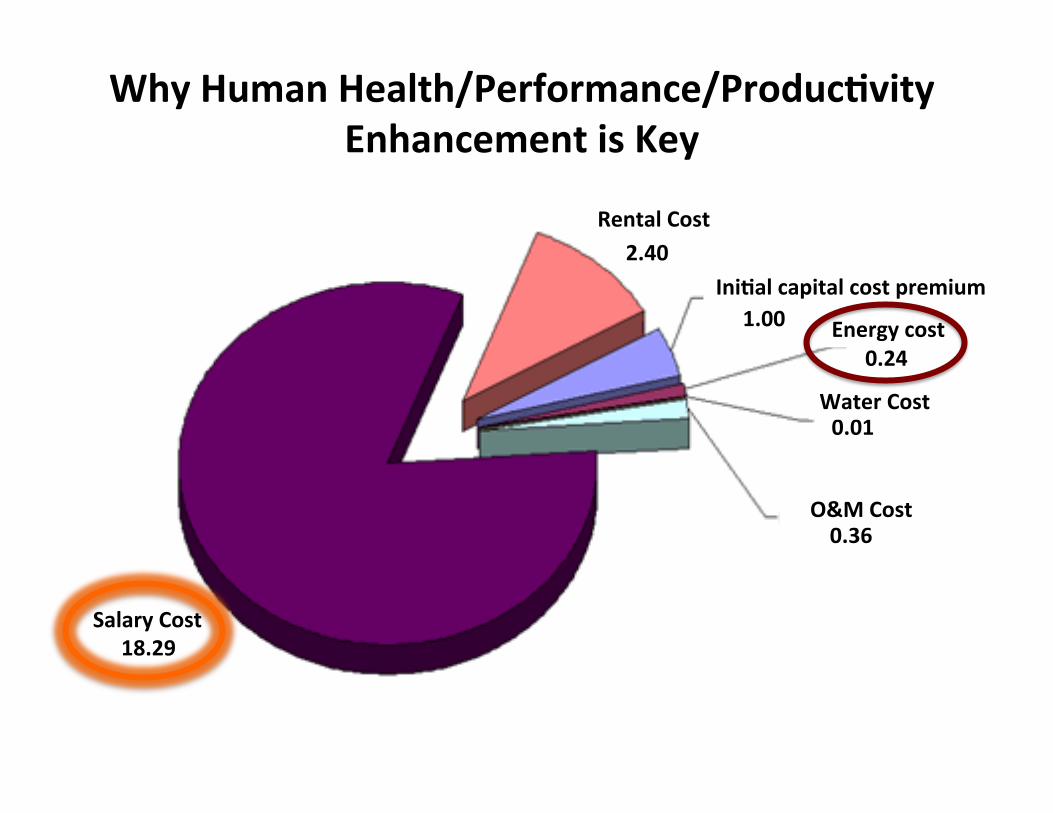
Why Human Performance/Productivity is Important
https://www.mfe.govt.nz/publications/sus-dev/value-case-sustainable-building-feb06/html/page7.html
22
Ini6al'capital'cost'premium'
Salary'Cost'18.29'
0.36'
0.01'
0.24'Energy'cost'
Water'Cost'
O&M'Cost'
1.00'
0.24'Rental'Cost'
How(IoT(and(PoE([Power(over(Ethernet](LED(LighNng(Will(Transform(IT,(BRKSPGP1404,(Ma,(Laherty,(Business(Development(Manager,(Office(of(CTO,(ENG(Labs,(2014(
Why Human Health/Performance/Produc6vity Enhancement is Key
2.40

Figure 6a Lighting System Quality Increases Individual Productivity. The CBPD team has identified 12 studies linking improved lighting design decisions with 0.7-23% gains in individual productivity. Four of these studies demonstrate 3-23% improved performance at a range of tasks given the introduction of indirect-direct lighting systems. Four studies identify 3-13.2% increases in individual performance resulting from higher quality fixtures – high performance electronic ballasts and parabolic louvers. Four studies identify the contributions of higher lighting levels and daylight simulating fixtures to 0.7-2% improvement in individual productivity at a range of tasks.
Figure 6b Lighting System Quality Reduces Energy Use.
Center for Building Performance and Diagnostics, Carnegie Mellon 2003 Greenbuild Conference 8
Vivian Lo|ness, FAIA, Linking Energy to Health and Produc>vity in the Built Environment, Evalua>ng the Cost-‐Benefits of High Performance Building and Community Design for Sustainability, Health and Produc>vity, 2003 GreenBuild Conference, Center for Building Performance and Diagnos>cs, Carnegie Mellon
Case Studies 1980-‐2002 Improved Performance with Ligh6ng Control Strategies (*Performance improvement for specific tasks mul6plied by es6mated 6me at tasks)
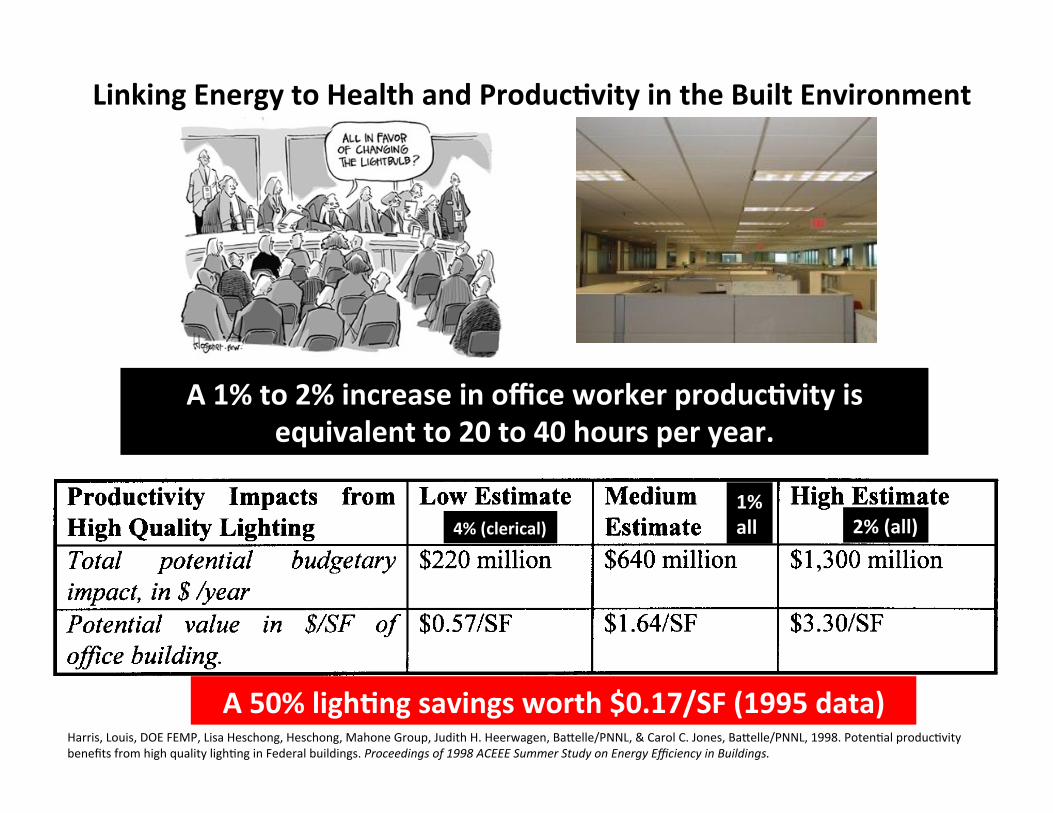
4Y0. The medium estimate assumes a 1% improvement in productivity for the overall officeworkforce, and the high estimate assumes a 2°/0potential impact on all workers.
Table 1. Upper and Lower Bounds of Productivity Estimates
Productivity Impacts from Low Estimate Medium High EstimateHigh Quality Lighting EstimateTotal potential budgetary $220 million $640 million $1,300 millionimpact, in $/yearPotential value in $ISF of $0.571SF $1 .641SF $3.301SFoj$ce building.
These findings underscore the importance of harnessing both energy savings and non-energybenefits when making changes to a lighting system. It is also important to recognize that the resultspresented here are based on one study. Further research is needed to validate the potentialproductivity impacts. At the present time, researchers are working on similar studies that willprovide additional data for productivity estimates.
References
Collins, B.L., W.S. Fisher, G.L. Gillette, R.W. Marans. 1989. Evaluating Office LightingEnvironments: Second Level Analysis. Washington, DC: U.S. Department of Commerce,National Institute of Building Standards, NISTIR 89-4069.
Custom Research, Inc. 1996. Facilities and Real Estate Strategies: Survey Findings. Commissionedfor Fortune Marketing.
E-CBECS (electronic version of Commercial Building Energy Consumption Survey). 1994. EnergyInformation Administration (EIA).
Harris, L. & Associates, Inc. for Steelcase, Inc. 1988. The Office Environment Index, DetailedFindings. Grand Rapids, MI: Steelcase Corporation.
Heerwagen, J.H., J.A. Wise, D. Lantrip, and M. Ivanovich. 1996. A Tale of Two Buildings:Biophilia and the Benefits of Green Design. Paper presented at the Third AnnualInternational Green Buildings Conference, San Diego, Ca., Nov. 17-20.
Kroner, W., JA Stark-Martin, and T. Willemain. 1992. Using Advanced Office Technolo~ toIncrease Productivity. Troy, NY: Center for Architectural Research, Rensselaer PolytechnicInstitute.
The National Research Council Commission on Behavioral and Social Sciences and Education (NRCCommission). 1983. Video Displays, Work and Vision. Washington, DC: National AcademyPress.
8.120- Harris, et. al.
Harris, Louis, DOE FEMP, Lisa Heschong, Heschong, Mahone Group, Judith H. Heerwagen, Ba2elle/PNNL, & Carol C. Jones, Ba2elle/PNNL, 1998. Poten>al produc>vity benefits from high quality ligh>ng in Federal buildings. Proceedings of 1998 ACEEE Summer Study on Energy Efficiency in Buildings.
A 1% to 2% increase in office worker produc6vity is equivalent to 20 to 40 hours per year.
1% all 2% (all) 4% (clerical)
Linking Energy to Health and Produc6vity in the Built Environment
A 50% ligh6ng savings worth $0.17/SF (1995 data)
R&D Plan
Page 45
these light sources is also dangerous due to the risk of fires and toxicity of the fuel, which contains a high proportion of heavy particulates [45].
The rapid growth of the solar lantern market, which rose from $200 million in 2013 to $500 million in 2014, would have been impossible without LED sources. The increased efficacy leads to substantial reduction in the cost of solar panels and storage batteries, far outweighing the added cost of the LEDs. Moreover, the small size of LEDs enables the design of rugged devices with more effective optics in a wide range of form factors [46].
On a community level, the availability of highly efficient lights that can be driven easily by low voltage DC current is leading to affordable solar-powered streetlights and enabling evening classes in schools, extended operation of health clinics, and other social activities in rural communities that were previously impractical.
SSL will allow many countries to provide more adequate lighting with minimal additional energy requirements. Nevertheless, the latent demand for good lighting is so great in the developing world that the increased energy consumption may offset energy savings that are made through increased efficacies. In particular, demand for lighting in Africa and certain parts of Asia is likely to increase over the next decade as these economies grow. This scenario provides even greater motivation for the development of higher efficacy SSL sources, the more efficient utilization of light, and the increased adoption of controls to minimize unnecessary light production.
4.2 Economic Impact The impact of lighting on the global economy, as estimated by the International Solid State Lighting Alliance (ISA) is shown in Figure 4.5 [35].
Figure 4.5 Impact of Lighting on the Global Economy in 2014 Source: ISA, Global Solid State Lighting Industry Status Report and Market Trends 2014, 2014 [35]
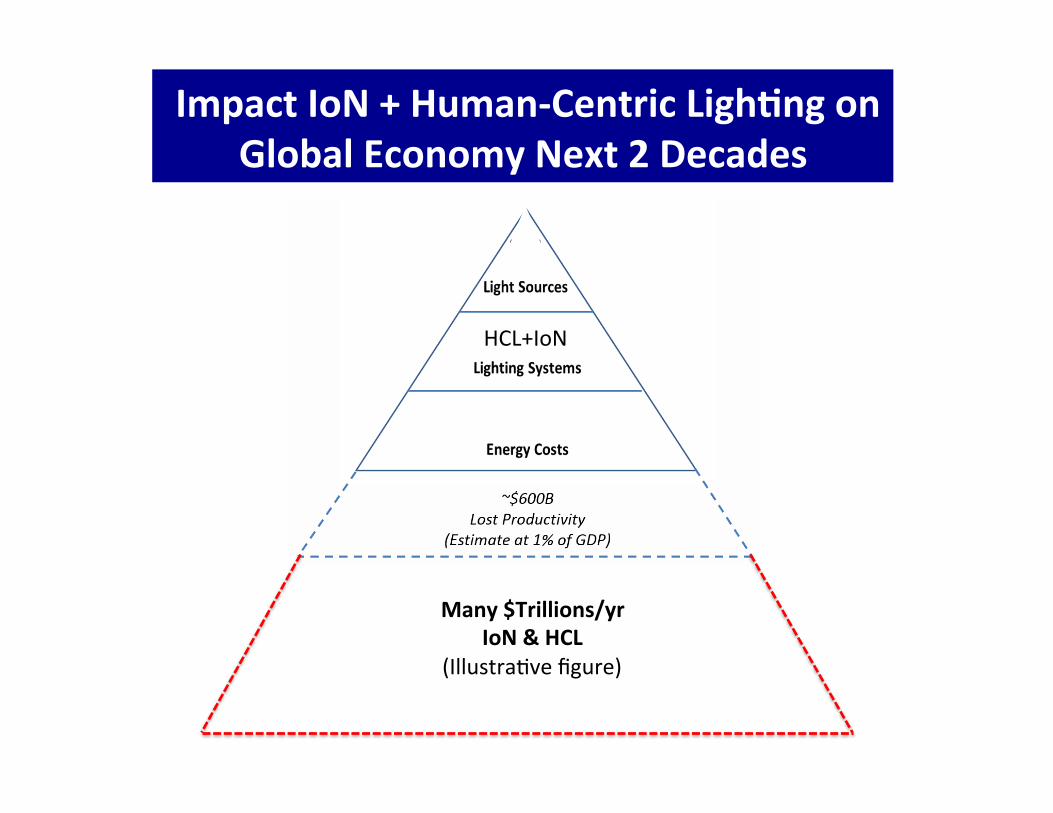
Impact IoN + Human-‐Centric Ligh6ng on Global Economy Next 2 Decades
Many $Trillions/yr IoN & HCL
(Illustra>ve figure)
HCL+IoN
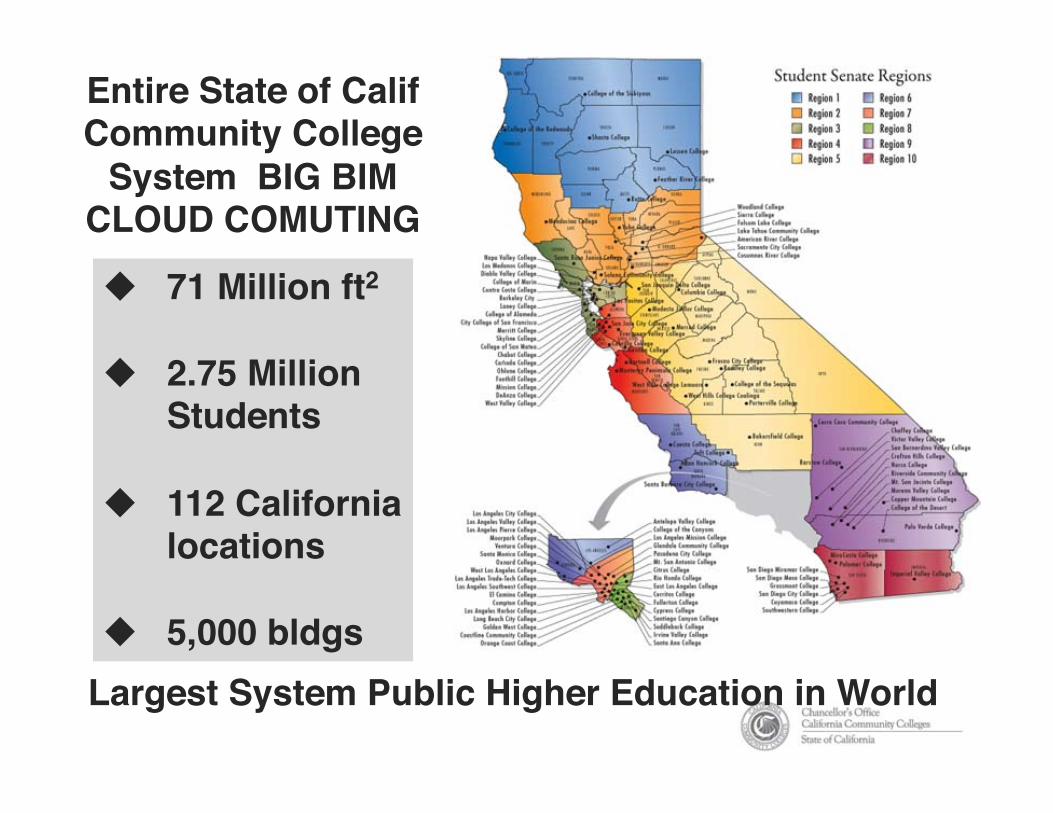
Entire State of Calif Community College
System BIG BIM CLOUD COMUTING
Largest System Public Higher Education in World
! 71 Million ft2
! 2.75 Million Students
! 112 California locations
! 5,000 bldgs
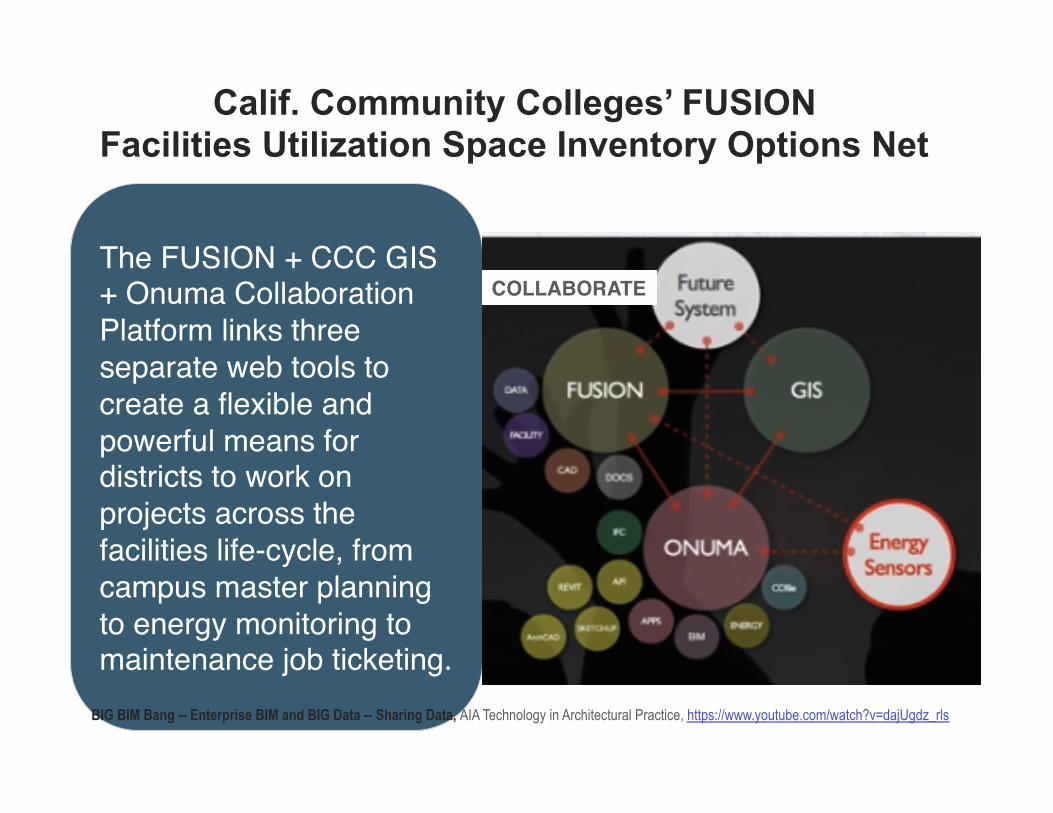
The FUSION + CCC GIS + Onuma Collaboration Platform links three separate web tools to create a flexible and powerful means for districts to work on projects across the facilities life-cycle, from campus master planning to energy monitoring to maintenance job ticketing.
Calif. Community Colleges’ FUSION Facilities Utilization Space Inventory Options Net
COLLABORATE
BIG BIM Bang -- Enterprise BIM and BIG Data -- Sharing Data, AIA Technology in Architectural Practice, https://www.youtube.com/watch?v=dajUgdz_rls

BIG BIM Bang -- Enterprise BIM and BIG Data -- Sharing Data, AIA Technology in Architectural Practice, https://www.youtube.com/watch?v=dajUgdz_rls

BIG BIM Bang -- Enterprise BIM and BIG Data -- Sharing Data, AIA Technology in Architectural Practice, https://www.youtube.com/watch?v=dajUgdz_rls
Issa, Suermann and Olbina
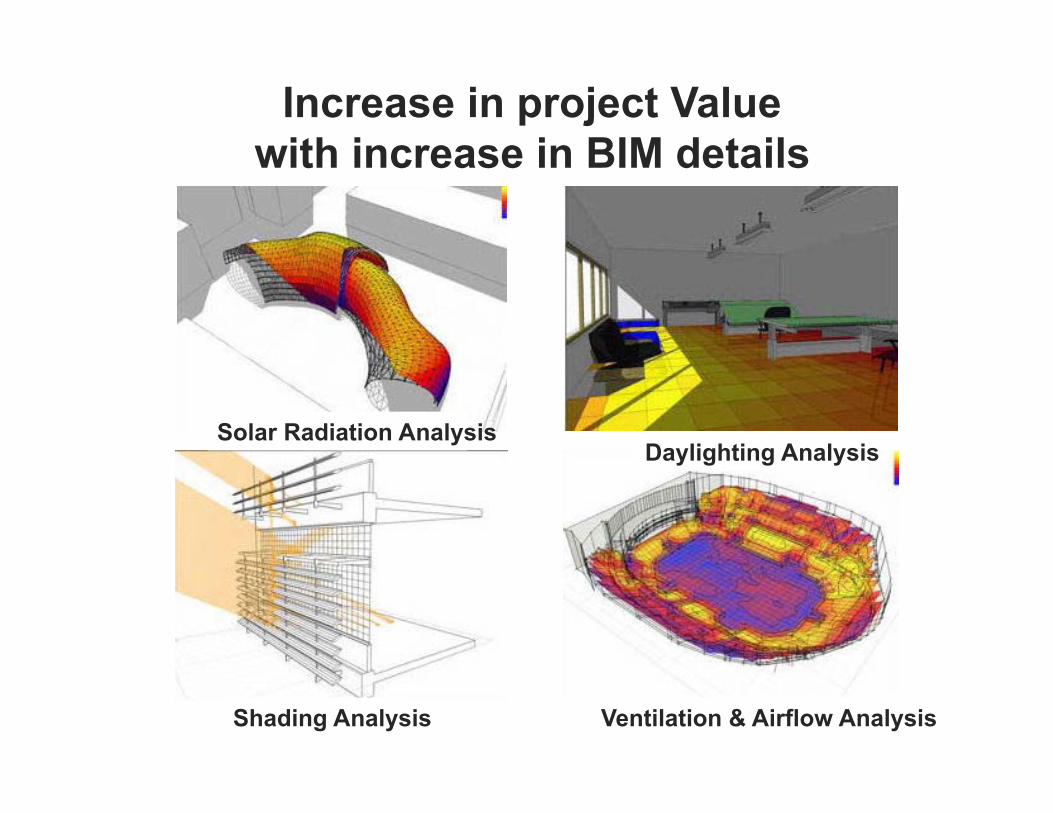
(A) Solar radiation Analysis (B) Daylighting analysis
(C) Shading analysis (D) Ventilation and Airflow Analysis
Figure 1: Different kinds of analysis performed by Autodesk Ecotect (Source: <www.autodesk.com/revit>)
2.2 VICO Virtual Construction (VC)
The Virtual Construction (VC) process involves building a building twice, once on the computer and once in the real world. It is a process by which a builder simulates a building before and during the actual construction process. VC relates time (4D) and cost (5D) to the underlying building model and allows the user to instantly relate a change to its impact on the project. It is ideally suited on projects with high cost and high risk and which can lead to high rewards for mitigating those costs and risks. Virtual construction is the natural extension of BIM superimposed with schedule and cost which when it is made ac-cessible to all stakeholders thus fostering communication and cooperation. The BIM allows the project team to collaborative-ly examine and tweak the building to meet budget and completion goals. As such, VC is invaluable for budget-constrained projects, where deadlines are important and project success is critical. As shown in Figure 3, the project risk is reduced as the representation of project progresses from 2D to 3D to 4D (schedule) to 5D (cost). VC is most applicable to projects of about $20 million and up, however, size is not as important as risk in the decision of whether to select VC or not. According to VICO (<www.vicosoftware.com>), through the use of VC on a hospital expansion project connecting three existing buildings with 102,000 sqf., the project team was able to eliminate 95% of the design clashes (700) and also reduced the project scheduled duration by 27% (42 weeks).
2666
Increase in project Value with increase in BIM details
Solar Radiation Analysis Daylighting Analysis
Shading Analysis Ventilation & Airflow Analysis


Summary of Points 1. In the beginning was Light
2. SSL technology integral part of shih from: a. Mass Produc6on to Mass Customiza6on b. Product with Fixed Single Func6on to Varied Mul6ple Func6ons
(Services)
3. Driven by convergence/synergism of 4 major Exponen6al growth trends summed up as Internet-‐of-‐Networks (IoN) a. Compu6ng power and informa6on storage b. Communica6on pipelines c. Miniaturiza6on d. Collec6ve Intelligence Networks (COINs)
4. Structural tensions between Con6nuous R&D & Accelerated Marke6ng a. Prove it first b. Applied learning and adap6on
5. Shared Goal: Proof of evidence-‐based outcomes of human-‐centric benefits comfort, health, well-‐being, produc6vity, benefits