Embed Size (px)
Citation preview
©2016 SCIO Health Analytics®. Confidential and Proprietary. All rights reserved. |1
Once We Understand, Change Results.
Patient (Persona) Analytics A Catalyst to Driving Engagement and Compliance
for Risk based Outcomes Contracting
October 5, 2016

|8
MARKET DRIVERS
DRUG PRICING PRESSURE
MARKET DRIVERS
COMPLEXITY OF HEALTHCARE
VALUE-BASED CARE
MARKET STRATEGIES
NEW BUSINESS MODELS
PAYVIDERS
OUTCOMES BASED CONTRACTING
COLLABORATION
RISK & DATA SHARING FOR BETTER
PATIENT OUTCOMES
PATIENT ENGAGEMENT &
CONSUMERISM
INSIGHTS & TECHNOLOGY AS
A KEY ENABLER
|9
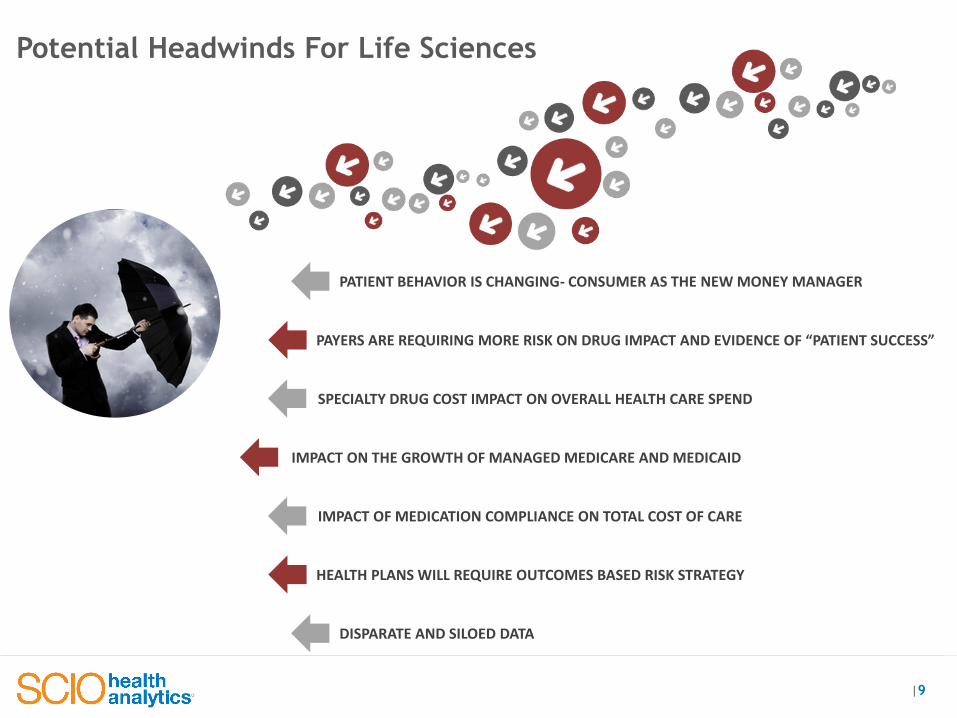
Potential Headwinds For Life Sciences
HEALTH PLANS WILL REQUIRE OUTCOMES BASED RISK STRATEGY
SPECIALTY DRUG COST IMPACT ON OVERALL HEALTH CARE SPEND
IMPACT OF MEDICATION COMPLIANCE ON TOTAL COST OF CARE
IMPACT ON THE GROWTH OF MANAGED MEDICARE AND MEDICAID
DISPARATE AND SILOED DATA
PATIENT BEHAVIOR IS CHANGING- CONSUMER AS THE NEW MONEY MANAGER
PAYER“ ARE REQUIRING MORE RI“K ON DRUG IMPACT AND EVIDENCE OF PATIENT “UCCE““

|11
360o ANALYSIS MATTERS
Singular View
SCIO
Comprehensive view
Vs.
IMPACT FOCUSMeasure and predict areas for
greatest impact and
identification of untreated
patients.
RESOURCE FOCUSFocus resources on contracting
payer collaboration and
commercial operation
resources
3600 FOCUSIncorporate multiple data
sources to determine
behaviors leading to
compliance, engagement and
risk reduction.
SCIO believes in bringing insights to light through a comprehensive lens
|13
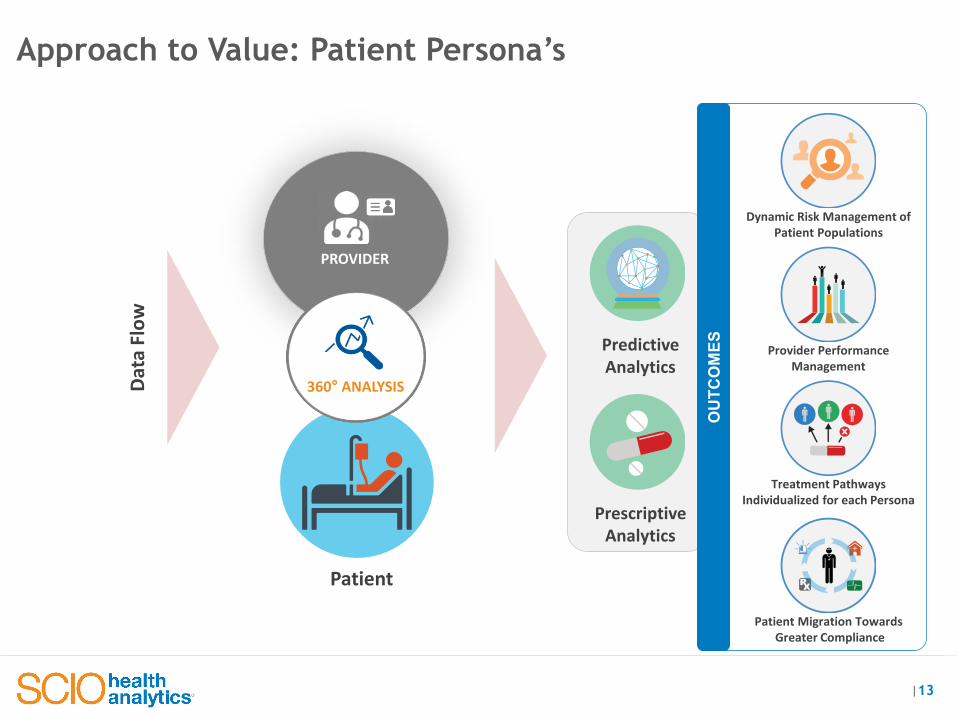
Patient
Approach to Value: Patient Persona’s
PROVIDER
360° ANALYSIS
Prescriptive
Analytics
Predictive
Analytics
OU
TC
OM
ES
Da
ta F
low
Dynamic Risk Management of
Patient Populations
Provider Performance
Management
Treatment Pathways
Individualized for each Persona
Patient Migration Towards
Greater Compliance

|14
72%
14%
4%1%
$200K+
$100K - $200K
$50K - $100K
Less than $50K
Estimated Income
Patient Persona example: High Utilizers
23%
58%
12%7%
65+ 55-64
35-54 16-34
Age Group
Description
High-risk adults, mostly non- college level education, blue collar employees with average income. They happen to be high utilizers of healthcare services given that they are higher risk and the average chronic conditions is greater than one.
Intervention: High risk with high utilization, so need to education HCP to ensure steerage
Demographic Attributes
% Above Poverty Level 68%
% Blue Collar Employed 36%
% Single Family Dwelling 33%
% Married 48%
% Household with children 60%
Utilization Attributes
IP Utilization 1.45
ER Utilization 0.84
# Average Chronic Conditions 2.05
Paid Amount PMPM ER $95
Paid Amount PMPM IP $247
Gender Education
School College
Individuals with
Income Level
> $50K
Median Age
43
$146K
72%
HCP Engagement
AverageSpending
Median Home Value
Socio-Economic Score
62
Spending Pattern
60 100
Low Risk Median Risk
Prospective Score
0.71

|15
Healthy &
Affluent
Balanced
AdultsHigh Utilizers Quality Driven Cost Conscious
Chronic older
Adults
High Cost Baby
Boomers
Example of Personas – Clinical Attributes
No.of chronic conditions
ER Paid PMPM
IP Paid PMPM
ER Utilization
IP Utilization
0.540.70 0.71
0.86 0.82
1.021.13
Median Risk Prospective
Score
0.6 0.7 0.8 1.2 1.2 1.3 1.6
0.09 0.05 0.10 0.04 0.07 0.08 0.09
0.25 0.22 0.34 0.23 0.18 0.21 0.23
$75 $73 $147 $54 $75 $118 $248
$10 $9 $14 $9 $7 $10 $11

|18
THE OPIOID CHALLENGE

|19
• Market Potential is up to 6x the current number of patients on Opioid Dependence therapy. 80% of which are non compliant.
Patients are stratified by compliance and prospective risk
(10) Highest prospective risk patients (e.g. decile 10) consume 75% of healthcare spend
Each year prospective risks shifts patients between each decile group (e.g. patients health improves resulting in lower
risk while other patients become more sick)
Existing and Untreated Patients by Opioid Dependence Compliance and Risk
|20
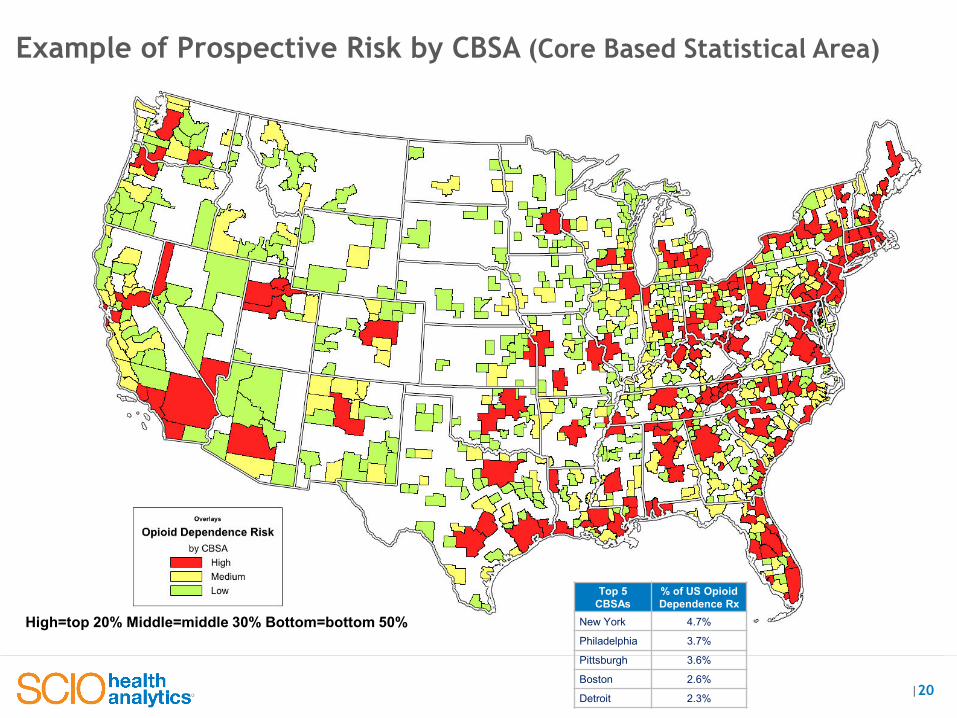
Example of Prospective Risk by CBSA (Core Based Statistical Area)
Top 5 CBSAs
% of US OpioidDependence Rx
New York 4.7%
Philadelphia 3.7%
Pittsburgh 3.6%
Boston 2.6%
Detroit 2.3%
High=top 20% Middle=middle 30% Bottom=bottom 50%

|21
UNDIAGNOSED DIABETES PATIENT CHALLENGE

|22
Patients are stratified by compliance and prospective risk
(10) Highest prospective risk patients (e.g. decile 10) consume 75% of healthcare spend
Each year prospective risks shifts patients between each decile group (e.g. patients health improves resulting in lower
risk while other patients become more sick)
Patients by Diabetes Groups, Compliance and Risk
|23
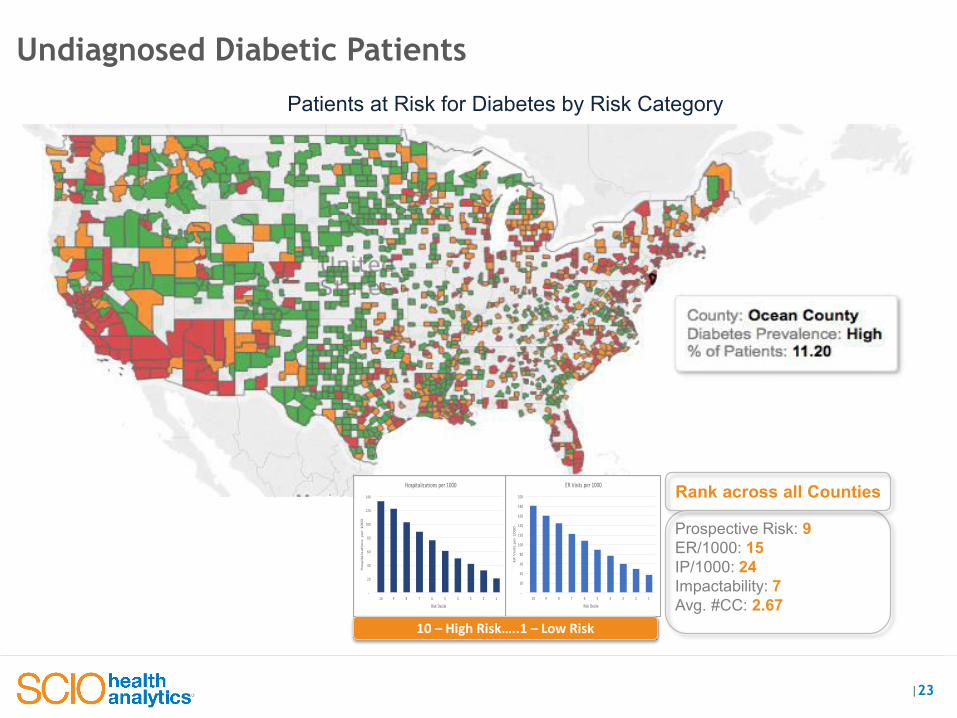
Patients at Risk for Diabetes by Risk Category
-
20
40
60
80
100
120
140
10 9 8 7 6 5 4 3 2 1
Hospitalizationsper1000
RiskDecile
Hospitalizationsper1000
-
20
40
60
80
100
120
140
160
180
200
10 9 8 7 6 5 4 3 2 1
ERVisitsper1000
RiskDecile
ERVisitsper1000
10 – High Risk…..1 – Low Risk
Undiagnosed Diabetic Patients
Prospective Risk: 9ER/1000: 15IP/1000: 24Impactability: 7Avg. #CC: 2.67
Rank across all Counties
|24
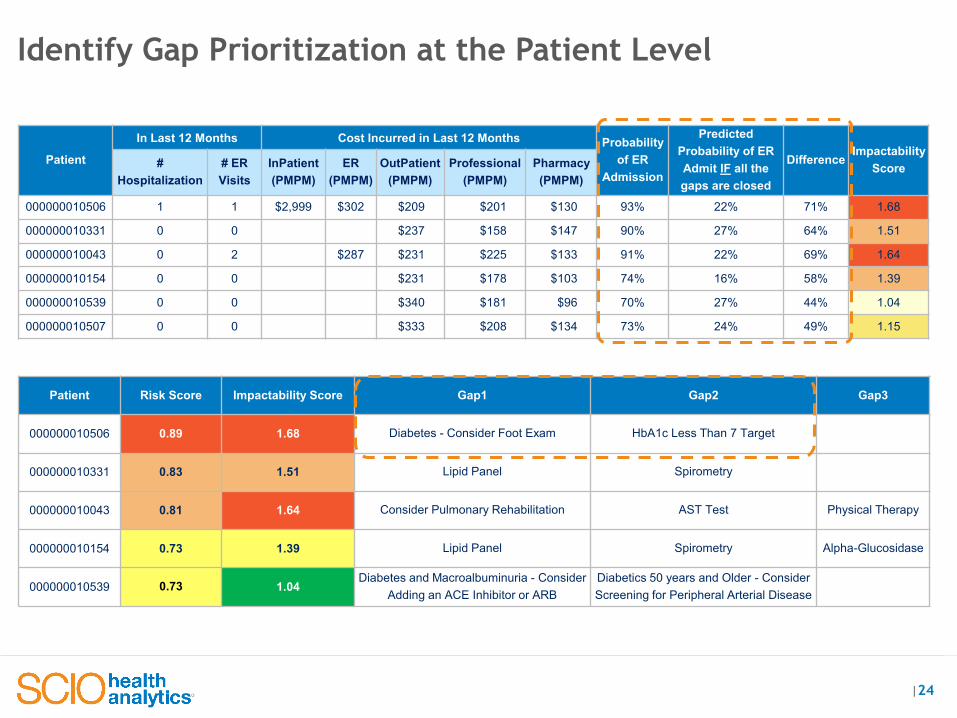
Identify Gap Prioritization at the Patient Level
Patient Risk Score Impactability Score Gap1 Gap2 Gap3
000000010506 0.89 1.68 Diabetes - Consider Foot Exam HbA1c Less Than 7 Target
000000010331 0.83 1.51 Lipid Panel Spirometry
000000010043 0.81 1.64 Consider Pulmonary Rehabilitation AST Test Physical Therapy
000000010154 0.73 1.39 Lipid Panel Spirometry Alpha-Glucosidase
000000010539 0.73 1.04Diabetes and Macroalbuminuria - Consider
Adding an ACE Inhibitor or ARB
Diabetics 50 years and Older - Consider
Screening for Peripheral Arterial Disease
Patient
In Last 12 Months Cost Incurred in Last 12 Months Probability
of ER
Admission
Predicted
Probability of ER
Admit IF all the
gaps are closed
DifferenceImpactability
Score#
Hospitalization
# ER
Visits
InPatient
(PMPM)
ER
(PMPM)
OutPatient
(PMPM)
Professional
(PMPM)
Pharmacy
(PMPM)
000000010506 1 1 $2,999 $302 $209 $201 $130 93% 22% 71% 1.68
000000010331 0 0 $237 $158 $147 90% 27% 64% 1.51
000000010043 0 2 $287 $231 $225 $133 91% 22% 69% 1.64
000000010154 0 0 $231 $178 $103 74% 16% 58% 1.39
000000010539 0 0 $340 $181 $96 70% 27% 44% 1.04
000000010507 0 0 $333 $208 $134 73% 24% 49% 1.15
|25
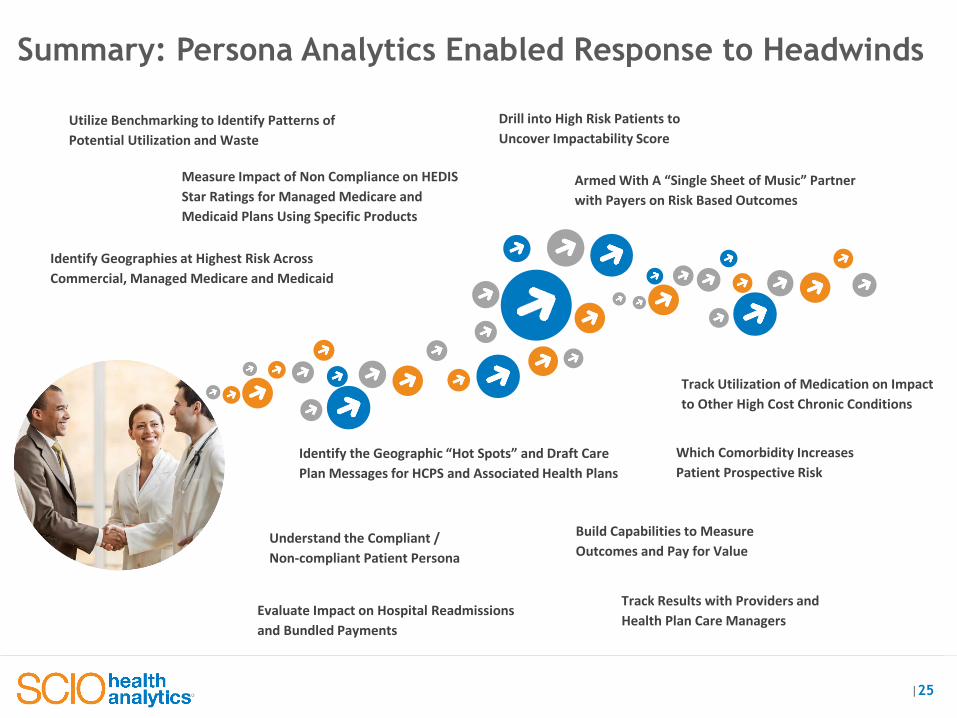
Utilize Benchmarking to Identify Patterns of
Potential Utilization and Waste
Drill into High Risk Patients to
Uncover Impactability Score
Measure Impact of Non Compliance on HEDIS
Star Ratings for Managed Medicare and
Medicaid Plans Using Specific Products
Identify Geographies at Highest Risk Across
Commercial, Managed Medicare and Medicaid
Ar ed With A “i gle “heet of Music Part er with Payers on Risk Based Outcomes
Ide tify the Geographic Hot “pots a d Draft Care Plan Messages for HCPS and Associated Health Plans
Understand the Compliant /
Non-compliant Patient Persona
Build Capabilities to Measure
Outcomes and Pay for Value
Evaluate Impact on Hospital Readmissions
and Bundled Payments
Track Results with Providers and
Health Plan Care Managers
Track Utilization of Medication on Impact
to Other High Cost Chronic Conditions
Which Comorbidity Increases
Patient Prospective Risk
Summary: Persona Analytics Enabled Response to Headwinds