Embed Size (px)
Citation preview

Innovations In Quality: Rural Success Stories
Adam Kohlrus, MS, CPHQ, CPPS
Director of Performance Improvement
Institute for Innovations in Care and Quality
June 17, 2015

Aims
• Illinois Hospital Success in 2014
• The Landscape
• Innovative Rural Programs
-Readmissions (Graham Hospital)
-Behavioral Health (Herrin Hospital)
-Medication Reconciliation (Anderson Hospital)
• The Institute Road Ahead-HEN 2.0
2

Statewide Success 2014
3

As part of HEN 1.0, 100 IL IHA HEN hospitals prevented 15,887 instances of patient harm for a cost savings of
$161.8 million between January 2012 and March 2014 14,294 readmissions prevented; 285 early-elective deliveries prevented; 234 post-operative pulmonary embolisms
or incidents of deep vein thrombosis prevented; 192 central line-associated bloodstream
infections prevented; 188 catheter-associated urinary tract
infections prevented; 152 incidents of ventilator-associated
pneumonia prevented; 131 surgical site infections prevented; 126 birth trauma or injuries to neonates
prevented; 123 pressure ulcers prevented; 116 falls with injury prevented; and 46 manifestations of poor glycemic control
prevented.
http://www.ihatoday.org/IHA-Institute/Raising-the-Bar.aspx 4

5
AHA/HRET: Achievement of Targets – November 2014
AREA At least 60%
Reporting
At least 70%
Reporting
At least 80%
Reporting
17.6% Change
from Baseline
(15% Readm)
AND At Least
60% Reporting
40% Change from
Baseline (20% Readm)
AND At Least 80%
Reporting
Met High
Perf.
Benchmk
Achievement
of Target
ADE
CAUTI
100% reporting
33% reduction
CLABSI
100% reporting
61% reduction
Falls
60%-53% reporting
9% reduction/
25% reduction
OB-EED
90% reporting
79% reduction
OB-Other
98% reporting
41% reduction
PrU
100% reporting
28% reduction
SSI
100% reporting
Readm
100% reporting
VAP/VAE
100% reporting
23% reduction
VTE
100% reporting
42% reduction
IL IHA HEN 1.0 Results

The Landscape
6

CMS has adopted a framework that categorizes payments to providers
Description
Medicare Fee-for-Service examples
Payments are based on volume of services and not linked to quality or efficiency
Category 1:
Fee for Service – No Link to Value
Category 2:
Fee for Service – Link to Quality
Category 3:
Alternative Payment Models Built on Fee-for-Service Architecture
Category 4:
Population-Based Payment
At least a portion of payments vary based on the quality or efficiency of health care delivery
Some payment is linked to the effective management of a population or an episode of care Payments still triggered by
delivery of services, but opportunities for shared savings or 2-sided risk
Payment is not directly triggered by service delivery so volume is not linked to payment Clinicians and
organizations are paid and responsible for the care of a beneficiary for a long period (e.g., ≥1 year)
Limited in Medicare fee-for-service Majority of
Medicare payments now are linked to quality
Hospital value-based purchasing Physician Value
Modifier Readmissions /
Hospital Acquired Condition Reduction Program
Accountable Care Organizations Medical homes Bundled payments Comprehensive Primary Care
initiative Comprehensive ESRD Medicare-Medicaid Financial
Alignment Initiative Fee-For-Service Model
Eligible Pioneer Accountable Care Organizations in years 3-5 Maryland hospitals
Source: Rajkumar R, Conway PH, Tavenner M. CMS ─ engaging multiple payers in payment reform. JAMA 2014; 311: 1967-8.

During January 2015, HHS announced goals for value-based payments within the Medicare FFS system

2016
30%
85%
2018
50%
90%
Target percentage of payments in ‘FFS linked to quality’ and ‘alternative payment models’ by 2016 and 2018
2014
~20%
>80%
2011
0%
~70%
Goals Historical Performance
All Medicare FFS (Categories 1-4)
FFS linked to quality (Categories 2-4)
Alternative payment models (Categories 3-4)

Medicare Penalties
Medicaid Penalties
2011 25.3 Million N/A
2012 20.9 Million N/A
2013 18.8 Million 40 Million
2014 14.8 Million 12 Million
2015 30.5 Million 12 Million
10
IL Medicare/Medicaid Readmissions Penalties
• $174.3 Million in
Medicare/Medicaid penalties which Illinois Hospitals have incurred since 2011...

Our Solution…Systems Innovation
System Innovation
Consumer Experience
Service Model
Product Offering
Channel Partners
Process Operations
Revenue Model
Source: Adapted from Change and Innovation in Healthcare: Avia (Roy Smythe and Leslie Wainwright)
• The Ipod
• Integrated offerings which create a unique and holistic customer experience are needed in order to adapt to the system and consumer

12
The IHI Triple Aim

Innovative Rural Programs
13
How you respond to the challenge in the second half will
determine what you become after the game, whether
you are a winner or a loser.
-Louis Camuti

An Innovative Solution to Reducing Readmissions:
Graham Hospital and The
W.R.A.P Program
14

W.R.A.P-Graham Hospital
• With the rising emphasis on reducing hospital readmissions, it is important to identify and utilize evidence based programs that can help ensure patient safety at discharge, as well as shore up hospital confidence that it is providing effective and successful individualized discharged plans for each patient.
• Wellness Recovery Action Plan (W.R.A.P.) offers many of the necessary components for a successful disease management program
• Offered in both in-patient and out-patient settings, to maximize efforts to successfully reduce preventable hospital readmissions, specifically for the C.O.P.D. population
15

Why Use W.R.A.P
While countless curriculums' can be found on disease management techniques, W.R.A.P. has some unique components that set it apart from the others:
A) It is an Evidence Based Practice- Extensive research has proven its techniques are effective in the management of chronic health conditions.
B) Low cost to implement- there are no costly materials to buy or fees associated with the use of the curriculum.
C) It is empowering and offers immediate buy-in for the participants- There is no one telling them what they must do. They can choose the wellness tools that they know will work best for them and then put it all together in a succinct plan they can reference daily and revise as see their needs changing.
D) It looks at the WHOLE person and helps participants to see the spectrum of wellness to illness and action steps they can use to intervene before they end up back in a crisis and must go back to the hospital again.
16

W.R.A.P COPD Program
• Week 1- Introduction to W.R.A.P.
• Week 2- Explanation of COPD
• Week 3- Representative from Dietary address how diet affects their COPD management, as well as tools they can use each day to help improve their quality of life.
• Week 4- Representative from Pharmacy address how their meds work to help improve lung function and other overall organ systems connected with COPD.
• Week 5- Coverage of the W.R.A.P. curriculum that helps group members develop Wellness Tools that they can use each day to help stay healthy, despite having COPD.
17

W.R.A.P COPD Program
• Week 6- Explanation of the W.R.A.P. curriculum, which allows group members to identify COPD triggers, early warning signs, when things are breaking down, crisis plan management of COPD.
• Week 7- Coverage of the W.R.A.P. curriculum for a Post Crisis W.R.A.P. plan.
• Week 8- Question and answer time, assistance with group members in writing certain parts of their W.R.A.P. plan, finish up any W.R.A.P. curriculum that had not been covered in previous weeks, etc.
*Department representatives are there for question and answer only. They do not need to bring any prepared curriculum with them, but are welcome to bring ideas, handouts or demonstrate techniques they think might be beneficial to
participants.
18
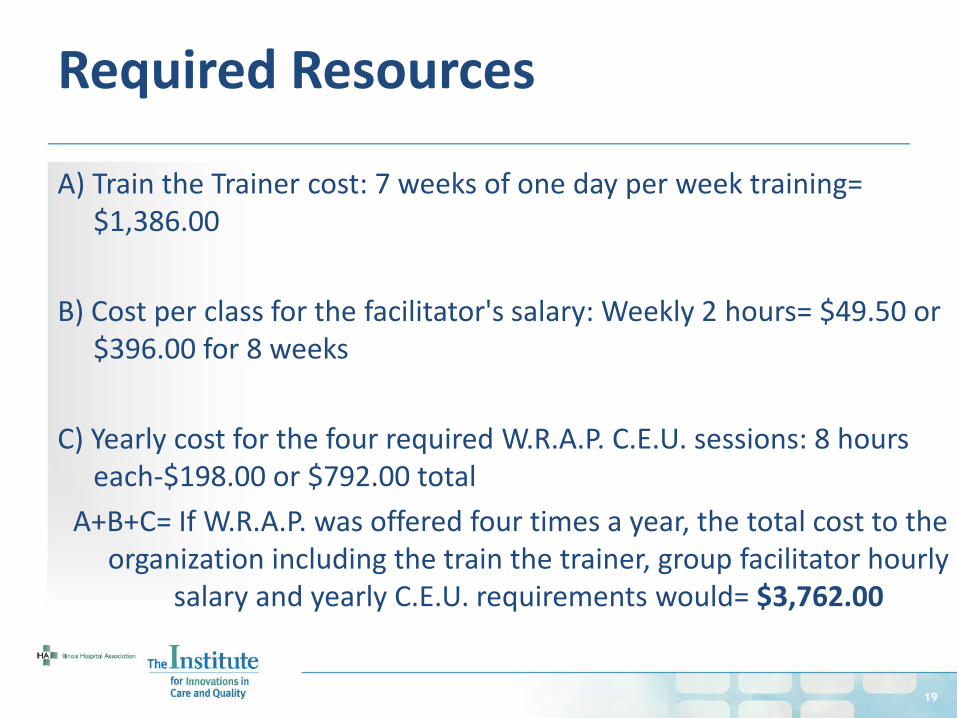
Required Resources
A) Train the Trainer cost: 7 weeks of one day per week training= $1,386.00
B) Cost per class for the facilitator's salary: Weekly 2 hours= $49.50 or $396.00 for 8 weeks
C) Yearly cost for the four required W.R.A.P. C.E.U. sessions: 8 hours each-$198.00 or $792.00 total
A+B+C= If W.R.A.P. was offered four times a year, the total cost to the organization including the train the trainer, group facilitator hourly
salary and yearly C.E.U. requirements would= $3,762.00
19

W.R.A.P-ROI
• An internal audit was done in 2012 by Graham's financial services department to get an estimated cost of what one readmission costs the organization.
• At that time, they found the average gross charge per inpatient to be $22,622.
• As of January, with the adjustment percentage of 58.5% being applied to each person, the average net loss with each readmission is $9,388.
20

W.R.A.P-ROI
Cost of 4 W.R.A.P. TrainingSessions (Each TrainingSession is 8 Weeks)
Net loss for each COPDreadmission
21
$ 3,762
$ 9,388

22
W.R.A.P Achieving the Triple Aim
Low cost to implement: High ROI
Patient-Centered Care
Largest readmitted diagnostic population
(COPD)
Focuses on the WHOLE person from wellness to
illness

An Innovative Solution to
Reducing Behavioral Health Readmissions:
Herrin Hospital
and Centerstone Collaborative Pilot Project Aligning Community Partners
23

Behavioral Health Readmissions
24
HF Bipolar Septicemia
COPD Major Depressive Disorders & Other
Unspecified Psychoses
• A “super-utilizer” groundswell is emerging. Programs designed to serve high-need, high-cost populations are growing in number – the Center for Health Care Strategies (CHCS) recently catalogued such programs in 26 states, and expects this number to steadily increase.
Top 5 APR-DRGs in Illinois
These top 5 APR DRGs for Illinois are from October 1, 2013-September 30, 2014 RAP Statewide Report
In other states and at the federal level,
policymakers are increasingly
making it a priority to launch and scale these
programs.

Centerstone Crisis Center in Partnership with Herrin Hospital • Hospital and Emergency Department costs related to mental
health crises are one of the biggest drivers of Medicaid costs in southern Illinois. Seeing a need to reduce unnecessary ED and hospital utilization for persons with mental illness in crisis, Centerstone has developed two service lines: Community Crisis Assessment and Crisis Stabilization.
25

• In 2014, Centerstone’s ED and hospital diversion care service lines saved Illinois $4.1 million in prevented Medicaid costs.
• In January 2014 at the start of the Southern Illinois Healthcare Centerstone collaboration, the average number of hours a person with a behavioral health crisis could expect to be in the Herrin Hospital ED was 7.3 hours.
• Due to the partnership with Centerstone, the 2015 average hours are now 6.1 hours.
• This is a 20% reduction, freeing up valuable staff time in the ED to address other urgent needs.
26
Centerstone Crisis Center in Partnership with Herrin Hospital

• Centerstone’s Community Crisis Assessment Team provided 2,730 crisis services in 2014.
• Mental health related ED visits can cost as much as 50% more than that of other ED visits, for an average cost of $3,100.
• With Centerstone’s Crisis Assessment Services costing $402 per assessment on average, this is a savings of $2,698 per encounter if the community crisis assessment prevented an ED visit.
• For the individuals who received a preventative crisis assessment be for e an ED visit occurred, estimated 2014 savings for ED visits alone is $3 million.
27
Community Crisis Assessment

• Centerstone’s Crisis Stabilization Unit (CSU) is a cost-effective hospitalization alternative for individuals with mental illness needing a safe, short term, 24/7 staffed unit with nursing coverage.
• The CSU prevented 537 hospitalization nights while providing a safe, short-term 24/7-staffed unit with nursing coverage.
• This amounted to a mean per diem savings of $2,021, a total savings of nearly $1.1 million in 2014.
28
Crisis Stabilization Unit (CSU)

29
Crisis Center Achieving the Triple Aim
Meeting the patient at the right place, at the
right time and with the right level of care
Designed to serve high-need, high cost population

An Innovative Solution to Enhanced Medication
Reconciliation:
Anderson Hospital Collaborative Pilot Project: Connecting Hospital EMRs with the
IL PMP
30
31
The Illinois Prescription Monitoring Program (PMP) Collaborative
A collaborative effort to leverage existing technology in order to enhance medication
reconciliation by facilitating accurate and more timely communication of medications across the
continuum

• A centralized repository of controlled medication prescription information collected from 2800+ pharmacies in Illinois
• Information is electronically uploaded on a weekly basis to the IL Dept of Human Services (DHS) PMP website
o 1 million prescriptions/month
• Clinicians currently access the PMP
by navigating to and logging in at the website to view patients current & historical use of controlled medications
32
What is the Prescription Monitoring Program (PMP)?

33
Objectives of the Pilot Collaborative
Phase I: Introduce seamless direct integration between PMP & Acute Care Hospital Electronic Medical Record (EMR) - allowing clinicians direct access to current PMP medication information from their EMR
Phase II: Integrate a data transfer link between PMP & LTC medication information to Hospital’s EMR to provide enhanced accuracy of patient medication
reconciliation resulting in decreased readmissions and improved safety
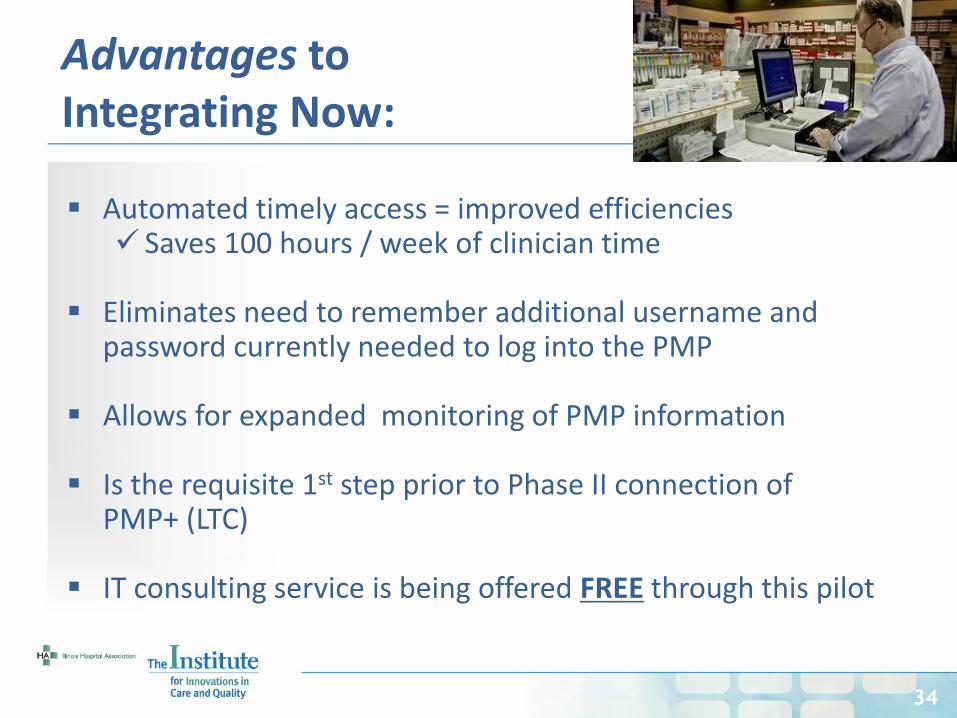
Automated timely access = improved efficiencies Saves 100 hours / week of clinician time
Eliminates need to remember additional username and password currently needed to log into the PMP
Allows for expanded monitoring of PMP information Is the requisite 1st step prior to Phase II connection of
PMP+ (LTC) IT consulting service is being offered FREE through this pilot
Advantages to Integrating Now:
34

EMR-PMP pathway:
Anderson Hospital Prior to 2012 (and majority of hospitals today)
EMR
Clinician
logs in
twice – to
PMP & EMR
for a clear
picture of
medication
use
DHS PMP
BEFORE
INTEGRATION
EMR
35

Anderson Hospital Today
EMR
DHS PMP
AFTER PHASE 1
INTEGRATION EMR
LISTENER
Clinician
logs into
EMR and
navigates
to a tab to
see the
PMP info
36
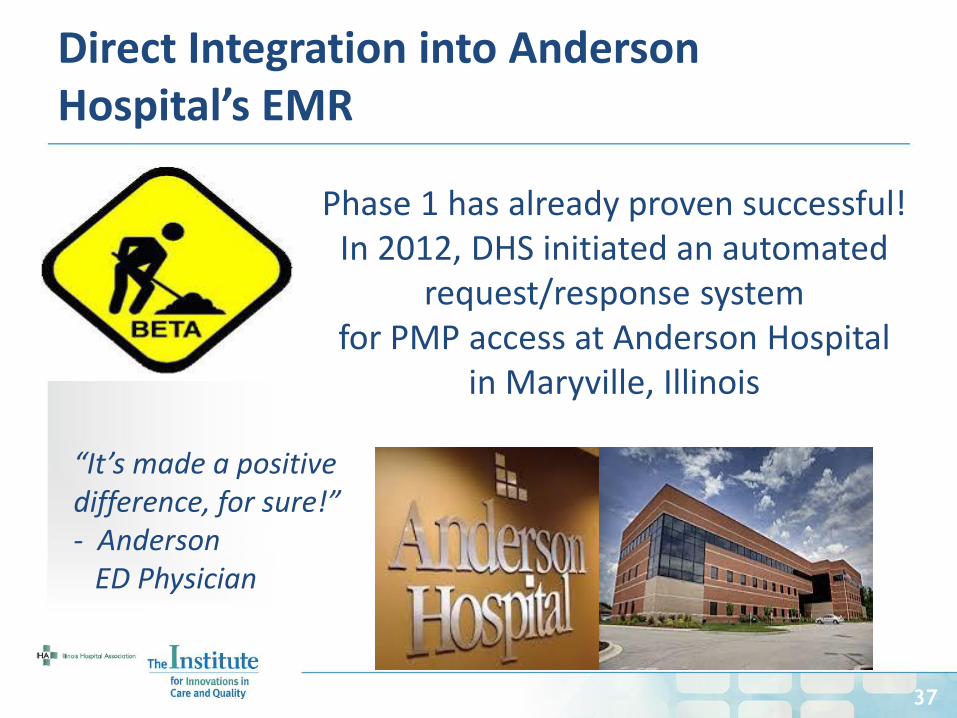
Direct Integration into Anderson Hospital’s EMR
Phase 1 has already proven successful! In 2012, DHS initiated an automated
request/response system for PMP access at Anderson Hospital
in Maryville, Illinois
“It’s made a positive difference, for sure!” - Anderson ED Physician
37

• Huge value add due to the EMR button -no need to log into the PMP manually • Expands numbers of staff “eyes” to monitor medication
sources • Used PMP data to justify denial of medications to potential
drug seeking patients • Augments medication reconciliation for admission &
discharge
38
Anderson Clinician Feedback
“It’s been awesome!”

39
PMP Achieving the Triple Aim
More accurate real-time medication
reconciliation
Since Anderson Hospital submits approximately 1,200 automated
requests weekly, the approximate value to the
hospital equals $8,000 weekly or slightly more than two FTE
physicians annually.
Enhanced continuity of care on transfers between LTC &
hospitals
Increased accuracy of medication reconciliation
resulting in decreased readmissions and improved
patient outcomes

The Institute and the Road Ahead
40

Content Across the Continuum…
41

42
• Encourage your Quality Departments, CEOs, CMOs, CNOs and fellow Board Members to engage in HEN 2.0 and the Institute’s Quality Initiatives moving forward
The Institute for Innovations in Care and Quality