Embed Size (px)
Citation preview
Dependence of health outcome on health expenditure in Africa
1 in 8 child dies before 51 in 8 child dies before 5in Africa
1
Soheila AbachiNovember 27, 2014
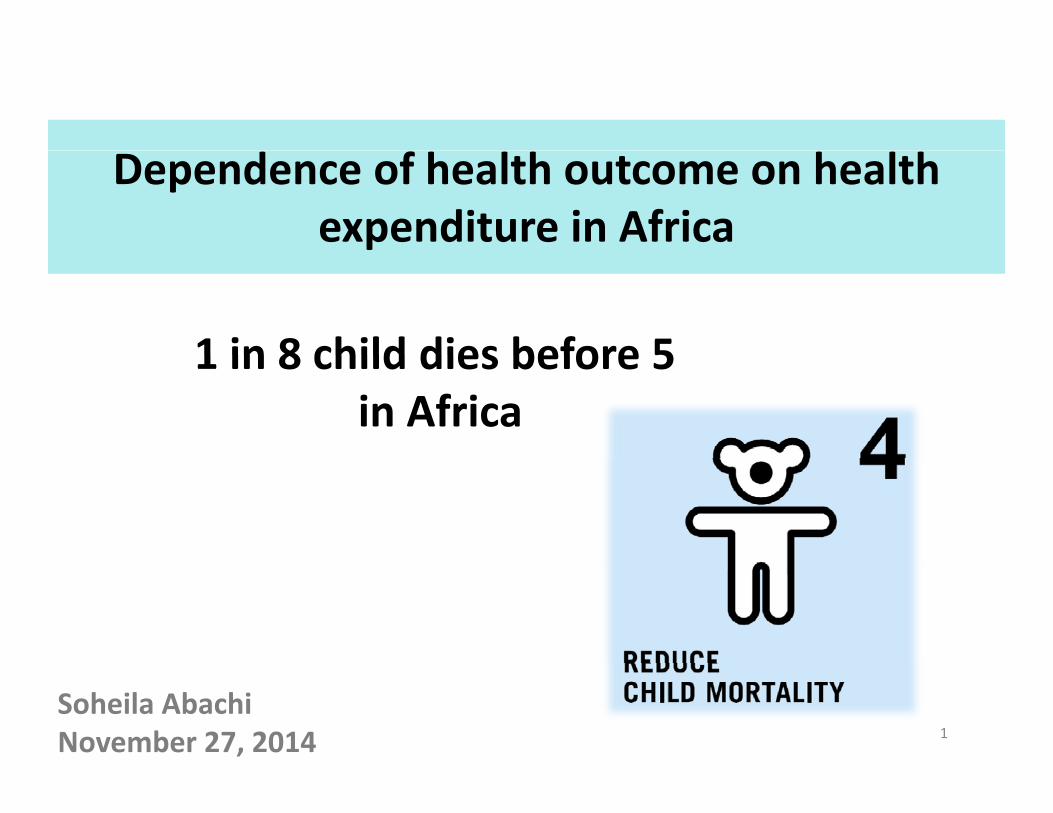
Facts
Life expectancy linked to economic growth (WHO)
10% increase in life expectancy 0.35% increase in economic hgrowth
Poor and rich countries economic growth difference due to health status of members (commission on microeconomics & health)health status of members (commission on microeconomics & health)
10 million <5 death in 2006, 5 million from Africa
each min te 21 children < 5 die (UNICEF)each minute 21 children < 5 die (UNICEF)
~ 70% caused by diarrhea, malaria, neonatal infection pneumonia preterm delivery lack of oxygen at birthinfection, pneumonia, preterm delivery, lack of oxygen at birth (UNICEF)
2
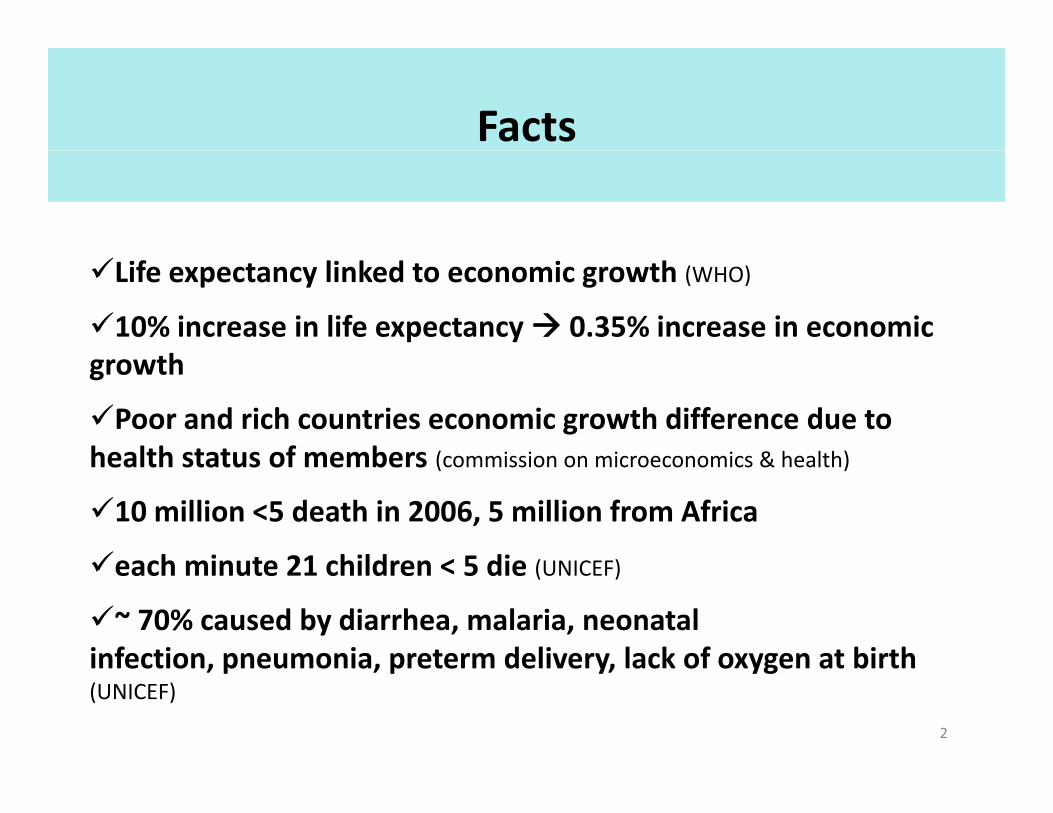
Facts
~ 50% of global <5 death in five countries: India, Nigeria, Democratic Republic of the Congo, Pakistan, China
H l h $/ / 2001Health care $/person/year 2001 (Commission for Africa, 2004)
High‐income countries > US$ 2,000
Africa US$13‐$21 in 2001
To deliver basic treatment & care for major communicable diseases & earl childhood and maternal illnesses in s b Saharandiseases & early childhood and maternal illnesses in sub‐ Saharan Africa expenditure should rise to US$ 38 by 2015
3
Data
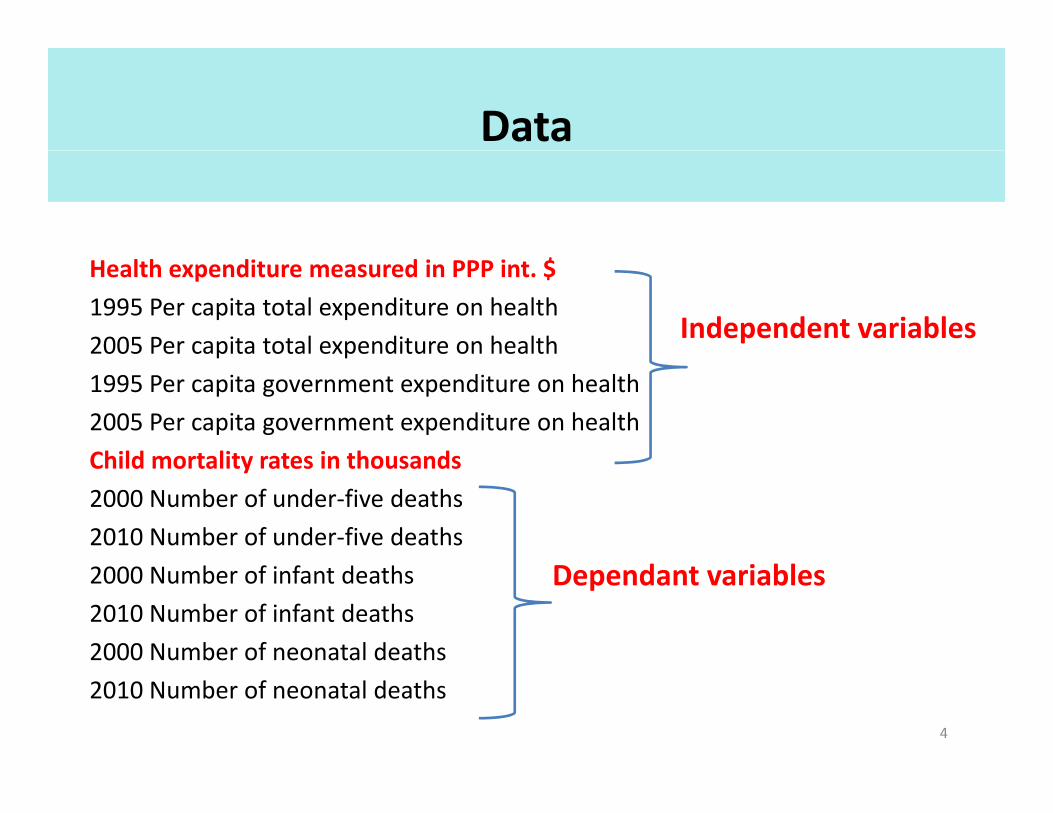
Health expenditure measured in PPP int. $
1995 Per capita total expenditure on health
2005 Per capita total expenditure on healthIndependent variables
p p
1995 Per capita government expenditure on health
2005 Per capita government expenditure on health
Child mortality rates in thousandsChild mortality rates in thousands
2000 Number of under‐five deaths
2010 Number of under‐five deaths
2000 Number of infant deaths
2010 Number of infant deaths
2000 Number of neonatal deaths
Dependant variables
2010 Number of neonatal deaths
4
Data
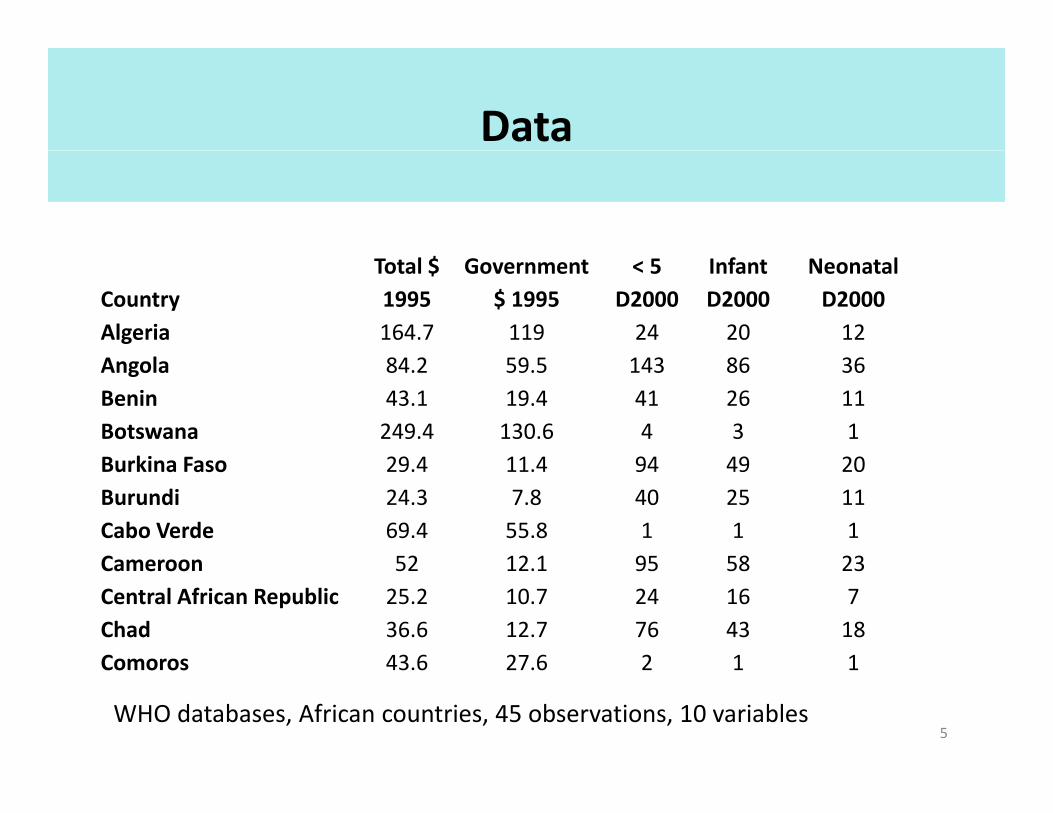
Country Total $1995
Government $ 1995
< 5 D2000
Infant D2000
NeonatalD2000
Algeria 164.7 119 24 20 12Angola 84.2 59.5 143 86 36Benin 43.1 19.4 41 26 11Botswana 249.4 130.6 4 3 1B ki F 29 4 11 4 94 49 20Burkina Faso 29.4 11.4 94 49 20Burundi 24.3 7.8 40 25 11Cabo Verde 69.4 55.8 1 1 1Cameroon 52 12 1 95 58 23Cameroon 52 12.1 95 58 23Central African Republic 25.2 10.7 24 16 7Chad 36.6 12.7 76 43 18Comoros 43 6 27 6 2 1 1Comoros 43.6 27.6 2 1 1
WHO databases, African countries, 45 observations, 10 variables 5
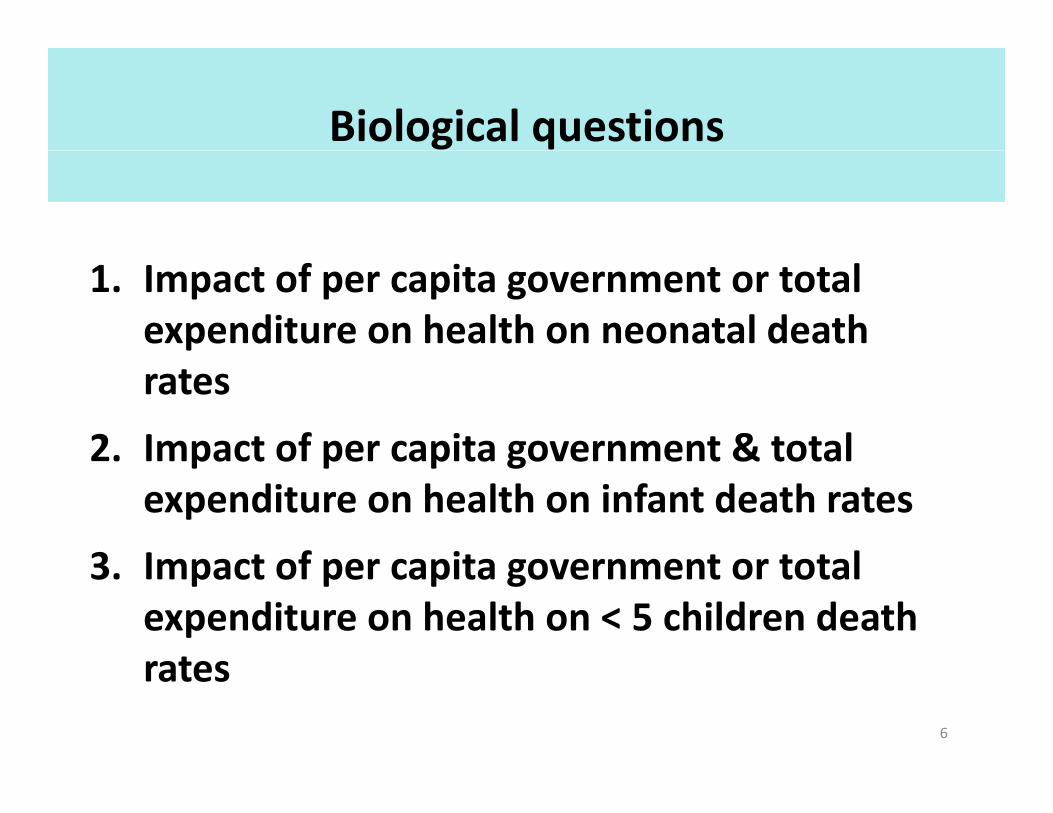
Biological questions
1. Impact of per capita government or total expenditure on health on neonatal death rates
2. Impact of per capita government & total2. Impact of per capita government & total expenditure on health on infant death rates
3 Impact of per capita government or total3. Impact of per capita government or total expenditure on health on < 5 children death ratesrates
6
900
1000 Nigeria
500
600
700
800
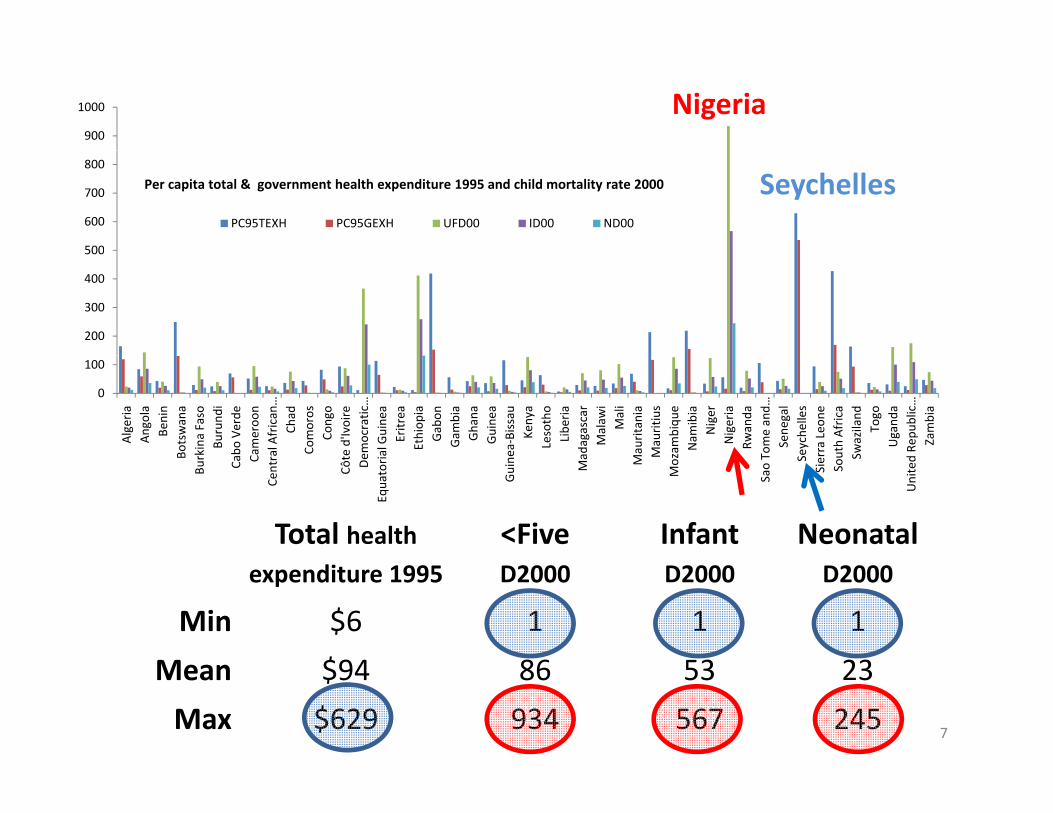
Per capita total & government health expenditure 1995 and child mortality rate 2000
PC95TEXH PC95GEXH UFD00 ID00 ND00
Seychelles
200
300
400
500
0
100
Algeria
Angola
Benin
Botswana
rkina Faso
Burund
iabo Ve
rde
Cameroo
nral A
frican
…Ch
adCo
moros
Congo
te d'Ivoire
emocratic
…ial G
uine
aEritrea
Ethiop
iaGabon
Gam
bia
Ghana
Guine
ane
a‐Bissau
Kenya
Lesotho
Libe
ria
adagascar
Malaw
iMali
Mauritania
Mauritiu
szambiqu
eNam
ibia
Niger
Nigeria
Rwanda
Tome and …
Sene
gal
Seyche
lles
erra Leo
neuth Africa
Swaziland
Togo
Ugand
ad Re
public …
Zambia
Total health <Five Infant Neonatal
Bur
Ca CCe
ntr
Côt De
Equatori
Guin Ma M
Mo
Sao T S
Sie
SoS
United
expenditure 1995 D2000 D2000 D2000
Min $6 1 1 1
M $94 86 53 23
7
Mean $94 86 53 23
Max $629 934 567 245
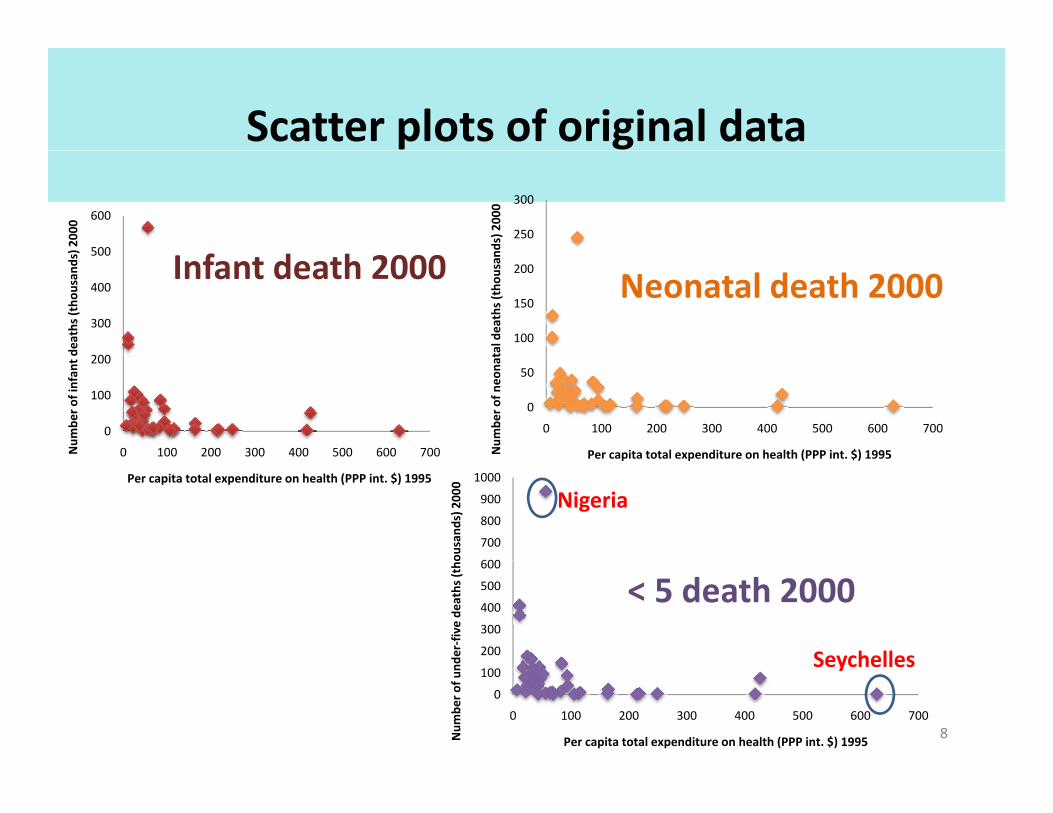
Scatter plots of original data
250
300
nds) 200
0
500
600
) 200
0
100
150
200
tal deaths (tho
usan
Neonatal death 2000
200
300
400
500
deaths (tho
usan
ds)
Infant death 2000
0
50
0 100 200 300 400 500 600 700
Num
ber o
f neo
nat
Per capita total expenditure on health (PPP int. $) 1995
0
100
200
0 100 200 300 400 500 600 700Num
ber o
f infan
t d
Per capita total expenditure on health (PPP int. $) 1995
Per capita total expenditure on health (PPP int. $) 1995
600
700
800
900
1000
ousand
s) 200
0
Nigeria
200
300
400
500
600
der‐fiv
e de
aths (tho
< 5 death 2000
Seychelles
8
0
100
0 100 200 300 400 500 600 700
Num
ber o
f und
Per capita total expenditure on health (PPP int. $) 1995
Seychelles
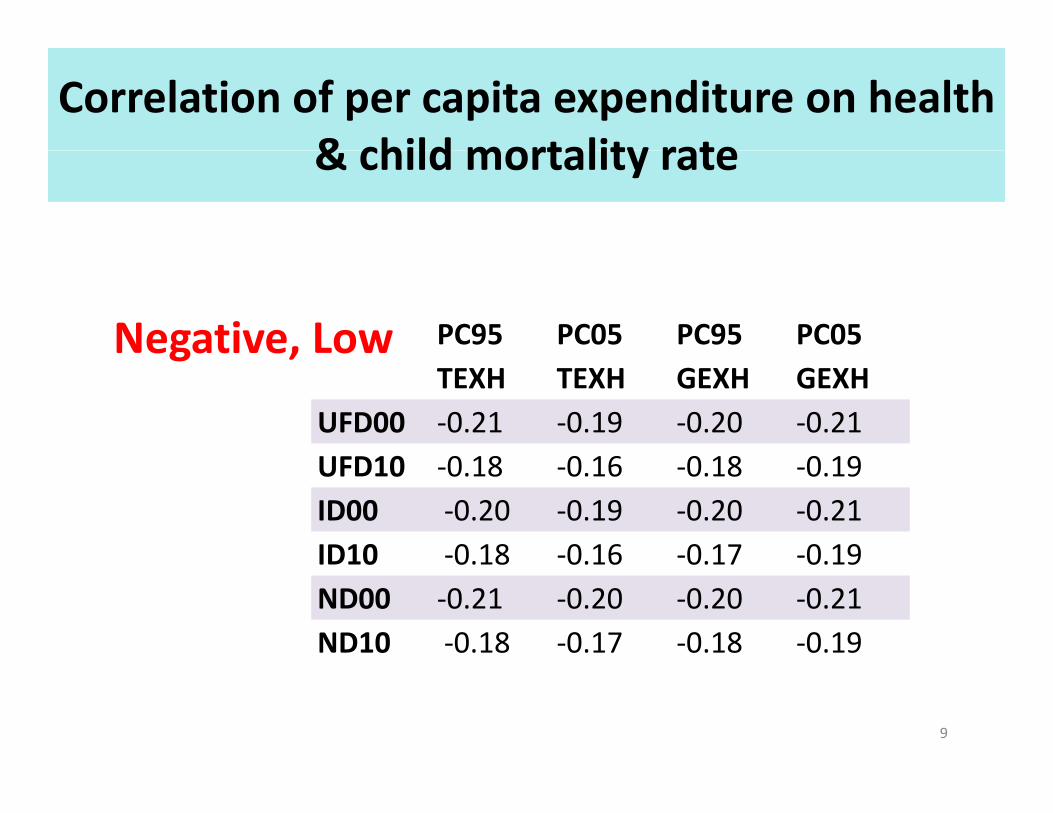
Correlation of per capita expenditure on health & child mortality rate& child mortality rate
Negative, Low PC95 PC05 PC95 PC05 g ,TEXH TEXH GEXH GEXH
UFD00 ‐0.21 ‐0.19 ‐0.20 ‐0.21UFD10 0 18 0 16 0 18 0 19UFD10 ‐0.18 ‐0.16 ‐0.18 ‐0.19ID00 ‐0.20 ‐0.19 ‐0.20 ‐0.21ID10 ‐0 18 ‐0 16 ‐0 17 ‐0 19ID10 0.18 0.16 0.17 0.19ND00 ‐0.21 ‐0.20 ‐0.20 ‐0.21ND10 ‐0.18 ‐0.17 ‐0.18 ‐0.19
9
Transformation
Square root
Did not help with the normalityDid not help with the normality
Log 10
Induced the normality considerably
10
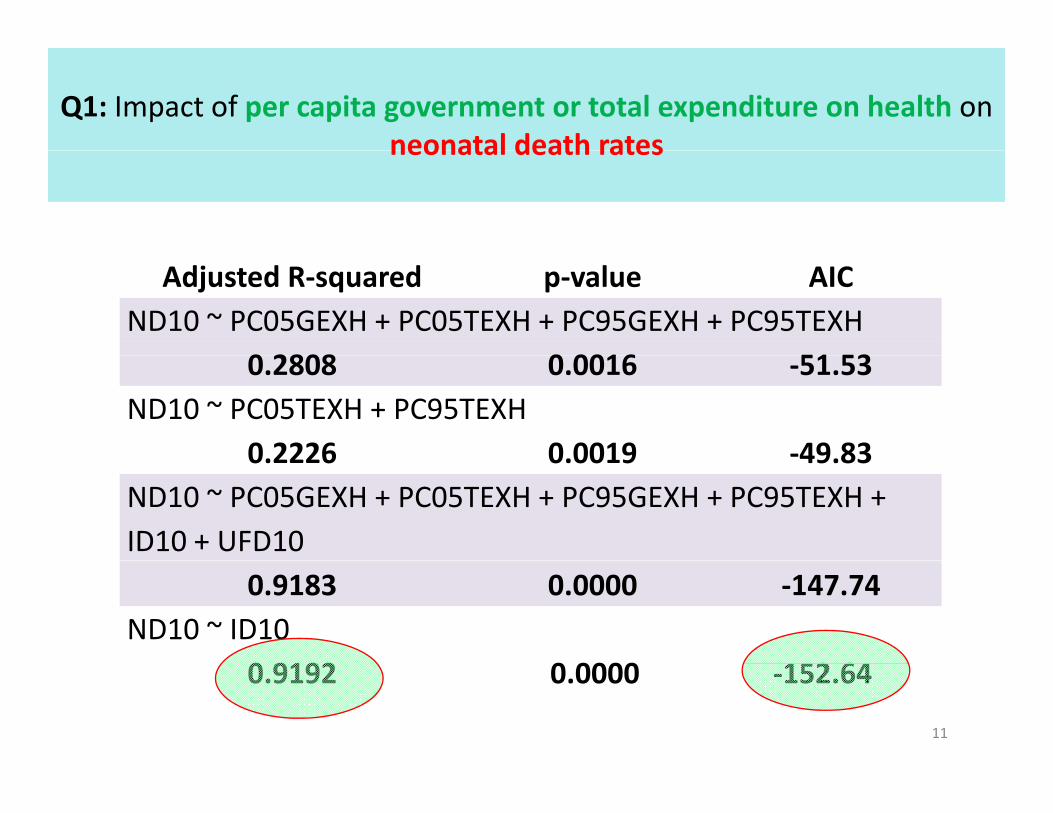
Q1: Impact of per capita government or total expenditure on health on neonatal death ratesneonatal death rates
Adjusted R‐squared p‐value AICND10 ~ PC05GEXH + PC05TEXH + PC95GEXH + PC95TEXH
0 2808 0 0016 51 530.2808 0.0016 ‐51.53ND10 ~ PC05TEXH + PC95TEXH
0 2226 0 0019 ‐49 830.2226 0.0019 49.83ND10 ~ PC05GEXH + PC05TEXH + PC95GEXH + PC95TEXH + ID10 + UFD10
0.9183 0.0000 ‐147.74ND10 ~ ID10
0 9192 0 0000 152 640.9192 0.0000 ‐152.64
11
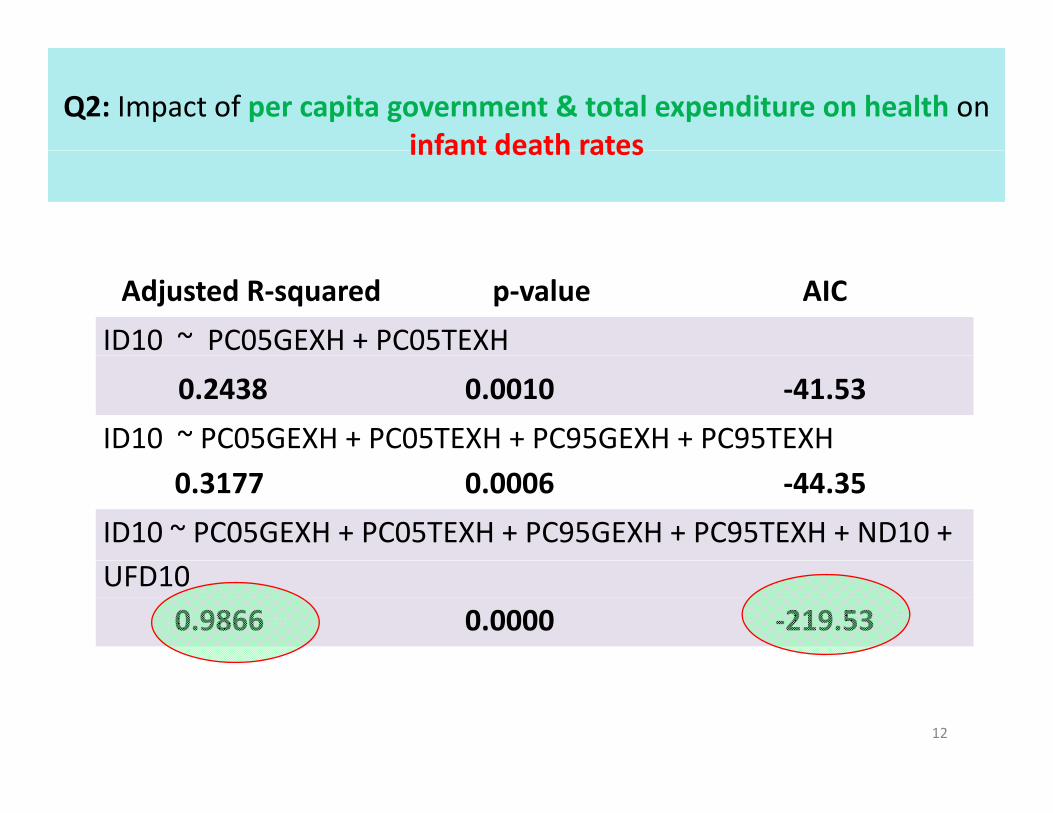
Q2: Impact of per capita government & total expenditure on health on infant death ratesinfant death rates
Adjusted R‐squared p‐value AIC
ID10 ~ PC05GEXH + PC05TEXH
0.2438 0.0010 ‐41.53
ID10 ~ PC05GEXH + PC05TEXH + PC95GEXH + PC95TEXH0.3177 0.0006 ‐44.35
ID10 ~ PC05GEXH + PC05TEXH + PC95GEXH + PC95TEXH + ND10 + UFD10
0.9866 0.0000 ‐219.53
12
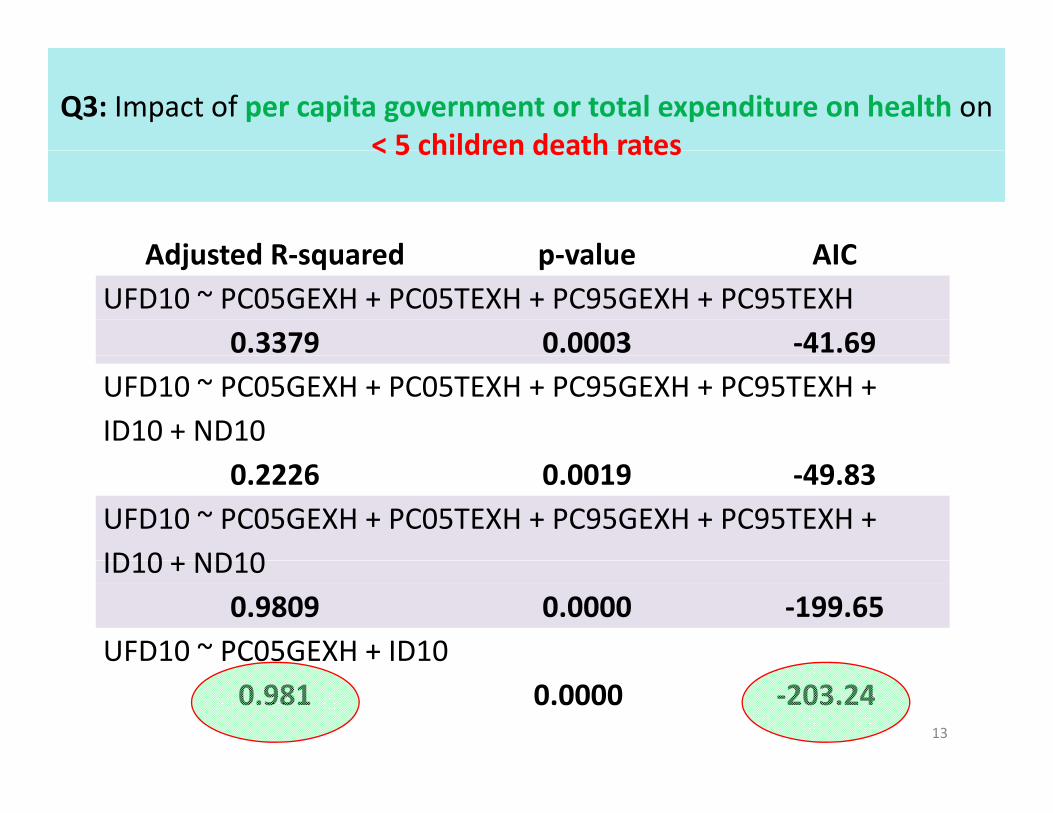
Q3: Impact of per capita government or total expenditure on health on < 5 children death rates< 5 children death rates
Adjusted R squared p value AICAdjusted R‐squared p‐value AICUFD10 ~ PC05GEXH + PC05TEXH + PC95GEXH + PC95TEXH
0.3379 0.0003 ‐41.69UFD10 ~ PC05GEXH + PC05TEXH + PC95GEXH + PC95TEXH + ID10 + ND10
0.2226 0.0019 ‐49.83UFD10 ~ PC05GEXH + PC05TEXH + PC95GEXH + PC95TEXH + ID10 + ND10ID10 + ND10
0.9809 0.0000 ‐199.65UFD10 ~ PC05GEXH + ID10
0.981 0.0000 ‐203.2413
Quality of fit of the models
Assumptions
Normality of error termsy
Constant variance of residuals vs. fitted values
Independence of error termsIndependence of error terms
Influential observations
14
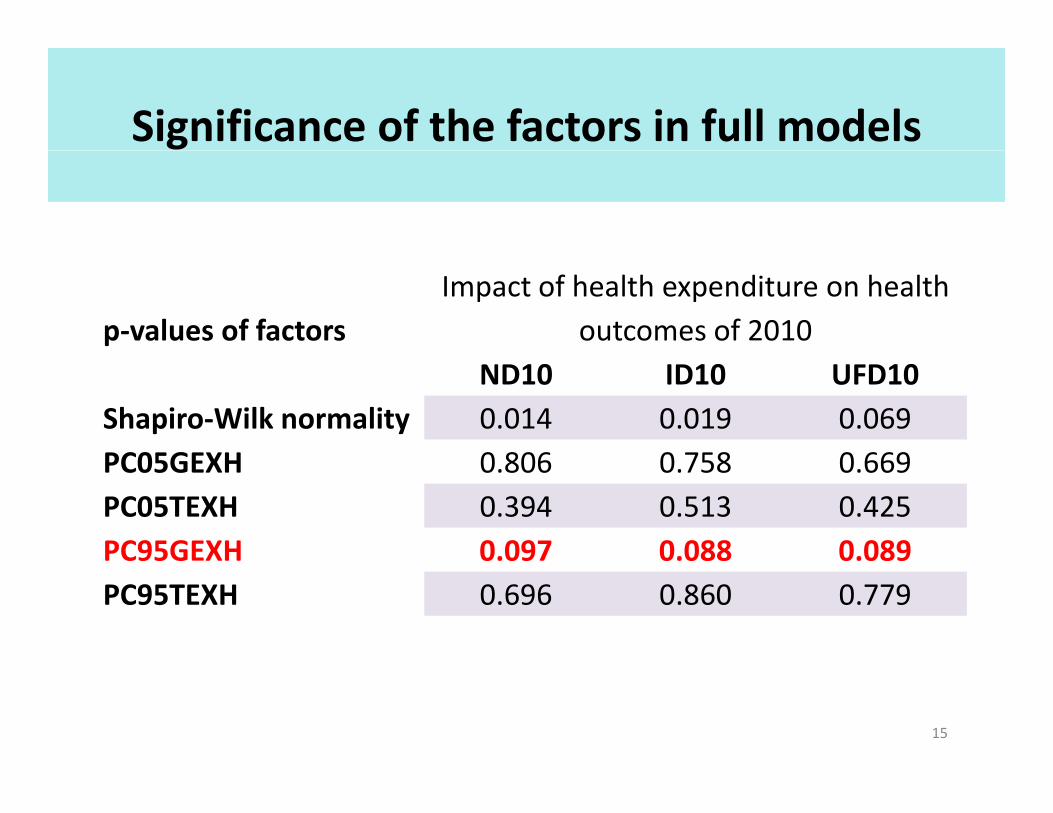
Significance of the factors in full models
p‐values of factorsImpact of health expenditure on health
outcomes of 2010ND10 ID10 UFD10
Shapiro‐Wilk normality 0.014 0.019 0.069PC05GEXH 0 806 0 758 0 669PC05GEXH 0.806 0.758 0.669PC05TEXH 0.394 0.513 0.425PC95GEXH 0.097 0.088 0.089PC95GEXH 0.097 0.088 0.089PC95TEXH 0.696 0.860 0.779
15
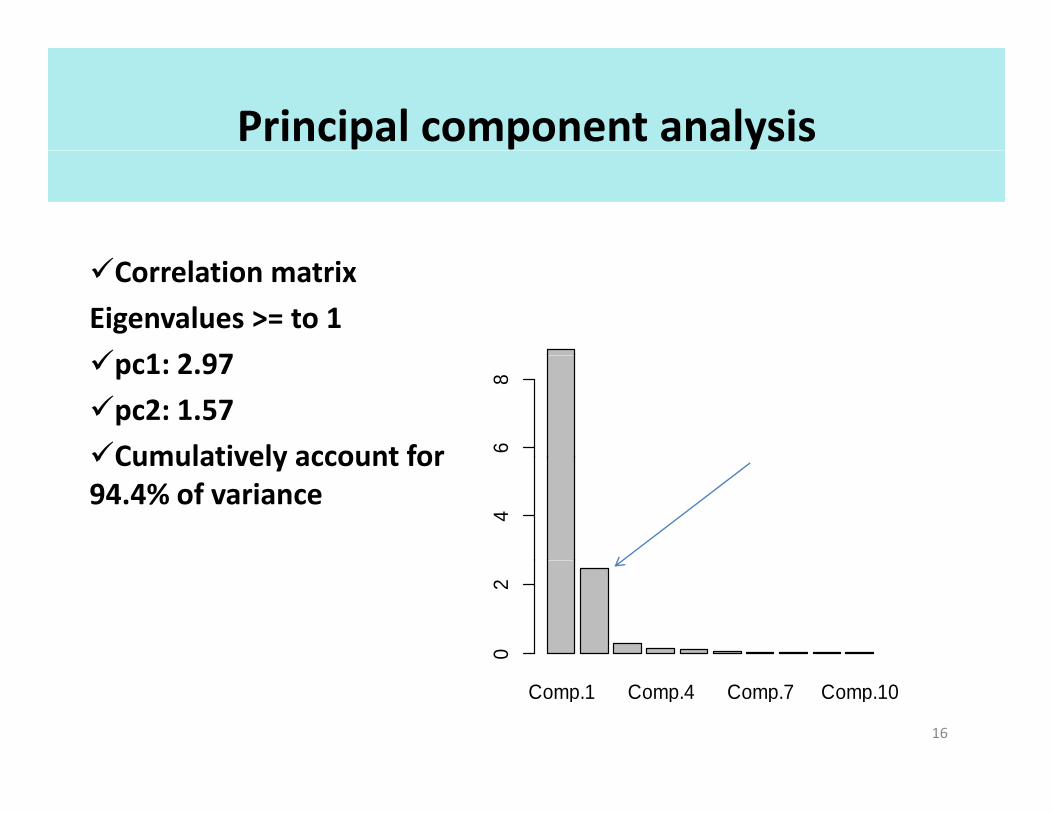
Principal component analysis
Correlation matrix
Eigenvalues >= to 1
1 2 97pc1: 2.97
pc2: 1.57
Cumulatively account for 68
Cumulatively account for 94.4% of variance
40
2
16
Comp.1 Comp.4 Comp.7 Comp.10
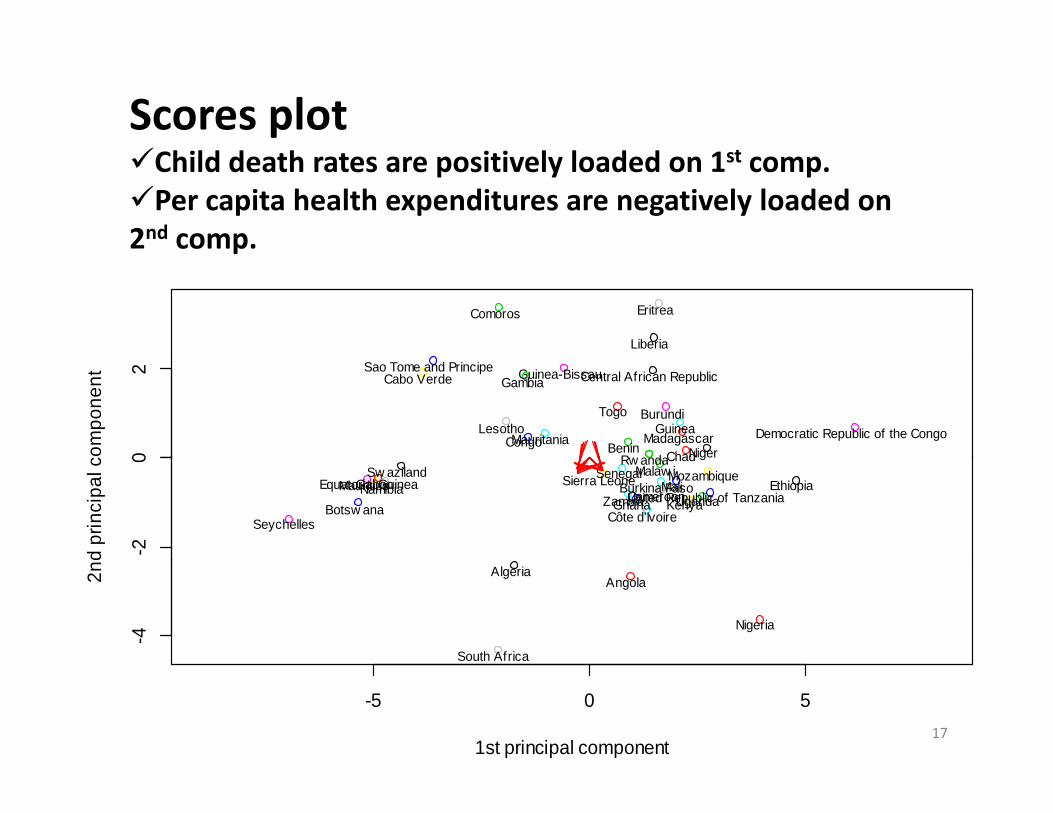
Scores plot h ld d h l l d d tChild death rates are positively loaded on 1st comp.
Per capita health expenditures are negatively loaded on 2nd comp.
Comoros Eritrea
Liberia
p
02
com
pone
nt
Benin
Burundi
Cabo Verde Central African Republic
ChadCongo Democratic Republic of the Congo
Gambia
Guinea
Guinea-Bissau
LesothoMadagascarMauritania
NigerRw anda
Sao Tome and Principe
Togo
-20
d pr
inci
pal c
Botsw anaBurkina FasoCameroon
Chad
Côte d'Ivoire
Equatorial Guinea EthiopiaGabonGhana Kenya
Malaw iMaliMauritiusMozambique
Namibia
gRw andaSenegal
Seychelles
Sierra LeoneSw aziland
UgandaUnited Republic of TanzaniaZambia
-4
2n AlgeriaAngola
Nigeria
South Africa
17
-5 0 5
1st principal component
Summary
Health expenditures have statistically relatively low but significant effect on infant, neonatal and under‐five mortality in AfricaAfrica
Health expenditure only one of the many factors important in improving the health status of a member
per capita health spending & health outcomes negatively correlated
18
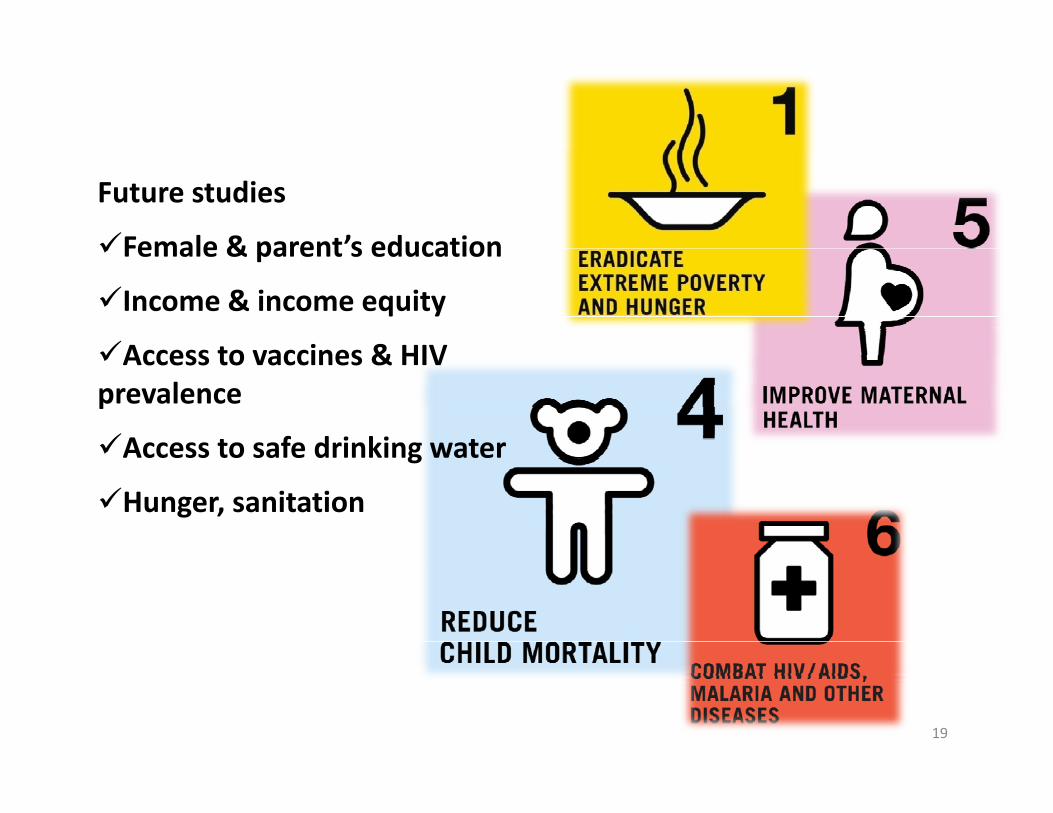
Future studies
Female & parent’s educationFemale & parent s education
Income & income equity
Access to vaccines & HIVAccess to vaccines & HIV prevalence
Access to safe drinking waterg
Hunger, sanitation
19

Thank youThank you.
20