Embed Size (px)
Citation preview

April 2015This publication was produced for review by the United States Agency for International Development.
It was prepared by Elaine Baruwa, Sophie Faye, Christian Yao and Waldo Beausejour for the Health Finance andGovernance Project.
HÔPITAL UNIVERSITAIRE DE MIREBALAIS(HUM) COSTING STUDY

The Health Finance and Governance ProjectUSAID’s Health Finance and Governance (HFG) project will improve health in developing countries by expandingpeople’s access to health care. Led by Abt Associates, the project team will work with partner countries toincrease their domestic resources for health, manage those precious resources more effectively, and make wisepurchasing decisions. As a result, this five-year, $209 million global project will increase the use of both primaryand priority health services, including HIV/AIDS, tuberculosis, malaria, and reproductive health services. Designedto fundamentally strengthen health systems, HFG will support countries as they navigate the economic transitionsneeded to achieve universal health care.
DATE 2013
Cooperative Agreement No: AID-OAA-A-12-00080
Submitted to: Scott Stewart, AOROffice of Health SystemsBureau for Global Health
Recommended Citation: Baruwa Elaine, Faye Sophie, Yao Christian and Beausejour Waldo. April 2015.Hôpital Universitaire de Mirebalais (HUM) Costing Study. Bethesda, MD: Health Finance & Governance Project, AbtAssociates Inc.
Abt Associates Inc. | 4550 Montgomery Avenue, Suite 800 North | Bethesda, Maryland 20814T: 301.347.5000 | F: 301.652.3916 | www.abtassociates.com
Broad Branch Associates | Development Alternatives Inc. (DAI) | Futures Institute| Johns Hopkins Bloomberg School of Public Health (JHSPH) | Results for Development Institute (R4D)| RTI International | Training Resources Group, Inc. (TRG)

HÔPITAL UNIVERSITAIRE DE MIREBALAIS(HUM) COSTING STUDY
DISCLAIMER
The author’s views expressed in this publication do not necessarily reflect the views of the United States Agency
for International Development (USAID) or the United States Government.


i
CONTENTS
Contents ...............................................................................................................i
Acronyms............................................................................................................iii
Acknowledgments...............................................................................................v
Executive Summary ..........................................................................................vii
1. Background ...........................................................................................1
1.1 Haiti .........................................................................................................................................11.2 HUM........................................................................................................................................1
2. Objectives..............................................................................................3
2.1 Objectives ..............................................................................................................................32.2 Rationale.................................................................................................................................3
3. Methodology..........................................................................................5
4. Findings..................................................................................................7
4.1 Total costs .............................................................................................................................74.2 Key intermediate cost centers.......................................................................................114.3 Final medical services cost structure ...........................................................................124.4 Final medical services cost per output.........................................................................14
5. Discussion ............................................................................................17
Annex A: Total expenditures by line item.......................................................21
Annex B: Cost allocation process.....................................................................25
Annex C: Step down allocation assumptions...................................................27
Annex D: Step down allocation results ............................................................29
List of TablesTable 1: Hospital total costs for 2014 in US$................................................................................ 7Table 2: Pharmaceutical and medical supply costs by cost center in US$ ............................. 9Table 3: Equipment total value by cost center in US$...............................................................10Table 4: Unit cost for intermediate cost centers ........................................................................12Table 6: Cost allocations by input for final medical cost centers, inpatients.......................14Table 7: Outpatient unit costs by final cost centers...................................................................15Table 8: Inpatient Unit costs by final cost centers ......................................................................16Table 9: Total expenditures provided for December 2013 in US$ .......................................23Table 10: Step down allocation assumptions................................................................................27Table 11: Administrative and Logistical Cost Allocation...........................................................30Table 12: Intermediate Medical Services Cost Allocation ........................................................30Table 13: Final Medical Services Cost Allocation ........................................................................31Table 14: Total Direct and Indirect Cost Allocation..................................................................31Table 15: Administrative and logistical cost allocations to intermediate and final costcenters.....................................................................................................................................................32Table 16: Full costs by final medical cost center .........................................................................33

List of Figures
Figure 2: Cost allocation process....................................................................................................... 6Figure 3: Breakdown of total costs by Direct/Indirect ................................................................ 8Figure 4: Breakdown of direct costs ................................................................................................. 8Figure 5: Breakdown of payroll costs ............................................................................................... 9Figure 6: Breakdown of costs for intermediate cost centers ..................................................11Figure 7: Summary cost structure for inpatient and outpatient care ...................................13

iii
ACRONYMS
GOH Government of Haiti
HUM Hôpital Universitaire de Mirebalais
MASH Management Accounting System for Hospitals
MSPP Ministère de la Santé Publique et de la Population (Ministry of Health)
OAVCT Office Assurance Véhicule Contre Tiers (Third Party Vehicle Insurance)
OFATMA Office d'Assurance Accidents du Travail, Maladie et Maternité (Worker’sCompensation)
OR Operating Room
USAID United States Agency for International Development


v
ACKNOWLEDGMENTS
The authors would like to thank the busy administrative and clinical staff of the Hôpital Universitaire deMirebalais for their time and effort including but not limited to Gabou Mendy, Franciscka Lucien, BryanMundy, Maxi Raymonville, Brittany Eddy and her team, and Militza Michel.
We would also like to thank Marie Jeanne Offosse, Ben Johns, Michele Abbott, Heather Cogswell, YannDerriennic and Stephen Musau of USAID’s Health Finance and Governance Project for their technicalreview and overall support.
Finally we would like to acknowledge the support from USAID Haiti without which this work would nothave been possible.


vii
EXECUTIVE SUMMARY
The Health Finance and Governance Project (HFG), funded by the United States Agency forInternational Development (USAID), was asked by USAID Haiti to work with Partners in Health and itssister organization in Haiti, Zanmi Lasante, (PIH/ZL) to conduct a costing study of the recently openedHôpital Universitaire de Mirebalais (HUM). The objective of the study is to provide data and informationthat will support the development of a financial sustainability plan for HUM.
BackgroundHUM was built by the combined efforts of the Ministry of Public Health and the Population (MSPP) andPIH/ZL. Many donors contributed financially to the completion of this hospital complex, with acombined investment estimated to be more than US$23 million. The newly opened hospital wascompleted in response to an urgent request from the MSPP in the aftermath of the 2010 earthquake,which destroyed several key elements of Haiti’s infrastructure for basic health and education, such asthe Hospital of the National University of Haiti (HUEH) in Port au Prince.
Locating HUM in Mirebalais, in Haiti’s Central department,1 addresses an acute need in an area wherethe population’s health status and access to care are poor. The hospital was intended to play a majorrole in fulfilling the MSSP's strategic plan to ensure the decentralized offering of high-quality care in Haiti.Therefore, its mission and structure differ from that of other hospitals: HUM provides primary careto185, 000 inhabitants in Mirebalais, Savanette and Saut-d'Eau and secondary care to 451,000 inhabitantsfrom communes extending from most of Central Plateau, lower-Artibonite and upper-Ouest. Tertiarycare upon referral is offered to patients from a broader population of approximately 3.3 millioninhabitants, covering the entire center of Haiti including the suburbs of Port-au-Prince. Furthermore,beyond an initial registration fee of 50 HTG2 (US$1.1), services are provided free. However, the realityis that the post-earthquake level of funding available for health has peaked and the hospital needs tounderstand its cost structure in order to increase the efficiency with which it uses its resources and inorder to design an effective strategy for financing the hospital in the long term.
Objectives and RationaleThe primary objective of this analysis is to analyze HUM’s cost structure and to estimate unit costs inorder to inform the development of the hospital’s budgeting, management, and planning systems; this iscritical as HUM moves strategically towards a long-term financing strategy aligned with national healthfinancing priorities to ensure the long-term viability of the HUM model in Haiti's public health sector.
1 One of Haiti’s’ 10 geo-political regions2 1US$=42HTG

System Question Relevance to Sustainability
Budgeting To what extent, financially, is the hospital’s
current cost structure fully accounted for inits budget planning?
What specific areas of expenditures maycurrently be off-budget and what level ofexpenditure does this account for?
Having these cost structure data allows HUMto increase the accuracy of its future budgetsto ensure that it has accurate estimates of itsfuture funding needs.
Management How does resource use change over time; is
the facility realizing economies of scale as itincreases its level of service delivery?
How does resource use compare with otherfacilities (where data are available)?
Do the current information systems providethe data required to track efficiency?
Having accurately measured and consistentlytracked indicators of efficiency and thesystems to produce these measures is criticalfor implementing sound management of theresources available to the facility anddemonstrating this efficiency to funders.
Planning Given their current cost structure and
recent service delivery levels, whichdepartments/services are anticipated to haveunit cost structures that may be appropriatefor cross-subsidization to support a revenuegeneration strategy without posing access tocare barriers to its focal indigent population?
Having an understanding of cost structureallows HUM to determine: Revenue generation opportunities Cross-subsidization opportunities
Having an understanding of cost structureinforms HUM’s response to increasinglysophisticated health service purchasingmechanisms like:
Results-based financing contracting Health insurance schemes
MethodologyThis study uses a tool for costing hospital services called the Management Accounting System forHospitals (MASH), developed by the USAID Partners for Health Reformplus project in 2004. MASH usesa top-down approach for allocating costs, with the intent that all hospital costs should be assigned to thedepartments (also called cost centers) that provide “final” services to patients, either as inpatients oroutpatients. A cost center is the smallest hospital unit that provides one kind of service, where costs areaccumulated or assigned. Through discussions with hospital staff and administrators, cost centers weredefined in a way that would be useful to managers and other final users and would reflect both howdepartments are organized and how hospital data are stored. Overhead cost centers include alladministrative services and physical building costs. Intermediate cost centers include diagnostic servicesas well as pharmacy and mortuary services. The final medical services cost centers include outpatient,emergency, and inpatient services, by ward. These medical services serve as cost centers for purposes ofestimating unit costs that include the distributed overhead and intermediate services costs. The analysisprovides an estimate of the cost of an inpatient bed-day and the cost of an outpatient visit.
ix
FindingsYearly operating costs at HUM were estimated to be US$15, 267,208 (Table ES-1). This includes thevalue of all resources used, not just those included in the budget.
Table ES-1: Hospital Total Costs, 2014
All Costs US$ %
Labor costs $ 7,501,112 49.1%
Pharmaceuticals and medicalsupplies
$ 1,691,797 11.1%
Depreciation of equipment $ 857,290 5.6%
Direct costs $ 10,050,198 65.8%
Indirect costs $ 5,217,010 34.2%
Total costs $ 15,267,208 100%
Approximately 66 percent of HUM’s expenses can be allocated directly to cost centers. This level ofdirect costs provides confidence in the cost estimation for all hospital’s cost centers because fewercosts (indirect costs) needed to be allocated. Labor accounts for about 49 percent of total costs,pharmaceutical drugs and medical supplies for 11 percent and 6 percent are attributed to depreciationof equipment. The relatively high proportion of costs accounted for by drugs medical supplies revealsthe use of sophisticated equipment at HUM that typically requires relatively sophisticated medicalsupplies reflecting the integration of new technologies and innovations at HUM that align with its tertiaryhealth care service delivery objectives.
Labor
Labor is the major cost driver: wages and salaries were the largest proportion of total costs and this isreflective of staffing models specific to tertiary care facilities where clinical specialists are directproviders of health services to treat and diagnose common to complex illness. As a major cost driverlabor cost controls or efficiency measures targeted at personnel costs will be important to consider forthe future. However, the hospital management is limited in its ability to influence personnel costs at thecurrent time because the hospital is in an expansion phase; many positions are still being filled, includingsome other specialist doctors; therefore, labor costs are likely to rise. PIH, Boston pays the salaries of afew staff that are complement to the locally trained team in specialties where there’s an additionalcapacity need. However, the hospital itself covers nearly 71 percent of payroll.
Pharmaceuticals and Medical Supplies
Pharmaceuticals and medical supplies account for a high proportion of direct costs (US$ $1,691,797),reflecting the availability and use of sophisticated laboratory and diagnostic equipment as well as the highthroughput of the intermediate centers: pharmacy, operating room, radiology, and laboratorydepartments.

Depreciation
HUM benefits from relatively new and highly sophisticated diagnostic equipment necessitating highdepreciation costs (US$ 2,093,757 per year). If total3 depreciation were excluded, the yearly operatingcosts would be US$ $13,173,451.4
Indirect costs
A total of $5,217,010 of indirect costs per year is estimated as the cost of resources that are usedacross cost centers. The largest of these costs are the depreciation of buildings, vehicles and energysystems ($1,236,467). Energy is also a substantial indirect ($908,767). Other line items include officesupplies, other staff expenses, transport, communications and other functioning costs.
Key Intermediate Cost Centers
The availability and use of key intermediate medical services are critical to the high-quality care thatHUM aims to deliver. These centers have high costs and most have high throughput. The operatingrooms account for $1,424,491 a year; they conduct 2,998 surgeries at an average of $475 per procedureand there is wide variation in the types of surgery performed. The laboratory at HUM is prolific with330, 476 tests per year at approximately $2 per test, but there is wide variation in actual unit costs duethe wide range of tests conducted. Finally, the radiology unit accounts for $671,914 per year andconducts 26,616 exams at an average cost of $25 per exam though specific unit costs vary, as unitoutputs range from basic X-rays to MRI scans.
Final Medical Service Cost Centers
Final medical service unit cost results should be interpreted with a lot of caution: their calculation is verysensitive to hospital activity. Furthermore, while it is tempting to think of cost data as indicative of whatfee structures might look like, getting from cost to fee is a process that involves other critical variablessuch as the projected and feasible service delivery growth, population demographics/epidemiology,demand for services, policy priorities, equity, and revenue opportunities. That being said, the full cost,outpatient visit numbers, and cost per output do indicate opportunities that should be explored furtheras HUM carries out its strategic plan.
3 Total depreciation would include depreciation of medical equipment (direct cost, $857,290) as well as vehicles, buildingand energy systems (indirect costs, $1,236,467)4 HUM administration requested that the study team assume five years of useful life for medical equipment, which may beoverly conservative and certainly leads to high depreciation costs estimates.

xi
Table ES-2: Outpatient Unit Costs by Final Cost Centers
Final Cost Centers Full Cost Number of OutpatientVisits
Cost per OutpatientVisit
Outpatient General $1,321,275 78,007 $17
Outpatient Dental clinic $488,175 10,102 $48
Outpatient Community health $775,163 1,9955 $389
Outpatient women health $982,207 17,771 $55
Outpatient Pediatrics $263,032 12,115 $22
Outpatient Mental health $66,235 1,738 $38
Outpatient Oncology $867,227 6,553 $132
Rehabilitation/Physiotherapy $469,408 1,0336 $454
Accident & Emergency7 $2,041,063 14,629 $140
Labor and Delivery $1,410,267 3,0828 $458
Table ES-3: Inpatient Unit Costs by Final Cost Centers
Final Cost Centers Full Cost Number ofInpatient
Days
Cost perInpatient Day
BedOccupancy
Rate
AverageLength of
Stay (days)
Inpatient pediatrics $ 879,608 10256 $86 75% 11.2
Inpatient medical ward $ 1,667,872 12368 $135 72% 27.4
Inpatient surgical ward $ 2,164,147 13972 $155 118% 16.6
Inpatient NICU $ 791,242 4219 $188 65% 11.0
Inpatient isolation ward $ 218,081 2787 $78 70% 30.0
Inpatient antepartumward $ 364,088 2636 $138 61% 7.4
Inpatient postpartumward $ 498,118 12010 $41 167% 8.5
5 This department do a lot of education work (81806 individuals counselled) and immunizations (27982 patients). In this unit cost we only
accounted for the 1995 nutritional visits that were done, hence the expensive unit cost6 This is a new service that was built in 2014 and the activity is not yet important hence an expensive unit cost.7 Emergency department did not have disaggregated data to distinguish between A&E inpatient and A&E outpatient, hence no data oninpatient days.8 This represent the number of deliveries both normal deliveries and C-sections.

DiscussionBased upon these findings, the following key recommendations are offered to support the hospitaladministration’s efforts to move strategically toward being financially sustainable.
Budgeting
Accurate and realistic budgets that align with HUM’s mission and strategic plan are critical.
To what extent, financially, is the hospital’s current cost structure fully accounted for in its budget planning?
As this was the first complete year of HUM’s operation, budgets provided to the study team weretheoretical; for example, some line items were budgeted to be the same every month. Obviously, thiswill not be the case in practice as generally speaking, one would expect health service utilization tendsto have some seasonality and therefore operating expenses would be expected to fluctuate from monthto month. As more HUM expenditure and service delivery data become available, it will be possible tobudget more accurately using the MASH.
What specific areas of expenditures may currently be off-budget and what level of expenditure does this accountfor?
Pharmaceuticals and medical supplies are a major cost driver but full information on their unit costs wasnot available at the time of data collection. The study team, in preparing the MASH template, hasidentified nearly all of these unit costs so that in future HUM will be able to accurately account for thisresource use. Furthermore, HUM needs to distinguish between donated and purchased resources.Donated resources should be fully accounted for so that accurate resource needs and utilization arecaptured. Given HUM’s commitment to it its indigent population, fundraising will be a necessary part ofits financial strategy. Being able to accurately quantify what resources HUM needs will be helpful as itapproaches different donors who may have different priorities for funding or wish to make in-kindcontributions, for example, pharmaceuticals vs. equipment vs. fuel or other resources.
Depreciation/capital costs were also found to be a major cost driver. Budgets must account for thesecosts to ensure that maintenance and replacement funding is set aside. If charging for sophisticatedradiological services is part of a revenue generation strategy, then maintaining and replacing the requiredequipment is critical.
Management
Accurately measuring and consistently tracking efficiency indicators as well as having the systems toproduce these measures is critical for implementing sound management of the resources available to thefacility and demonstrating this to funders.
How does resource use change over time; is the facility realizing economies of scale as it increases its level ofservice delivery?
All of the average unit costs presented in this analysis are subject to change because HUM is still goingthrough its initial start-up phase and service delivery levels and expenditures are yet to stabilize. Oncethese variables have stabilized, HUM will need to go through a review phase to see how it might allocateits resources more efficiently. This study’s modelling of its cost structure will assist HUM in this process.This analysis includes the types of measures that, if monitored over time, can provide information onwhere economies of scale are being realized because unit costs should be decreasing, at least in themedium term. However, it is important to point out that the unit cost estimation should be furtherrefined to be more specific to the types of services (for example, the types of tests) as well as the typesof patients who receive services from a cost center that delivers services to both internal and externalpatients. For example, it will be important to be able to differentiate between types and numbers of

xiii
laboratory services used by patients receiving medical care from HUM versus laboratory services usedby referral patients not seen by HUM clinical staff.
How does resource use compare with other facilities (where data are available)?
Currently, the study team is not aware of similar costs data being available for other tertiary-levelfacilities in Haiti. This makes cost comparisons impossible. However, as noted previously, primary healthcare services are an important output of HUM and these cost data for Haiti are available forcomparison. Such comparisons would probably be of interest to MSPP as it explores options forproviding primary care as efficiently as possible.
Primary care at HUM as a national referral and teaching hospital was integral to the phasing approach toopening services at the hospital. HUM’s mandate included ensuring access to community-linked primarycare services for the currently underserved target catchment area for primary care services. During thesecond phase of operations at HUM there will be a transition of primary care services to the formerCDI location, reinforcing an integrated system for primary care management and referral for secondaryand tertiary level care at HUM. Therefore in terms of cost comparison data, the transition of primarycare services to the CDI location and resulting costs of care would represent the most/a more accuratemeasure for costs of primary services through HUM in the long term.
Do the current information systems provide the data required to track efficiency?
HUM has several sophisticated information management systems. Therefore, it should not be difficult forit to ensure that the appropriate data are available in order to provide more specific unit cost estimatesfor the future. For example:
For future revenue generation purposes, it will be important for systems to be able todifferentiate between indigent and non-indigent populations receiving care to ensure thatindigent populations remain able to access care free of charge and that this care is adequatelybudgeted while non-indigents are charged appropriately. This distinction is key to effectiverevenue generation policies that align with HUM's mission of commitment to its localpopulations.
Several units within the hospital will need to be able to aggregate and disaggregate services moreaccurately. Examples of this are L&D, where service delivery data are reported by the numberof uniquely identified patients rather than the number of services, the latter of which makes itimpossible to determine when a single patient uses the service more than once and the truenumber of visits. Similarly, several inpatient units currently have occupancy rates of more than100 percent because the utilization data are rounded up to whole bed days and don't capturesituations such as day surgery recovery, or others in which more than one patient occupies abed in one day.
The ability to accurately determine unit costs will become even more critical as financing strategies forHUM are developed and revenue is collected from out-of-pocket fees, insurance companies, andgovernment contracting.
Planning
HUM recognizes the need to move toward a sustainable financial position.
Given their current cost structures and recent service delivery levels, which departments/services are anticipatedto have unit cost structures that may be appropriate for cross-subsidization to support a revenue generationstrategy without posing access to care barriers to its focal indigent population?
Revenue generation opportunities: This analysis identified some of the major opportunities for revenuegeneration that HUM has at hand, including the use of its laboratory, operating room, and radiologyfacilities. Given the cost of the equipment being used, it will be important for HUM to market thesefacilities and use them to their maximum capacity. In addition, given that providing medical education is

part of its mission, these facilities might enable HUM to provide (tuition fee supported) education tonon-Haitian medical trainees from the Caribbean.
Cross-subsidization opportunities: Although HUM is still in its start-up phase, it already serves patientsfrom a wide variety of socioeconomic groups, so it is reasonable to plan for some cross-subsidizationbetween those who are able to pay for services and those who are unable to pay. Examples of servicesin this group might be radiology, physiotherapy, and surgical services; their costs are too high to expectindigent populations to pay out of pocket, but wealthier patients may want to take advantage of HUM'ssophisticated, high-quality facilities and can pay to do so. Similarly, low-cost services may be marked upand priced to cross-subsidize more expensive services.
Results-based financing (RBF) contracting: Haiti is currently witnessing the implementation of at leastone RBF pilot scheme to support the provision of maternal and neonatal child health. Given HUM'scommitment to providing primary health care, it may be possible for the hospital to participate in theRBF schemes. Understanding the resources required to provide the significant amount of primary healthcare delivered by HUM would be important for setting contract prices (particularly if RBF payments arelower than HUM costs.)
Formal health insurance schemes: Although private insurance coverage is very low in Haiti (1 percent9) itis highest in the Port-au-Prince region geographically close to HUM. Therefore, understanding its coststructure allows HUM to potentially contract with formal insurance schemes. These schemes includethe state-run Office d'Assurance Accidents du Travail; Maladie et Maternité (OFATMA), a provider ofworker’s compensation program; the Office Assurance Véhicule Contre Tiers (OAVCT), a state-runprovider of third party vehicle insurance; and private insurance companies.
HUM is an exciting opportunity to establish a level of quality care in Haiti comparable to that of muchwealthier countries for a population that has previously experienced insurmountable barriers to evenbasic care. Ensuring that the facility has the resources it needs to continue to deliver this care is animportant responsibility that will require the involvement of many stakeholders. By understanding itscost structure and being able to discuss its resource needs in evidence-based terms, the administrationof HUM will be able to clearly and accurately estimate and express these needs to the many potentialstakeholders who are increasingly seeking value for money for their contributions, and to take advantageof the more sophisticated health financing contracting opportunities that are being explored by theGovernment of Haiti.
9 Preliminary Living Standards Measurement Survey data, personal communication

1
1. BACKGROUND
USAID’s Health Finance and Governance Project (HFG) was asked by USAID Haiti to work with ZanmiLasante/Partners in Health (ZL/PIH) to conduct a costing study of the recently opened HôpitalUniversitaire de Mirebalais.
1.1 HaitiThe Republic of Haiti occupies the western portion of the island of Hispaniola in the Caribbean with apopulation of approximately 10 million people 44% of which are under 18 years of age. The HumanDevelopment Index ranks Haiti at the 161st position placing10 it in the lowest fifth of that table andreflecting its weak economy. Total Health Expenditure for the period 2011-2012 is estimated at 32.4billion Haitian Gourdes (HTG) or US$771 million11. Health spending per capita over this period isapproximately US$75.9 which is above average for a low income country. However, the country’s healthexpenditure is largely made up of foreign aid which accounted for 53% (bilateral and multilateral donors)of total health expenditure over 2011-2012 and this poses future challenges for all levels of servicedelivery but particularly the hospital level. Over the same period, total hospital expenditure wasestimated to be HTG 8.59 billion (US$200 million) but direct foreign transfers account for 76% of thatexpenditure by source of revenue and government accounts for less than 4%.
1.2 HUMThe Hôpital Universitaire de Mirebalais (HUM) was built by the combined efforts of the Ministry of PublicHealth and the Population (MSPP), and Partners in Health with its sister organization in Haiti, ZanmiLasante (PIH/ZL). Many donors contributed to the completion of this hospital complex, with anestimated investment of over US $23 million. The locating of HUM in Mirebalais in the departmentCentral12 (about 50 Km from Port au Prince) addresses an acute need in area where the population’shealth status and access to care are poor. This project was completed in response to an urgent requestfrom the MSPP, in the aftermath of the 2010 earthquake that destroyed several key elements of theinfrastructure for basic health and education, such as the Hospital of the National University of Haiti(HUEH) in Port au Prince.
HUM provides primary care to185, 000 inhabitants in Mirebalais, Savanette and Saut-d'Eau andsecondary care to 451,000 inhabitants from communes extending from most of Central Plateau, lower-Artibonite and upper-Ouest. Tertiary care referral is offered to patients from a broader population ofapproximately 3.3 million inhabitants, covering the entire center of Haiti including the suburbs of Port-au-Prince. HUM also delivers medical education to nurses, medical students as well resident physicians.The hospital was built and equipped to meet the demands for quality care for all users, thus playing amajor role in the MSSP's strategic plan to assure the decentralized offering of high quality care in Haiti.
10 Human Development Report 2013, http://hdr.undp.org/en/2013-report11 Haiti National Health Accounts, 2011/12, forthcoming.12 One of Haiti’s’ 10 geo-political regions

As a result of its broad mission, the hospital is unique in that it provides basic primary health careservices as well as high end radiology, surgical and medical services such as MRI scans and oncology.Furthermore, beyond an initial registration fee of 50HTG (US$1.10) services are provided free.However, the reality is that post-earthquake swell of funding available for health has peaked and thehospital needs to understand its cost structure in order to increase the efficiency with which it uses itsavailable resources as well as to design an effective strategy for financing the hospital in the long term.

3
2. OBJECTIVES
2.1 ObjectivesThe primary objectives of the analysis are to estimate and analyze the cost structure of the newlyopened hospital with a view to informing budgeting, planning, and management efforts as the hospitalmoves strategically towards a long-term financing strategy. This strategy should align with national healthfinancing priorities to ensure the long-term viability of the HUM model in Haiti's public health sector.
2.2 RationaleA costing analysis can provide answers to specific questions within each of these three areas that arerelated to long term sustainability.
System Question Relevance to Sustainability
Budgeting To what extent, financially, is the hospital’s
current cost structure fully accounted for inits budget planning?
What specific areas of expenditures maycurrently be off-budget and what level ofexpenditure does this account for?
Having these cost structure data allows HUMto increase the accuracy of its future budgetsto ensure that it has accurate estimates of itsfuture funding needs.
Management How does resource use change over time; is
the facility realizing economies of scale as itincreases its level of service delivery?
How does resource use compare with otherfacilities (where data are available)?
Do the current information systems providethe data required to track efficiency?
Having accurately measured and consistentlytracked indicators of efficiency and thesystems to produce these measures is criticalfor implementing sound management of theresources available to the facility anddemonstrating this efficiency to funders.
Planning Given their current cost structure and
recent service delivery levels, whichdepartments/services are anticipated to haveunit cost structures that may be appropriatefor cross-subsidization to support a revenuegeneration strategy without posing access tocare barriers to its focal indigent population?
Having an understanding of cost structureallows HUM to determine: Revenue generation opportunities Cross-subsidization opportunities
Having an understanding of cost structureinforms HUM’s response to increasinglysophisticated health service purchasingmechanisms like: Results-based financing contracting Health insurance schemes

5
3. METHODOLOGY
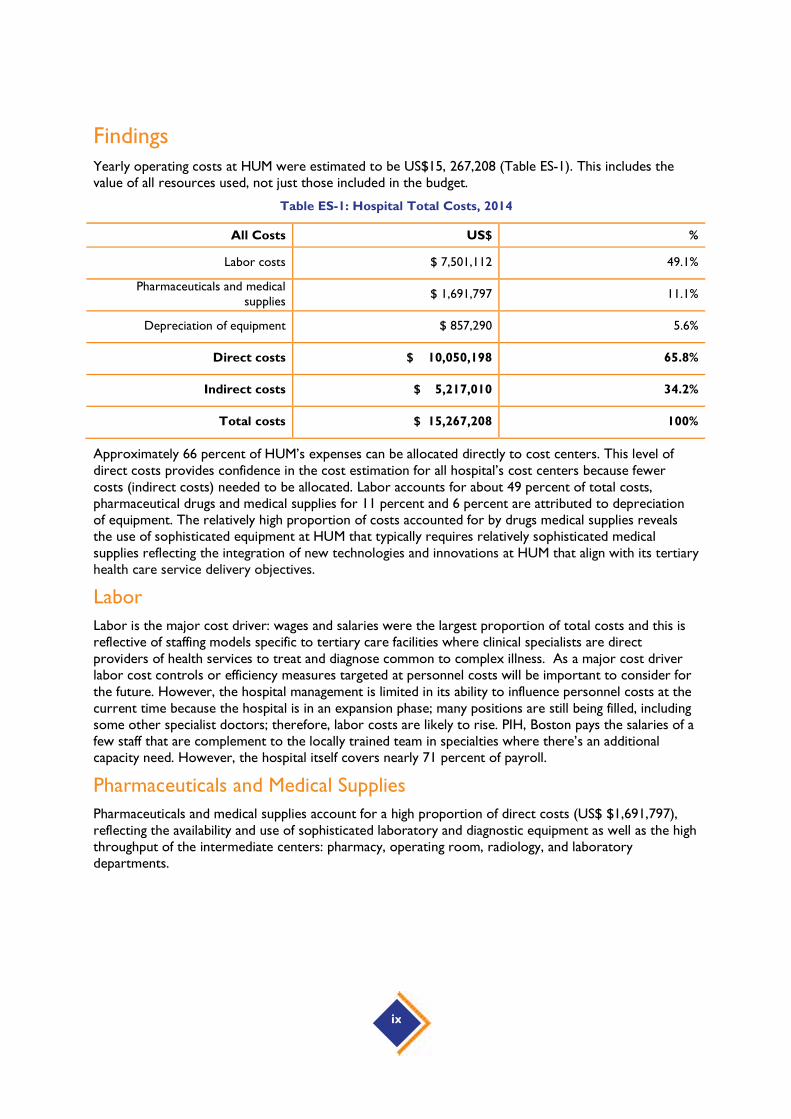
This study uses a tool for costing hospital services called the Management Accounting System forHospitals (MASH) (Partners for Health Reformplus 2004). This tool uses a top-down approach forallocating costs, with the intent that all hospital costs should end up in the departments (also called costcenters) that ultimately provide “final” services to patients, either as inpatients or outpatients. The firststep in the MASH process is to define cost centers. A cost center is the smallest hospital unit thatprovides one kind of service, where costs are accumulated or assigned. Through discussions with thehospital staff and administrators, cost centers were defined in a way that was useful to managers andother final users and reflected both how departments are currently organized as well as how hospitaldata is stored, Figure 1. Hospital departments were classified into three types: “administrative andlogistics,” “intermediate medical services,” and “final medical services.”
Figure 1: Cost Centers utilized in the MASH set up for HUM
The method of allocating costs follows a “step-down” process, starting with the administrative andlogistical cost centers, then the intermediate cost centers. Figure describes the cost allocation processutilized by the MASH. All line item costs were allocated using this four step process. A detaileddescription of the relevant assumptions used can be found in Annex C.

Figure 2: Cost allocation process
Overhead services and physical building services are included in the administrative and logistical services.Intermediate services include diagnostic services as well as pharmacy and mortuary services. The finalmedical services include outpatient, emergency and inpatient services by ward. These final medicalservices were used for purposes of estimating unit costs that include the distributedadministative/logistical and intermediate services costs. This analysis then provided an estimate of thecost of an inpatient bed-day and the cost of an outpatient visit.

7
4. FINDINGS
The findings from the MASH analysis are presented in four sections. In the first section, we look at totalcosts and the line items that account for the largest proportions of those costs: Direct costs (labor,pharmaceuticals and medical supplies, and equipment depreciation) and indirect costs. The secondsection will look at the results of the key intermediate cost centers and their costs including pharmacy,operating room, laboratory, radiology etc. The third section looks at the cost structure of the finalmedical cost centers and the final section presents the unit cost per output for each final medical serviceby inpatient and outpatient departments.
4.1 Total costsFor 2014, operating costs at HUM were US$15,267,208. This figure includes the value of all resourcesused13, not just those included in the reported operating expenditure: depreciation of capital costs forbuilding and equipment are included in these costs as well as donated drugs and equipment. If we don’tconsider any depreciation costs14, the yearly operating costs of HUM drop to US$ 13,173,451. Thisfinding highlights the sophistication and newness of the facility. For example, HUM is renowned as beingone of the largest solar powered hospitals in the world.
Table 1: Hospital total costs for 2014 in US$
All Costs US$ %
Labor costs $ 7,501,112 49.1%
Pharmaceuticals and medicalsupplies $ 1,691,797 11.1%
Depreciation of equipment $ 857,290 5.6%
Direct costs $ 10,050,198 65.8%
Indirect costs $ 5,217,010 34.2%
Total costs $ 15,267,208 100%
Approximately 66% of HUM’s expenses can be allocated directly to cost centers (Figure ). This level ofdirect costs provides confidence in the cost estimation for all hospital’s cost centers because fewercosts (indirect costs) needed to be allocated.
13 Except the value of medical staff who come to work as volunteer at the hospital throughout the year.
14 Total depreciation would include depreciation of medical equipment (direct cost, $ 857,290 ) as well as vehicles, building and energy systems(indirect costs, $1,236,467)

Figure 3: Breakdown of total costs by Direct/Indirect
Figure , breaks down direct costs into the major cost categories, labor, pharmaceuticals/medical suppliesand depreciation of medical equipment. In Figure , we see that labor accounts for 75 percent of thedirect costs, pharmaceutical drugs/medical supplies 17 percent. The 8 percent accounted for bydepreciation refers to depreciation on medical equipment only. Each of these is discussed next in moredetail.
Figure 4: Breakdown of direct costs
4.1.1 Labor
Personnel wages and salaries were the largest proportion of the direct costs at about 75 percent(approximately US$ 7,501,112 a year) and this is reflective of staffing models specific to tertiary carefacilities where clinical specialists are direct providers of health services to treat and diagnose commonto complex illness. As a major cost driver, labor cost controls or efficiency measures targeted atpersonnel costs will be important to consider in the future. However, the hospital management islimited in its ability to influence personnel costs at the current time and it should be noted that manypositions are still being filled, including some specialist doctors, because the hospital is still in an
66%
34%
Hospital costs distribution(total $15,267,208 per year)
Direct costs
Indirect costs
75%
17%
8%
Direct costs distribution(total $10,050,198 per year)
Labor costs
Drugs and medicalsupplies
Depreciation ofequipment

9
expansion phase. A few staff are paid for by Partners in Health in Boston that are complementary to thelocally trained team in specialties where additional capacity is needed. However, most of the payroll(71%) is covered by the hospital, see Figure .
Figure 5: Breakdown of payroll costs
4.1.2 Pharmaceuticals/medical suppliesPharmaceuticals and medical supplies account for US$ 1,691,797 per year. The relatively high proportion of costsaccounted for by drugs and medical supplies reflects the use of sophisticated equipment at HUM that typicallyrequires relatively sophisticated medical supplies. Aside from pharmacy, the operating rooms account for11percent of cost, followed by dental clinic (10 percent), Laboratory (9 percent) and Accident & Emergency (7percent). Pharmaceutical and medical supply costs are shown in detail in Table 2.
Table 2: Pharmaceutical and medical supply costs by cost center in US$
Cost center Drugs and medical supplies
Value in US$ % of total
Pharmacy 434,296 26%
Operating Room 184,618 11%
Outpatient Dental clinic 172,721 10%
Laboratory 151,330 9%
Accident & Emergency 117,464 7%
All other cost centers 631,368 37%
Total 1,691,797 100%
71%
14%
15%
Payroll distribution(total $ 7,501,112 per year)
Hospital paid: localpersonnel
Hospital paid: nonlocal personnel
Partners' paidpersonnel

4.1.3 Depreciation and Equipment costs
Capital costs represent the value of fixed assets used in the delivery of services. These are an importantcomponent of hospital costing, particularly when the full cost of delivering services is required, forexample, for guidance in setting up user fees or to contract with insurance. Capital depreciation costsare not trivial; they represent 8 percent of direct cost (medical equipment only) and 6 percent of totalcosts.
The cost analysis for HUM does include capital costs; because the hospital opened recently it waspossible to obtain the value of fixed assets for the analysis. However, the hospital had not maintained aregister of all fixed assets nor are the values of the assets currently in use easily retrievable. An attemptto estimate the cost of fixed assets proved time-consuming; it involved a team of data collectors takingan inventory of equipment for every department and then the study team obtaining price estimates ofthe costs of those items. The total value of that equipment was then used in order to calculate a yearlydepreciation amount that was added to the other direct costs, to arrive at a more accurate estimate ofthe total costs of running the hospital. For the depreciation calculations we used a life time of 5 years15
for the equipment at the recommendation of the hospital.
A closer look at the inventory results in terms of total value of the equipment in Table 3 gives insightson the costs centers with the most expensive medical equipment. The radiology department has by farthe highest proportion of the equipment value, as HUM is one of the few hospitals in the country havinga scanner. The operating room suite is also well equipped and denotes of the surgical potential of HUM.The OB/GYN department also has a high amount of equipment as it is a referral hospital for OB/GYNpatients in the region.
Table 3: Equipment total value by cost center in US$
Cost Centers Equipment
value in US $ % of total
Radiology1,249,396 29%
Operating Room538,950 13%
Inpatient OBGYN (labor and delivery)307,549 7%
All other cost enters2,190,554 51%
Total4,286,449 100%
4.1.4 Indirect costs
A total of $5,217,010 of indirect costs per year is estimated as the cost of resources that are usedacross all cost centers. The largest of these costs are the depreciation of buildings, vehicles and energysystems ($1,236,467). Energy is also a substantial indirect cost ($908,767) as well as Food ($640,920).
15 HUM administration requested that the study team assume five years of useful life for medical equipment, which may be overly
conservative and certainly leads to high depreciation costs estimates.
11
Other line items include office supplies, other staff expenses, transport, communications and otherfunctioning costs (see annex A for more details on the line items).
Following the grouping of each department’s costs into direct (labor, drugs and supplies, equipment) andindirect costs, the administrative and logistical services’ costs were then allocated between intermediateand final medical cost centers. The resulting intermediate medical services’ costs were then allocated tofinal medical costs center to obtain the final medical cost centers’ “Full costs”, see Annex B for detailson this process and Annexes D through E for the intermediary results.
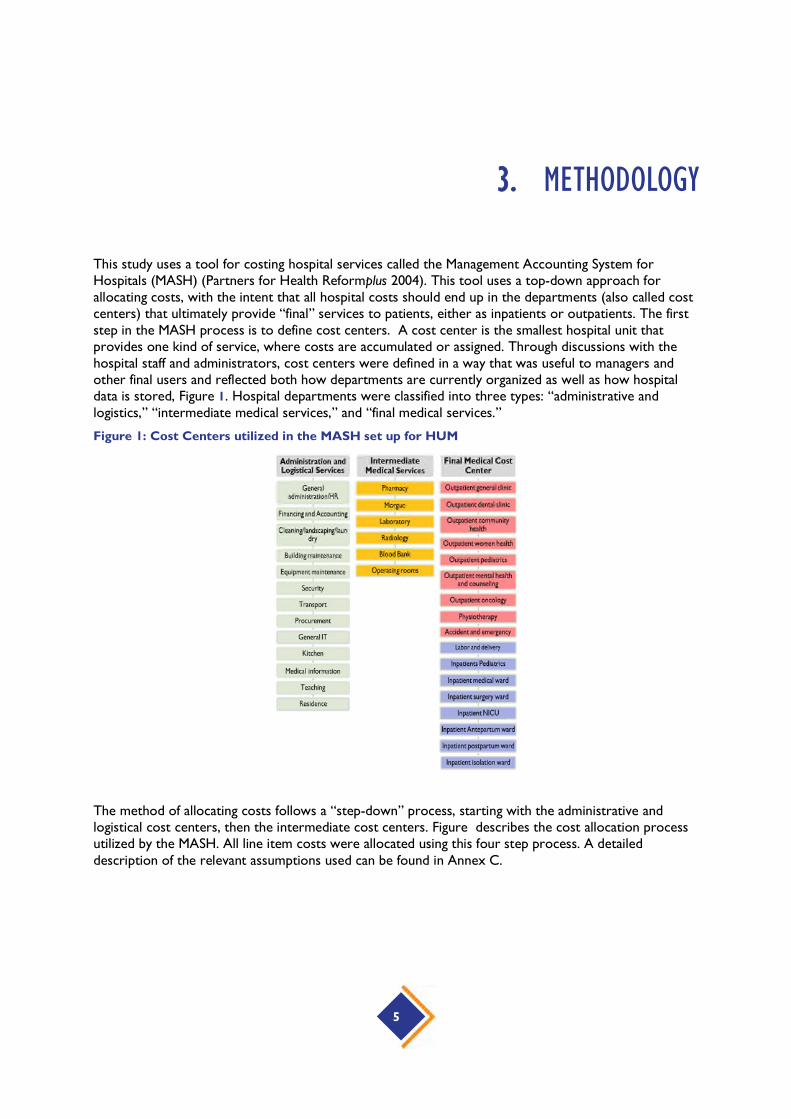
4.2 Key intermediate cost centersThe step-down allocation of costs in the MASH tool does not directly report the final costs associatedwith intermediate cost centers, which may be as important for hospital management to understand asthe breakdown for the final cost centers. To provide additional cost information, this section will focuson the following most expensive intermediate cost centers: Pharmacy, Laboratory, Radiology andOperating Room.
There are three types of costs that make up the total cost for each center: direct costs, indirect costs,and allocated costs from logistical cost centers. For the intermediate cost centers, the direct costsinclude labor, equipment and drugs and medical supplies. The indirect costs consist of utilities, and allother related shared costs (for example stationary). Finally, the costs allocated from all of the logisticaland administrative cost centers are also included.
Figure demonstrates that these allocated costs are a significant part of the total cost for theintermediate medical cost centers. For pharmacy and laboratory they account for respectively 15 and 24percent of the total cost while for radiology it is 33 percent and for the OR suite it is 26 percent.
Figure 6: Breakdown of costs for intermediate cost centers
$-
$200,000
$400,000
$600,000
$800,000
$1,000,000
$1,200,000
$1,400,000
$1,600,000
Pharmacy Laboratory Radiology OperatingRoom
Intermediate centers'cost breakdown
Total allocated froms logistics
Indirect costs
Equipment
Drugs & supplies
Labor

The hospital management might also be interested in the unit cost of output for the intermediatemedical cost centers. Using the activity reported by the hospital, those unit costs are shown in
Table 5. Particular care needs to be taken when interpreting these unit costs, depending on the natureof the cost center: single output versus multiple outputs.
Ultrasound, mortuary and blood bank outputs can be considered as homogenous units and as such thecosts below are the real unit costs. However, laboratory, radiology, operating room and physiotherapydepartments each produce a range of heterogeneous outputs where each output has a different level ofresource consumption. For example, the laboratory performs different types of test that requiredifferent equipment, reagents or amounts of staff time: an HIV test is different from a biopsy testing forcancer. The radiology department does both X-rays and MRI scanning each of which are very differentin terms of cost of the required equipment and materials used. Similarly the time spent on differentsurgeries carried out in the OR is different; so is the type of staff time and medical supplies used forthem. For physiotherapy, different patients need different number of/or longer sessions depending ontheir condition. Therefore, because of these considerations, the unit costs for laboratory, radiology,operating room and physiotherapy should be interpreted as being ‘the average cost of a unit of outputfrom these cost centers’ and not ‘the average cost of any one service’.
Table 4: Unit cost for intermediate cost centers
Intermediate MedicalServices
Cost after logisticalservices allocation
Volume of services Average Unit Cost
Per day of conservation
Morgue $ 39,199 4,126 $ 10
Per test
Laboratory $ 647,003 330,476 $ 2
Per exam
Radiology $ 671,914 26,616 $ 25
Per unit of blood
Blood Bank $ 171,017 1,783 $ 96
Per surgery
Operating Room $ 1,424,491 2,998 $ 475
4.3 Final medical services cost structureThis section presents the cost structure of the final medical services. For HUM we found that outpatientcare accounts for 34 percent or just over a third of total hospital costs. Typically that figure is close to aquarter or a fifth. However this finding reflects the mission of HUM which includes the delivery of

13
primary health care to its indigent local population. Figure shows the cost of inpatient and outpatientcare broken into major inputs, salaries and drugs/supplies. For both outpatient and inpatient costcenters, salaries and drugs/medical supplies make up the majority of allocated costs at around 60percent.
Figure 7: Summary cost structure for inpatient and outpatient care
Table 5 (outpatient units) and Table 6 (inpatient units) show the cost structure in more detail. Generaloutpatient care was the largest cost center followed by Women health and Oncology. The outpatientPhysiotherapy/Rehabilitation reported the highest proportion spent on salaries with 67 percent whichcan be explained by the fact that very little drugs and supplies were reported for this cost center.
Table 5: Cost allocations by input for final medical cost centers, outpatients
Final Cost centers Full cost Salaries % Drugs andsupplies
% Other %
Outpatient General $1,321,275 $573,971 43% $197,013 15% $550,291 42%
Outpatient Dental clinic $488,175 $94,024 19% $256,698 53% $137,452 28%
Outpatient Community health $775,163 $496,525 64% $4,087 1% $274,552 35%
Outpatient women health $982,207 $533,521 54% $127,904 13% $320,782 33%
Outpatient Pediatrics $263,032 $124,603 47% $14,487 6% $123,942 47%
Outpatient Mental health $66,235 $25,933 39% $163 0% $40,138 61%
salaries ,49%
Drugs&supplies,
14%
Others ,37%
Outpatients cost allocation by input
salaries ,49%
Drugs&supplies, 9%
Others ,42%
Inpatients cost allocation by input

Outpatient Oncology $867,227 $379,907 44% $163,554 19% $323,766 37%
Physiotherapy/rehabilitation $469,408 $315,717 67% $4,719 1% $148,971 32%
Total $5,232,722
Surgery, A&E, medicine and L&D were the largest departments in terms of costs amongst the inpatientunits and each of them is larger, in terms of cost, than any of the outpatient units. All inpatients serviceshave a higher proportion spent on salaries than on drugs and this difference in cost structure is typicalfor inpatient units.
Table 6: Cost allocations by input for final medical cost centers, inpatients
Final Cost centers Full cost Salaries % Drugsand
supplies
% Other %
Accident & Emergency $2,041,063 $1,036,809 51% $238,199 12% $766,056 38%
Labor and Delivery $1,410,267 $636,241 45% $141,982 10% $632,043 45%
Inpatient Pediatrics $879,608 $416,816 47% $55,308 6% $407,483 46%
Inpatient Medical Ward $1,667,872 $829,660 50% $153,312 9% $684,900 41%
Inpatient Surgical Ward $2,164,147 $1,232,650 57% $139,692 6% $791,805 37%
Inpatient NICU $791,242 $378,947 48% $86,565 11% $325,730 41%
Inpatient Isolation ward $218,081 $65,140 30% $22,462 10% $130,478 60%
Inpatient Prenatal ward $364,088 $153,577 42% $32,172 9% $178,339 49%
Inpatient Postnatal ward $498,118 $207,070 42% $53,478 11% $237,570 48%
Total $10,034,486
4.4 Final medical services cost per outputThe last step in the cost structure analysis is to use the cost estimate data in combination with serviceutilization data to give average costs per output for each unit. The activity data was provided by thehospital: number of outpatient visits, number of admissions and number of inpatient days. The data onthe number of beds was extracted from the equipment inventory data and from documents provided bythe hospital. The bed occupancy rate were calculated by multiplying the total number of beds per wardby 360 to get the total possible inpatient days per year; then the number of reported inpatient days wasdivided by the number of possible inpatient days. The average length of stay per ward was calculated asthe ratio of number of inpatient days over number of admissions.

15
These unit cost results should be interpreted with a lot of caution: their calculation is very sensitive to hospitalactivity. Furthermore, for some cost centers it is very difficult to separate the different services provided.Whenever different services uses different amounts of resources from the same cost center, simplydividing the total cost by the number of units will give inaccurate unit cost estimates. For example theoutpatient oncology’s number of outpatient visits includes patients who came for follow-up visits andthose who came for a chemotherapy session. Unless more detailed data are made available on theconsumption of resource for each type of service (visit vs. chemotherapy) it is not possible to provide amore accurate determination of how much of the total cost of the oncology department can beallocated to visits versus chemotherapy sessions and therefore what the corresponding unit cost foreach type of service may be.
Table 7 shows the cost per outpatient visit across the outpatient units. The general outpatient unitfollows a typical primary care high volume, low cost pattern (although from a sound researchperspective it would be necessary to compare this with costs from a primary care center to determinewhether it is accurate to refer to $17 per visit as being low.)
Table 7: Outpatient unit costs by final cost centers
Final cost centers Full cost Number of visits Cost per visit
Outpatient General $1,321,275 78,007 $17
Outpatient Dental clinic $488,175 10,102 $48
Outpatient Communityhealth
$775,163 1,99516 $389
Outpatient women health $982,207 17,771 $55
Outpatient Pediatrics $263,032 12,115 $22
Outpatient Mental health $66,235 1,738 $38
Outpatient Oncology $867,227 6,553 $132
Rehabilitation/Physiotherapy $469,408 1,03317 $454
Accident & Emergency $2,041,063 14,629 $140
Labor and Delivery $1,410,267 3,08218 $458
The Accident and Emergency department is currently not collecting data that allow for any distinction tobe made between patients kept for observation and those who are discharged immediately aftertreatment. However this unit does ‘admit’ some patients for observation and have approximately 30beds that may be used. The activity found in table 7 is then a mix of patients kept for observation (1 or2 days) and those discharged immediately.
Table 8 presents the average output costs for inpatient care. We see several units with bed occupancyrates above 100% because the available data are not yet disaggregated enough to allow us to
16 This department do a lot of education work (81806 individuals counselled) and immunizations (27982 patients). In this unit cost weonly accounted for the 1995 nutritional visits that were done, hence the expensive unit cost17 This is a new service that was built in 2014 and the activity is not yet important hence an expensive unit cost.18 This represent the number of deliveries both normal deliveries and C-sections.
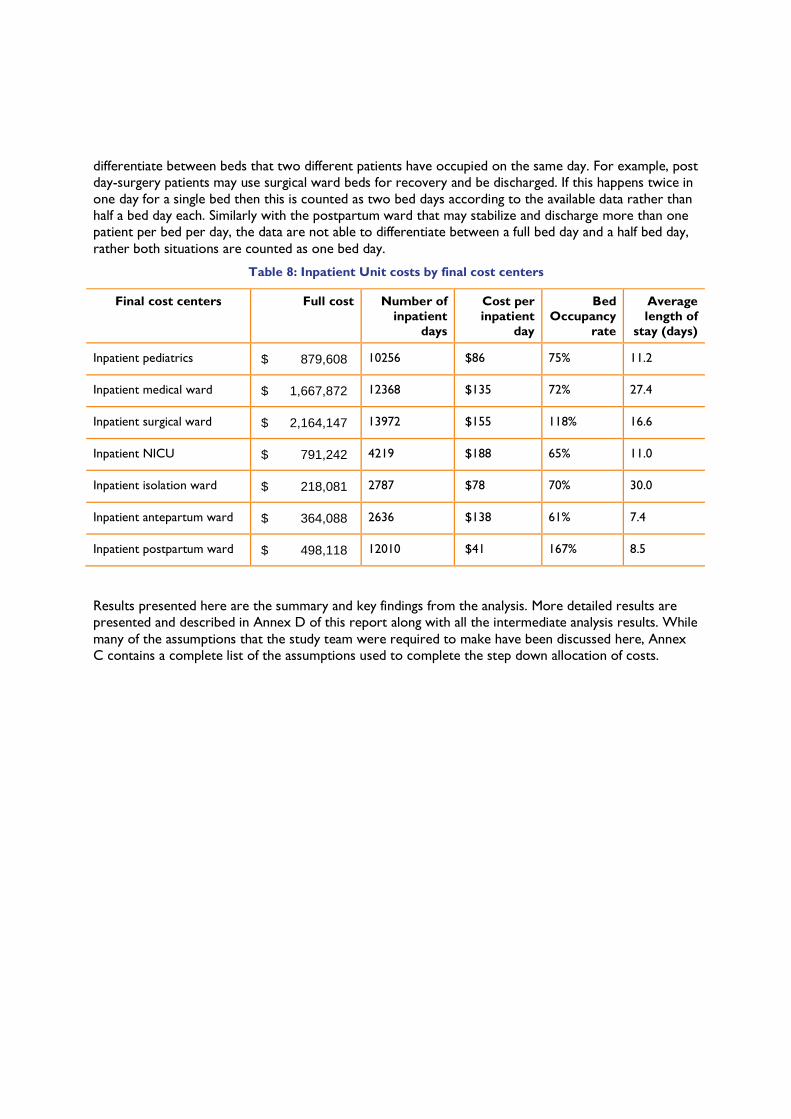
differentiate between beds that two different patients have occupied on the same day. For example, postday-surgery patients may use surgical ward beds for recovery and be discharged. If this happens twice inone day for a single bed then this is counted as two bed days according to the available data rather thanhalf a bed day each. Similarly with the postpartum ward that may stabilize and discharge more than onepatient per bed per day, the data are not able to differentiate between a full bed day and a half bed day,rather both situations are counted as one bed day.
Table 8: Inpatient Unit costs by final cost centers
Final cost centers Full cost Number ofinpatient
days
Cost perinpatient
day
BedOccupancy
rate
Averagelength of
stay (days)
Inpatient pediatrics $ 879,608 10256 $86 75% 11.2
Inpatient medical ward $ 1,667,872 12368 $135 72% 27.4
Inpatient surgical ward $ 2,164,147 13972 $155 118% 16.6
Inpatient NICU $ 791,242 4219 $188 65% 11.0
Inpatient isolation ward $ 218,081 2787 $78 70% 30.0
Inpatient antepartum ward $ 364,088 2636 $138 61% 7.4
Inpatient postpartum ward $ 498,118 12010 $41 167% 8.5
Results presented here are the summary and key findings from the analysis. More detailed results arepresented and described in Annex D of this report along with all the intermediate analysis results. Whilemany of the assumptions that the study team were required to make have been discussed here, AnnexC contains a complete list of the assumptions used to complete the step down allocation of costs.
17
5. DISCUSSION
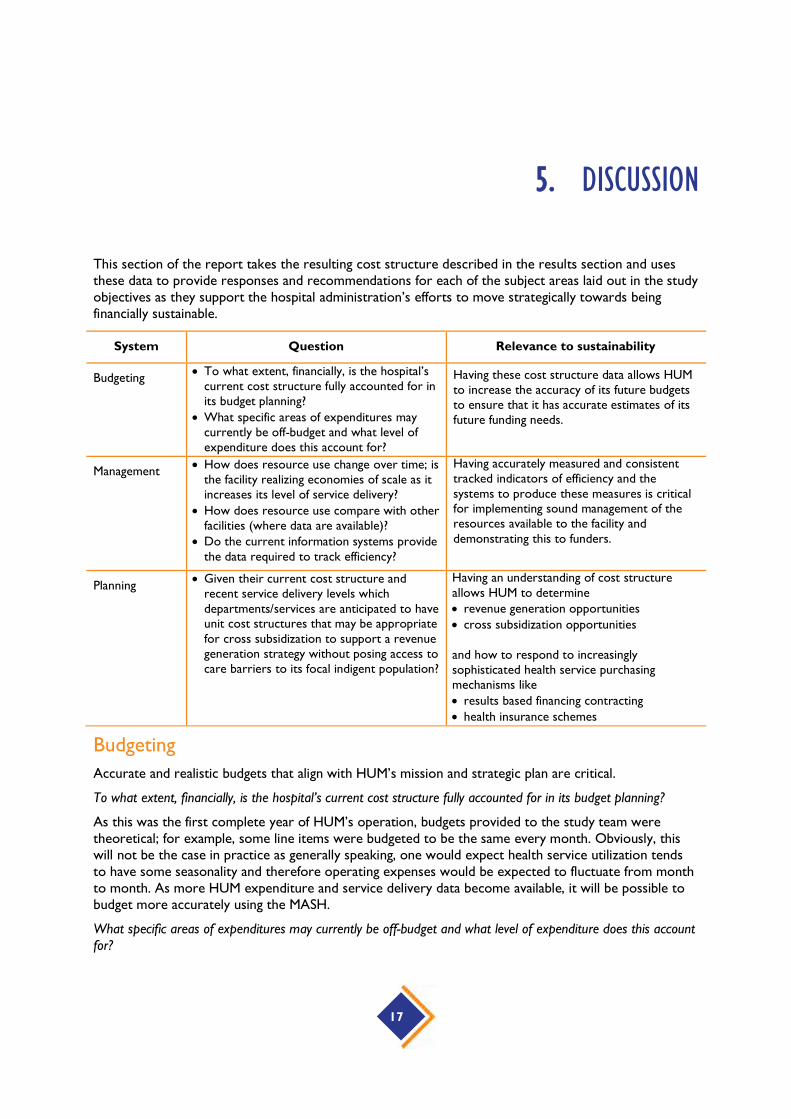
This section of the report takes the resulting cost structure described in the results section and usesthese data to provide responses and recommendations for each of the subject areas laid out in the studyobjectives as they support the hospital administration’s efforts to move strategically towards beingfinancially sustainable.
System Question Relevance to sustainability
Budgeting To what extent, financially, is the hospital’s
current cost structure fully accounted for inits budget planning?
What specific areas of expenditures maycurrently be off-budget and what level ofexpenditure does this account for?
Having these cost structure data allows HUMto increase the accuracy of its future budgetsto ensure that it has accurate estimates of itsfuture funding needs.
Management How does resource use change over time; is
the facility realizing economies of scale as itincreases its level of service delivery?
How does resource use compare with otherfacilities (where data are available)?
Do the current information systems providethe data required to track efficiency?
Having accurately measured and consistenttracked indicators of efficiency and thesystems to produce these measures is criticalfor implementing sound management of theresources available to the facility anddemonstrating this to funders.
Planning Given their current cost structure and
recent service delivery levels whichdepartments/services are anticipated to haveunit cost structures that may be appropriatefor cross subsidization to support a revenuegeneration strategy without posing access tocare barriers to its focal indigent population?
Having an understanding of cost structureallows HUM to determine revenue generation opportunities cross subsidization opportunities
and how to respond to increasinglysophisticated health service purchasingmechanisms like results based financing contracting health insurance schemes
Budgeting
Accurate and realistic budgets that align with HUM’s mission and strategic plan are critical.
To what extent, financially, is the hospital’s current cost structure fully accounted for in its budget planning?
As this was the first complete year of HUM’s operation, budgets provided to the study team weretheoretical; for example, some line items were budgeted to be the same every month. Obviously, thiswill not be the case in practice as generally speaking, one would expect health service utilization tendsto have some seasonality and therefore operating expenses would be expected to fluctuate from monthto month. As more HUM expenditure and service delivery data become available, it will be possible tobudget more accurately using the MASH.
What specific areas of expenditures may currently be off-budget and what level of expenditure does this accountfor?

Pharmaceuticals and medical supplies are a major cost driver but full information on their unit costs wasnot available at the time of data collection. The study team, in preparing the MASH template, hasidentified nearly all of these unit costs so that in future HUM will be able to accurately account for thisresource use. Furthermore, HUM needs to distinguish between donated and purchased resources.Donated resources should be fully accounted for so that accurate resource needs and utilization arecaptured. Given HUM’s commitment to it its indigent population, fundraising will be a necessary part ofits financial strategy. Being able to accurately quantify what resources HUM needs will be helpful as itapproaches different donors who may have different priorities for funding or wish to make in-kindcontributions, for example, pharmaceuticals vs. equipment vs. fuel or other resources.
Depreciation/capital costs were also found to be a major cost driver. Budgets must account for thesecosts to ensure that maintenance and replacement funding is set aside. If charging for sophisticatedradiological services is part of a revenue generation strategy, then maintaining and replacing the requiredequipment is critical.
Management
Accurately measuring and consistently tracking efficiency indicators as well as having the systems toproduce these measures is critical for implementing sound management of the resources available to thefacility and demonstrating this to funders.
How does resource use change over time; is the facility realizing economies of scale as it increases its level ofservice delivery?
All of the average unit costs presented in this analysis are subject to change because HUM is still goingthrough its initial start-up phase and service delivery levels and expenditures are yet to stabilize. Oncethese variables have stabilized, HUM will need to go through a review phase to see how it might allocateits resources more efficiently. This study’s modelling of its cost structure will assist HUM in this process.This analysis includes the types of measures that, if monitored over time, can provide information onwhere economies of scale are being realized because unit costs should be decreasing, at least in themedium term. However, it is important to point out that the unit cost estimation should be furtherrefined to be more specific to the types of services (for example, the types of tests) as well as the typesof patients who receive services from a cost center that delivers services to both internal and externalpatients. For example, it will be important to be able to differentiate between types and numbers oflaboratory services used by patients receiving medical care from HUM versus laboratory services usedby referral patients not seen by HUM clinical staff.
How does resource use compare with other facilities (where data are available)?
Currently, the study team is not aware of similar costs data being available for other tertiary-levelfacilities in Haiti. This makes cost comparisons impossible. However, as noted previously, primary healthcare services are an important output of HUM and these cost data for Haiti are available forcomparison. Such comparisons would probably be of interest to MSPP as it explores options forproviding primary care as efficiently as possible.
Primary care at HUM as a national referral and teaching hospital was integral to the phasing approach toopening services at the hospital. HUM’s mandate included ensuring access to community-linked primarycare services for the currently underserved target catchment area for primary care services. During thesecond phase of operations at HUM there will be a transition of primary care services to the formerCDI location, reinforcing an integrated system for primary care management and referral for secondaryand tertiary level care at HUM. Therefore in terms of cost comparison data, the transition of primarycare services to the CDI location and resulting costs of care would represent the most accuratemeasure for costs of primary services through HUM in the long term.

19
Do the current information systems provide the data required to track efficiency?
HUM has several sophisticated information management systems. Therefore, it should not be difficult forit to ensure that the appropriate data are available in order to provide more specific unit cost estimatesfor the future. For example:
For future revenue generation purposes, it will be important for systems to be able todifferentiate between indigent and non-indigent populations receiving care to ensure thatindigent populations remain able to access care free of charge and that this care is adequatelybudgeted while non-indigents are charged appropriately. This distinction is key to any effectiverevenue generation policies that align with HUM's mission of commitment to its localpopulations.
Several units within the hospital will need to be able to aggregate and disaggregate services moreaccurately. Examples of this are L&D, where service delivery data are reported by the numberof uniquely identified patients rather than the number of services, the latter of which makes itimpossible to determine when a single patient uses the service more than once and the truenumber of visits. Similarly, several inpatient units currently have occupancy rates of more than100 percent because the utilization data are rounded up to whole bed days and don't capturesituations such as day surgery recovery, or others in which more than one patient occupies abed in one day.
The ability to accurately determine unit costs will become even more critical as financing strategies forHUM are developed and revenue is collected from out-of-pocket fees, insurance companies, andgovernment contracting.
Planning
HUM recognizes the need to move toward a sustainable financial position.
Given their current cost structures and recent service delivery levels, which departments/services are anticipatedto have unit cost structures that may be appropriate for cross-subsidization to support a revenue generationstrategy without posing access to care barriers to its focal indigent population?
Revenue generation opportunities: This analysis identified some of the major opportunities for revenuegeneration that HUM has at hand, including the use of its laboratory, operating room, and radiologyfacilities. Given the cost of the equipment being used, it will be important for HUM to market thesefacilities and use them to their maximum capacity. In addition, given that providing medical education ispart of its mission, these facilities might enable HUM to provide education to non-Haitian medicaltrainees from the Caribbean.
Cross-subsidization opportunities: Although HUM is still in its start-up phase, it already serves patientsfrom a wide variety of socioeconomic groups, so it is reasonable to plan for some cross-subsidizationbetween those who are able to pay for services and those who are unable to pay. Examples of servicesin this group might be radiology, physiotherapy, and surgical services; their costs are too high to expectindigent populations to pay out of pocket, but wealthier patients may want to take advantage of HUM'ssophisticated, high-quality facilities and can pay to do so. Similarly, low-cost services may be marked upand priced to cross-subsidize more expensive services.
Results-based financing (RBF) contracting: Haiti is currently witnessing the implementation of at leastone RBF pilot scheme to support the provision of maternal and neonatal child health. Given HUM'scommitment to providing primary health care, it may be possible for the hospital to participate in theRBF schemes. Understanding the resources required to provide the significant amount of primary health

care delivered by HUM would be important for setting contract prices (particularly if RBF payments arelower than HUM costs.)
Formal health insurance schemes: Although private insurance coverage is very low in Haiti (1 percent19)it is highest in the Port-au-Prince region geographically close to HUM. Therefore, understanding its coststructure allows HUM to potentially contract with formal insurance schemes. These schemes includethe state-run Office d'Assurance Accidents du Travail; Maladie et Maternité (OFATMA), a provider ofworker’s compensation program; the Office Assurance Véhicule Contre Tiers (OAVCT), a state-runprovider of third party vehicle insurance; and private insurance companies.
HUM is an exciting opportunity to establish a level of quality care in Haiti comparable to that of muchwealthier countries for a population that has previously experienced insurmountable barriers to evenbasic care. Ensuring that the facility has the resources it needs to continue to deliver this care is animportant responsibility that will require the involvement of many stakeholders. By understanding itscost structure and being able to discuss its resource needs in evidence-based terms, the administrationof HUM will be able to clearly and accurately estimate and express these needs to the many potentialstakeholders who are increasingly seeking value for money for their contributions, and to take advantageof the more sophisticated health financing contracting opportunities that are being explored by thegovernment of Haiti.
19 Preliminary Living Standards Measurement Survey data, personal communication

21
ANNEX A: TOTAL EXPENDITURES BY LINE ITEM
Data types and sourcesAfter determining the cost centers, the next step was to gather the necessary output and cost data. Thisincludes service volumes, quantities of drug and medical supplies, total staff numbers, direct expendituredata, and other data such as building space allocations, equipment and vehicle inventories, and othercapital and fixed asset costs.
Expenditure data were collected from the Hospital, as well as procurement and some invoice data fordrugs and medical consumables. Service volume data collection included bed numbers, inpatientadmissions, number of patient days, outpatient visits, and number of procedures per department. Intotal, service volume data were collected from all outpatient clinics, all inpatient wards, the emergencydepartment, the physiotherapy department, the laboratory, the blood bank the pharmacy, the radiology,the ultrasound, the operating rooms (OR), the mortuary, and some logistical services (kitchen,transport). Data concerning drugs and medical supplies included quantity of drugs and supplies used byeach cost center as well as some unit costs of specific drugs. Staff positions, numbers of staff,salaries/wages and any additional compensation or allowances, and where possible, allocation of stafftime spent in different cost centers were also obtained. Expenditure data were collected from thefinancial department and included indirect costs (covering utilities, equipment, fuel, maintenance, etc.).Capital and equipment inventories were collected, as well as square footage of space occupied by thedifferent wards.
Payroll data
Staff costs (human resource expenses): these represent the human resources expenses incurred for theprovision of services per production unit. In the context of this study, these expenses take into accountthe base salaries, the ONA fees borne by the institution and the bonuses received by the employees as afunction of the position and of the category with reference to a code. The staff hired by the hospital canbe classified in 3 subgroups: the local staff (paid in local currency), an intermediate group (paid in USdollars). These first 2 subgroups are paid directly by the hospital; the third subgroup is composed in partof expatriates who are paid from Boston (PIH registered office).
As for the distribution of human resources working time between the cost centers, an estimate of thistime (expressed as a percentage) was carried out with the aid of the heads of services and when needed,with the resource persons of the services in question.
Depreciation assumptions
The depreciation periods used for the costing in the model are variable and depend on the type ofequipment (heavy equipment, light equipment, rolling stock, etc.). This information is generally madeavailable by the manufacturer. At HUM, the majority of this equipment and certain consumables werereceived as gifts and therefore it was difficult to retrace the exact value and the probable useful life ofthese goods. Research was conducted through central purchasing websites on the internet on thetheoretical acquisition cost of the equipment. . Despite these efforts certain materials could still not beassigned a value and these are generally associated with the operational block, with the laboratory, withradiology, etc. Therefore depreciation on medical equipment may be underestimated. Depreciation
periods used were according to information provided by the hospital. All medical and non-medicalequipment were inventoried and depreciated at 5 years with the exception of those discussed below.
Building depreciation
The total acquisition cost of the premises was decided by mutual agreement with the administration andoperations manager. The estimation was made on the basis of a cost per square foot of 60 US$. Theperiod of amortization recommended by the HUM was 25 years.
Energy systems depreciation
The hospital uses various sources to provide the electricity necessary for the functioning of its units, i.e.solar energy, and generators using fuel oil. For medical gas (oxygen, vacuum) and water, the hospital hasits own production units. The period of depreciation for this equipment recommended by HUM was 5years. The study team notes that this can be considered as a relatively short period in relation to theacquisition costs of such devices compared to their manufacturer warranty. This assumption, combinedwith the significant expenditures for the supply of inputs could result in inflated total hospital costs.
Vehicle depreciation
The value of vehicle depreciation was estimated using the sum of the acquisition value of new vehiclesand the current total value of used vehicles vehicle. That information was provided by the Head of theTransport department. For the depreciation of vehicle HUM proposed 3 years.
Drugs and medical supplies data
The receipt of orders and the distribution of drugs and medical supplies amongst the services arecarried out by the "procurement" service. Each unit or medical department receives its endowmentfrom the hospital warehouse. The two pharmacies are also supplied from the warehouse. For the periodunder study, some medical inputs (drugs and consumables) were ordered and purchased from the PIHregistered office in Boston. The monitoring system at HUM can retrace the endowment and theconsumption recorded by each of the units or departments in the hospital. But the estimate in monetaryterms of the consumption by services is not yet integrated into the system. Where prices forpharmaceuticals and medical supplies were missing, the study team did an internet search. The IDAFoundation Electronic Price Indicator (April 2014) database and other internet sources were used toobtain prices where they were not available from HUM.
Expenditure dataAlthough budget information was available, the HFG team followed the standard process of using actualexpenditure data which were available for 2014. Actual expenditure data present a more accuratepicture of financial resources used than budgets from which expenditure may vary in practice. Table 9presents the expenditures utilized in this analysis. In general all the direct costs were estimated by thestudy team. We note that pharmaceutical and medical supply expenditures were estimated by the studyteam directly as described above. The team estimated depreciation directly as well. Labor was alsoestimated by the team using payroll data received from HUM.

23
Table 9: Total expenditures provided for December 2013 in US$
All Costs US$ % of Total Costs
Labor costs $ 7,501,112 49.1%
Drugs and medical supplies $ 1,691,797 11.1%
Depreciation of equipment $ 857,290 5.6%
Staff part time $ 297,257 1.9%
Staff fringe $ 222,954 1.5%
Other staff expenses $ 83,696 0.5%
Food $ 640,920 4.2%
Food special events $ 5,756 0.0%
Medical supplies $ 21,419 0.1%
Computer supplies $ 4,910 0.0%
Cleaning supplies $ 116,715 0.8%
Office Supplies $ 20,794 0.1%
Home supplies $ 8,321 0.1%
Other supplies and accessories $ 15,791 0.1%
Medical services cost $ 19,054 0.1%
Other fuel $ 213,397 1.4%
Energy: generator, electricity, water. $ 908,767 6.0%
Infrastructure Insurance $ 32,424 0.2%
Transport -patient $ 31,658 0.2%
Transport/shipping drugs $ 23,123 0.2%
Other transport $ 33,955 0.2%
Transport -personnel $ 37,897 0.2%
Communications $ 139,512 0.9%
Rental costs $ 109,513 0.7%

All Costs US$ % of Total Costs
Educational costs $ 10,718 0.1%
Funtionning costs $ 210,825 1.4%
Miscellaneous $ 136,455 0.9%
Social support payments $ 100,635 0.7%
Travel costs $ 19,001 0.1%
Administrative costs $ 58,271 0.4%
Maintenance $ 232,366 1.5%
Other maintenance $ 38,102 0.2%
Construction/renovation $ 61,343 0.4%
Small medical equipment $ 31,423 0.2%
Other equipment &furniture $ 93,570 0.6%
Energy systems depreciation $ 517,800 3.4%
Buildings depreciation $ 567,667 3.7%
Vehicles depreciation $ 151,000 1.0%
Total costs $ 15,267,208 100%

25
ANNEX B: COST ALLOCATION PROCESS
Cost allocationThe final cost analysis process includes assigning direct costs to the relevant cost centers, determiningthe rules for allocating indirect costs, finalizing the “step-down” sequence, and performing final costcalculations.
The main hospital resources in providing care are: labor, equipment and drugs and medical supplies.Most of the time those costs can be directly traced to a particular cost center, which is why we definedthem as “direct costs”: sum of payroll, capital depreciation and medical drugs/supplies consumptionspecific to each cost center. We further define “fixed direct costs” (payroll + capital depreciation) and“variable direct costs” (drugs+ medical supplies consumption). This is to make a distinction between thedirect costs that instantly change with the volume of patient (variable)and the one that do not instantlydepend on the volume of medical activity(fixed).
Some hospital resources are shared in a way that makes it impossible or impractical to measure directlyhow much of the resource is used in a particular cost center: here there are referred to as “indirectcosts”. For administration, communication and transportation costs, an indirect allocation process wasused to distribute them across the cost centers. Indirect cost allocation is based on identified “costdrivers”, or indicators that most directly influence the cost being incurred. These could be floor spaceutilized, number of staff, number of patients, etc. The fixed and variable direct costs defined above canalso be used as criteria for indirect cost allocation.
In the step-down sequence, cost centers are assigned to different “levels.” Centers at the top “supply”the centers below them with some kind of service, and they in turn do the same for the centers belowthem. The assumption is that a cost center is either a supplier or a customer to another cost center.For example, in this analysis we assumed that the cleaning/landscaping and laundry unit ‘serves’ theadministrative department while acknowledging that the general administration/HR department mayoffer management services to the cleaning/landscaping and laundry unit employees. In this case (andothers) the provision of services in not necessarily one directional, but, in order to conclude the step-down process, a decision was made as to which order is either larger (in terms of the value of servicesoffered) or that the value of services is small enough that the hierarchy of levels will not affect final costsin a substantive way.


27
ANNEX C: STEP DOWN ALLOCATION ASSUMPTIONS
In order to conduct the step-down allocation, each cost center was given allocation base/criteria, whichwas used to allocate the total costs from that cost center across all the remaining cost centers at lowerlevels. Table 10 lists the allocation bases used for each cost center, as well as any assumptions orcalculations used to determine the amount of the base unit to be applied to each of the remaining costcenters.
Table 10: Step down allocation assumptions
Cost Center Allocation Base Assumptions
Administrative Services and Logistics
Cleaning/Landscaping/laundryCleaning staffdistribution
The distribution of cleaning staff across the different costcenters (number of staff for that cost center)determinethe importance of that cost center in terms ofcorresponding :more resources needed for cleaning.
General administration/HR Staff number
Calculated from the hospital payroll data. Wherenecessary staff was distributed to different cost centersaccording to time spent in that cost center. The morestaff, the more management needed.
Transport Distance driven Number of kilometers driven for each cost center. The
higher the number of kilometers driven for a cost center,the higher its proportion of the shared transport costsshould be.
Financing and AccountingStaff number
Calculated from the hospital payroll data. Wherenecessary staff was distributed to different cost centersaccording to time spent in that cost center. The morestaff, the more management needed.
Building MaintenanceFloor space
Building space by square feet was measured and reportedbased on blueprints for the hospital. The more spaceused, the more resources needed for maintenance.
Medical Equipmentmaintenance
Number ofinterventions
The department provided the list of interventionsprovided to each of the cost centers that it served. Thehigher the number of interventions, the higher thecorresponding maintenance costs.
Kitchen Number mealsserved
We got the number of meals served to each department.The higher the number of meals, the higher the share ofthe kitchen corresponding costs.
Security Value of equipment Calculated from the depreciation cost of equipment.
Allocated to all cost centers. The higher the value of theequipment, the higher the resources for its protection.
ProcurementDirect costs
Direct costs were calculated by summing drugs /medicalsupplies consumption, labor and equipment depreciationattributable to a cost center. The higher the value, themore resources used for provision.

Cost Center Allocation Base Assumptions
Medical Information System fixed direct costs
Fixed direct costs were calculated summing labor costsand depreciation of equipment directly attributable to acost center. The more expensive a center is to run, thehigher its proportion of the shared costs should be.
General ITfixed direct costs
Fixed direct costs were calculated summing labor costsand depreciation of equipment directly attributable to acost center. The more expensive a center is to run, thehigher its proportion of the shared costs should be.
Residencefixed direct costs
Fixed direct costs were calculated summing labor costsand depreciation of equipment directly attributable to acost center. The more expensive a center is to run, thehigher its proportion of the shared costs should be.
TeachingNumber ofresidents
There were 23 interns assigned to final medical costcenters based on a list received from the HospitalAccounts team.
Intermediate Medical Services
PharmacyPercentageestimates
Based on direct consumption (cost) of drugs andconsumables reported in the pharmacy records.
Laboratory Number of tests As reported by the laboratory records
Blood BankNumber of units ofblood
As reported by the Blood bank records
MortuaryNumber ofcadavers
As reported by the mortuary records
Radiology Number of exams As reported by radiology and wards records.
Operating RoomNumber ofsurgeries
As reported by operating rooms and wards records.

29
ANNEX D: STEP DOWN ALLOCATION RESULTS
Step 1: Classify costs between direct and indirect costsAll line item expenditures listed in Table 9 were classified into direct or indirect categories using thefollowing criteria:
Direct costs: the costs that can be directly traced to a particular cost center e.g. salaries, drugs, etc.
Indirect costs: the costs that are shared among many cost centers e.g. utilities, maintenance etc.
Step 2: Allocate direct and indirect costs across cost centersThis cost analysis divided cost centers into “administrative services and logistics,” “intermediate medicalservices,” and “final medical services.” The goal of this first stage of the hospital costing is to define atotal cost for each of the hospital’s administrative/logistical, intermediate medical and final medical costcenters. This is accomplished by first accumulating the direct costs20 of each cost center and second byallocating the indirect costs21 in the second step using the appropriate allocation statistics. This cost perservice center is needed information for budget management and planning at the hospital level. The coststructure HUM is presented in Table 11,
Table 12 and
20 In this report, the term direct cost means costs for the main resources in health care production that are easily linkedto a specific cost center: Labor, Equipment, Drugs and medical supplies.21 Indirect costs refer to all other hospital costs.

Table 13.
The final medical services are the most expensive to run with 46 percent of total costs, followed bylogistical services (35 percent) and intermediate medical services (19 percent). The top cost center interms of cost is the Inpatient Surgical ward (7.3%) followed by the operating room (6.9%) and theGeneral administration (6.2 %).

31
Table 11: Administrative and Logistical Cost Allocation
Cost centers Direct costs(USD)
% Indirectcosts(USD)
% Totalcosts(USD)
%
General Administration/HR 644,781 6.4% 305,639 5.9% 950,421 6.2%
Transport 131,222 1.3% 440,704 8.4% 571,926 3.7%
Financing and Accounting 229,562 2.3% 38,728 0.7% 268,290 1.8%
Building Maintenance(facilities and
operations)
261,864 2.6% 204,317 3.9% 466,180 3.1%
Equipment maintenance (Biomedical) 128,363 1.3% 40,952 0.8% 169,315 1.1%
Kitchen 77,765 0.8% 448,579 8.6% 526,345 3.4%
Security 144,891 1.4% 68,365 1.3% 213,256 1.4%
Procurement 132,140 1.3% 39,477 0.8% 171,617 1.1%
Medical information system 377,277 3.8% 95,231 1.8% 472,508 3.1%
General IT 98,827 1.0% 26,717 0.5% 125,545 0.8%
Residence 39,101 0.4% 405,867 7.8% 444,968 2.9%
Teaching 171,821 1.7% 205,485 3.9% 377,306 2.5%
Total Admin/Logistical Services 2,678,407 26.7% 2,663,773 51.1% 5,342,180 35.0%
Table 12: Intermediate Medical Services Cost Allocation
Cost centers Directcosts(USD)
% Indirectcosts(USD)
% Totalcosts(USD)
%
Pharmacy 557,850 5.6% 246,878 4.7% 804,728 5.3%
Morgue 8,551 0.1% 7,338 0.1% 15,889 0.1%
Laboratory 414,818 4.1% 79,414 1.5% 494,231 3.2%
Radiology 380,294 3.8% 66,780 1.3% 447,075 2.9%
Blood Bank 49,028 0.5% 14,274 0.3% 63,302 0.4%
Operating Room 626,021 6.2% 425,711 8.2% 1,051,732 6.9%
Total Intermediate MedicalServices 2,036,562 20.3% 840,395 16.1% 2,876,957 18.8%

Table 13: Final Medical Services Cost Allocation
Cost centers Directcosts(USD)
% Indirectcosts(USD)
% Totalcosts(USD)
%
Outpatient General 312,122 3.1% 148,689 2.9% 460,811 3.0%
Outpatient Dental clinic 211,449 2.1% 37,071 0.7% 248,520 1.6%
Outpatient Community health 322,569 3.2% 115,300 2.2% 437,870 2.9%
Outpatient women health 447,326 4.5% 132,006 2.5% 579,332 3.8%
Outpatient Pediatrics 59,355 0.6% 29,459 0.6% 88,814 0.6%
Outpatient Mental health 21,902 0.2% 14,002 0.3% 35,905 0.2%
Outpatient Oncology 313,553 3.1% 68,048 1.3% 381,601 2.5%
Rehabilitation/Physiotherapy 238,404 2.4% 39,729 0.8% 278,133 1.8%
Accident & Emergency 679,803 6.8% 143,785 2.8% 823,588 5.4%
Inpatient Labor and Delivery 383,890 3.8% 146,903 2.8% 530,793 3.5%
Inpatient Pediatrics 305,686 3.0% 126,884 2.4% 432,571 2.8%
Inpatient Medical Ward 631,623 6.3% 181,003 3.5% 812,627 5.3%
Inpatient Surgical Ward 875,566 8.7% 238,947 4.6% 1,114,513 7.3%
Inpatient NICU 253,022 2.5% 87,350 1.7% 340,372 2.2%
Inpatient Isolation ward 42,238 0.4% 61,845 1.2% 104,083 0.7%
Inpatient Antenatal ward 92,687 0.9% 66,966 1.3% 159,653 1.0%
Inpatient Postnatal ward 144,034 1.4% 74,853 1.4% 218,887 1.4%
Total Final Medical Services 5,335,230 53.1% 1,712,841 32.8% 7,048,071 46.2%
Table 14: Total Direct and Indirect Cost Allocation
Cost centers Directcosts(USD)
% Indirectcosts(USD)
% Totalcosts(USD)
%
Admin/logistical Services2,678,407 26.7% 2,663,773 51.1% 5,342,180 35.0%
Intermediate Medical Services 2,036,562 20.3% 840,395 16.1% 2,876,957 18.8%
Final Medical Services 5,335,230 53.1% 1,712,841 32.8% 7,048,071 46.2%
TOTAL 10,050,198 100% 5,217,010 100% 15,267,208 100%

33
Step 3: Allocate administrative/logistical costs to intermediateand final cost centersStep three in the allocation process takes the administrative and logistics cost center costs and allocatesthem to the intermediate and final cost centers. The criteria used for allocating any cost center’s costs(described in Annex B) reflects the use of that cost center’s services by the others and may includespace utilized, number of staff, or number of patients. At the end of step three, the costs appear asshown in
Table 15.
Table 15: Administrative and logistical cost allocations to intermediate and final cost centers
Cost Centers Total Costbefore
allocation(USD)
Administrative andlogistical costs
allocated
Total Cost afterallocation(USD)
% oftotalcost
Value in US$ % of total
Pharmacy 804,728 137,848 2.6% 942,576 6%
Morgue 15,889 23,310 0.4% 39,199 0%
Laboratory 494,231 152,772 2.9% 647,003 4%
Radiology 447,075 224,839 4.2% 671,914 4%
Blood Bank 63,302 107,715 2.0% 171,017 1%
Operating Room 1,051,732 372,759 7.0% 1,424,491 9%
Total Intermediate MedicalServices 2,876,957 1,019,243 19% 3,896,200 26%
Outpatient General 460,811 225,095 4.2% 685,906 4%
Outpatient Dental clinic 248,520 57,396 1.1% 305,915 2%
Outpatient Community health 437,870 334,392 6.3% 772,262 5%
Outpatient women health 579,332 222,639 4.2% 801,972 5%
Outpatient Pediatrics 88,814 77,302 1.4% 166,116 1%
Outpatient Mental health 35,905 30,214 0.6% 66,119 0%
Outpatient Oncology 381,601 149,395 2.8% 530,996 3%
Physiotherapy 278,133 160,354 3.0% 438,487 3%
Accident & Emergency 823,588 582,161 10.9% 1,405,749 9%
Labor and Delivery 530,793 330,750 6.2% 861,543 6%
Inpatient Pediatrics 432,571 296,589 5.6% 729,160 5%
Inpatient Medical Ward 812,627 592,139 11.1% 1,404,766 9%
Inpatient Surgical Ward 1,114,513 598,944 11.2% 1,713,457 11%
Inpatient NICU 340,372 259,858 4.9% 600,230 4%
Inpatient Isolation ward 104,083 86,790 1.6% 190,873 1%
Inpatient Antepartum ward 159,653 129,625 2.4% 289,278 2%
Inpatient Postpartum ward 218,887 189,294 3.5% 408,180 3%
Total Final medical services 7,048,071 4,322,937 81% 11,371,008 74%
Total 9,925,028 5,342,180 100% 15,267,208 100%

Note that the total under column “Administrative and logistical Costs Allocated” equals the subtotal inTable 11, and is added to the Total Costs column to its left to calculate the new totals for eachintermediate and final cost center. Further details on allocation assumptions can be found in Annex Babove. Intermediate cost centers now account for about 26 percent of the total hospital cost, and finalcost centers for the remaining 74 percent.
Step 4: Allocate intermediate costs centers’ costs across thefinal medical servicesThe fourth step is to allocate the costs of the intermediate medical service cost centers to the final costcenters. This is done on the basis of the usage of these intermediate cost center services by the finalcost centers. The result is the “full costs by final medical cost center,” as shown in Table 16.
Intermediate cost centers were allocated by direct consumption for Pharmacy, number of tests forLaboratory, number of exams for Radiology, number of surgeries for Operating Theater, number ofcadavers for the Mortuary, number of units of blood for the Blood Bank. Further detail regarding theseallocation bases and assumptions are included in Annex B.
Table 16: Full costs by final medical cost center
Cost CentersCost before
allocation(USD)
Medical intermediatecosts allocated Full Cost after
allocation(USD)
% oftotalcostValue in US$ % of total
Outpatient General 685,906 635,369 16.3% 1,321,275 9%
Outpatient Dental clinic 305,915 182,260 4.7% 488,175 3%
Outpatient Community health 772,262 2,902 0.1% 775,163 5%
Outpatient women health 801,972 180,235 4.6% 982,207 6%
Outpatient Pediatrics 166,116 96,916 2.5% 263,032 2%
Outpatient Mental health 66,119 116 0.0% 66,235 0%
Outpatient Oncology 530,996 336,231 8.6% 867,227 6%
Physiotherapy 438,487 30,921 0.8% 469,408 3%
Accident & Emergency 1,405,749 635,314 16.3% 2,041,063 13%
Labor and Delivery 861,543 548,724 14.1% 1,410,267 9%
Inpatient Pediatrics 729,160 150,448 3.9% 879,608 6%
Inpatient Medical Ward 1,404,766 263,106 6.8% 1,667,872 11%
Inpatient Surgical Ward 1,713,457 450,690 11.6% 2,164,147 14%
Inpatient NICU 600,230 191,012 4.9% 791,242 5%
Inpatient Isolation ward 190,873 27,208 0.7% 218,081 1%
Inpatient Antepartum ward 289,278 74,810 1.9% 364,088 2%
Inpatient Postpartum ward 408,180 89,938 2.3% 498,118 3%
Total 11,371,008 3,896,200 100% 15,267,208 100%
Inpatient cost centers accounted for about 66 percent of costs, while outpatient services accounted forabout 34 percent. Surgical ward was the largest single cost center (14 percent) followed A&E (13percent), by medical ward (11 percent) and L&D (9 percent), all of them inpatient services.
Accident and Emergency (outpatient plus inpatient) accounted for a high proportion of full costs: 13percent. Staff interviews suggest that a large majority of hospital inpatients are admitted through theA&E, which could be causing an inflated cost that does not reflect true patient needs, but data tosupport this claim were unavailable. If true, the Hospital could benefit from determining a more efficientway to admit patients not in need of A&E care.

35


37