Embed Size (px)
Citation preview
Covenant Health
One Hospital’s Approach
to Improving Blood
Management
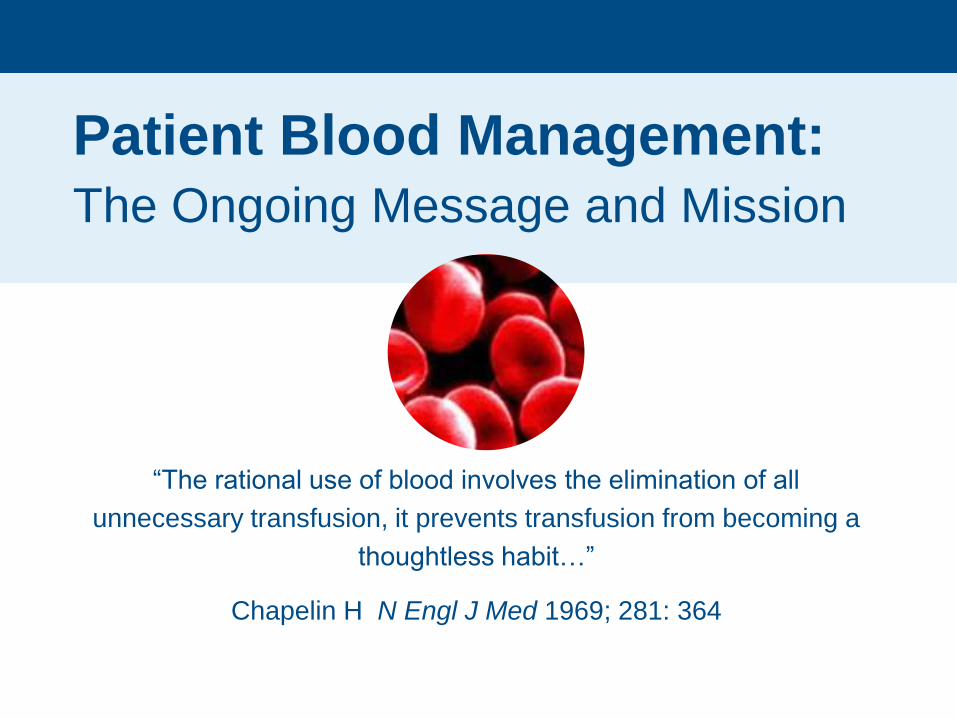
Patient Blood Management:
The Ongoing Message and Mission
“The rational use of blood involves the elimination of all
unnecessary transfusion, it prevents transfusion from becoming a
thoughtless habit…”
Chapelin H N Engl J Med 1969; 281: 364
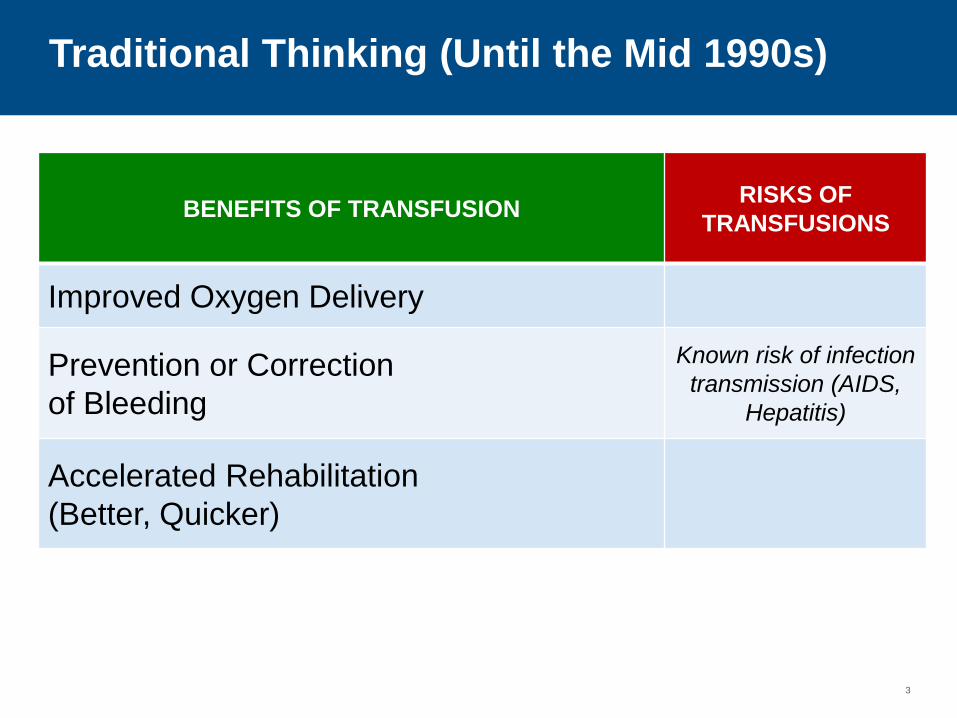
Traditional Thinking (Until the Mid 1990s)
BENEFITS OF TRANSFUSION RISKS OF
TRANSFUSIONS
Improved Oxygen Delivery
Prevention or Correction
of Bleeding
Known risk of infection
transmission (AIDS,
Hepatitis)
Accelerated Rehabilitation
(Better, Quicker)
3
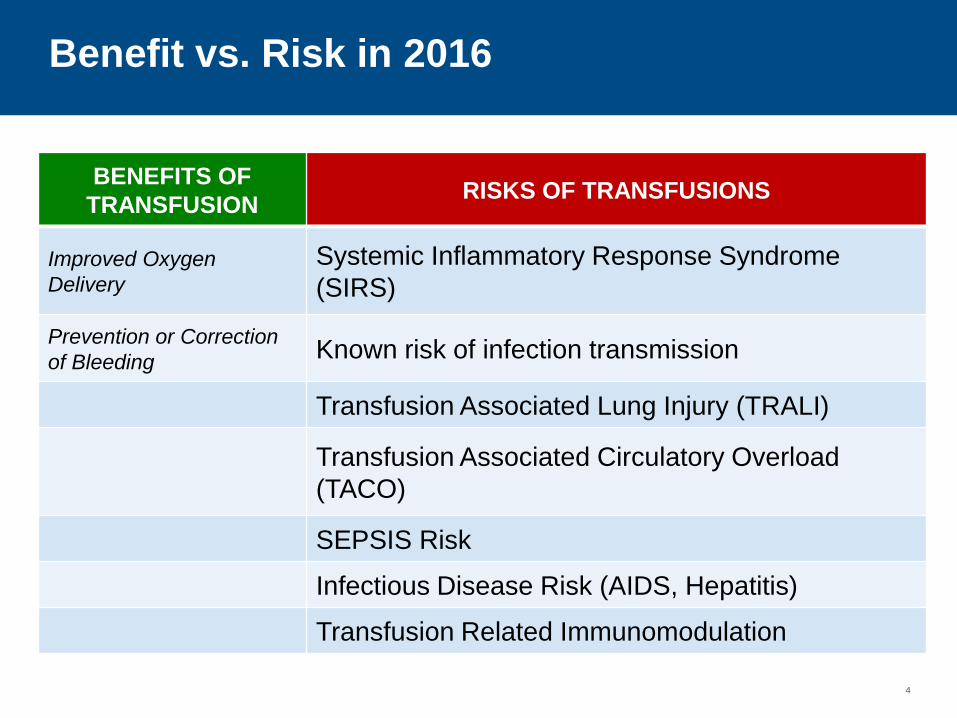
Benefit vs. Risk in 2016
BENEFITS OF
TRANSFUSION RISKS OF TRANSFUSIONS
Improved Oxygen
Delivery
Systemic Inflammatory Response Syndrome
(SIRS)
Prevention or Correction
of Bleeding Known risk of infection transmission
Transfusion Associated Lung Injury (TRALI)
Transfusion Associated Circulatory Overload
(TACO)
SEPSIS Risk
Infectious Disease Risk (AIDS, Hepatitis)
Transfusion Related Immunomodulation
4
Transfusion Requirements in Critical Care
5
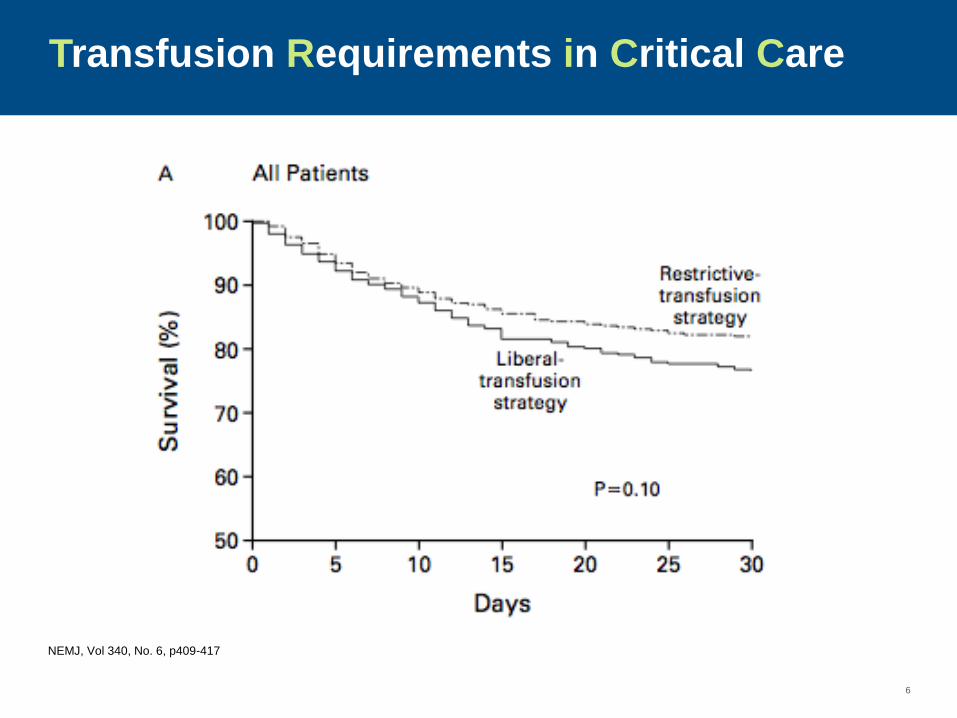
Transfusion Requirements in Critical Care
NEMJ, Vol 340, No. 6, p409-417
6
Transfusion Literature
7
Transfusion Literature
Journal of Vascular Surg. Vol 51, No. 3, Mar 2010. P 616-621.
8
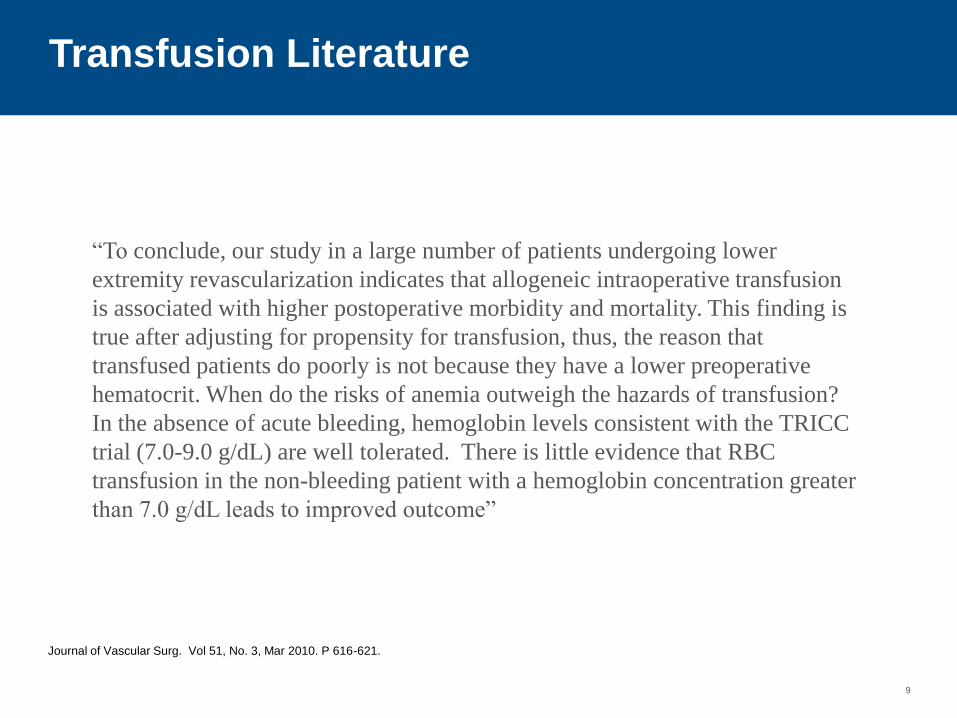
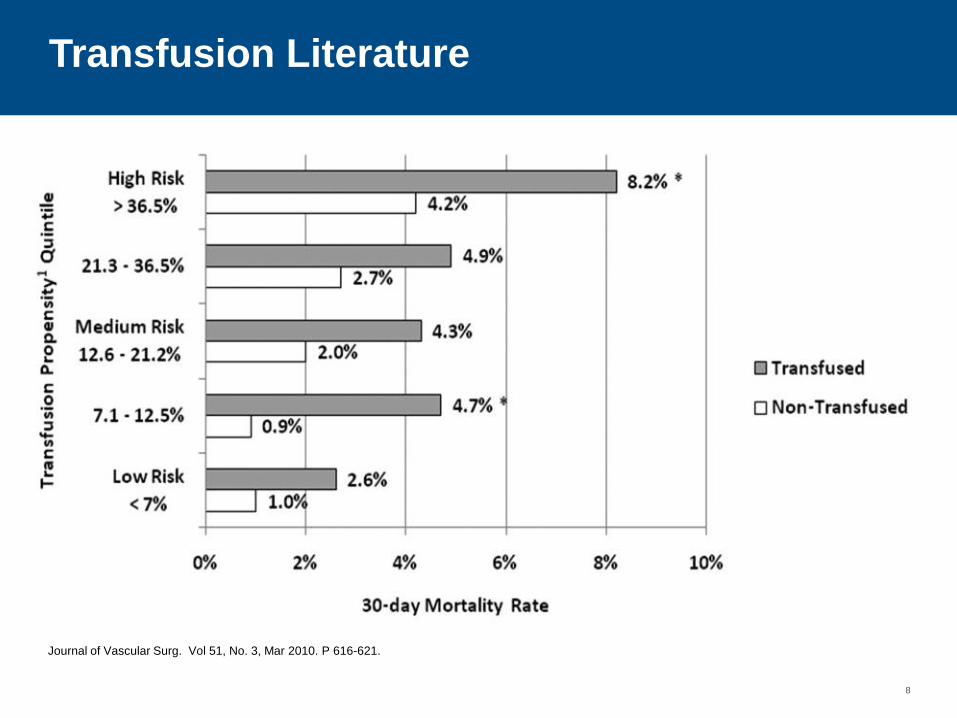
Transfusion Literature
Journal of Vascular Surg. Vol 51, No. 3, Mar 2010. P 616-621.
“To conclude, our study in a large number of patients undergoing lower
extremity revascularization indicates that allogeneic intraoperative transfusion
is associated with higher postoperative morbidity and mortality. This finding is
true after adjusting for propensity for transfusion, thus, the reason that
transfused patients do poorly is not because they have a lower preoperative
hematocrit. When do the risks of anemia outweigh the hazards of transfusion?
In the absence of acute bleeding, hemoglobin levels consistent with the TRICC
trial (7.0-9.0 g/dL) are well tolerated. There is little evidence that RBC
transfusion in the non-bleeding patient with a hemoglobin concentration greater
than 7.0 g/dL leads to improved outcome”
9
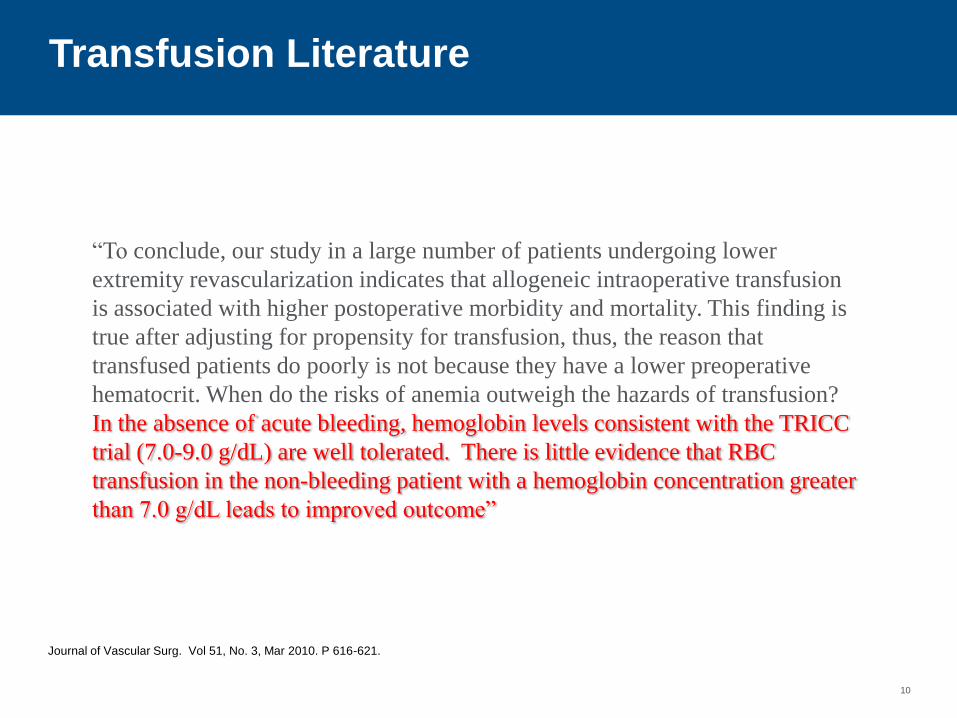
Transfusion Literature
Journal of Vascular Surg. Vol 51, No. 3, Mar 2010. P 616-621.
“To conclude, our study in a large number of patients undergoing lower
extremity revascularization indicates that allogeneic intraoperative transfusion
is associated with higher postoperative morbidity and mortality. This finding is
true after adjusting for propensity for transfusion, thus, the reason that
transfused patients do poorly is not because they have a lower preoperative
hematocrit. When do the risks of anemia outweigh the hazards of transfusion?
In the absence of acute bleeding, hemoglobin levels consistent with the TRICC
trial (7.0-9.0 g/dL) are well tolerated. There is little evidence that RBC
transfusion in the non-bleeding patient with a hemoglobin concentration greater
than 7.0 g/dL leads to improved outcome”
10
© 2016 Mediware Information Systems, Inc. All rights reserved.
Background/Context: History
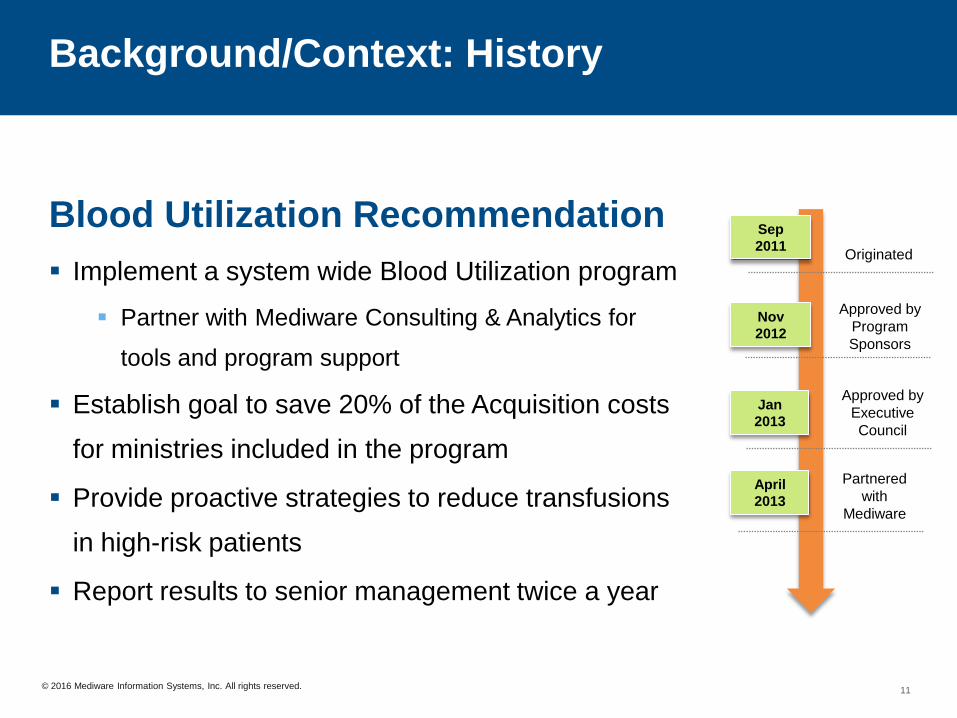
Blood Utilization Recommendation
Implement a system wide Blood Utilization program
Partner with Mediware Consulting & Analytics for
tools and program support
Establish goal to save 20% of the Acquisition costs
for ministries included in the program
Provide proactive strategies to reduce transfusions
in high-risk patients
Report results to senior management twice a year
Sep
2011 Originated
Nov
2012
Approved by
Program
Sponsors
Jan
2013
Approved by
Executive
Council
April
2013
Partnered
with
Mediware
11
© 2016 Mediware Information Systems, Inc. All rights reserved.
Background/Context: History
12
© 2016 Mediware Information Systems, Inc. All rights reserved.
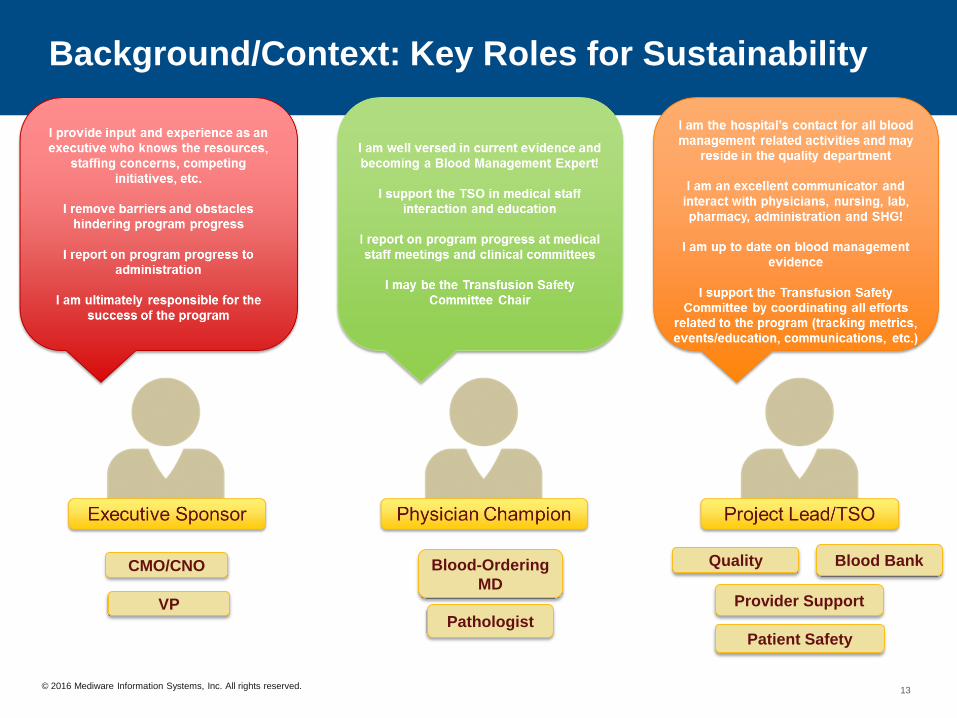
Background/Context: Key Roles for Sustainability
CMO/CNO
VP
Blood-Ordering
MD
Pathologist
Quality Blood Bank
Provider Support
Patient Safety
13
© 2016 Mediware Information Systems, Inc. All rights reserved.
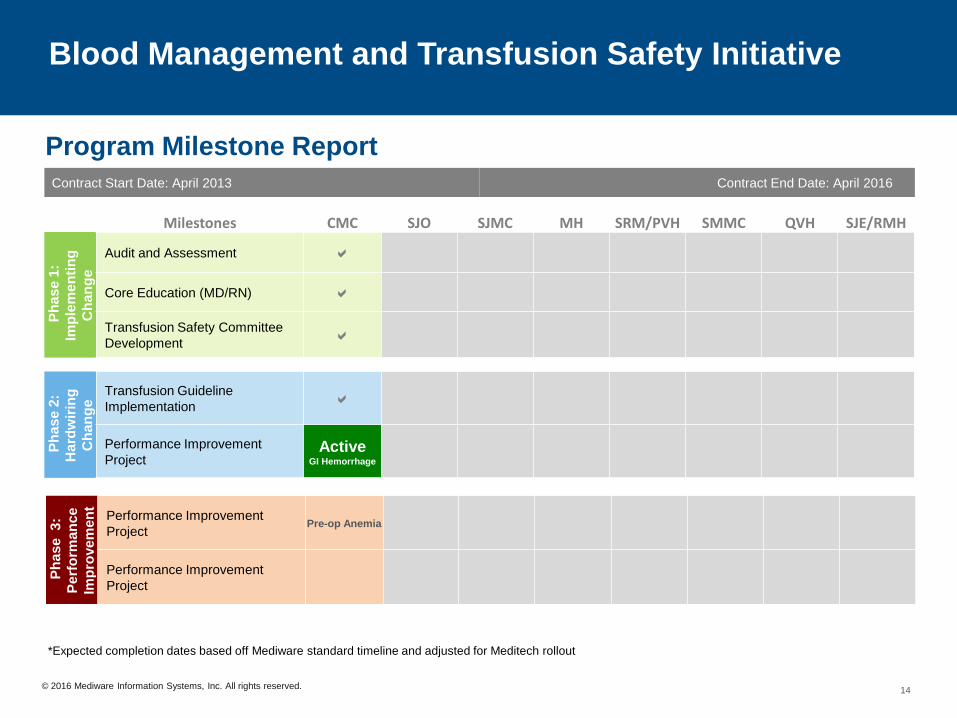
Blood Management and Transfusion Safety Initiative
*Expected completion dates based off Mediware standard timeline and adjusted for Meditech rollout
Milestones CMC SJO SJMC MH SRM/PVH SMMC QVH SJE/RMH
Ph
as
e 1
:
Imp
lem
en
tin
g
Ch
an
ge
Audit and Assessment
Core Education (MD/RN)
Transfusion Safety Committee
Development
Ph
as
e 2
:
Ha
rdw
irin
g
Ch
an
ge
Transfusion Guideline
Implementation
Performance Improvement
Project Active
GI Hemorrhage
Ph
as
e 3
:
Pe
rfo
rma
nc
e
Imp
rove
me
nt
Performance Improvement
Project Pre-op Anemia
Performance Improvement
Project
Program Milestone Report
Contract Start Date: April 2013 Contract End Date: April 2016
14
© 2016 Mediware Information Systems, Inc. All rights reserved.
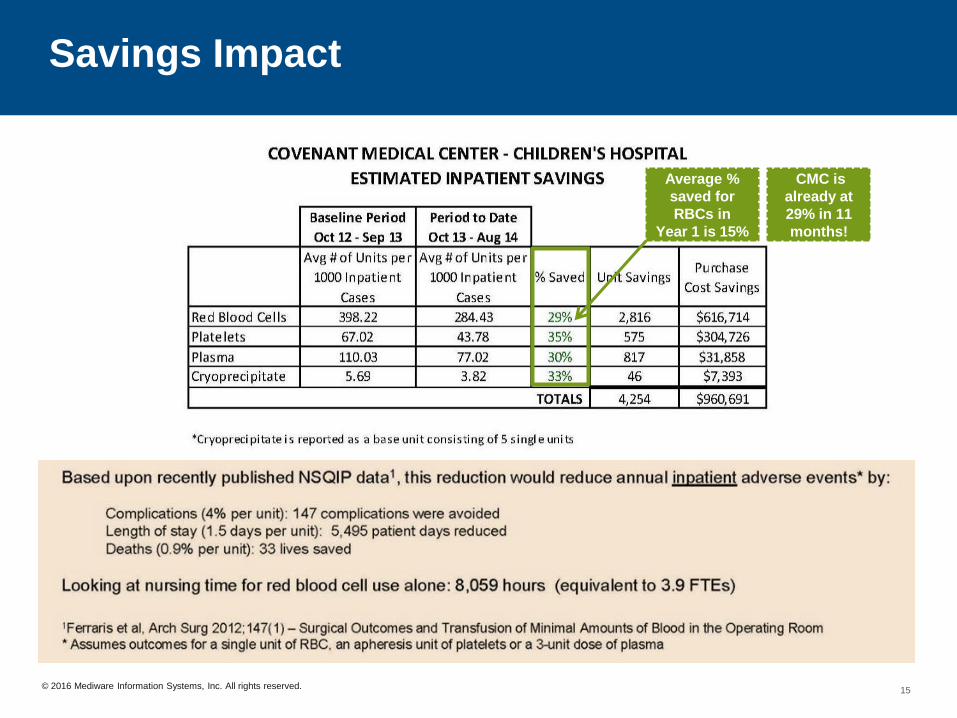
Savings Impact
Average %
saved for
RBCs in
Year 1 is 15%
CMC is
already at
29% in 11
months!
15
© 2016 Mediware Information Systems, Inc. All rights reserved.
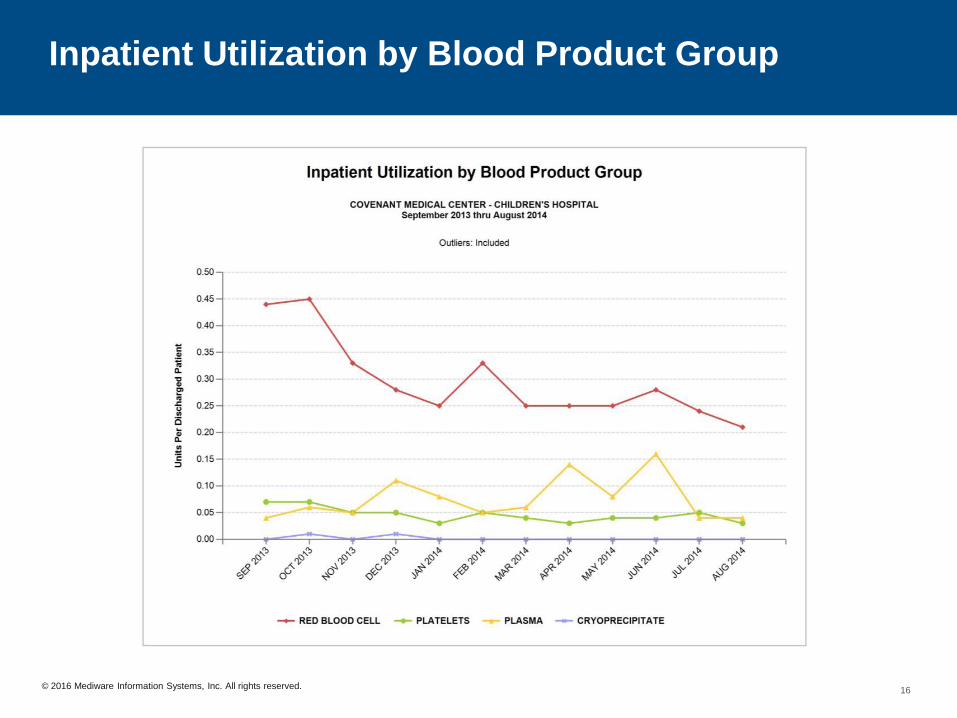
Inpatient Utilization by Blood Product Group
16
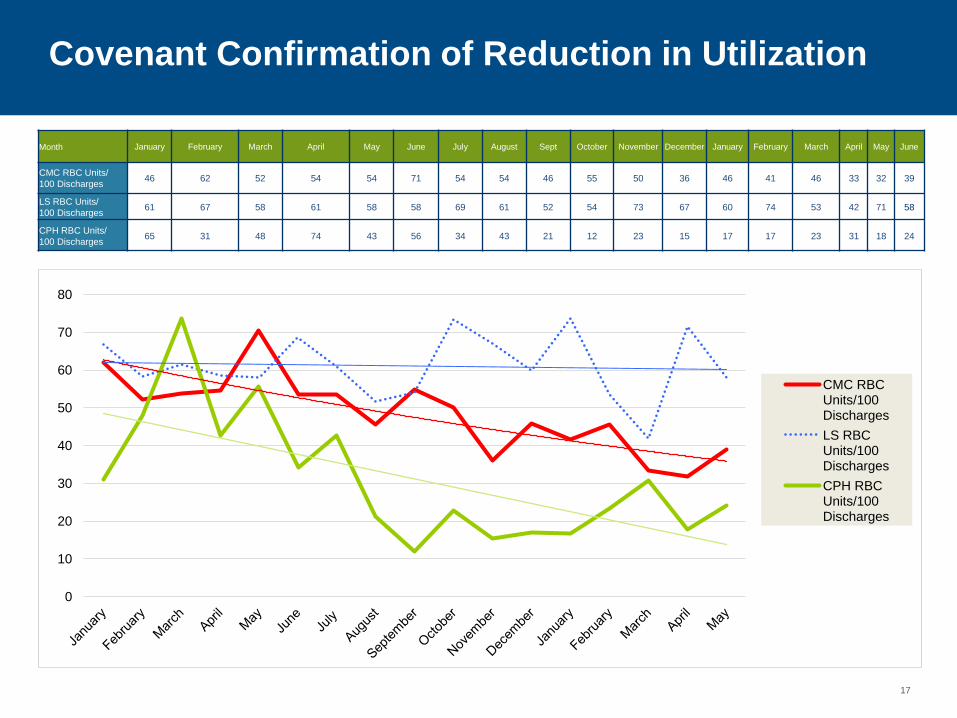
Covenant Confirmation of Reduction in Utilization
0
10
20
30
40
50
60
70
80
CMC RBC Units/100 Discharges
LS RBC Units/100 Discharges
CPH RBC Units/100 Discharges
Month January February March April May June July August Sept October November December January February March April May June
CMC RBC Units/
100 Discharges 46 62 52 54 54 71 54 54 46 55 50 36 46 41 46 33 32 39
LS RBC Units/
100 Discharges 61 67 58 61 58 58 69 61 52 54 73 67 60 74 53 42 71 58
CPH RBC Units/
100 Discharges 65 31 48 74 43 56 34 43 21 12 23 15 17 17 23 31 18 24
17
© 2016 Mediware Information Systems, Inc. All rights reserved.
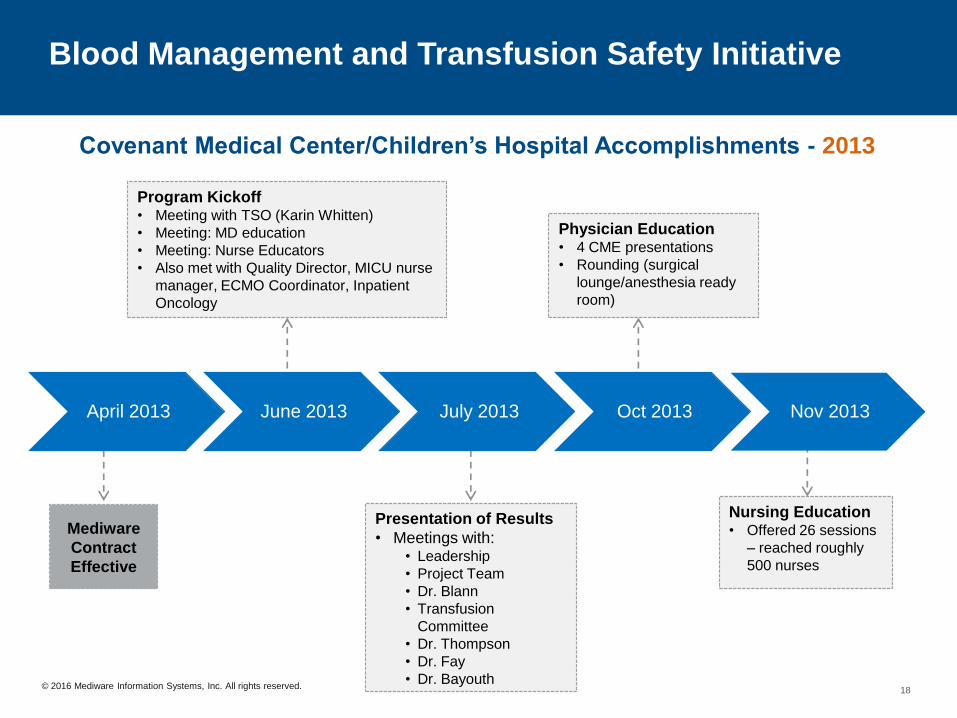
Blood Management and Transfusion Safety Initiative
April 2013 June 2013 July 2013 Oct 2013 Nov 2013
Mediware
Contract
Effective
Program Kickoff • Meeting with TSO (Karin Whitten)
• Meeting: MD education
• Meeting: Nurse Educators
• Also met with Quality Director, MICU nurse
manager, ECMO Coordinator, Inpatient
Oncology
Presentation of Results
• Meetings with: • Leadership
• Project Team
• Dr. Blann
• Transfusion
Committee
• Dr. Thompson
• Dr. Fay
• Dr. Bayouth
Physician Education • 4 CME presentations
• Rounding (surgical
lounge/anesthesia ready
room)
Nursing Education • Offered 26 sessions
– reached roughly
500 nurses
Covenant Medical Center/Children’s Hospital Accomplishments - 2013
18
© 2016 Mediware Information Systems, Inc. All rights reserved.
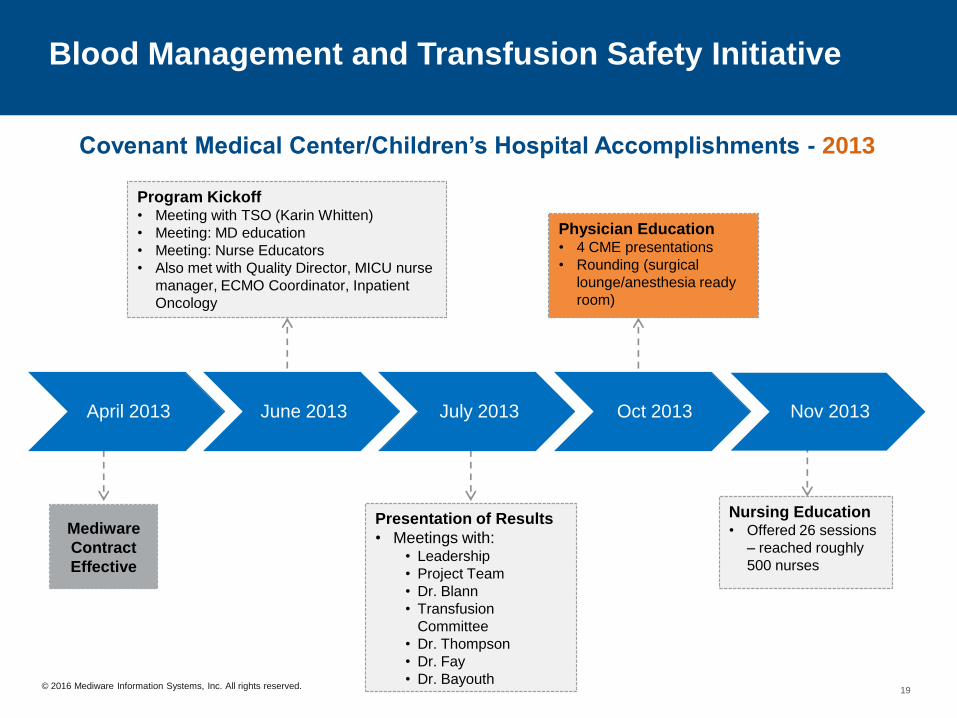
Blood Management and Transfusion Safety Initiative
April 2013 June 2013 July 2013 Oct 2013 Nov 2013
Mediware
Contract
Effective
Program Kickoff • Meeting with TSO (Karin Whitten)
• Meeting: MD education
• Meeting: Nurse Educators
• Also met with Quality Director, MICU nurse
manager, ECMO Coordinator, Inpatient
Oncology
Presentation of Results
• Meetings with: • Leadership
• Project Team
• Dr. Blann
• Transfusion
Committee
• Dr. Thompson
• Dr. Fay
• Dr. Bayouth
Physician Education • 4 CME presentations
• Rounding (surgical
lounge/anesthesia ready
room)
Nursing Education • Offered 26 sessions
– reached roughly
500 nurses
Covenant Medical Center/Children’s Hospital Accomplishments - 2013
19
© 2016 Mediware Information Systems, Inc. All rights reserved.
20
© 2016 Mediware Information Systems, Inc. All rights reserved.
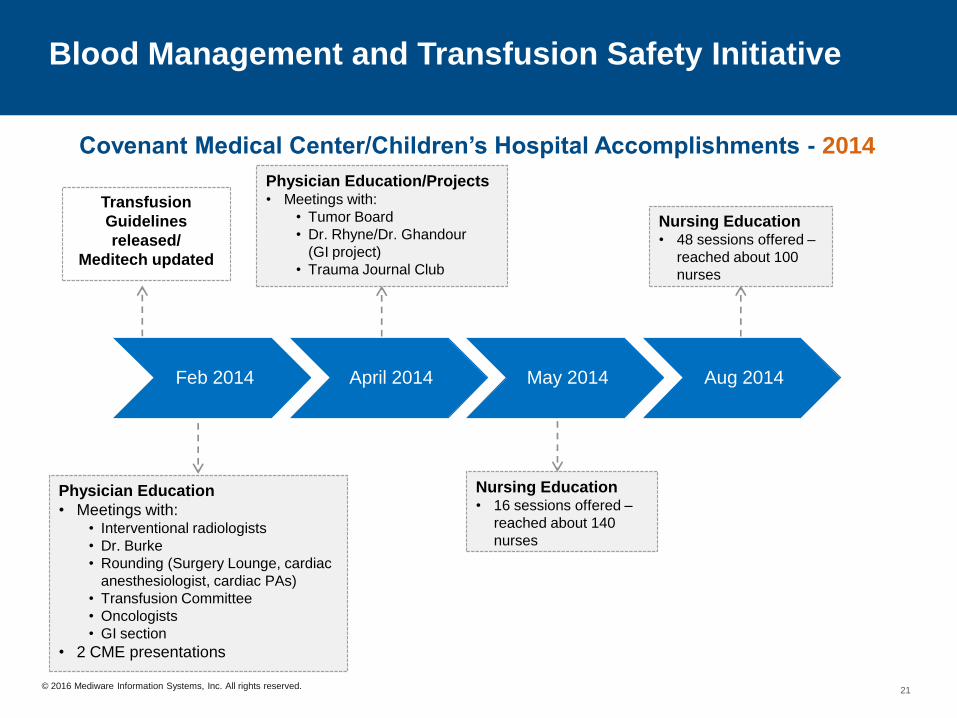
Blood Management and Transfusion Safety Initiative
Covenant Medical Center/Children’s Hospital Accomplishments - 2014
Feb 2014 April 2014 May 2014 Aug 2014
Physician Education
• Meetings with: • Interventional radiologists
• Dr. Burke
• Rounding (Surgery Lounge, cardiac
anesthesiologist, cardiac PAs)
• Transfusion Committee
• Oncologists
• GI section
• 2 CME presentations
Nursing Education • 16 sessions offered –
reached about 140
nurses
Physician Education/Projects • Meetings with:
• Tumor Board
• Dr. Rhyne/Dr. Ghandour
(GI project)
• Trauma Journal Club
Nursing Education • 48 sessions offered –
reached about 100
nurses
Transfusion
Guidelines
released/
Meditech updated
21
© 2016 Mediware Information Systems, Inc. All rights reserved.
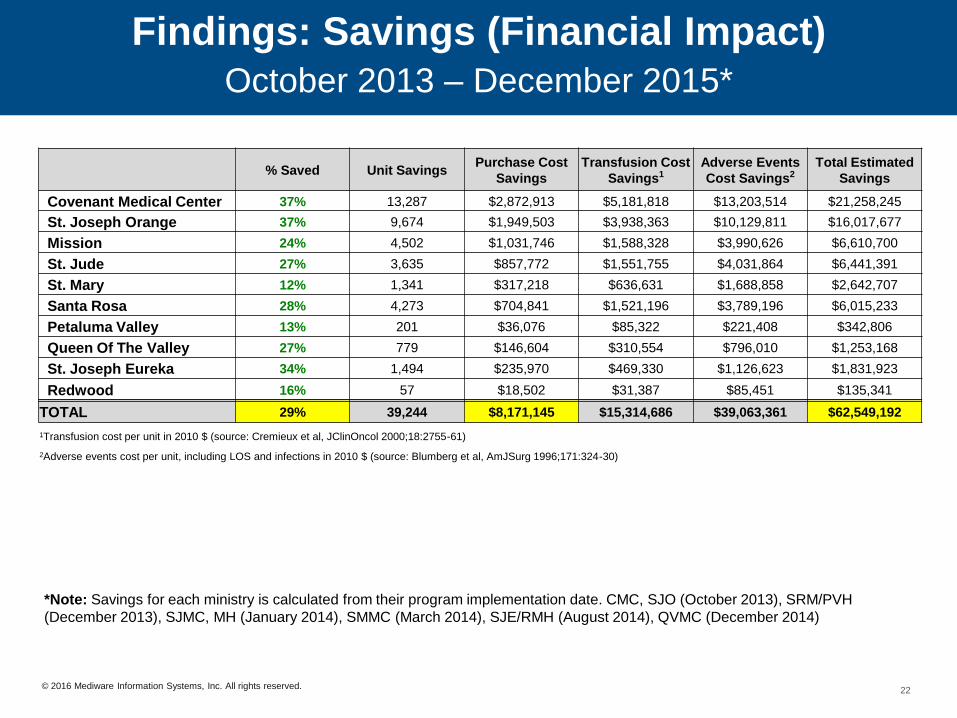
Findings: Savings (Financial Impact)
October 2013 – December 2015*
*Note: Savings for each ministry is calculated from their program implementation date. CMC, SJO (October 2013), SRM/PVH
(December 2013), SJMC, MH (January 2014), SMMC (March 2014), SJE/RMH (August 2014), QVMC (December 2014)
% Saved Unit Savings
Purchase Cost
Savings
Transfusion Cost
Savings1
Adverse Events
Cost Savings2
Total Estimated
Savings
Covenant Medical Center 37% 13,287 $2,872,913 $5,181,818 $13,203,514 $21,258,245
St. Joseph Orange 37% 9,674 $1,949,503 $3,938,363 $10,129,811 $16,017,677
Mission 24% 4,502 $1,031,746 $1,588,328 $3,990,626 $6,610,700
St. Jude 27% 3,635 $857,772 $1,551,755 $4,031,864 $6,441,391
St. Mary 12% 1,341 $317,218 $636,631 $1,688,858 $2,642,707
Santa Rosa 28% 4,273 $704,841 $1,521,196 $3,789,196 $6,015,233
Petaluma Valley 13% 201 $36,076 $85,322 $221,408 $342,806
Queen Of The Valley 27% 779 $146,604 $310,554 $796,010 $1,253,168
St. Joseph Eureka 34% 1,494 $235,970 $469,330 $1,126,623 $1,831,923
Redwood 16% 57 $18,502 $31,387 $85,451 $135,341
TOTAL 29% 39,244 $8,171,145 $15,314,686 $39,063,361 $62,549,192
1Transfusion cost per unit in 2010 $ (source: Cremieux et al, JClinOncol 2000;18:2755-61)
2Adverse events cost per unit, including LOS and infections in 2010 $ (source: Blumberg et al, AmJSurg 1996;171:324-30)
22
© 2016 Mediware Information Systems, Inc. All rights reserved.
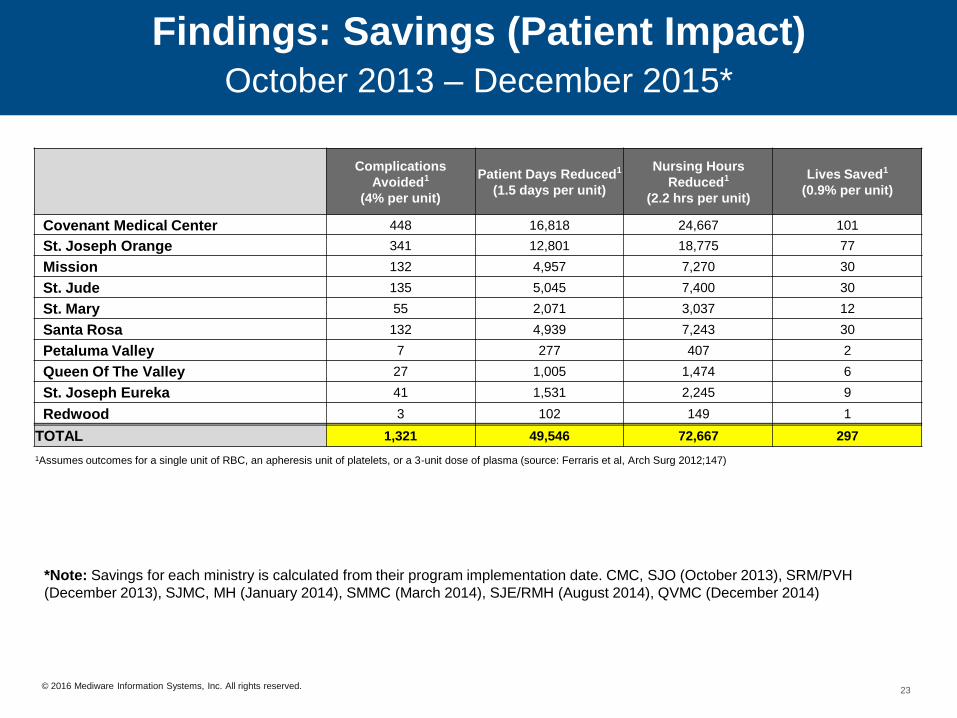
Findings: Savings (Patient Impact)
October 2013 – December 2015*
Complications
Avoided1
(4% per unit)
Patient Days Reduced1
(1.5 days per unit)
Nursing Hours
Reduced1
(2.2 hrs per unit)
Lives Saved1
(0.9% per unit)
Covenant Medical Center 448 16,818 24,667 101
St. Joseph Orange 341 12,801 18,775 77
Mission 132 4,957 7,270 30
St. Jude 135 5,045 7,400 30
St. Mary 55 2,071 3,037 12
Santa Rosa 132 4,939 7,243 30
Petaluma Valley 7 277 407 2
Queen Of The Valley 27 1,005 1,474 6
St. Joseph Eureka 41 1,531 2,245 9
Redwood 3 102 149 1
TOTAL 1,321 49,546 72,667 297
1Assumes outcomes for a single unit of RBC, an apheresis unit of platelets, or a 3-unit dose of plasma (source: Ferraris et al, Arch Surg 2012;147)
*Note: Savings for each ministry is calculated from their program implementation date. CMC, SJO (October 2013), SRM/PVH
(December 2013), SJMC, MH (January 2014), SMMC (March 2014), SJE/RMH (August 2014), QVMC (December 2014)
23
© 2016 Mediware Information Systems, Inc. All rights reserved.
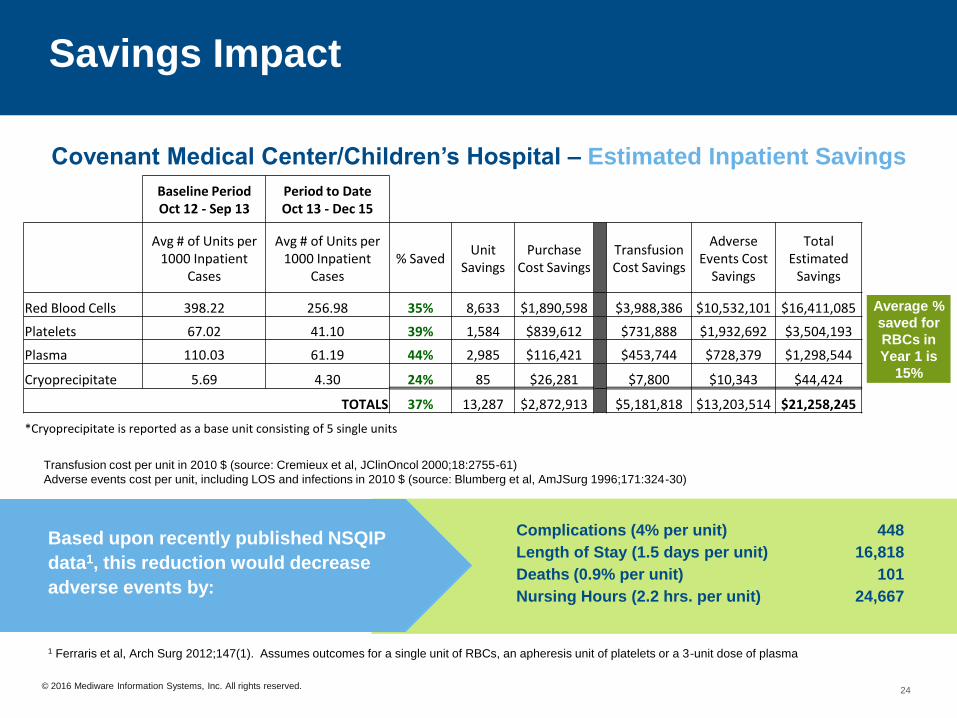
Savings Impact
1 Ferraris et al, Arch Surg 2012;147(1). Assumes outcomes for a single unit of RBCs, an apheresis unit of platelets or a 3-unit dose of plasma
Average %
saved for
RBCs in
Year 1 is
15%
Covenant Medical Center/Children’s Hospital – Estimated Inpatient Savings
Transfusion cost per unit in 2010 $ (source: Cremieux et al, JClinOncol 2000;18:2755-61)
Adverse events cost per unit, including LOS and infections in 2010 $ (source: Blumberg et al, AmJSurg 1996;171:324-30)
Based upon recently published NSQIP
data1, this reduction would decrease
adverse events by:
Complications (4% per unit) 448
Length of Stay (1.5 days per unit) 16,818
Deaths (0.9% per unit) 101
Nursing Hours (2.2 hrs. per unit) 24,667
Baseline Period Oct 12 - Sep 13
Period to Date Oct 13 - Dec 15
Avg # of Units per 1000 Inpatient
Cases
Avg # of Units per 1000 Inpatient
Cases % Saved
Unit Savings
Purchase Cost Savings
Transfusion Cost Savings
Adverse Events Cost
Savings
Total Estimated
Savings
Red Blood Cells 398.22 256.98 35% 8,633 $1,890,598 $3,988,386 $10,532,101 $16,411,085
Platelets 67.02 41.10 39% 1,584 $839,612 $731,888 $1,932,692 $3,504,193
Plasma 110.03 61.19 44% 2,985 $116,421 $453,744 $728,379 $1,298,544
Cryoprecipitate 5.69 4.30 24% 85 $26,281 $7,800 $10,343 $44,424
TOTALS 37% 13,287 $2,872,913 $5,181,818 $13,203,514 $21,258,245
*Cryoprecipitate is reported as a base unit consisting of 5 single units
24
© 2016 Mediware Information Systems, Inc. All rights reserved.
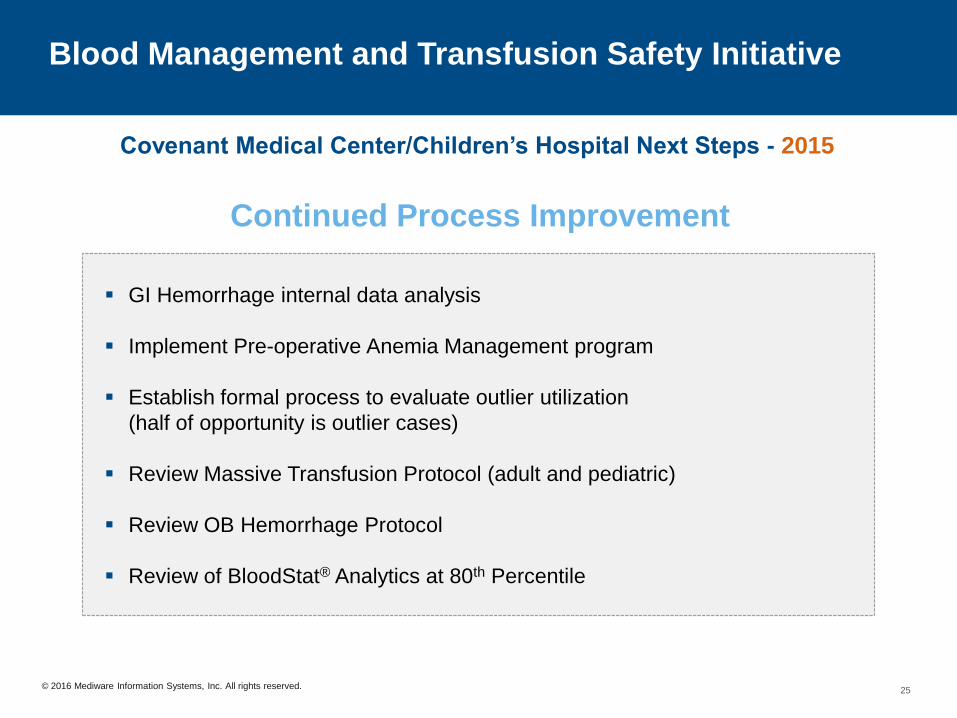
Blood Management and Transfusion Safety Initiative
Covenant Medical Center/Children’s Hospital Next Steps - 2015
GI Hemorrhage internal data analysis
Implement Pre-operative Anemia Management program
Establish formal process to evaluate outlier utilization
(half of opportunity is outlier cases)
Review Massive Transfusion Protocol (adult and pediatric)
Review OB Hemorrhage Protocol
Review of BloodStat® Analytics at 80th Percentile
Continued Process Improvement
25
© 2016 Mediware Information Systems, Inc. All rights reserved.
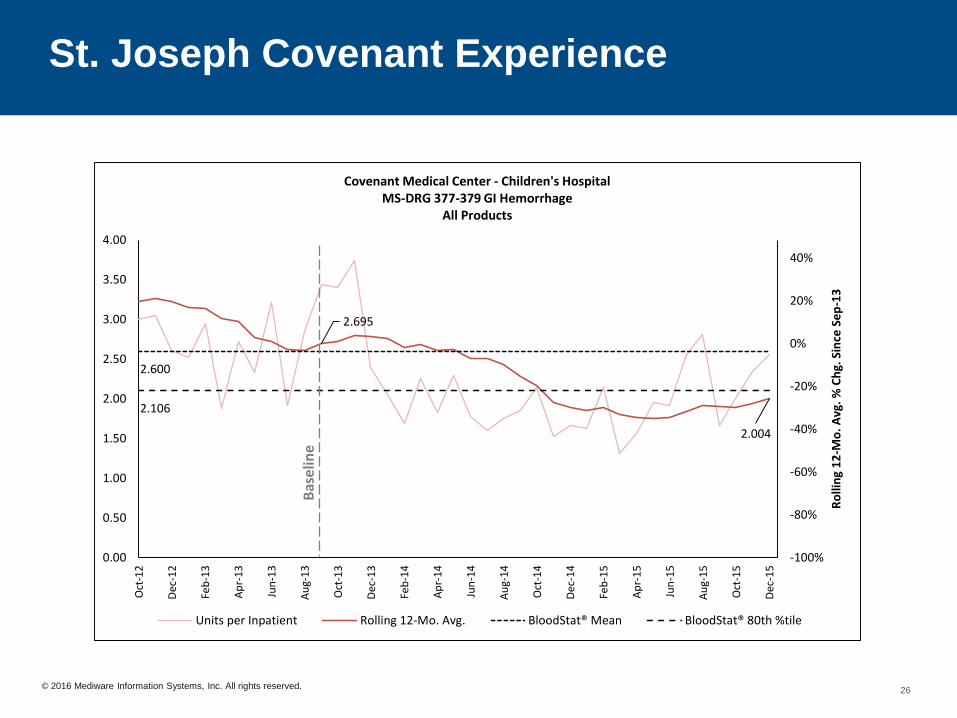
St. Joseph Covenant Experience
2.695
2.004
2.600
2.106
-100%
-80%
-60%
-40%
-20%
0%
20%
40%
0.00
0.50
1.00
1.50
2.00
2.50
3.00
3.50
4.00
Oct
-12
Dec
-12
Feb
-13
Ap
r-1
3
Jun
-13
Au
g-1
3
Oct
-13
Dec
-13
Feb
-14
Ap
r-1
4
Jun
-14
Au
g-1
4
Oct
-14
Dec
-14
Feb
-15
Ap
r-1
5
Jun
-15
Au
g-1
5
Oct
-15
Dec
-15
Ro
llin
g 1
2-M
o.
Avg
. %
Ch
g. S
ince
Se
p-1
3
Covenant Medical Center - Children's HospitalMS-DRG 377-379 GI Hemorrhage
All Products
Units per Inpatient Rolling 12-Mo. Avg. BloodStat® Mean BloodStat® 80th %tile
Bas
elin
e
26
Future Challenges:
Correction of Pre-Admission
and Pre-Operative Anemia
Sustainment of Success
in Reduction of Blood
Product Utilization
27
One Hospital’s
Approach to
Improving Blood
Management
Covenant Health
Thank You For
Allowing Me To
Share This
Success
Covenant Health