Embed Size (px)
Citation preview
South East Asia’s Pharmerging Landscape
IBC Asia South East Asia Pharmaceutical Forum
Sep 2012
Singapore
Over the next 30 minutes we will touch briefly upon…
• The “Asian” Pharmerging Markets and growth opportunities therein
• Dynamics & trends that make South East Asia a unique and challenging environment
• Key success factors in South East Asia
2
• Q&A
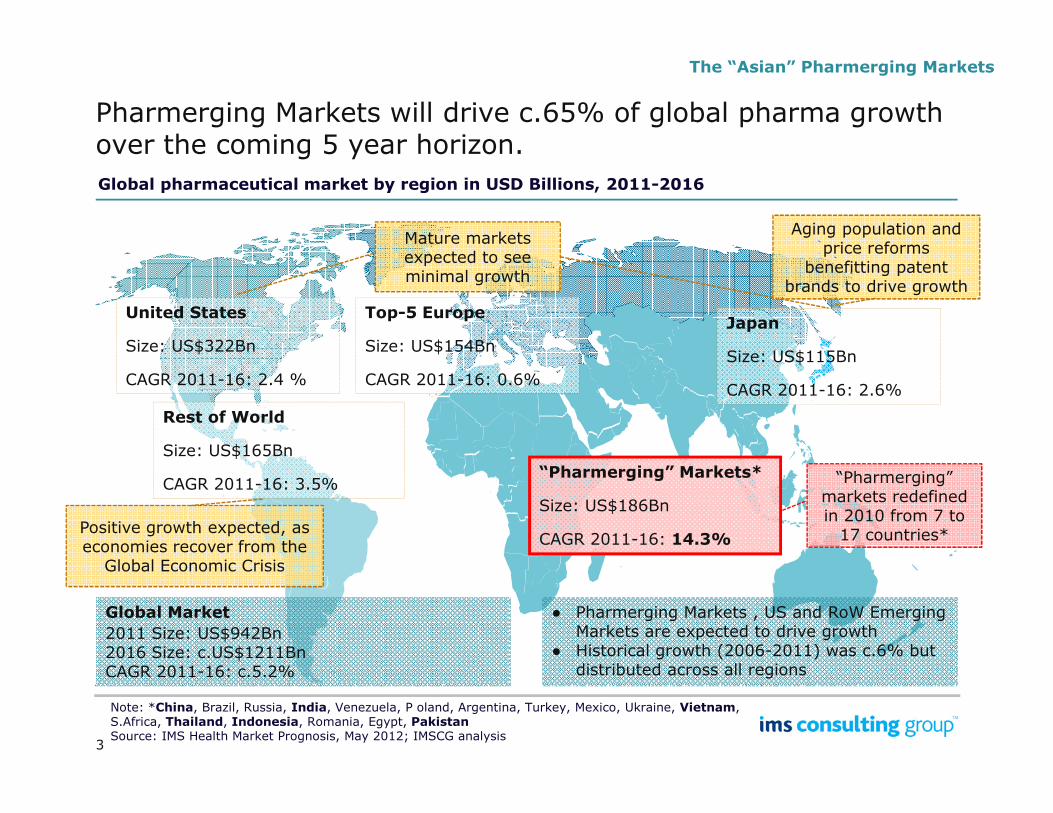
Pharmerging Markets will drive c.65% of global pharma growth over the coming 5 year horizon.
The “Asian” Pharmerging Markets
Global pharmaceutical market by region in USD Billions, 2011-2016
United States
Size: US$322Bn
CAGR 2011-16: 2.4 %
Japan
Size: US$115Bn
CAGR 2011-16: 2.6%
Top-5 Europe
Size: US$154Bn
CAGR 2011-16: 0.6%
Rest of World
Mature markets expected to see minimal growth
Aging population and price reforms
benefitting patent brands to drive growth
3
Note: *China, Brazil, Russia, India, Venezuela, P oland, Argentina, Turkey, Mexico, Ukraine, Vietnam, S.Africa, Thailand, Indonesia, Romania, Egypt, PakistanSource: IMS Health Market Prognosis, May 2012; IMSCG analysis
“Pharmerging” Markets*
Size: US$186Bn
CAGR 2011-16: 14.3%
Rest of World
Size: US$165Bn
CAGR 2011-16: 3.5% “Pharmerging”markets redefined in 2010 from 7 to 17 countries*Positive growth expected, as
economies recover from the Global Economic Crisis
Global Market
2011 Size: US$942Bn2016 Size: c.US$1211BnCAGR 2011-16: c.5.2%
● Pharmerging Markets , US and RoW Emerging Markets are expected to drive growth
● Historical growth (2006-2011) was c.6% but distributed across all regions
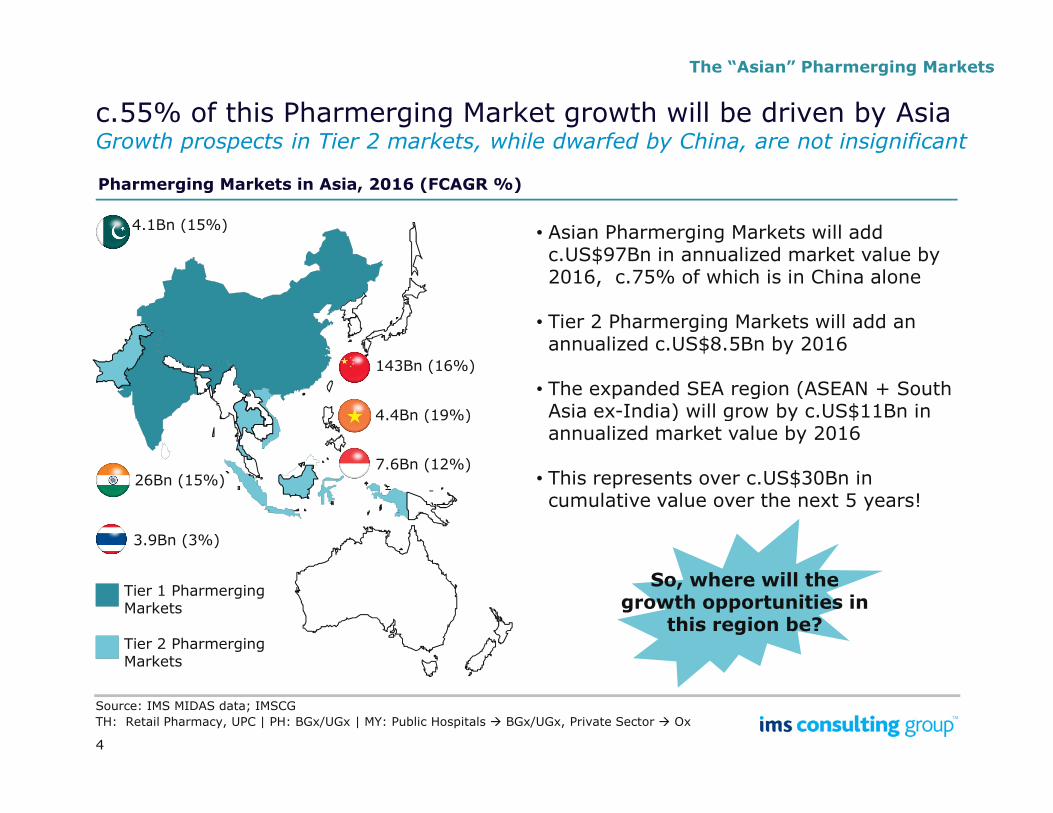
c.55% of this Pharmerging Market growth will be driven by AsiaGrowth prospects in Tier 2 markets, while dwarfed by China, are not insignificant
The “Asian” Pharmerging Markets
Pharmerging Markets in Asia, 2016 (FCAGR %)
• Asian Pharmerging Markets will add c.US$97Bn in annualized market value by 2016, c.75% of which is in China alone
• Tier 2 Pharmerging Markets will add an annualized c.US$8.5Bn by 2016
• The expanded SEA region (ASEAN + South Asia ex-India) will grow by c.US$11Bn in
143Bn (16%)
4.1Bn (15%)
4.4Bn (19%)
4
Tier 1 PharmergingMarkets
Source: IMS MIDAS data; IMSCG
Asia ex-India) will grow by c.US$11Bn in annualized market value by 2016
• This represents over c.US$30Bn in cumulative value over the next 5 years!
Tier 2 PharmergingMarkets
26Bn (15%)
3.9Bn (3%)
7.6Bn (12%)
4.4Bn (19%)
TH: Retail Pharmacy, UPC | PH: BGx/UGx | MY: Public Hospitals � BGx/UGx, Private Sector � Ox
So, where will the growth opportunities in
this region be?
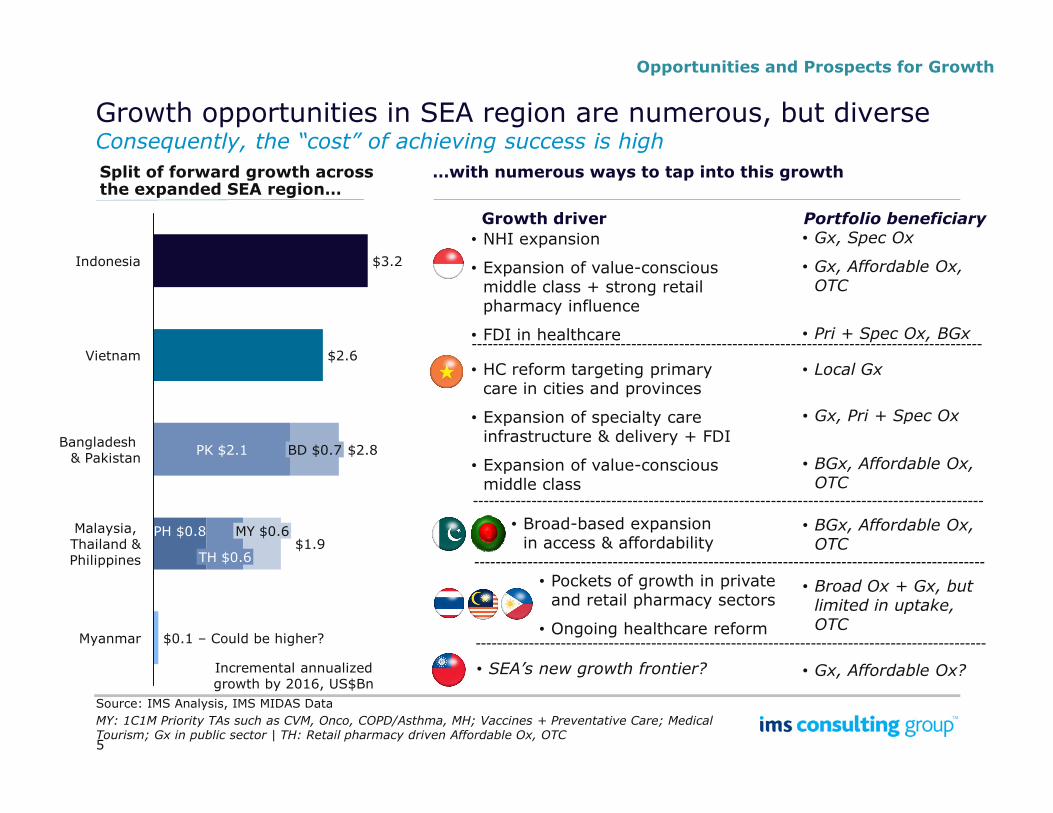
Growth opportunities in SEA region are numerous, but diverseConsequently, the “cost” of achieving success is high
Opportunities and Prospects for Growth
…with numerous ways to tap into this growthSplit of forward growth across the expanded SEA region…
• NHI expansion
• Expansion of value-conscious middle class + strong retail pharmacy influence
• FDI in healthcare
Growth driver Portfolio beneficiary
• HC reform targeting primary care in cities and provinces
Expansion of specialty care
• Gx, Spec Ox
• Gx, Affordable Ox, OTC
• Pri + Spec Ox, BGx
Vietnam $2.6
Indonesia $3.2
• Local Gx
• Gx, Pri + Spec Ox
5
• Expansion of specialty care infrastructure & delivery + FDI
• Expansion of value-conscious middle class
• Broad-based expansion in access & affordability
• Pockets of growth in private and retail pharmacy sectors
• Ongoing healthcare reform
• SEA’s new growth frontier?
$1.9TH $0.6
Malaysia, Thailand &Philippines
PK $2.1Bangladesh & Pakistan
Myanmar
MY $0.6
$0.1 – Could be higher?
$2.8
PH $0.8
BD $0.7
Incremental annualized growth by 2016, US$Bn
Source: IMS Analysis, IMS MIDAS Data
• Gx, Pri + Spec Ox
• BGx, Affordable Ox, OTC
• BGx, Affordable Ox, OTC
• Broad Ox + Gx, but limited in uptake, OTC
MY: 1C1M Priority TAs such as CVM, Onco, COPD/Asthma, MH; Vaccines + Preventative Care; Medical Tourism; Gx in public sector | TH: Retail pharmacy driven Affordable Ox, OTC
• Gx, Affordable Ox?
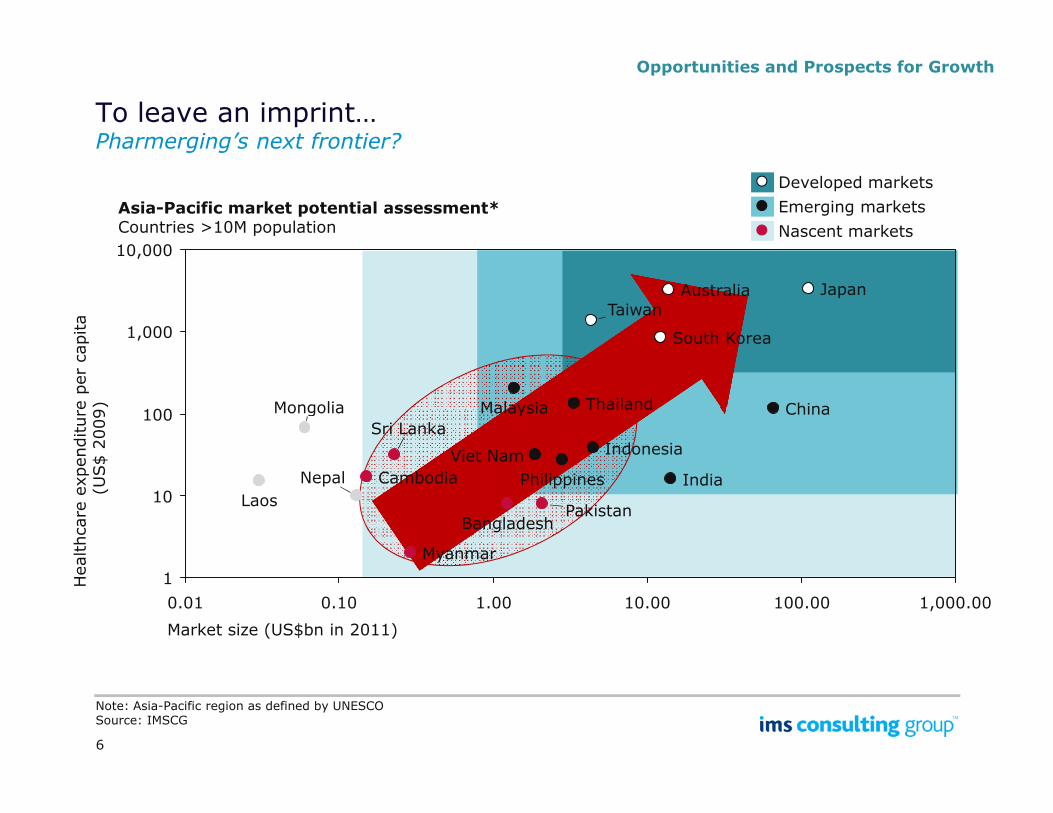
To leave an imprint…Pharmerging’s next frontier?
Asia-Pacific market potential assessment*Countries >10M population Nascent markets
Emerging markets
Developed markets
Healthcare expenditure per capita
(US$ 2009)
10,000
1,000
100 Mongolia ThailandMalaysia China
Taiwan
South Korea
JapanAustralia
Opportunities and Prospects for Growth
6
Note: Asia-Pacific region as defined by UNESCOSource: IMSCG
Healthcare expenditure per capita
(US$ 2009)
100
10
1
Market size (US$bn in 2011)
1,000.00100.0010.001.000.100.01
Nepal
Mongolia
Laos
Sri Lanka
Pakistan
Myanmar
Cambodia
Bangladesh
Viet Nam
Thailand
Philippines
Malaysia
Indonesia
India
China
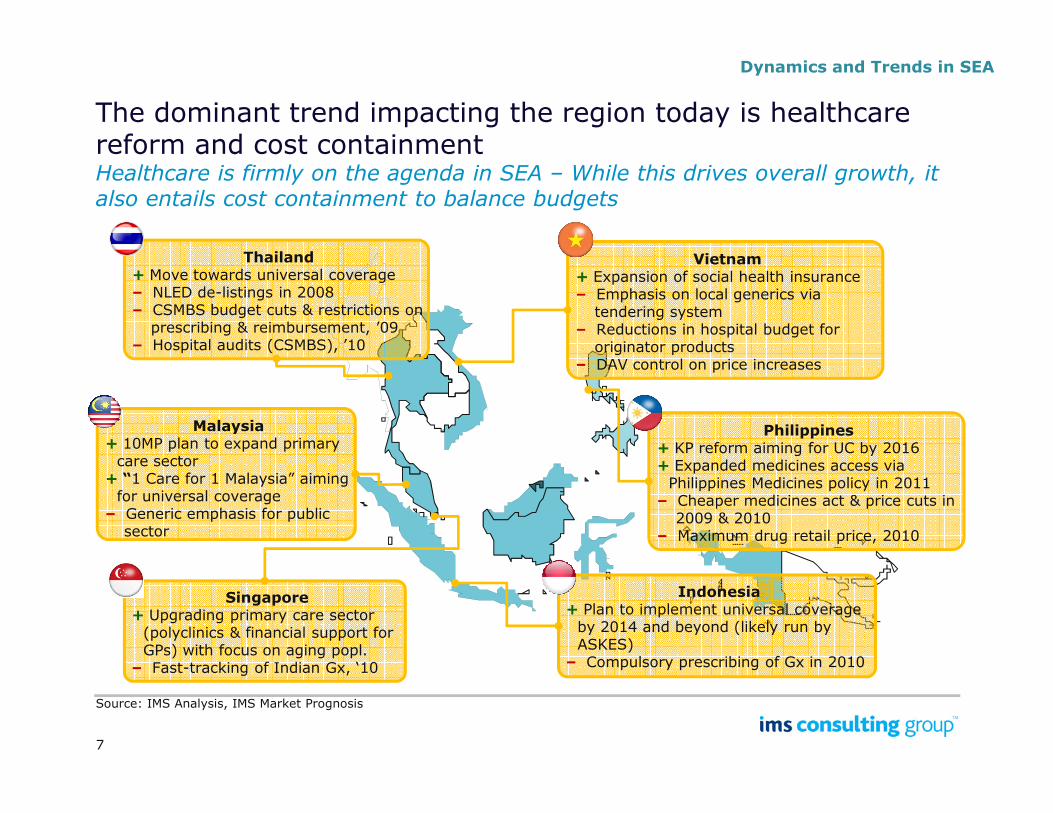
The dominant trend impacting the region today is healthcare reform and cost containment Healthcare is firmly on the agenda in SEA – While this drives overall growth, it also entails cost containment to balance budgets
Dynamics and Trends in SEA
Thailand+ Move towards universal coverage – NLED de-listings in 2008– CSMBS budget cuts & restrictions on
prescribing & reimbursement, ’09– Hospital audits (CSMBS), ’10
Vietnam+ Expansion of social health insurance– Emphasis on local generics via
tendering system– Reductions in hospital budget for
originator products– DAV control on price increases
7
Malaysia+ 10MP plan to expand primary care sector+ “1 Care for 1 Malaysia” aiming for universal coverage– Generic emphasis for public
sector
Indonesia + Plan to implement universal coverage by 2014 and beyond (likely run by ASKES)– Compulsory prescribing of Gx in 2010
Singapore+ Upgrading primary care sector (polyclinics & financial support for GPs) with focus on aging popl.– Fast-tracking of Indian Gx, ‘10
Philippines+ KP reform aiming for UC by 2016+ Expanded medicines access via Philippines Medicines policy in 2011– Cheaper medicines act & price cuts in
2009 & 2010– Maximum drug retail price, 2010
Source: IMS Analysis, IMS Market Prognosis
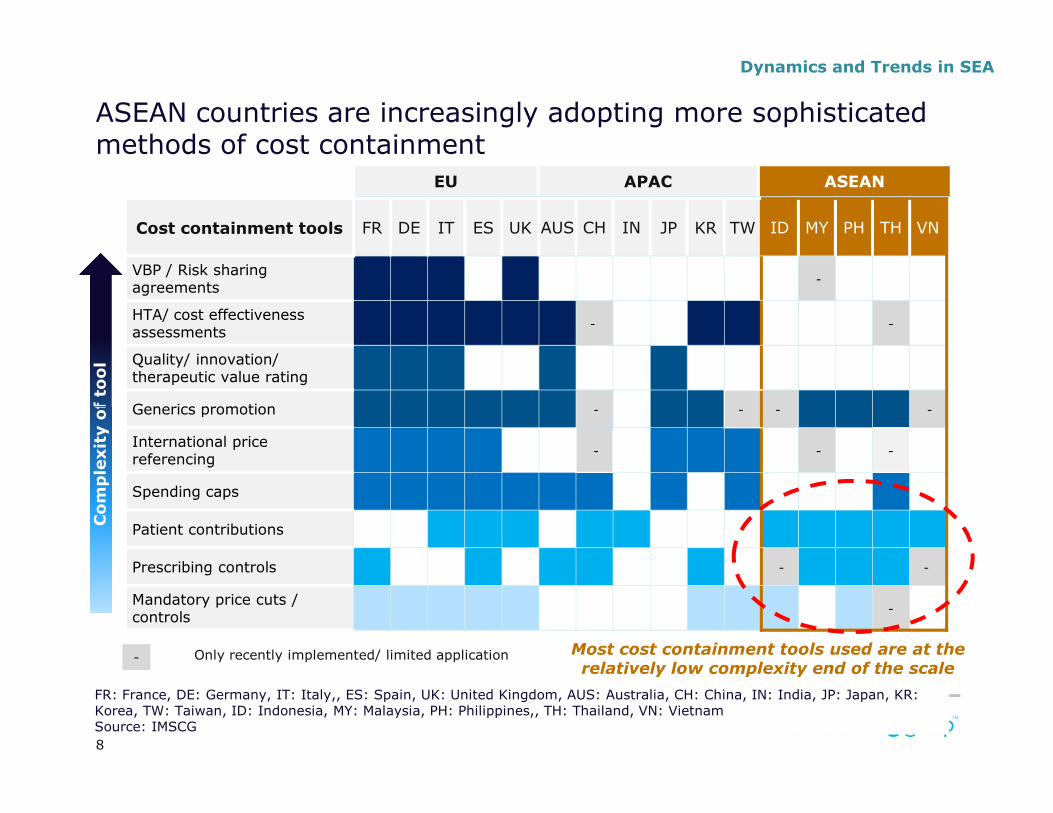
Cost containment tools FR DE IT ES UK AUS CH IN JP KR TW ID MY PH TH VN
VBP / Risk sharing agreements
-
HTA/ cost effectiveness assessments
- -
Quality/ innovation/ therapeutic value rating
Generics promotion - - - -
EU APAC ASEAN
of tool
ASEAN countries are increasingly adopting more sophisticated methods of cost containment
Dynamics and Trends in SEA
8
Generics promotion - - - -
International price referencing
- - -
Spending caps
Patient contributions
Prescribing controls - -
Mandatory price cuts / controls
-
Only recently implemented/ limited application
Complexity of tool
FR: France, DE: Germany, IT: Italy,, ES: Spain, UK: United Kingdom, AUS: Australia, CH: China, IN: India, JP: Japan, KR: Korea, TW: Taiwan, ID: Indonesia, MY: Malaysia, PH: Philippines,, TH: Thailand, VN: VietnamSource: IMSCG
Most cost containment tools used are at the relatively low complexity end of the scale
-
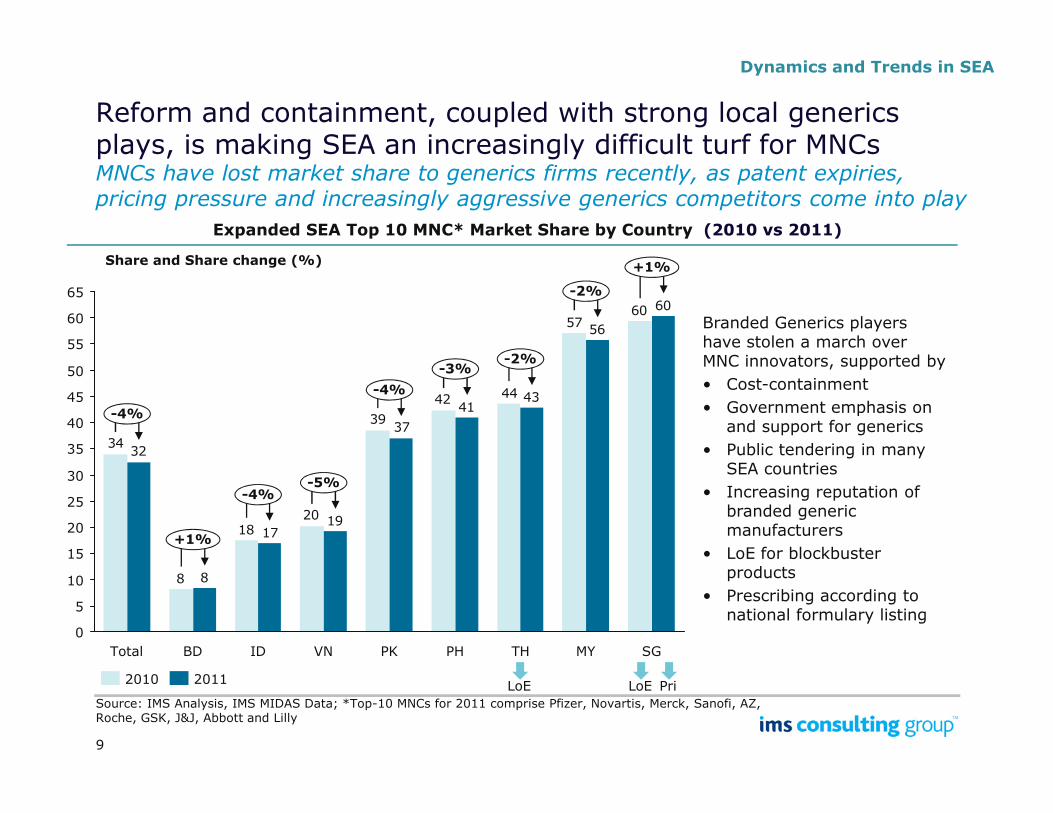
Reform and containment, coupled with strong local generics plays, is making SEA an increasingly difficult turf for MNCsMNCs have lost market share to generics firms recently, as patent expiries, pricing pressure and increasingly aggressive generics competitors come into play
Dynamics and Trends in SEA
6057
4442
60
56
4341
45
65
60
55
50
-4%
-2%-3%
-4%
-2%
+1%
Expanded SEA Top 10 MNC* Market Share by Country (2010 vs 2011)
Share and Share change (%)
Branded Generics players have stolen a march over MNC innovators, supported by
• Cost-containment
• Government emphasis on
9
39
2018
8
34
41
37
1917
8
32
25
20
15
10
40
35
PKVNIDTotal BD SG
30
0
-4%
-5%
5
+1%
MYTHPH
-4%
20112010
Source: IMS Analysis, IMS MIDAS Data; *Top-10 MNCs for 2011 comprise Pfizer, Novartis, Merck, Sanofi, AZ, Roche, GSK, J&J, Abbott and Lilly
LoE LoE Pri
• Government emphasis on and support for generics
• Public tendering in many SEA countries
• Increasing reputation of branded generic manufacturers
• LoE for blockbuster products
• Prescribing according to national formulary listing
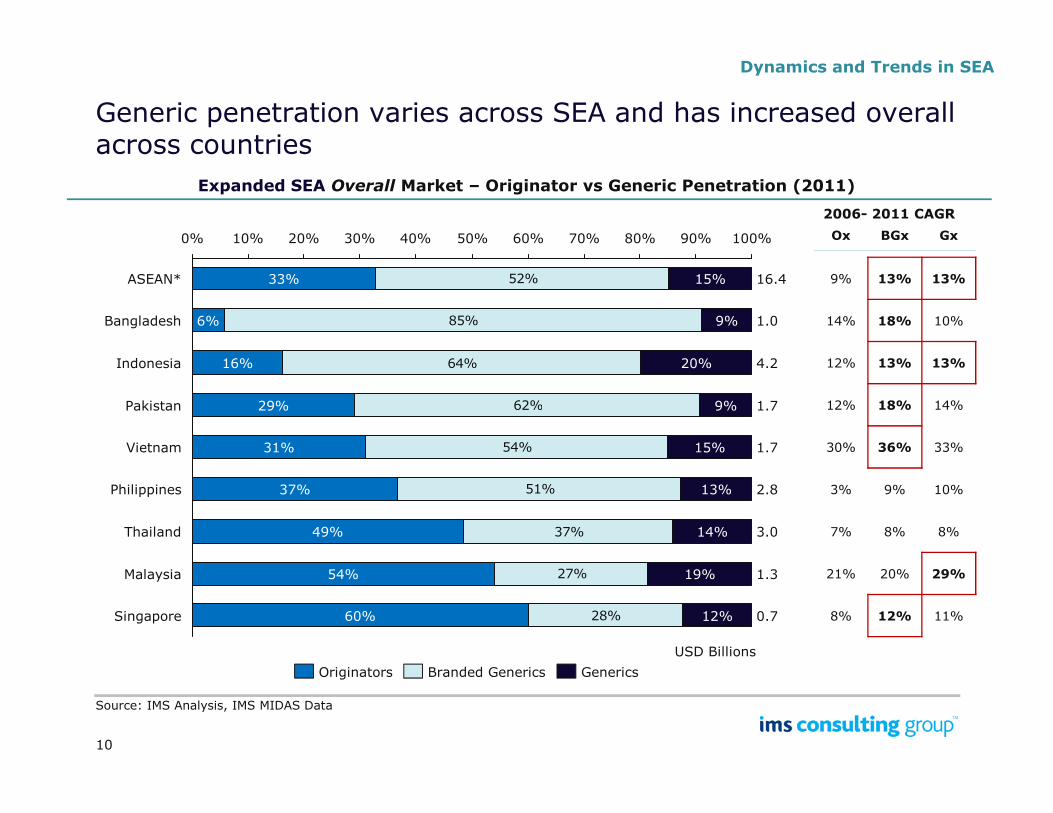
Generic penetration varies across SEA and has increased overall across countries
52%
85%
64%
62%Pakistan 1.729% 9%
Indonesia 4.216% 20%
Bangladesh 1.06% 9%
100%90%80%70%60%50%40%30%20%10%0%
ASEAN* 16.433% 15%
Expanded SEA Overall Market – Originator vs Generic Penetration (2011)
Ox BGx Gx
9% 13% 13%
14% 18% 10%
12% 13% 13%
12% 18% 14%
2006- 2011 CAGR
Dynamics and Trends in SEA
10
62%
54%
51%
37%
27%
28%
2.837% 13%
Vietnam 1.731% 15%
Pakistan 1.729% 9%
Malaysia 1.354% 19%
Thailand 3.049% 14%
Philippines
0.760%Singapore 12%
Originators Branded Generics Generics
USD Billions
Source: IMS Analysis, IMS MIDAS Data
12% 18% 14%
30% 36% 33%
3% 9% 10%
7% 8% 8%
21% 20% 29%
8% 12% 11%
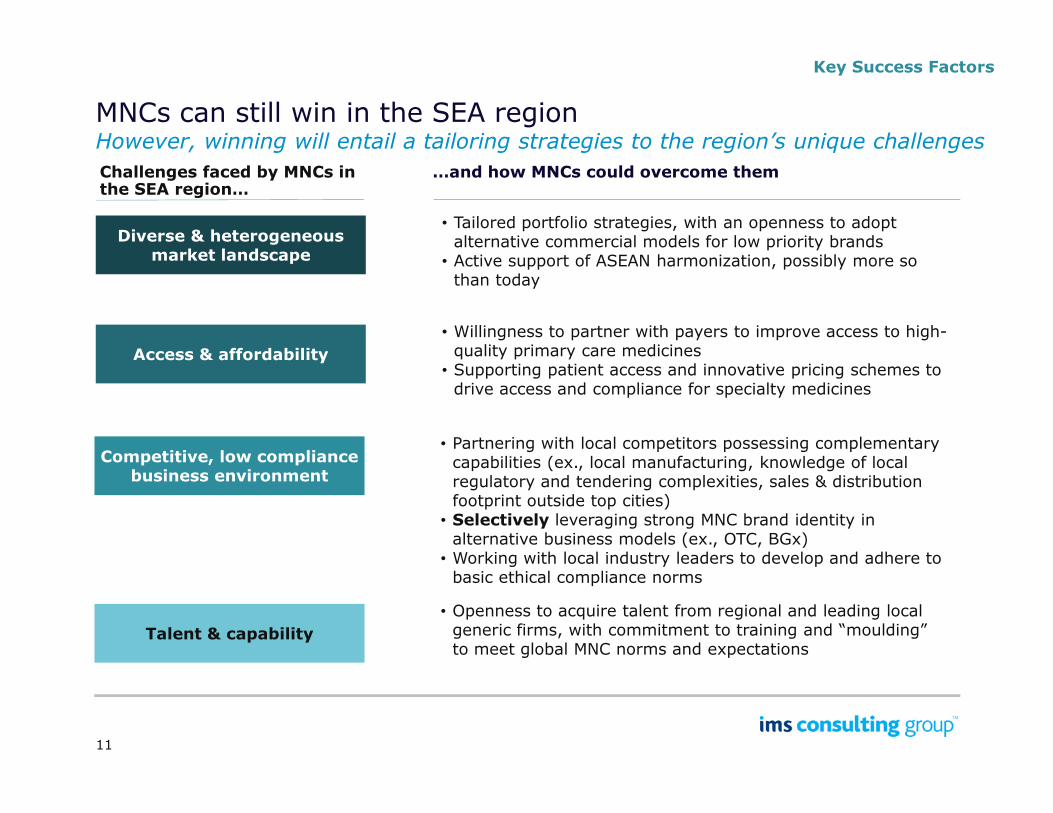
MNCs can still win in the SEA regionHowever, winning will entail a tailoring strategies to the region’s unique challenges
Key Success Factors
…and how MNCs could overcome themChallenges faced by MNCs in the SEA region…
Diverse & heterogeneous market landscape
• Tailored portfolio strategies, with an openness to adopt alternative commercial models for low priority brands
• Active support of ASEAN harmonization, possibly more so than today
Access & affordability
• Willingness to partner with payers to improve access to high-quality primary care medicines
• Supporting patient access and innovative pricing schemes to drive access and compliance for specialty medicines
11
Competitive, low compliance business environment
• Partnering with local competitors possessing complementary capabilities (ex., local manufacturing, knowledge of local regulatory and tendering complexities, sales & distribution footprint outside top cities)
• Selectively leveraging strong MNC brand identity in alternative business models (ex., OTC, BGx)
• Working with local industry leaders to develop and adhere to basic ethical compliance norms
Talent & capability
• Openness to acquire talent from regional and leading local generic firms, with commitment to training and “moulding” to meet global MNC norms and expectations
About IMS Consulting Group
IMS Consulting Group is present across 70 countries with over 500 consultants across the globe. As it focuses only on healthcare and life-sciences sector, our team of consultants bring a wide- and in-depth focuses only on healthcare and life-sciences sector, our team of consultants bring a wide- and in-depth skill set that is unmatched by any other firm.
IMS Consulting Group works with clients to facilitate a wide range of mission critical business decisions. Some typical work includes strategies to enter to specific geographic/ business/ therapy/ product markets and operational excellence initiatives to cover sales force as well as internal operations.
If you would like to know more about what we can do for your business, contact us at:
Dr. Srikanth Rajagopal: [email protected] / +65 6412 7381