Embed Size (px)
Citation preview
Description of the isolation data reported in TESSy (2008 to 2014)
Martina Escher, Cornelia Adlhoch, Eeva Broberg and Pasi Penttinen on behalf of the EISN
European Influenza Surveillance Network Annual Meeting 201411 June 2015

• Weekly aggregated data on influenza isolated specimens (IS) are collected in TESSy since 2008 To monitor the influenza specimens’ availability across
EU/EEA countries for antigenic characterisation influenza vaccine virus selection and production
Background:
Countries
TESSy
? ?
Objective of the analysis
• First analysis of IS data reported to TESSy to:
• evaluate the usefulness of the reported data to inform the surveillance objectives
• describe who report and what is reported
• evaluate IS representativeness compare to other virological influenza surveillance data reported
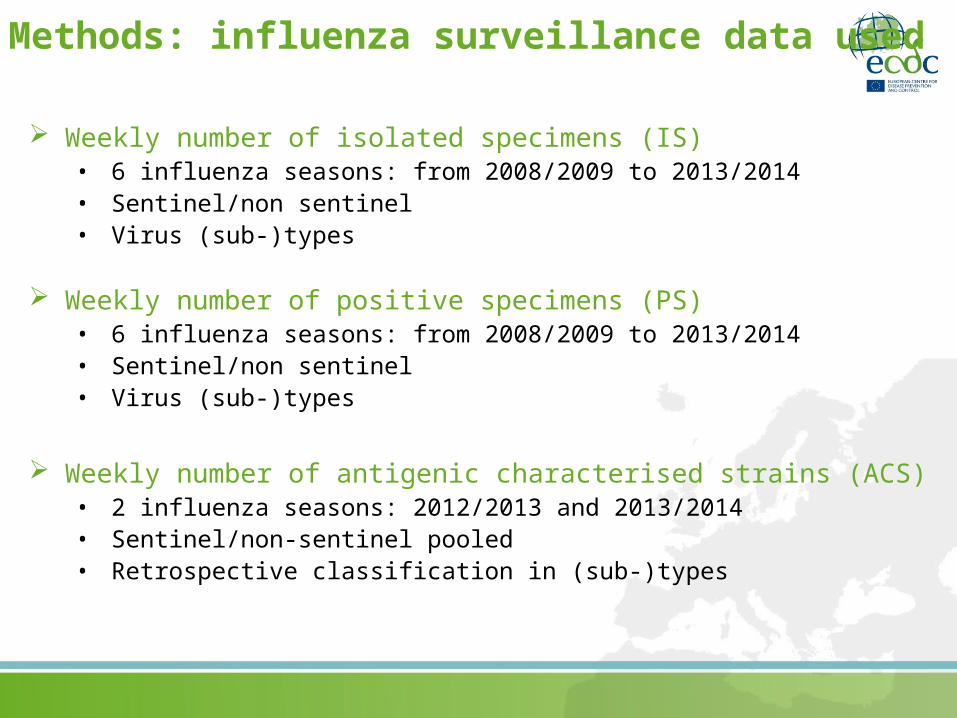
Weekly number of isolated specimens (IS)• 6 influenza seasons: from 2008/2009 to 2013/2014• Sentinel/non sentinel• Virus (sub-)types
Weekly number of positive specimens (PS) • 6 influenza seasons: from 2008/2009 to 2013/2014 • Sentinel/non sentinel• Virus (sub-)types
Weekly number of antigenic characterised strains (ACS)• 2 influenza seasons: 2012/2013 and 2013/2014• Sentinel/non-sentinel pooled • Retrospective classification in (sub-)types
Methods: influenza surveillance data used
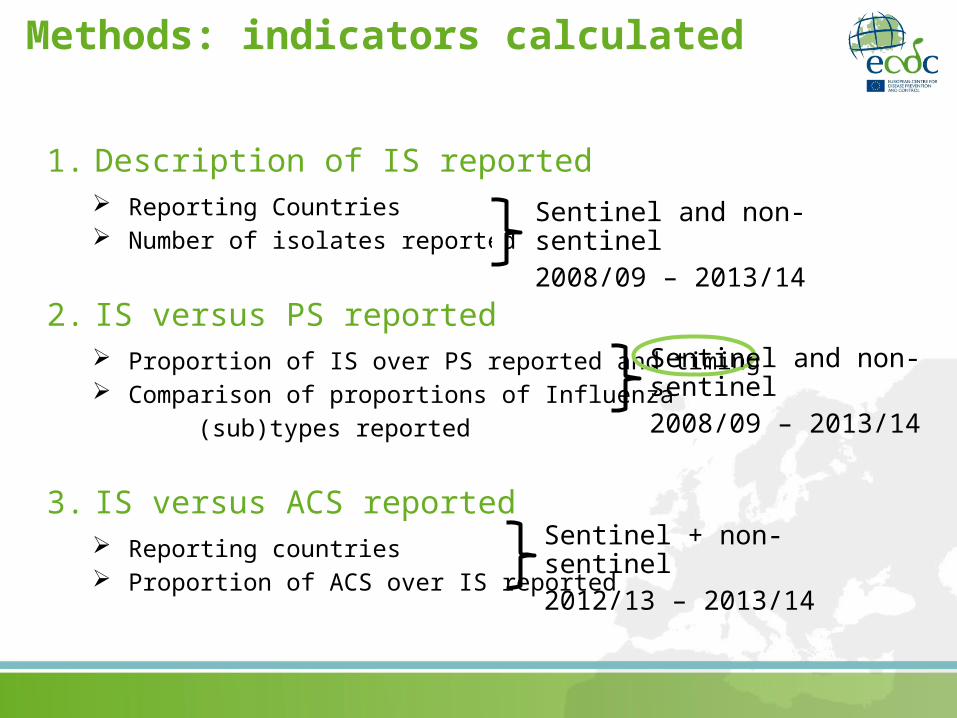
Methods: indicators calculated
1. Description of IS reported Reporting Countries Number of isolates reported
2. IS versus PS reported Proportion of IS over PS reported and timing Comparison of proportions of Influenza
(sub)types reported
3. IS versus ACS reported Reporting countries Proportion of ACS over IS reported
Sentinel and non-sentinel2008/09 – 2013/14
Sentinel and non-sentinel2008/09 – 2013/14
Sentinel + non-sentinel2012/13 – 2013/14
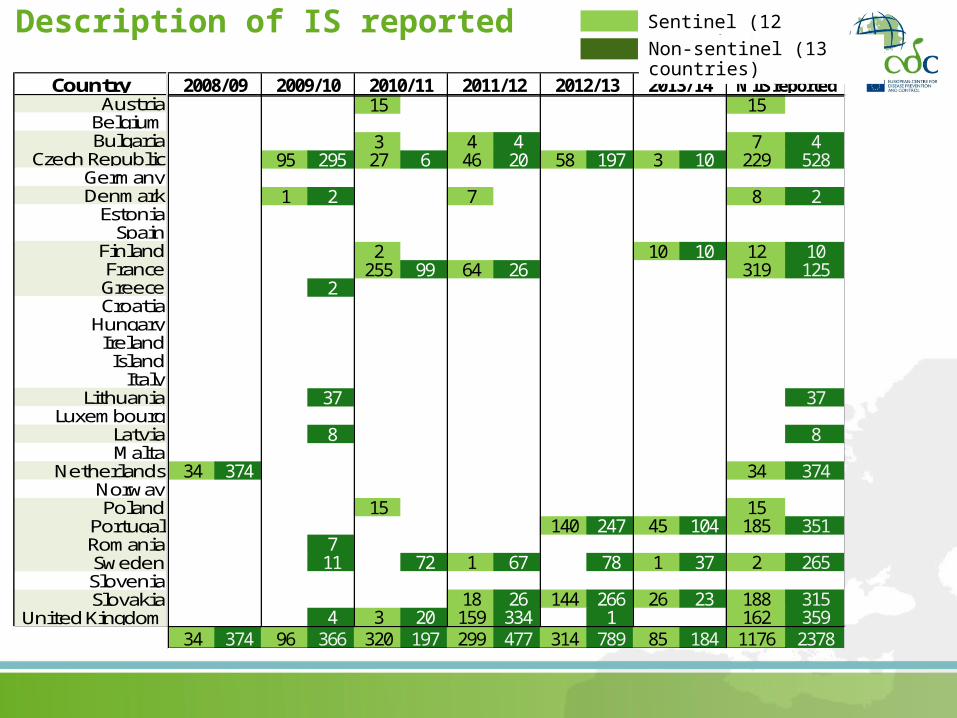
Description of IS reported
CountryAustria
BelgiumBulgaria
Czech RepublicGermanyDenmark
EstoniaSpain
FinlandFranceGreeceCroatia
HungaryIreland
IslandItaly
LithuaniaLuxembourg
LatviaMalta
NetherlandsNorwayPoland
PortugalRomaniaSwedenSloveniaSlovakia
United Kingdom
Sentinel (12 countries)
15 15
3 4 4 7 495 295 27 6 46 20 58 197 3 10 229 528
1 2 7 8 2
2 10 10 12 10255 99 64 26 319 125
2
37 37
8 8
34 374 34 374
15 15140 247 45 104 185 351
711 72 1 67 78 1 37 2 265
18 26 144 266 26 23 188 3154 3 20 159 334 1 162 359
34 374 96 366 320 197 299 477 314 789 85 184 1176
N IIS reported2008/09 2009/10 2010/11 2011/12 2012/13 2013/14
Non-sentinel (13 countries)
15 15
3 4 4 7 495 295 27 6 46 20 58 197 3 10 229 528
1 2 7 8 2
2 10 10 12 10255 99 64 26 319 125
2
37 37
8 8
34 374 34 374
15 15140 247 45 104 185 351
711 72 1 67 78 1 37 2 265
18 26 144 266 26 23 188 3154 3 20 159 334 1 162 359
34 374 96 366 320 197 299 477 314 789 85 184 1176 2378

Description of reported isolates
N of reporting countries
N Isolated specime
ns
N weeks with
reported isolates
Median (Range) of
weekly reported isolates
N of reporting countries
N Isolated specime
ns
N weeks with
reported isolates
Median (Range) of
weekly reported isolates
2008/09 1 34 12 0 (0-6) 1 374 15 0 (0-82)
2009/10 2 96 10 0 (0-26) 8 366 21 1 (0-53)
2010/11 7 320 26 4 (0-28) 4 197 23 4 (0-41)
2011/12 7 299 24 4 (0-38) 6 477 33 8 (1-51)
2012/13 4 314 16 0 (0-48) 5 789 28 5 (0-78)
2013/14 5 85 20 2 (0-12) 5 184 29 3 (0-30)
Non sentinelSentinel
Influenza season
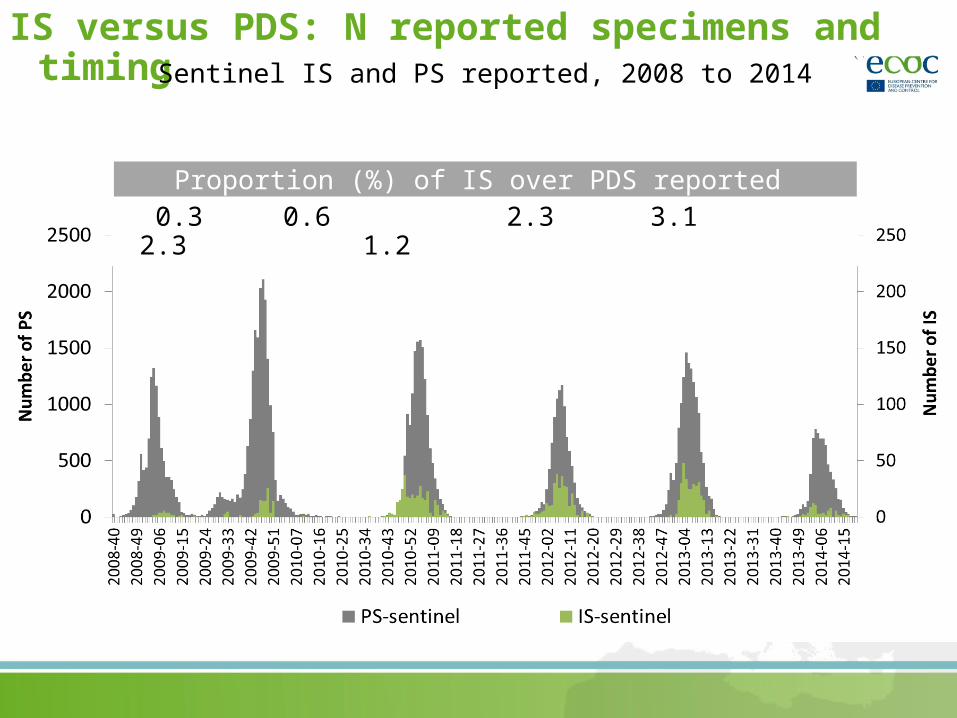
IS versus PDS: N reported specimens and timingSentinel IS and PS reported, 2008 to 2014
Proportion (%) of IS over PDS reported 0.3 0.6 2.3 3.1 2.3 1.2
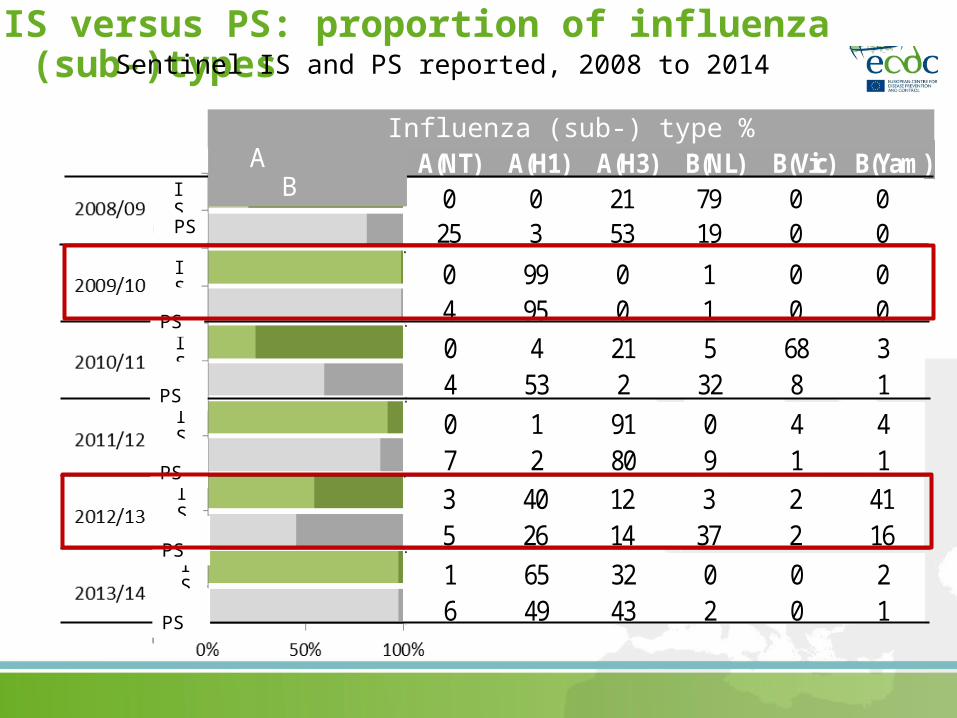
IS versus PS: proportion of influenza (sub-)types
A(NT) A(H1) A(H3) B(NL) B(Vic) B(Yam)0 0 21 79 0 0
25 3 53 19 0 0
0 99 0 1 0 04 95 0 1 0 00 4 21 5 68 34 53 2 32 8 10 1 91 0 4 47 2 80 9 1 13 40 12 3 2 415 26 14 37 2 161 65 32 0 0 26 49 43 2 0 1
IS
PS
IS
IS
IS
IS
IS
PS
PS
PS
PS
PS
Influenza (sub-) type % A B
Sentinel IS and PS reported, 2008 to 2014
Which conclusions can we draw?
- Less than 50% of EU/EEA countries reported isolation at least in one season and in one system
- Behaviour in performing isolation varied between and within countries
- IS represent between 0.3% and 3.1% of the PS
- Isolation was undertaken during the whole season with a pattern following the detections
- Proportion of (sub-)typed IS reported not always reflected that of PS..
…representativeness of the available isolates??
IS ACS ACS/IS % IS ACS ACS/IS %Austria
BelgiumBulgaria
Czech Republic 255 13GermanyDenmark
EstoniaGreece
Spain 20FinlandFrance
HungaryIreland
IslandItaly
LithuaniaLuxembourg
Latvia 2Malta
NetherlandsNorwayPoland
Portugal 387Romania 149Sweden 78
Slovenia 38Slovakia 380
United Kingdom 1 49
2012/2013 2013/2014
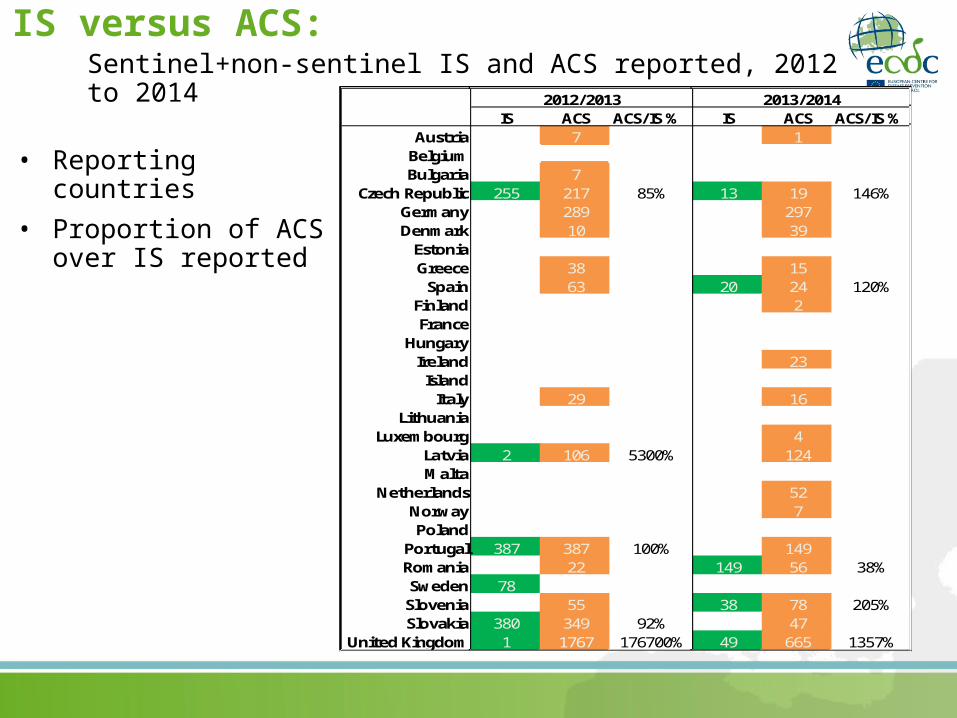
IS versus ACS:Sentinel+non-sentinel IS and ACS reported, 2012 to 2014
• Reporting countries
• Proportion of ACS over IS reported
IS ACS ACS/IS % IS ACS ACS/IS %Austria 7 1
BelgiumBulgaria 7
Czech Republic 255 217 85% 13 19 146%Germany 289 297Denmark 10 39
EstoniaGreece 38 15
Spain 63 20 24 120%Finland 2France
HungaryIreland 23
IslandItaly 29 16
LithuaniaLuxembourg 4
Latvia 2 106 5300% 124Malta
Netherlands 52Norway 7Poland
Portugal 387 387 100% 149Romania 22 149 56 38%Sweden 78
Slovenia 55 38 78 205%Slovakia 380 349 92% 47
United Kingdom 1 1767 176700% 49 665 1357%
2012/2013 2013/2014IS ACS IS ACS
Austria 7 1BelgiumBulgaria 7
Czech Republic 255 217 13 19Germany 289 297Denmark 10 39
EstoniaGreece 38 15
Spain 63 20 24Finland 2France
HungaryIreland 23
IslandItaly 29 16
LithuaniaLuxembourg 4
Latvia 2 106 124Malta
Netherlands 52Norway 7Poland
Portugal 387 387 149Romania 22 149 56Sweden 78
Slovenia 55 38 78Slovakia 380 349 47
United Kingdom 1 1767 49 665
2012/2013 2013/2014IS ACS ACS/IS % IS ACS ACS/IS %
Austria 7 1BelgiumBulgaria 7
Czech Republic 255 217 85% 13 19 146%Germany 289 297Denmark 10 39
EstoniaGreece 38 15
Spain 63 20 24 120%Finland 2France
HungaryIreland 23
IslandItaly 29 16
LithuaniaLuxembourg 4
Latvia 2 106 5300% 124Malta
Netherlands 52Norway 7Poland
Portugal 387 387 100% 149Romania 22 149 56 38%Sweden 78
Slovenia 55 38 78 205%Slovakia 380 349 92% 47
United Kingdom 1 1767 176700% 49 665 1357%
2012/2013 2013/2014
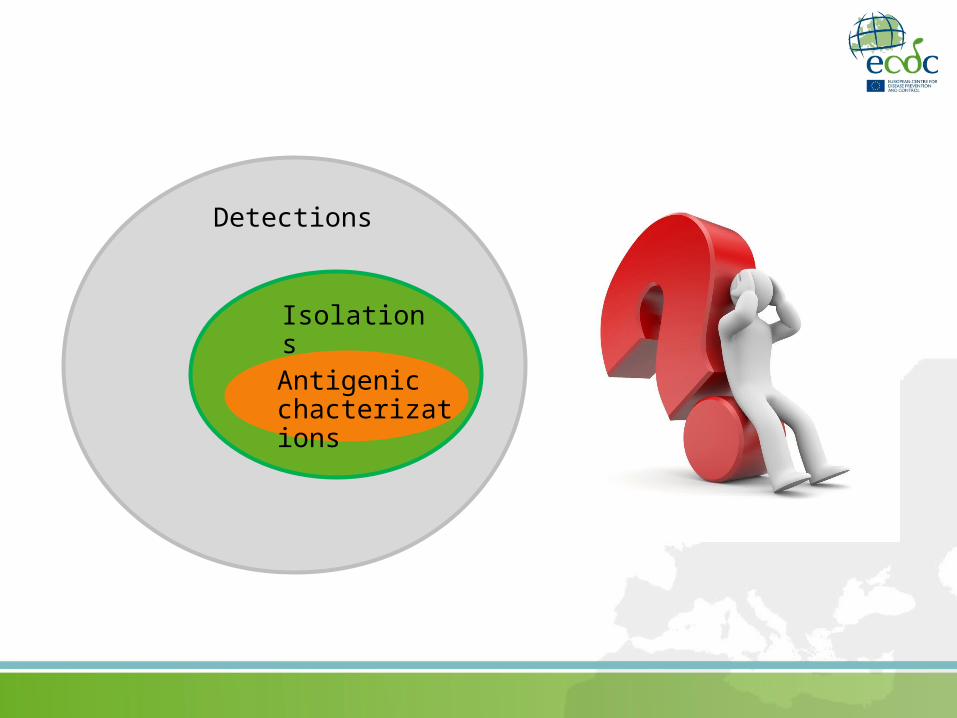
Detections
Isolations
Antigenic chacterizations
Conclusion
• Objectives for influenza IS reporting: monitoring the influenza specimens’ availability across Europe
• Do the data reported in TESSy inform this objective?
• Is this surveillance objective needed at European level?
ECDC surveillance strategy :“develop the quality, effectiveness and accessibility of
the EU surveillance activities while ensuring that the burden on those contributing to these activities remains congruent with the benefits”
• Are there alternative ways to inform the objective?
• If not, should ECDC stop collecting these data?

Thank you…
……Questions???