Embed Size (px)
Citation preview

““DEMYSTIFYING CLINICAL DEMYSTIFYING CLINICAL ELECTROCARDIOGRAPHY”ELECTROCARDIOGRAPHY”
… … HHighlighting ighlighting Myocardial Ischemia, Injury & Infarct
©Kristy Molnar, Partner, Critical Care Consultants, 2013©Kristy Molnar, Partner, Critical Care Consultants, 2013

PHILIPS HEALTHCARE
Patient Care & Clinical Informatics

Continuing Education for
Healthcare Professionals
EDUCATIONAL EDUCATIONAL SERVICESSERVICES
© Copyright, 2013
Critical Care Consultants
Kristy Molnar

Partner, Nursing Education Consultant
CRITICAL CARE CONSULTANTS
Demystifying Clinical Demystifying Clinical Electrocardiography …Electrocardiography …
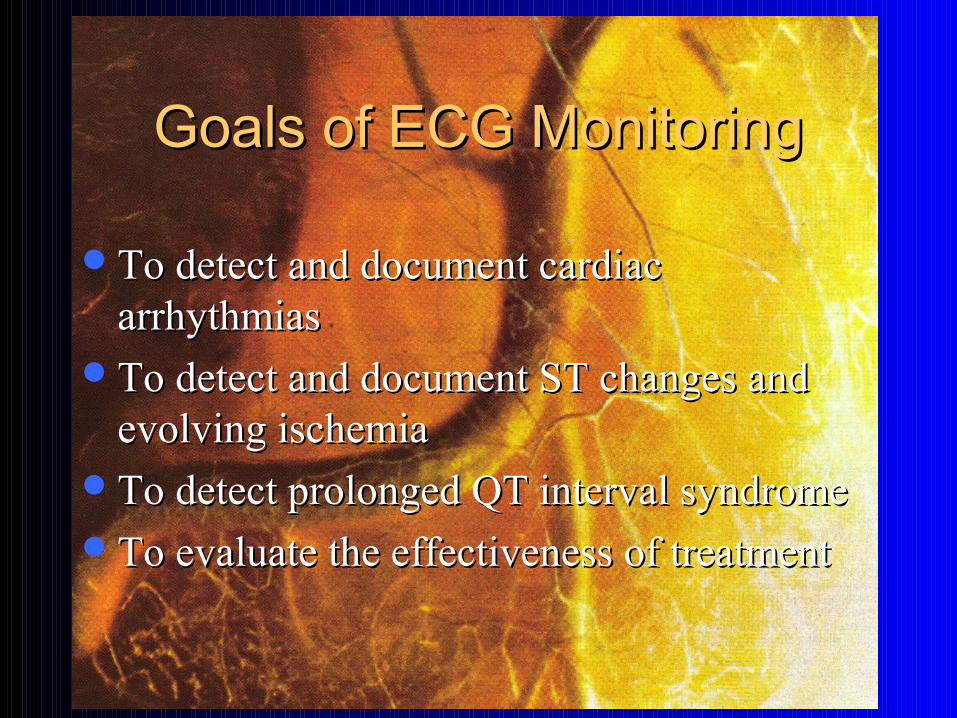
Goals of ECG MonitoringGoals of ECG Monitoring
To detect and document cardiac To detect and document cardiac arrhythmiasarrhythmias
To detect and document ST changes and To detect and document ST changes and evolving ischemiaevolving ischemia
To detect prolonged QT interval syndromeTo detect prolonged QT interval syndromeTo evaluate the effectiveness of treatmentTo evaluate the effectiveness of treatment

We’ve come a LONG Way!We’ve come a LONG Way!
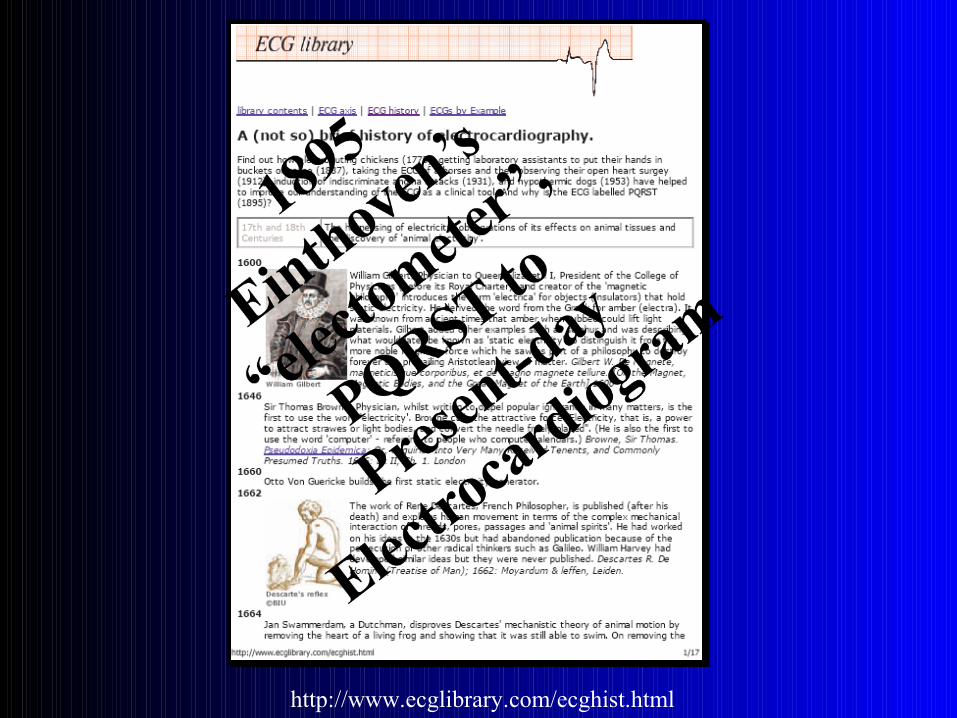
http://www.ecglibrary.com/ecghist.html
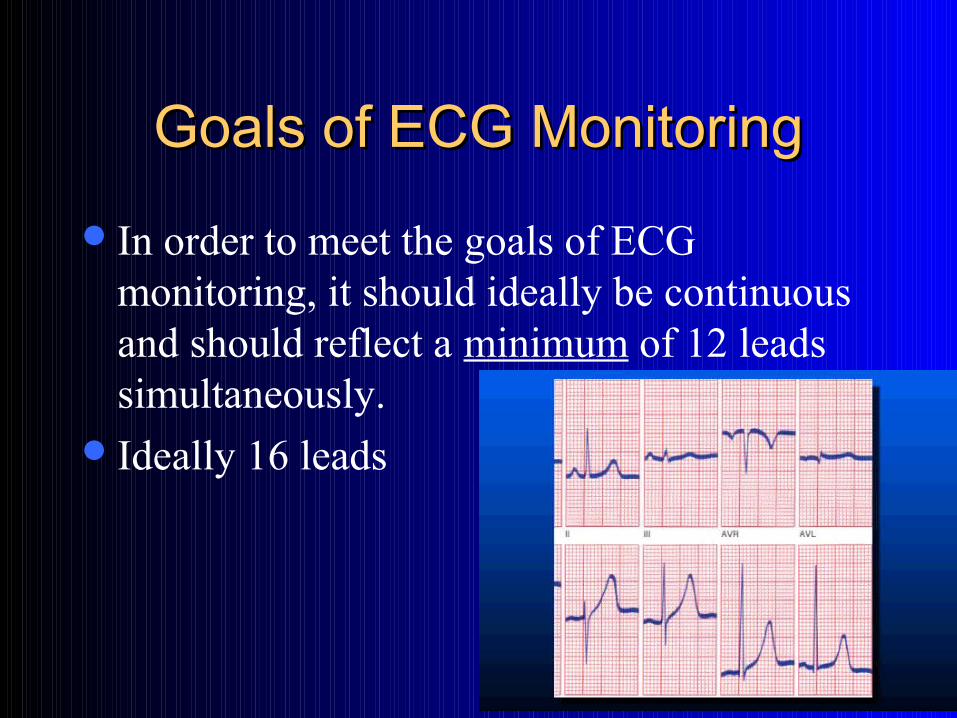
Goals of ECG MonitoringGoals of ECG Monitoring
In order to meet the goals of ECG monitoring, it should ideally be continuous and should reflect a minimum of 12 leads simultaneously.
Ideally 16 leads
Goals of ECG MonitoringGoals of ECG Monitoring
Comprehensive arrhythmia diagnosis often requires a MULTI-LEAD perspective,
Ischemia detection can only occur IF the associated leads are viewed,
Transient events of diagnostic/therapeutic importance may not persist LONG ENOUGH to allow documentation with a standand ECG.
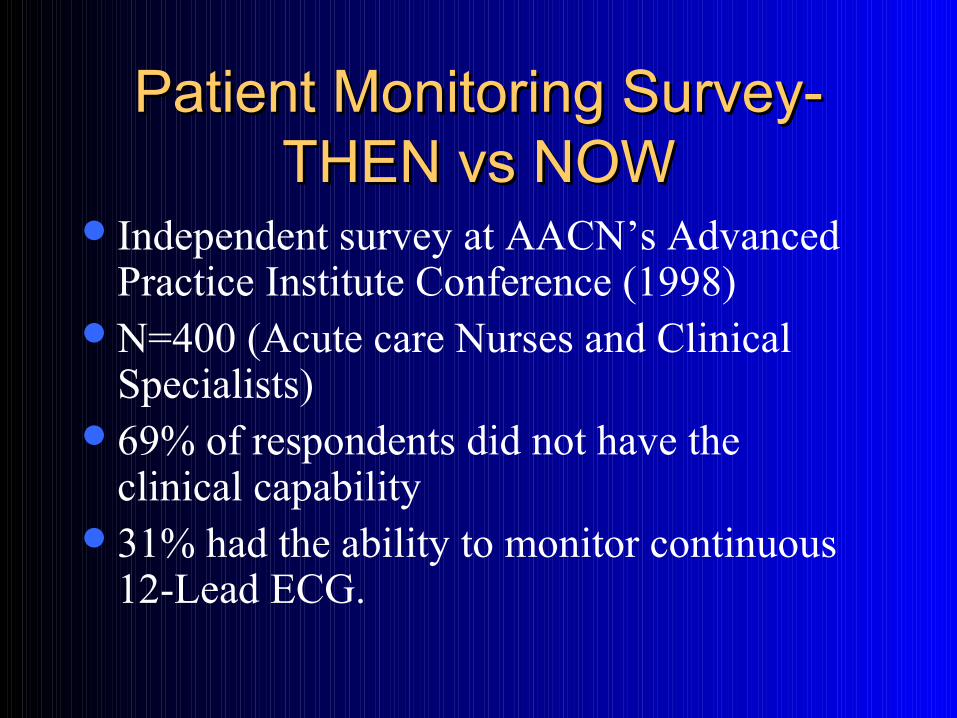
Patient Monitoring Survey-Patient Monitoring Survey-THEN vs NOWTHEN vs NOW
Independent survey at AACN’s Advanced Practice Institute Conference (1998)
N=400 (Acute care Nurses and Clinical Specialists)
69% of respondents did not have the clinical capability
31% had the ability to monitor continuous 12-Lead ECG.
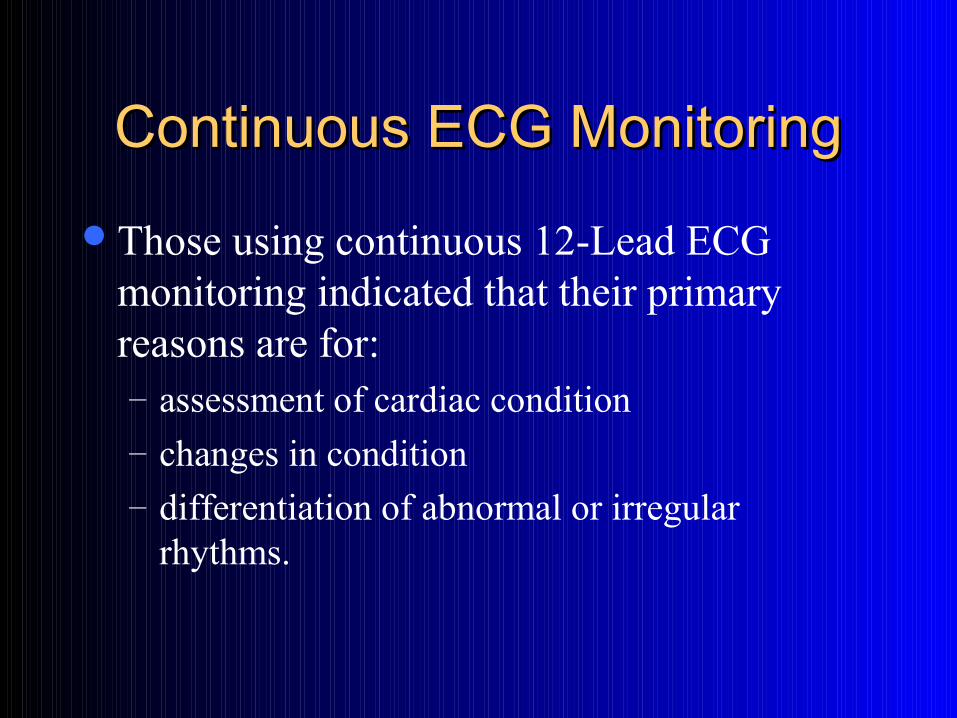
Continuous ECG MonitoringContinuous ECG Monitoring
Those using continuous 12-Lead ECG monitoring indicated that their primary reasons are for: – assessment of cardiac condition – changes in condition– differentiation of abnormal or irregular
rhythms.
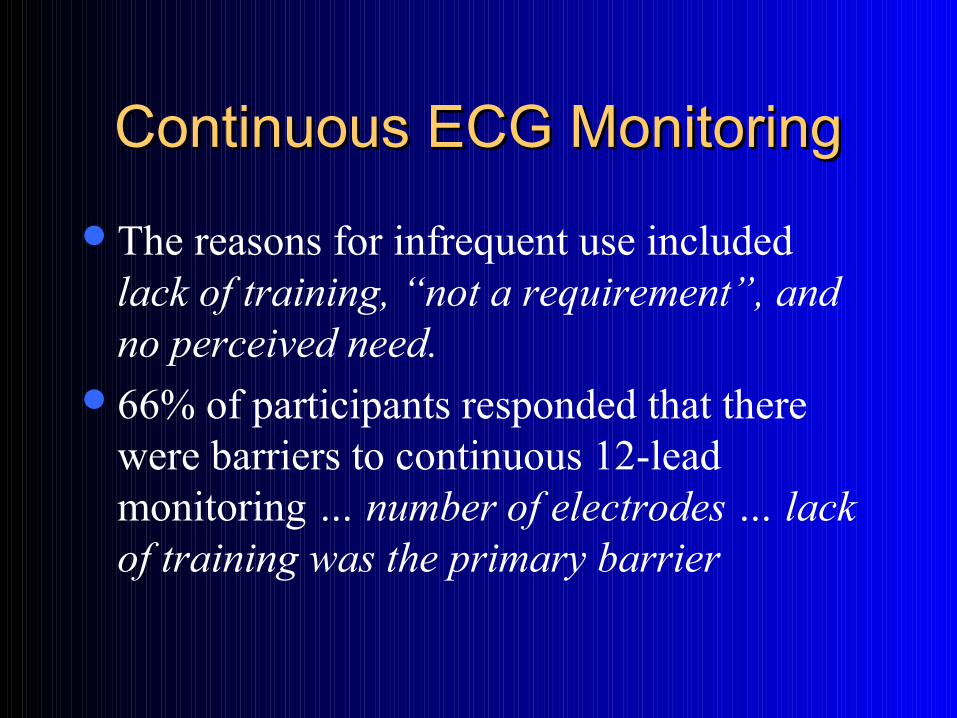
Continuous ECG MonitoringContinuous ECG Monitoring
The reasons for infrequent use included lack of training, “not a requirement”, and no perceived need.
66% of participants responded that there were barriers to continuous 12-lead monitoring … number of electrodes … lack of training was the primary barrier
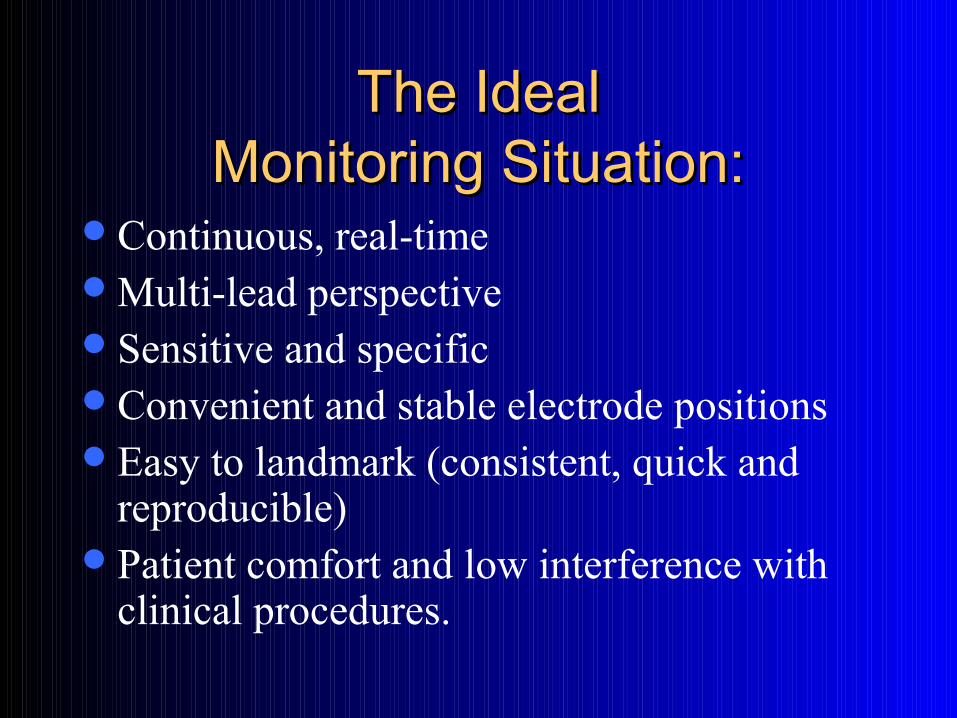
The IdealThe IdealMonitoring Situation:Monitoring Situation:
Continuous, real-timeMulti-lead perspectiveSensitive and specificConvenient and stable electrode positionsEasy to landmark (consistent, quick and
reproducible)Patient comfort and low interference with
clinical procedures.
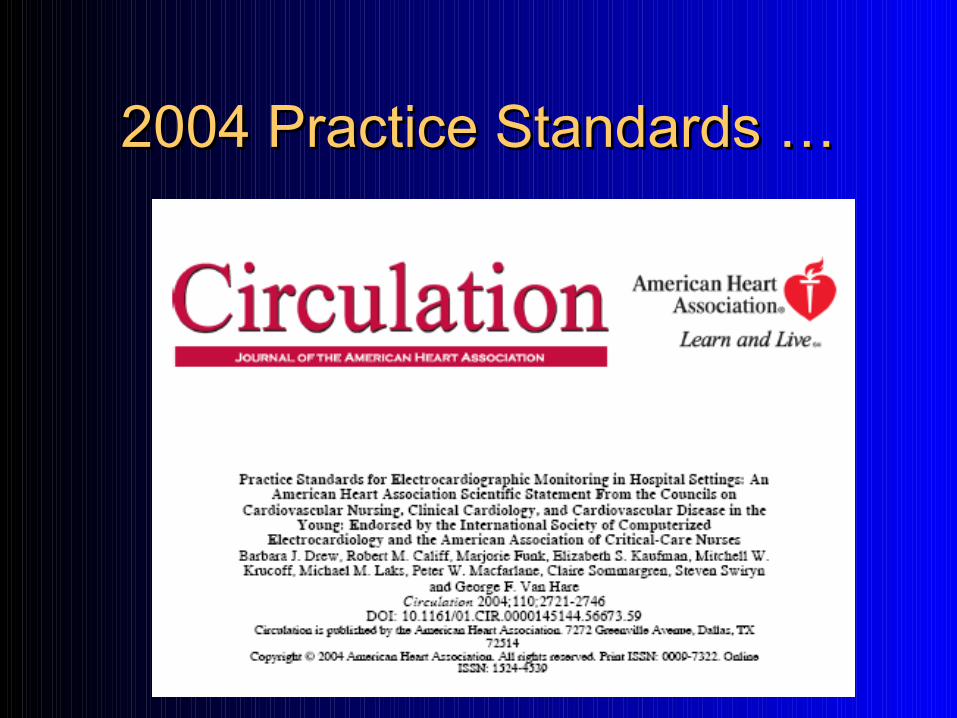
2004 Practice Standards …2004 Practice Standards …
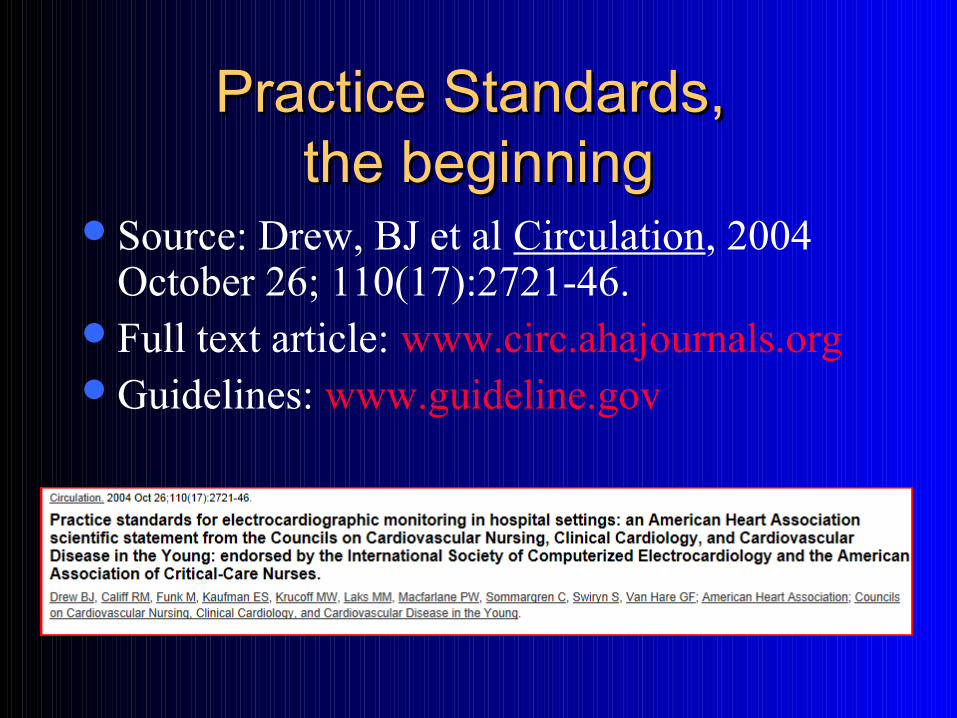
Practice Standards, Practice Standards, the beginningthe beginning
Source: Drew, BJ et al Circulation, 2004 October 26; 110(17):2721-46.
Full text article: www.circ.ahajournals.orgGuidelines: www.guideline.gov
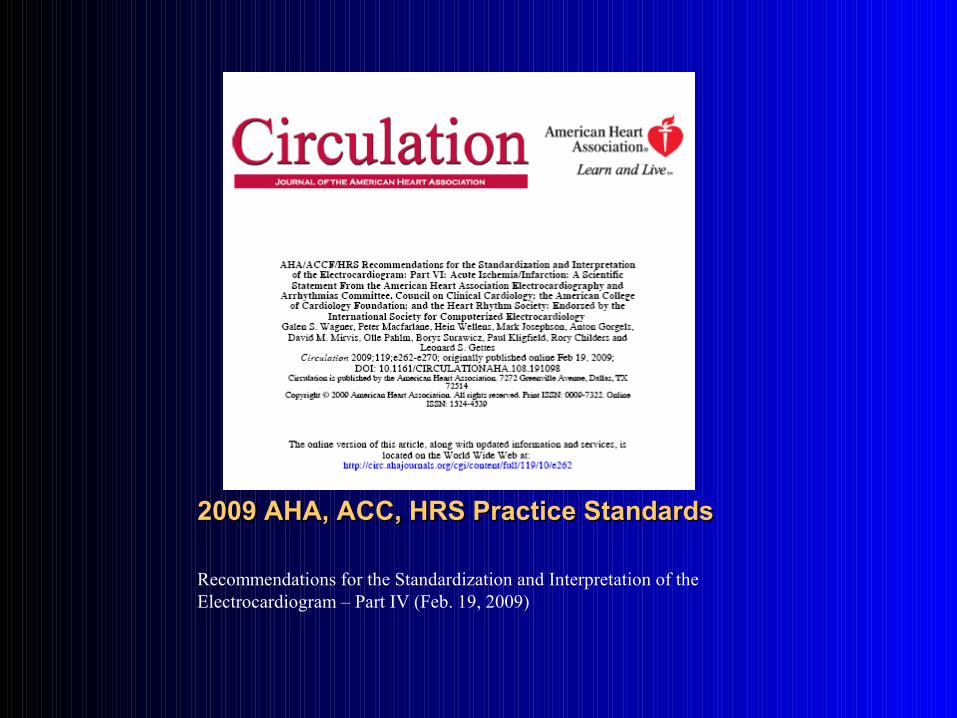
2009 AHA, ACC, HRS Practice Standards2009 AHA, ACC, HRS Practice Standards
Recommendations for the Standardization and Interpretation of the Electrocardiogram – Part IV (Feb. 19, 2009)
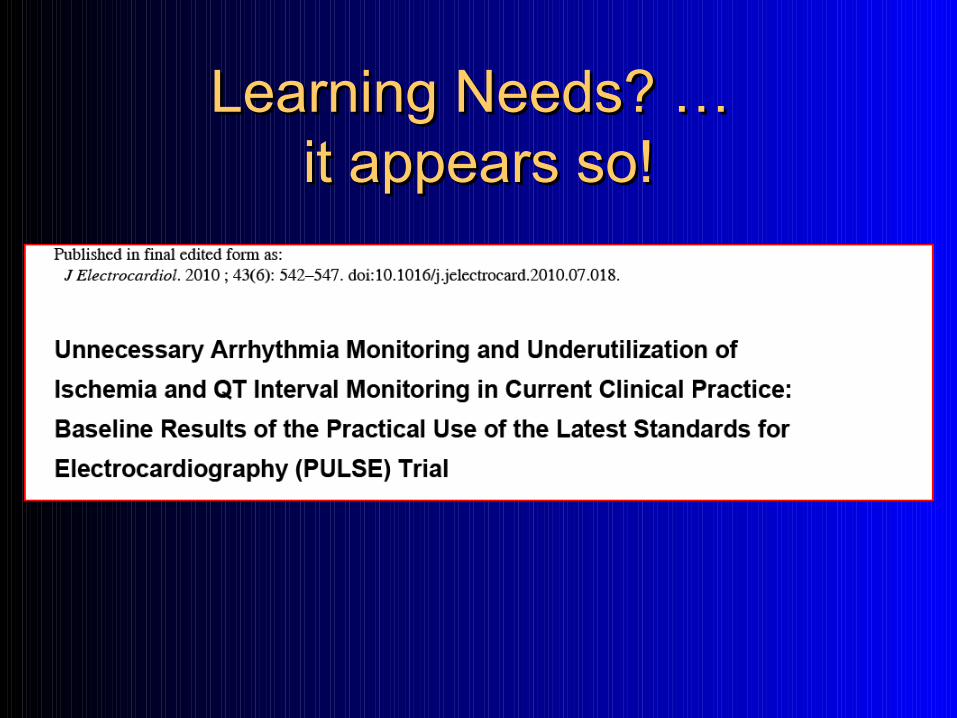
Learning Needs? … Learning Needs? … it appears so!it appears so!
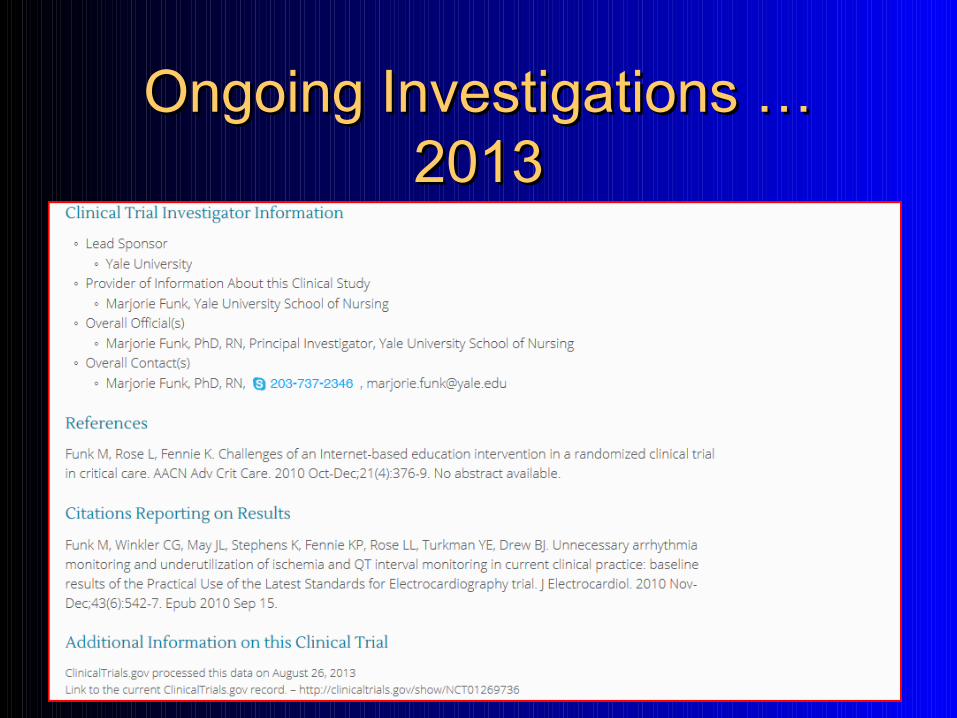
Ongoing Investigations … Ongoing Investigations … 20132013
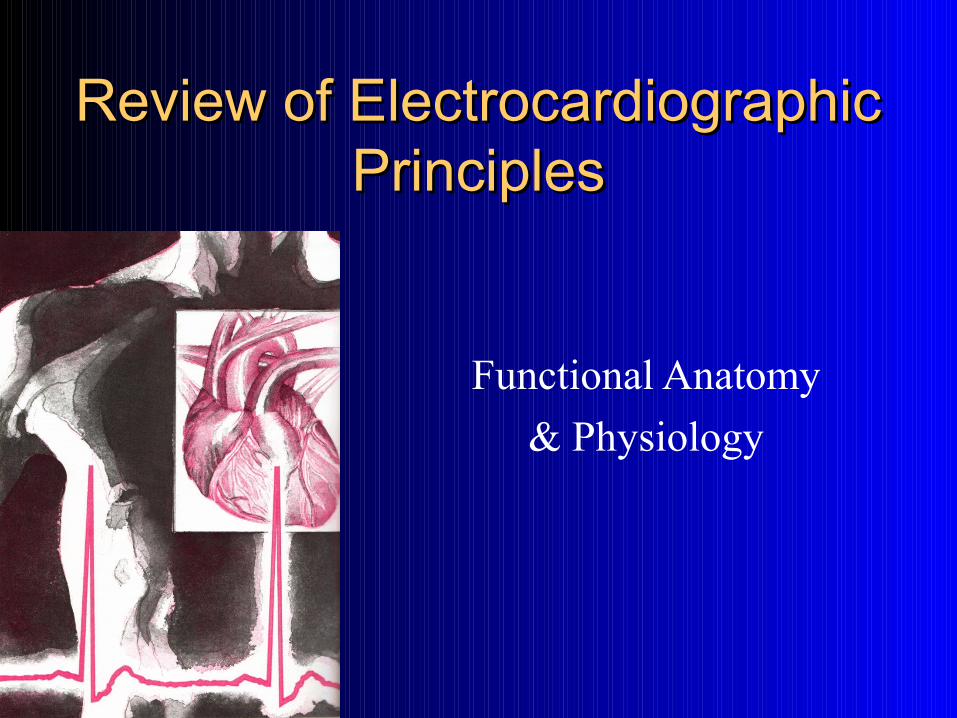
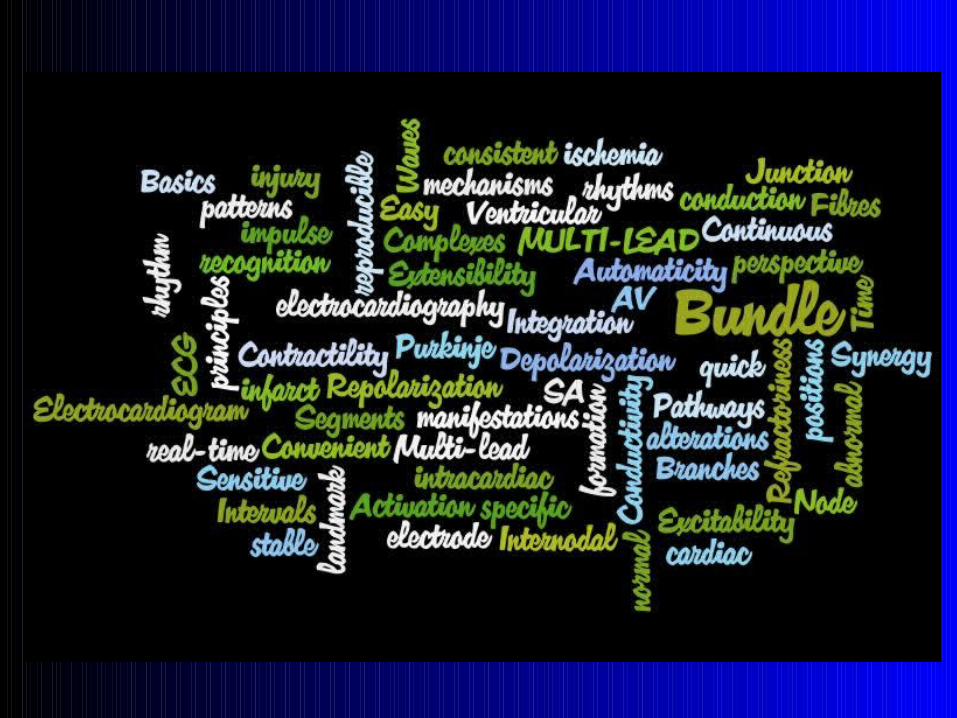
Review of Electrocardiographic Review of Electrocardiographic PrinciplesPrinciples
Functional Anatomy
& Physiology
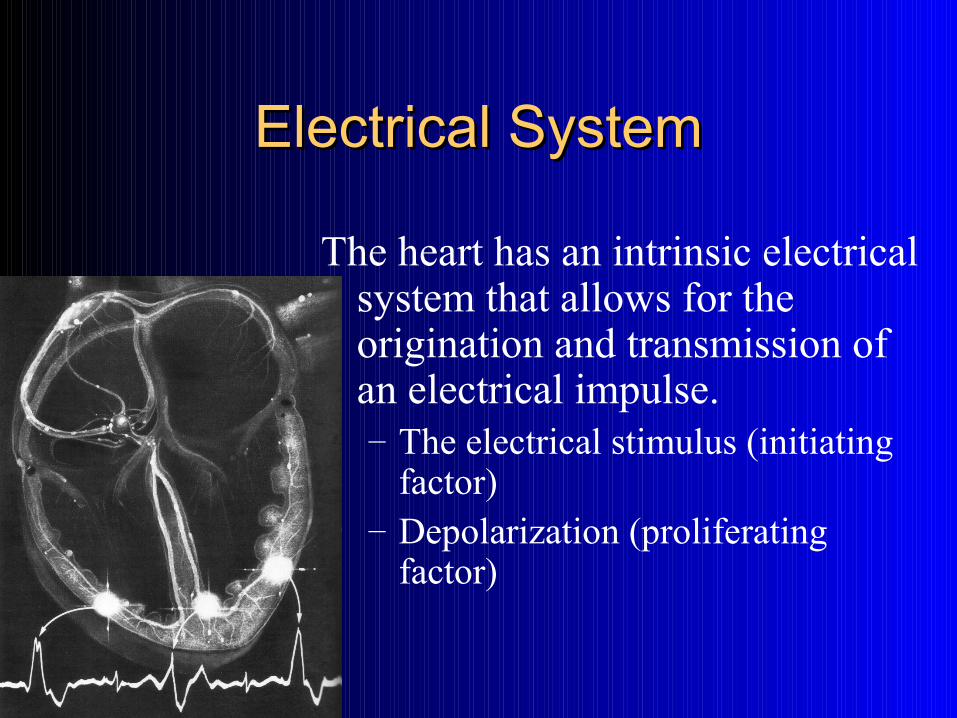
Electrical SystemElectrical System
The heart has an intrinsic electrical system that allows for the origination and transmission of an electrical impulse.– The electrical stimulus (initiating
factor)– Depolarization (proliferating
factor)
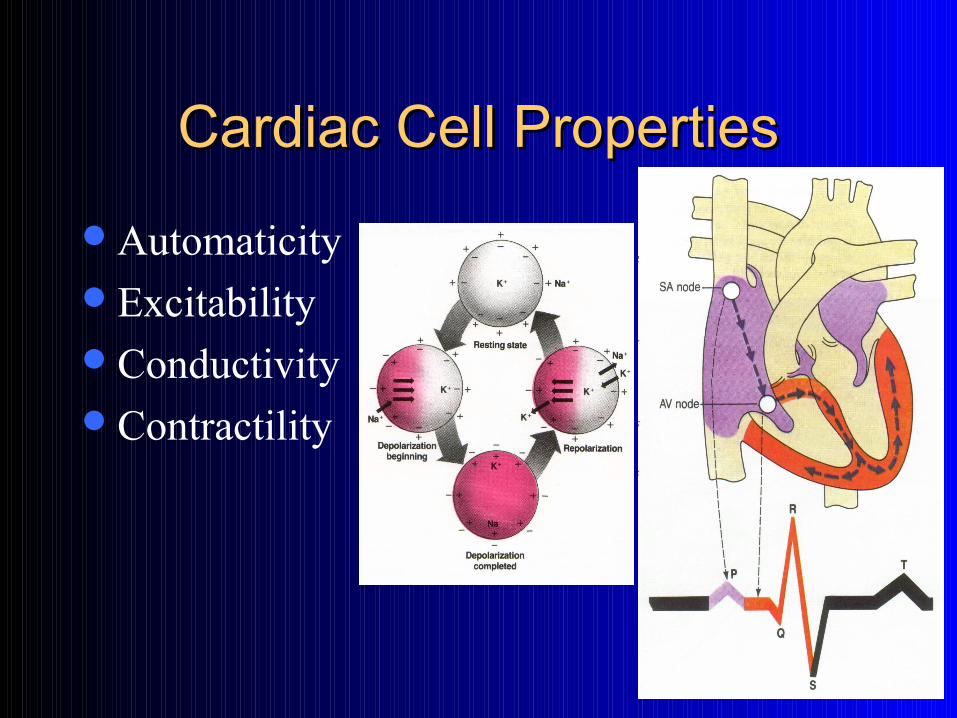
Cardiac Cell PropertiesCardiac Cell Properties
AutomaticityExcitabilityConductivityContractility
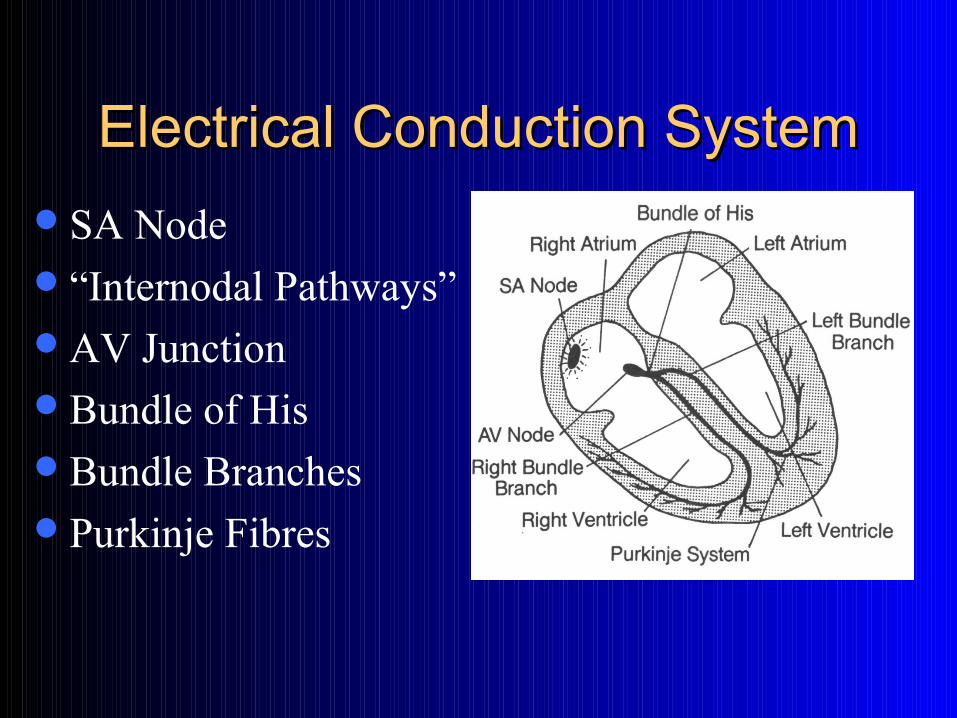
Electrical Conduction SystemElectrical Conduction System
SA Node“Internodal Pathways”AV JunctionBundle of HisBundle BranchesPurkinje Fibres
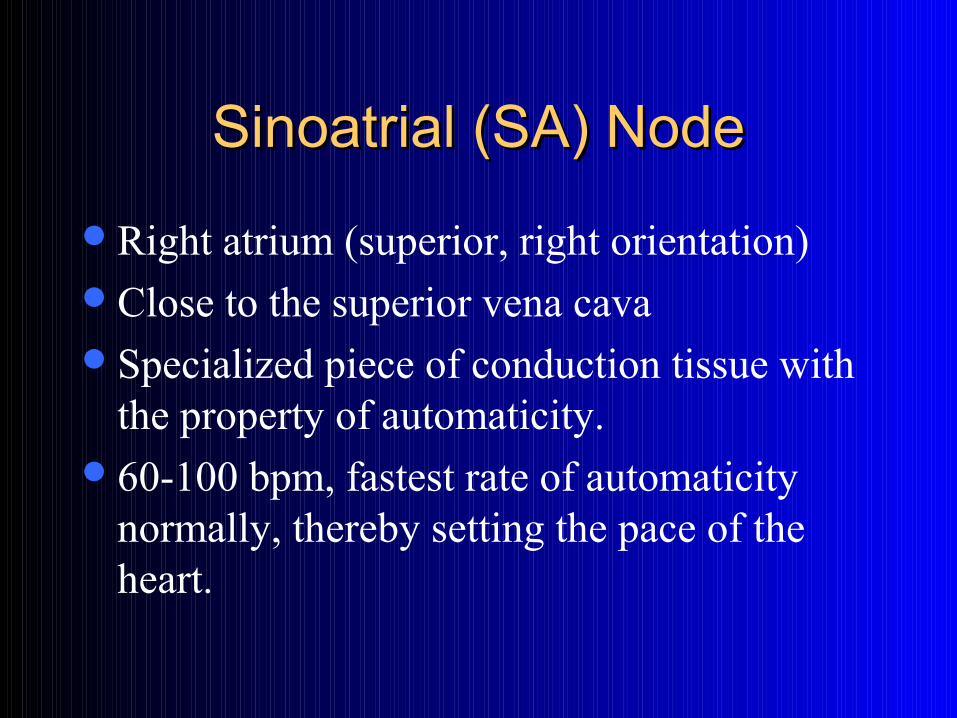
Sinoatrial (SA) NodeSinoatrial (SA) Node
Right atrium (superior, right orientation)Close to the superior vena cavaSpecialized piece of conduction tissue with
the property of automaticity.60-100 bpm, fastest rate of automaticity
normally, thereby setting the pace of the heart.
The SA Node -The SA Node -Automaticity & ExcitabiltyAutomaticity & Excitabilty
Innervated by the autonomic nervous system. Sympathetic stimulation can accelerate the SA
node up to a rate of 150-160/min. Parasympathetic stimulation can slow the heart
rate to less than 60/min. If the heart was separated from the body’s nervous
system, the SA node could still initiate its own impulses.
ConductivityConductivity
Once an electrical stimulus is originated, it spreads throughout the remainder of the conduction system and the heart muscle.
ConductivityConductivity
When the impulse is released from the SA node, it travels throughout the atria, causing them to depolarize and subsequently, contract.
The depolarization wave arrives at the AV node, which is located on the inferior-right side of the intra-atrial septum.
ConductivityConductivity
The wave is delayed there for approximately .10 seconds before arriving at the Bundle of His … allowing for atrial contraction to precede ventricular contraction (contributing to adequate ventricular filling, an additional 20-30% of preload).
AV JunctionAV Junction
Under normal conditions, the AV junctional tissue is not the pacemaker of the heart – since it has a lower rate of automaticity than the SA Node.
The rate of impulse formation in the AV junctional tissue is normally 40-60/min.
A-V ConductionA-V Conduction
The cardiac impulse spreads to the thin bundle of “threads” known as the bundle of His
The bundle of His connects the AV junction to the bundle branches (located in the right side of the intra-atrial septum just above the ventricles)
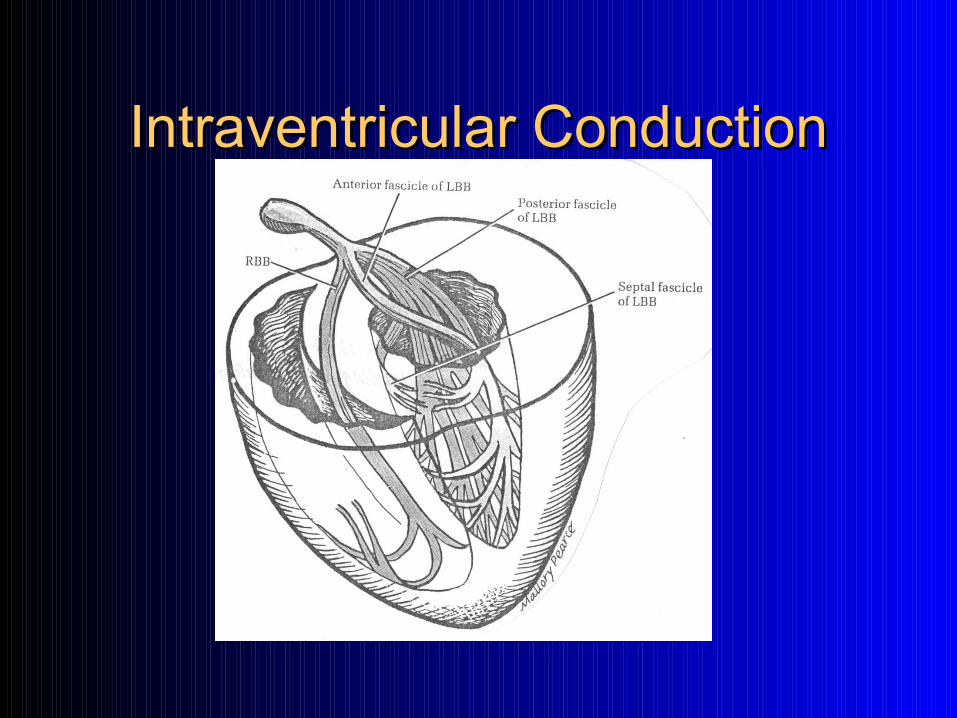
Intraventricular ConductionIntraventricular Conduction
The conduction structures in the ventricles consist of the conduction structures below the bundle of His, also known as the His-Purkinje network.
The impulse passes down the Left and Right bundle branches in a sequential fashion.
Intraventricular ConductionIntraventricular Conduction
Bundle Branch ConductionBundle Branch Conduction
Repolarization is faster in the Left Bundle Branch, therefore it is ready to conduct earlier than the Right Bundle Branch.
Conduction of the impulse is normally Left before Right.
Left vs. Right Bundle BranchLeft vs. Right Bundle Branch
The Right bundle is a slender fascicle that runs along the right side of the intraventicular septum and supplies the electrical impulses to the Right ventricle.
The Left bundle supplies the electrical impulses to the Left ventricle. It runs along the left side of the intraventricular septum and divides almost immediately into an anterior and posterior division (fascicle).
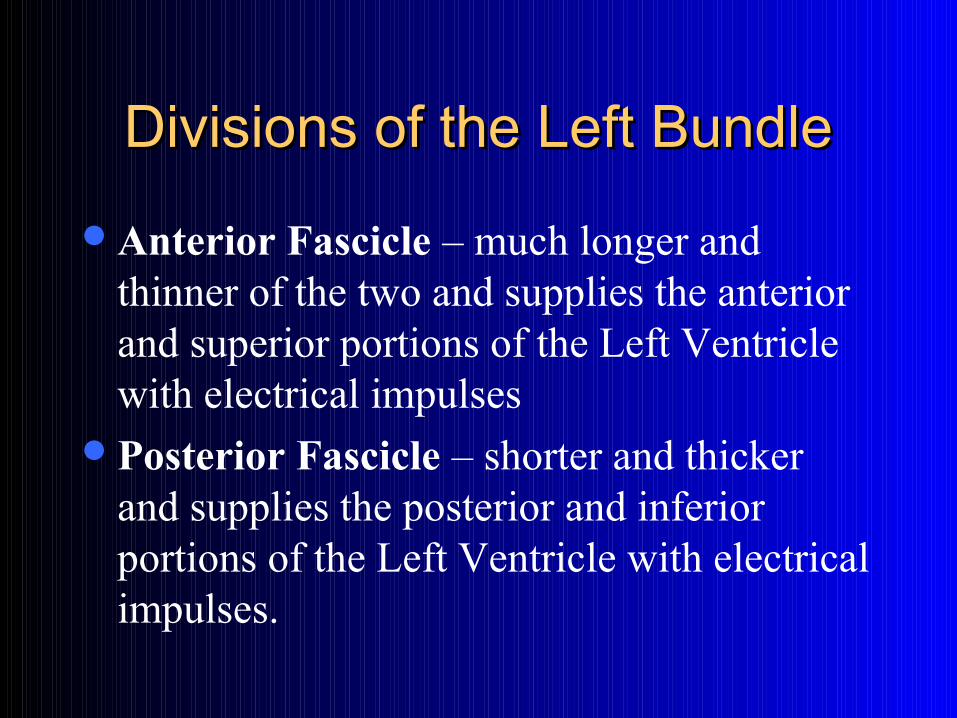
Divisions of the Left BundleDivisions of the Left Bundle
Anterior Fascicle – much longer and thinner of the two and supplies the anterior and superior portions of the Left Ventricle with electrical impulses
Posterior Fascicle – shorter and thicker and supplies the posterior and inferior portions of the Left Ventricle with electrical impulses.

Purkinje Network (Fibers)Purkinje Network (Fibers)
The bundle branches terminate in a network of fibers that are located in both the left and right ventricular walls.
The impulse travels into the Purkinje Fibers and cause ventricular depolarization (and subsequently, contraction)
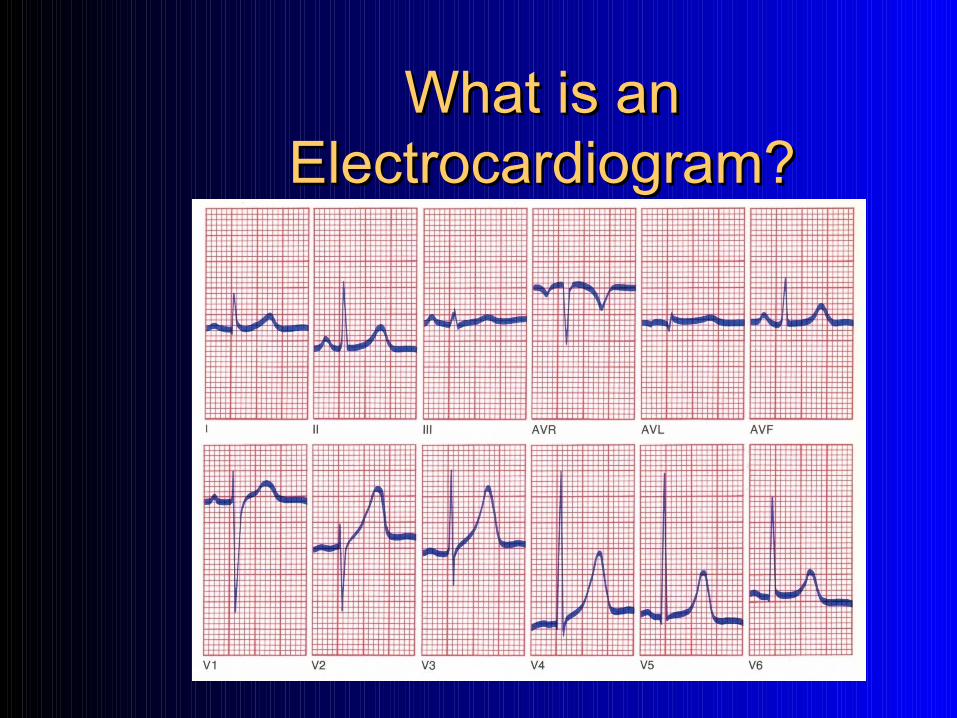
What is an What is an Electrocardiogram?Electrocardiogram?
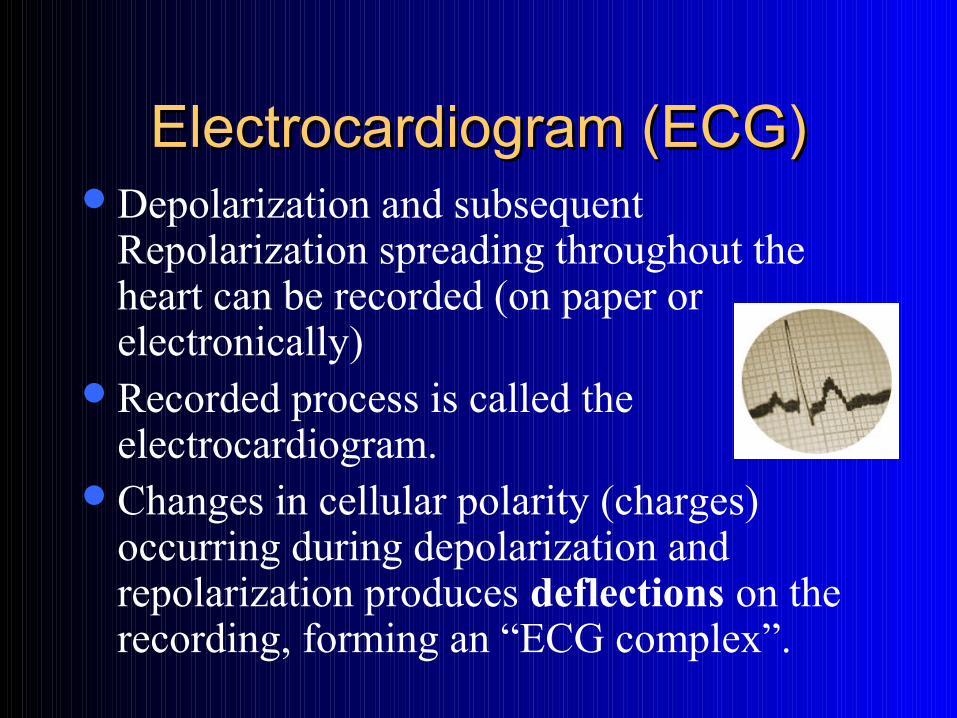
Electrocardiogram (ECG)Electrocardiogram (ECG)Depolarization and subsequent
Repolarization spreading throughout the heart can be recorded (on paper or electronically)
Recorded process is called the electrocardiogram.
Changes in cellular polarity (charges) occurring during depolarization and repolarization produces deflections on the recording, forming an “ECG complex”.
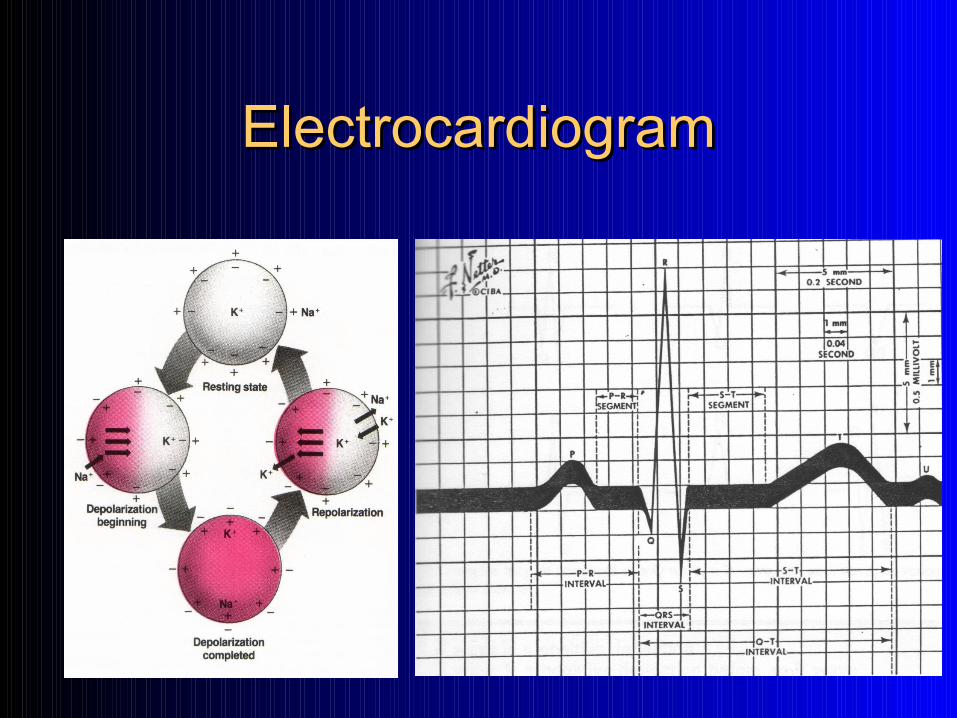
ElectrocardiogramElectrocardiogram
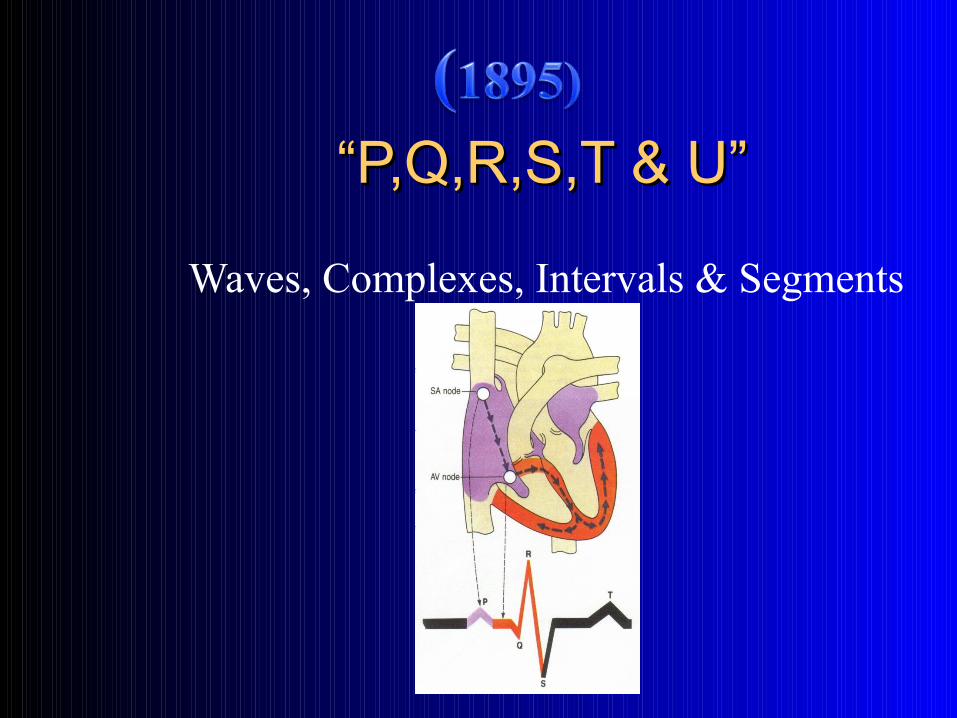
““P,Q,R,S,T & U”P,Q,R,S,T & U”
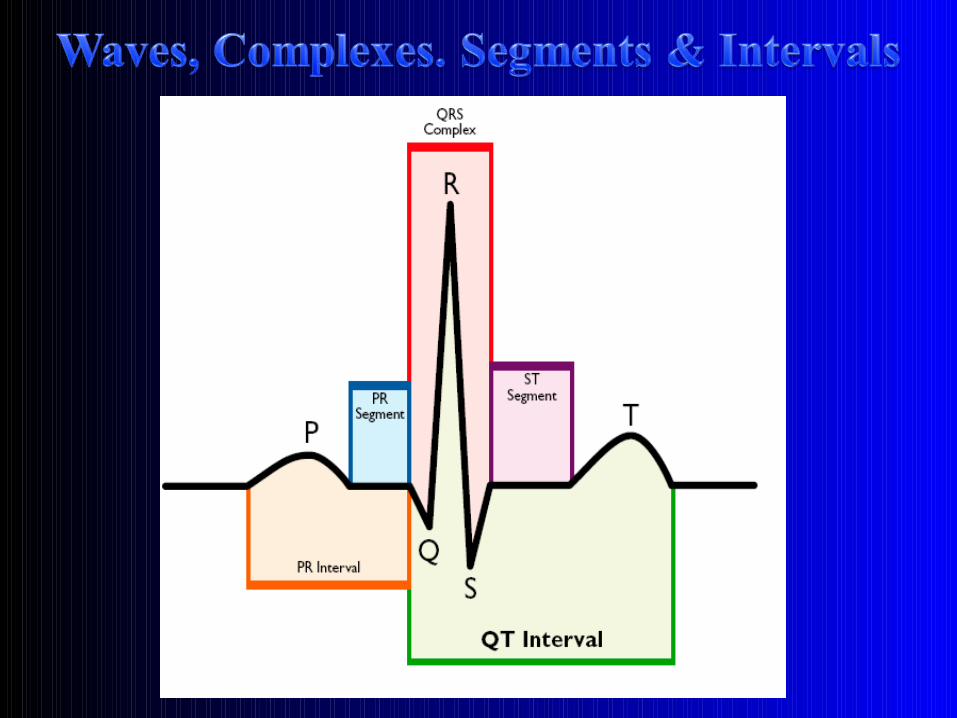
Waves, Complexes, Intervals & Segments
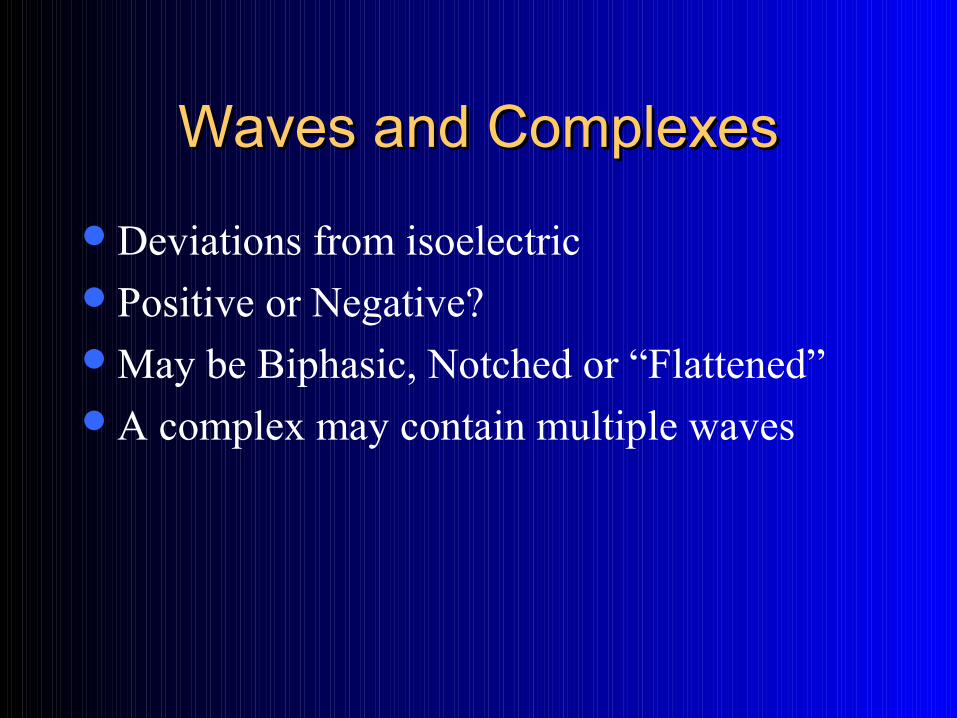
Waves and ComplexesWaves and Complexes
Deviations from isoelectricPositive or Negative?May be Biphasic, Notched or “Flattened”A complex may contain multiple waves
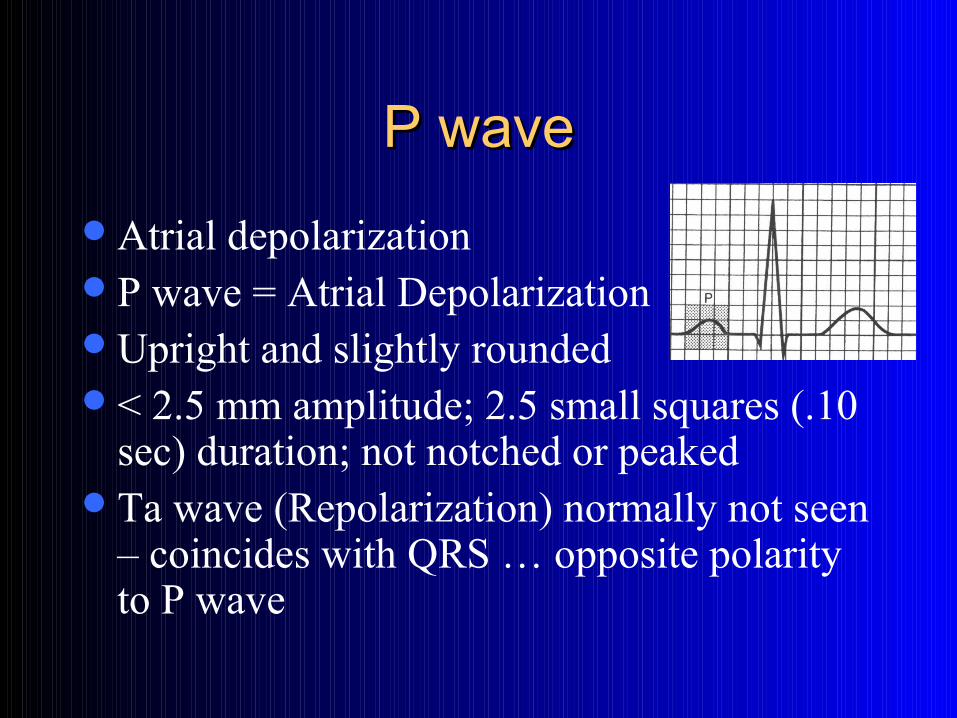
P waveP wave
Atrial depolarizationP wave = Atrial DepolarizationUpright and slightly rounded< 2.5 mm amplitude; 2.5 small squares (.10
sec) duration; not notched or peakedTa wave (Repolarization) normally not seen
– coincides with QRS … opposite polarity to P wave
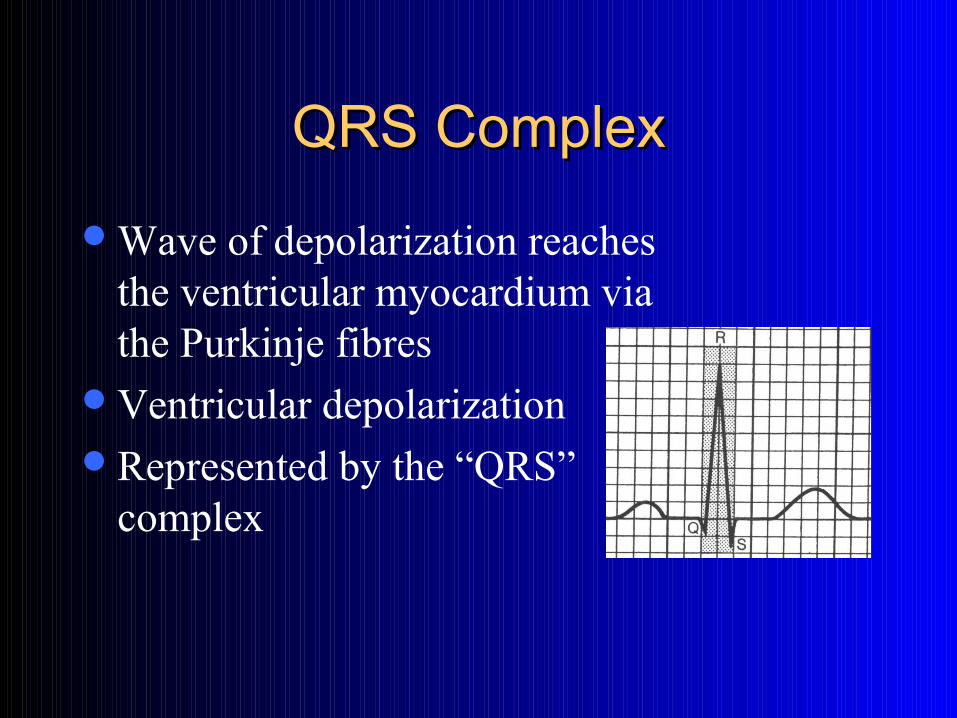
QRS ComplexQRS Complex
Wave of depolarization reaches the ventricular myocardium via the Purkinje fibres
Ventricular depolarizationRepresented by the “QRS”
complex
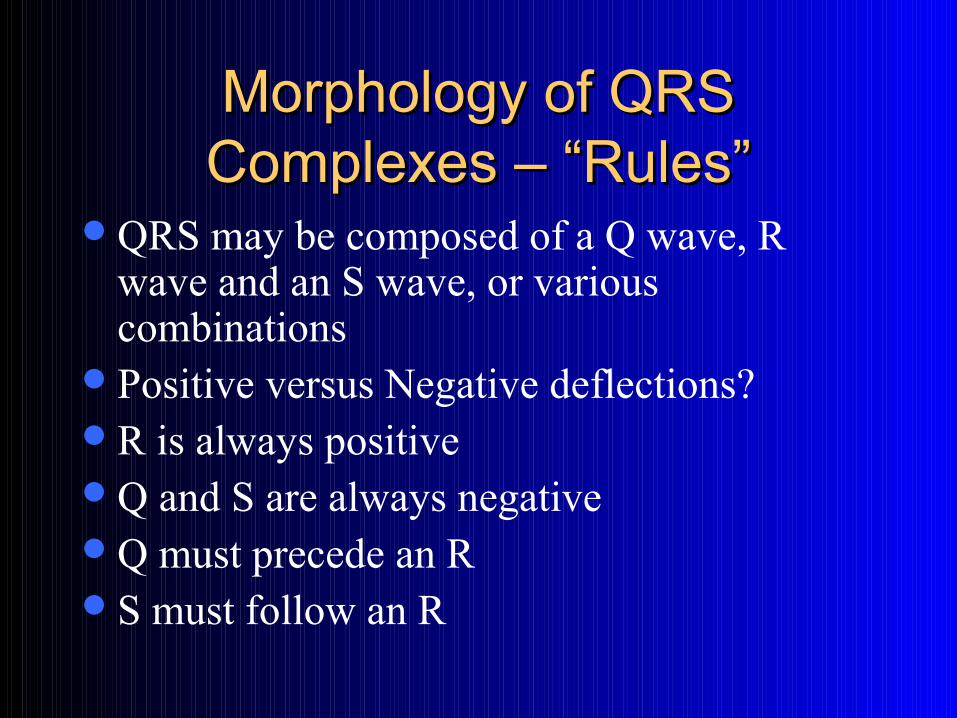
Morphology of QRS Morphology of QRS Complexes – “Rules”Complexes – “Rules”
QRS may be composed of a Q wave, R wave and an S wave, or various combinations
Positive versus Negative deflections?R is always positiveQ and S are always negativeQ must precede an RS must follow an R
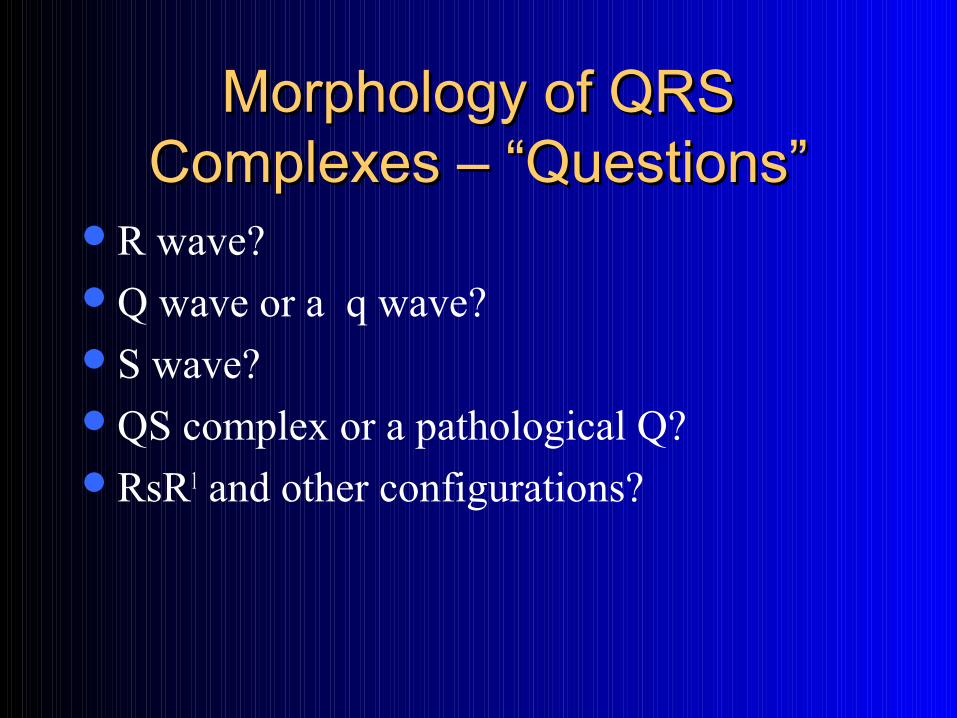
Morphology of QRS Morphology of QRS Complexes – “Questions”Complexes – “Questions”
R wave?Q wave or a q wave?S wave?QS complex or a pathological Q?RsR1 and other configurations?
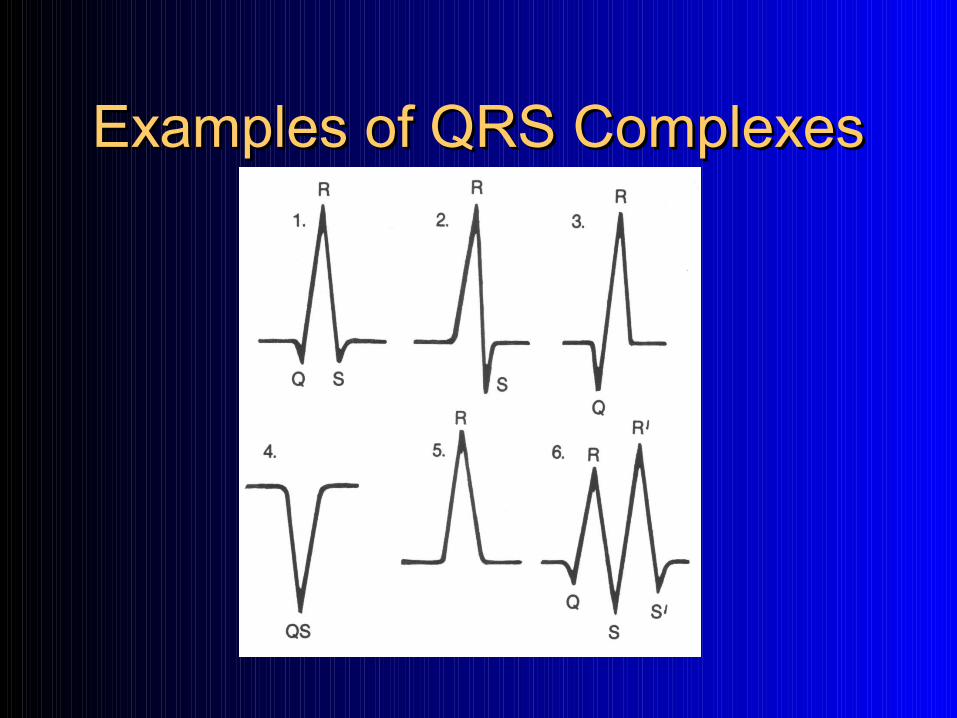
Examples of QRS ComplexesExamples of QRS Complexes
Changes in R wave Changes in R wave or a new Q wave?or a new Q wave?
R wave changes can be clinically significant in an acute situation (conduction abnormality or decrease in depolarization forces) … CAUTION – Lead Placement & Filters
What about the development of a new Q wave?
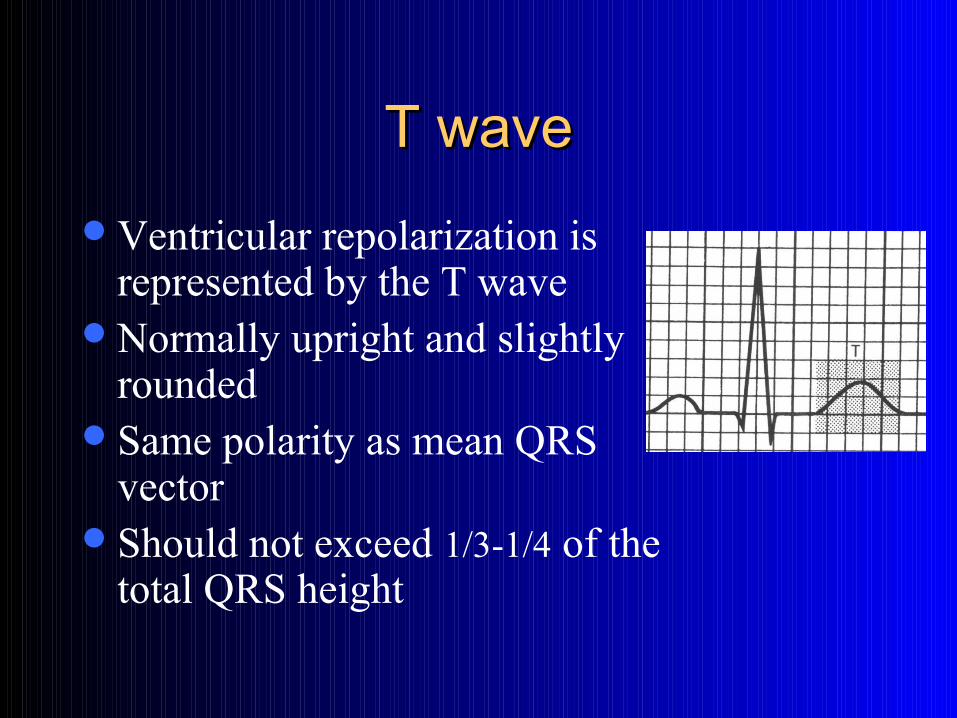
T waveT wave
Ventricular repolarization is represented by the T wave
Normally upright and slightly rounded
Same polarity as mean QRS vector
Should not exceed 1/3-1/4 of the total QRS height
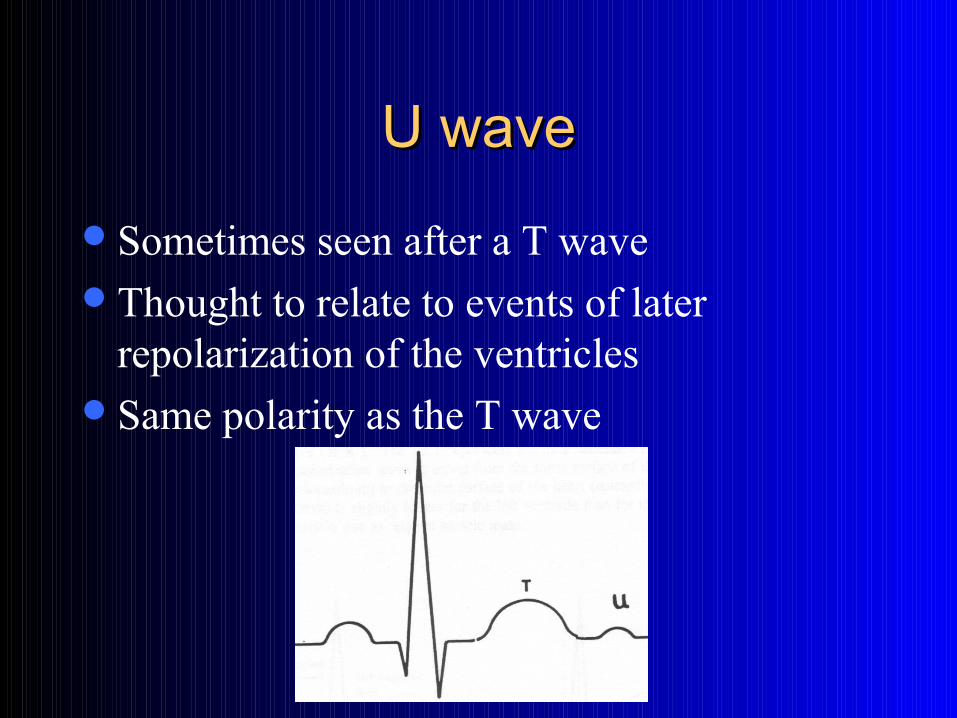
U waveU wave
Sometimes seen after a T waveThought to relate to events of later
repolarization of the ventriclesSame polarity as the T wave
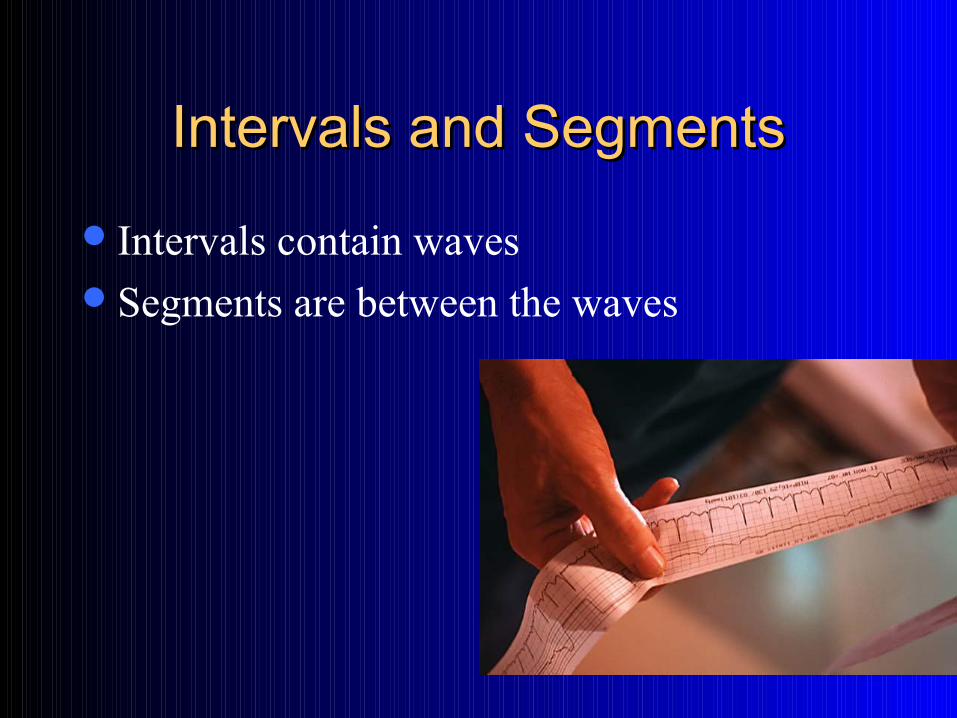
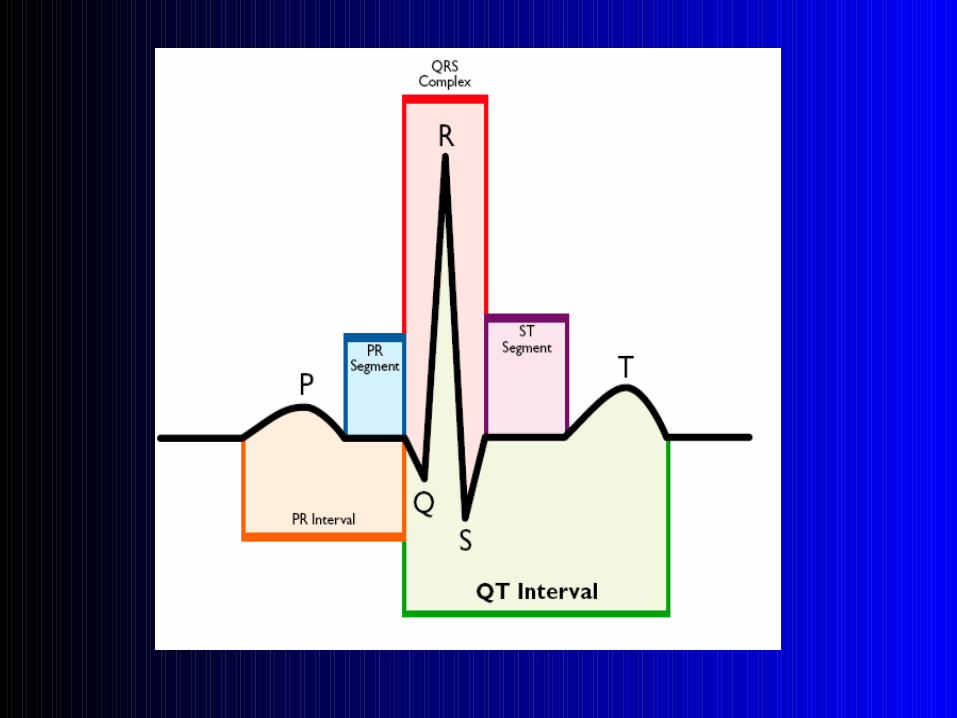
Intervals and SegmentsIntervals and Segments
Intervals contain wavesSegments are between the waves
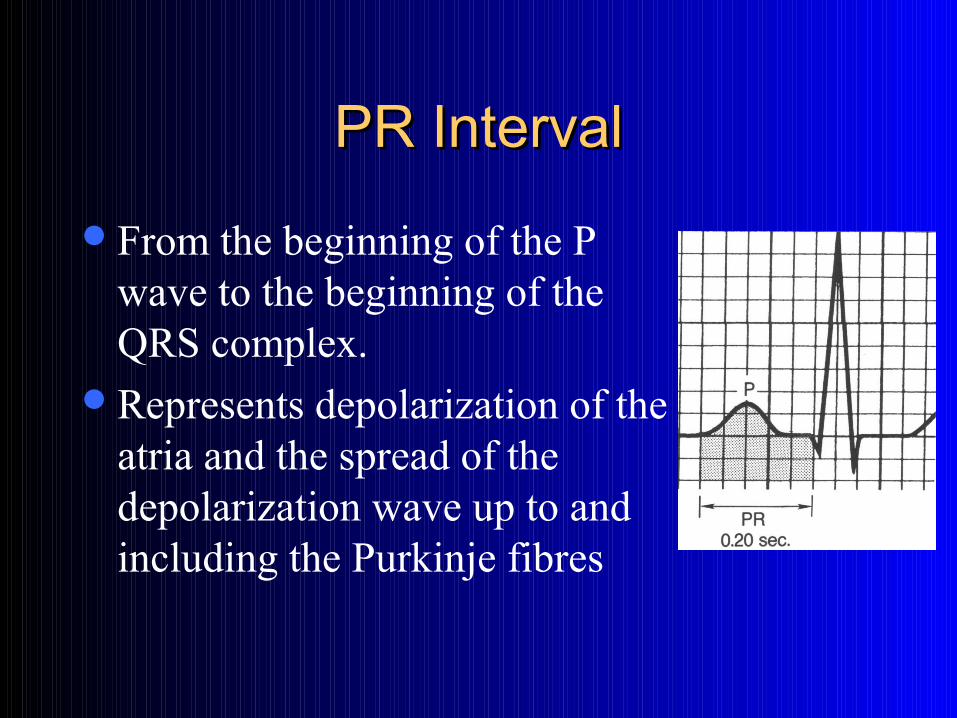
PR IntervalPR Interval
From the beginning of the P wave to the beginning of the QRS complex.
Represents depolarization of the atria and the spread of the depolarization wave up to and including the Purkinje fibres
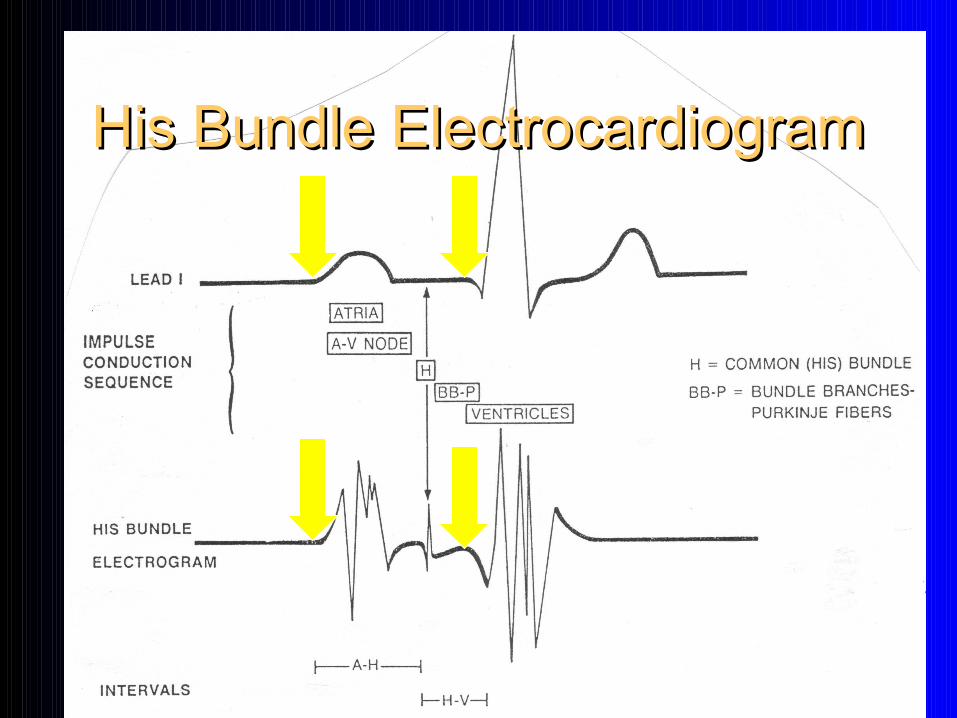
His Bundle ElectrocardiogramHis Bundle Electrocardiogram
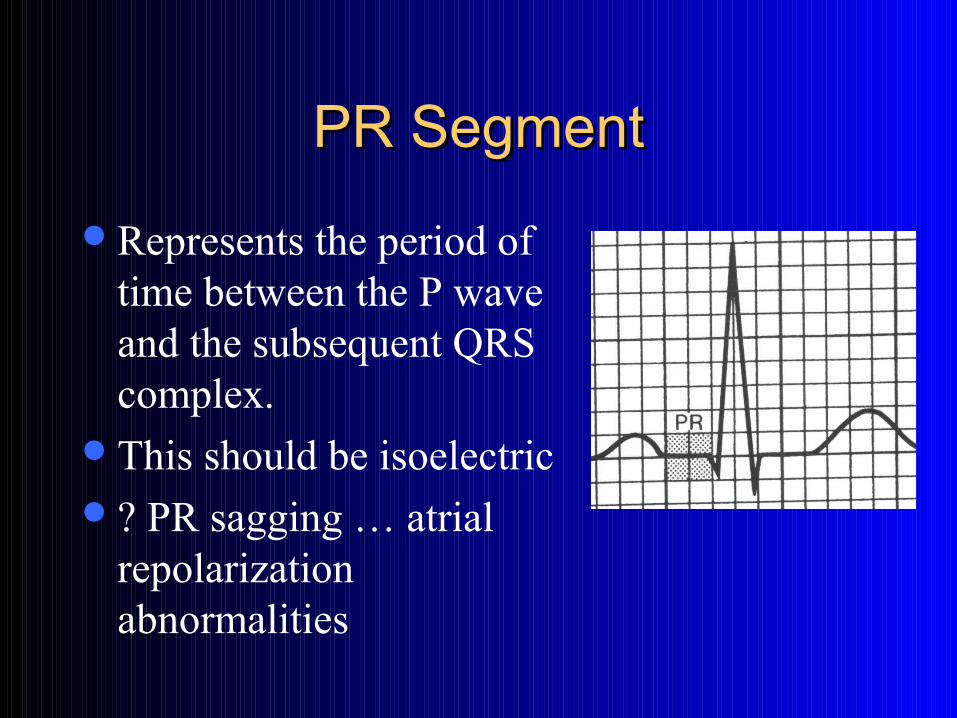
PR SegmentPR Segment
Represents the period of time between the P wave and the subsequent QRS complex.
This should be isoelectric? PR sagging … atrial
repolarization abnormalities
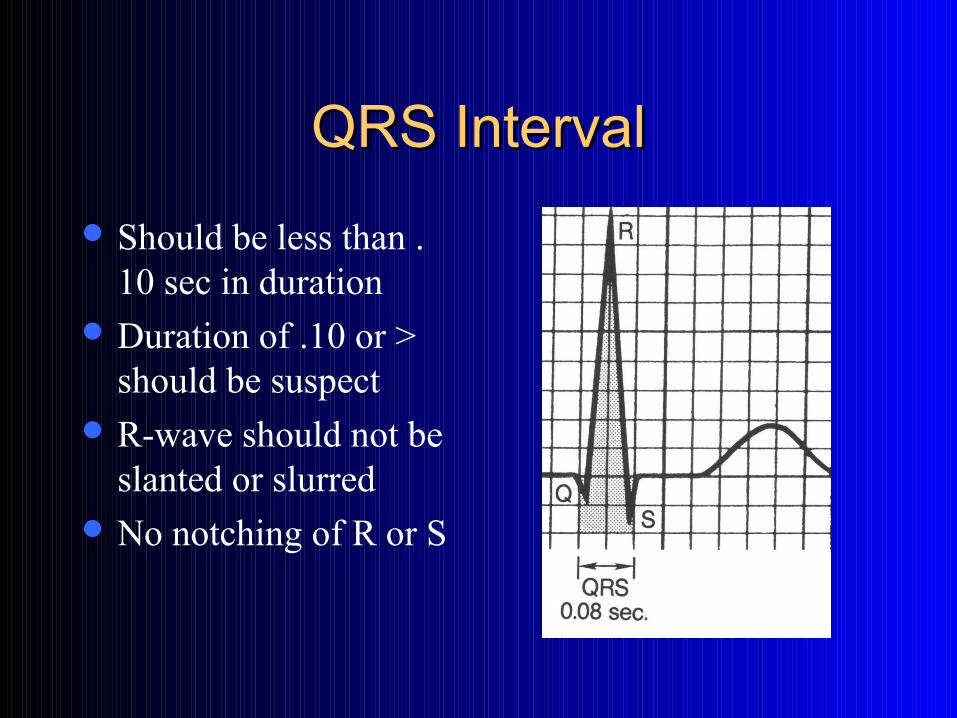
QRS IntervalQRS Interval
Should be less than .10 sec in duration
Duration of .10 or > should be suspect
R-wave should not be slanted or slurred
No notching of R or S
Intervals and Segments –Intervals and Segments –VATVAT
Ventricular Activation Time (VAT) Beginning of the QRS to the peak of the R wave
(or R1) Time necessary for the depolarization wave to
travel from the endocardium to the epicardium Time longer for LV than RV due to relative
muscle mass Earlier & more sensitive indicator than a global
increase in QRS duration
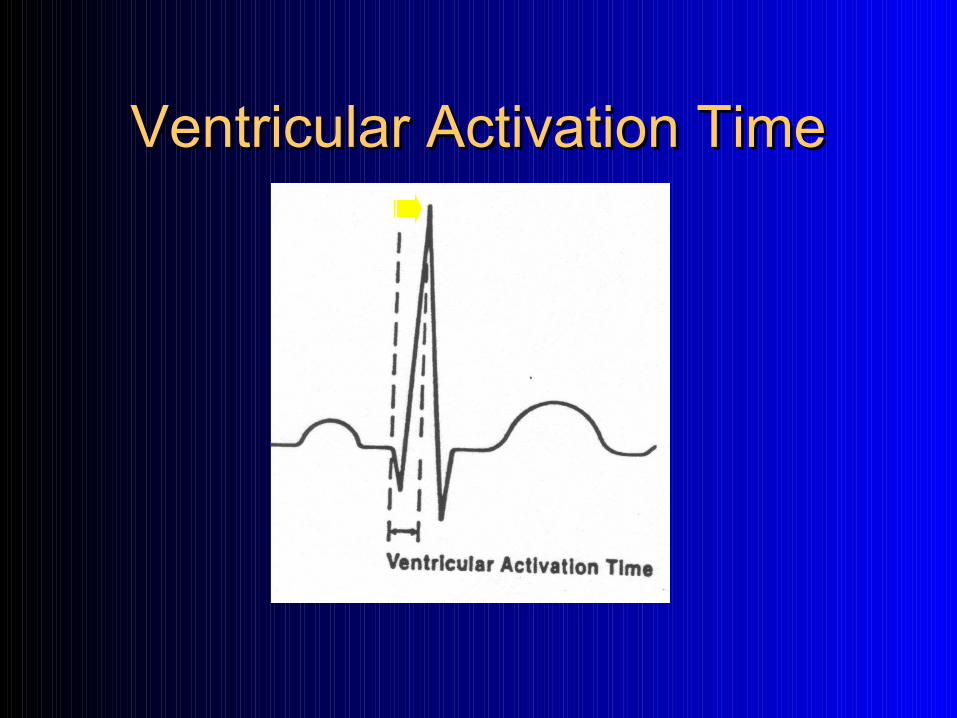
Ventricular Activation TimeVentricular Activation Time
ST SegmentST Segment
From the end of the QRS complex (at junction point) to the onset of the ascending limb of the T wave
Should be isoelectric … look for depression or elevation
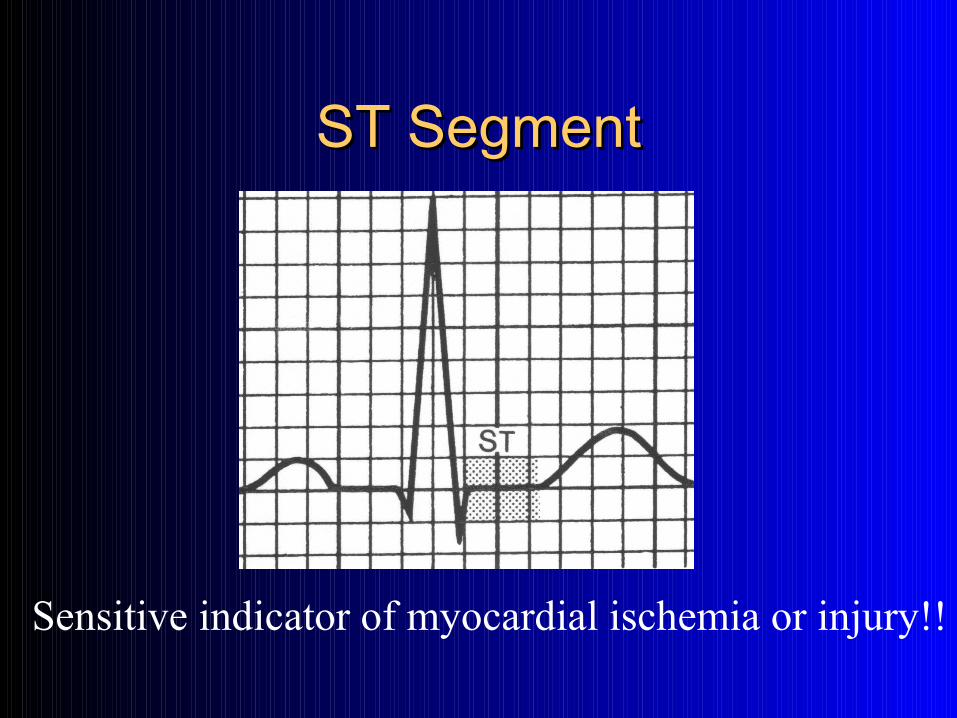
ST SegmentST Segment
Sensitive indicator of myocardial ischemia or injury!!
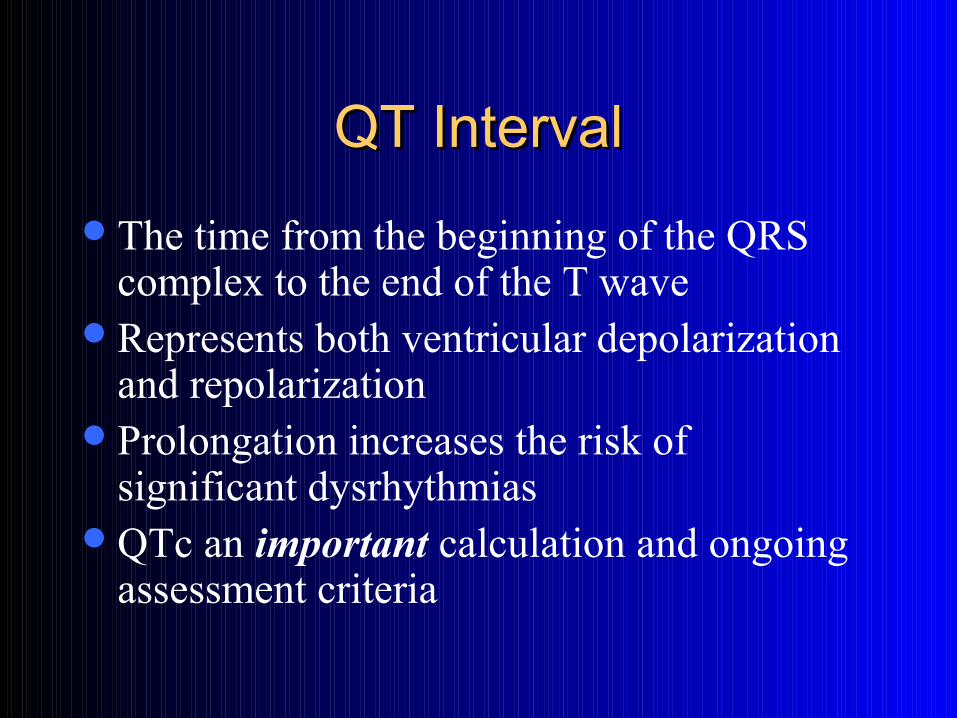
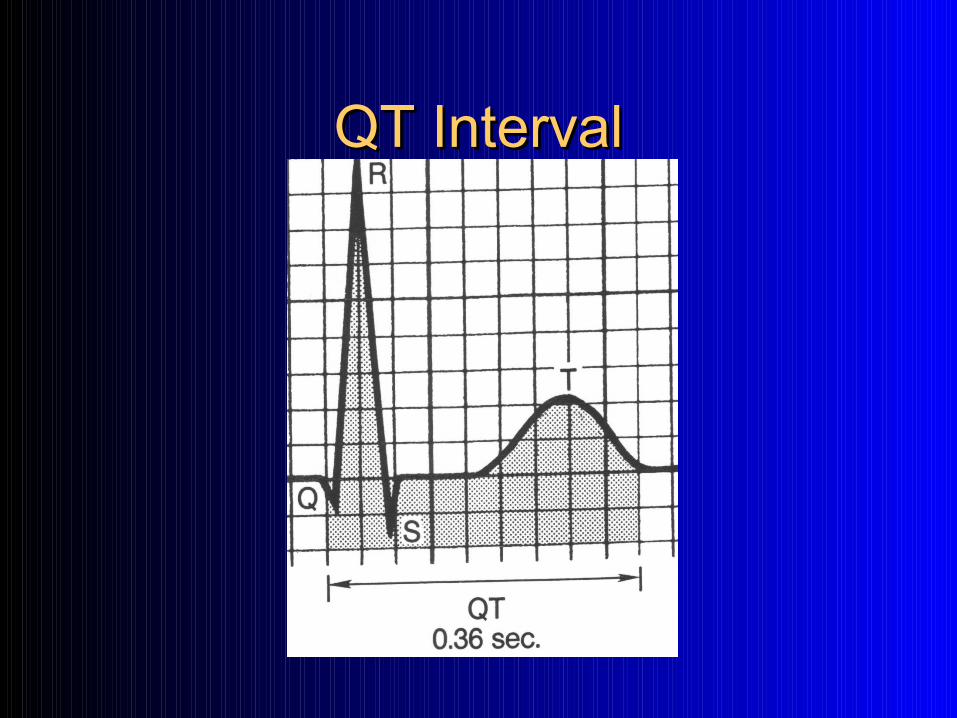
QT IntervalQT Interval
The time from the beginning of the QRS complex to the end of the T wave
Represents both ventricular depolarization and repolarization
Prolongation increases the risk of significant dysrhythmias
QTc an important calculation and ongoing assessment criteria
QT IntervalQT Interval
QT/QTc Interval MonitoringQT/QTc Interval Monitoring
Who, What, When, Where, Why??
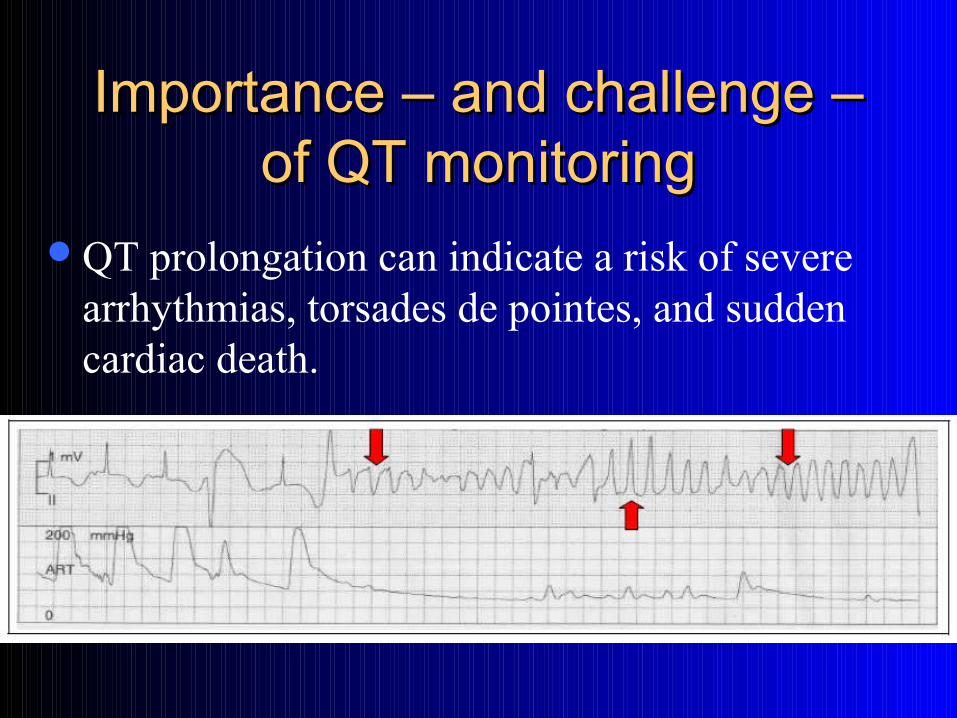
Importance – and challenge – Importance – and challenge – of QT monitoringof QT monitoring
QT prolongation can indicate a risk of severe arrhythmias, torsades de pointes, and sudden cardiac death.
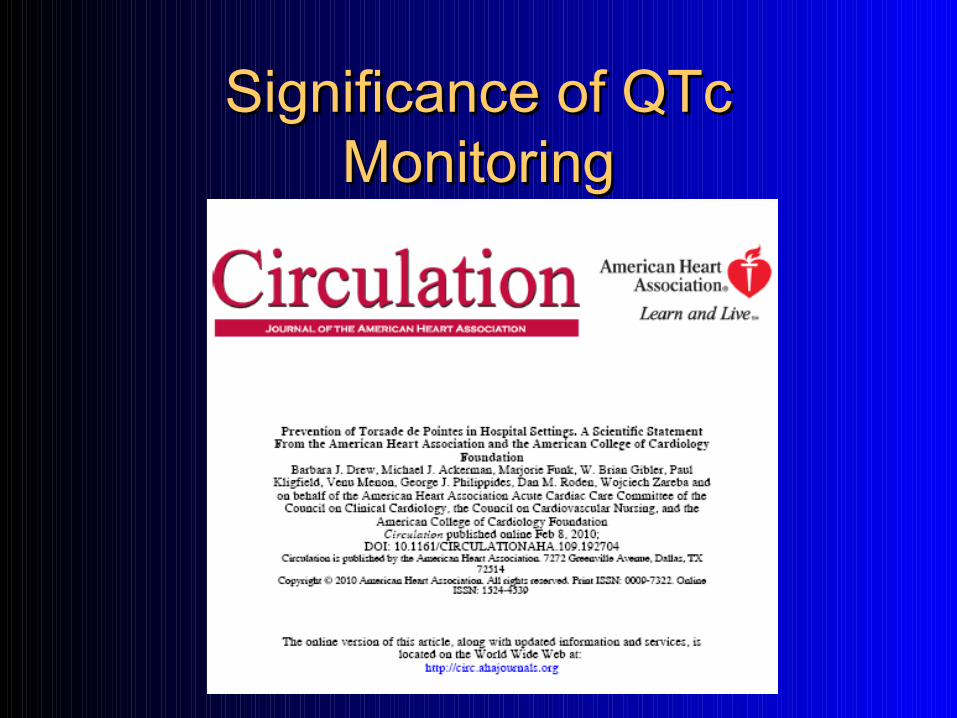
Significance of QTc Significance of QTc MonitoringMonitoring
Importance – and challenge – Importance – and challenge – of QT monitoringof QT monitoring
A growing number of anti-arrhythmic, anti-psychotic, and antibiotic medications can cause QT prolongation
A combination of variables can put your patient at risk.
Increased Risk for Torsades Increased Risk for Torsades de Pointesde Pointes
QT prolonging drugs (this list is LONG)FemalesOlder PatientsBradycardiaImpaired LV function (ischemia, LV
hypertrophy)HypokalemiaHypomagnesemia
QT and QTcQT and QTc
The QT has an inverse relationship to HR.QT = QTc at a HR of 60 bpm onlyHeart rate corrected QT interval is
abbreviated as QTcCorrection formulas, including the Bazett
and Fridericia, are population based & may not be representative for a particular patient
Drugs may also change the relationship between QT and HR
Normal QTc values?Normal QTc values?
Regardless of the 4 correction formulas used, a QTc of < 460 ms in women and < 460 ms in men is considered normal.
Clinical Guidelines suggest that Bazett and Fridericia formulas be included in all drug study submissions. Philips defaults to Bazett, but the configuration supports both.
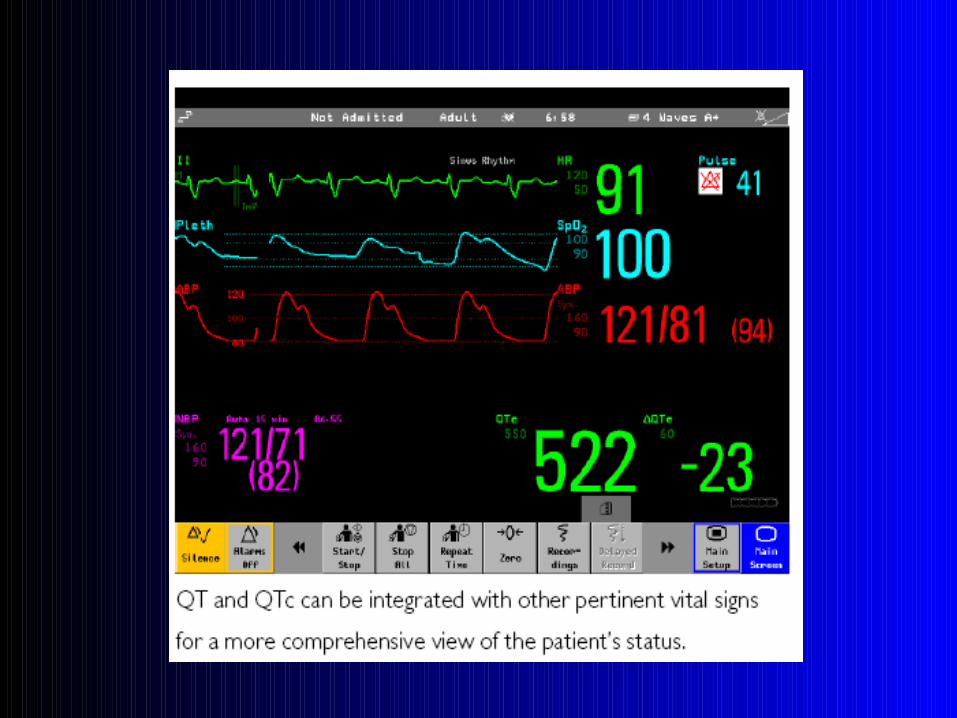
CompatibilityCompatibility
Continuous QT/QTc measurement is part of the Philips ST/Arrhythmia algorithm
Available on all IntelliVue Patient Monitors, Information Centre and Telemetry Systems.
3-Lead, 5-Lead, 6-Lead, EASI-derived 12-Lead & 12-Lead systems
““Normal” ECG WaveformNormal” ECG Waveform

Understanding Monitoring Understanding Monitoring Principles and ConceptsPrinciples and Concepts
Vectors, Leads, Polarity and Deflections …
How are they all related?
Recording of Electrical Forces Recording of Electrical Forces – The Lead Concept– The Lead Concept
A lead is an electrical system to record electrical activity
Multiple Leads are used in cardiac monitoring and ECG recording systems
A lead is composed on a negative and a positive pole
Sense the direction and magnitude of electrical forces
Recording of Electrical Forces Recording of Electrical Forces – The Lead Concept– The Lead Concept
Record surface information from different regions (or walls) of the myocardium.
The positive pole on any respective lead is the “sensing electrode”
It records electrical activity according to its perspective only (narrow and limited view)
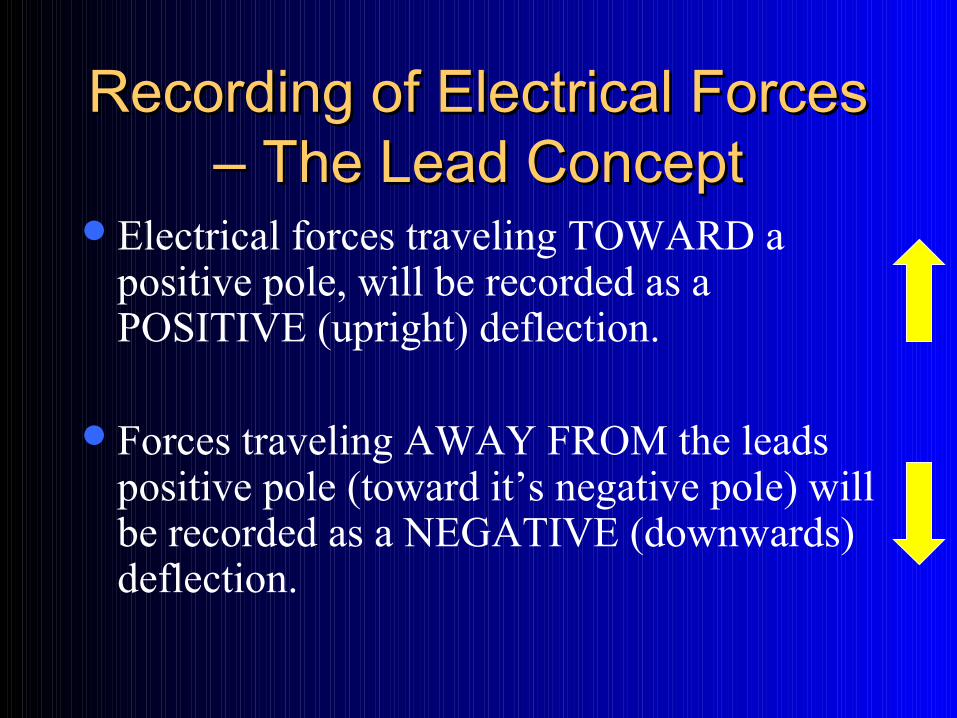
Recording of Electrical Forces Recording of Electrical Forces – The Lead Concept– The Lead Concept
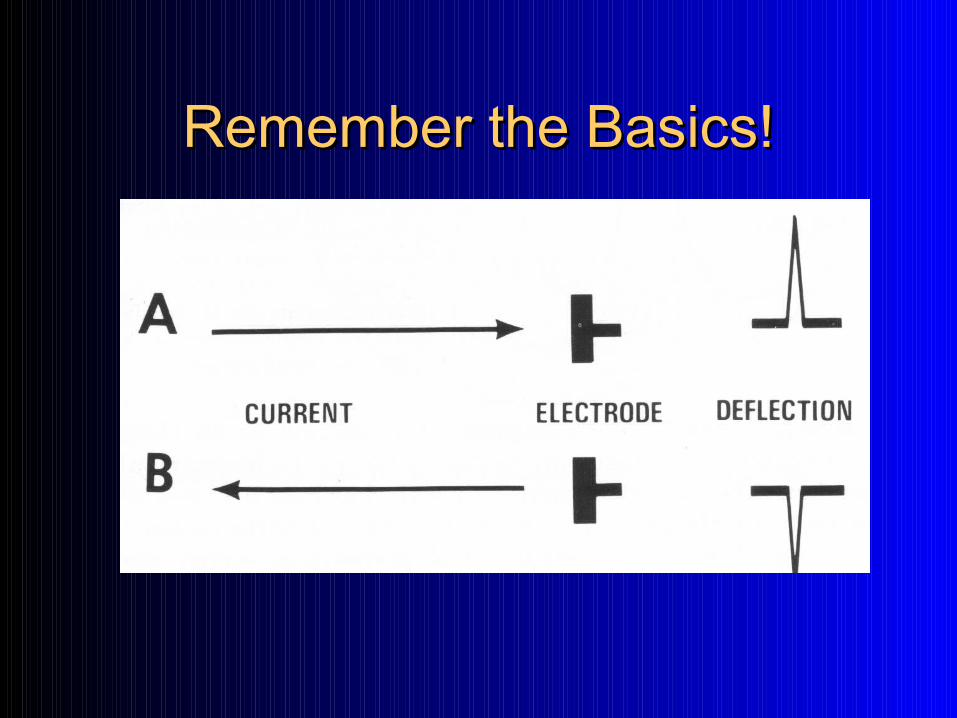
Electrical forces traveling TOWARD a positive pole, will be recorded as a POSITIVE (upright) deflection.
Forces traveling AWAY FROM the leads positive pole (toward it’s negative pole) will be recorded as a NEGATIVE (downwards) deflection.
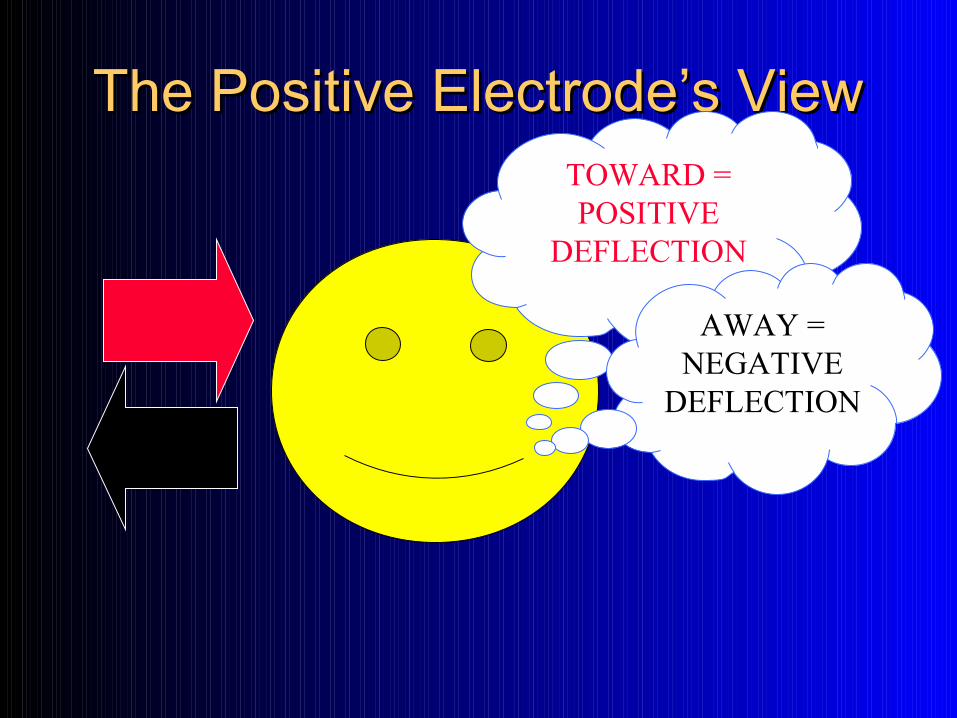
The Positive Electrode’s ViewThe Positive Electrode’s ViewTOWARD =POSITIVE
DEFLECTION
AWAY = NEGATIVE
DEFLECTION

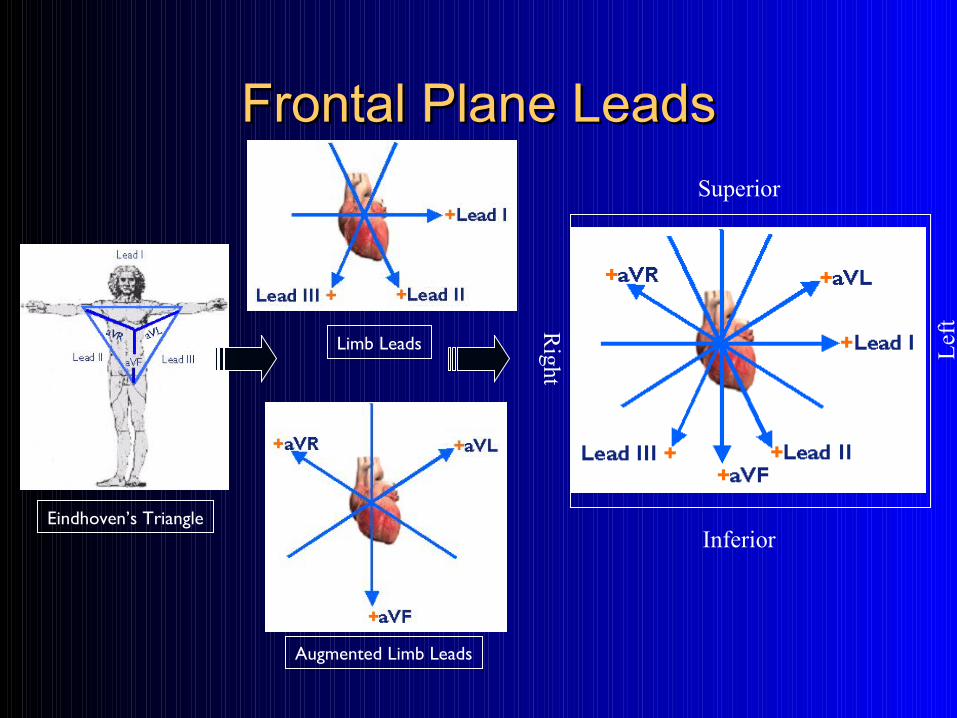
Planes of the HeartPlanes of the Heart
FrontalHorizontalSagittal
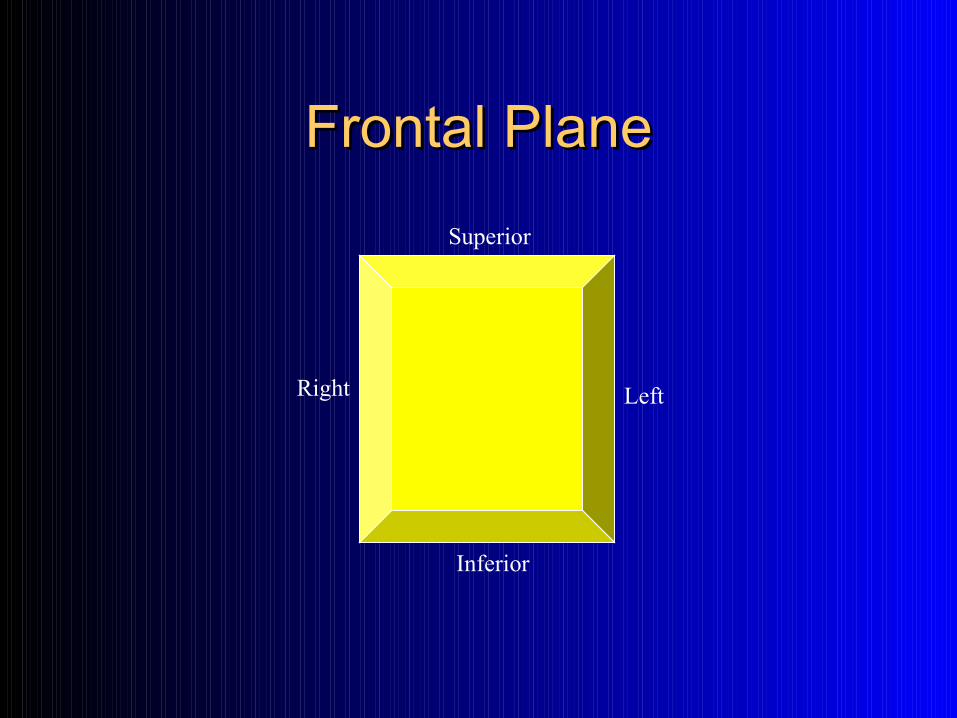
Frontal PlaneFrontal Plane
Superior
Inferior
LeftRight
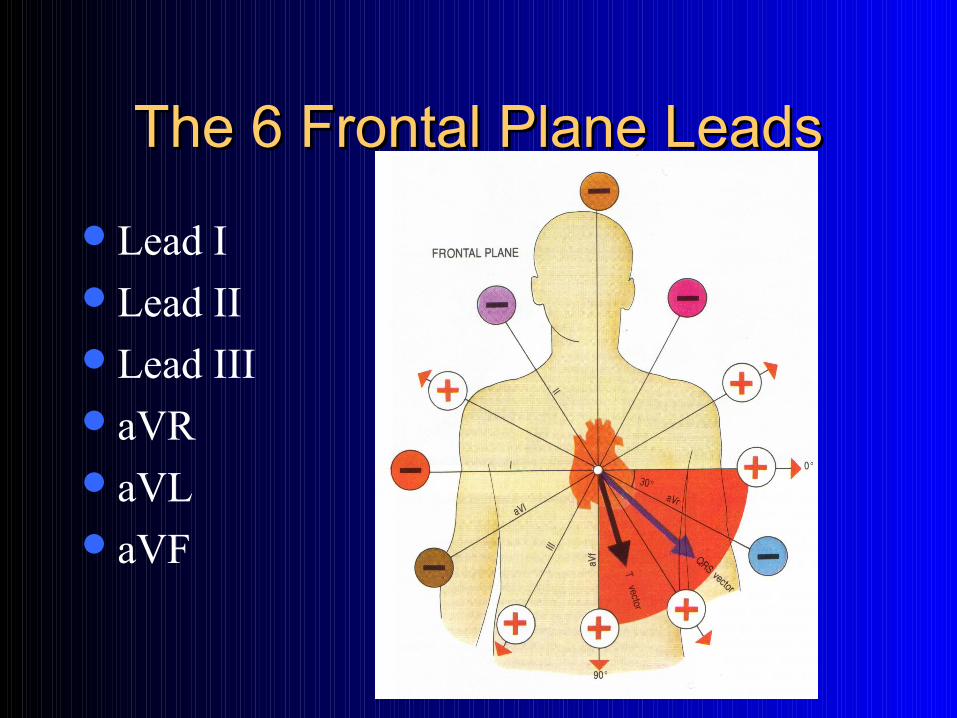
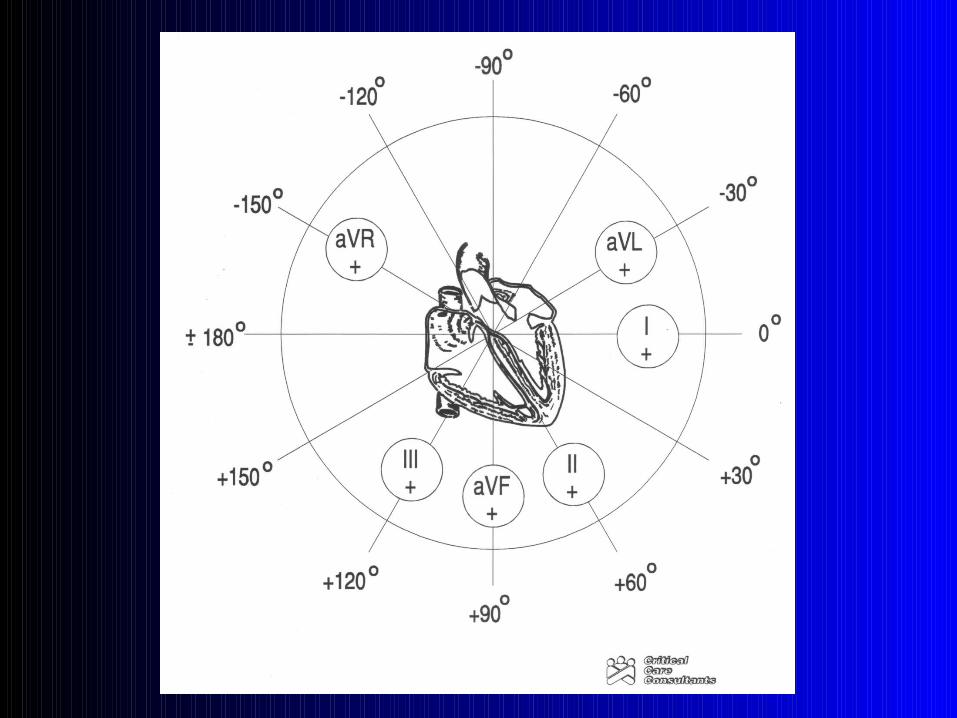
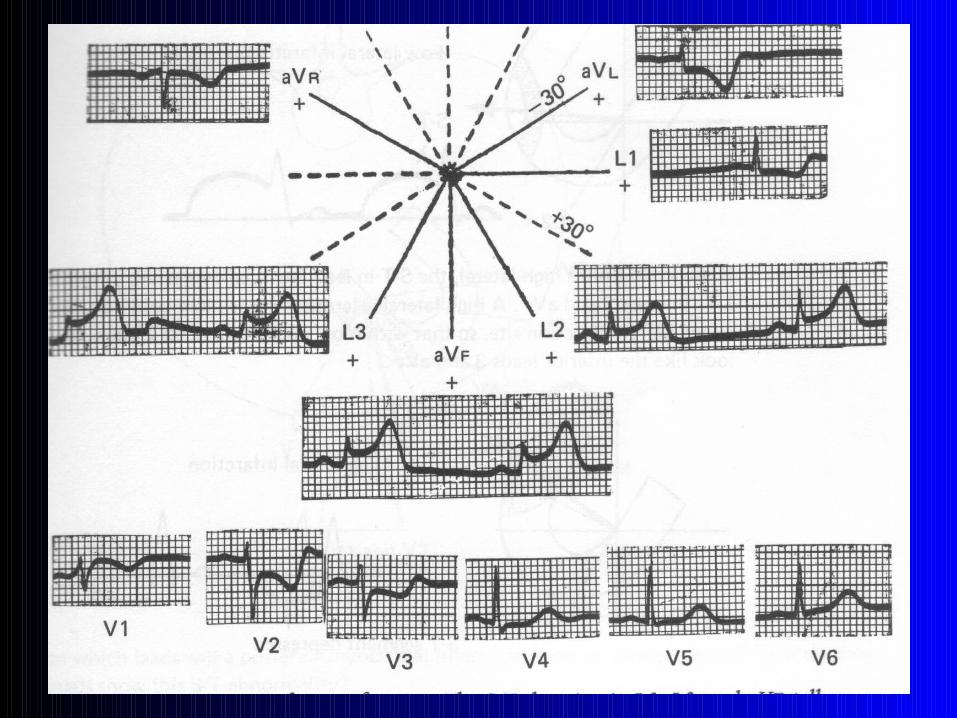
The 6 Frontal Plane LeadsThe 6 Frontal Plane Leads
Lead ILead IILead IIIaVRaVLaVF
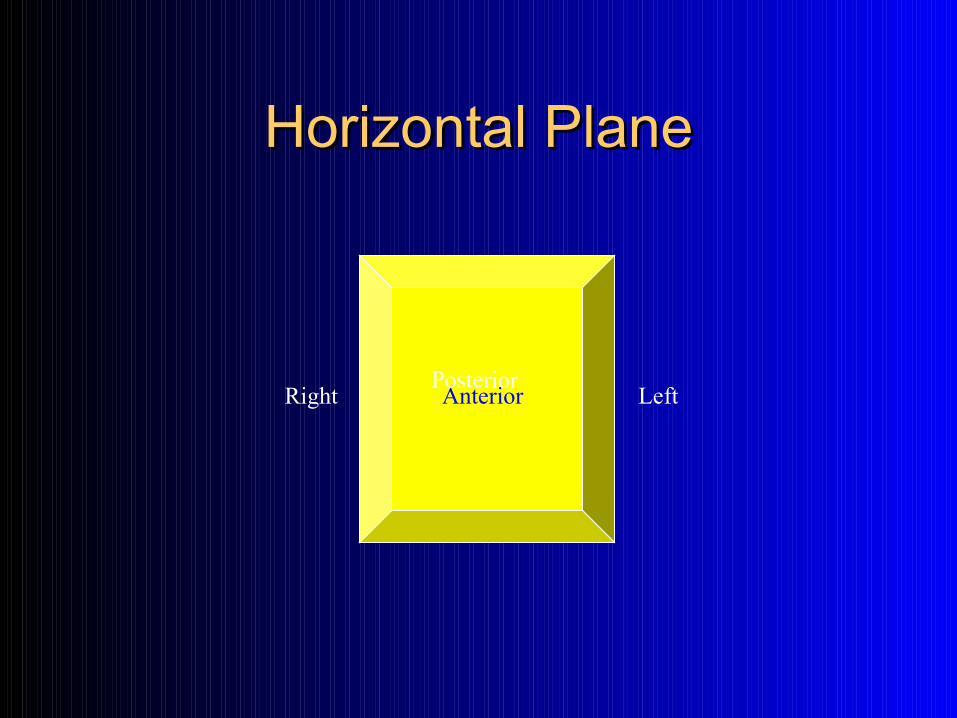
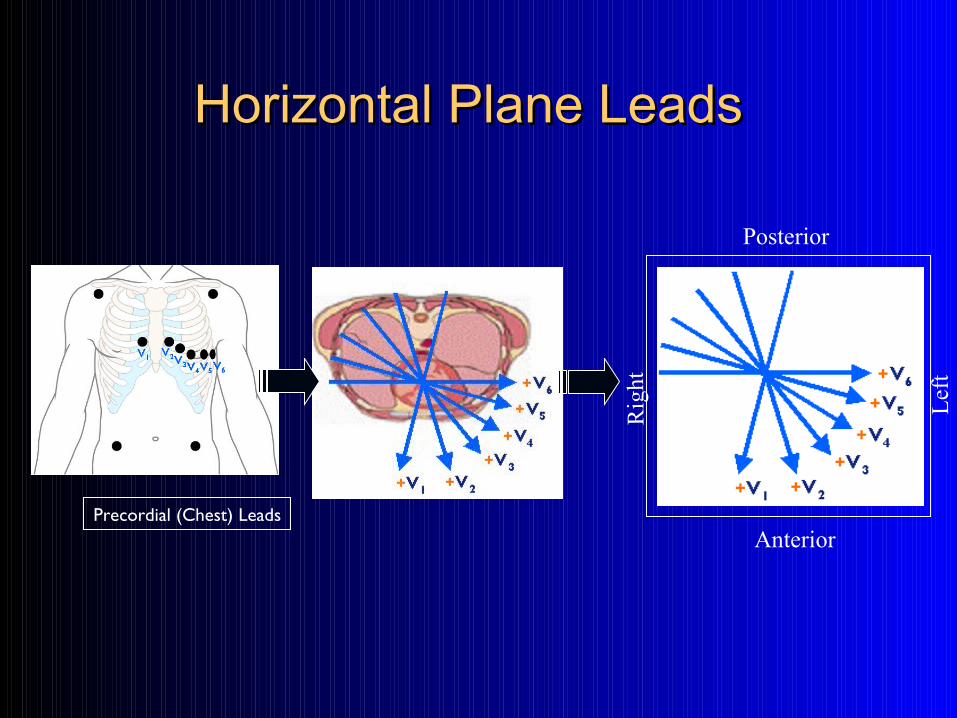
Horizontal PlaneHorizontal Plane
LeftRight AnteriorPosterior
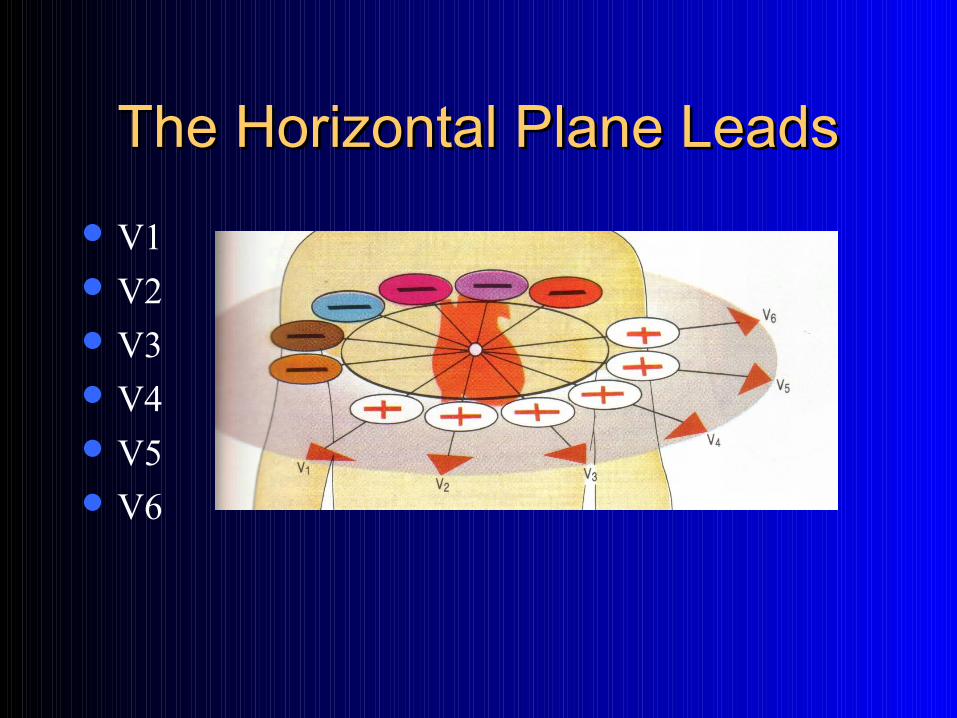
The Horizontal Plane LeadsThe Horizontal Plane Leads
V1 V2 V3 V4 V5 V6
The Horizontal Plane LeadsThe Horizontal Plane Leads
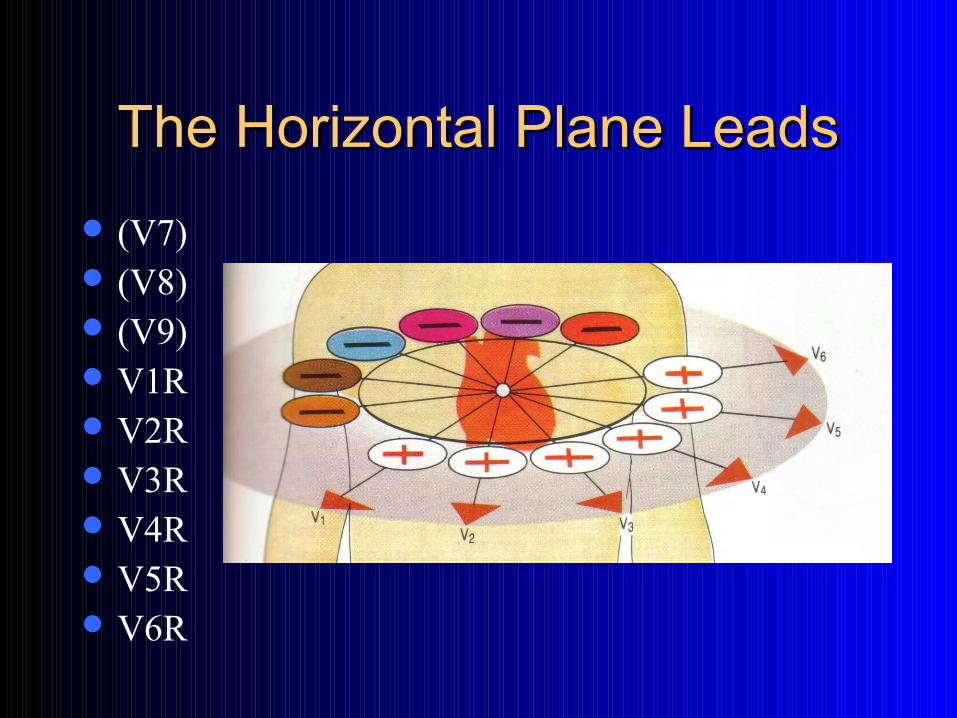
(V7) (V8) (V9) V1R V2R V3R V4R V5R V6R
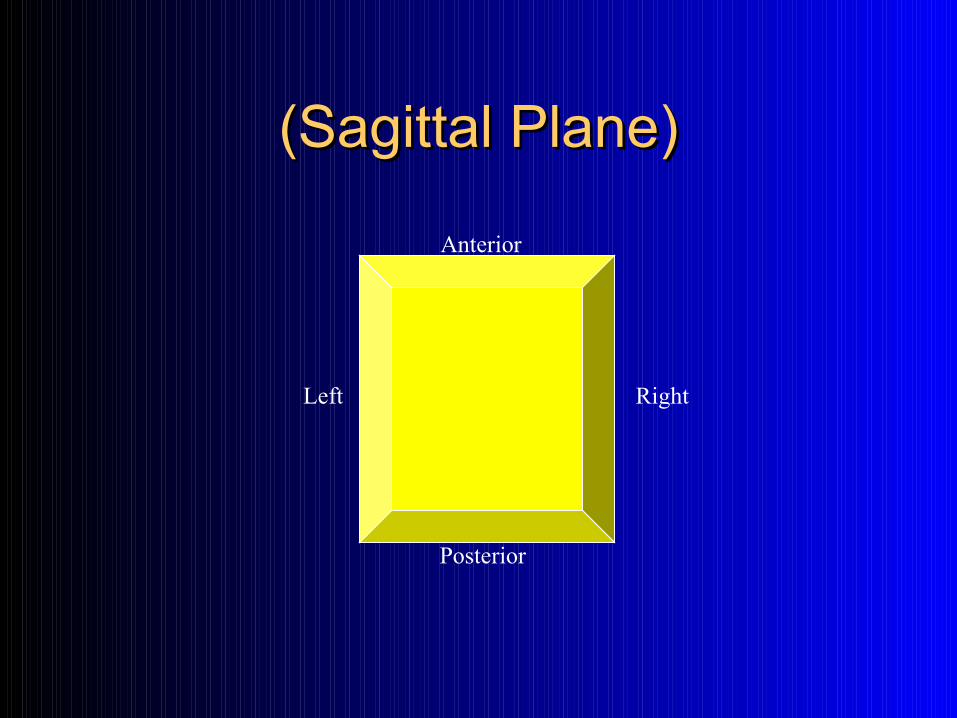
(Sagittal Plane)(Sagittal Plane)
RightLeft
Posterior
Anterior
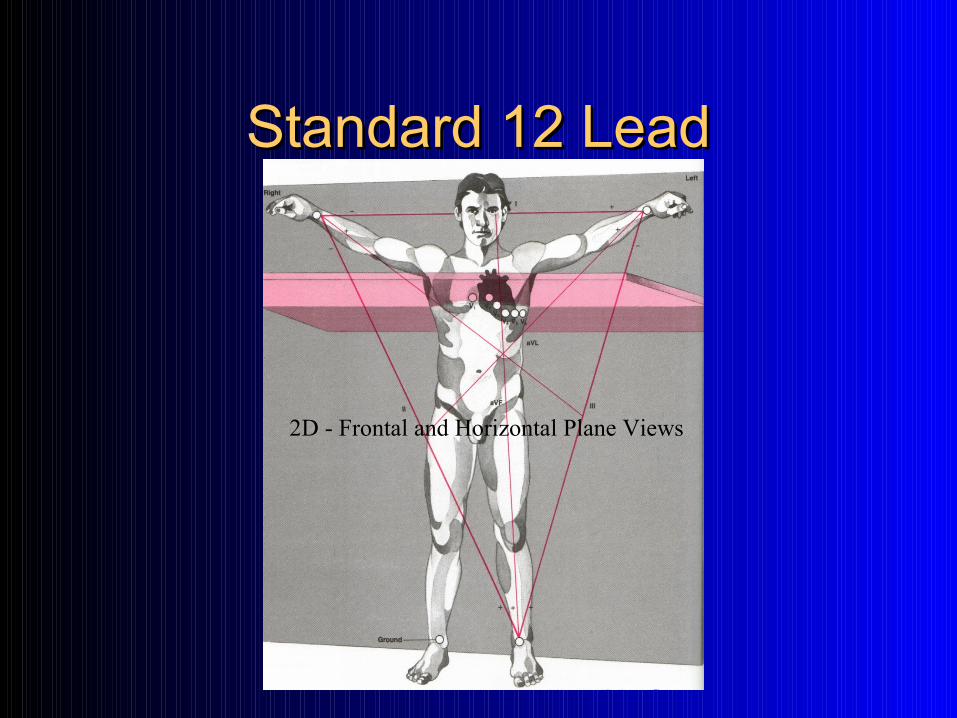
Standard 12 LeadStandard 12 Lead
2D - Frontal and Horizontal Plane Views

Bipolar LeadsBipolar Leads
Each lead has two physical poles, a positive pole and a negative pole
Lead I, II and III(also referred to as limb leads or extremity
leads, because of their placement on the body)
Einthoven’s Triangle
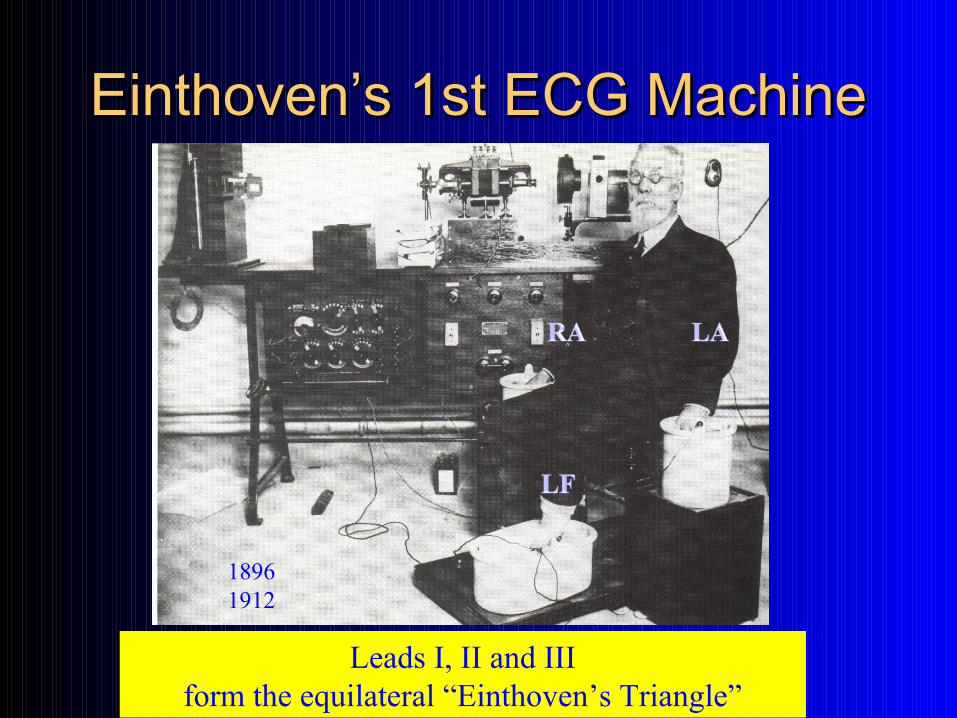
Einthoven’s 1st ECG MachineEinthoven’s 1st ECG Machine
1896 1912
Leads I, II and IIIform the equilateral “Einthoven’s Triangle”
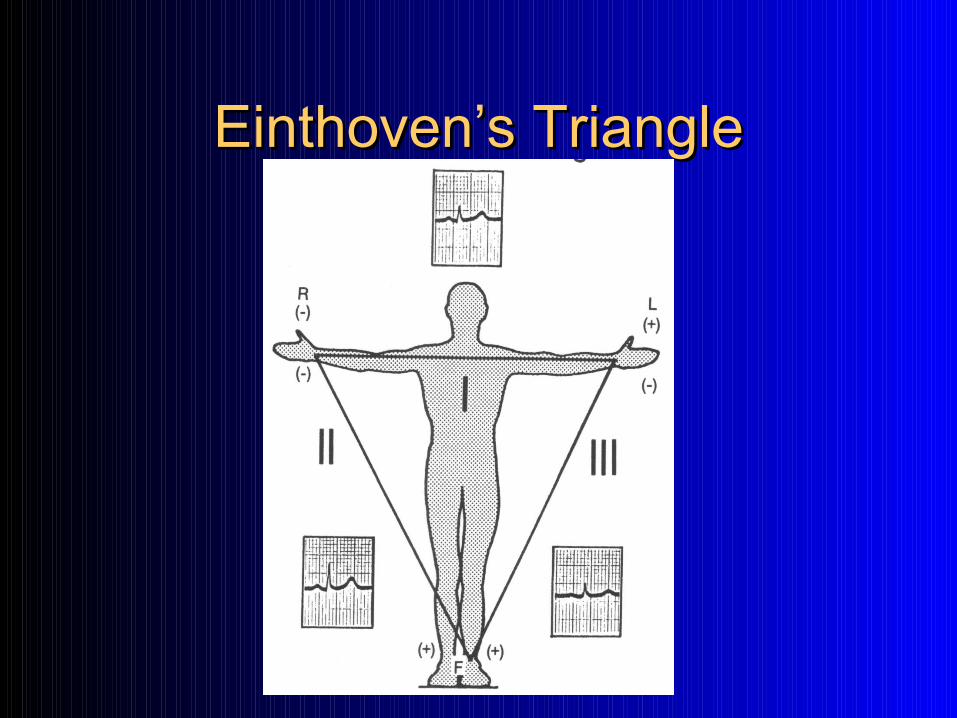
Einthoven’s TriangleEinthoven’s Triangle
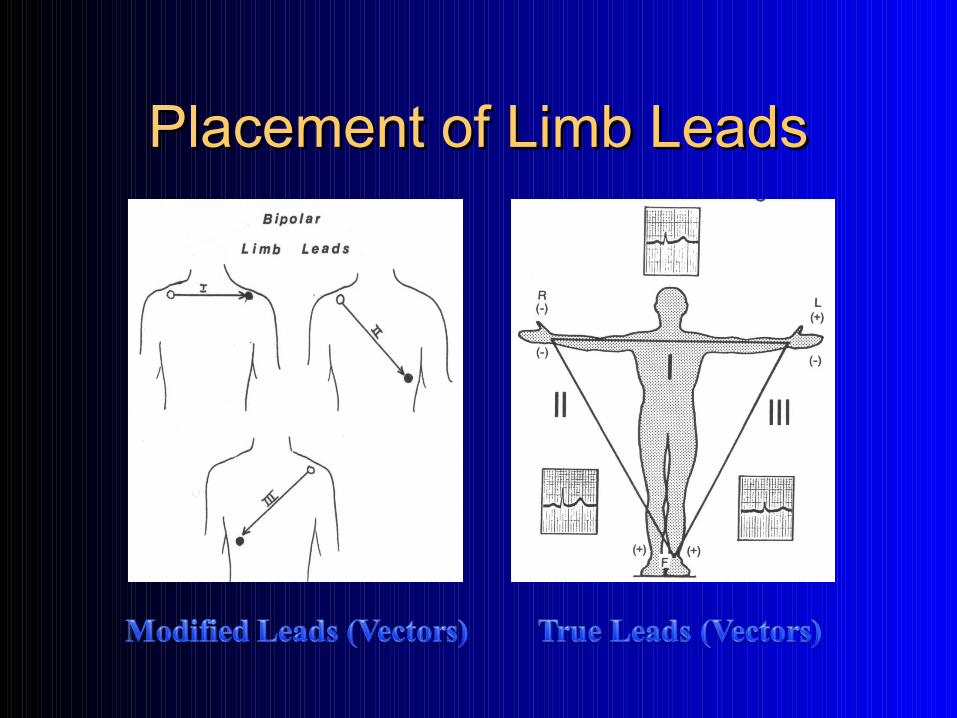
Placement of Limb LeadsPlacement of Limb Leads
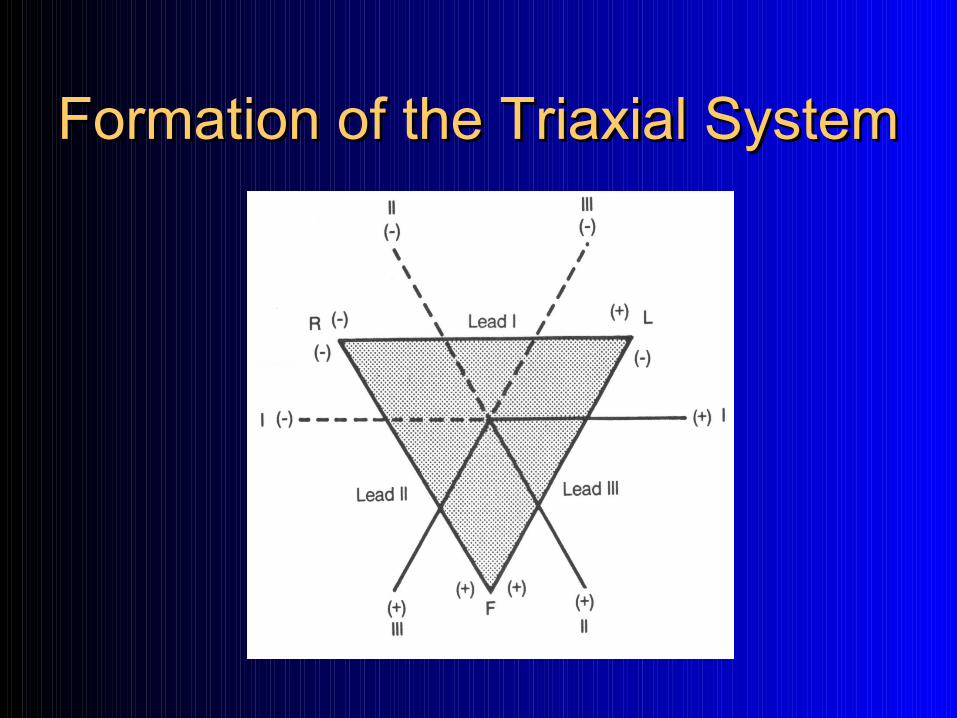
Formation of the Triaxial SystemFormation of the Triaxial System
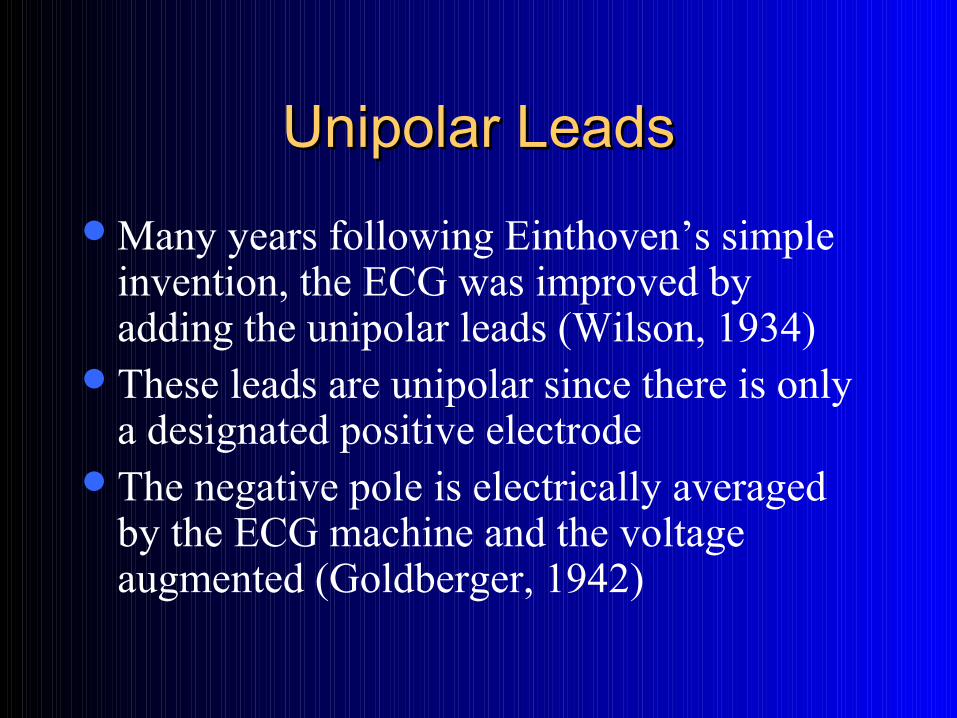
Unipolar LeadsUnipolar Leads
Many years following Einthoven’s simple invention, the ECG was improved by adding the unipolar leads (Wilson, 1934)
These leads are unipolar since there is only a designated positive electrode
The negative pole is electrically averaged by the ECG machine and the voltage augmented (Goldberger, 1942)
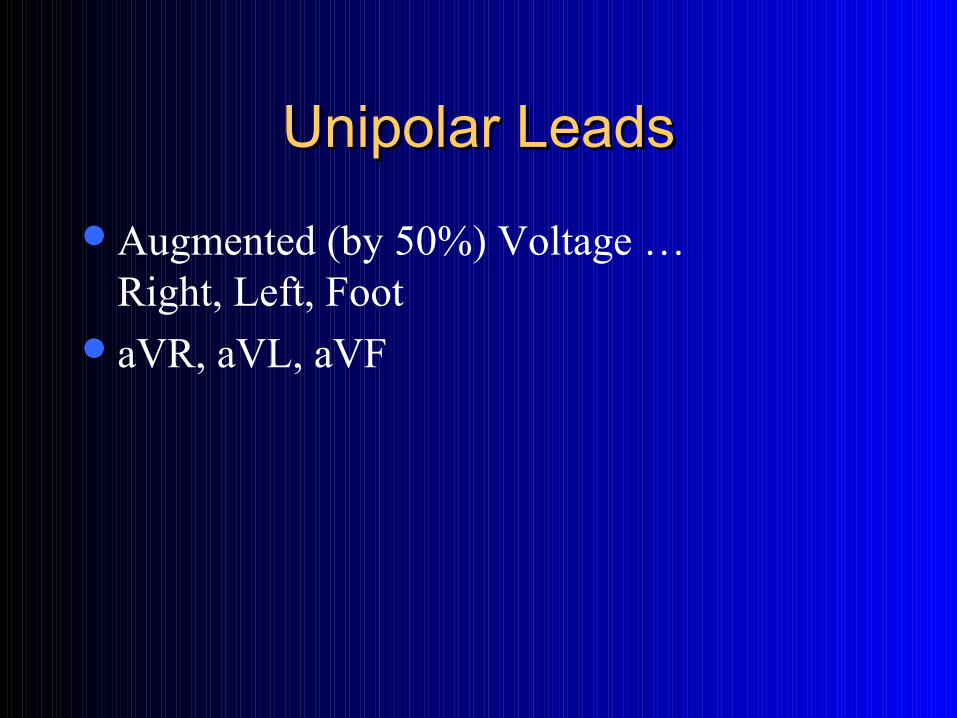
Unipolar LeadsUnipolar Leads
Augmented (by 50%) Voltage … Right, Left, Foot
aVR, aVL, aVF
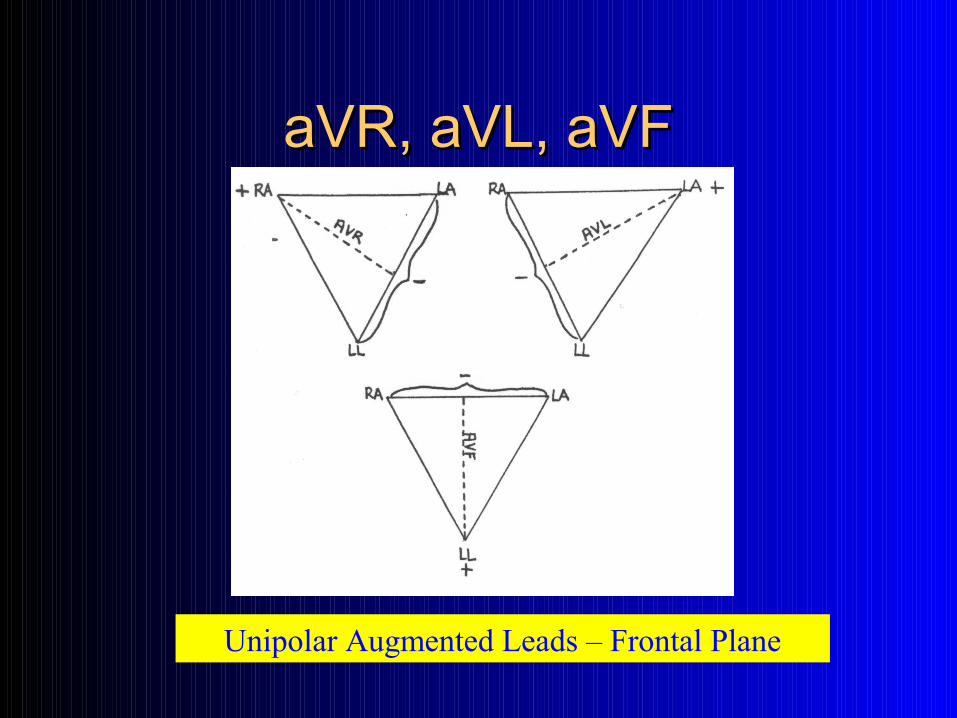
aVR, aVL, aVFaVR, aVL, aVF
Unipolar Augmented Leads – Frontal Plane
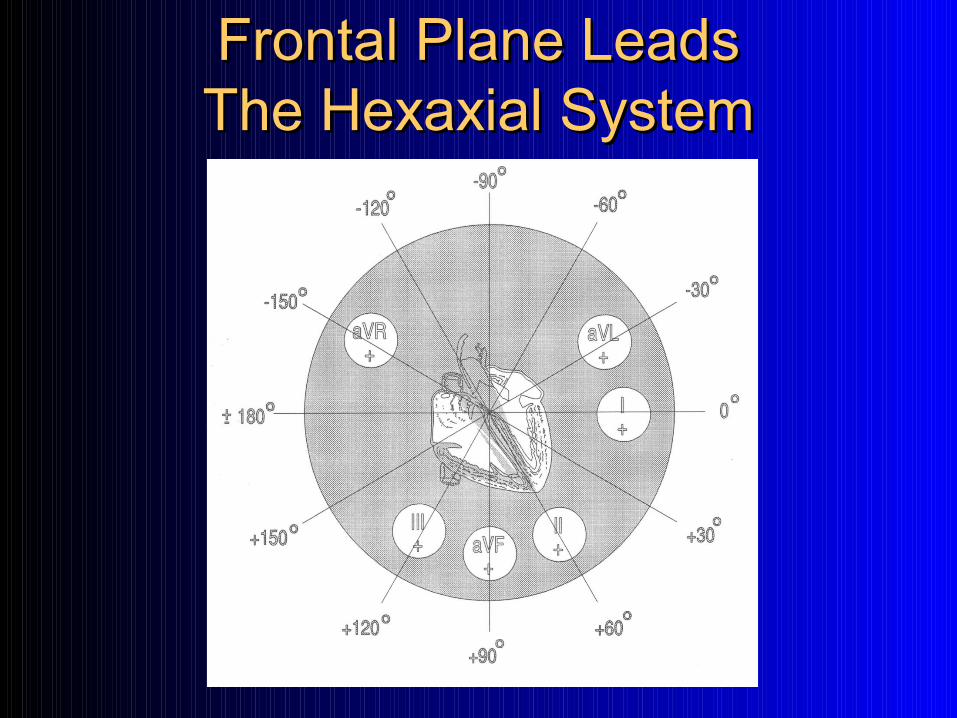
Frontal Plane LeadsFrontal Plane LeadsThe Hexaxial SystemThe Hexaxial System
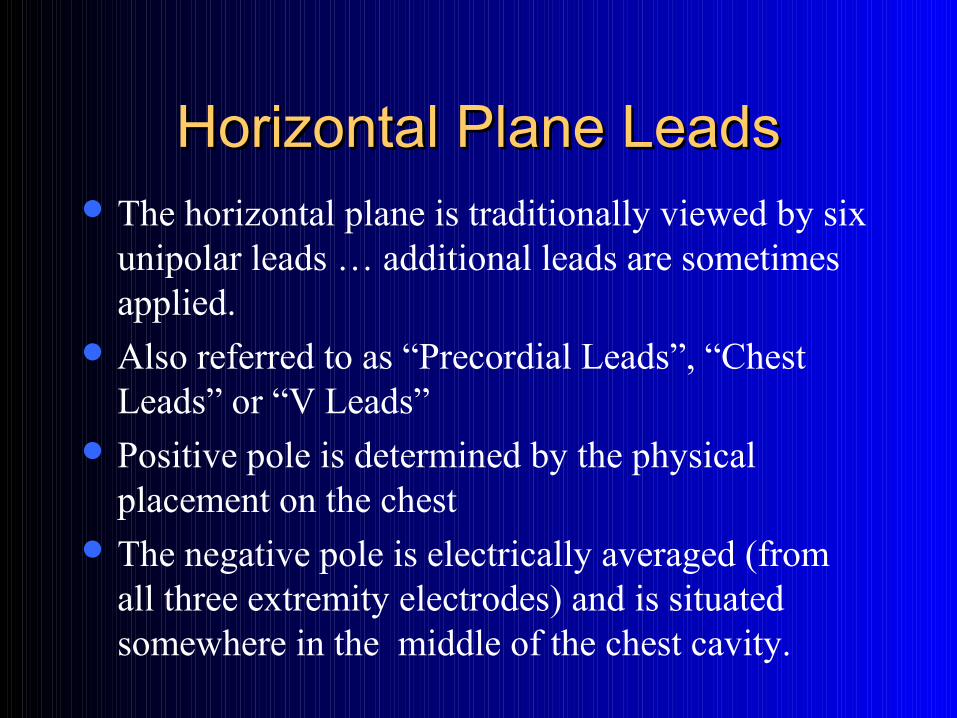
Horizontal Plane LeadsHorizontal Plane Leads The horizontal plane is traditionally viewed by six
unipolar leads … additional leads are sometimes applied.
Also referred to as “Precordial Leads”, “Chest Leads” or “V Leads”
Positive pole is determined by the physical placement on the chest
The negative pole is electrically averaged (from all three extremity electrodes) and is situated somewhere in the middle of the chest cavity.
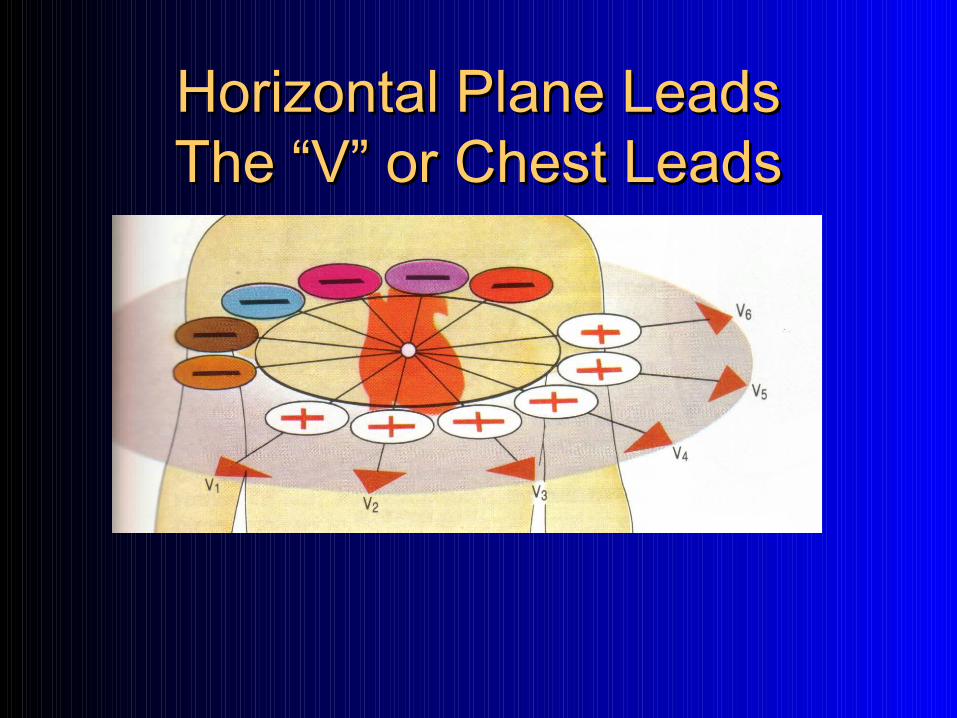
Horizontal Plane LeadsHorizontal Plane LeadsThe “V” or Chest LeadsThe “V” or Chest Leads
Anatomical Landmarking of Anatomical Landmarking of Chest LeadsChest Leads
V1 – 4th ICS immediately to the right of the sternum
V2 – 4th ICS immediately to the left of sternum
V3 – Directly between V2 and V4V4 – 5th ICS, left mid-clavicular lineV5 – 5th ICS, left anterior axillary lineV6 – 5th ICS, left mid-axillary line
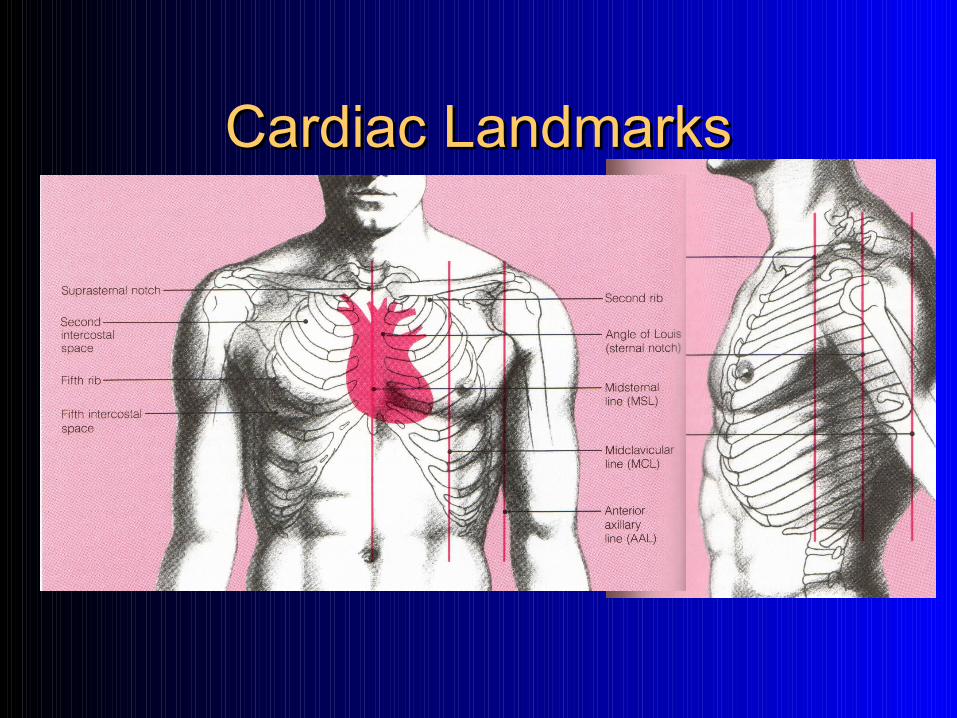
Cardiac LandmarksCardiac Landmarks
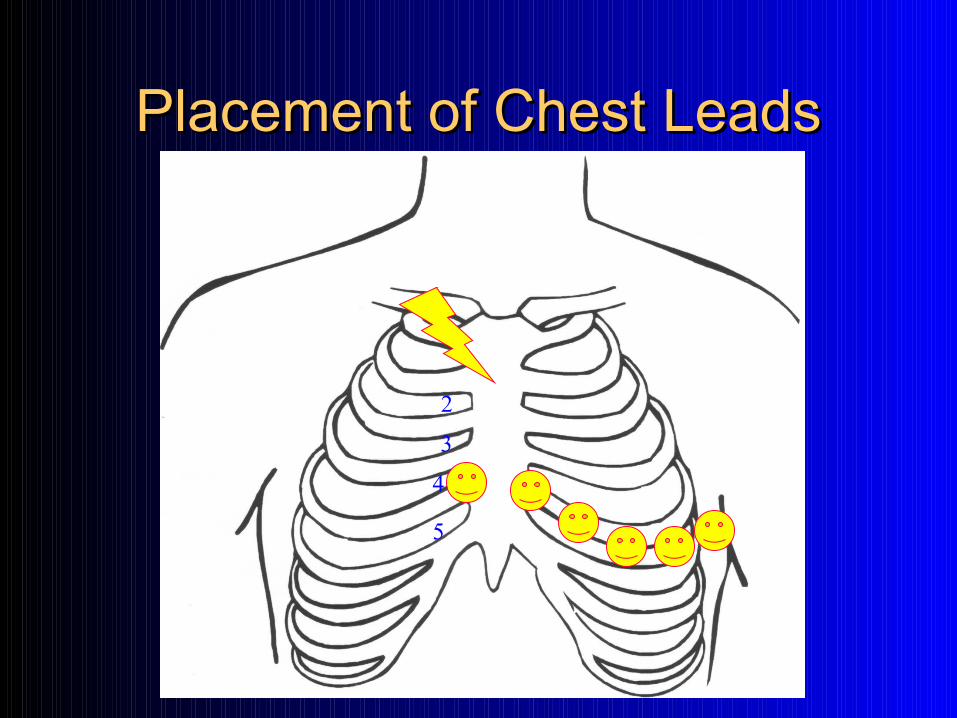
Placement of Chest LeadsPlacement of Chest Leads
2
3
4
5
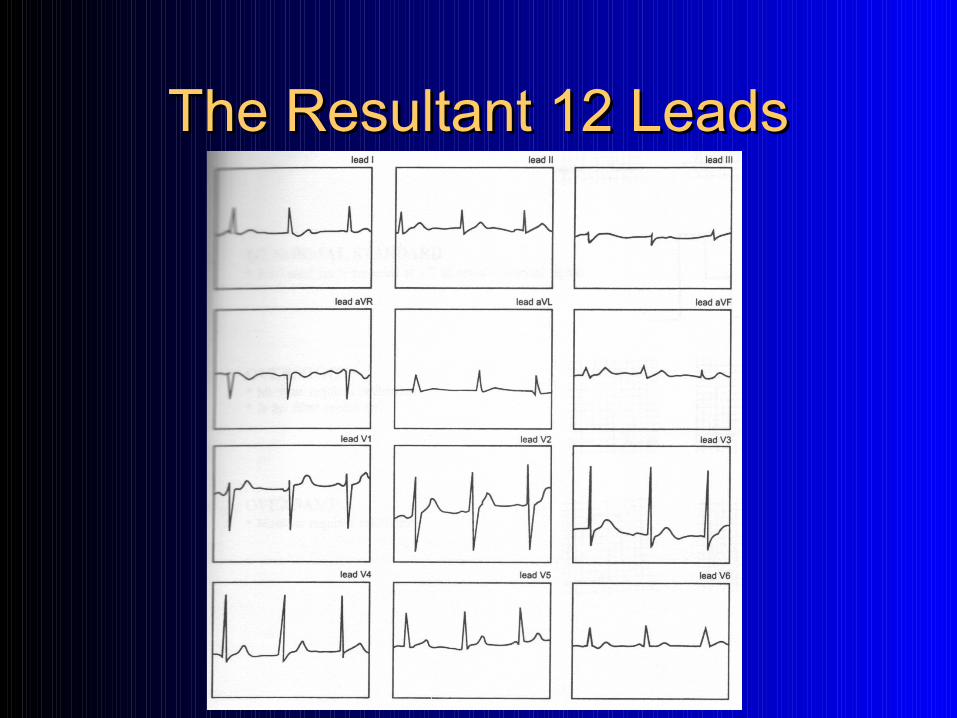
The Resultant 12 LeadsThe Resultant 12 Leads
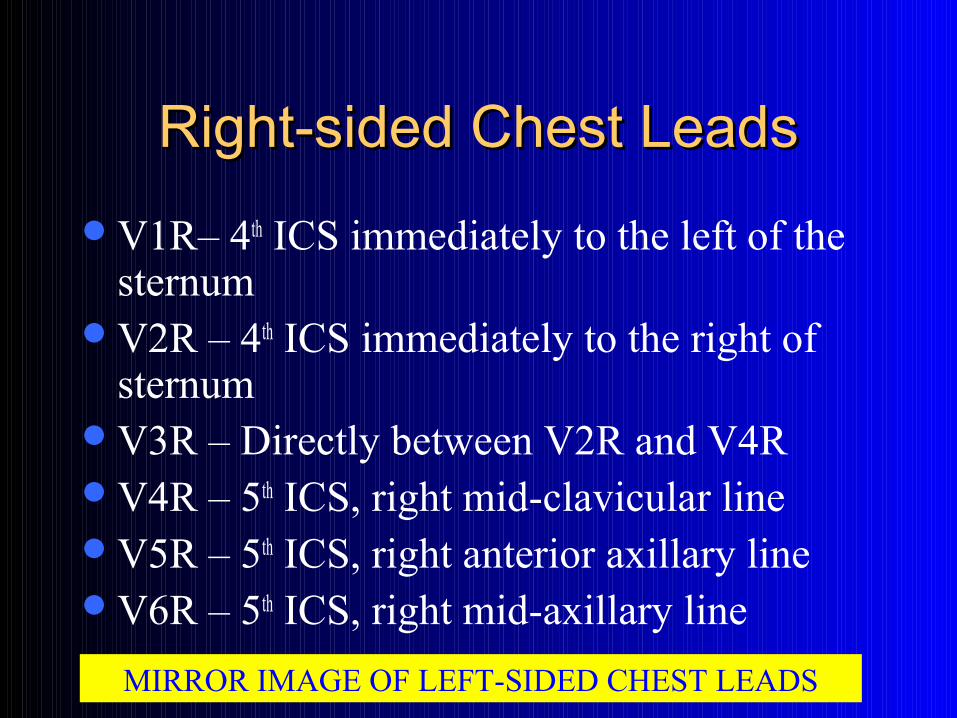
Right-sided Chest LeadsRight-sided Chest Leads
V1R– 4th ICS immediately to the left of the sternum
V2R – 4th ICS immediately to the right of sternum
V3R – Directly between V2R and V4R V4R – 5th ICS, right mid-clavicular lineV5R – 5th ICS, right anterior axillary lineV6R – 5th ICS, right mid-axillary line
MIRROR IMAGE OF LEFT-SIDED CHEST LEADS
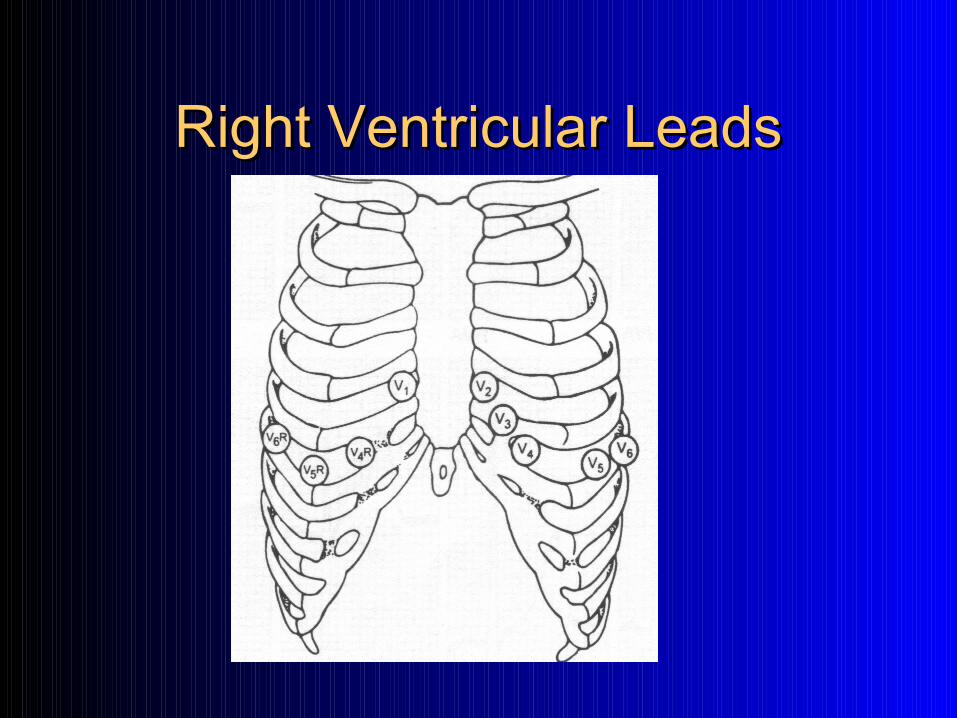
Right Ventricular LeadsRight Ventricular Leads
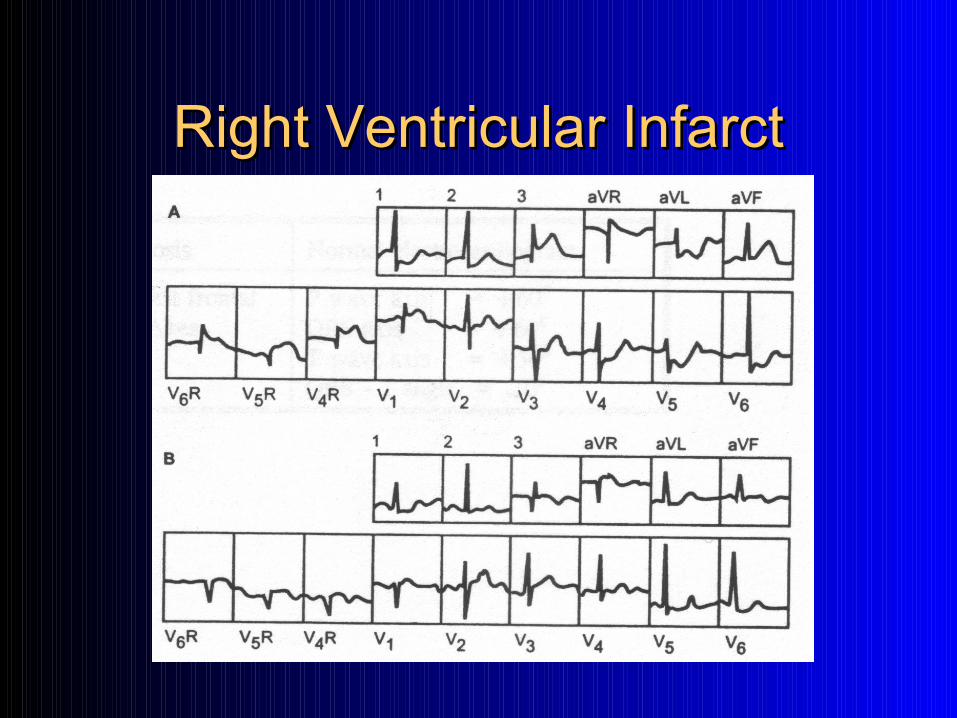
Right Ventricular InfarctRight Ventricular Infarct
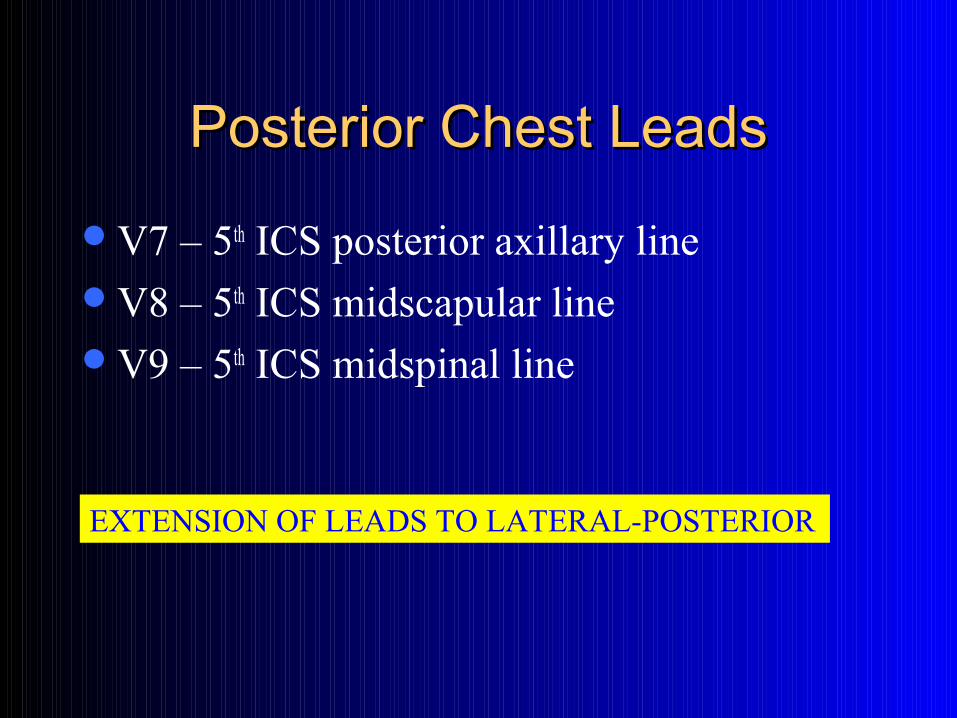
Posterior Chest LeadsPosterior Chest Leads
V7 – 5th ICS posterior axillary lineV8 – 5th ICS midscapular lineV9 – 5th ICS midspinal line
EXTENSION OF LEADS TO LATERAL-POSTERIOR
12-Lead Electrocardiogram12-Lead Electrocardiogram
Lead Options for Clinical Monitoring and Diagnostic Purposes
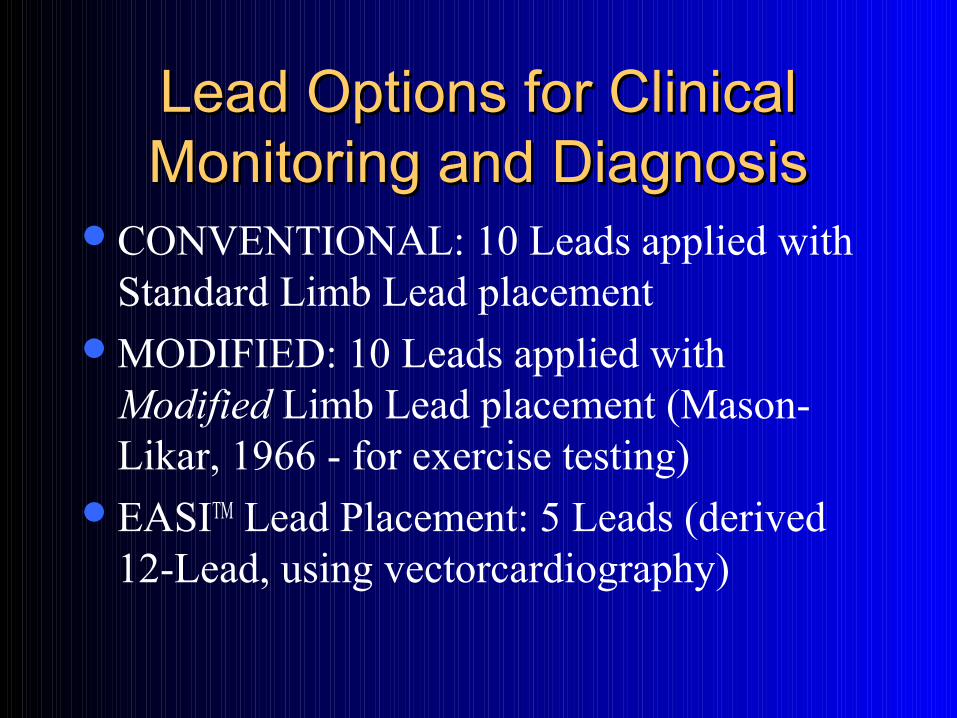
Lead Options for Clinical Lead Options for Clinical Monitoring and DiagnosisMonitoring and Diagnosis
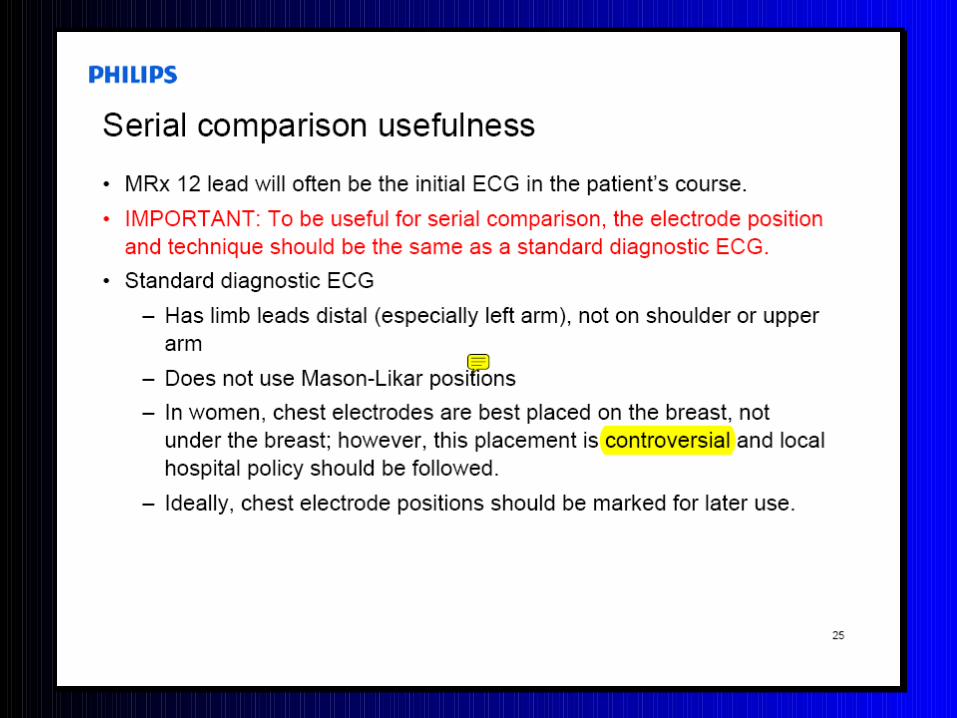
CONVENTIONAL: 10 Leads applied with Standard Limb Lead placement
MODIFIED: 10 Leads applied with Modified Limb Lead placement (Mason-Likar, 1966 - for exercise testing)
EASITM Lead Placement: 5 Leads (derived 12-Lead, using vectorcardiography)
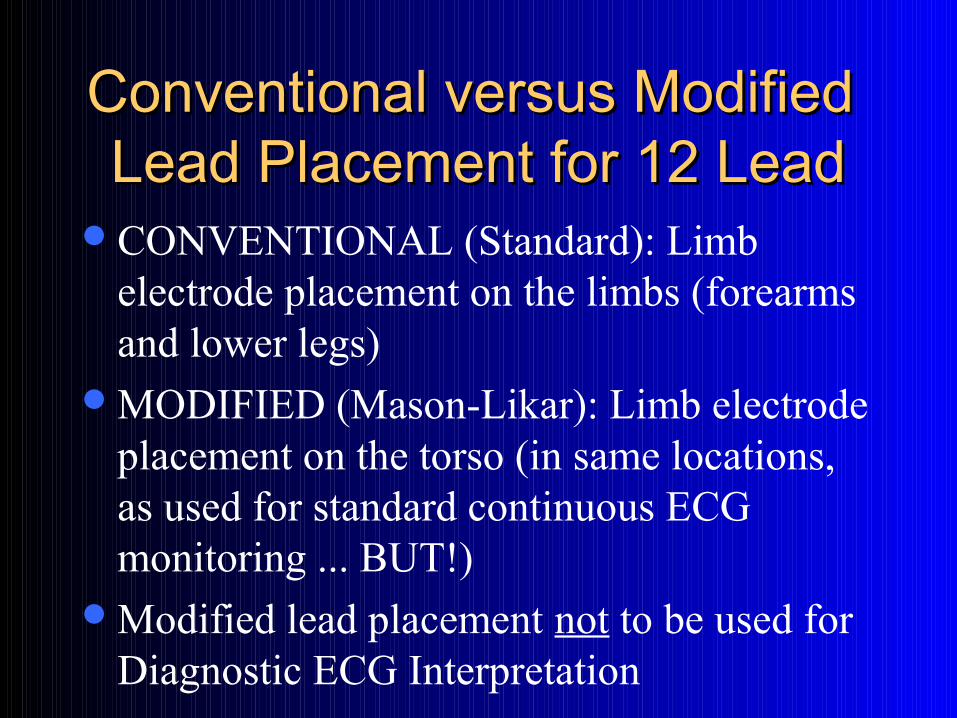
Conventional versus Modified Conventional versus Modified Lead Placement for 12 LeadLead Placement for 12 Lead
CONVENTIONAL (Standard): Limb electrode placement on the limbs (forearms and lower legs)
MODIFIED (Mason-Likar): Limb electrode placement on the torso (in same locations, as used for standard continuous ECG monitoring ... BUT!)
Modified lead placement not to be used for Diagnostic ECG Interpretation
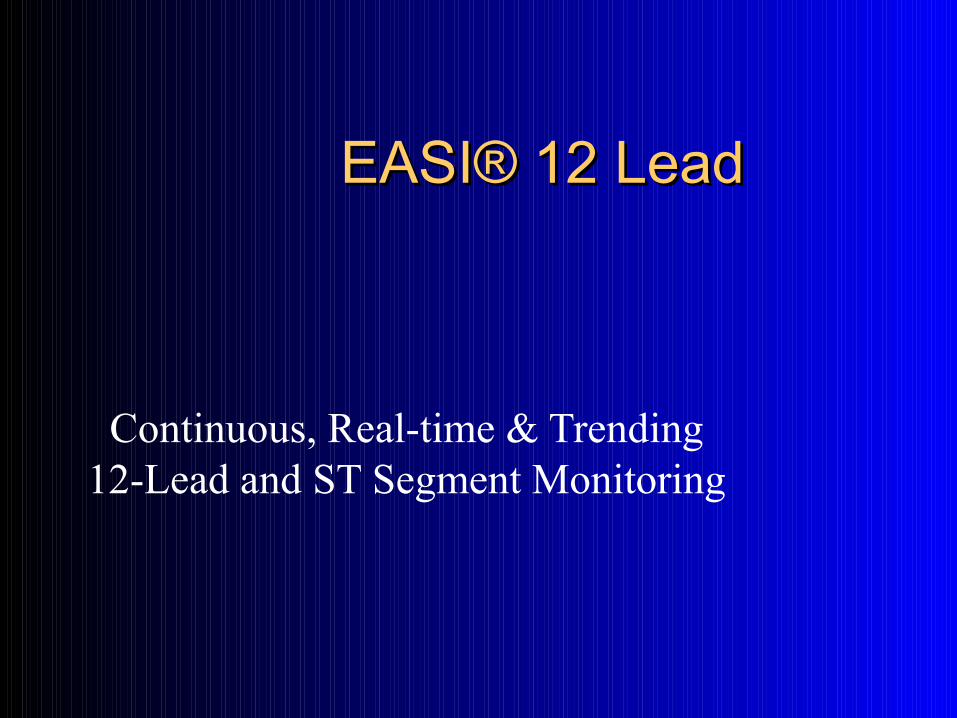
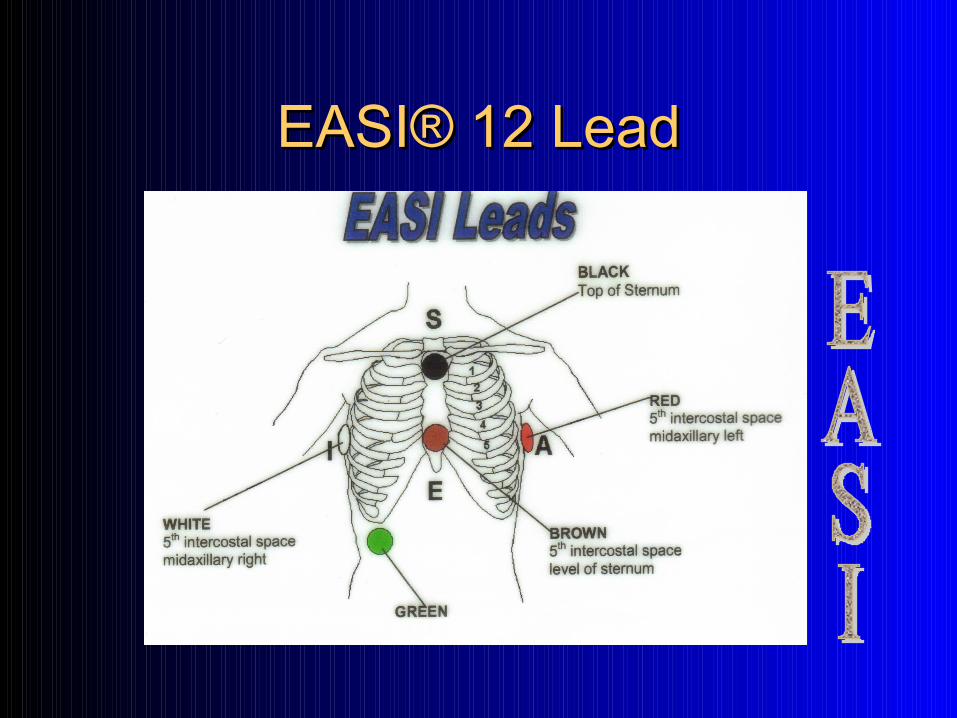
EASIEASI® 12 Lead® 12 Lead
Continuous, Real-time & Trending 12-Lead and ST Segment Monitoring
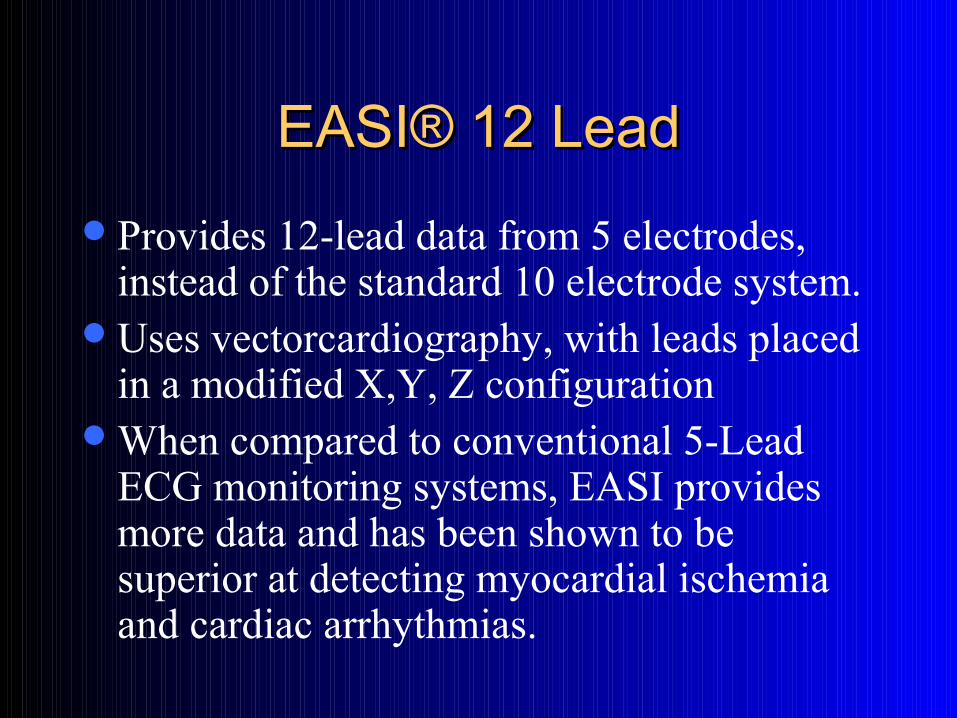
EASIEASI® 12 Lead® 12 Lead
Provides 12-lead data from 5 electrodes, instead of the standard 10 electrode system.
Uses vectorcardiography, with leads placed in a modified X,Y, Z configuration
When compared to conventional 5-Lead ECG monitoring systems, EASI provides more data and has been shown to be superior at detecting myocardial ischemia and cardiac arrhythmias.
EASIEASI® 12 Lead® 12 Lead
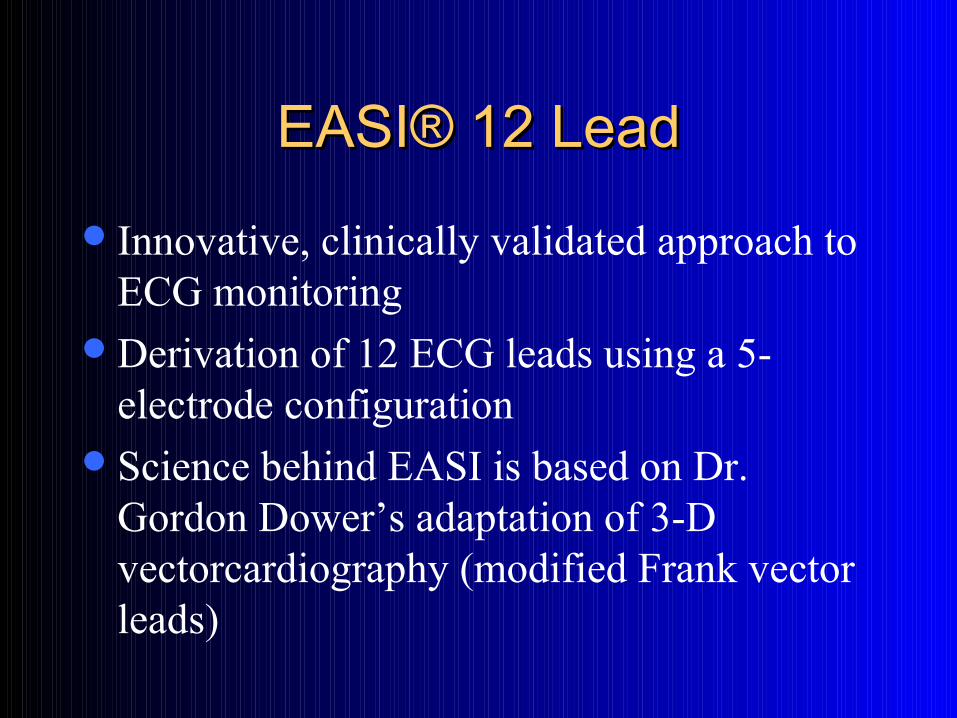
Innovative, clinically validated approach to ECG monitoring
Derivation of 12 ECG leads using a 5-electrode configuration
Science behind EASI is based on Dr. Gordon Dower’s adaptation of 3-D vectorcardiography (modified Frank vector leads)
EASIEASI® 12 Lead® 12 Lead
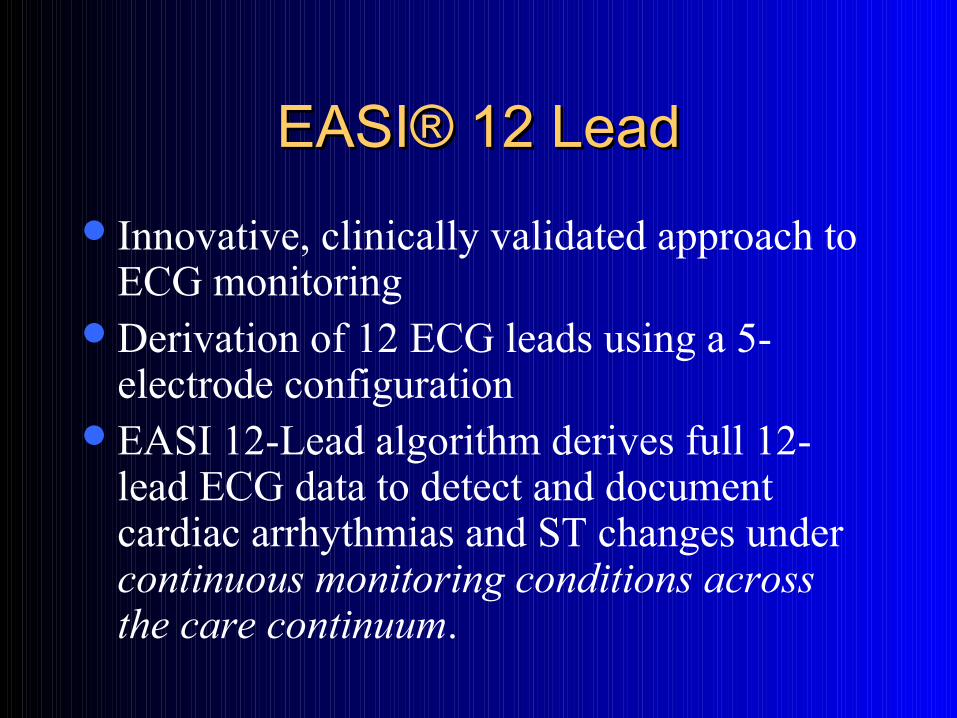
Innovative, clinically validated approach to ECG monitoring
Derivation of 12 ECG leads using a 5-electrode configuration
EASI 12-Lead algorithm derives full 12-lead ECG data to detect and document cardiac arrhythmias and ST changes under continuous monitoring conditions across the care continuum.
EASIEASI® 12 Lead® 12 Lead
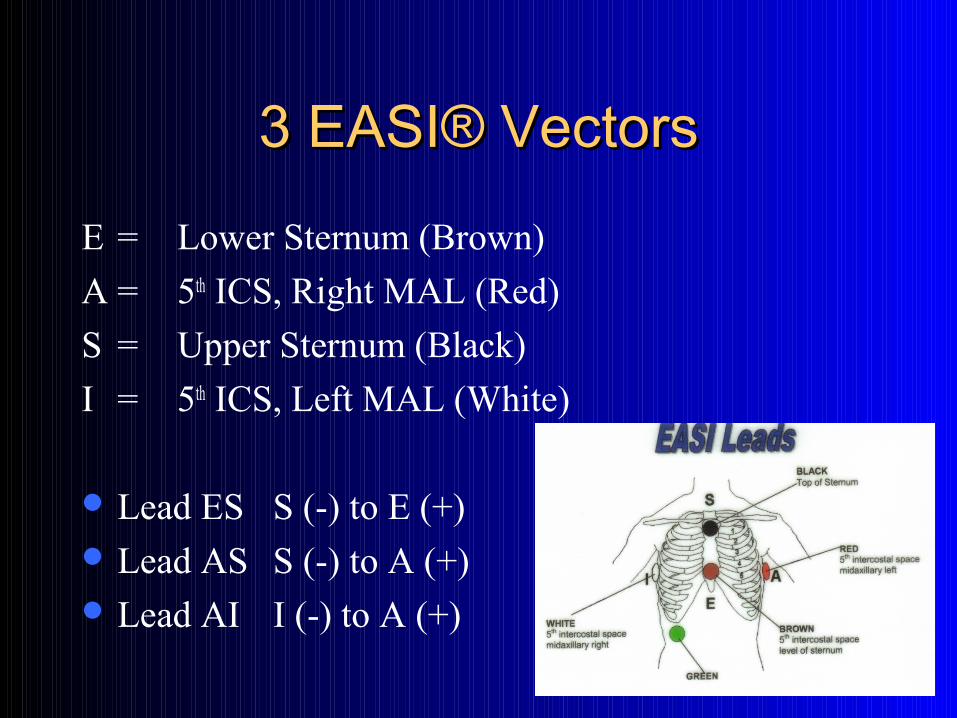
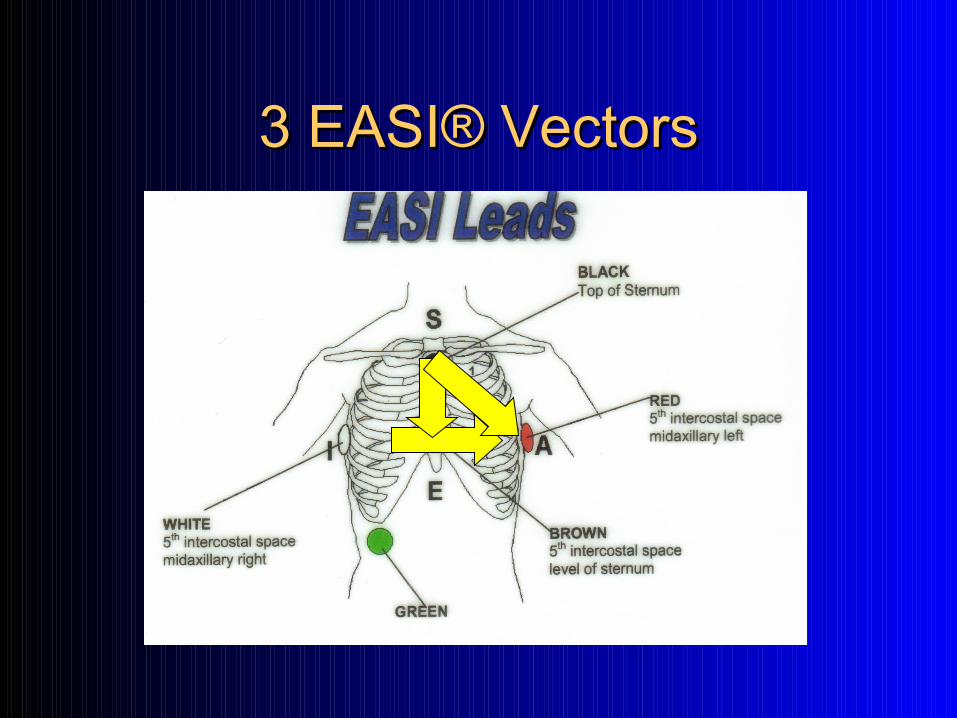
3 EASI3 EASI® Vectors® Vectors
E = Lower Sternum (Brown)
A = 5th ICS, Right MAL (Red)
S = Upper Sternum (Black)
I = 5th ICS, Left MAL (White)
Lead ES S (-) to E (+) Lead AS S (-) to A (+) Lead AI I (-) to A (+)
3 EASI3 EASI® Vectors® Vectors
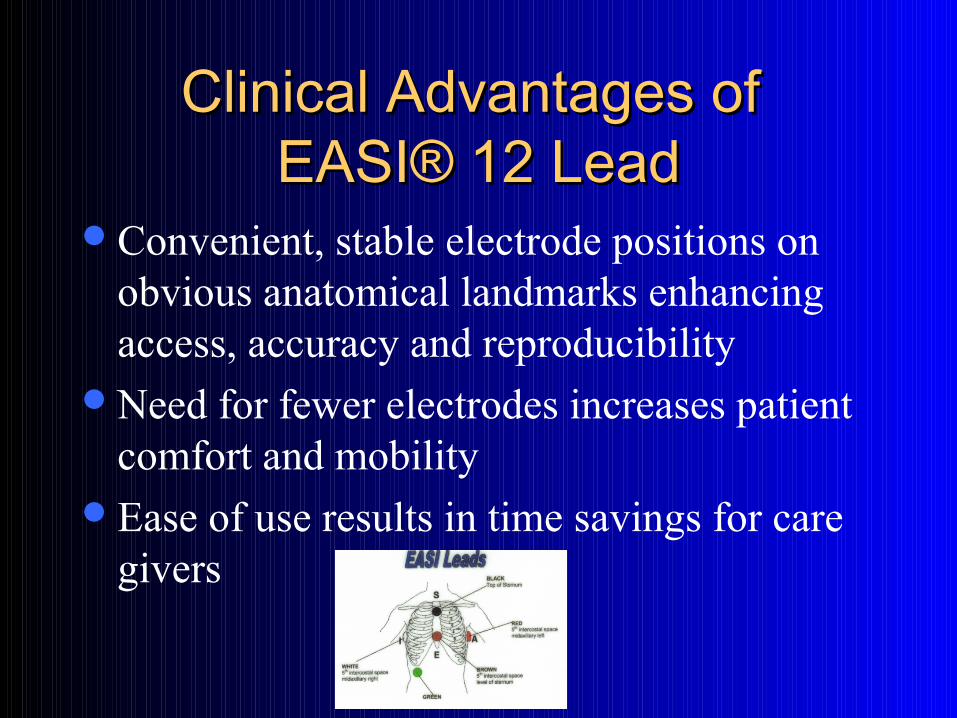
Clinical Advantages of Clinical Advantages of EASIEASI® 12 Lead® 12 Lead
Convenient, stable electrode positions on obvious anatomical landmarks enhancing access, accuracy and reproducibility
Need for fewer electrodes increases patient comfort and mobility
Ease of use results in time savings for care givers
Clinical Advantages of Clinical Advantages of EASIEASI® 12 Lead® 12 Lead
Innovative lead configuration achieves superior signal-to-noise ratios
Left precordium is always free … low interference with clinical procedures supports consistent 12-Lead information across the care continuum (physical exam, CXR, echocardiography, emergency resuscitation etc.)
Clinical Advantages of Clinical Advantages of EASIEASI® 12 Lead® 12 Lead
Ability to capture dynamic changes that may be missed using an ECG cart, since transient events of diagnostic/therapeutic importance may not persist long enough to capture.
With EASI, transient events can be documented with full 12-Lead ECG under continuous monitoring conditions.
EASIEASI® 12 Lead® 12 Lead
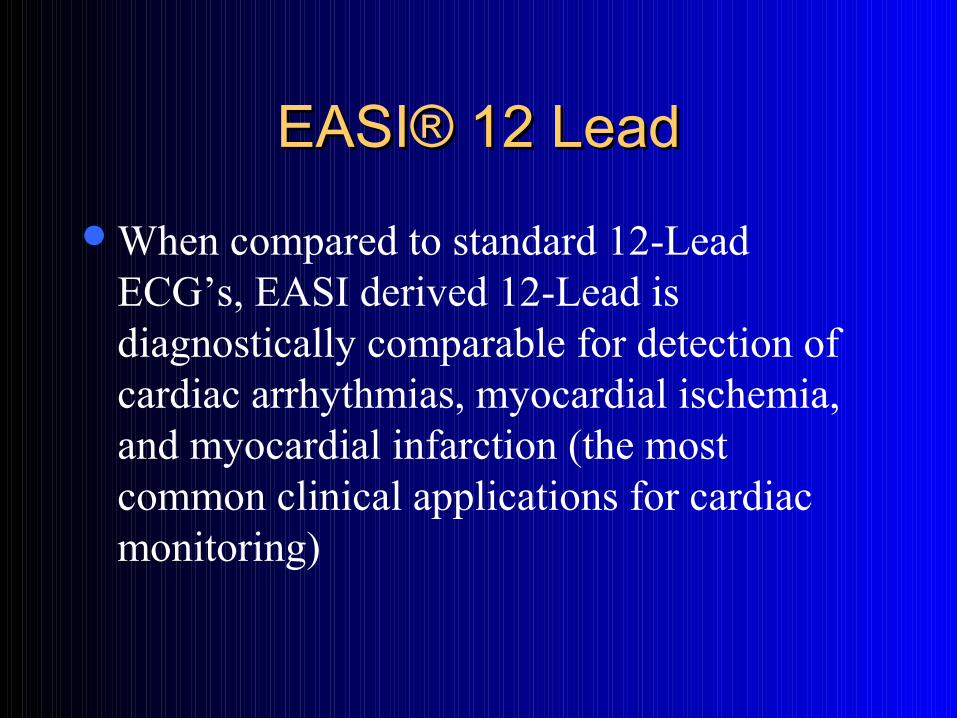
When compared to standard 12-Lead ECG’s, EASI derived 12-Lead is diagnostically comparable for detection of cardiac arrhythmias, myocardial ischemia, and myocardial infarction (the most common clinical applications for cardiac monitoring)
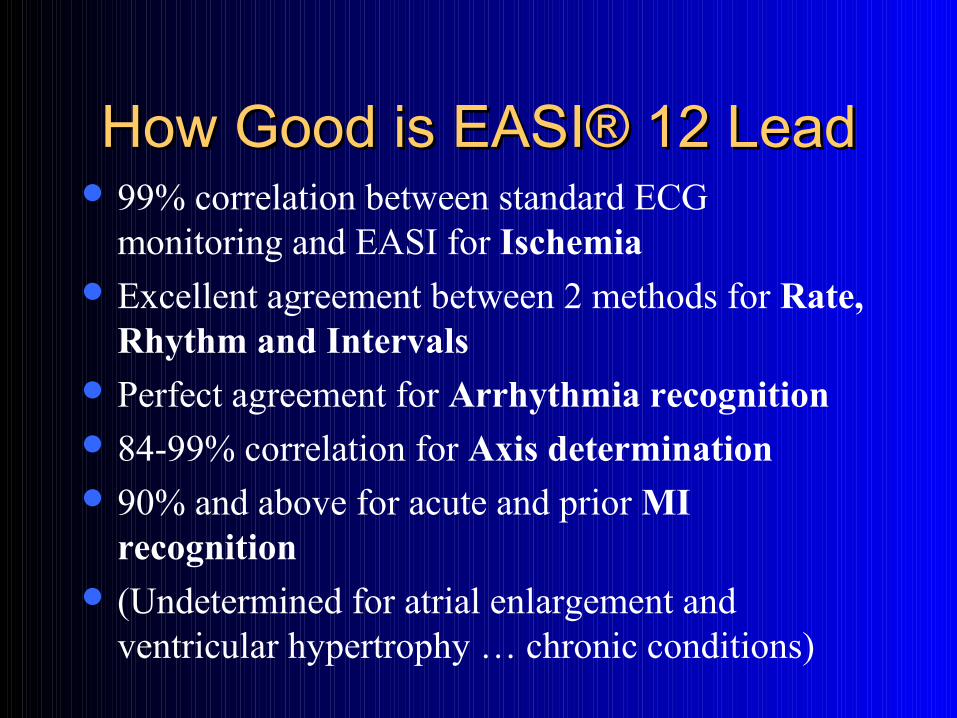
How Good is EASIHow Good is EASI® 12 Lead® 12 Lead 99% correlation between standard ECG
monitoring and EASI for Ischemia Excellent agreement between 2 methods for Rate,
Rhythm and Intervals Perfect agreement for Arrhythmia recognition 84-99% correlation for Axis determination 90% and above for acute and prior MI
recognition (Undetermined for atrial enlargement and
ventricular hypertrophy … chronic conditions)
Interpreting the Interpreting the EASIEASI® 12 Lead® 12 Lead
The derived EASI 12-lead is approached the same way as a standard 12-lead … all principles remain the same in terms of interpretation.
EASI should be used as a trending tool & as a dynamic clinical assessment tool (Monitoring)
Baseline EASI 12-lead should be compared to any changes, as is done with a conventional 12-lead.
EASI 12-lead is not meant to replace a standard 12-lead in terms of diagnostic value, but used in combination as a clinical assessment tool.
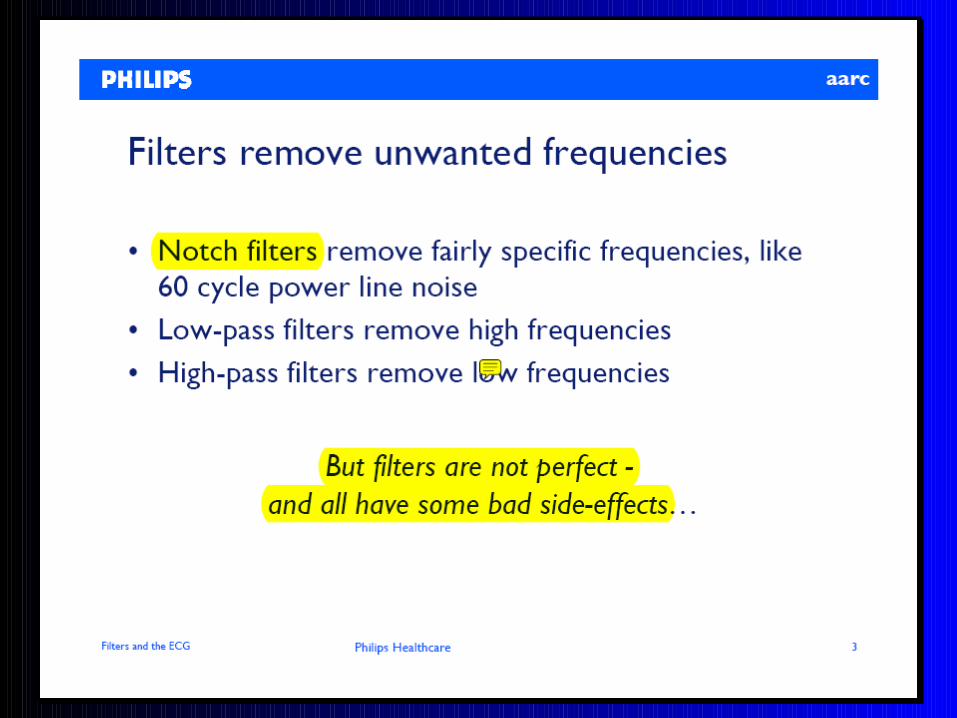
Technical ConsiderationsTechnical Considerations
Lead Placement & Vectors (Thoracic versus Limb)
Millivolt and StandardFilters

Back to the Application Stuff!Back to the Application Stuff!
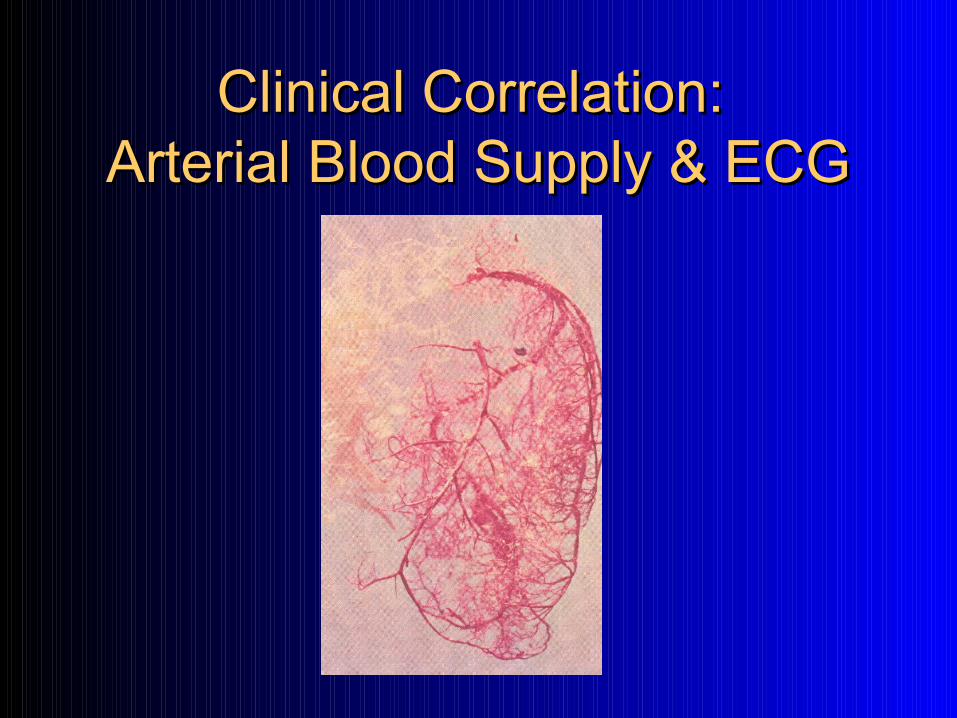
Clinical Correlation: Clinical Correlation: Arterial Blood Supply & ECGArterial Blood Supply & ECG
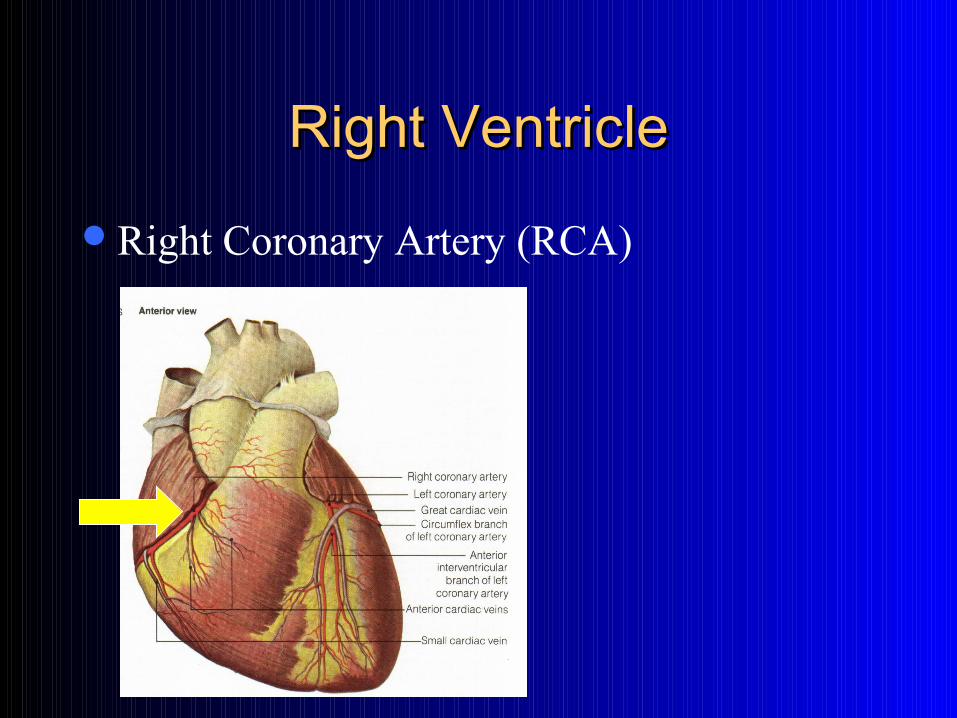
Right VentricleRight Ventricle
Right Coronary Artery (RCA)
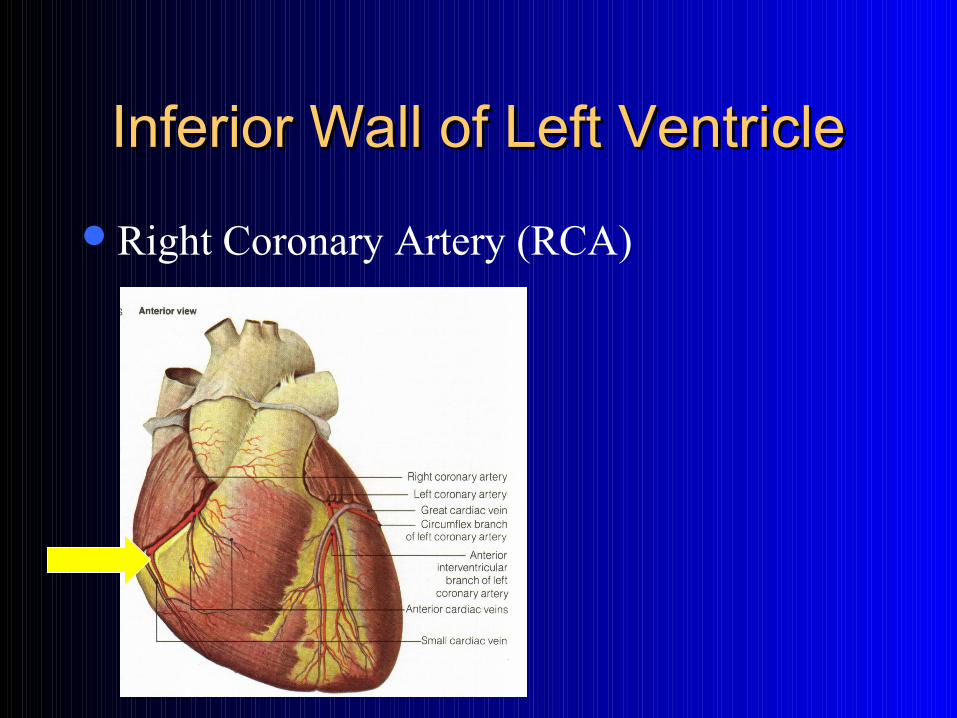
Inferior Wall of Left VentricleInferior Wall of Left Ventricle
Right Coronary Artery (RCA)
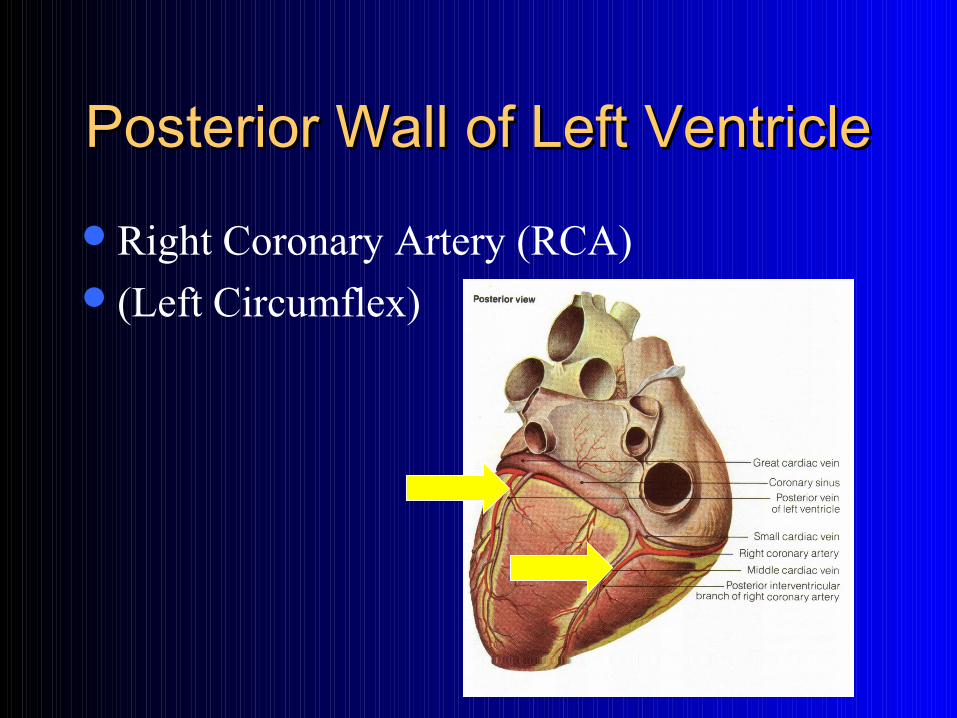
Posterior Wall of Left VentriclePosterior Wall of Left Ventricle
Right Coronary Artery (RCA)(Left Circumflex)
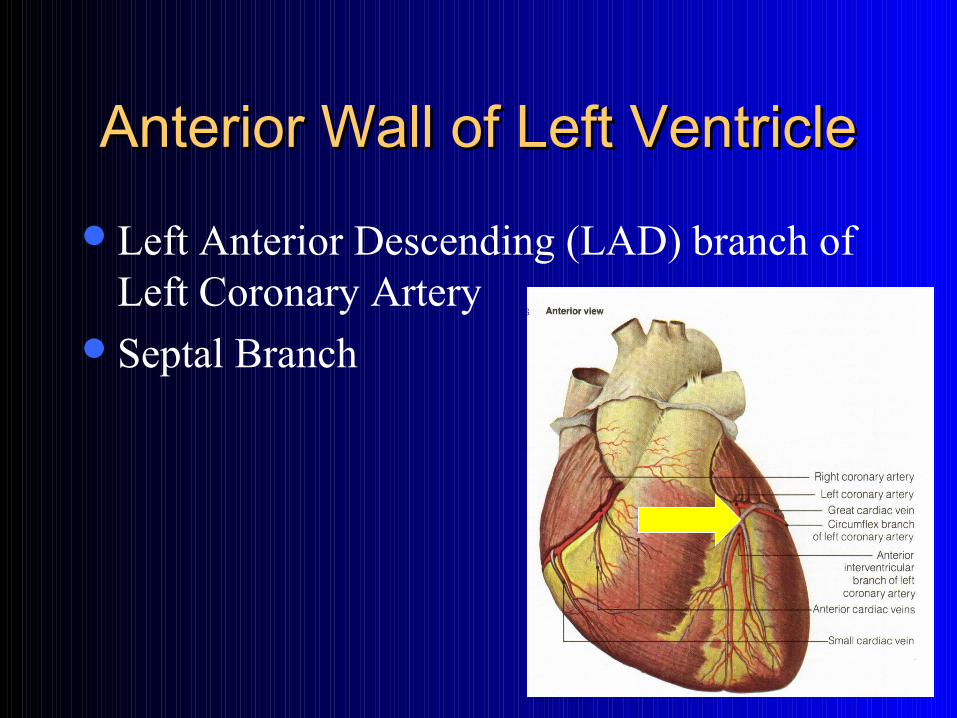
Anterior Wall of Left VentricleAnterior Wall of Left Ventricle
Left Anterior Descending (LAD) branch of Left Coronary Artery
Septal Branch
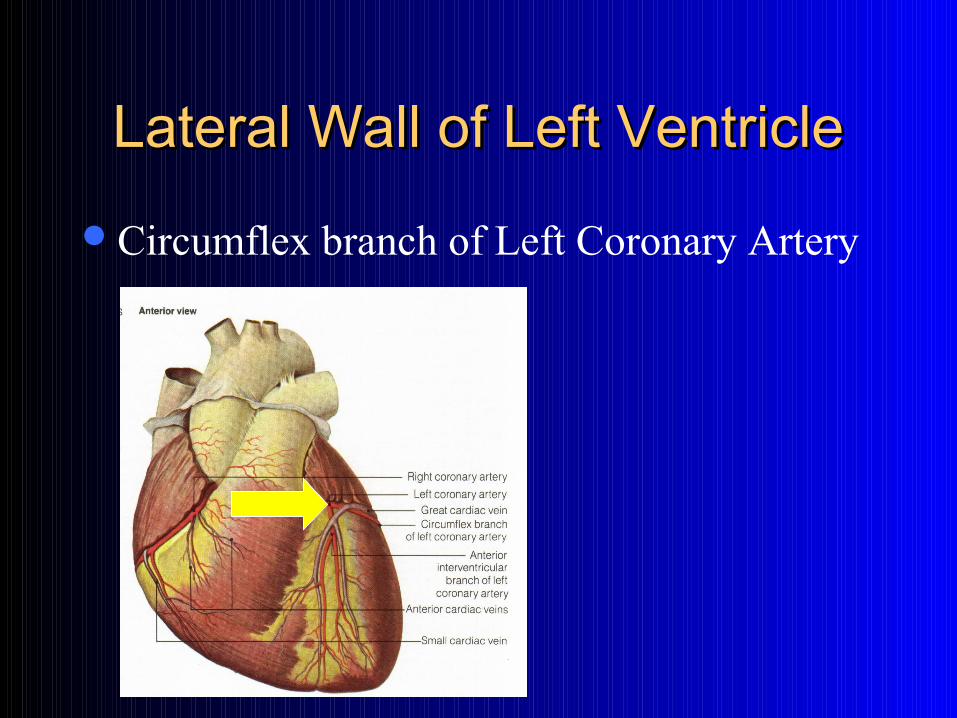
Lateral Wall of Left VentricleLateral Wall of Left Ventricle
Circumflex branch of Left Coronary Artery
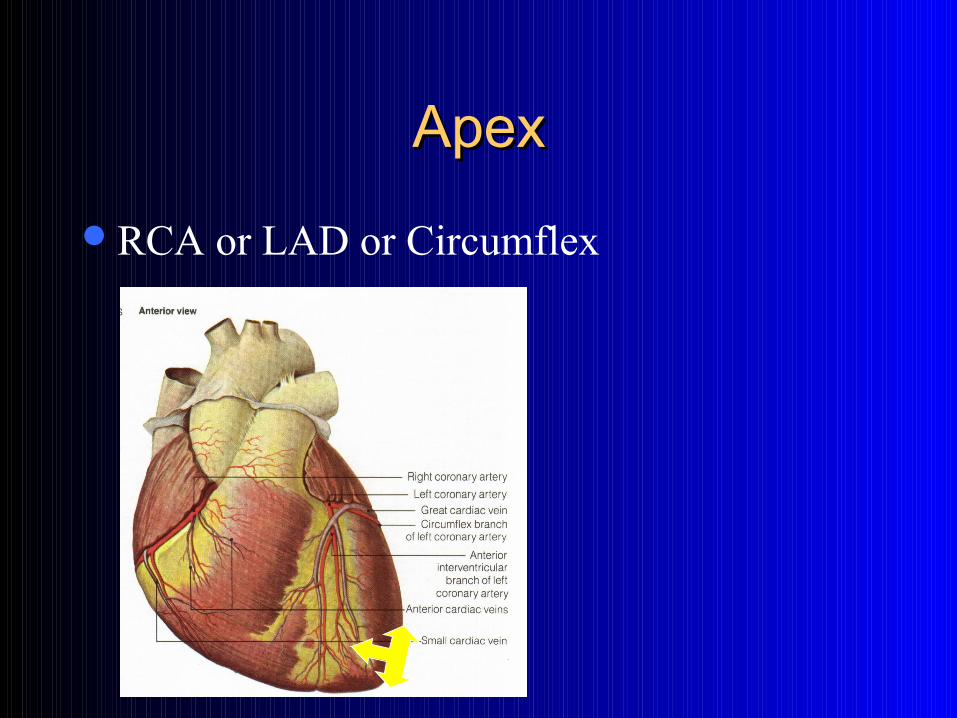
ApexApex
RCA or LAD or Circumflex
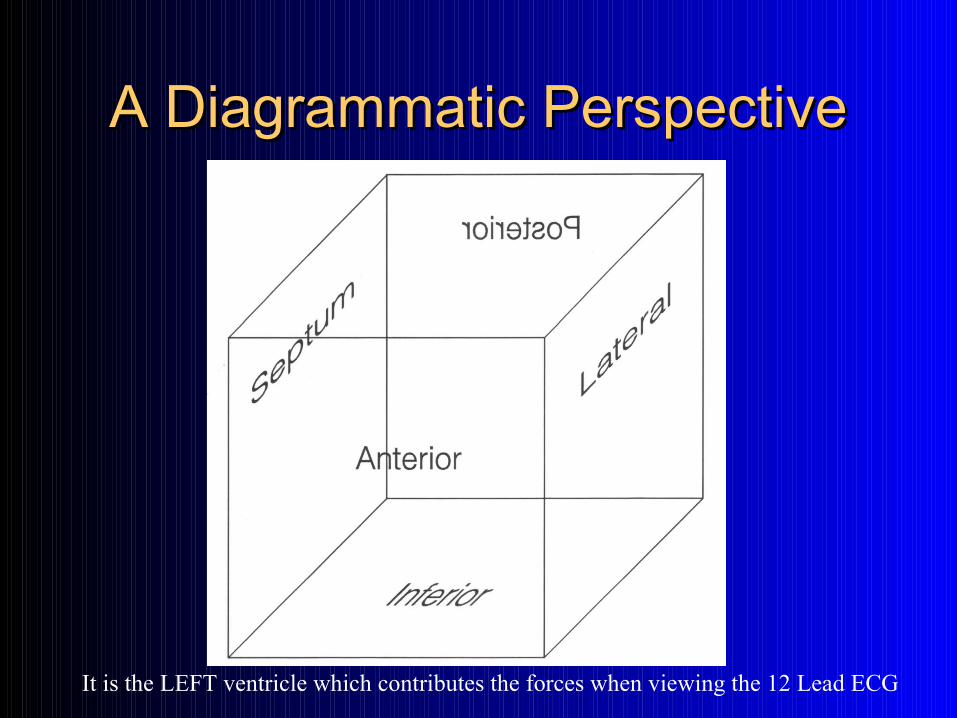
A Diagrammatic PerspectiveA Diagrammatic Perspective
It is the LEFT ventricle which contributes the forces when viewing the 12 Lead ECG
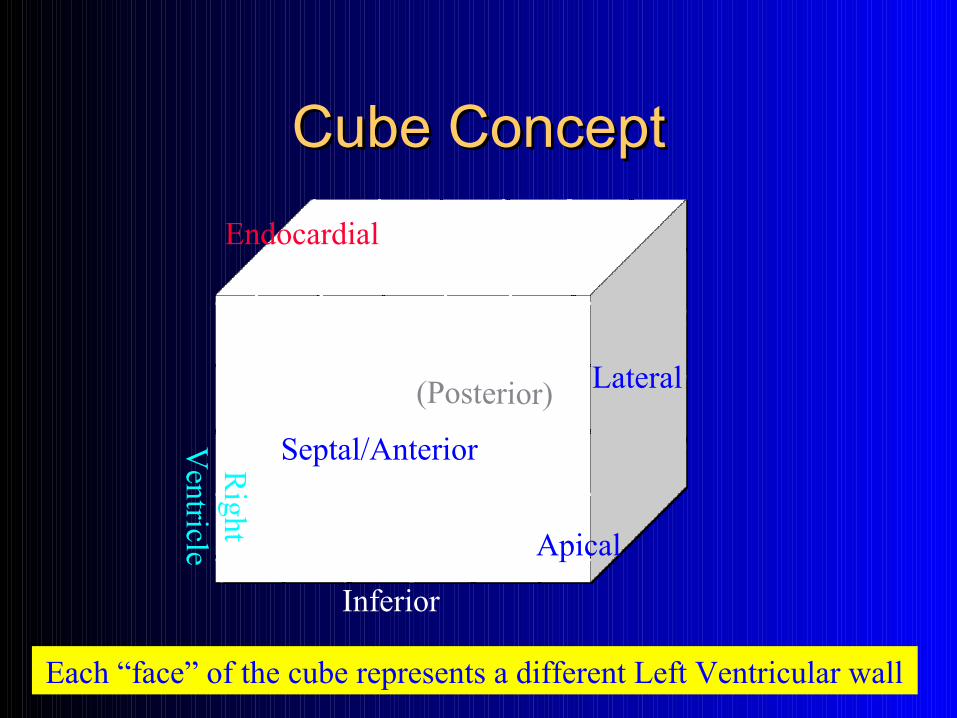
Cube ConceptCube Concept
Septal/Anterior
Apical
Lateral
Inferior
Endocardial
(Posterior)
Each “face” of the cube represents a different Left Ventricular wall
Right
Ventri cle
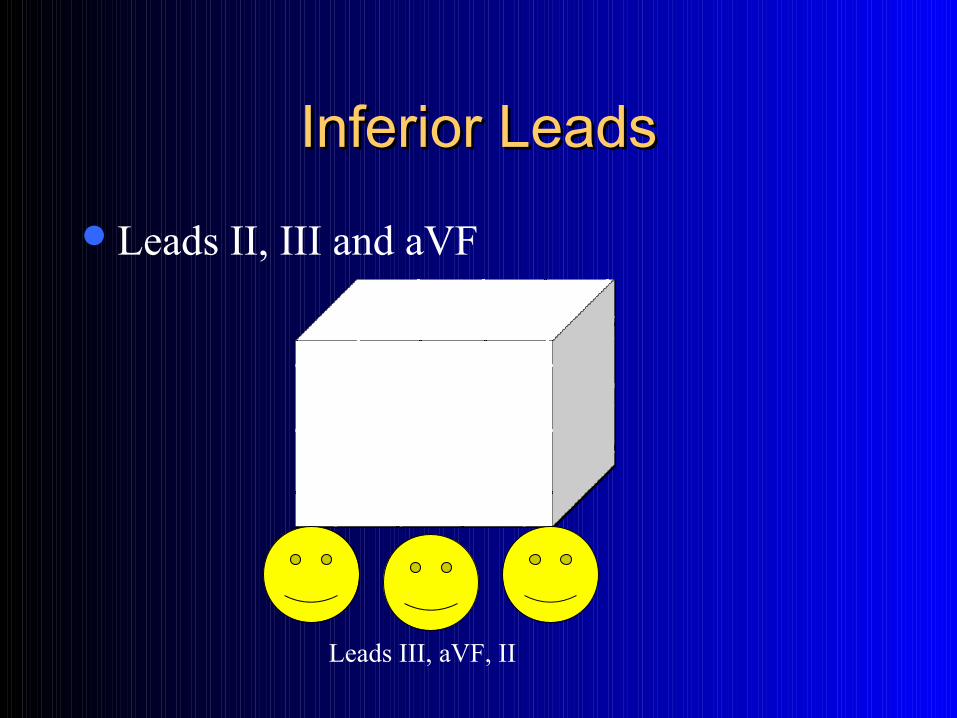
Inferior LeadsInferior Leads
Leads II, III and aVF
Leads III, aVF, II
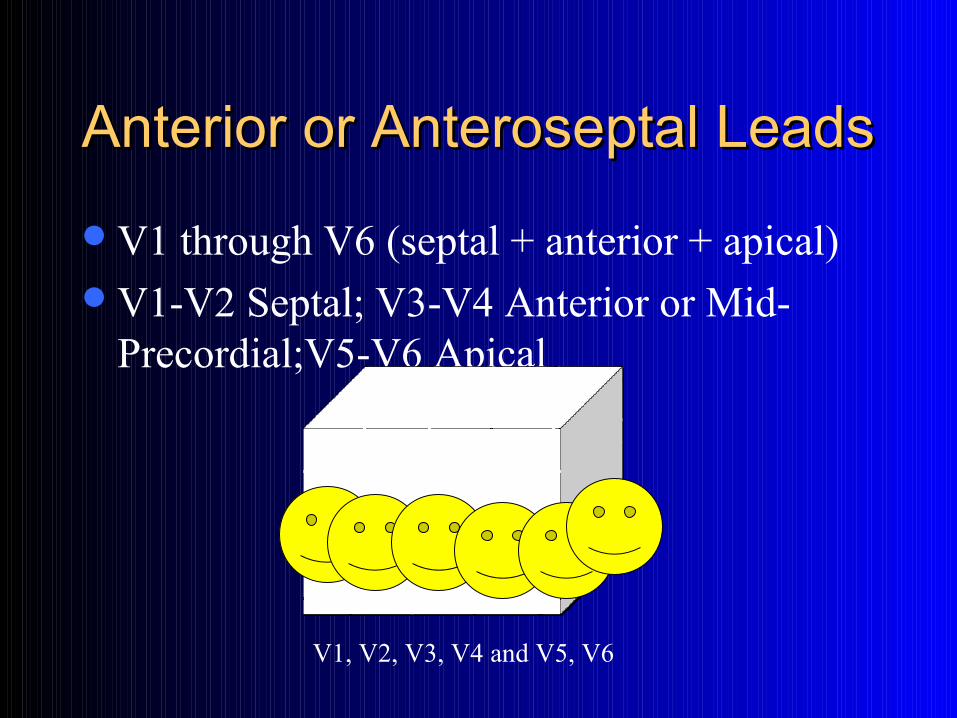
Anterior or Anteroseptal LeadsAnterior or Anteroseptal Leads
V1 through V6 (septal + anterior + apical)V1-V2 Septal; V3-V4 Anterior or Mid-
Precordial;V5-V6 Apical
V1, V2, V3, V4 and V5, V6
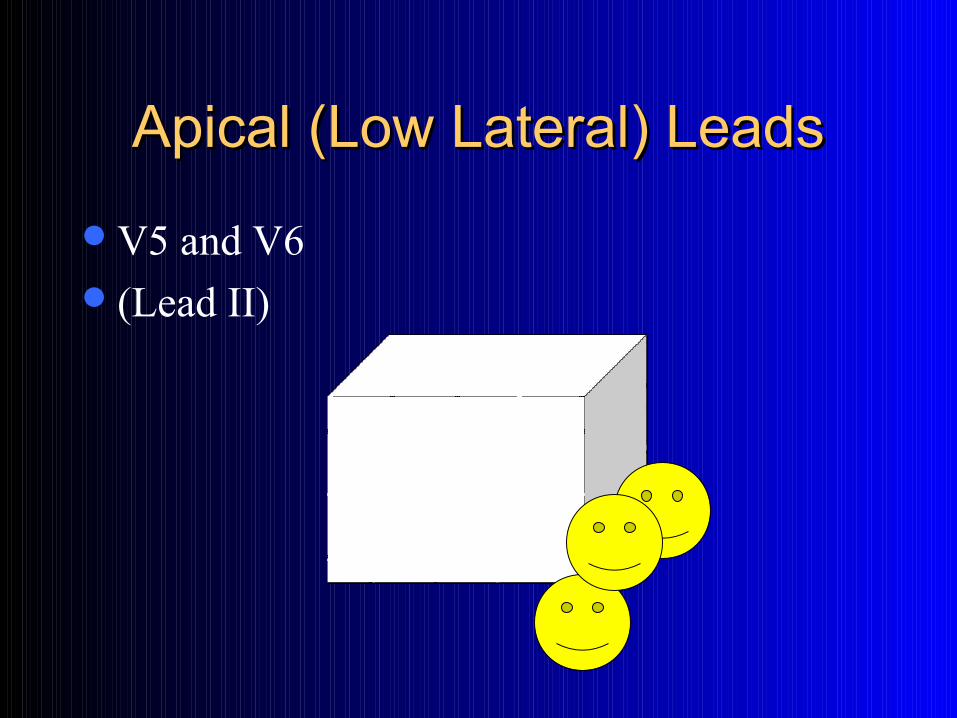
Apical (Low Lateral) LeadsApical (Low Lateral) Leads
V5 and V6(Lead II)
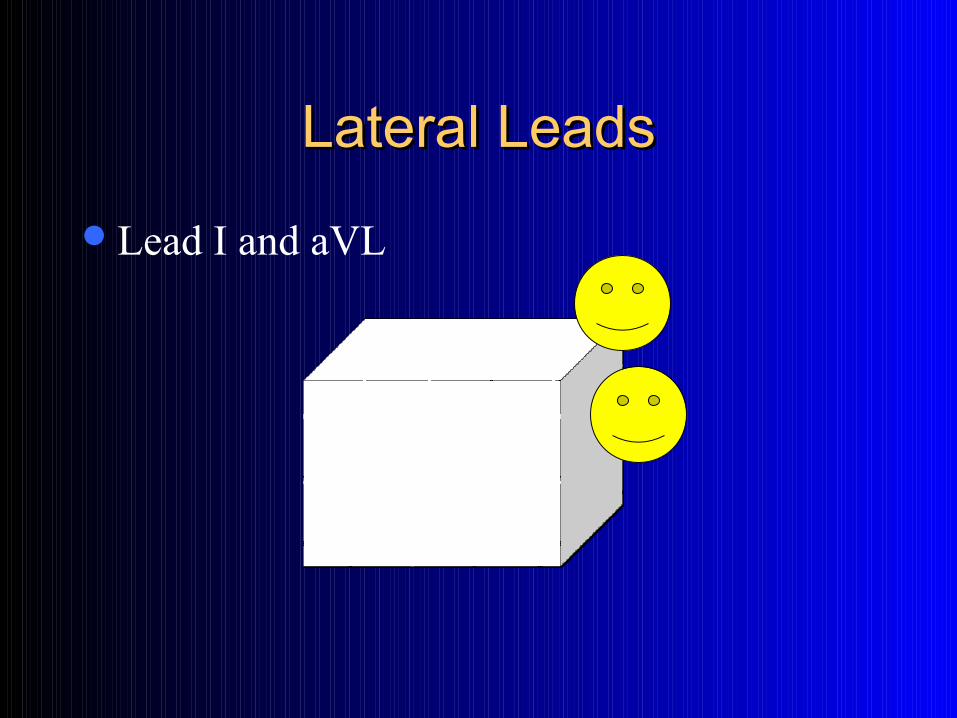
Lateral LeadsLateral Leads
Lead I and aVL
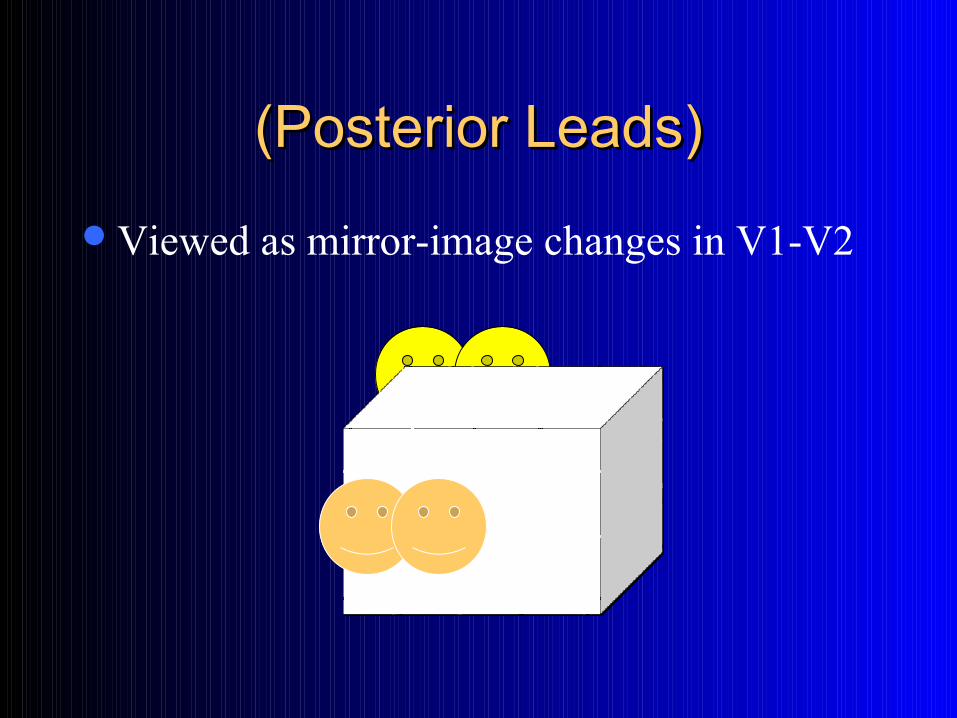
(Posterior Leads)(Posterior Leads)
Viewed as mirror-image changes in V1-V2
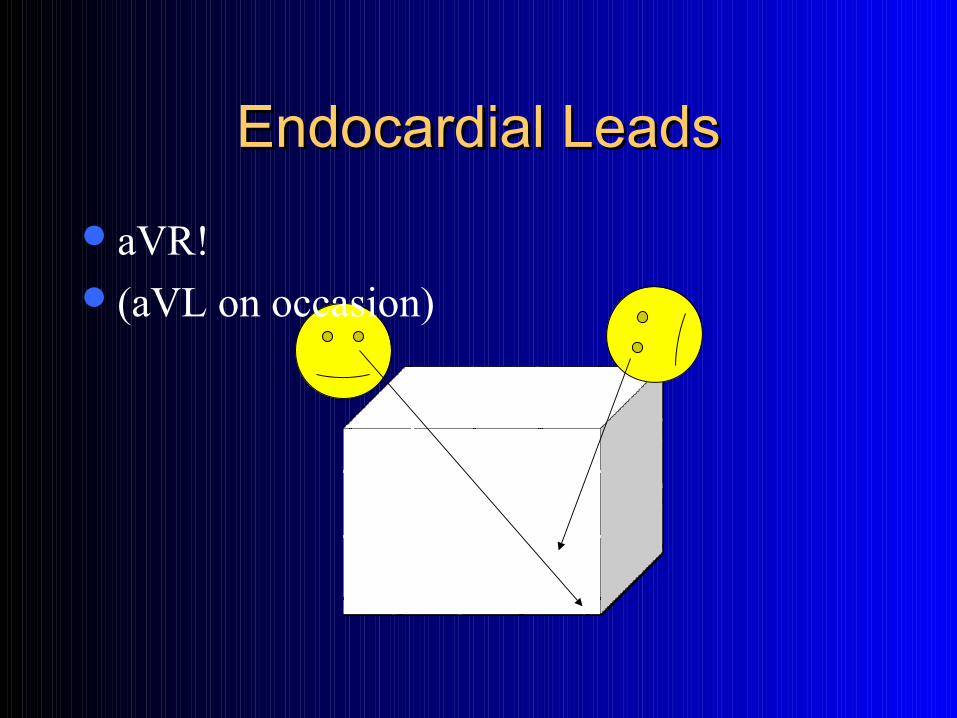
Endocardial LeadsEndocardial Leads
aVR!(aVL on occasion)
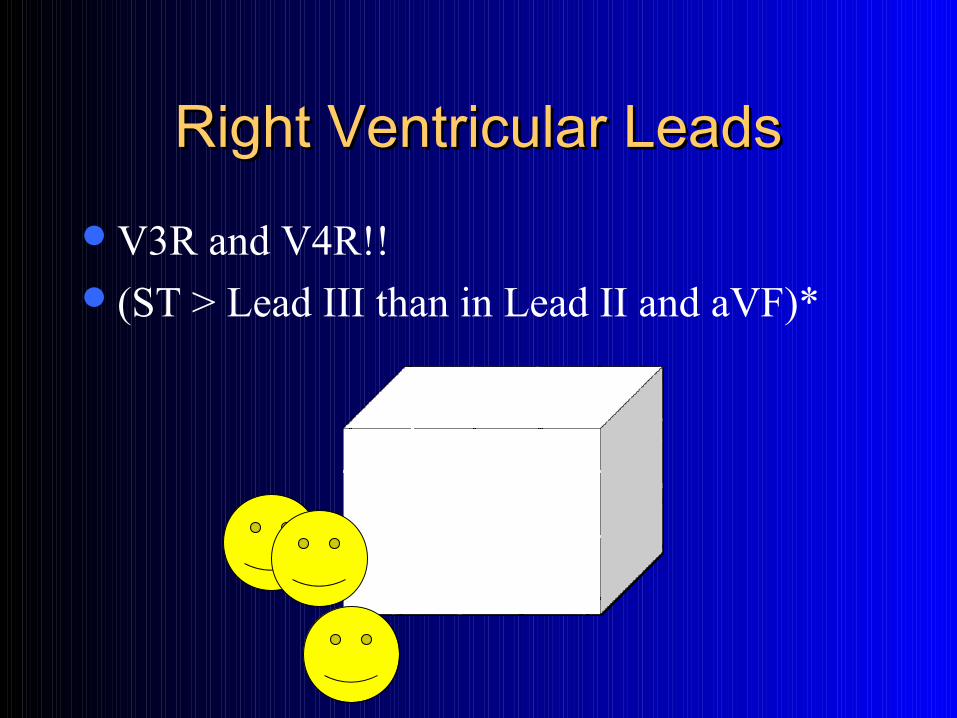
Right Ventricular LeadsRight Ventricular Leads
V3R and V4R!!(ST > Lead III than in Lead II and aVF)*
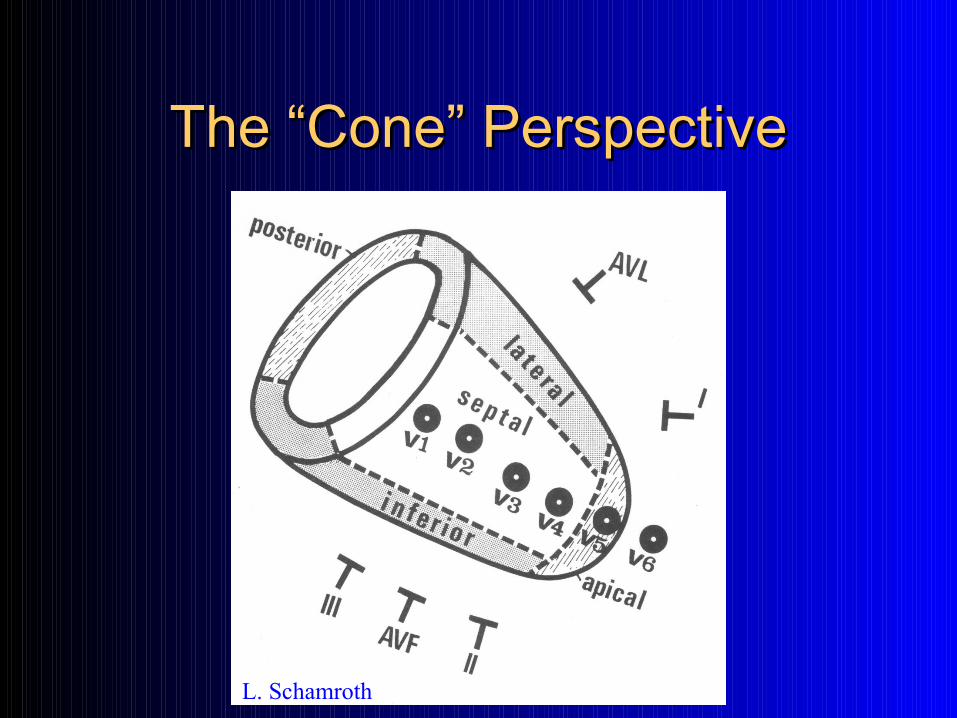
The “Cone” PerspectiveThe “Cone” Perspective
L. Schamroth

““OtherOther Fundamentals" Fundamentals"
Polarity

PolarityPolarity
An impulse traveling toward a positive electrode will be recorded as positive … an impulse traveling away from a positive electrode will be recorded as negative
There are, however, varying degrees of positivity and negativity represented by various ECG waveforms
PolarityPolarity
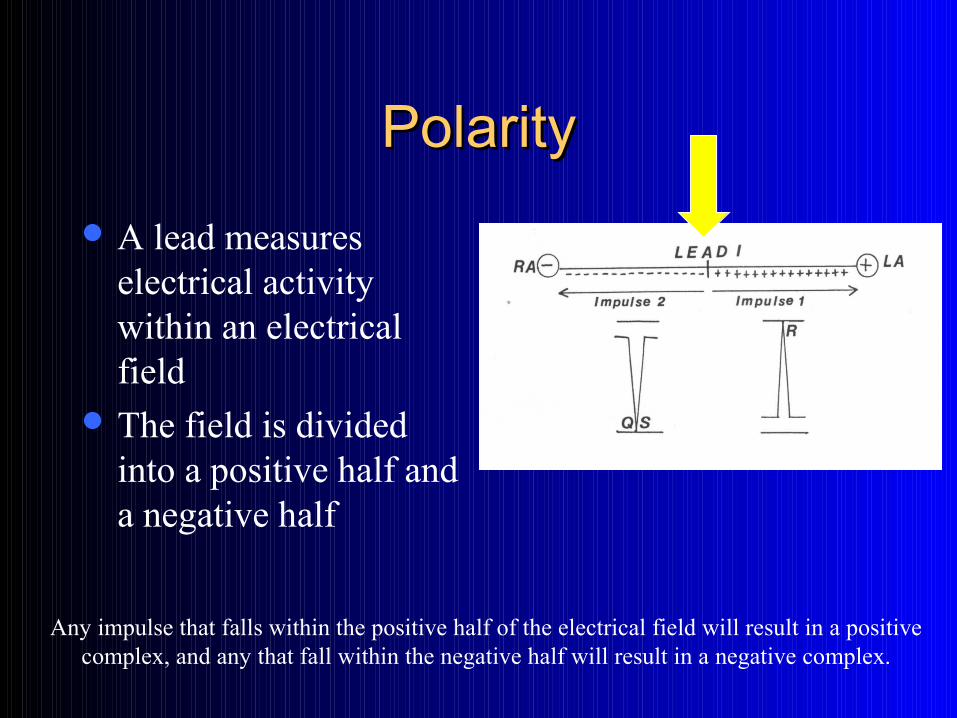
A lead measures electrical activity within an electrical field
The field is divided into a positive half and a negative half
Any impulse that falls within the positive half of the electrical field will result in a positive complex, and any that fall within the negative half will result in a negative complex.
Positive & Negative FieldsPositive & Negative Fields
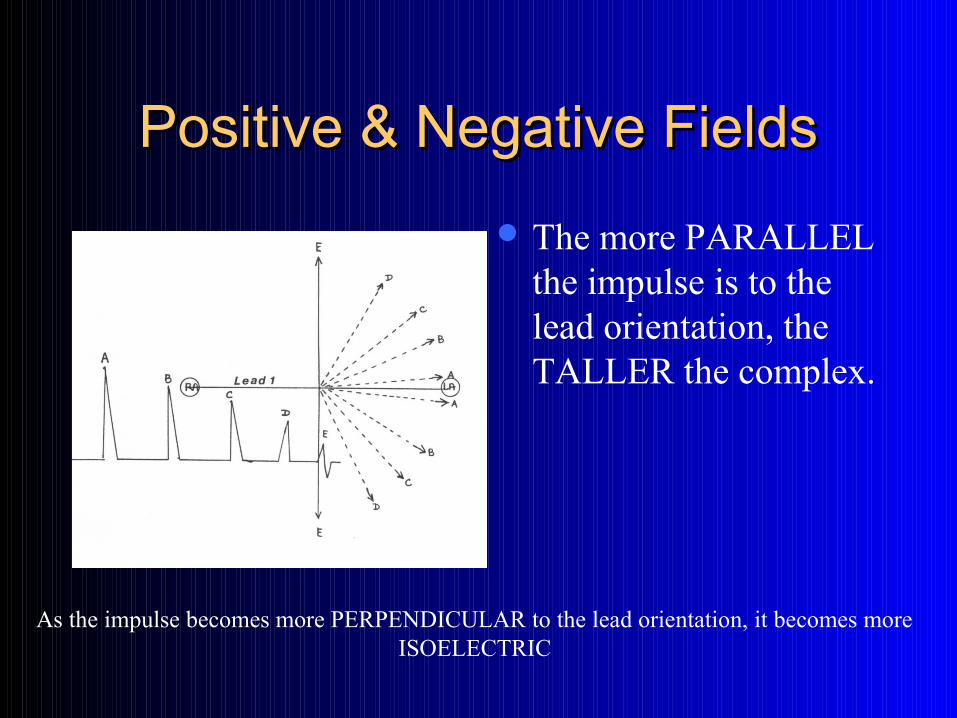
The more PARALLEL the impulse is to the lead orientation, the TALLER the complex.
As the impulse becomes more PERPENDICULAR to the lead orientation, it becomes more ISOELECTRIC
ExploringExploring the the Electrical Electrical Activation of the HeartActivation of the Heart
Wave of DepolarizationWave of Depolarization
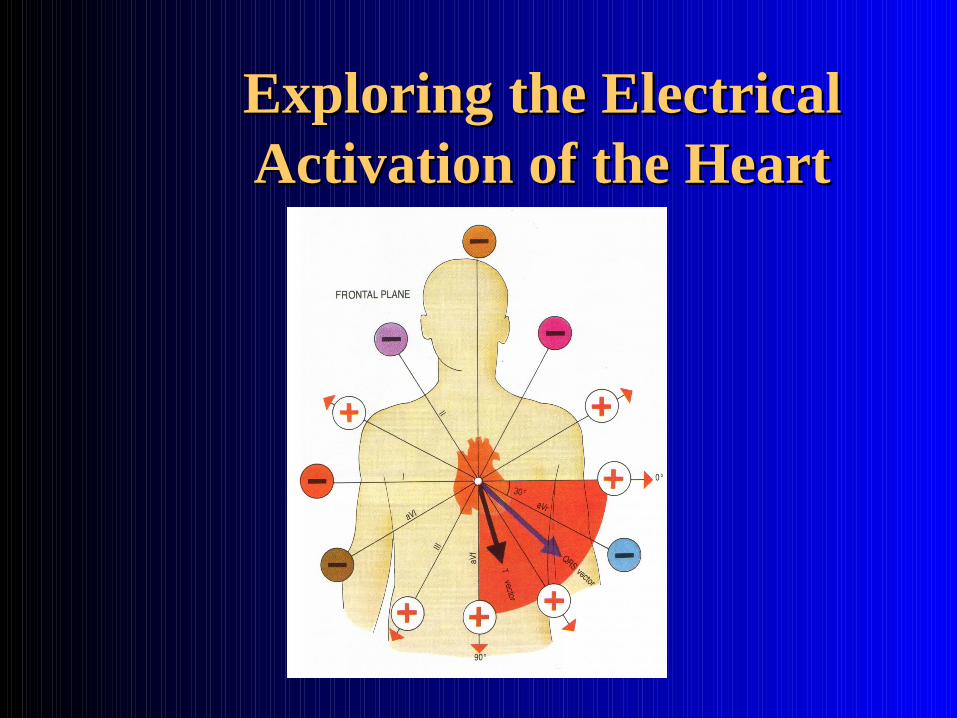
The anatomic position of the heart must also be considered, since it is the actual position of the heart that influences the net direction of electrical activity.
It is this NET direction that is recorded on the ECG
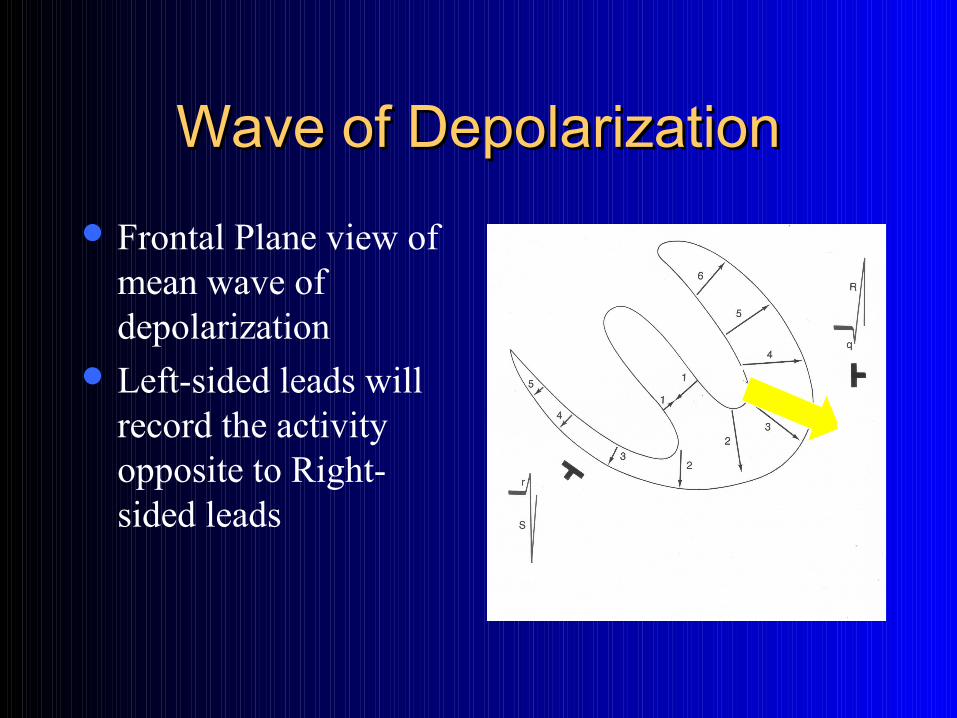
Wave of DepolarizationWave of Depolarization
Frontal Plane view of mean wave of depolarization
Left-sided leads will record the activity opposite to Right-sided leads
Wave of DepolarizationWave of Depolarization
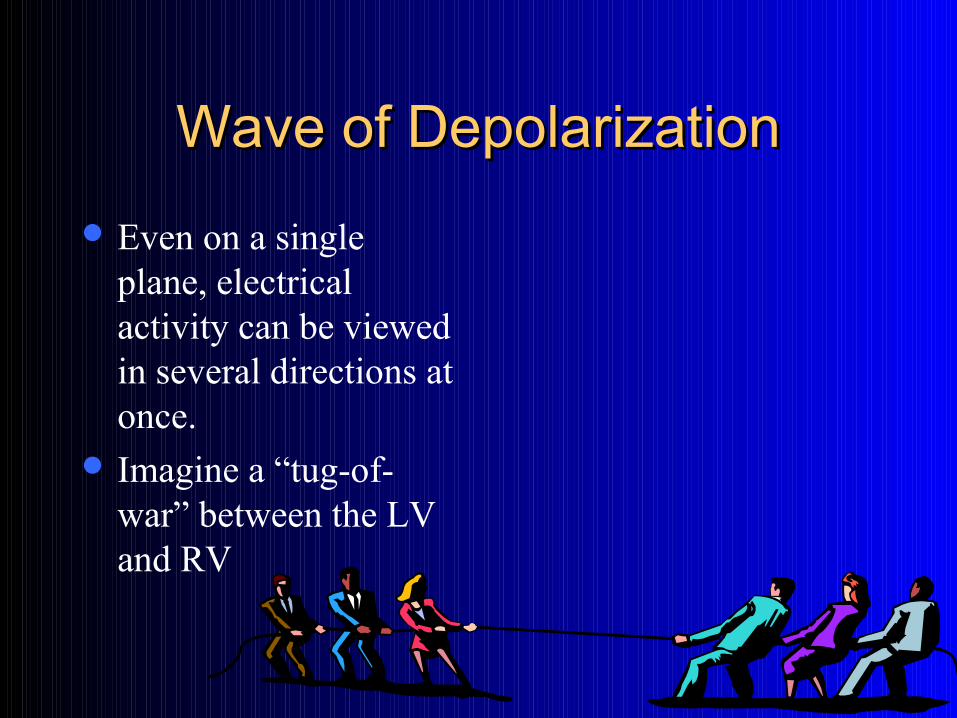
Even on a single plane, electrical activity can be viewed in several directions at once.
Imagine a “tug-of-war” between the LV and RV
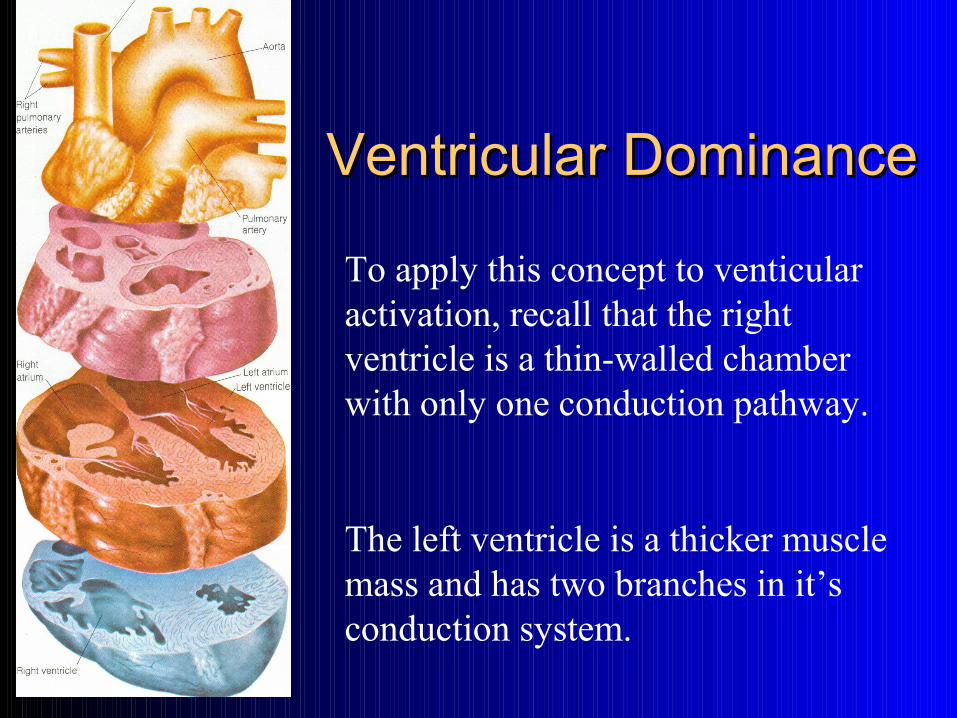
Ventricular DominanceVentricular Dominance
To apply this concept to venticular activation, recall that the right ventricle is a thin-walled chamber with only one conduction pathway.
The left ventricle is a thicker muscle mass and has two branches in it’s conduction system.
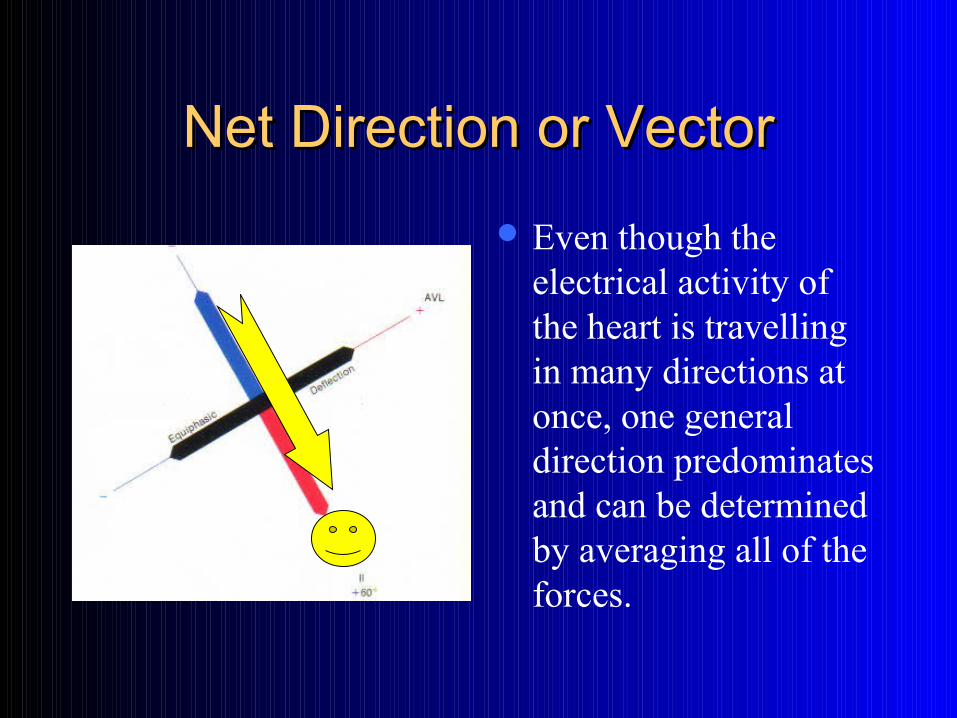
Net Direction or VectorNet Direction or Vector
Even though the electrical activity of the heart is travelling in many directions at once, one general direction predominates and can be determined by averaging all of the forces.
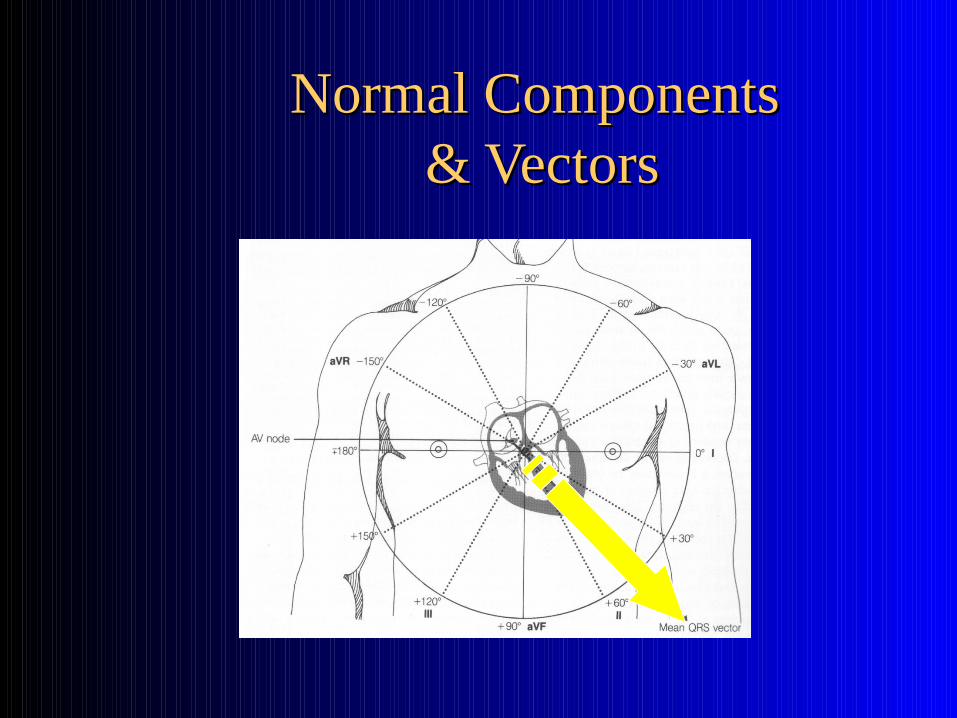
Normal Components Normal Components && Vectors Vectors
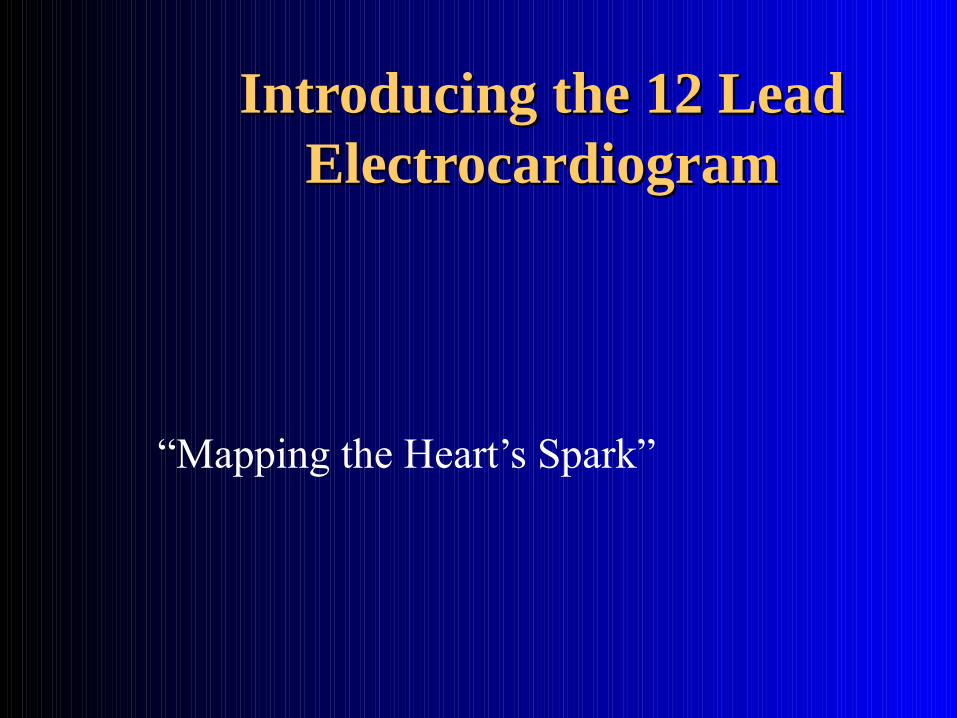
Introducing the 12 Lead Introducing the 12 Lead ElectrocardiogramElectrocardiogram
“Mapping the Heart’s Spark”

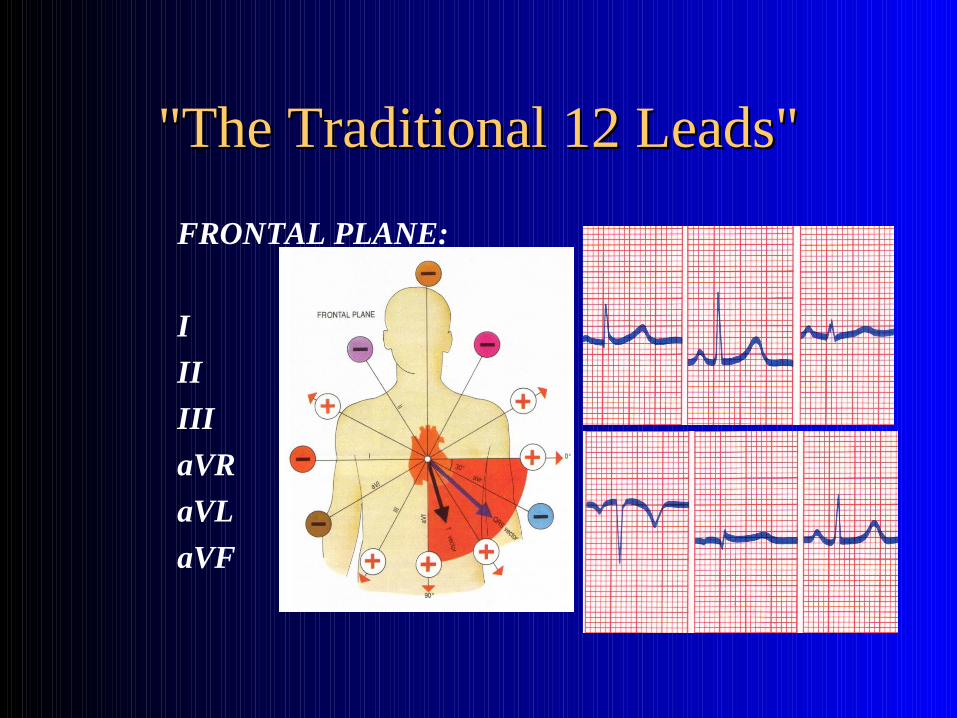
"The Traditional 12 Leads""The Traditional 12 Leads"
FRONTAL PLANE:
I
II
III
aVR
aVL
aVF
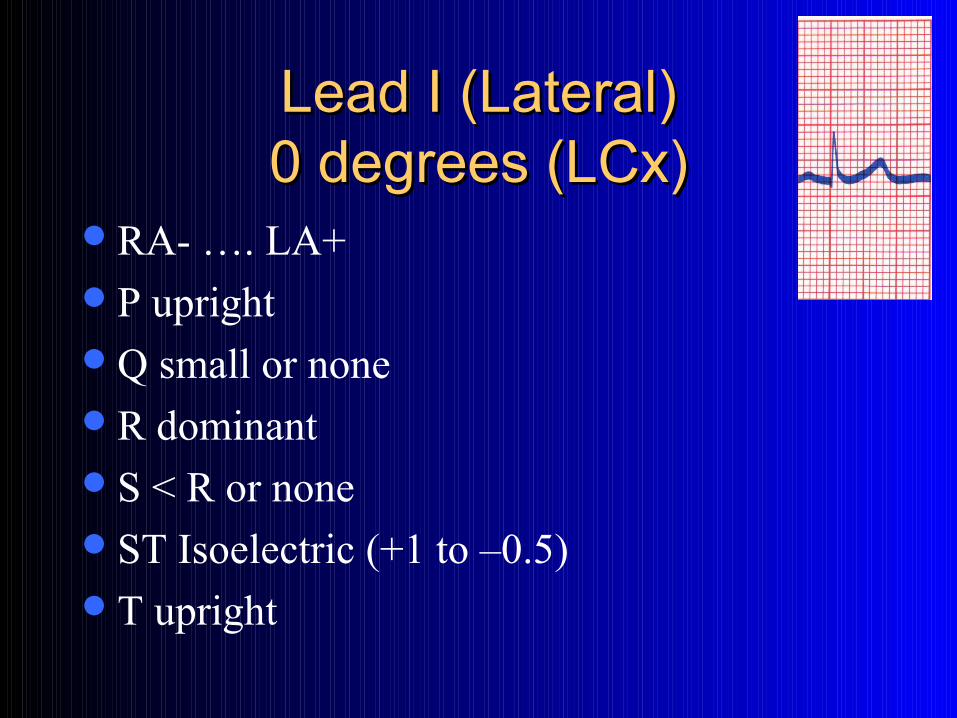
Lead I (Lateral)Lead I (Lateral)0 degrees (LCx)0 degrees (LCx)
RA- …. LA+P uprightQ small or noneR dominantS < R or noneST Isoelectric (+1 to –0.5)T upright
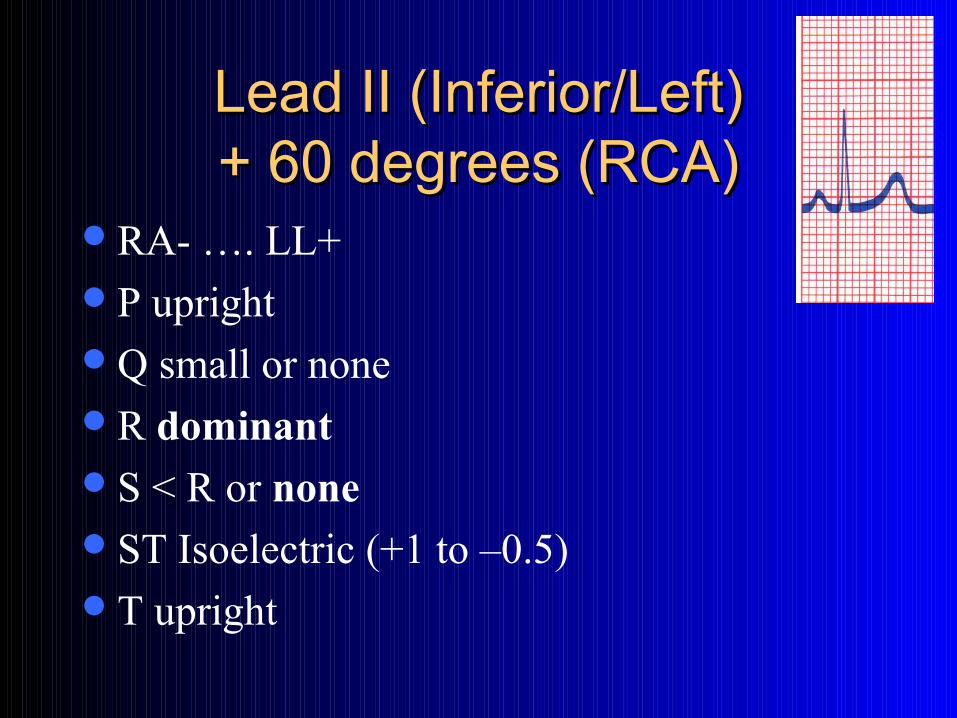
Lead II (Inferior/Left)Lead II (Inferior/Left)+ 60 degrees (RCA)+ 60 degrees (RCA)
RA- …. LL+P uprightQ small or noneR dominantS < R or noneST Isoelectric (+1 to –0.5)T upright
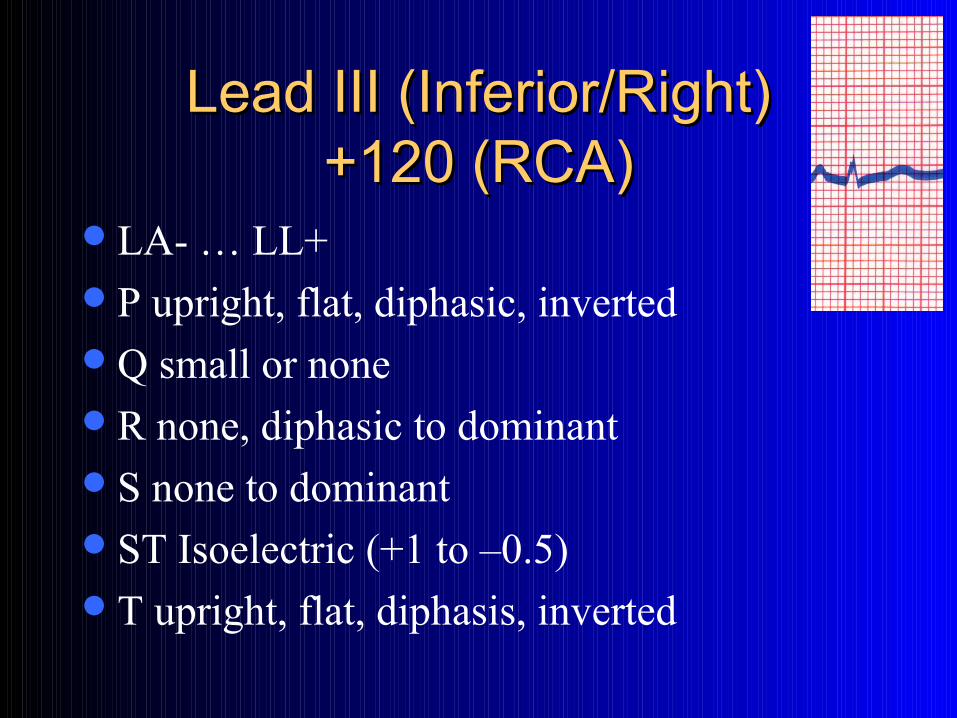
Lead III (Inferior/Right)Lead III (Inferior/Right)+120 (RCA)+120 (RCA)
LA- … LL+P upright, flat, diphasic, invertedQ small or noneR none, diphasic to dominantS none to dominantST Isoelectric (+1 to –0.5)T upright, flat, diphasis, inverted
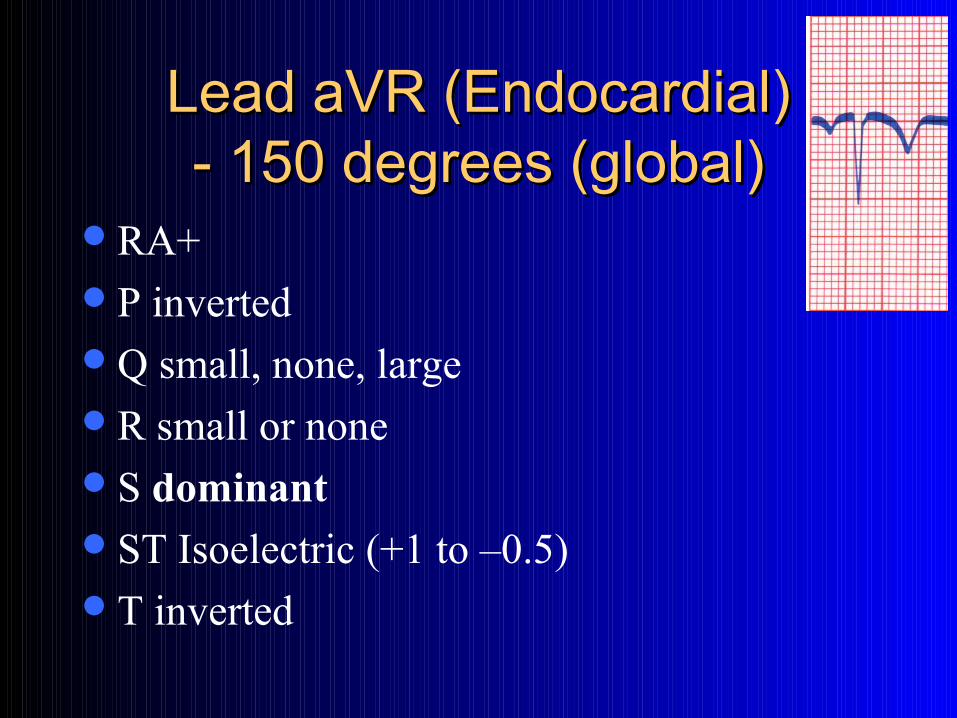
Lead aVR (Endocardial)Lead aVR (Endocardial)- 150 degrees (global)- 150 degrees (global)
RA+P invertedQ small, none, largeR small or noneS dominantST Isoelectric (+1 to –0.5)T inverted
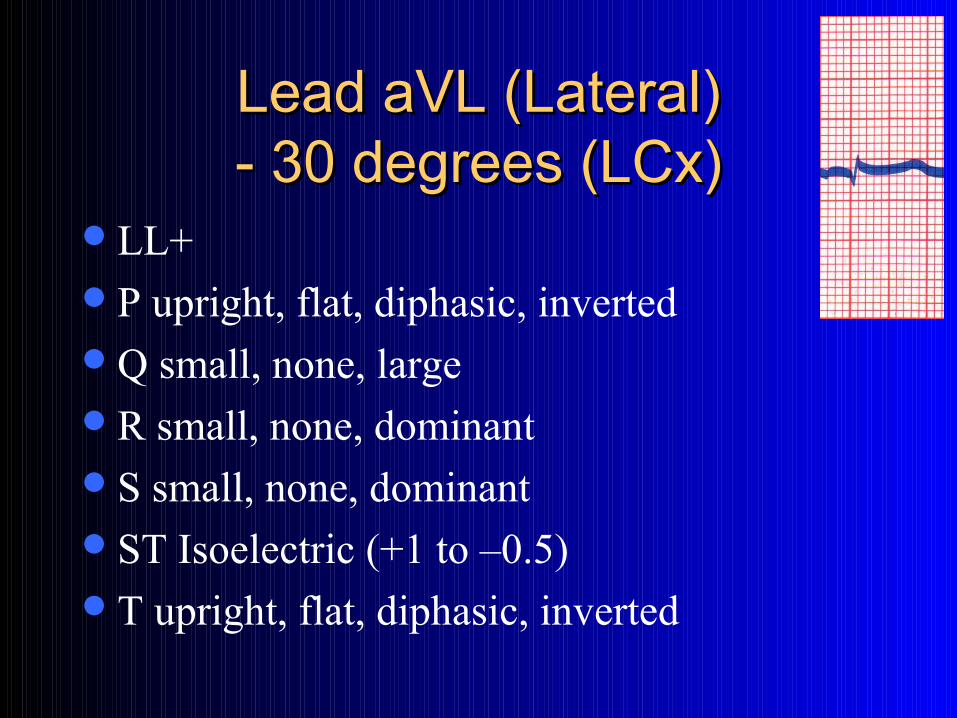
Lead aVL (Lateral)Lead aVL (Lateral)- 30 degrees (LCx)- 30 degrees (LCx)
LL+P upright, flat, diphasic, invertedQ small, none, largeR small, none, dominantS small, none, dominantST Isoelectric (+1 to –0.5)T upright, flat, diphasic, inverted
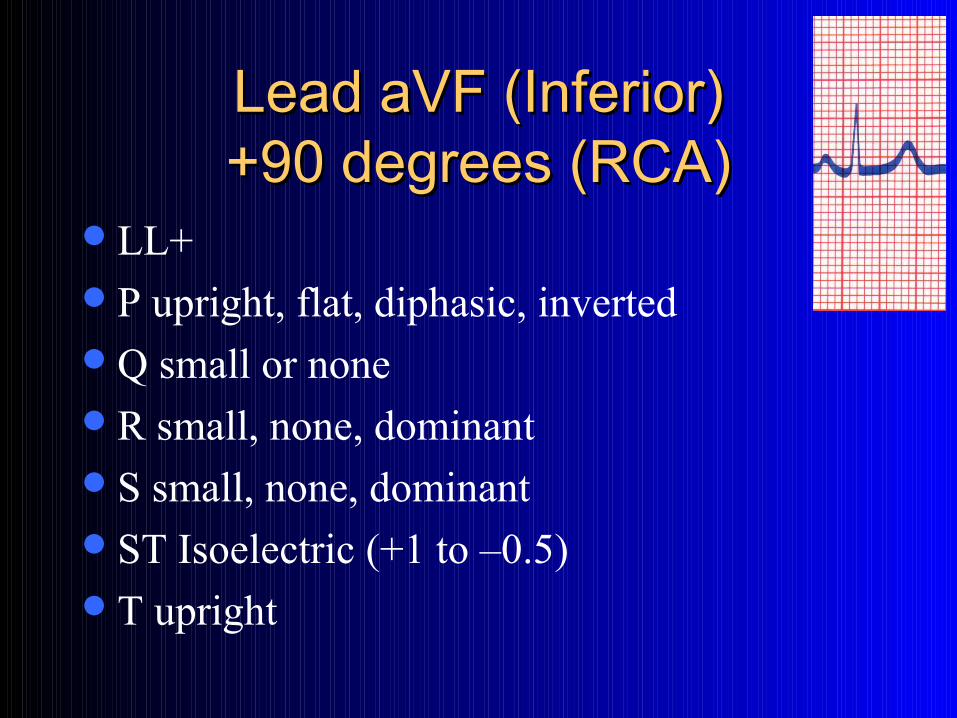
Lead aVF (Inferior)Lead aVF (Inferior)+90 degrees (RCA)+90 degrees (RCA)
LL+P upright, flat, diphasic, invertedQ small or noneR small, none, dominantS small, none, dominantST Isoelectric (+1 to –0.5)T upright
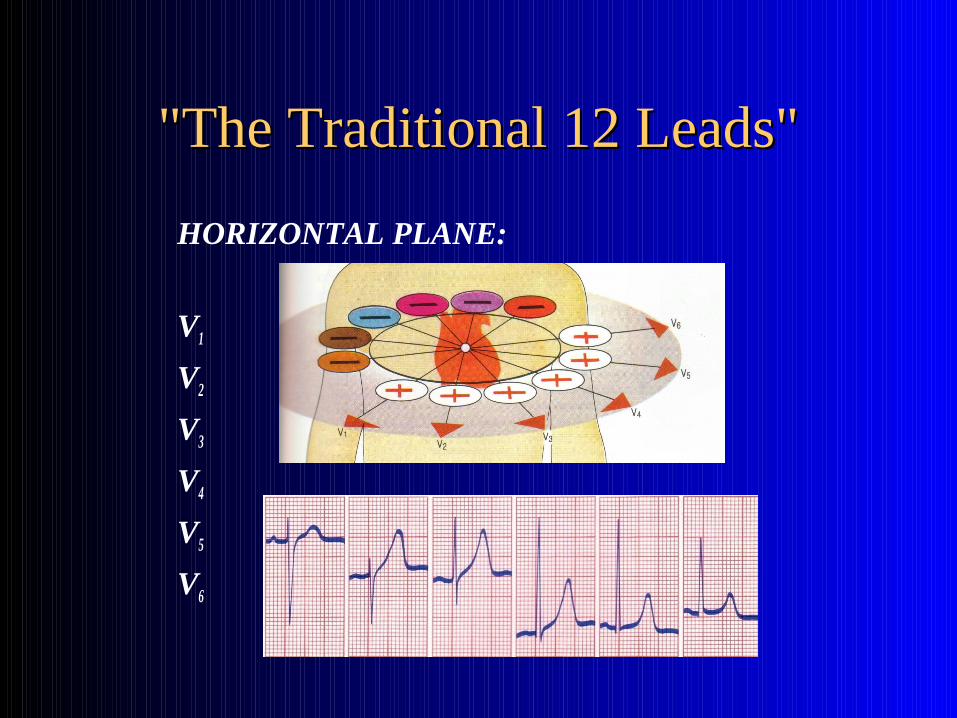
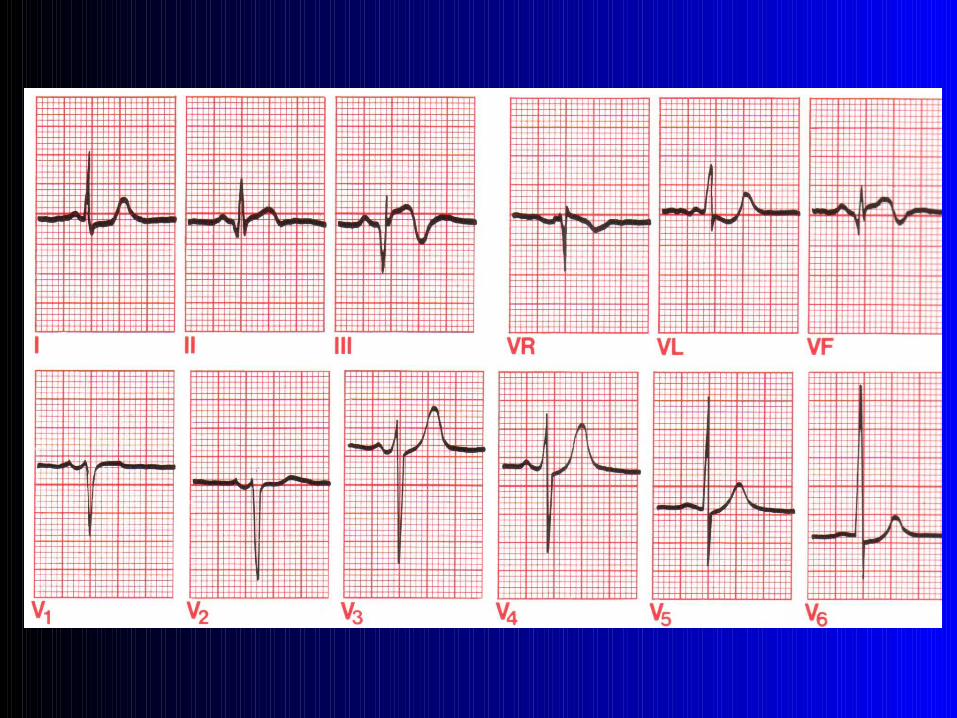
"The Traditional 12 Leads""The Traditional 12 Leads"
HORIZONTAL PLANE:
V1
V2
V3
V4
V5
V6
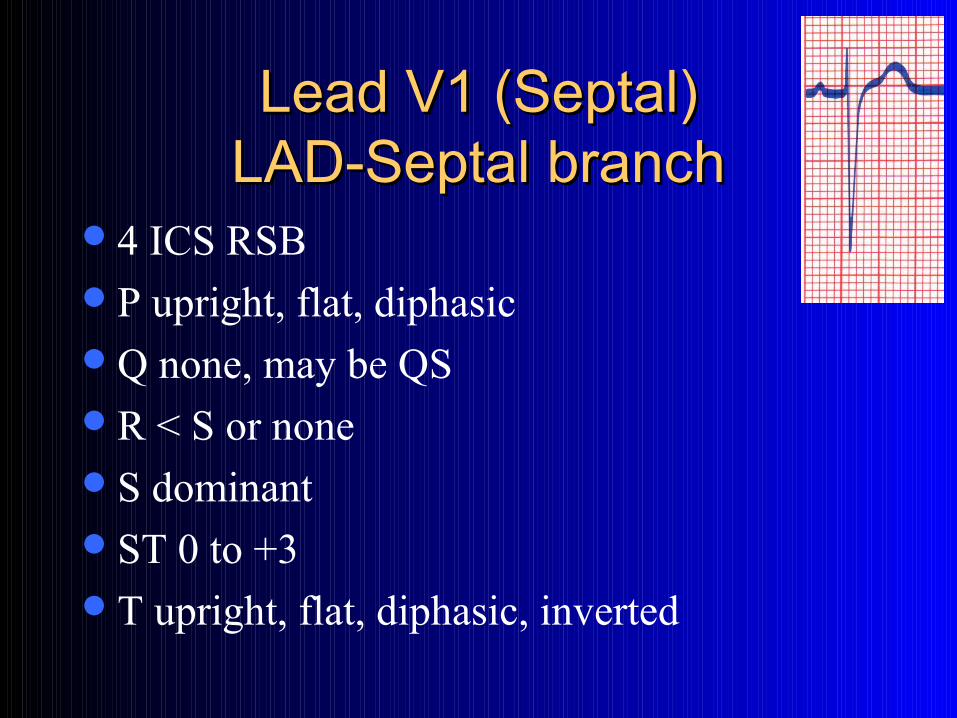
Lead V1 (Septal)Lead V1 (Septal)LAD-Septal branchLAD-Septal branch
4 ICS RSBP upright, flat, diphasicQ none, may be QSR < S or noneS dominantST 0 to +3T upright, flat, diphasic, inverted
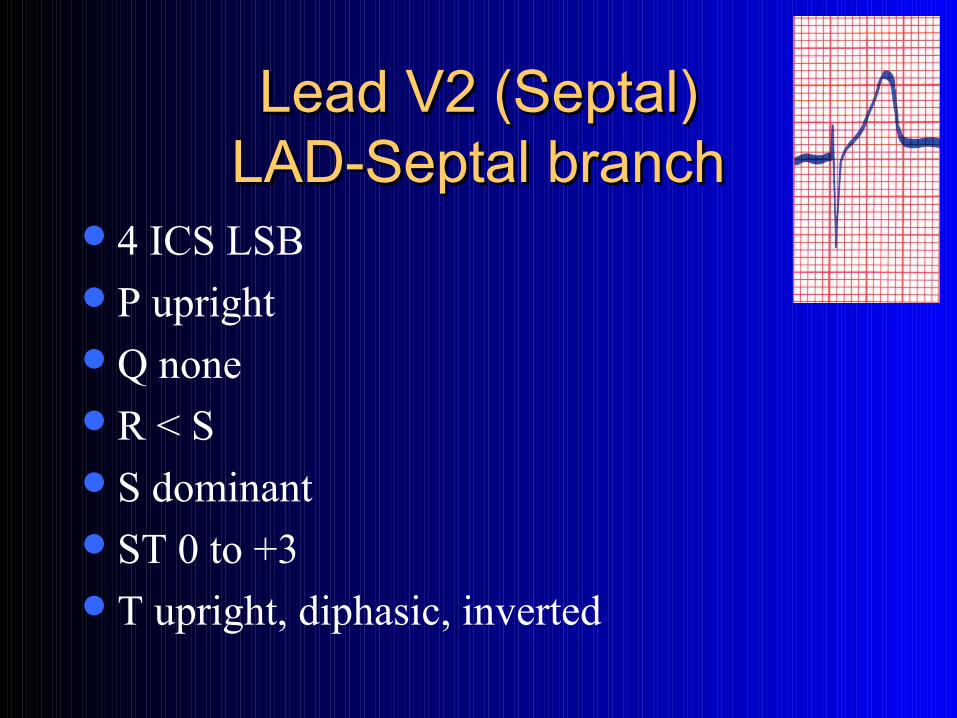
Lead V2 (Septal)Lead V2 (Septal)LAD-Septal branchLAD-Septal branch
4 ICS LSBP uprightQ noneR < SS dominantST 0 to +3T upright, diphasic, inverted
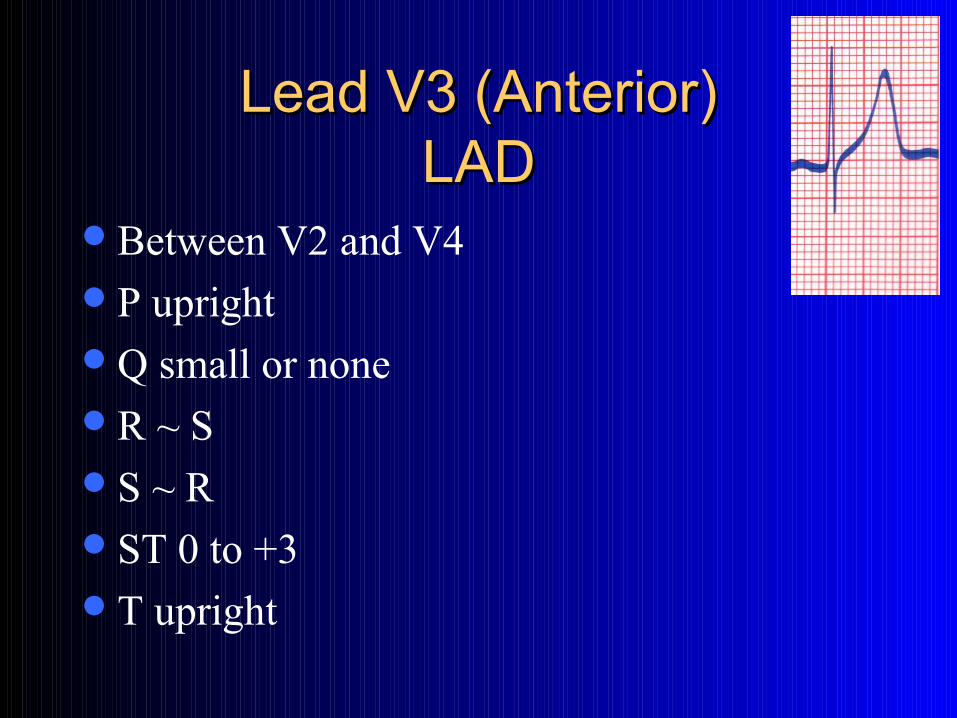
Lead V3 (Anterior)Lead V3 (Anterior)LADLAD
Between V2 and V4P uprightQ small or noneR ~ SS ~ RST 0 to +3T upright
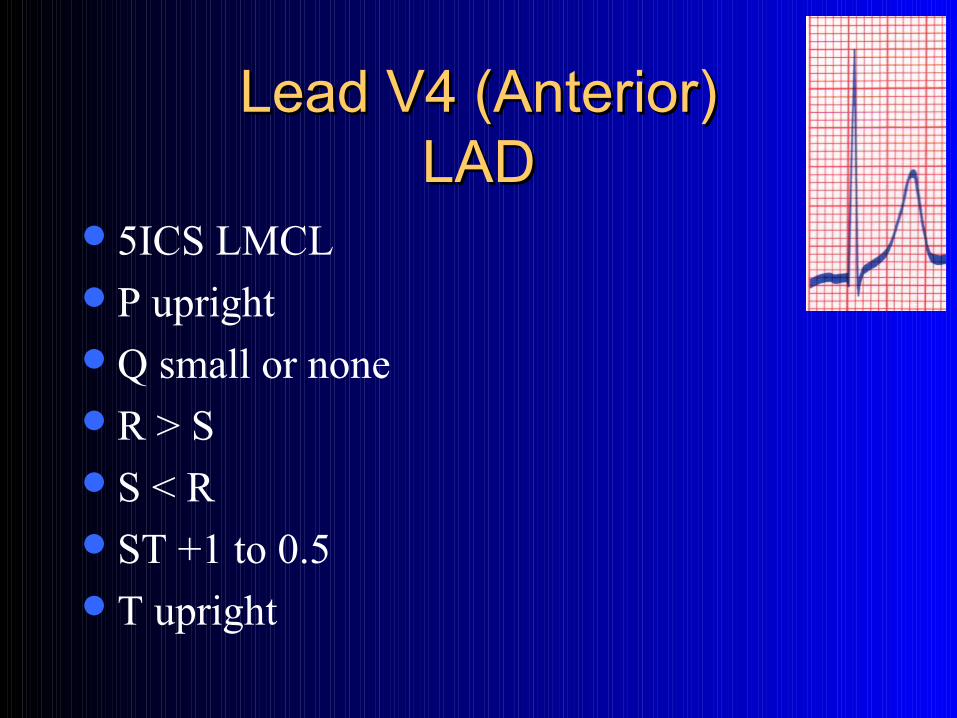
Lead V4 (Anterior)Lead V4 (Anterior)LADLAD
5ICS LMCLP uprightQ small or noneR > SS < RST +1 to 0.5T upright
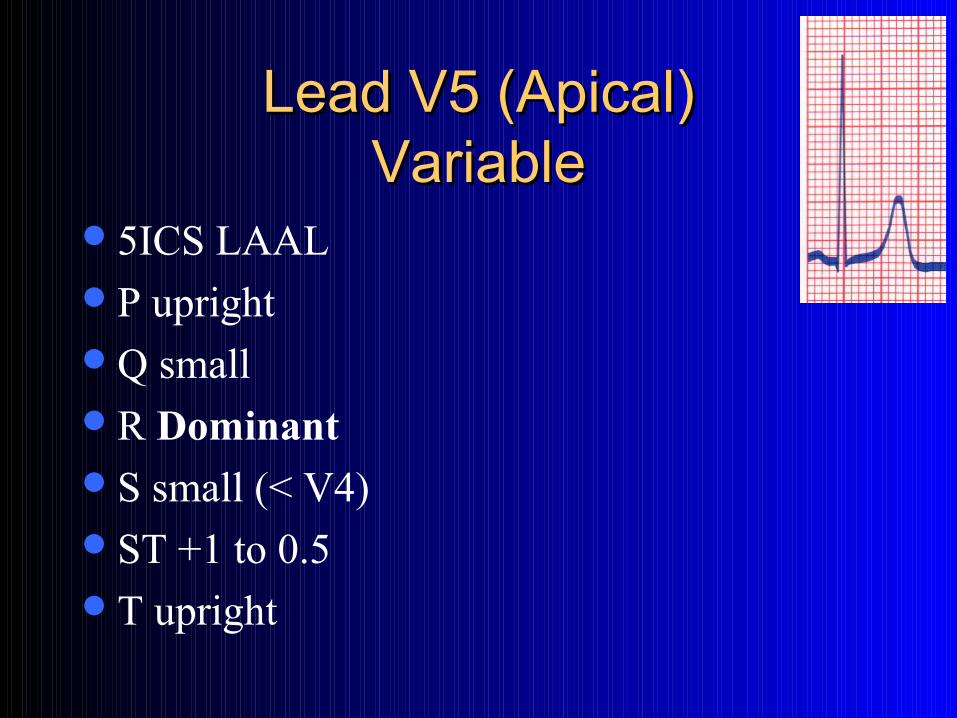
Lead V5 (Apical)Lead V5 (Apical)VariableVariable
5ICS LAALP uprightQ smallR DominantS small (< V4)ST +1 to 0.5T upright
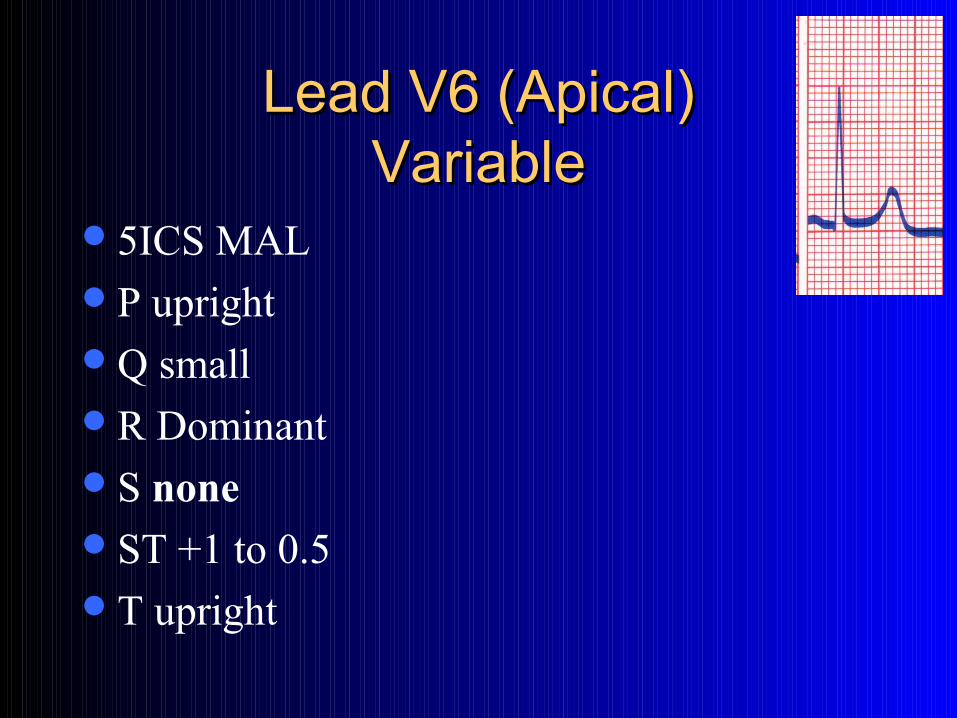
Lead V6 (Apical)Lead V6 (Apical)VariableVariable
5ICS MALP uprightQ smallR DominantS noneST +1 to 0.5T upright
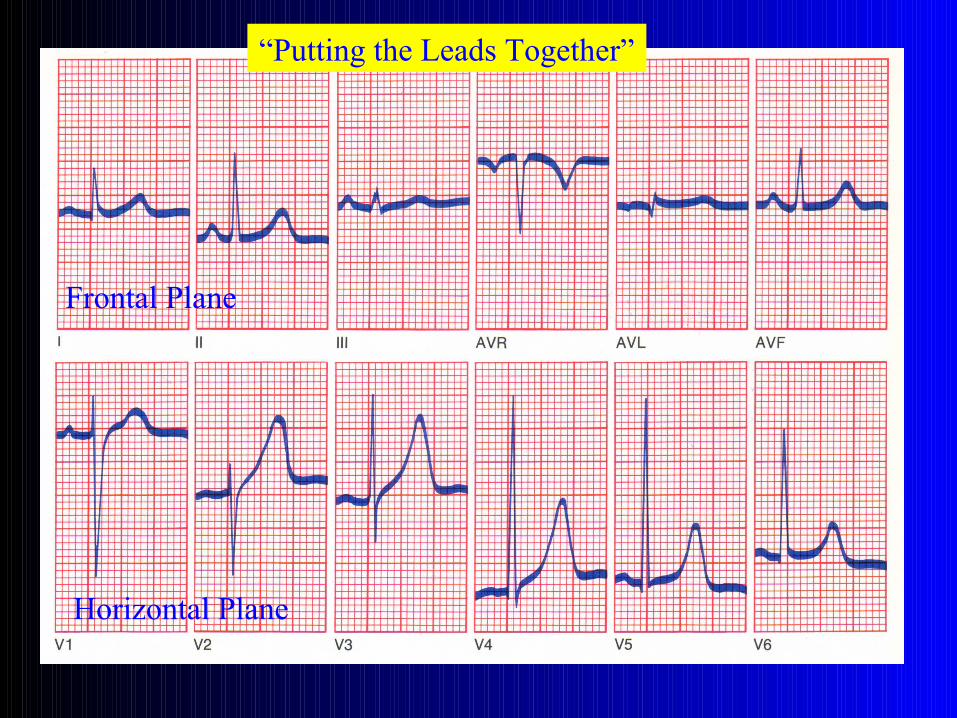
“Putting the Leads Together”
Frontal Plane
Horizontal Plane

““AdditionalAdditional Leads" Leads"
HORIZONTAL PLANE: Right-Sided Leads
V1R
V2R
V3R
V4R
V5R
V6R

““AdditionalAdditional Leads" Leads"
HORIZONTAL PLANE: Posterior Leads
V7
V8
V9
"Systematic Approach" "Systematic Approach" to the Electrocardiogramto the Electrocardiogram
A Systematic ApproachA Systematic Approach
Establish underlying rhythm (atrial & ventricular rates, PR interval, AV conduction)
Measure the QRS (including VAT) and QT interval
Determine the Mean Frontal Plane Axis
A Systematic ApproachA Systematic Approach
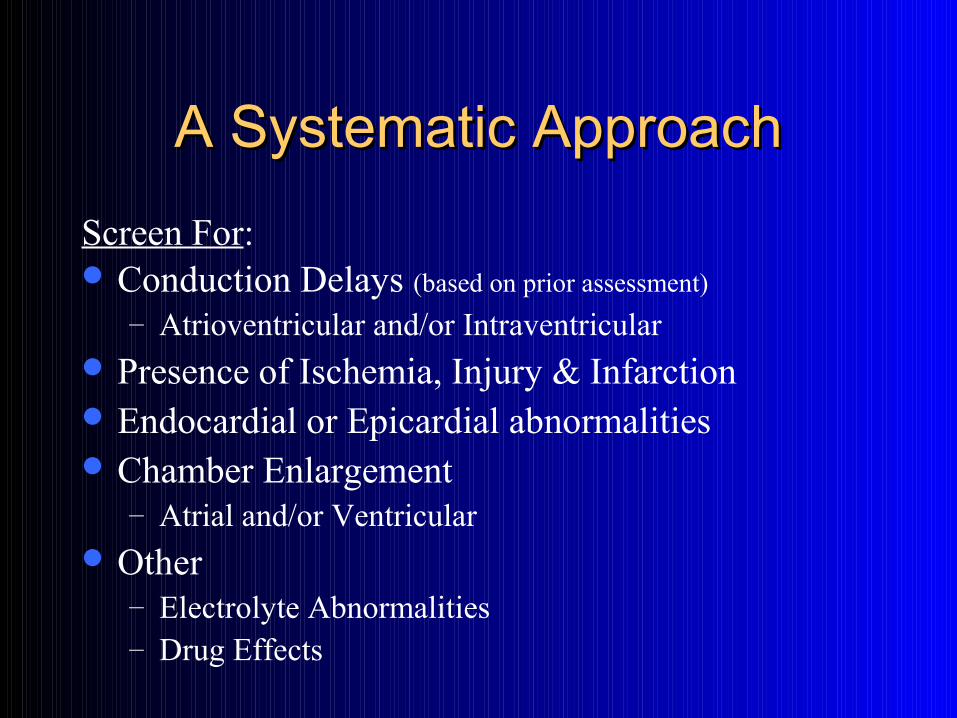
Screen For: Conduction Delays (based on prior assessment)
– Atrioventricular and/or Intraventricular Presence of Ischemia, Injury & Infarction Endocardial or Epicardial abnormalities Chamber Enlargement
– Atrial and/or Ventricular Other
– Electrolyte Abnormalities– Drug Effects
A Systematic ApproachA Systematic Approach
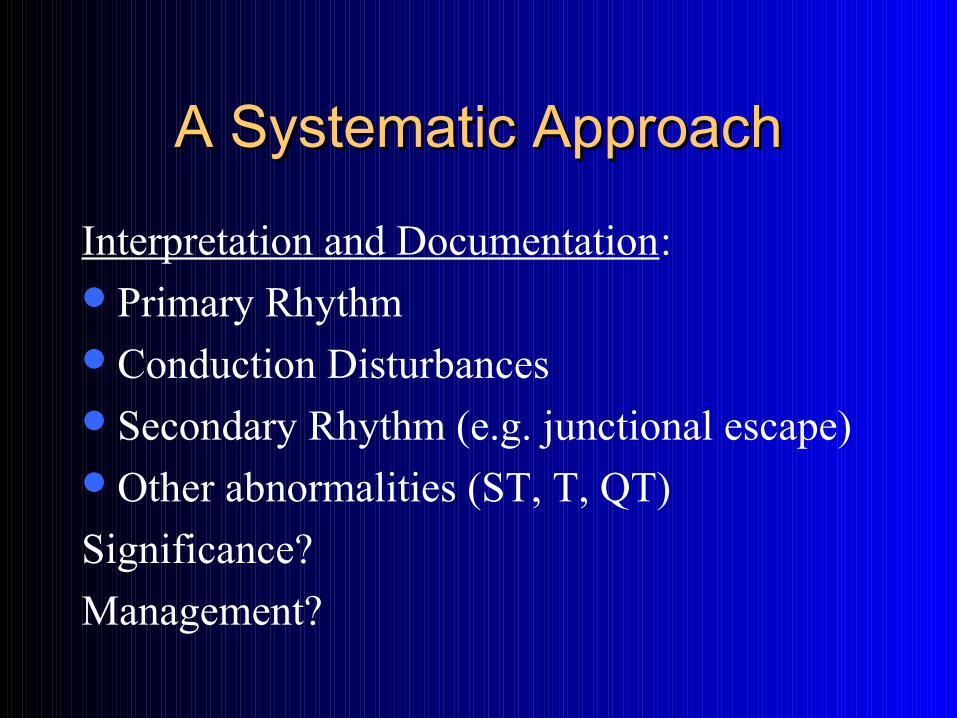
Interpretation and Documentation:Primary RhythmConduction DisturbancesSecondary Rhythm (e.g. junctional escape)Other abnormalities (ST, T, QT)
Significance?
Management?

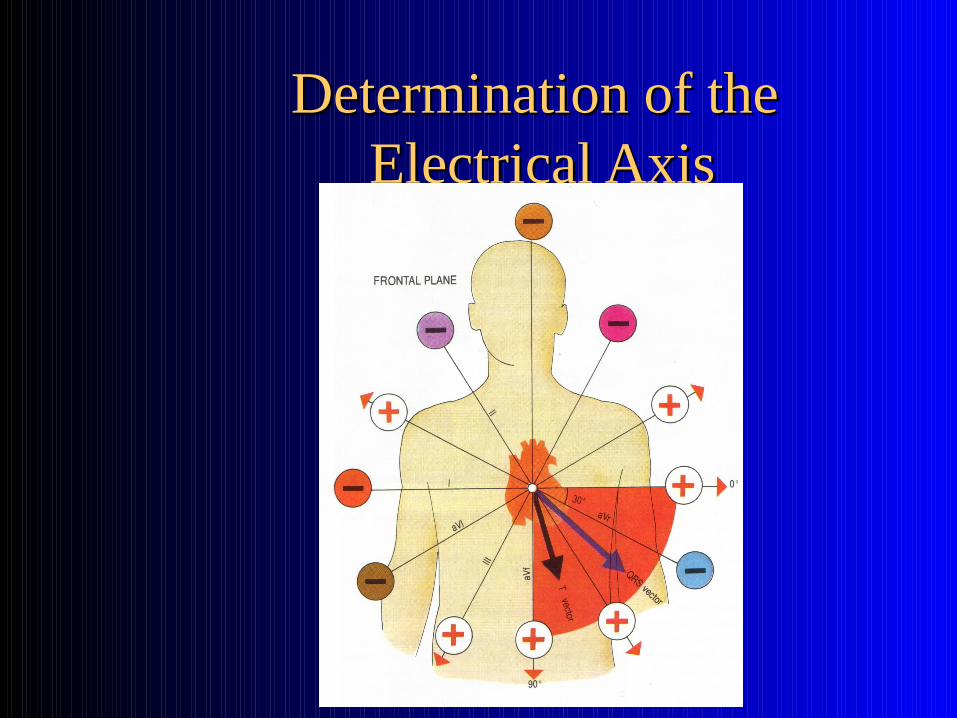
The Electrical AxisThe Electrical Axis

Axis … No Problem!Axis … No Problem!

The Electrical AxisThe Electrical Axis
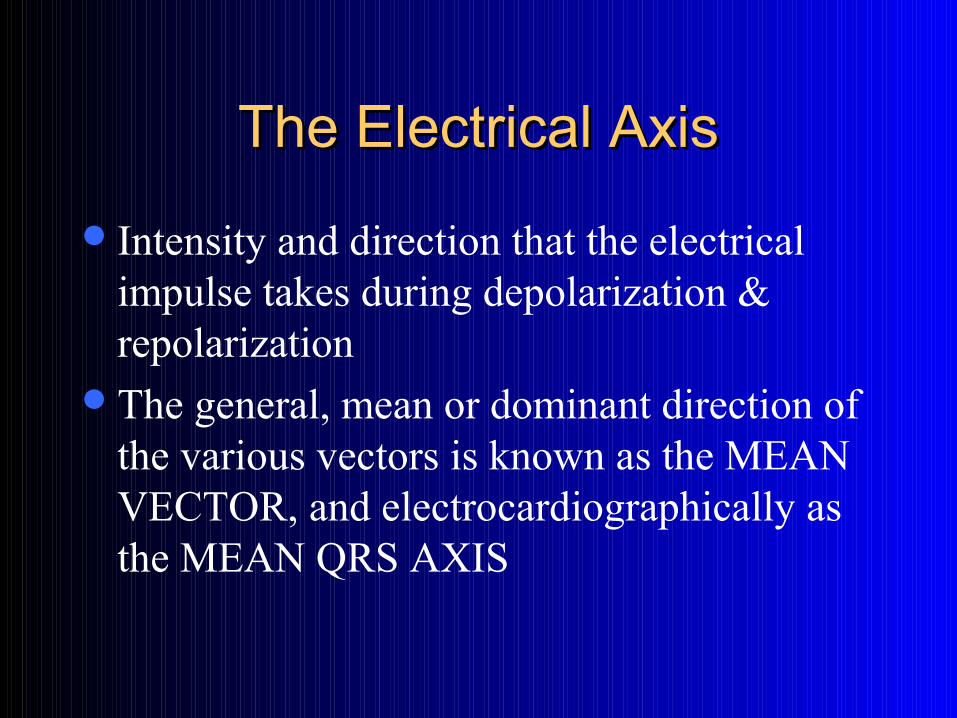
Intensity and direction that the electrical impulse takes during depolarization & repolarization
The general, mean or dominant direction of the various vectors is known as the MEAN VECTOR, and electrocardiographically as the MEAN QRS AXIS
The Electrical AxisThe Electrical Axis
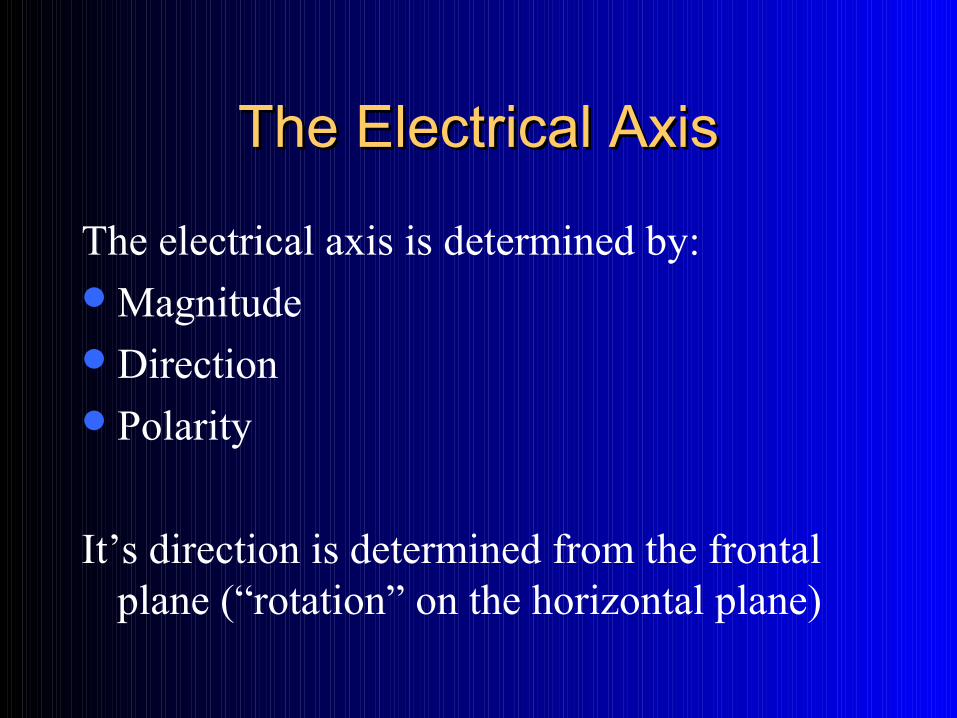
The electrical axis is determined by:MagnitudeDirectionPolarity
It’s direction is determined from the frontal plane (“rotation” on the horizontal plane)
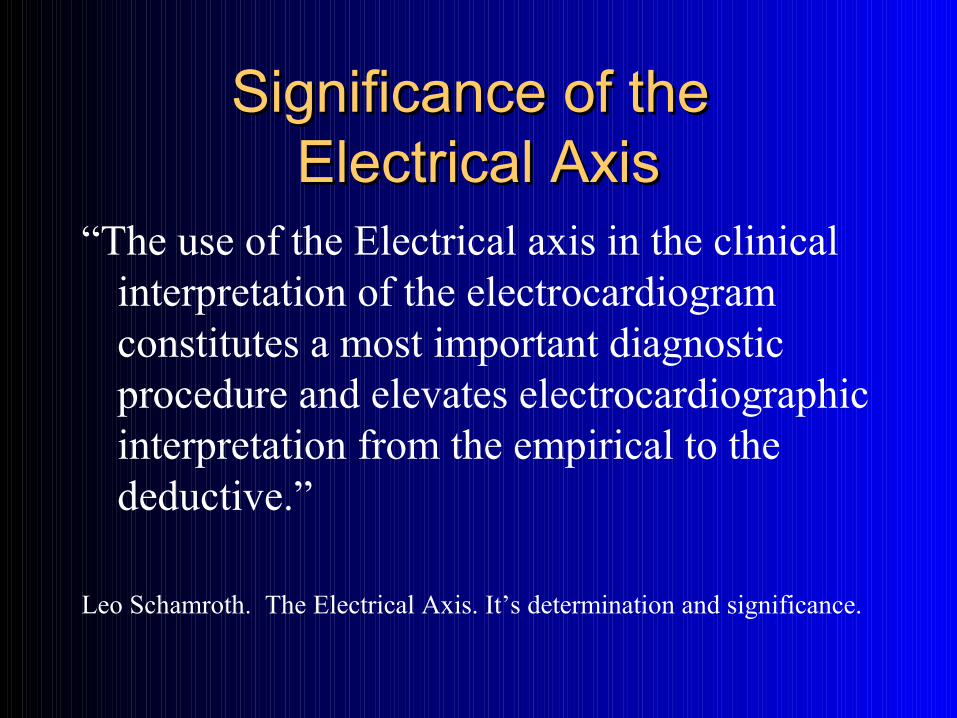
Significance of the Significance of the Electrical AxisElectrical Axis
“The use of the Electrical axis in the clinical interpretation of the electrocardiogram constitutes a most important diagnostic procedure and elevates electrocardiographic interpretation from the empirical to the deductive.”
Leo Schamroth. The Electrical Axis. It’s determination and significance.
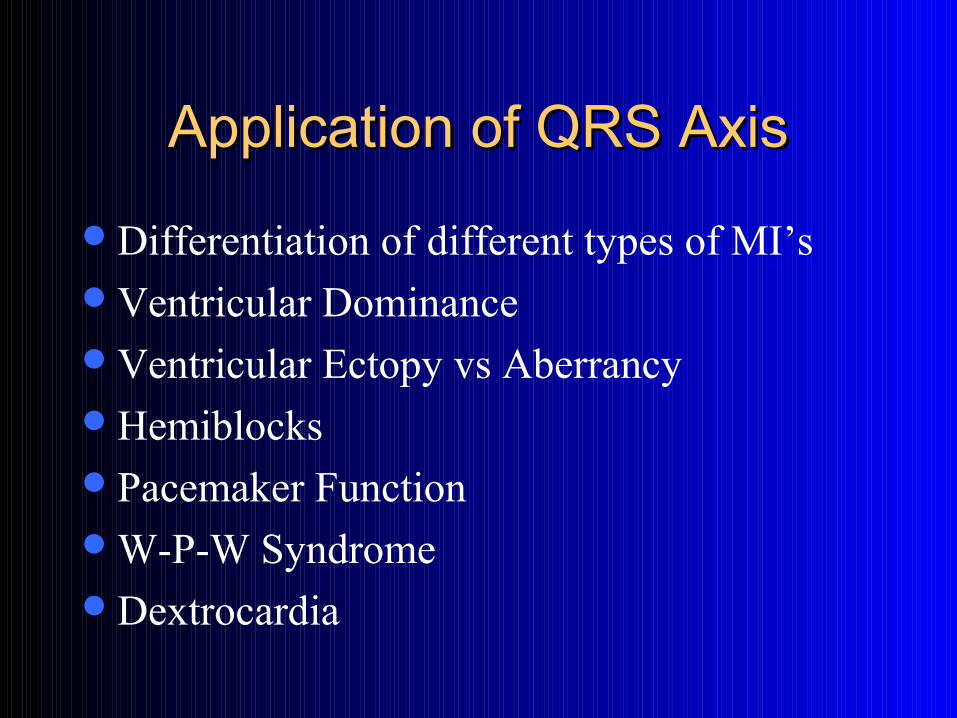
Application of QRS AxisApplication of QRS Axis
Differentiation of different types of MI’sVentricular DominanceVentricular Ectopy vs AberrancyHemiblocksPacemaker FunctionW-P-W SyndromeDextrocardia
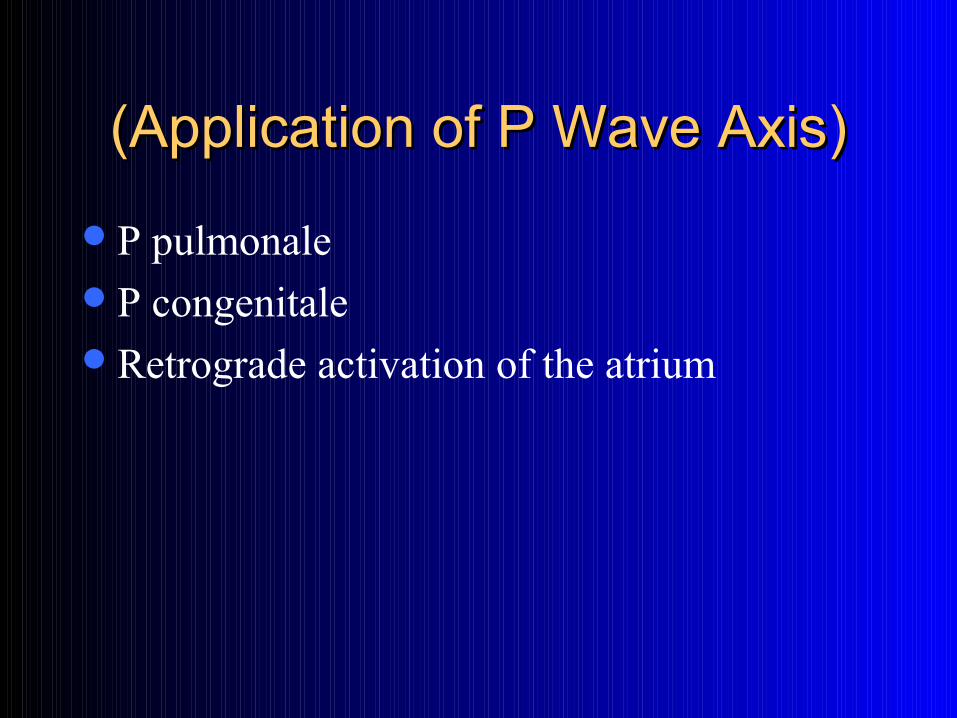
(Application of P Wave Axis)(Application of P Wave Axis)
P pulmonaleP congenitaleRetrograde activation of the atrium
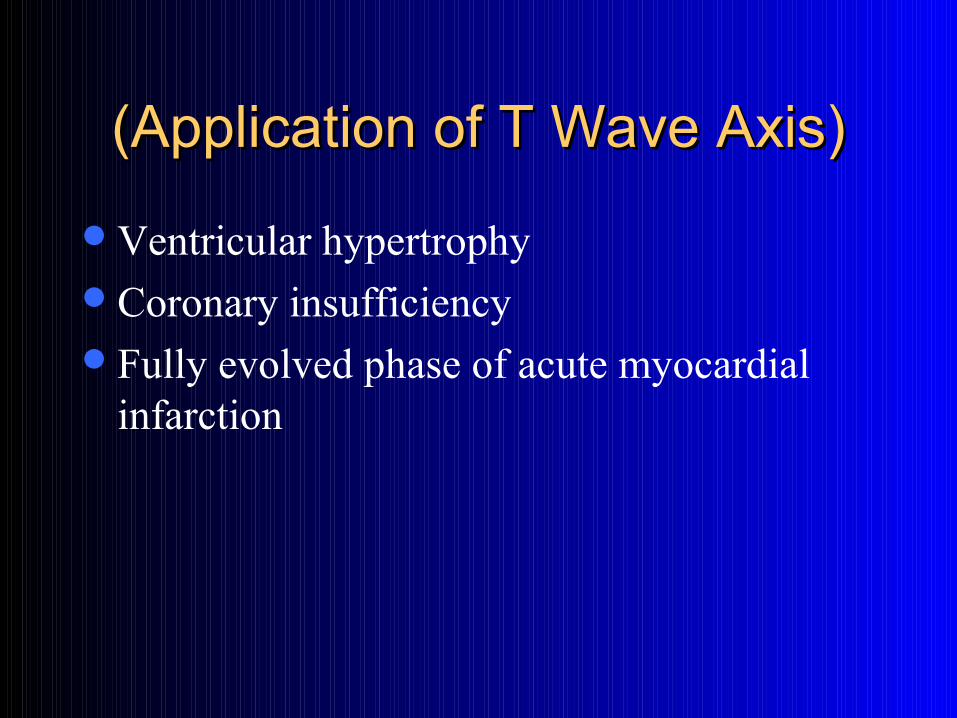
(Application of T Wave Axis)(Application of T Wave Axis)
Ventricular hypertrophyCoronary insufficiencyFully evolved phase of acute myocardial
infarction
(Application of ST Axis)(Application of ST Axis)
InfarctionSubendocardial vs. Subepicardial injury
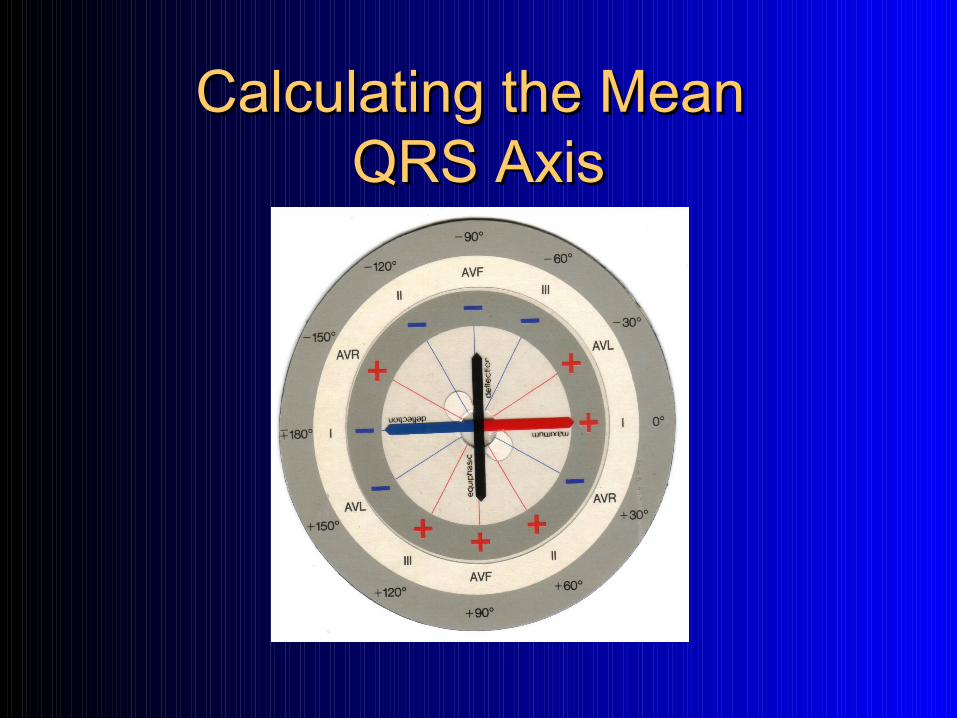
Calculating the Mean Calculating the Mean QRS AxisQRS Axis
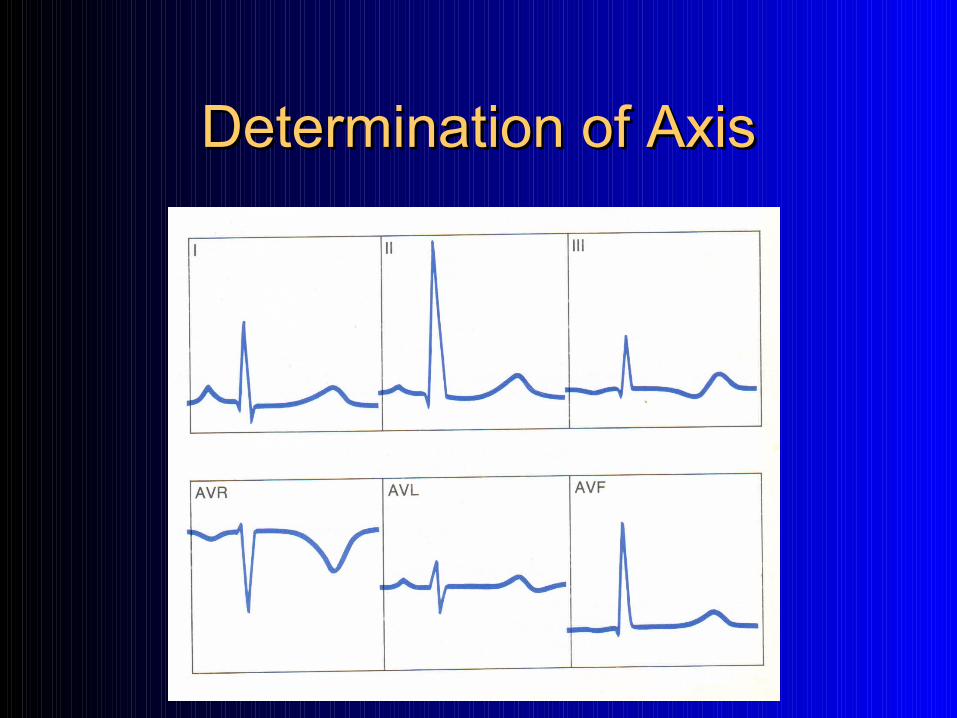
Determination of the AxisDetermination of the Axis
There are several methods for estimation of the frontal plane axis.
Ideal method would be both the most simplistic and accurate, thus lending itself to efficient clinical application.
Steps for Calculation of AxisSteps for Calculation of Axis
1. Most equiphasic or smallest complex on frontal plane?
2. Which lead is 900 (perpendicular) to this lead?
3. Is this lead mostly positive or negative? If positive, go to the positive pole … if negative, go to the negative pole
4. Axis?
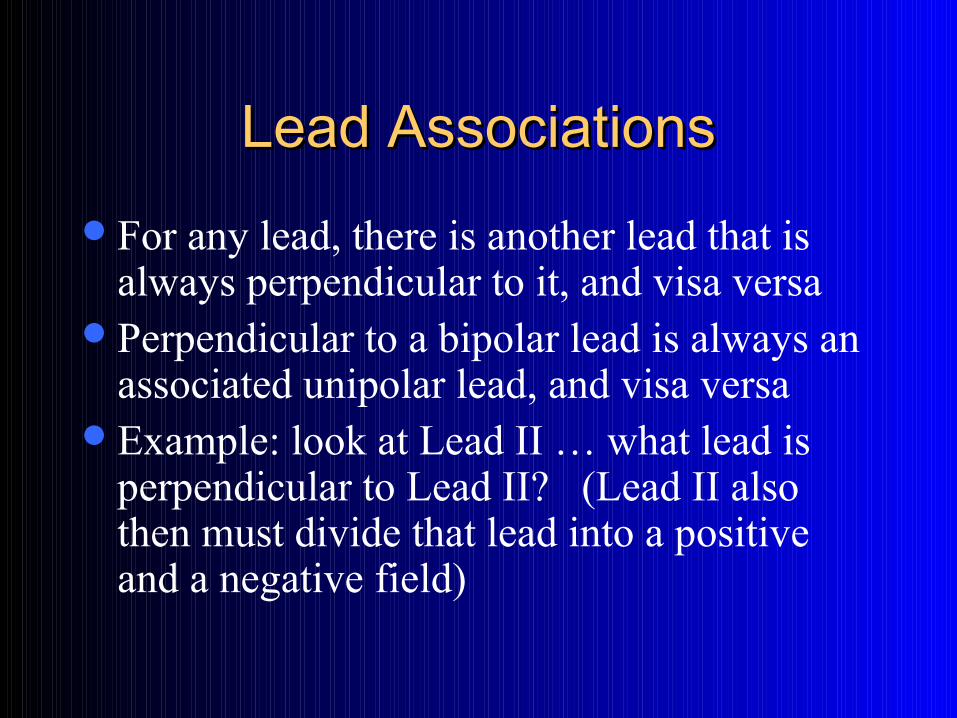
Lead AssociationsLead Associations
For any lead, there is another lead that is always perpendicular to it, and visa versa
Perpendicular to a bipolar lead is always an associated unipolar lead, and visa versa
Example: look at Lead II … what lead is perpendicular to Lead II? (Lead II also then must divide that lead into a positive and a negative field)
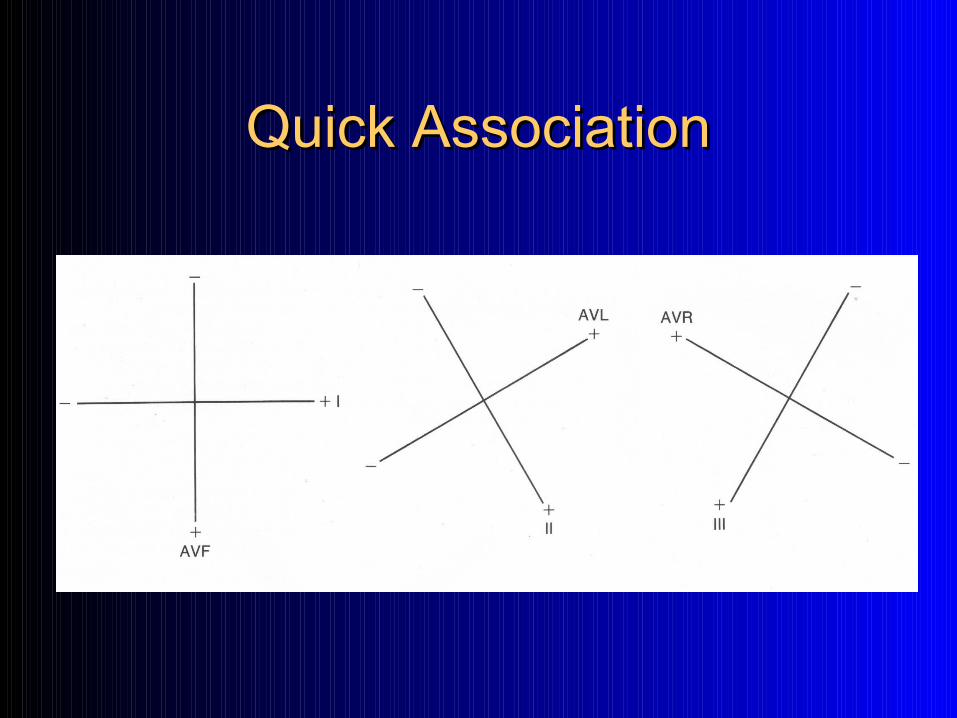
Quick AssociationQuick Association
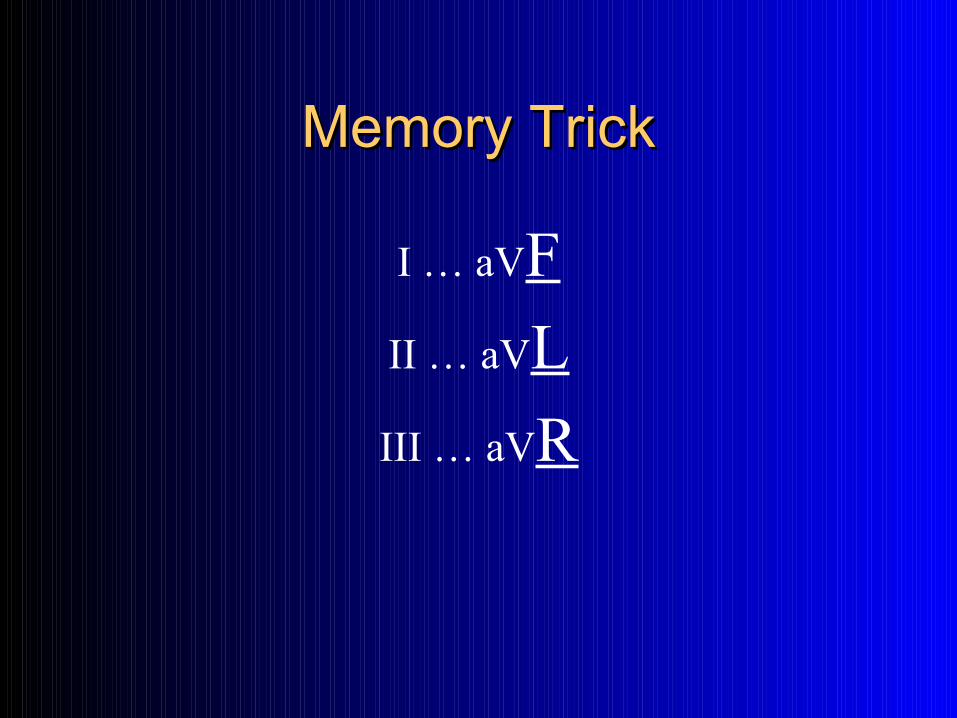
Memory TrickMemory Trick
I … aVF
II … aVL
III … aVR
Determination of AxisDetermination of Axis
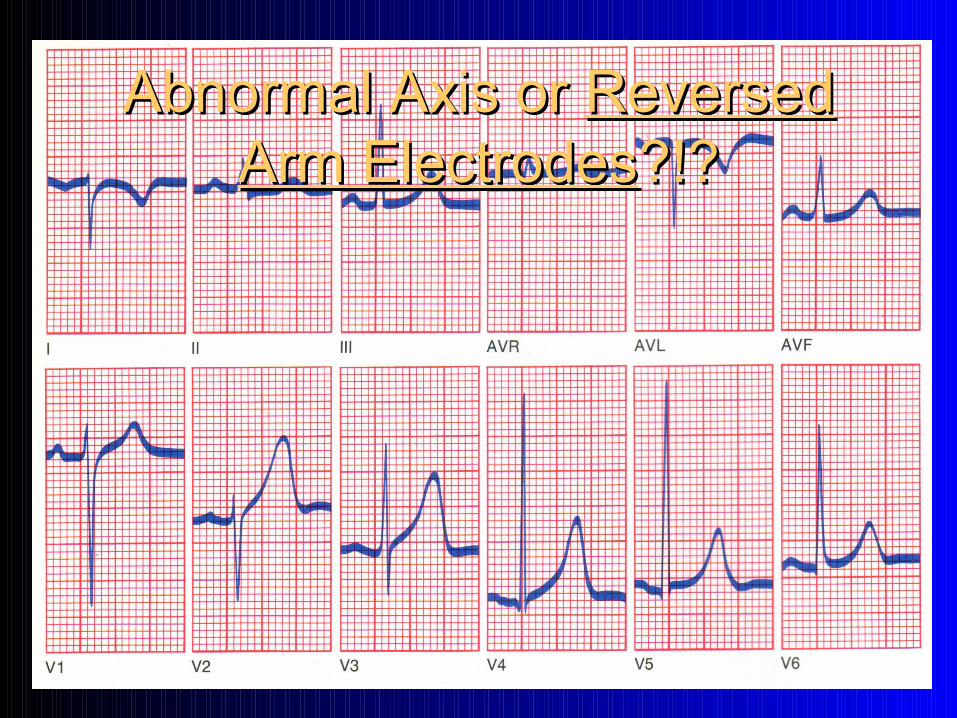
Abnormal Axis or Abnormal Axis or Reversed Reversed Arm ElectrodesArm Electrodes?!??!?
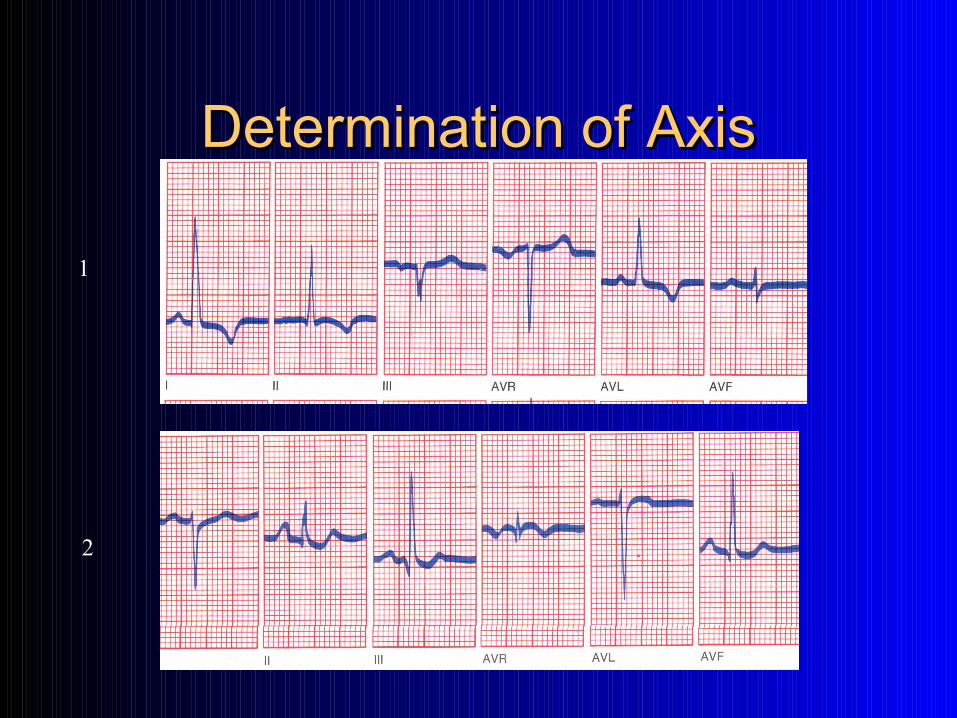
Determination of AxisDetermination of Axis
1
2
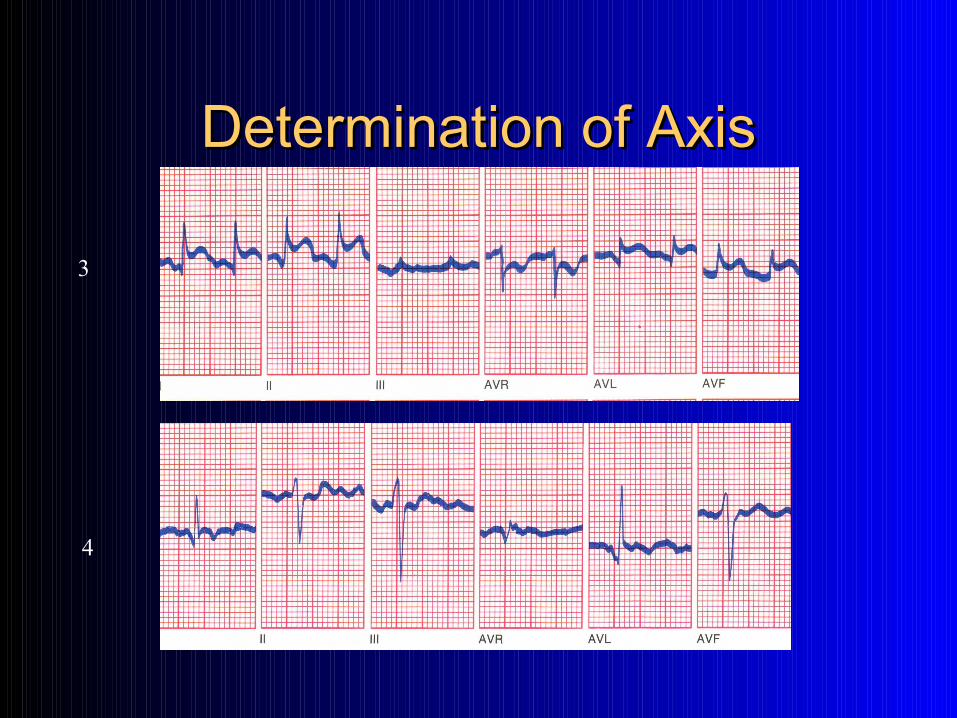
Determination of AxisDetermination of Axis
3
4
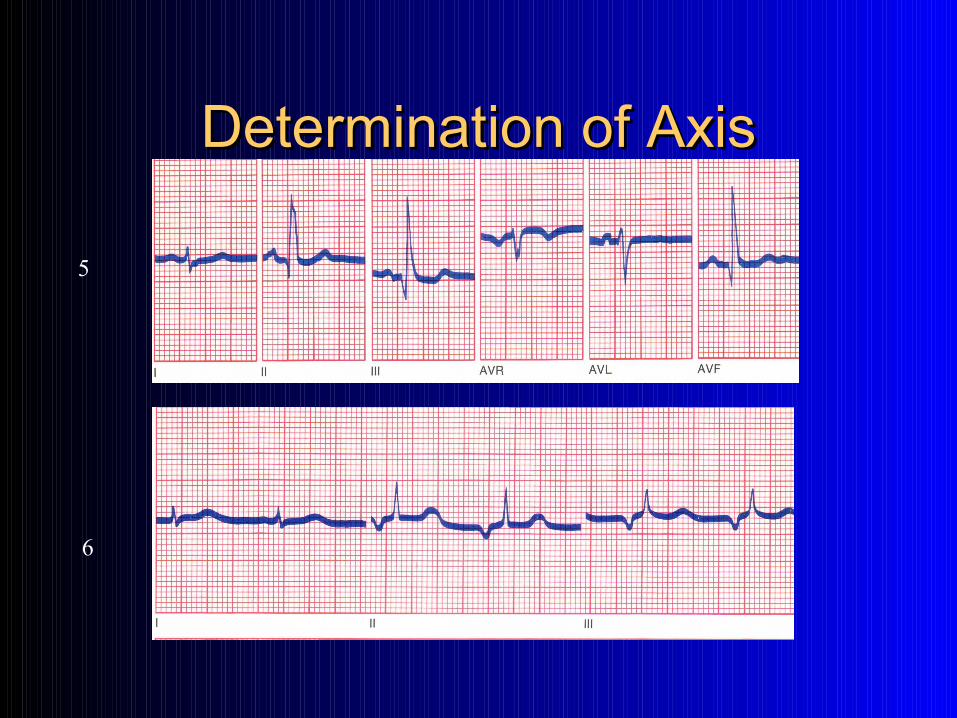
Determination of AxisDetermination of Axis
5
6
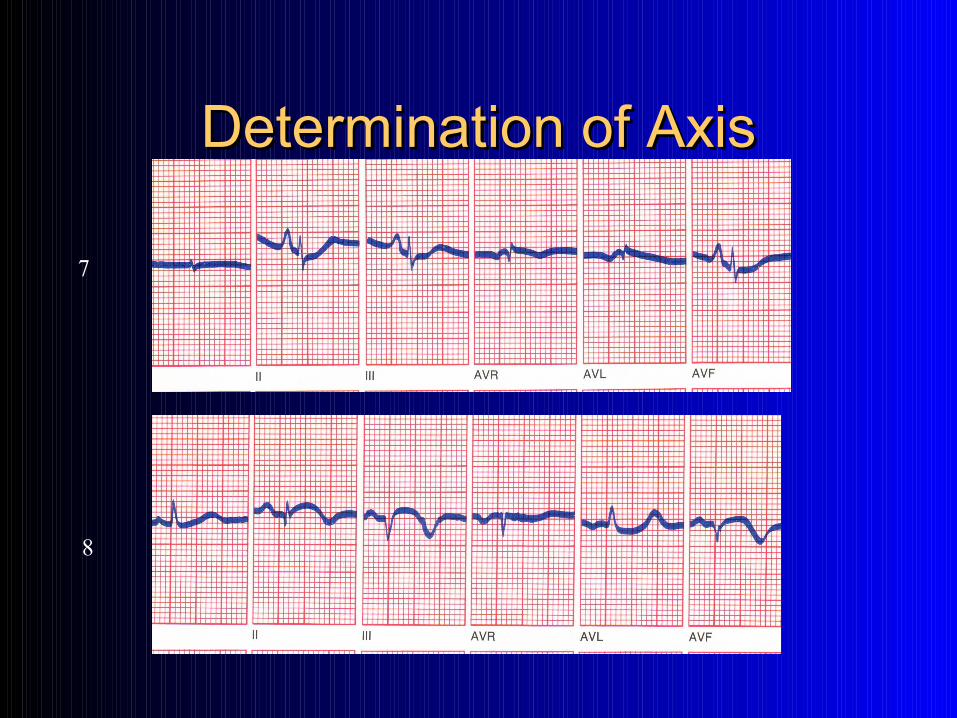
Determination of AxisDetermination of Axis
7
8
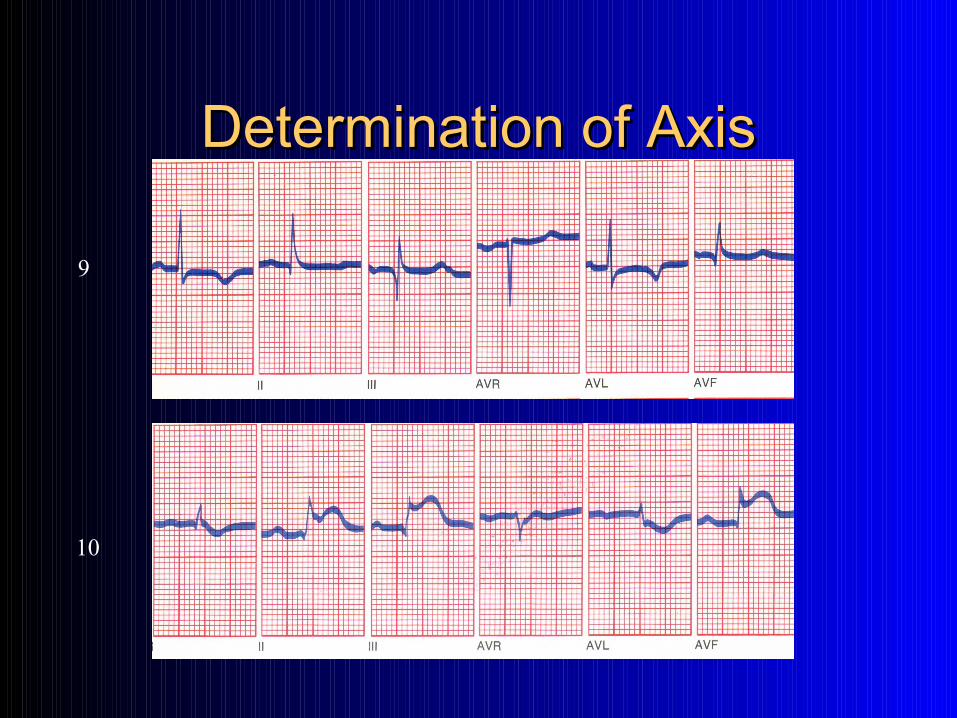
Determination of AxisDetermination of Axis
9
10
Determination of the Determination of the Electrical AxisElectrical Axis
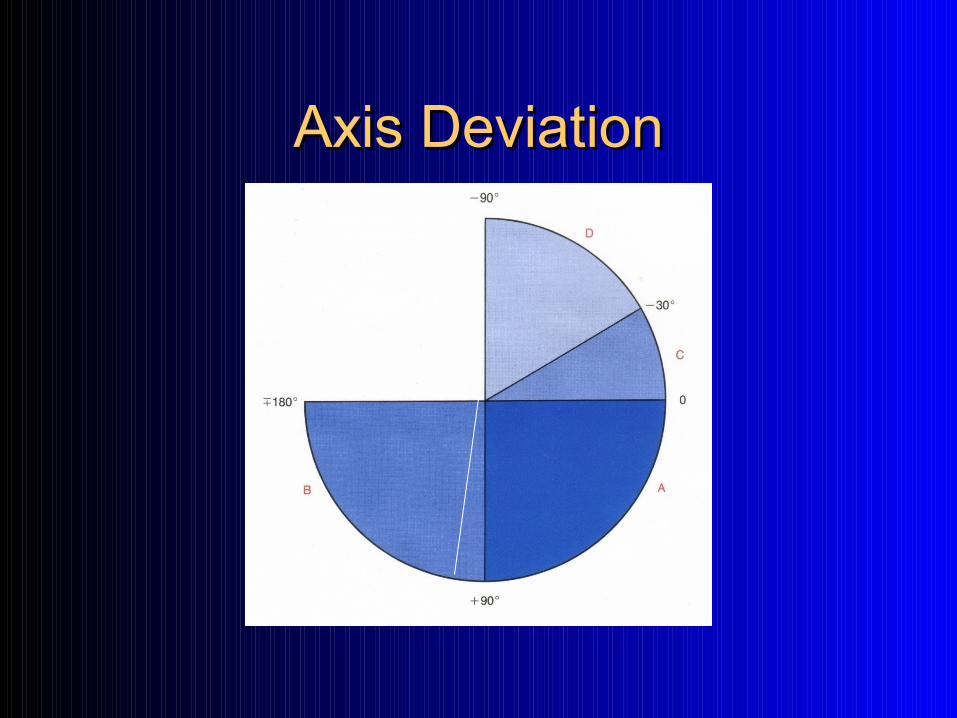
Axis DeviationAxis Deviation
ECG Patterns of Ischemia, ECG Patterns of Ischemia, Injury Injury && Infarct Infarct
Clinical Recognition
Ischemia, Injury & InfarctIschemia, Injury & Infarct
Myocardial Oxygenation– Supply– Demand
Regional versus Global deficits
Ischemia, Injury & InfarctIschemia, Injury & Infarct
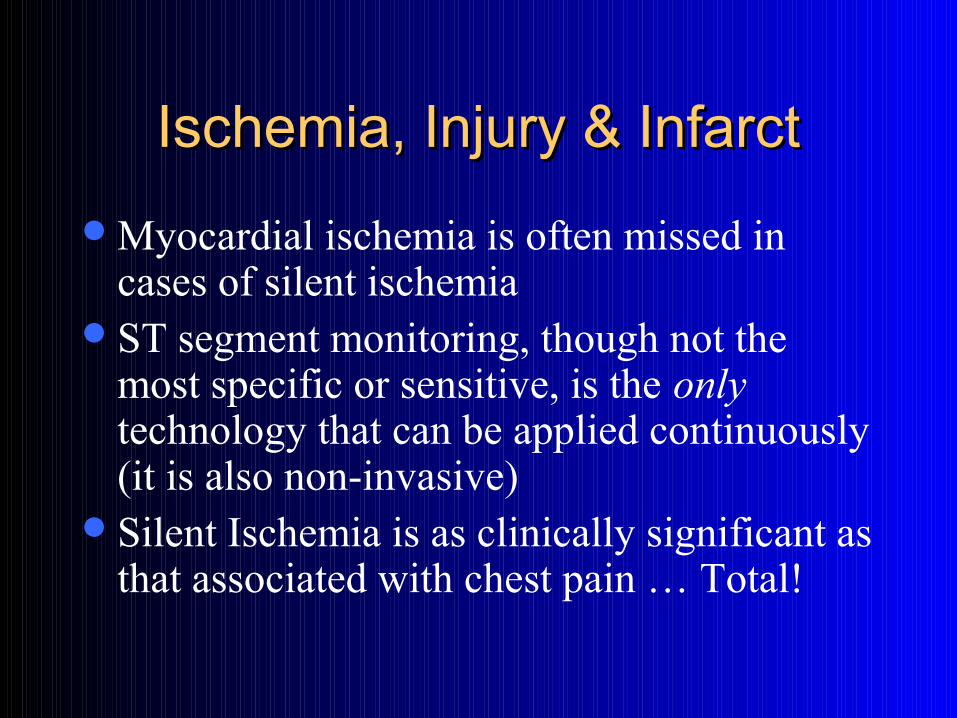
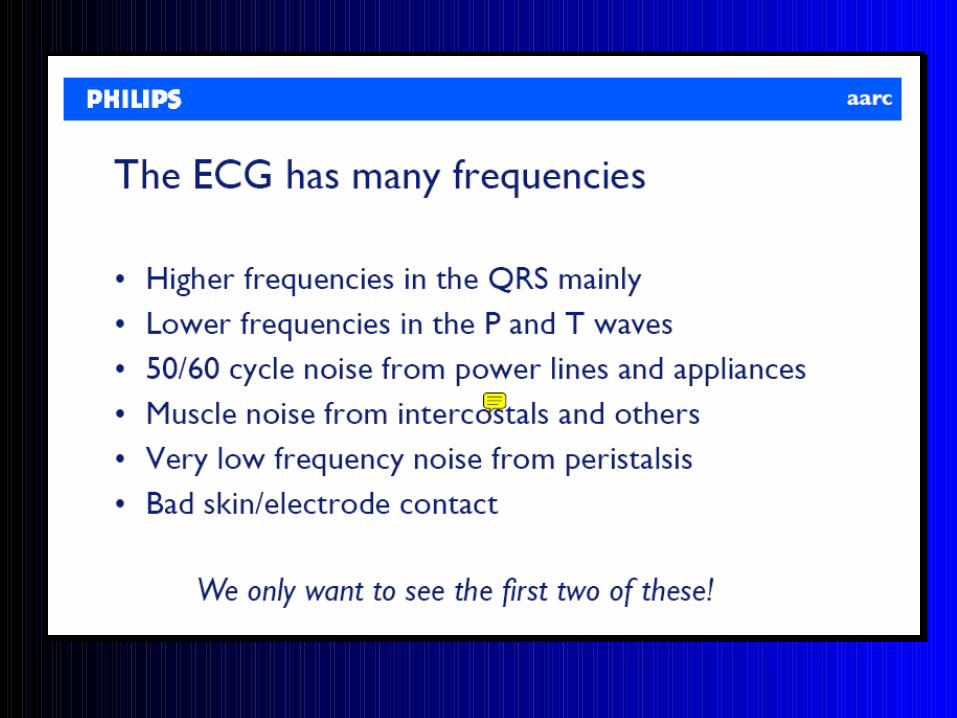
Myocardial ischemia is often missed in cases of silent ischemia
ST segment monitoring, though not the most specific or sensitive, is the only technology that can be applied continuously (it is also non-invasive)
Silent Ischemia is as clinically significant as that associated with chest pain … Total!
Ischemia, Injury & InfarctIschemia, Injury & Infarct
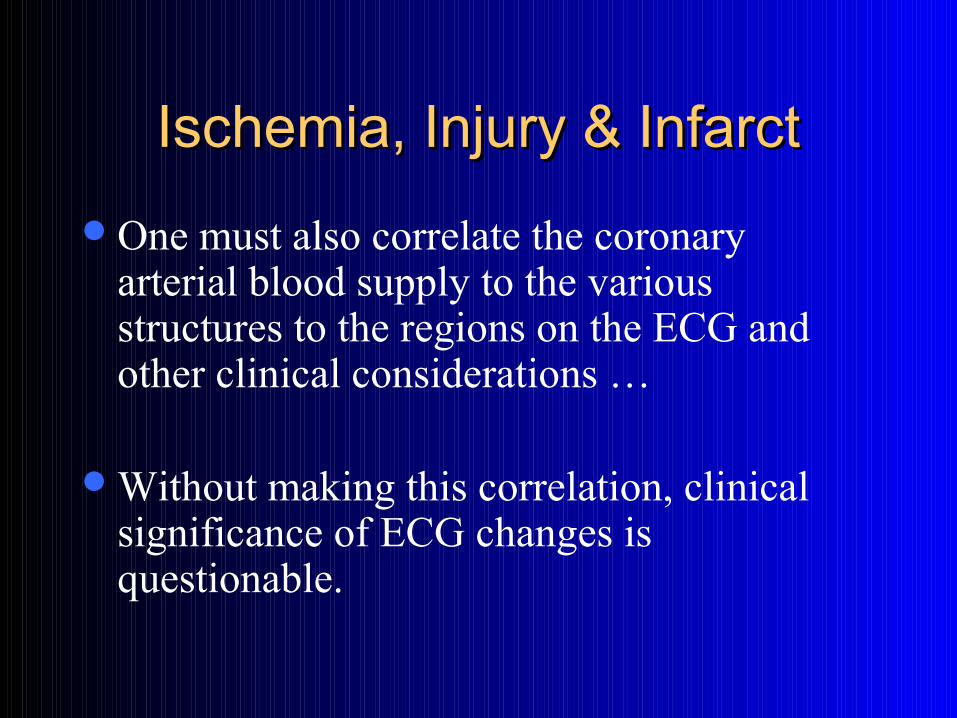
One must also correlate the coronary arterial blood supply to the various structures to the regions on the ECG and other clinical considerations …
Without making this correlation, clinical significance of ECG changes is questionable.
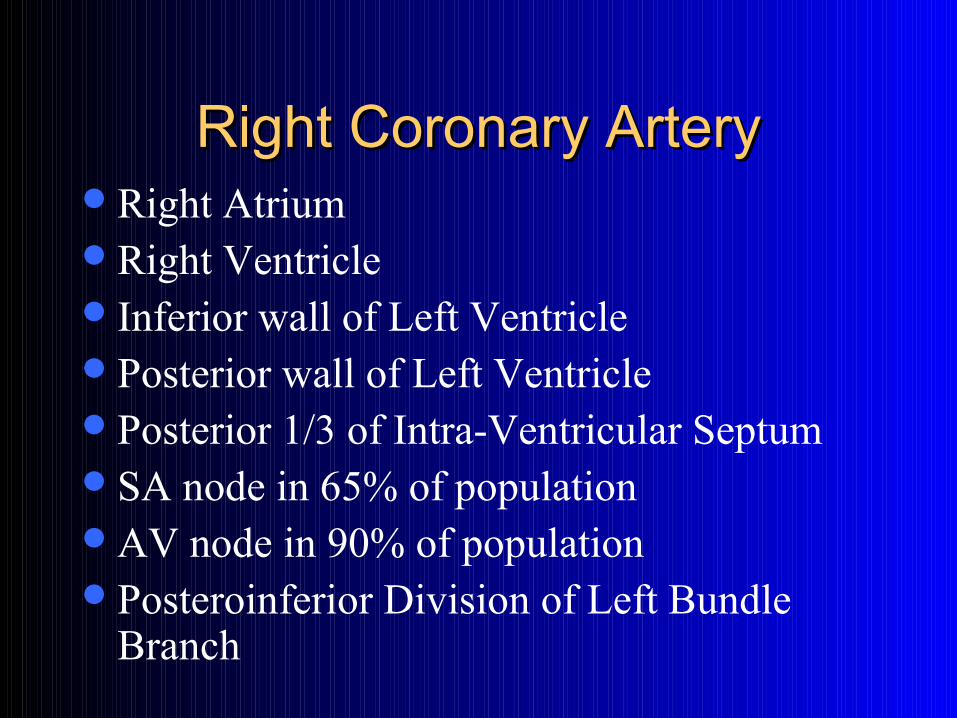
Right Coronary ArteryRight Coronary ArteryRight AtriumRight VentricleInferior wall of Left VentriclePosterior wall of Left VentriclePosterior 1/3 of Intra-Ventricular SeptumSA node in 65% of populationAV node in 90% of populationPosteroinferior Division of Left Bundle
Branch
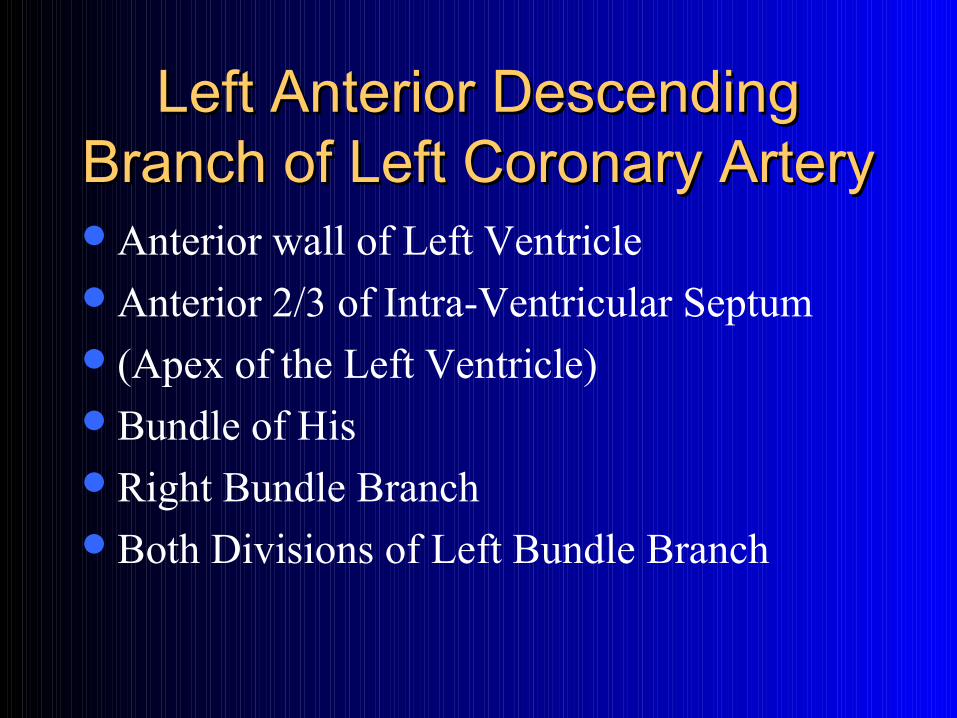
Left Anterior Descending Left Anterior Descending Branch of Left Coronary ArteryBranch of Left Coronary ArteryAnterior wall of Left VentricleAnterior 2/3 of Intra-Ventricular Septum(Apex of the Left Ventricle)Bundle of HisRight Bundle BranchBoth Divisions of Left Bundle Branch
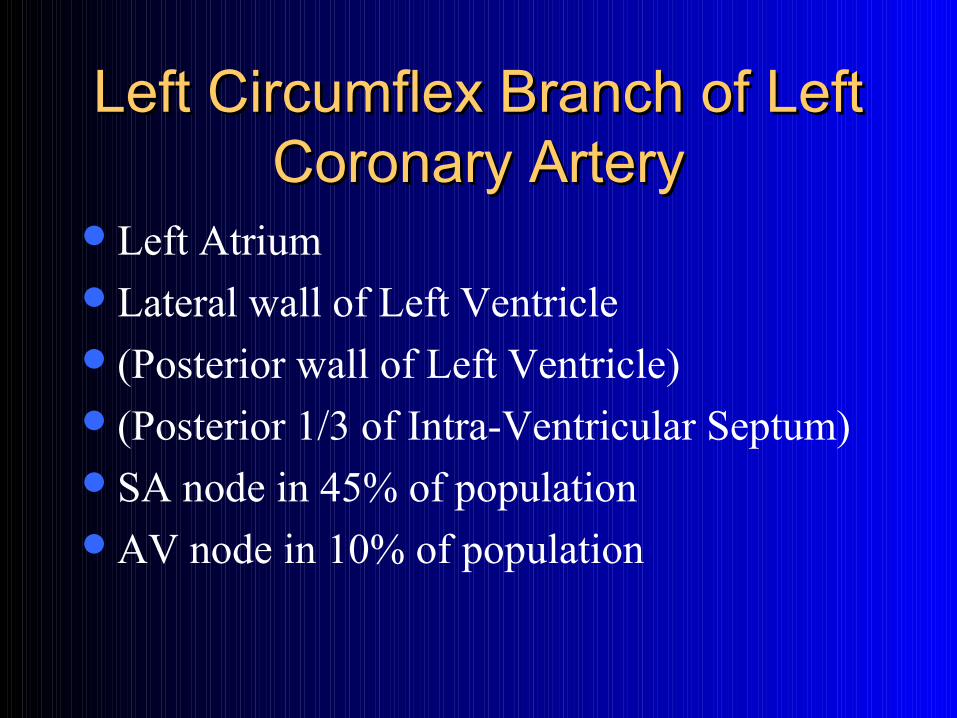
Left Circumflex Branch of Left Left Circumflex Branch of Left Coronary ArteryCoronary Artery
Left AtriumLateral wall of Left Ventricle(Posterior wall of Left Ventricle)(Posterior 1/3 of Intra-Ventricular Septum)SA node in 45% of populationAV node in 10% of population
Coronary CirculationCoronary Circulation
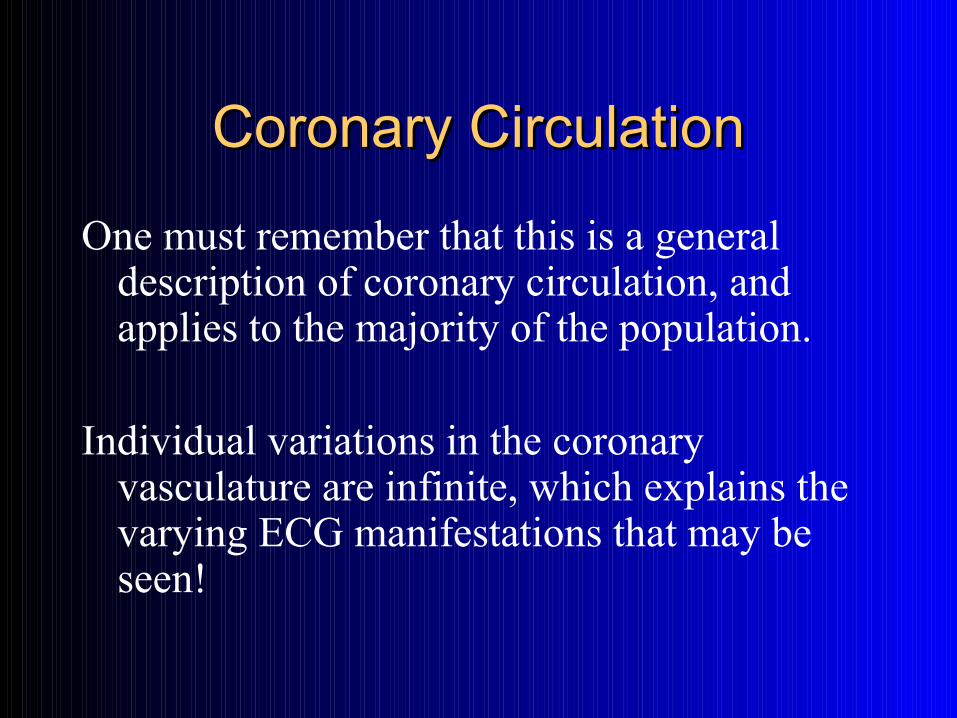
One must remember that this is a general description of coronary circulation, and applies to the majority of the population.
Individual variations in the coronary vasculature are infinite, which explains the varying ECG manifestations that may be seen!
ECG ManifestationsECG Manifestations
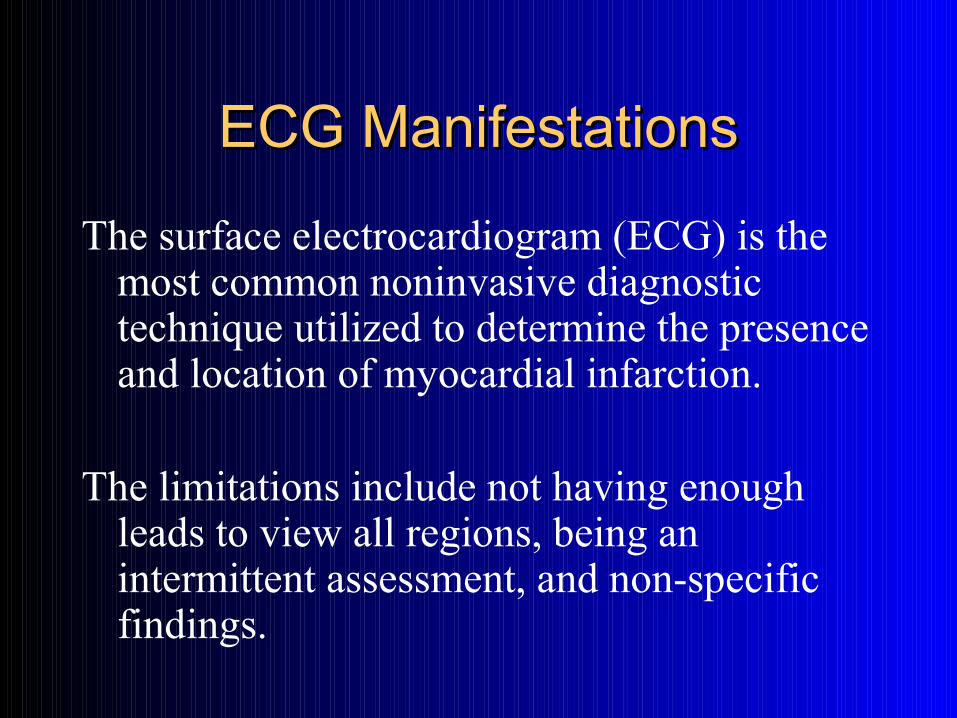
The surface electrocardiogram (ECG) is the most common noninvasive diagnostic technique utilized to determine the presence and location of myocardial infarction.
The limitations include not having enough leads to view all regions, being an intermittent assessment, and non-specific findings.
The ECG as a Diagnostic ToolThe ECG as a Diagnostic Tool
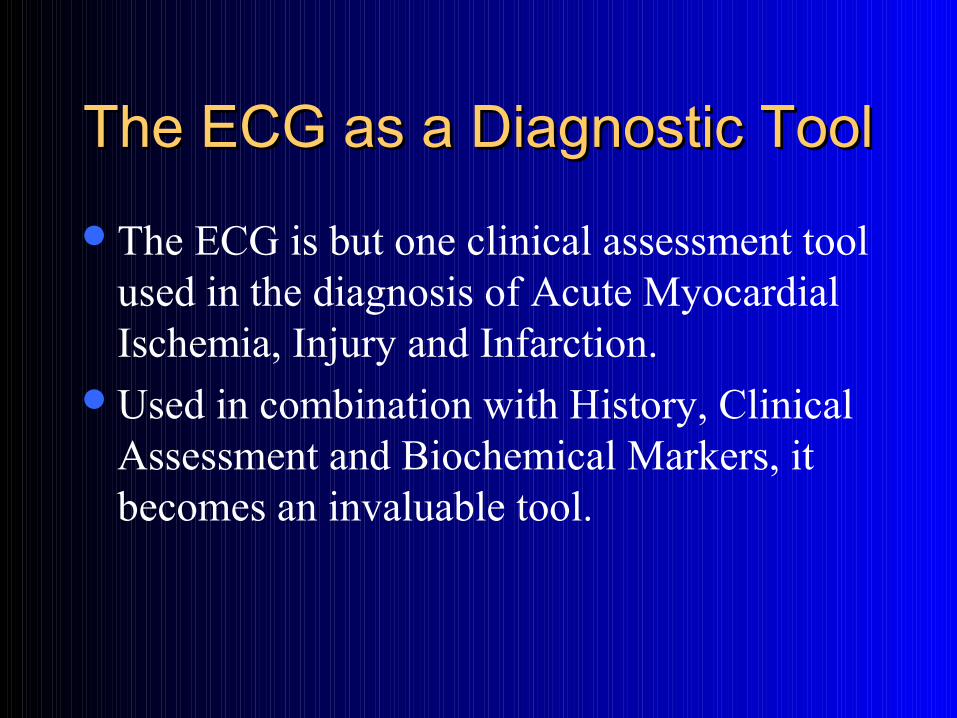
The ECG is but one clinical assessment tool used in the diagnosis of Acute Myocardial Ischemia, Injury and Infarction.
Used in combination with History, Clinical Assessment and Biochemical Markers, it becomes an invaluable tool.
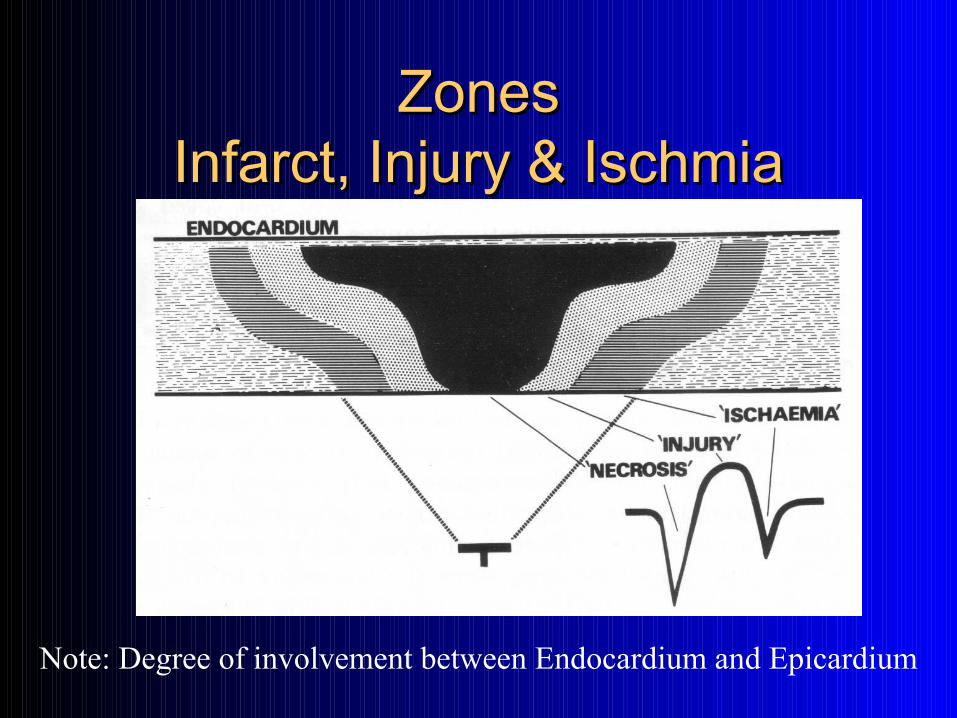
ZonesZonesInfarct, Injury & IschmiaInfarct, Injury & Ischmia
Note: Degree of involvement between Endocardium and Epicardium
Continuous ST-Segment Continuous ST-Segment Monitoring: Monitoring:
Protocol for PracticeProtocol for Practice
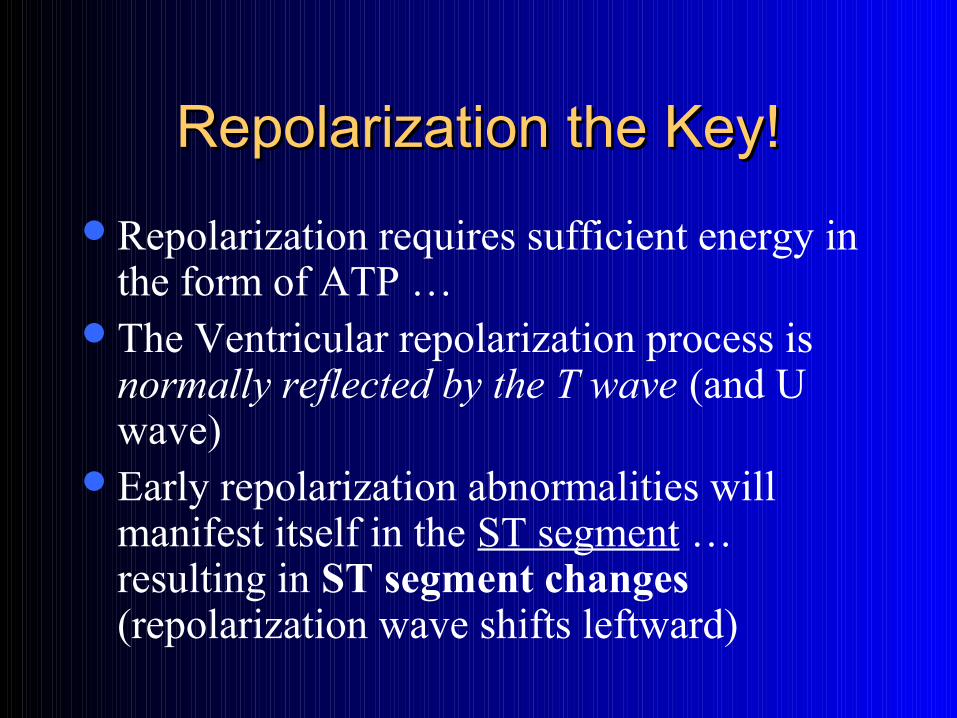
Repolarization the Key!Repolarization the Key!
Repolarization requires sufficient energy in the form of ATP …
The Ventricular repolarization process is normally reflected by the T wave (and U wave)
Early repolarization abnormalities will manifest itself in the ST segment … resulting in ST segment changes (repolarization wave shifts leftward)
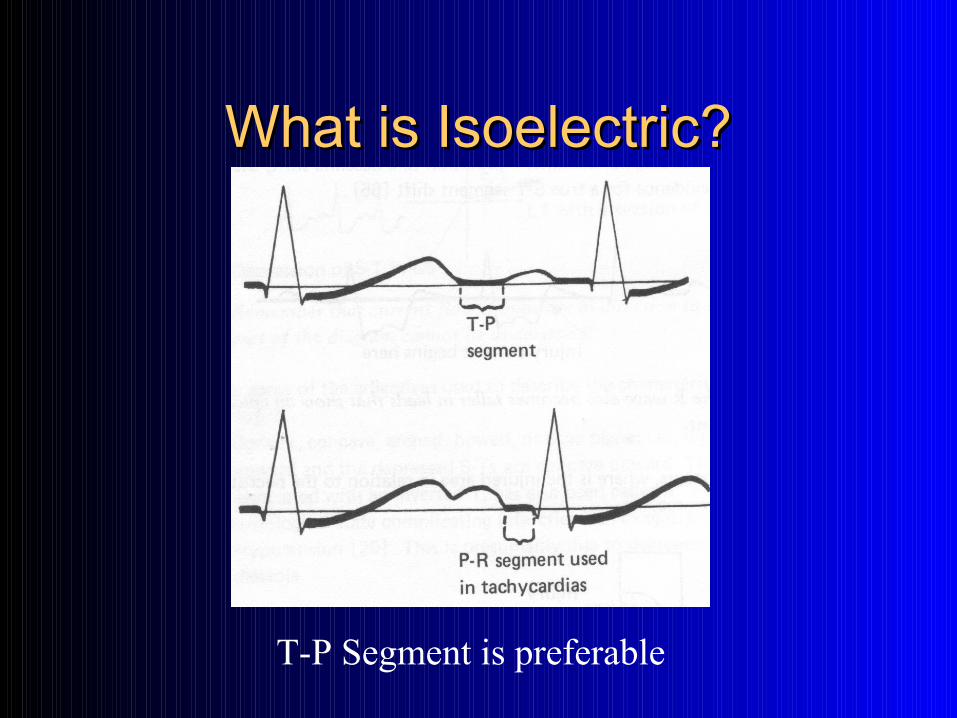
What is Isoelectric?What is Isoelectric?
T-P Segment is preferable
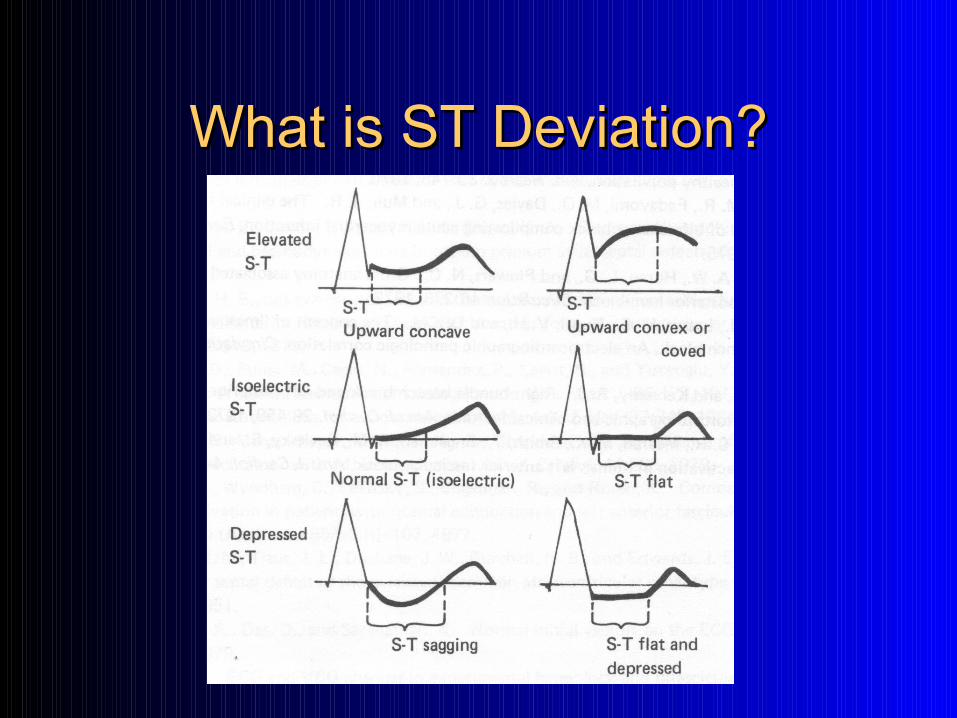
What is ST Deviation?What is ST Deviation?
ST Segment MonitoringST Segment Monitoring
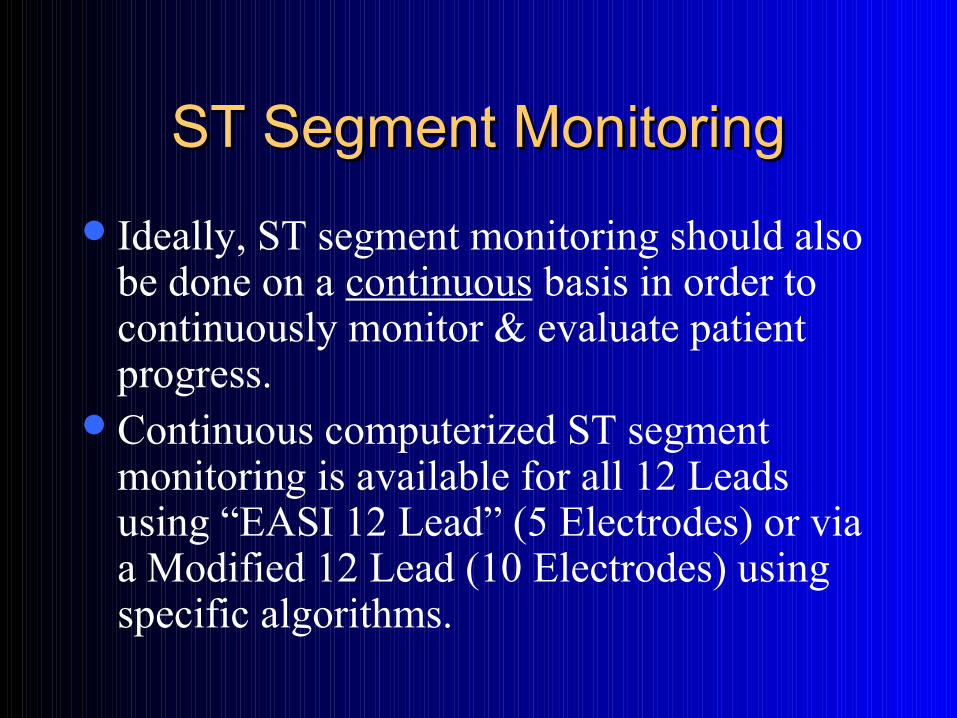
Ideally, ST segment monitoring should also be done on a continuous basis in order to continuously monitor & evaluate patient progress.
Continuous computerized ST segment monitoring is available for all 12 Leads using “EASI 12 Lead” (5 Electrodes) or via a Modified 12 Lead (10 Electrodes) using specific algorithms.
ST Segment MonitoringST Segment Monitoring
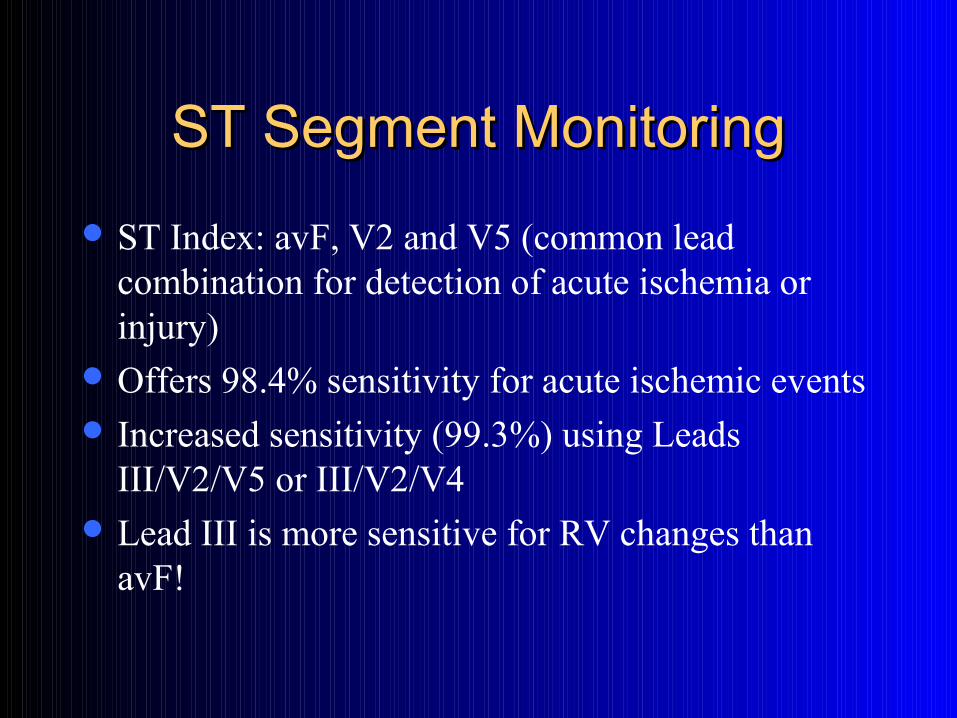
ST Index: avF, V2 and V5 (common lead combination for detection of acute ischemia or injury)
Offers 98.4% sensitivity for acute ischemic events Increased sensitivity (99.3%) using Leads
III/V2/V5 or III/V2/V4 Lead III is more sensitive for RV changes than
avF!
ST Segment MonitoringST Segment Monitoring
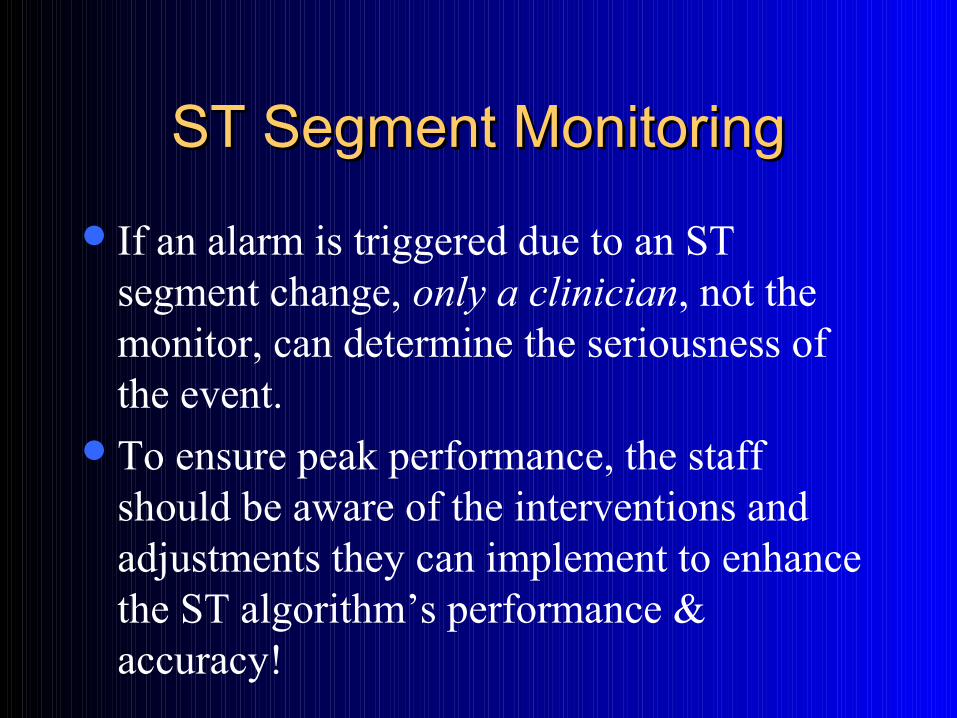
If an alarm is triggered due to an ST segment change, only a clinician, not the monitor, can determine the seriousness of the event.
To ensure peak performance, the staff should be aware of the interventions and adjustments they can implement to enhance the ST algorithm’s performance & accuracy!
CAUTION …CAUTION …ECG Settings!ECG Settings!

Sometimes it Hard to Tell Sometimes it Hard to Tell What’s What … They Look What’s What … They Look
Similar!Similar!
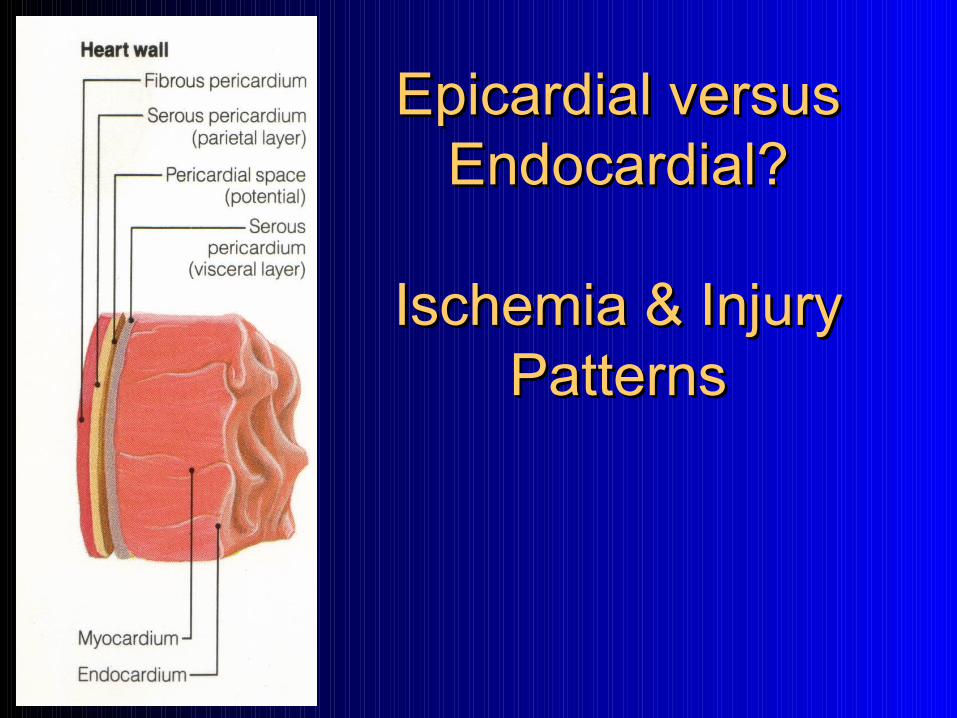
Epicardial versus Epicardial versus Endocardial?Endocardial?
Ischemia & Injury Ischemia & Injury PatternsPatterns
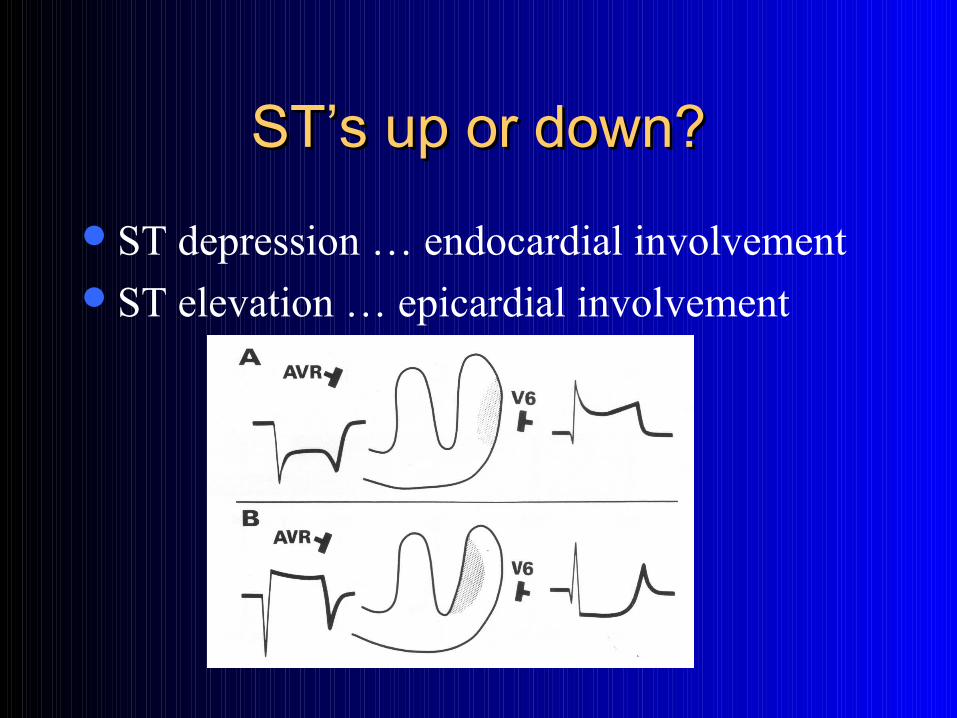
ST’s up or down?ST’s up or down?
ST depression … endocardial involvementST elevation … epicardial involvement
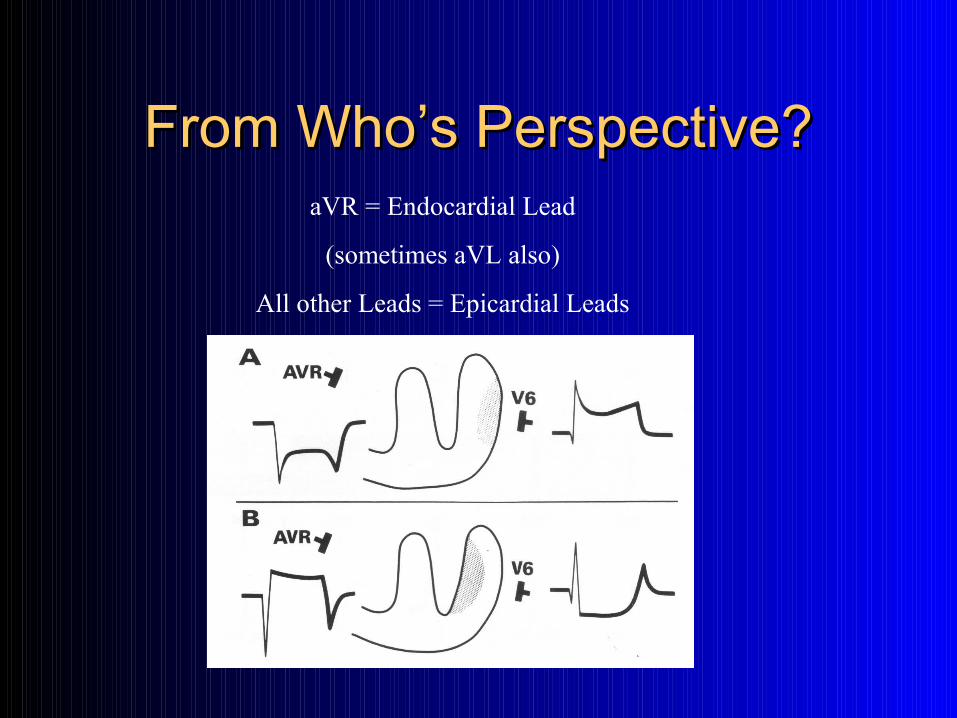
From Who’s Perspective?From Who’s Perspective?aVR = Endocardial Lead
(sometimes aVL also)
All other Leads = Epicardial Leads
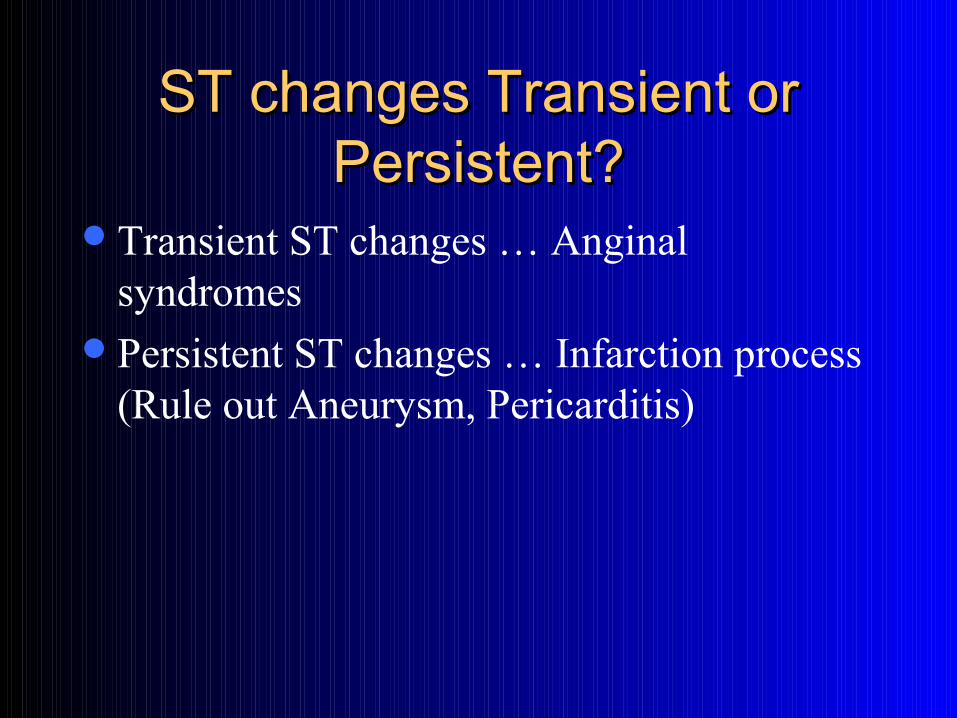
ST changes Transient or ST changes Transient or Persistent?Persistent?
Transient ST changes … Anginal syndromes
Persistent ST changes … Infarction process (Rule out Aneurysm, Pericarditis)

Regional or Global Regional or Global ST Changes?ST Changes?
Isolated to a specific region (remember correlation to coronary arterial supply)
Widespread ST segment and/or T wave changes may be seen in such conditions as Pericarditis and Coronary Insufficiency.
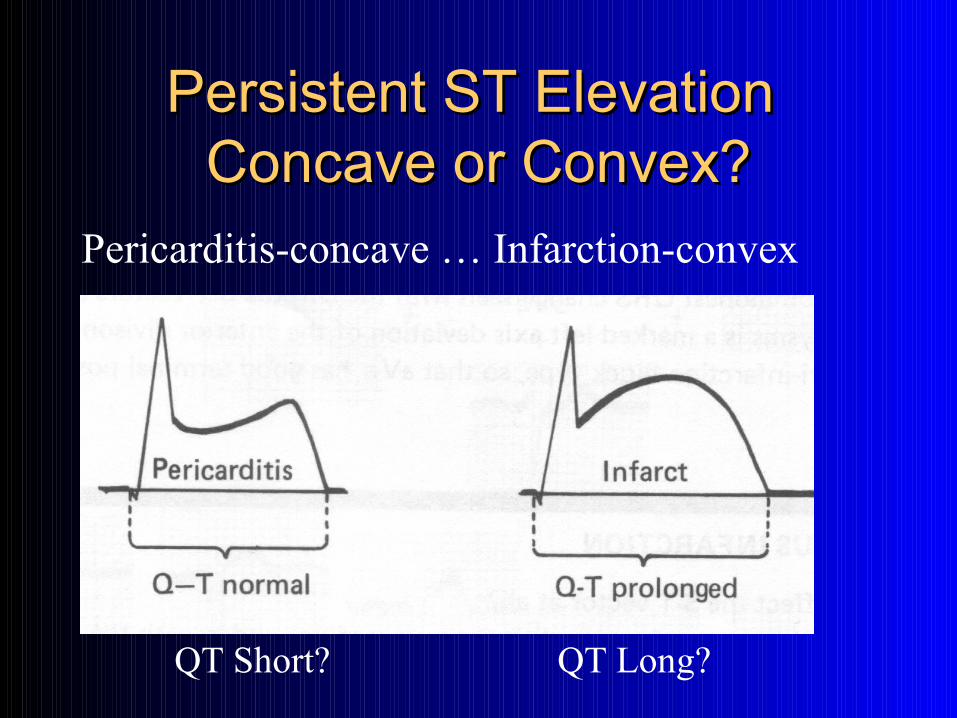
Persistent ST Elevation Persistent ST Elevation Concave or Convex?Concave or Convex?
Pericarditis-concave … Infarction-convex
QT Short? QT Long?
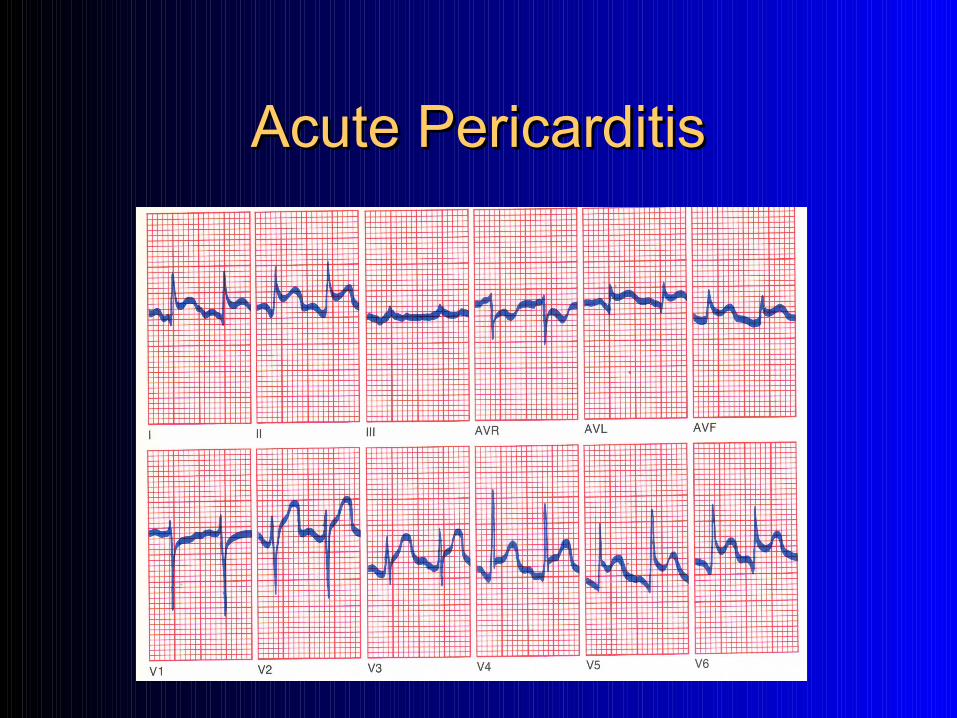
Acute PericarditisAcute Pericarditis

Indicative versus Reciprocal Indicative versus Reciprocal ST ChangesST Changes
Remember the cube concept … opposite walls can show the opposite changes. Remember also, associated leads (I/aVF, II/aVL, III/aVR) will
ST elevation in one wall will show ST depression in the opposite wall
If you can turn the ST “upside down” from one set of leads and match it to the ST in the opposing wall, it’s most likely reciprocal … rather than a separate process associated with a different coronary artery.
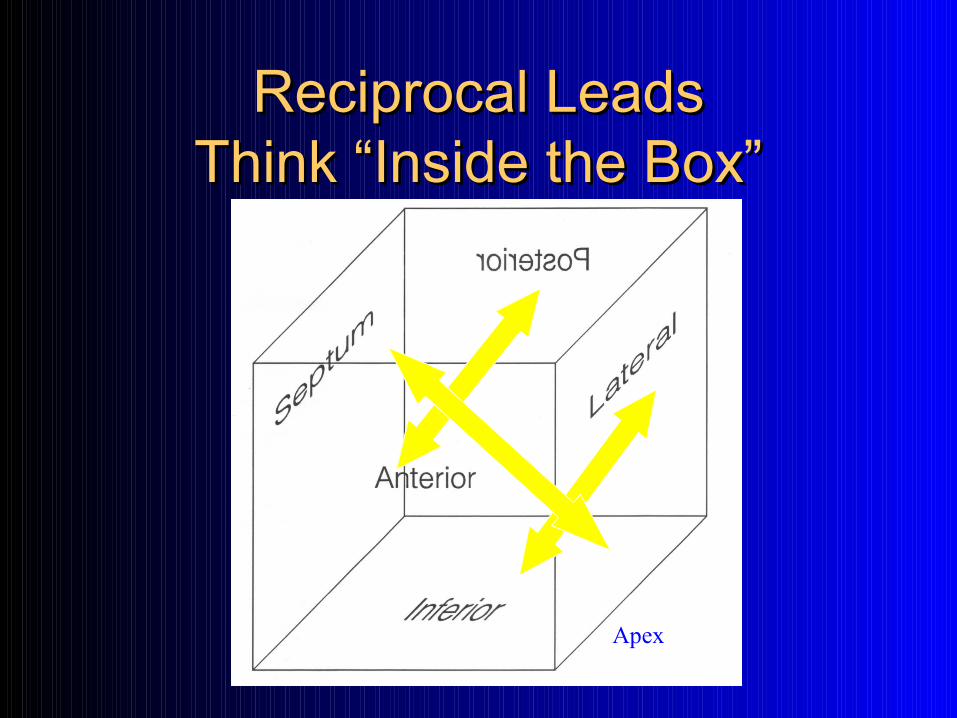
Reciprocal LeadsReciprocal LeadsThink “Inside the Box”Think “Inside the Box”
Apex
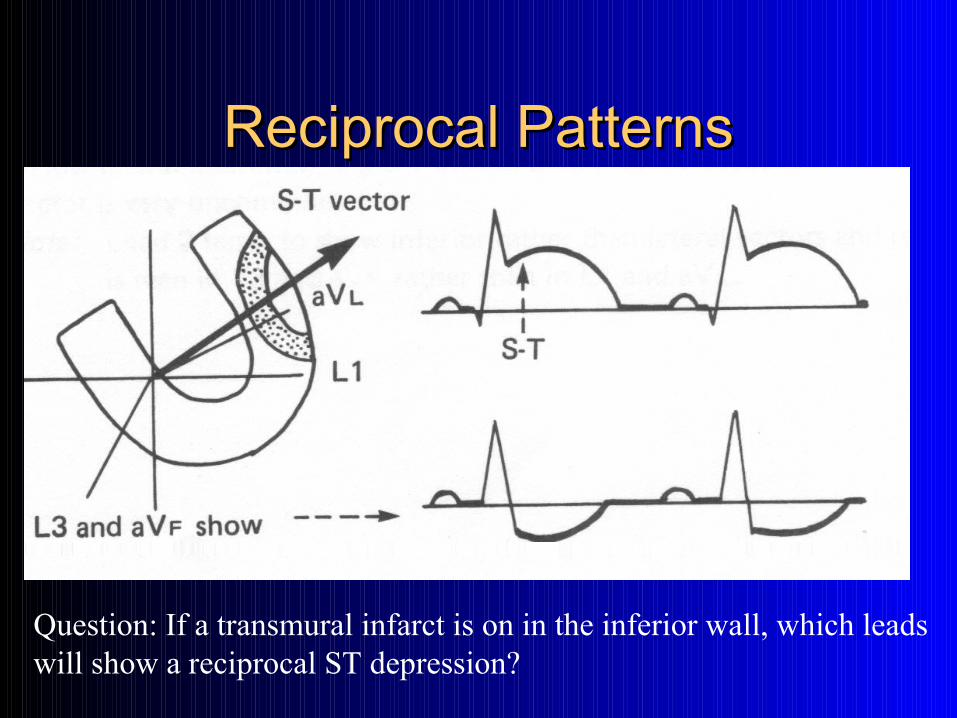
Reciprocal PatternsReciprocal Patterns
Question: If a transmural infarct is on in the inferior wall, which leads will show a reciprocal ST depression?
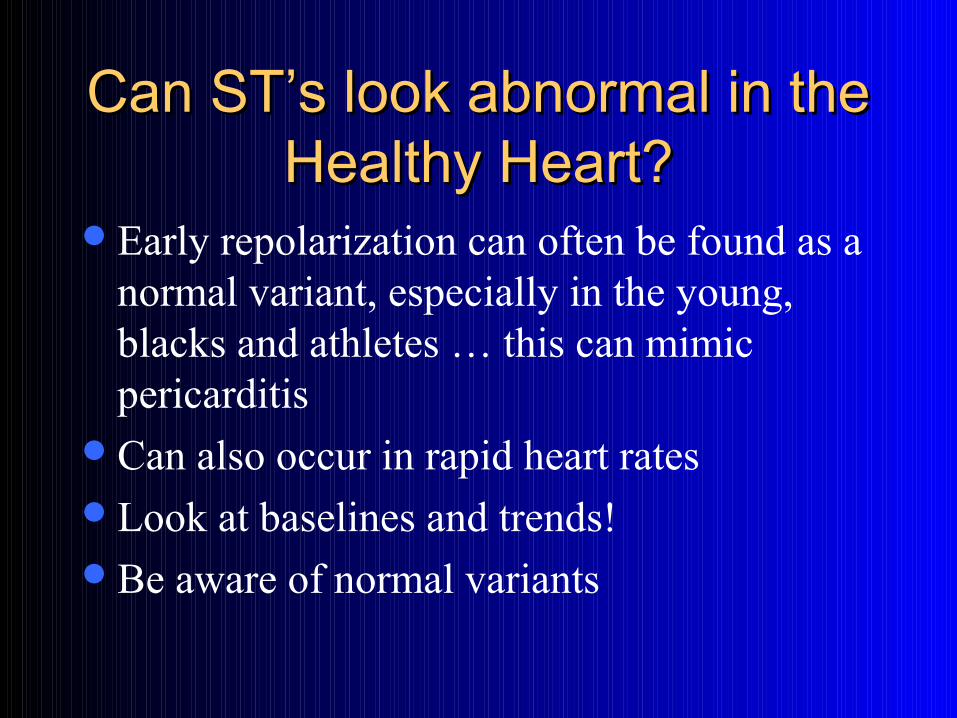
Can ST’s look abnormal in the Can ST’s look abnormal in the Healthy Heart?Healthy Heart?
Early repolarization can often be found as a normal variant, especially in the young, blacks and athletes … this can mimic pericarditis
Can also occur in rapid heart ratesLook at baselines and trends!Be aware of normal variants
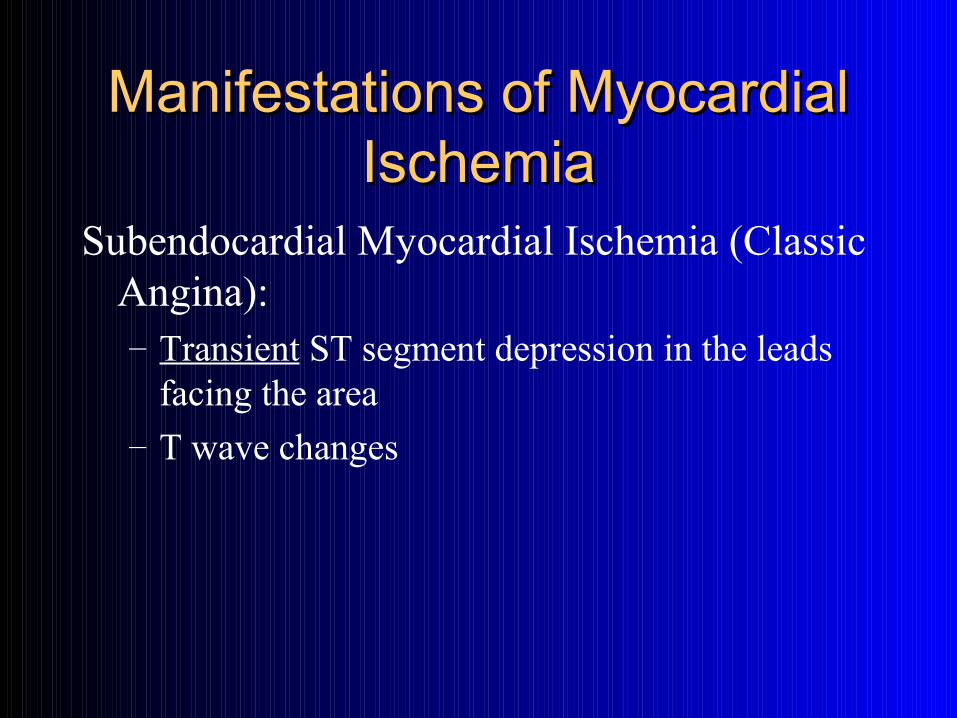
Manifestations of Myocardial Manifestations of Myocardial IschemiaIschemia
Subendocardial Myocardial Ischemia (Classic Angina):– Transient ST segment depression in the leads
facing the area– T wave changes
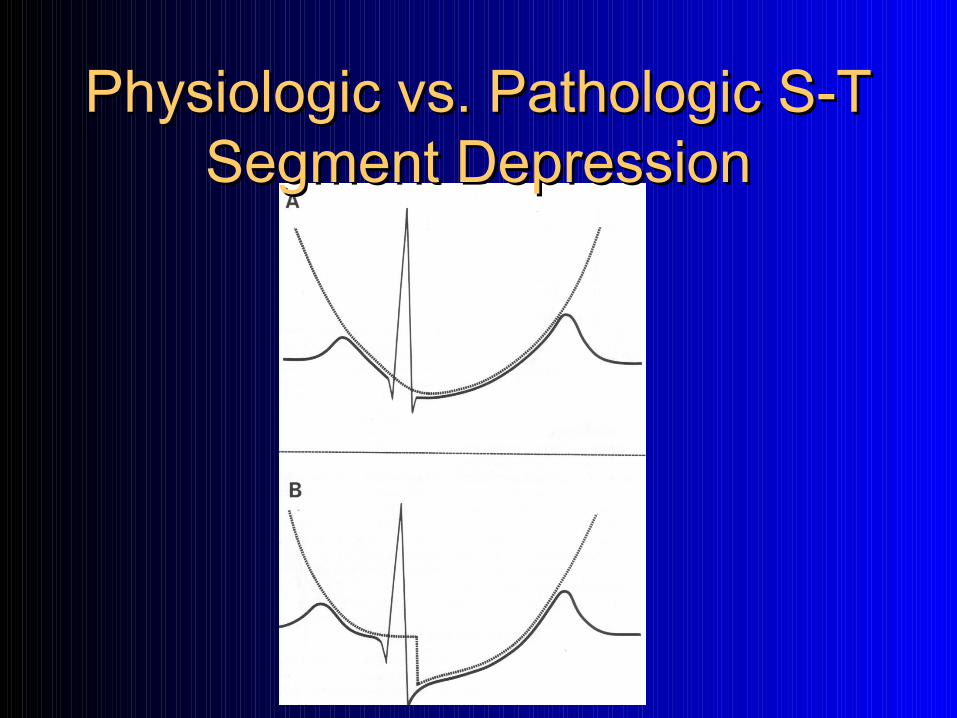
Physiologic vs. Pathologic S-T Physiologic vs. Pathologic S-T Segment DepressionSegment Depression
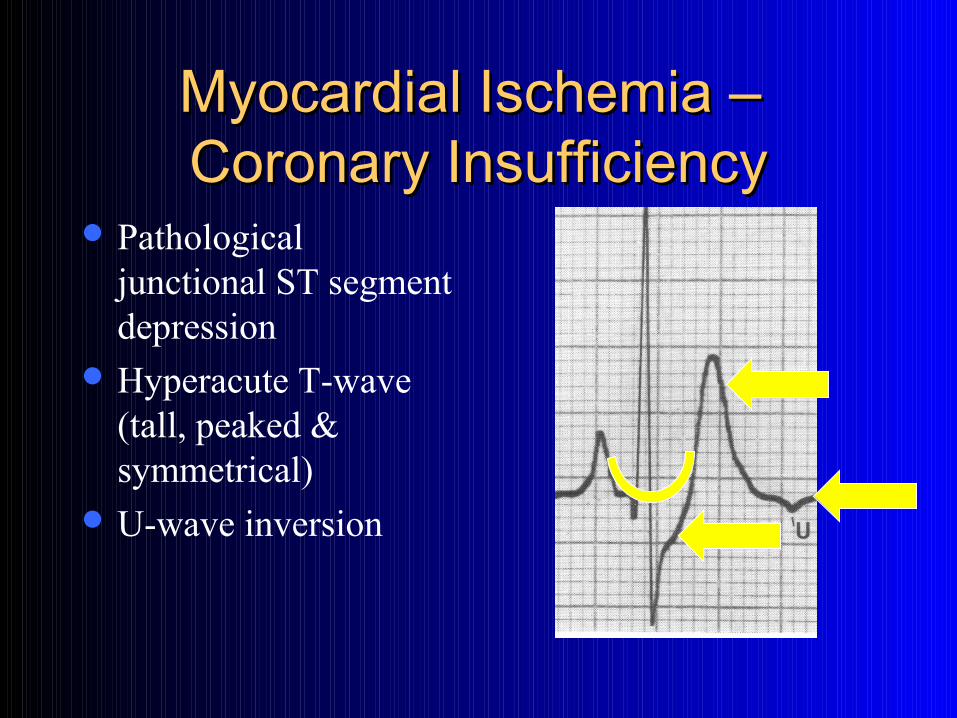
Myocardial Ischemia – Myocardial Ischemia – Coronary InsufficiencyCoronary Insufficiency
Pathological junctional ST segment depression
Hyperacute T-wave (tall, peaked & symmetrical)
U-wave inversion
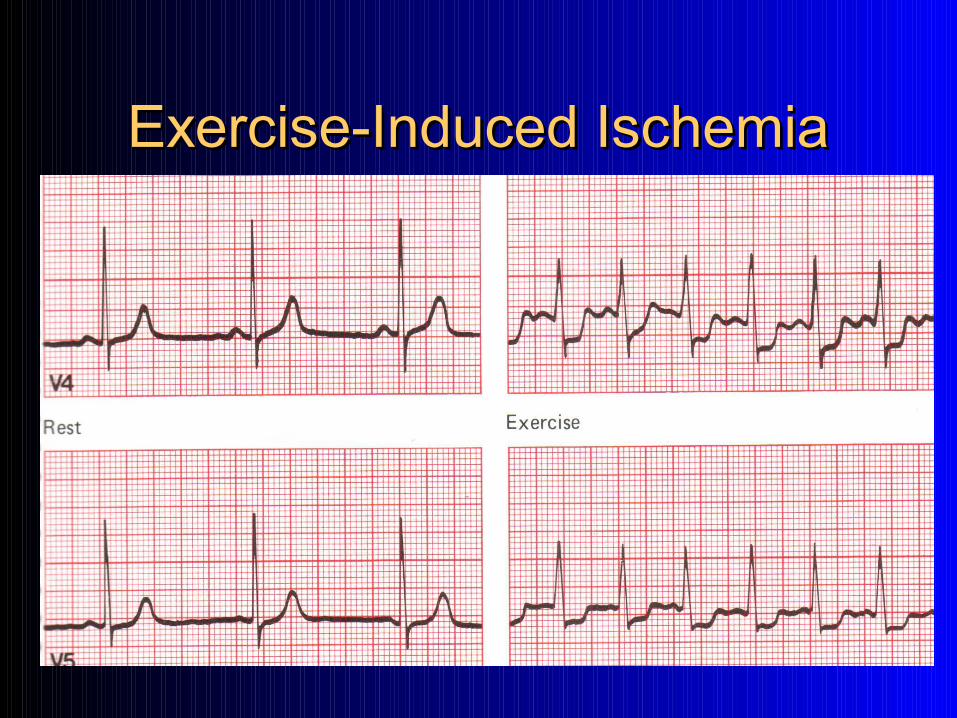
Exercise-Induced IschemiaExercise-Induced Ischemia
Manifestations of Myocardial Manifestations of Myocardial IschemiaIschemia
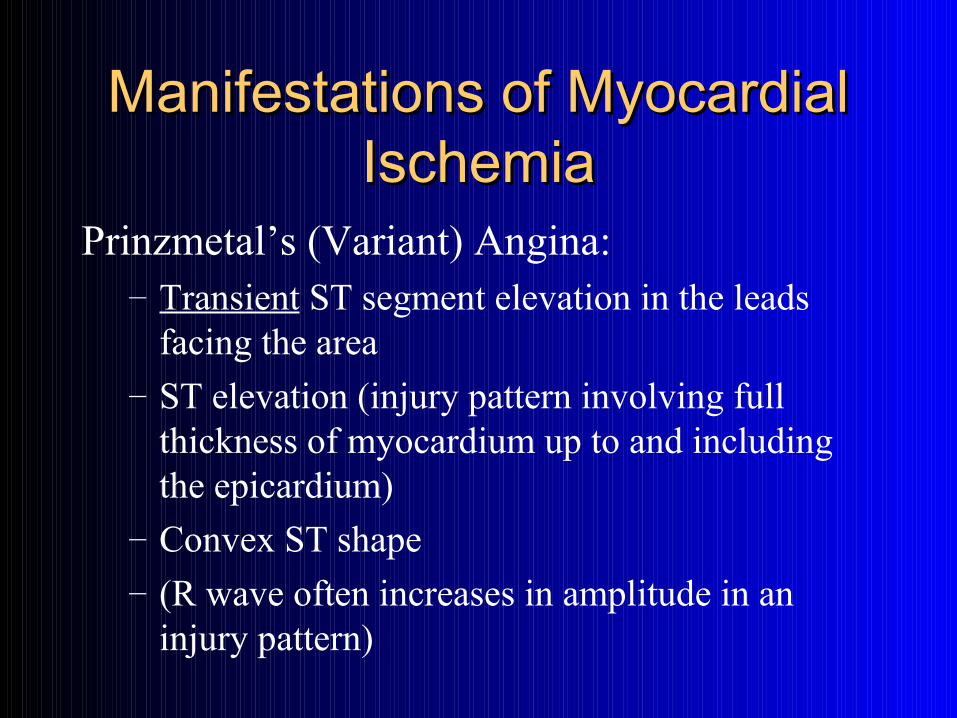
Prinzmetal’s (Variant) Angina:– Transient ST segment elevation in the leads
facing the area– ST elevation (injury pattern involving full
thickness of myocardium up to and including the epicardium)
– Convex ST shape– (R wave often increases in amplitude in an
injury pattern)
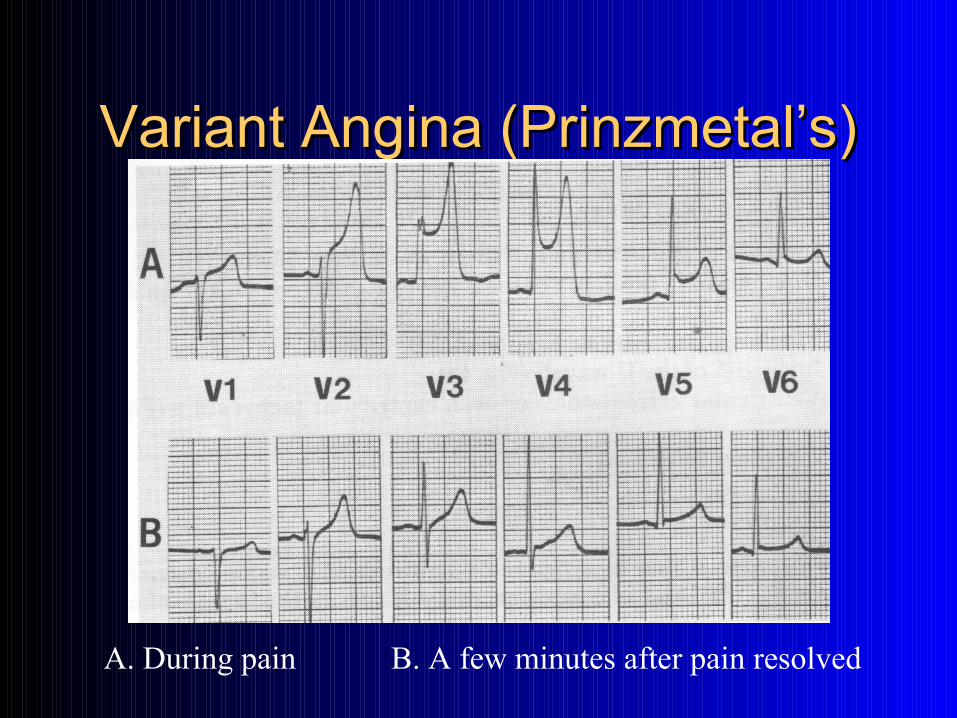
Variant Angina (Prinzmetal’s)Variant Angina (Prinzmetal’s)
A. During pain B. A few minutes after pain resolved
Infarction with or without Infarction with or without ST elevation?ST elevation?
STEMI … ST-Elevated (Acute) MINSTEMI …. Non-ST-Elevated (Acute) MI
IIdentifying the dentifying the “Non-“Non-TransmuralTransmural” or ” or
Non-ST-ElevatedNon-ST-ElevatedMMyocardial Infarctionyocardial Infarction
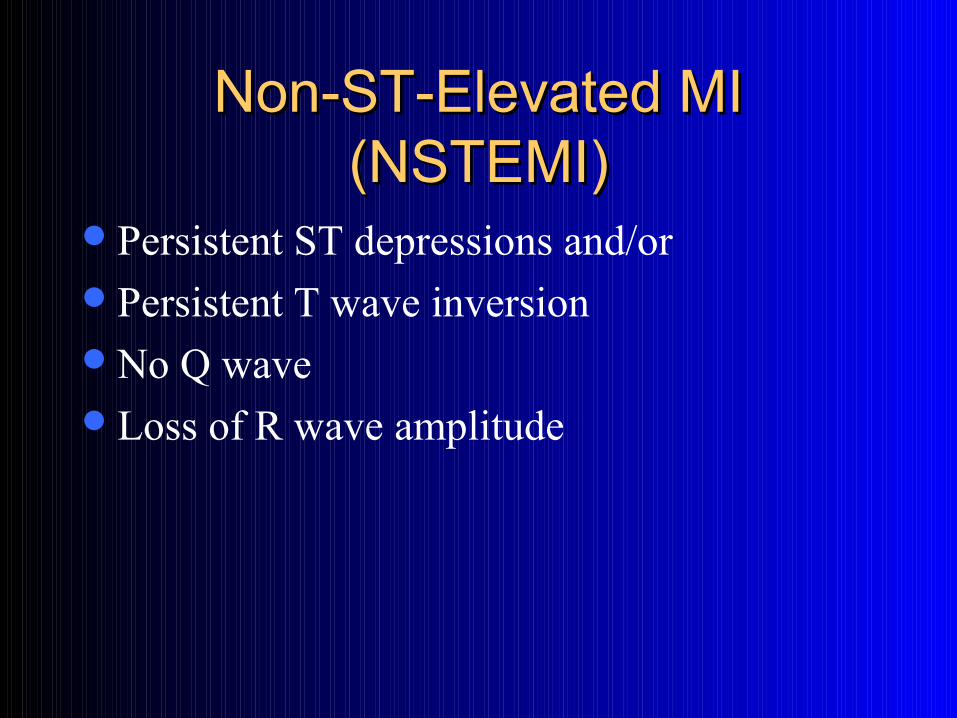
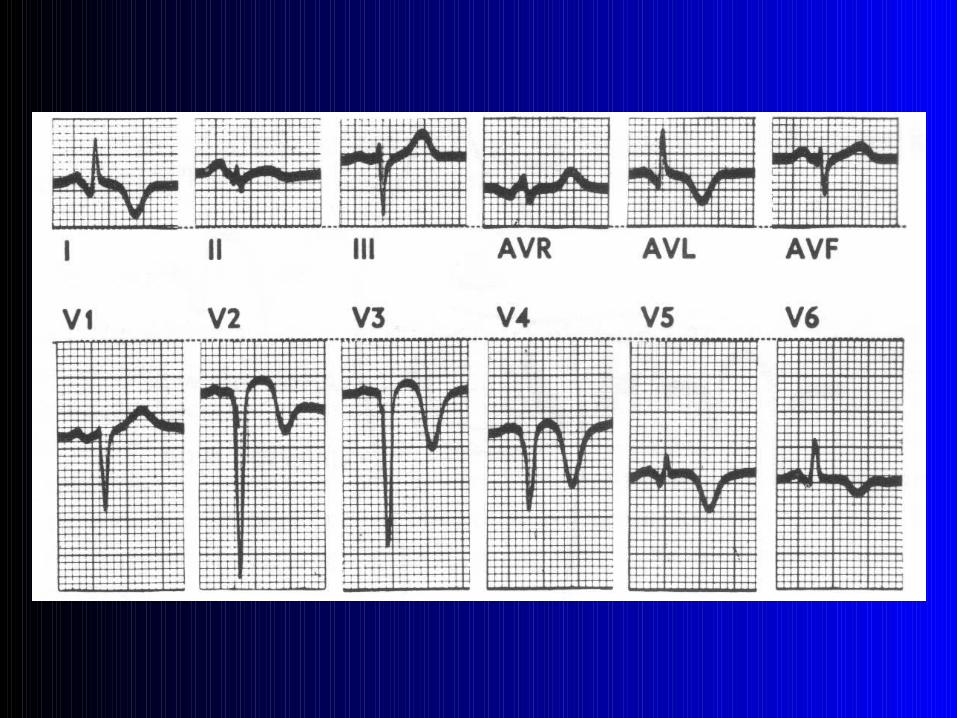
Non-ST-Elevated MI Non-ST-Elevated MI (NSTEMI)(NSTEMI)
Persistent ST depressions and/orPersistent T wave inversionNo Q waveLoss of R wave amplitude
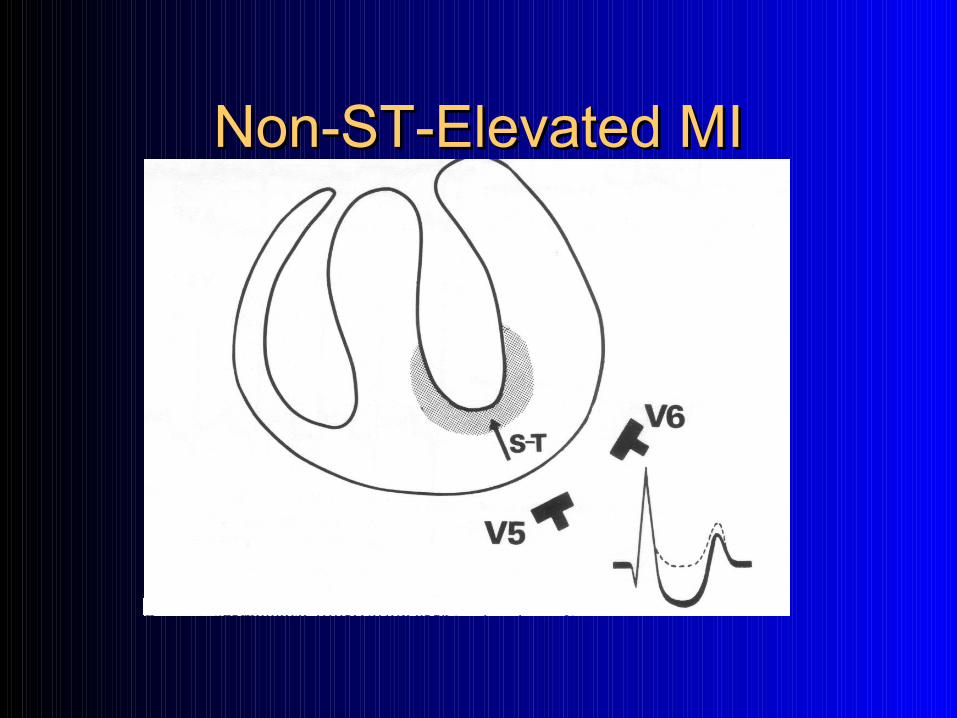
Non-ST-Elevated MINon-ST-Elevated MI
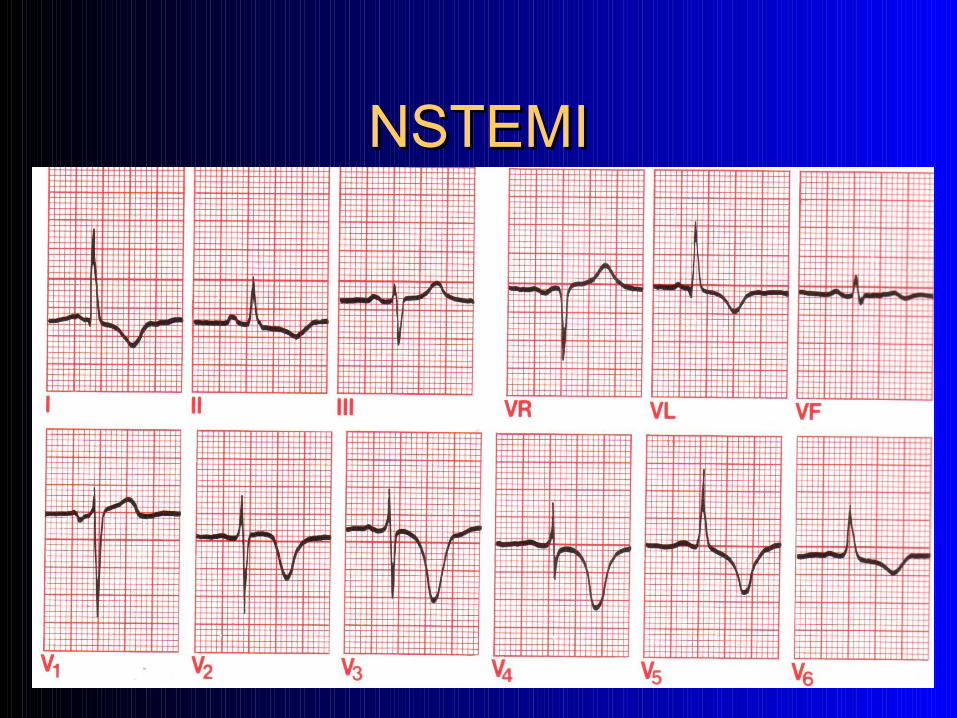
NSTEMINSTEMI
IIdentifying the dentifying the ““TransmuralTransmural” or ” or ST-ElevatedST-Elevated
Myocardial InfarctionMyocardial Infarction
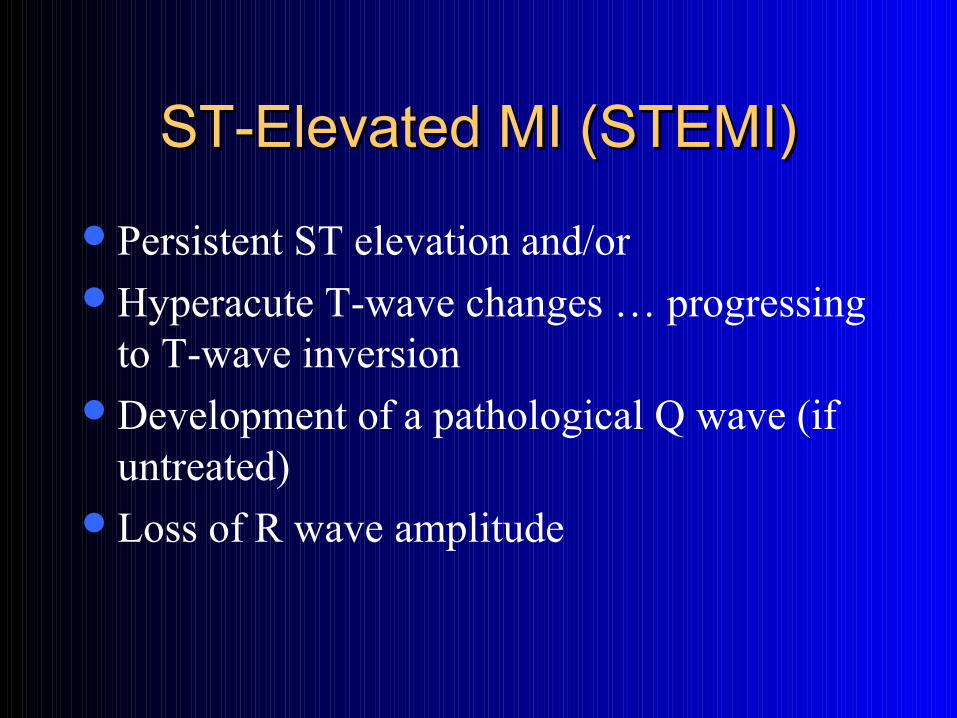
ST-Elevated MI (STEMI)ST-Elevated MI (STEMI)
Persistent ST elevation and/orHyperacute T-wave changes … progressing
to T-wave inversionDevelopment of a pathological Q wave (if
untreated)Loss of R wave amplitude
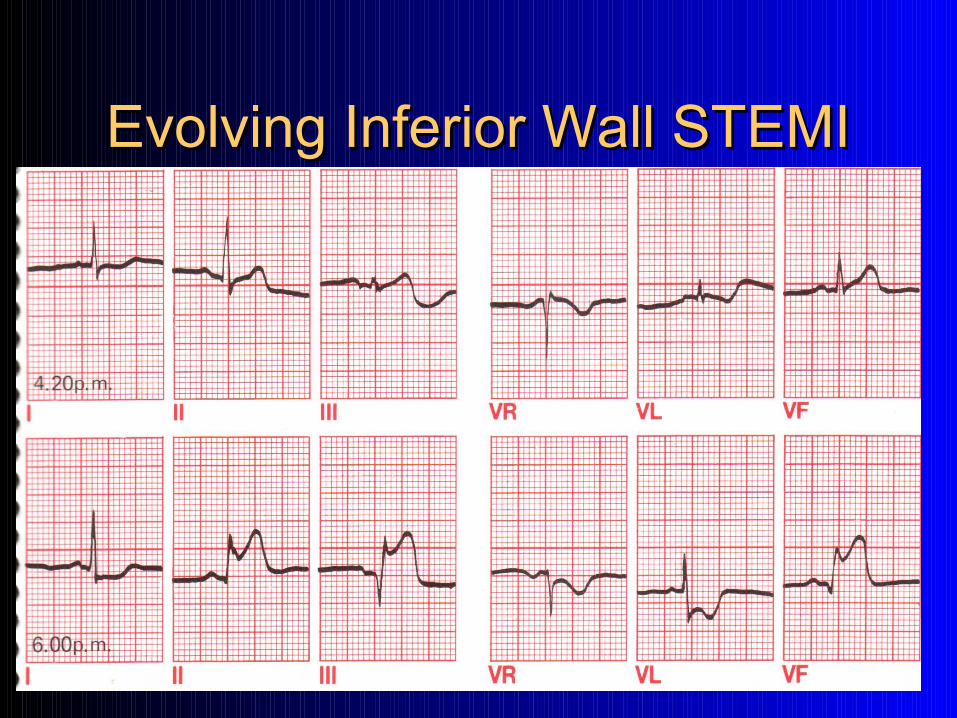
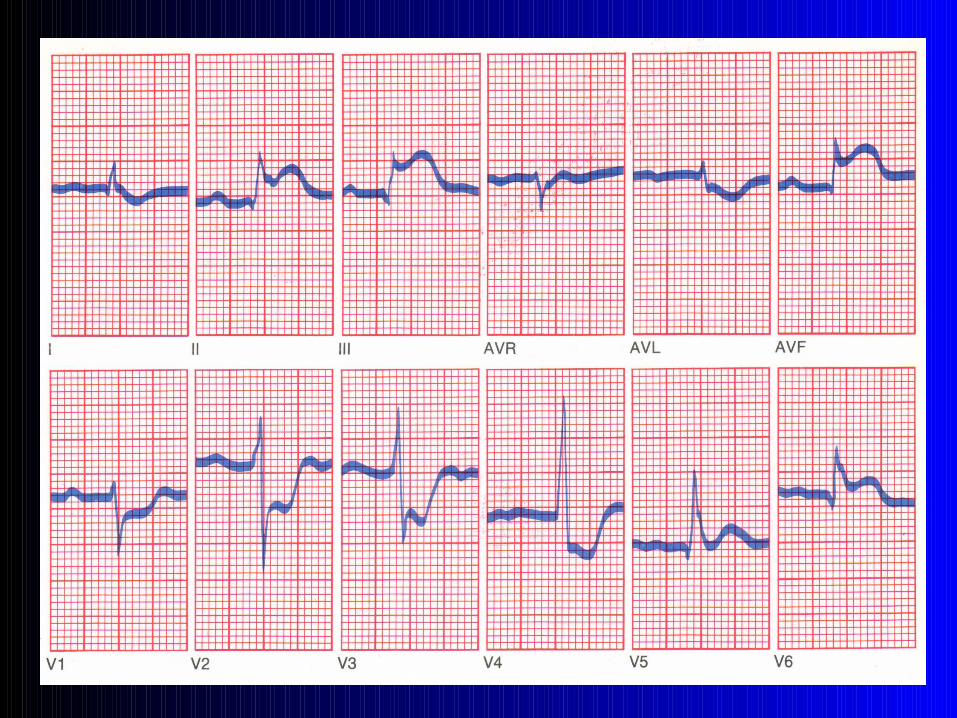
Evolving Inferior Wall STEMIEvolving Inferior Wall STEMI
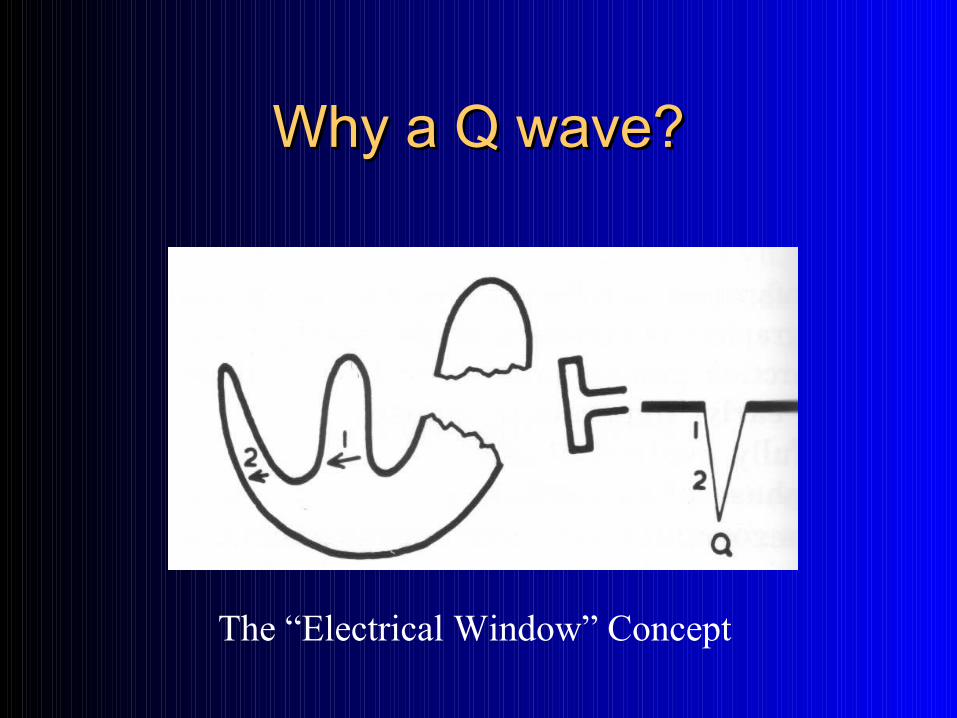
Why a Q wave?Why a Q wave?
The “Electrical Window” Concept
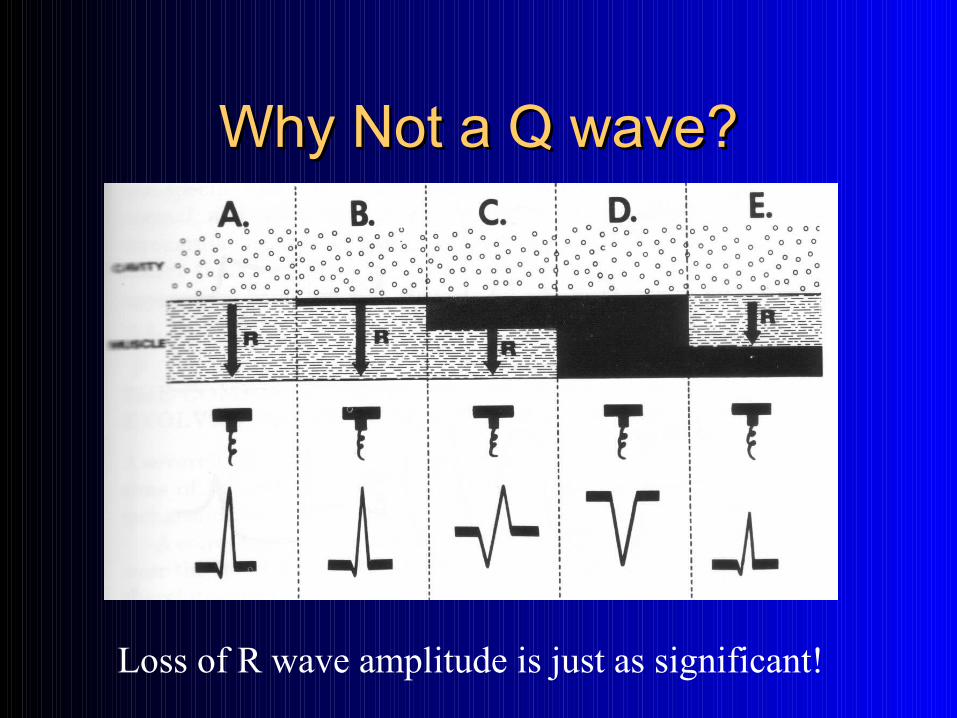
Why Not a Q wave?Why Not a Q wave?
Loss of R wave amplitude is just as significant!
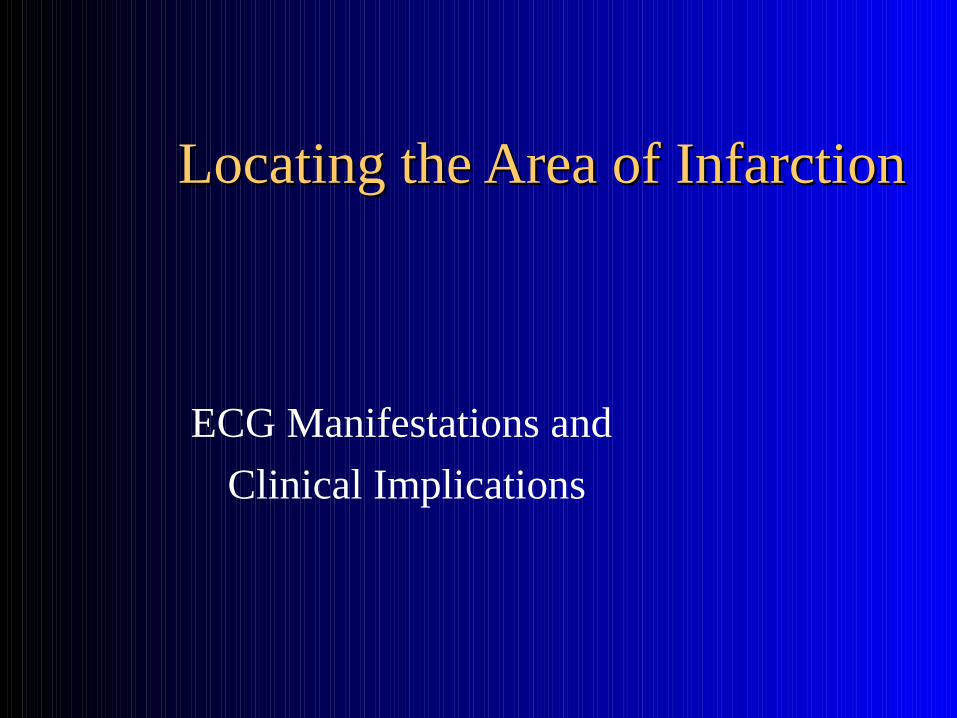
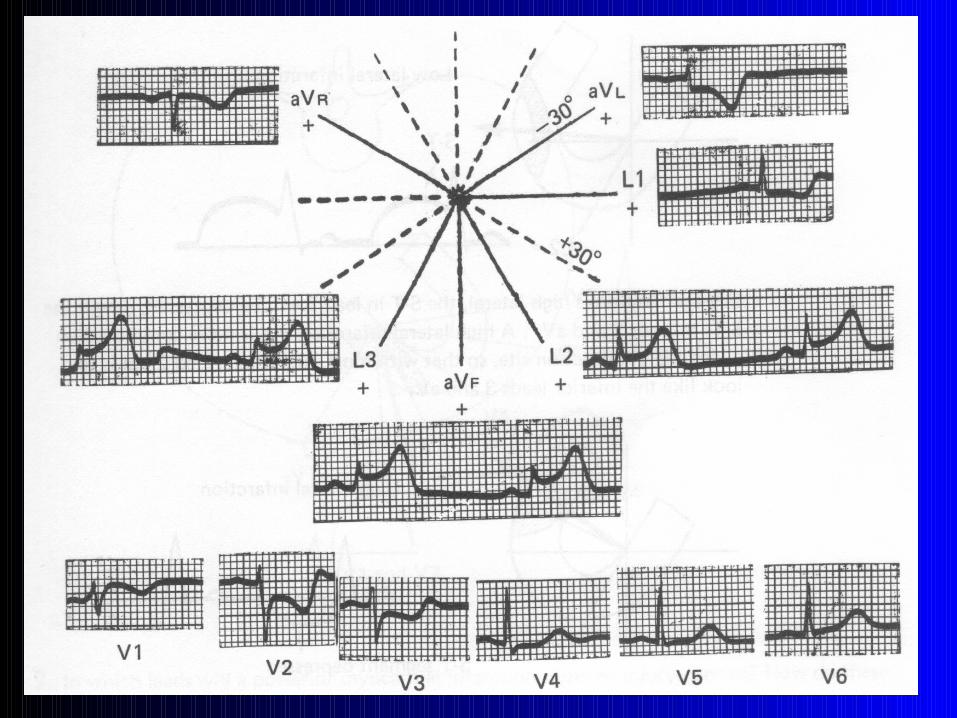
Locating the Area of InfarctionLocating the Area of Infarction
ECG Manifestations and
Clinical Implications

I Should Be Able to do This … I Should Be Able to do This … Right!?!Right!?!
ST SegmentsST Segments
ST Trending and Mapping – Expanding our Clinical
Monitoring for ACS
Acknowledgement: Philips Medical Systems – ST MapTM
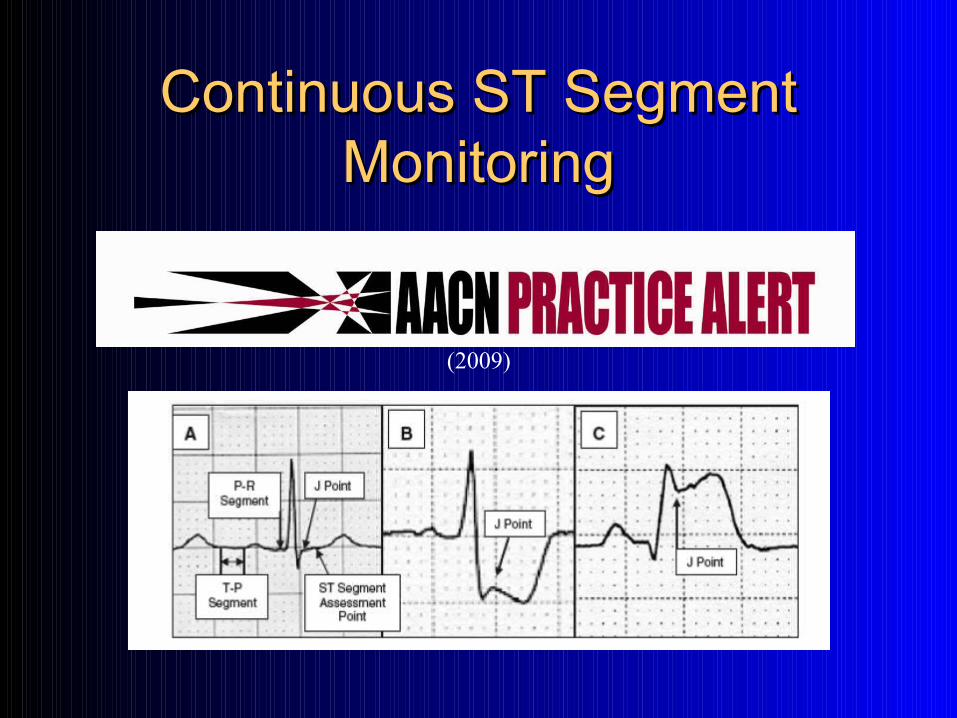
Continuous ST Segment Continuous ST Segment MonitoringMonitoring
(2009)
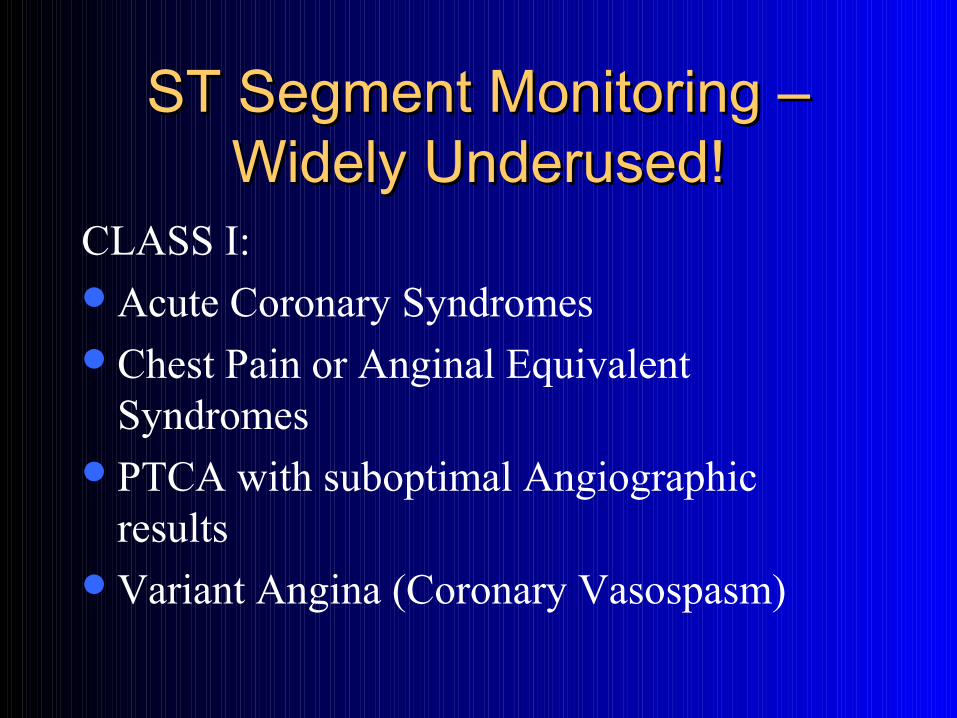
ST Segment Monitoring – ST Segment Monitoring – Widely Underused!Widely Underused!
CLASS I:Acute Coronary SyndromesChest Pain or Anginal Equivalent
SyndromesPTCA with suboptimal Angiographic
resultsVariant Angina (Coronary Vasospasm)
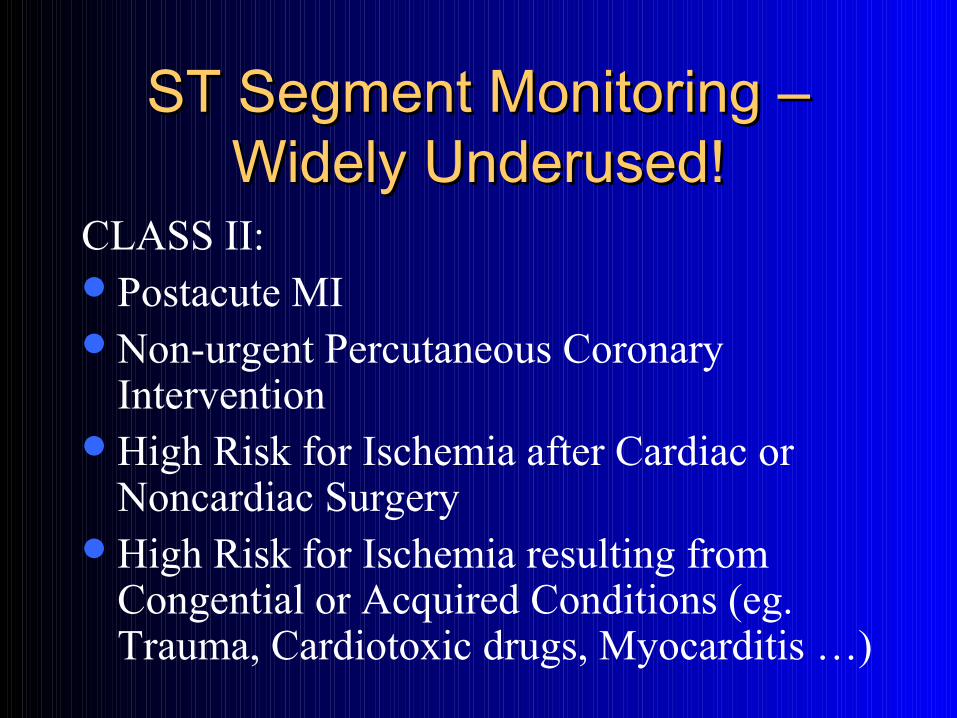
ST Segment Monitoring – ST Segment Monitoring – Widely Underused!Widely Underused!
CLASS II:Postacute MINon-urgent Percutaneous Coronary
InterventionHigh Risk for Ischemia after Cardiac or
Noncardiac SurgeryHigh Risk for Ischemia resulting from
Congential or Acquired Conditions (eg. Trauma, Cardiotoxic drugs, Myocarditis …)
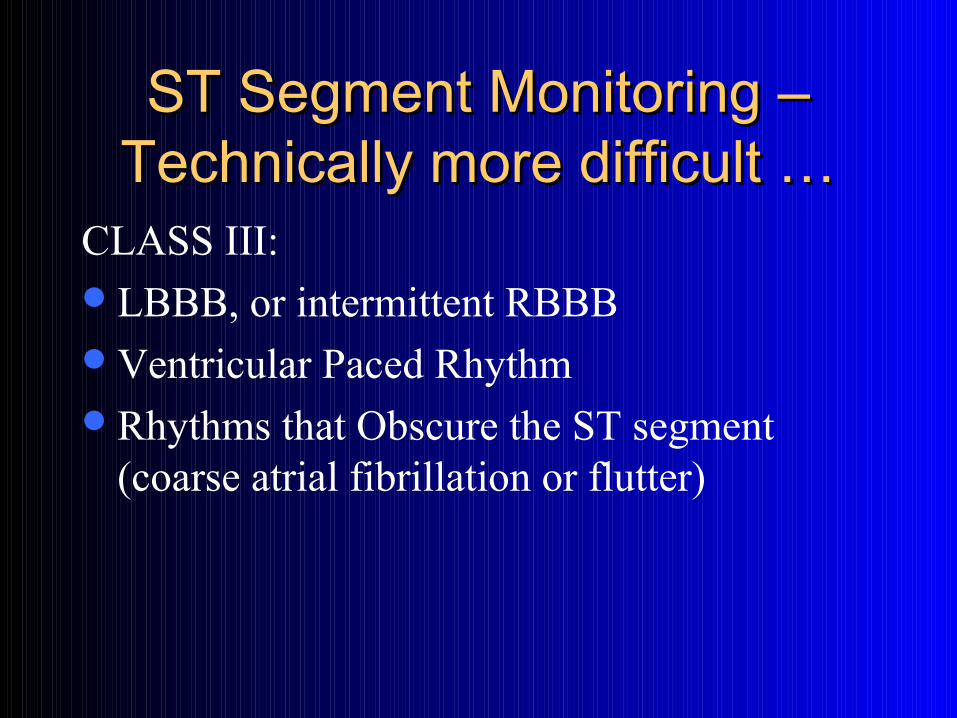
ST Segment Monitoring – ST Segment Monitoring – Technically more difficult …Technically more difficult …
CLASS III:LBBB, or intermittent RBBBVentricular Paced RhythmRhythms that Obscure the ST segment
(coarse atrial fibrillation or flutter)
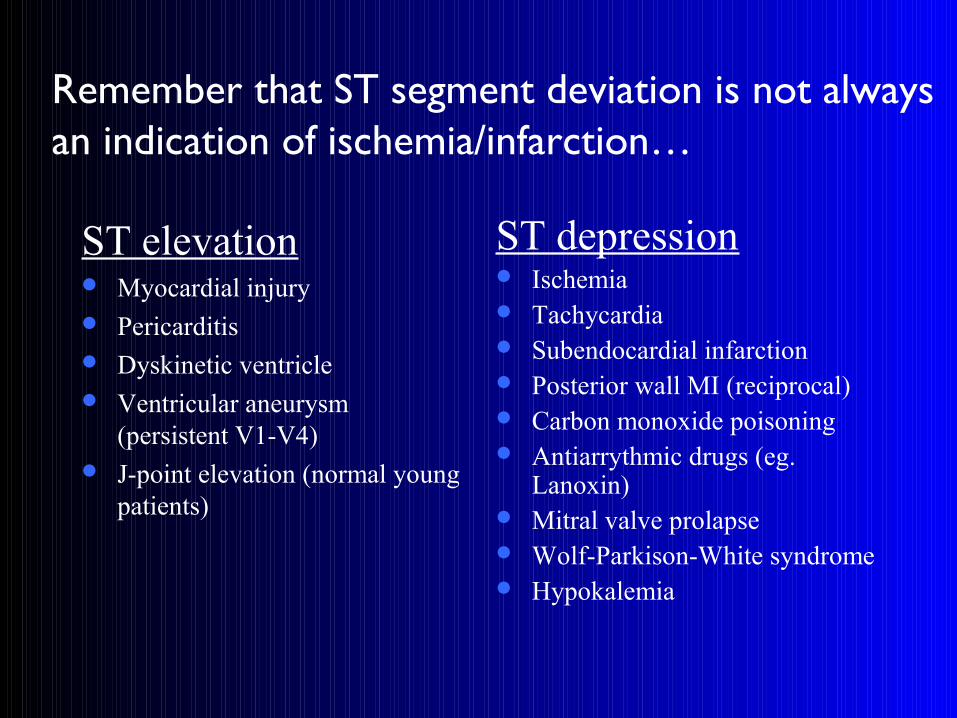
Remember that ST segment deviation is not always an indication of ischemia/infarction…
ST elevation Myocardial injury Pericarditis Dyskinetic ventricle Ventricular aneurysm
(persistent V1-V4) J-point elevation (normal young
patients)
ST depression Ischemia Tachycardia Subendocardial infarction Posterior wall MI (reciprocal) Carbon monoxide poisoning Antiarrythmic drugs (eg.
Lanoxin) Mitral valve prolapse Wolf-Parkison-White syndrome Hypokalemia
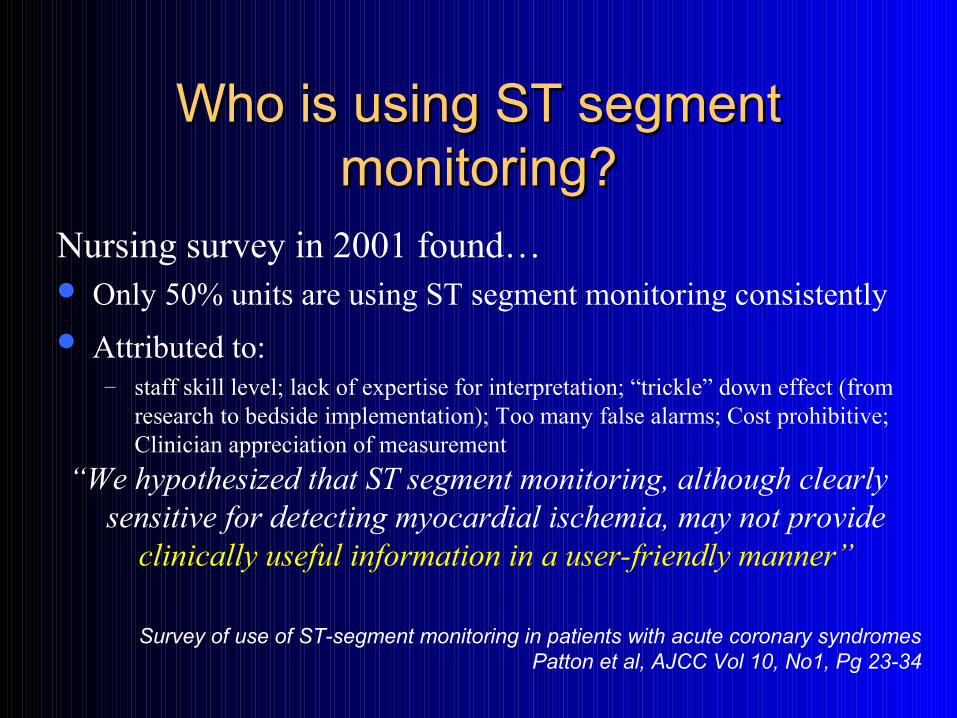
Who is using ST segment Who is using ST segment monitoring?monitoring?
Nursing survey in 2001 found… Only 50% units are using ST segment monitoring consistently
Attributed to: – staff skill level; lack of expertise for interpretation; “trickle” down effect (from
research to bedside implementation); Too many false alarms; Cost prohibitive; Clinician appreciation of measurement
“We hypothesized that ST segment monitoring, although clearly sensitive for detecting myocardial ischemia, may not provide
clinically useful information in a user-friendly manner”
Survey of use of ST-segment monitoring in patients with acute coronary syndromesPatton et al, AJCC Vol 10, No1, Pg 23-34
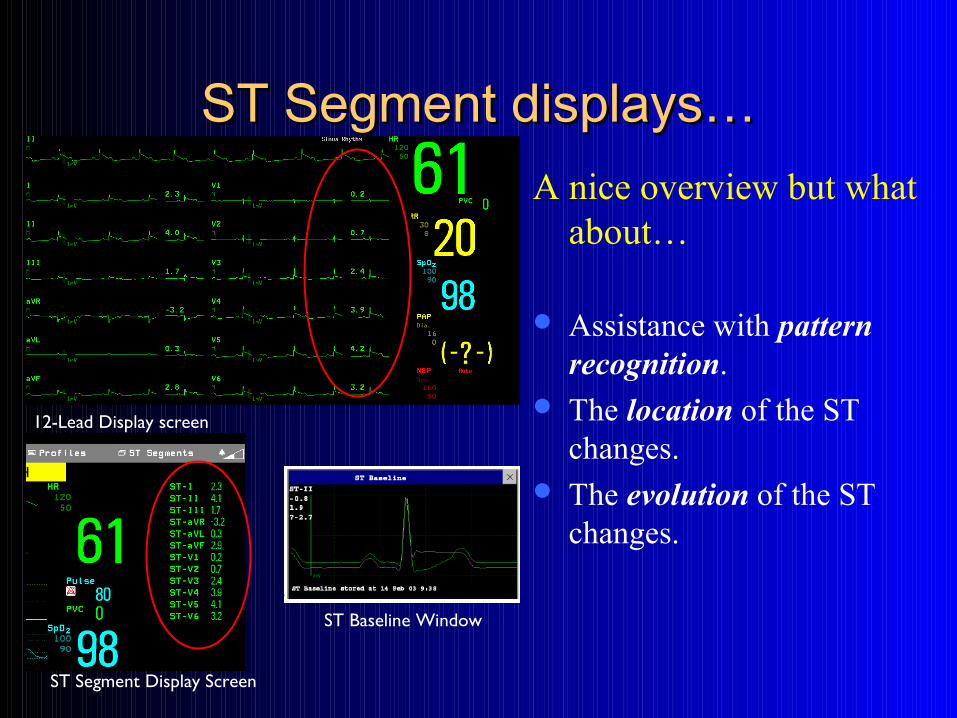
ST Segment displays…ST Segment displays…
A nice overview but what about…
Assistance with pattern recognition.
The location of the ST changes.
The evolution of the ST changes.
12-Lead Display screen
ST Baseline Window
ST Segment Display Screen


Cardiologists & Continuous Cardiologists & Continuous ST-Segment MonitoringST-Segment Monitoring
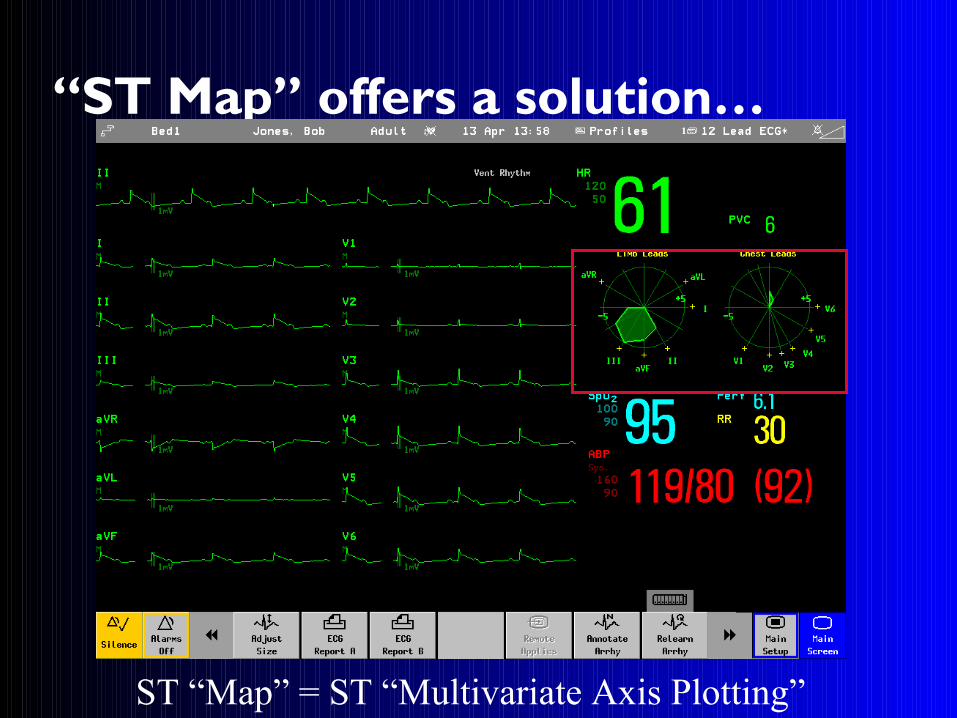
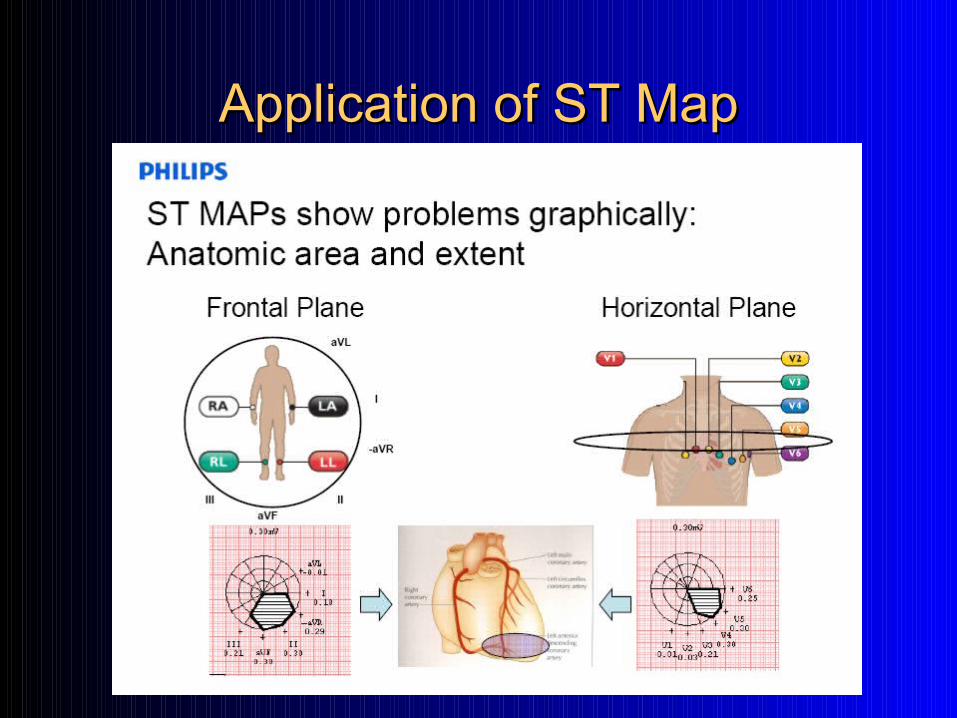
“ST Map” offers a solution…
ST “Map” = ST “Multivariate Axis Plotting”
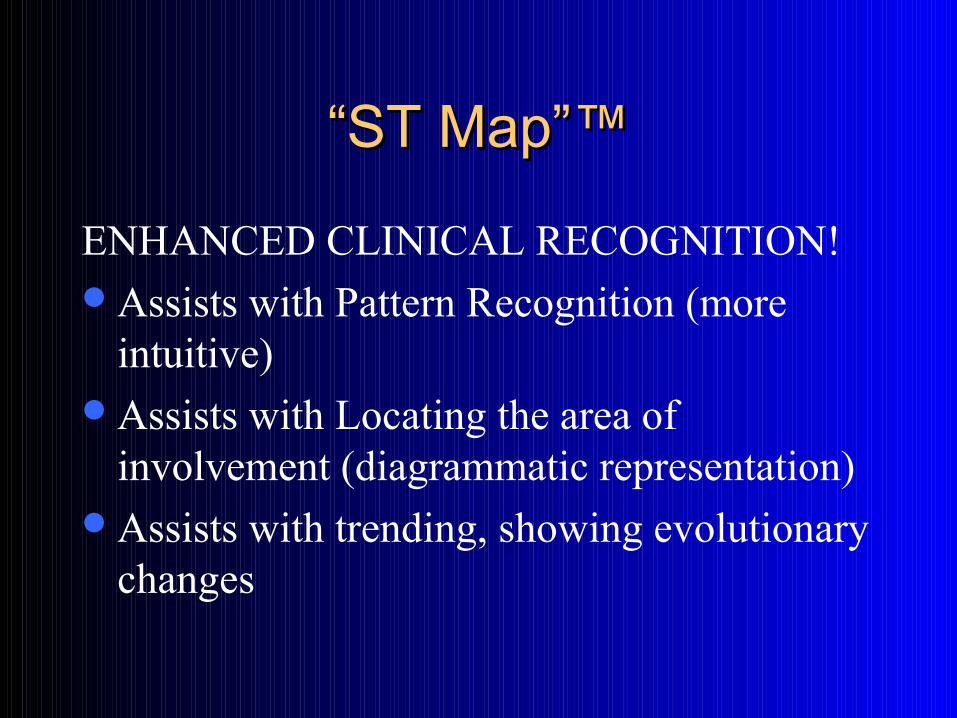
““ST Map”ST Map”™™
ENHANCED CLINICAL RECOGNITION!Assists with Pattern Recognition (more
intuitive)Assists with Locating the area of
involvement (diagrammatic representation)Assists with trending, showing evolutionary
changes
Eindhoven’s Triangle
Frontal Plane LeadsFrontal Plane Leads
Limb Leads
Augmented Limb Leads
Inferior
Superior
Lef
tRight
Horizontal Plane LeadsHorizontal Plane Leads
Precordial (Chest) Leads
Posterior
Anterior
Lef
t
Rig
ht
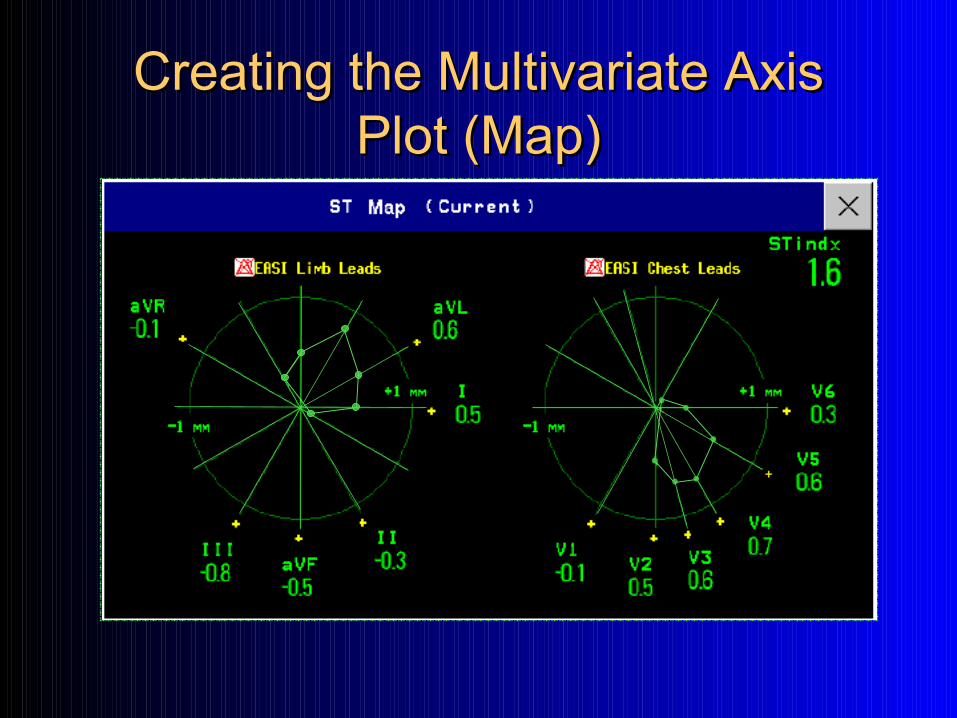
Creating the Multivariate Axis Creating the Multivariate Axis Plot (Map)Plot (Map)
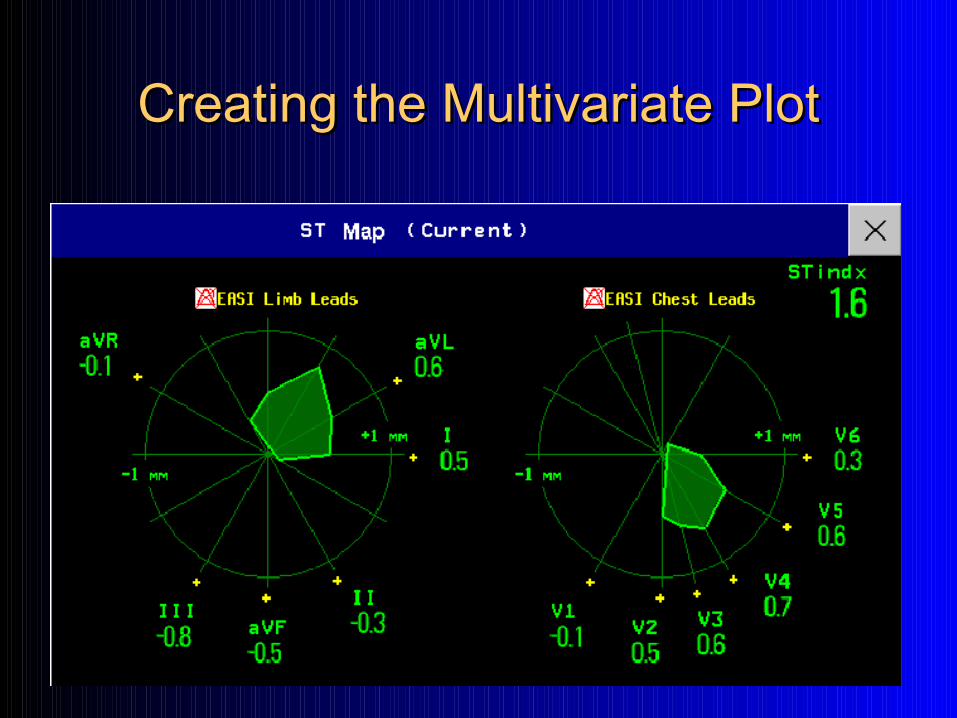
Creating the Multivariate PlotCreating the Multivariate Plot
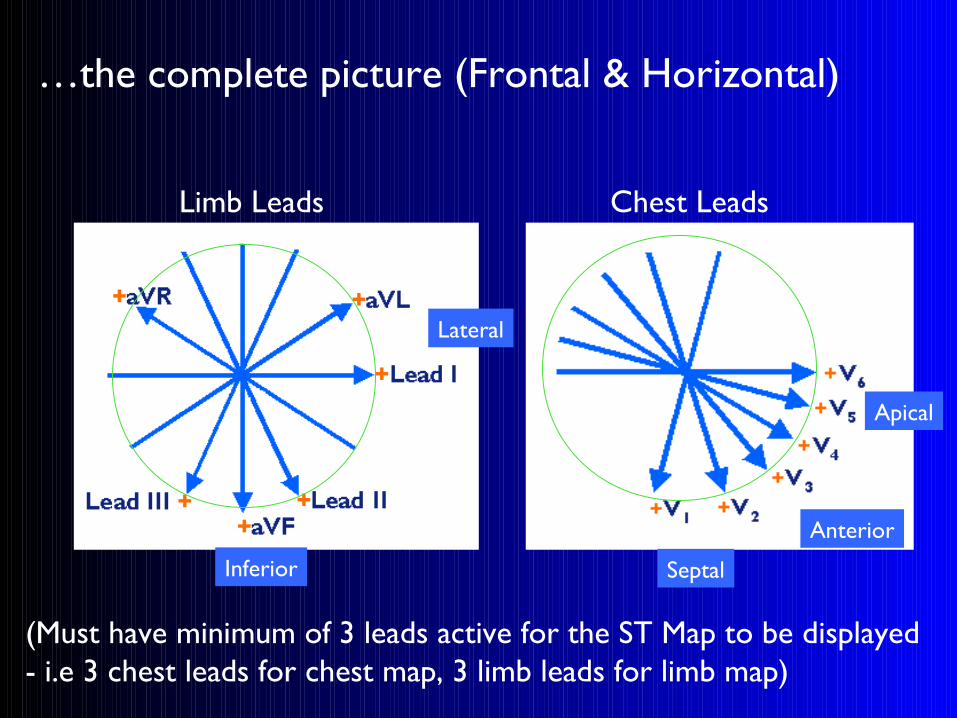
…the complete picture (Frontal & Horizontal)
Limb Leads Chest Leads
(Must have minimum of 3 leads active for the ST Map to be displayed - i.e 3 chest leads for chest map, 3 limb leads for limb map)
Inferior
Apical
Septal
Lateral
Anterior
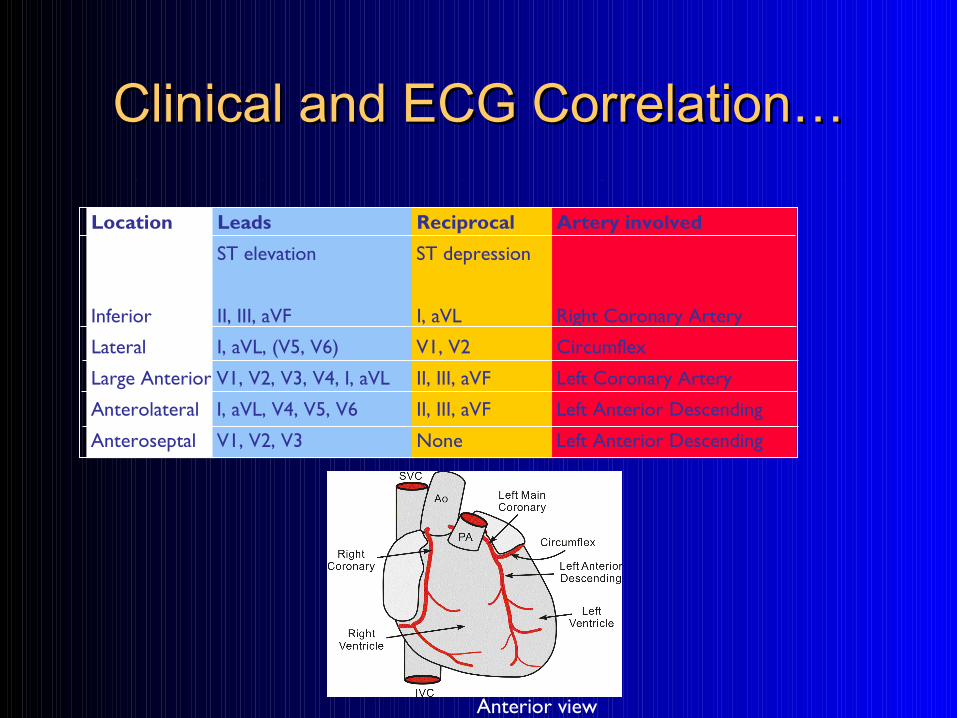
Clinical and ECG Correlation…Clinical and ECG Correlation…
Anterior view
Location Leads Reciprocal Artery involved
ST elevation ST depression
Inferior II, III, aVF I, aVL Right Coronary Artery
Lateral I, aVL, (V5, V6) V1, V2 Circumflex
Large Anterior V1, V2, V3, V4, I, aVL II, III, aVF Left Coronary Artery
Anterolateral I, aVL, V4, V5, V6 II, III, aVF Left Anterior Descending
Anteroseptal V1, V2, V3 None Left Anterior Descending
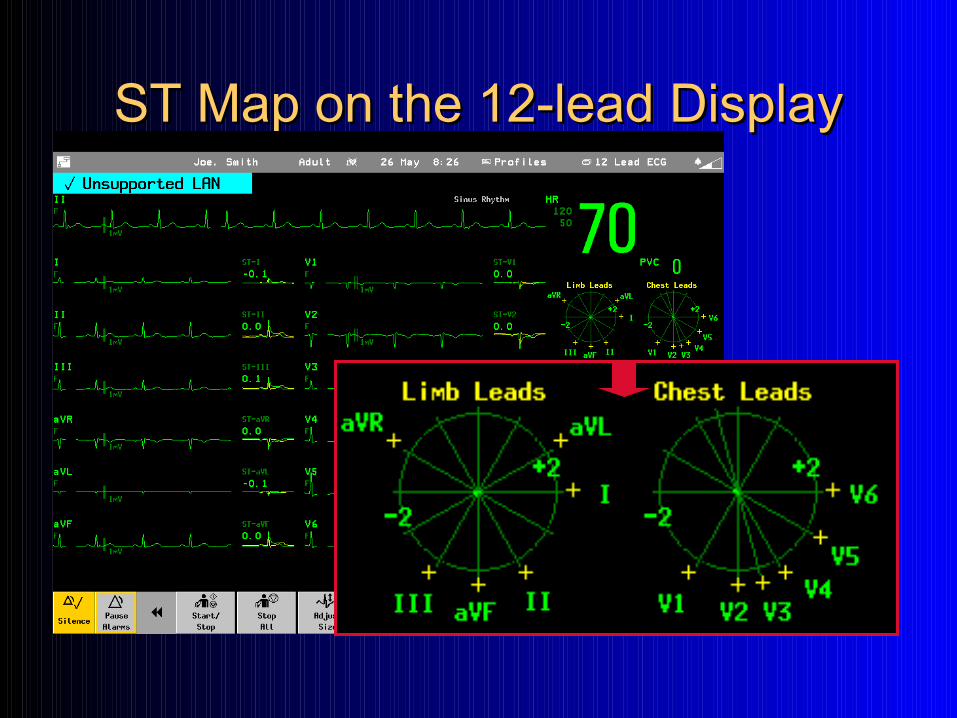
ST Map on the 12-lead DisplayST Map on the 12-lead Display
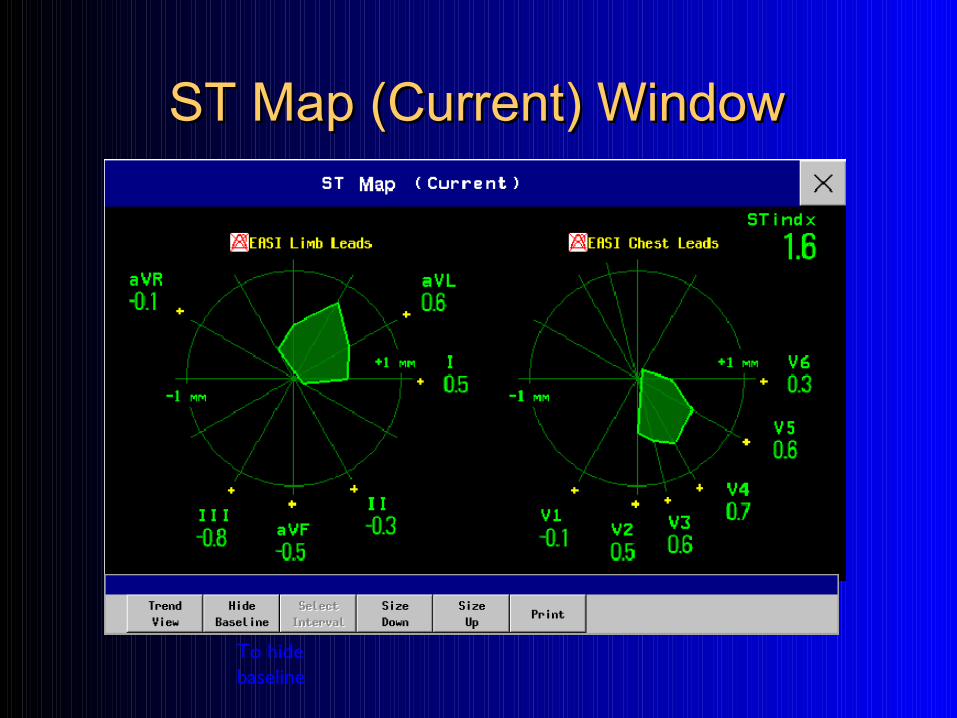
ST Map (Current) WindowST Map (Current) Window
To hide baseline
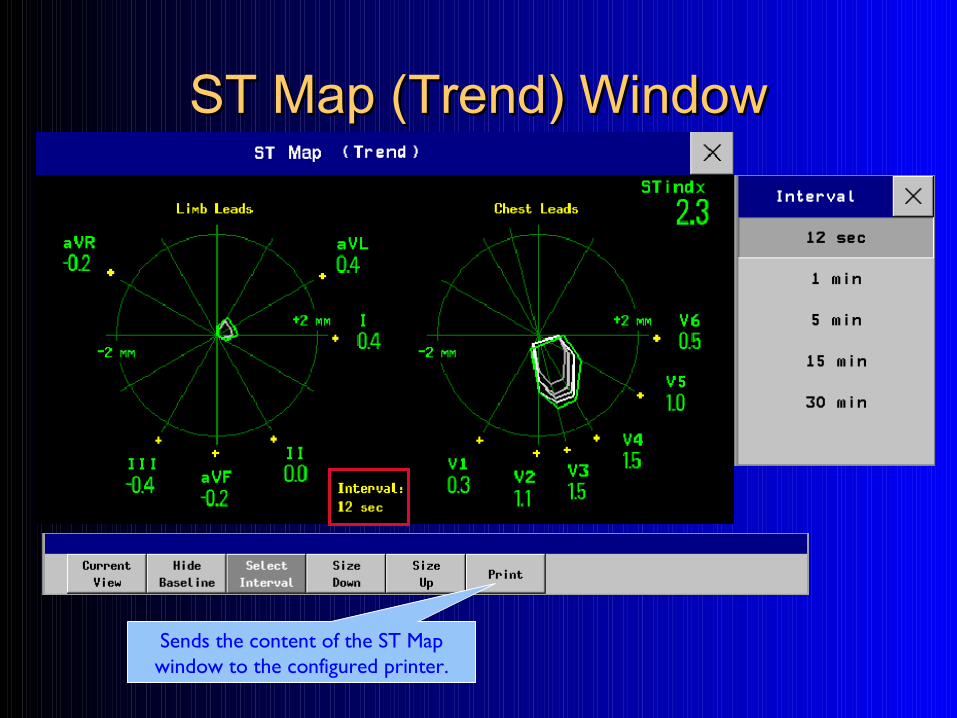
ST Map (Trend) WindowST Map (Trend) Window
Sends the content of the ST Map window to the configured printer.
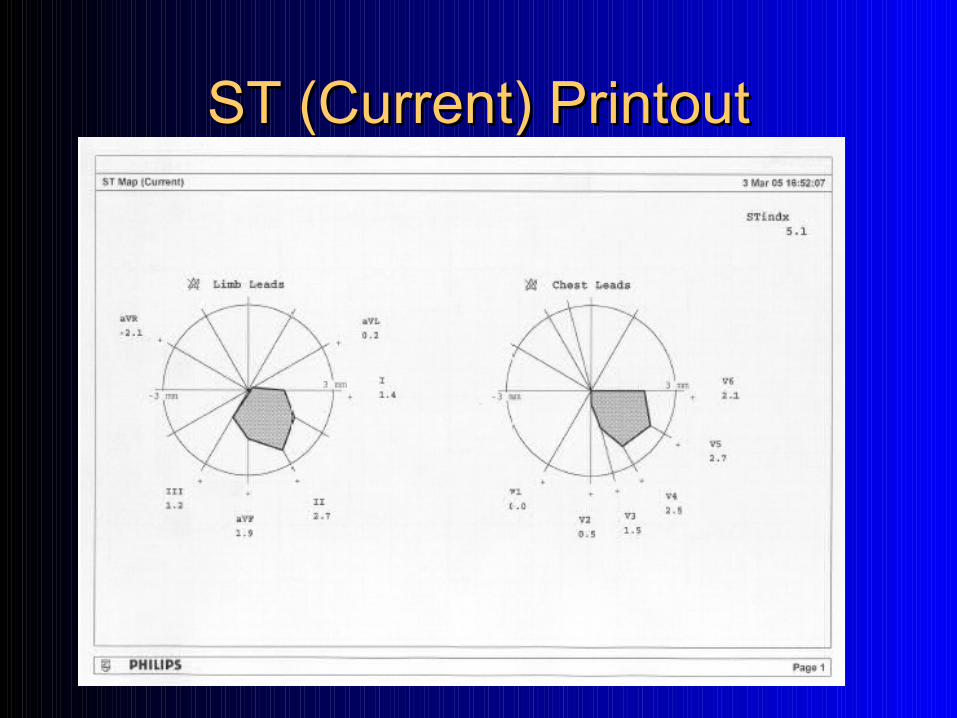
ST (Current) PrintoutST (Current) Printout
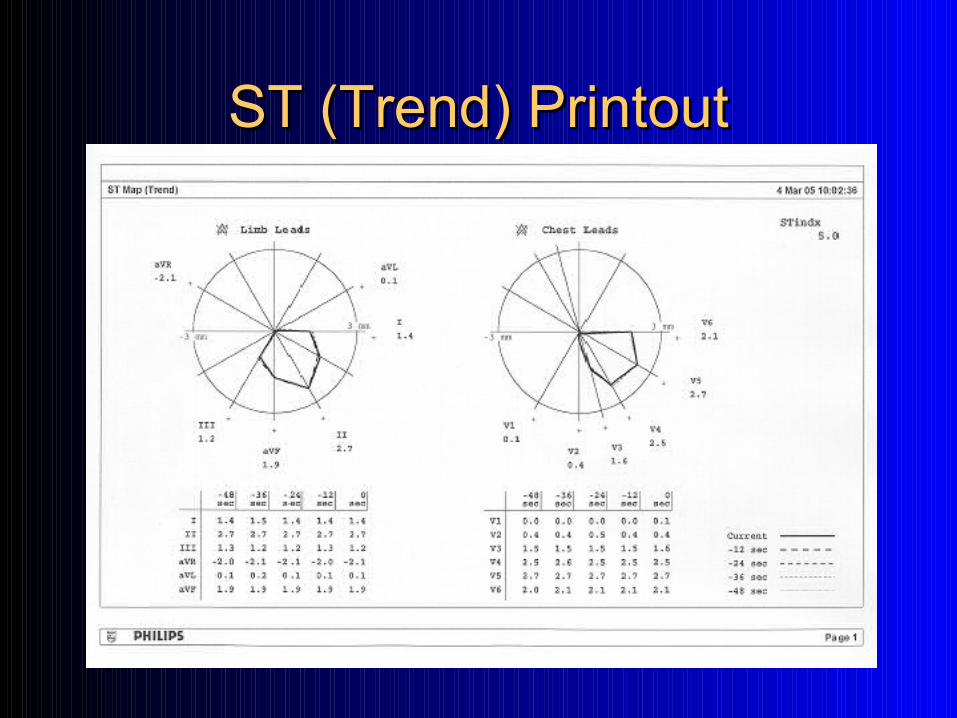
ST (Trend) PrintoutST (Trend) Printout
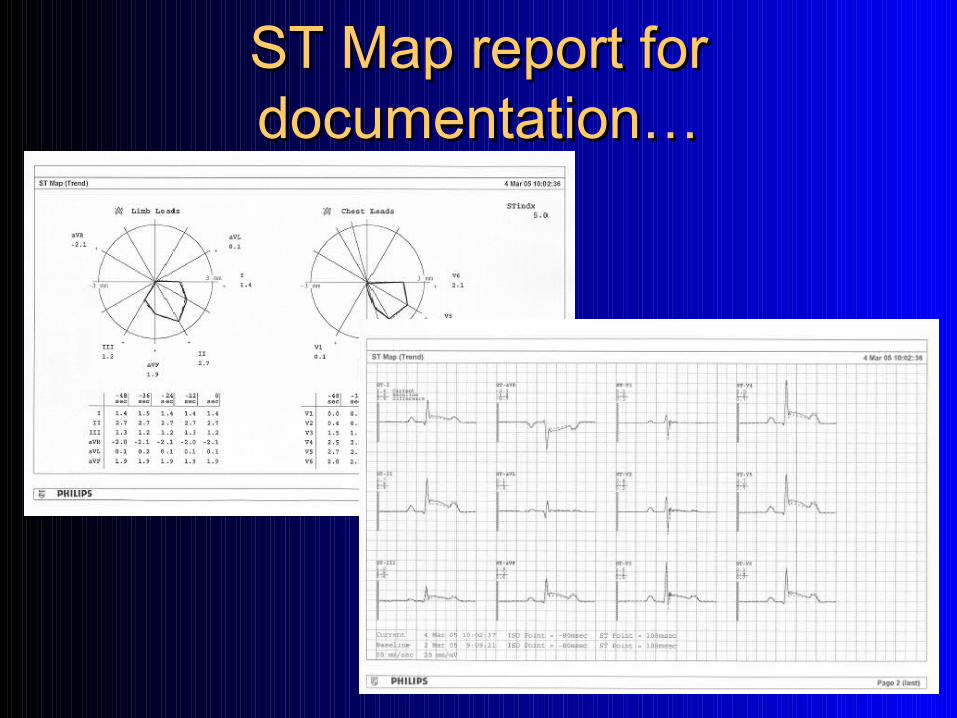
ST Map report for ST Map report for documentation…documentation…
Application of ST MapApplication of ST Map

A Case StudyA Case Study
Clinical Application of ST Segment Trending using “ST Map”
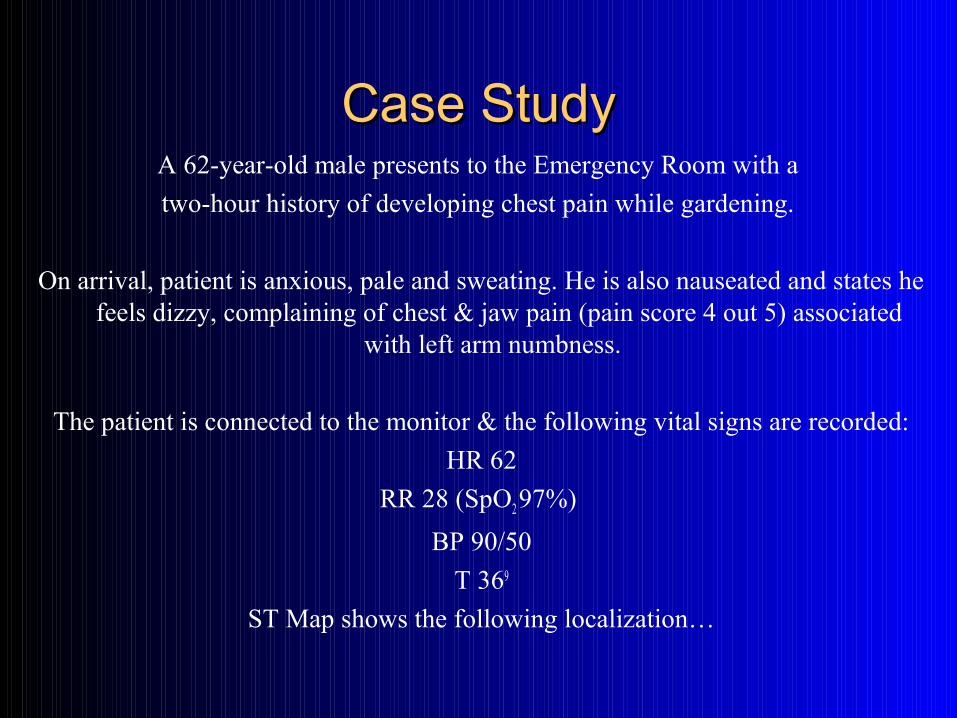
Case StudyCase StudyA 62-year-old male presents to the Emergency Room with a
two-hour history of developing chest pain while gardening.
On arrival, patient is anxious, pale and sweating. He is also nauseated and states he feels dizzy, complaining of chest & jaw pain (pain score 4 out 5) associated
with left arm numbness.
The patient is connected to the monitor & the following vital signs are recorded:
HR 62
RR 28 (SpO2 97%)
BP 90/50
T 369
ST Map shows the following localization…
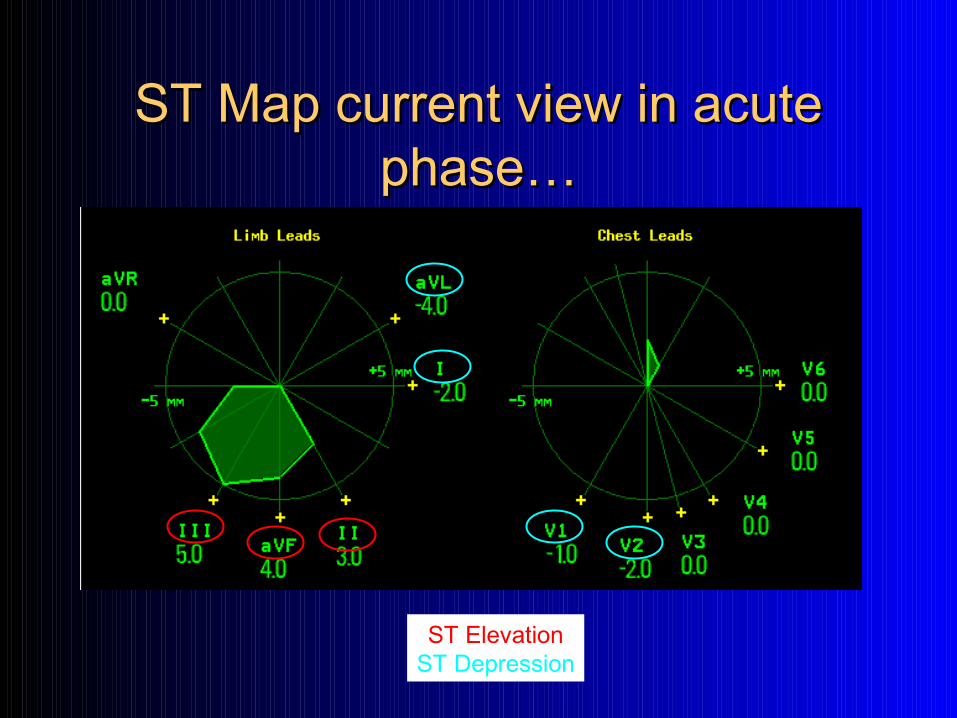
ST Map current view in acute ST Map current view in acute phase…phase…
ST ElevationST Depression
ST ElevationST Depression
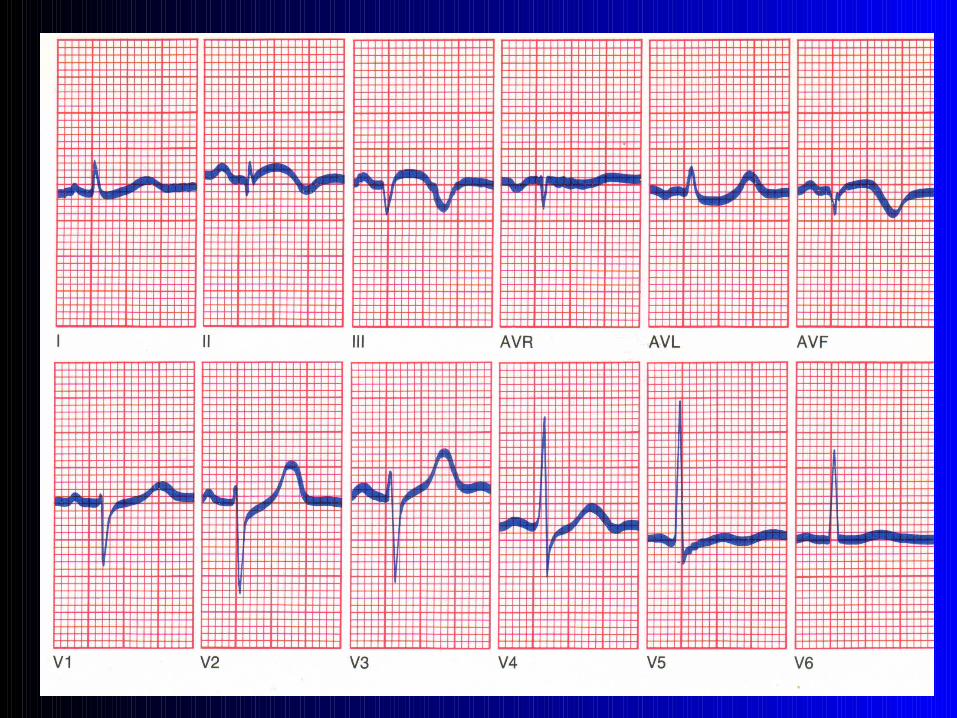
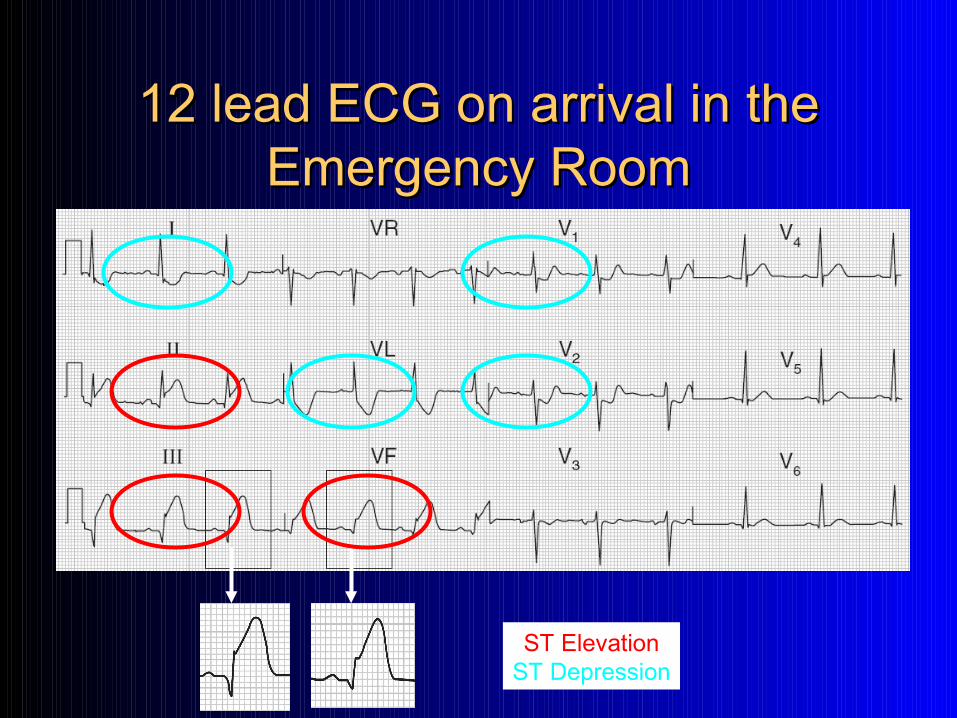
12 lead ECG on arrival in the 12 lead ECG on arrival in the Emergency RoomEmergency Room
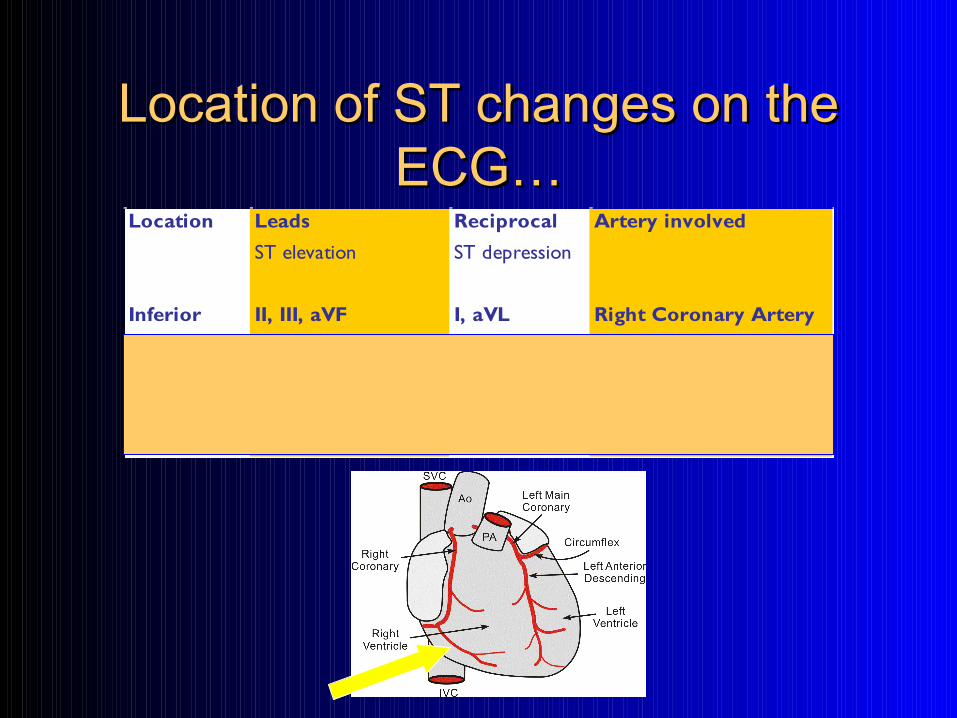
Location of ST changes on the Location of ST changes on the ECG…ECG…
Location Leads Reciprocal Artery involved
ST elevation ST depression
Inferior II, III, aVF I, aVL Right Coronary Artery
Lateral I, aVL, V5, V6 V1, V2 Circumflex
Anterior V1, V2, V3, V4, I, aVL II, III, aVF Left Coronary Artery
Anterolateral I, aVL, V4, V5, V6 II, III, aVF Left Anterior Descending
Anteroseptal V1, V2, V3 None Left Anterior Descending
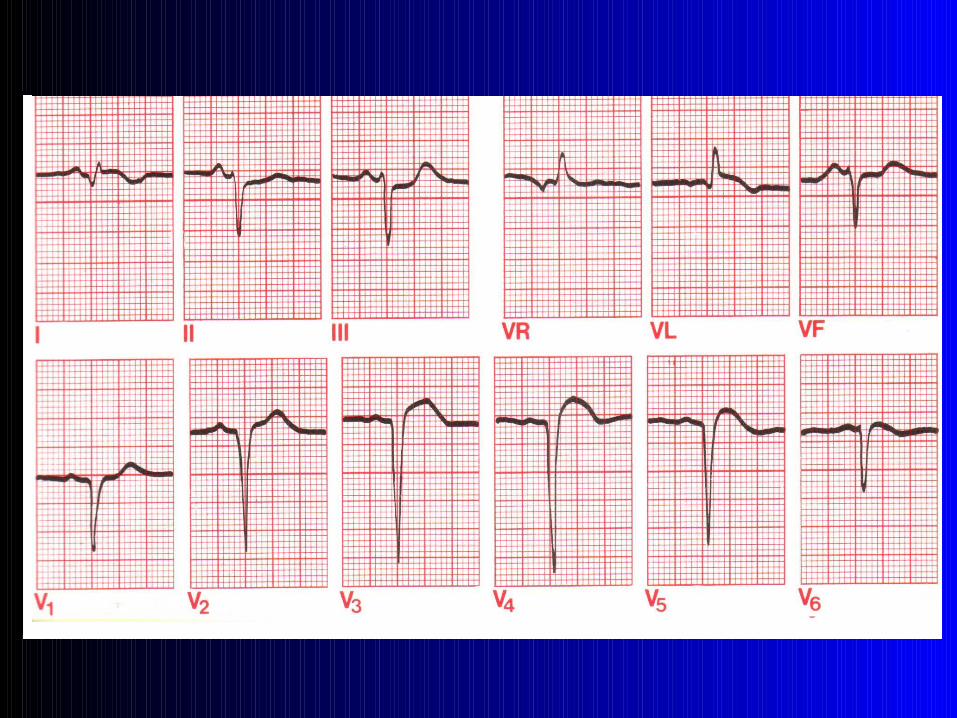
After evaluating the presenting symptoms, strong family history, & 12 lead ECG changes
a diagnosis of acute inferior myocardial infarction is made.
The patient is prepared for an emergency angiography with possible angioplasty.
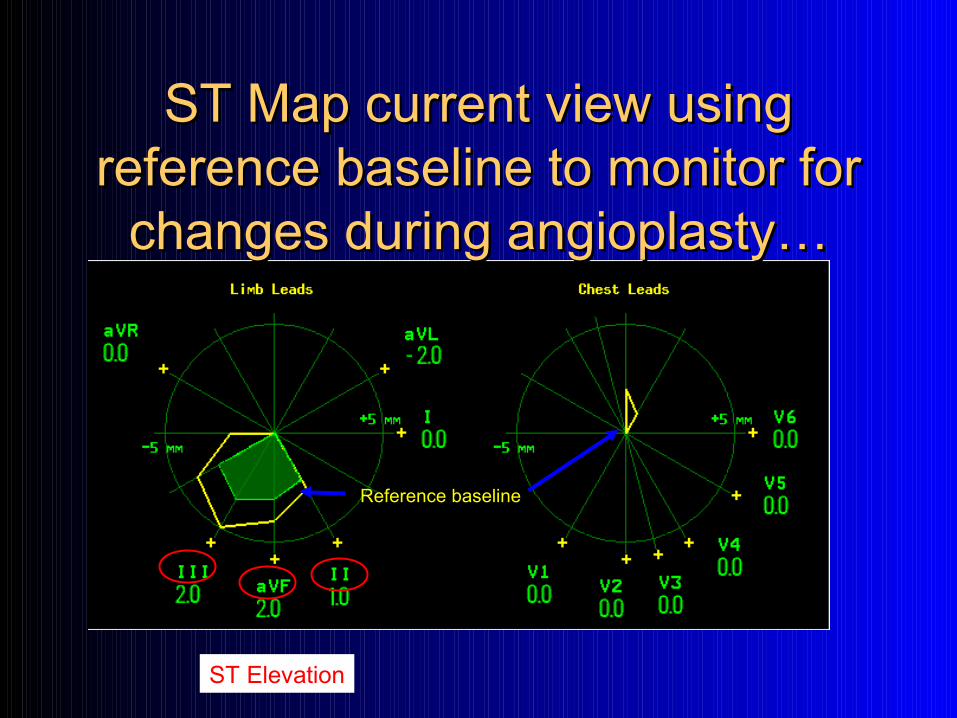
ST Map current view using ST Map current view using reference baseline to monitor for reference baseline to monitor for
changes during angioplasty…changes during angioplasty…
Reference baseline
ST Elevation
Angiogram showed a 85% occlusion of proximal right coronary artery and a coronary stent was successfully deployed. ReoPro™ was given as
per hospital guidelines.
The patient’s condition is stable and he is transferred to the Coronary Care Unit for close
observation.
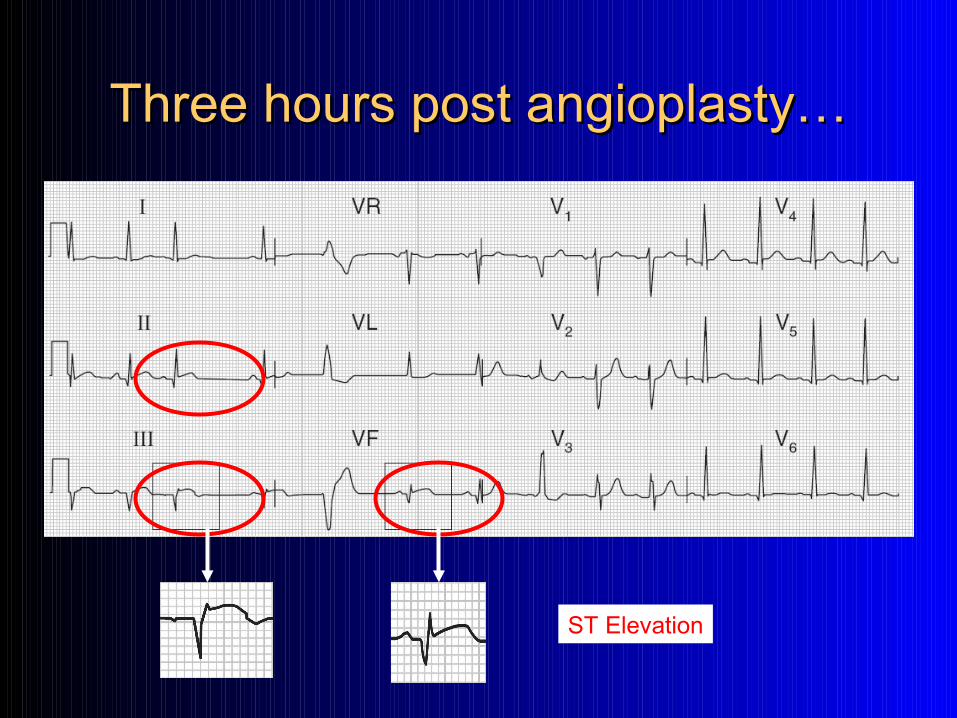
Three hours post angioplasty…Three hours post angioplasty…
ST Elevation
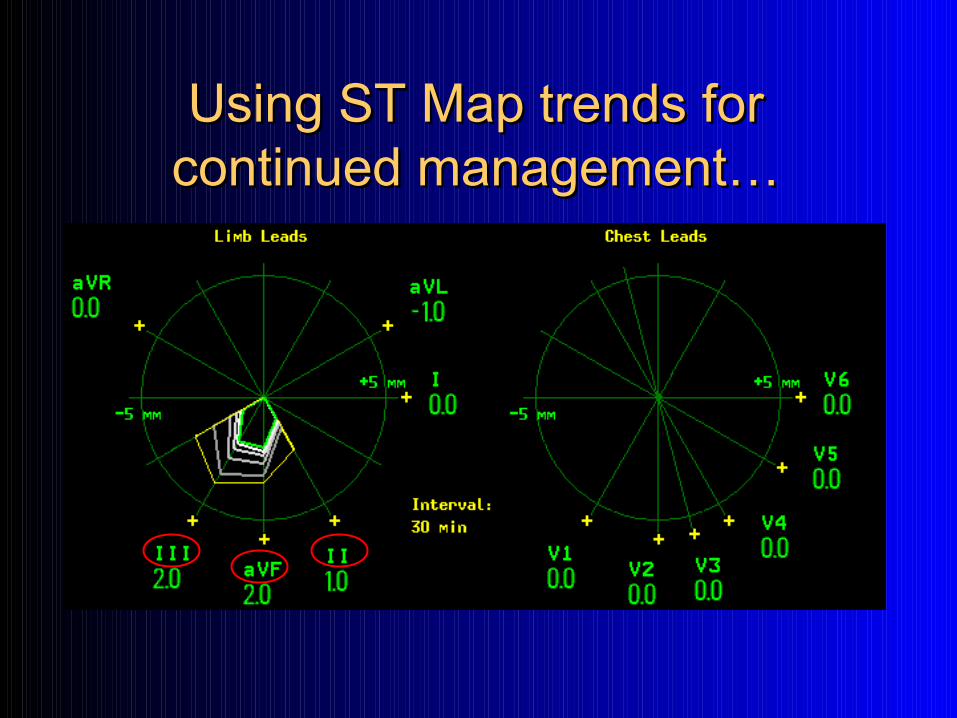
Using ST Map trends for Using ST Map trends for continued management…continued management…
12 hours post angioplasty, the patient had a brief episode of central non-radiating chest pain at rest not
associated with any other signs and symptoms.
The trending feature on the ST Map was set for 12 second snapshots to observe closely the changes in
the ST segments.
The pain resolved spontaneously.
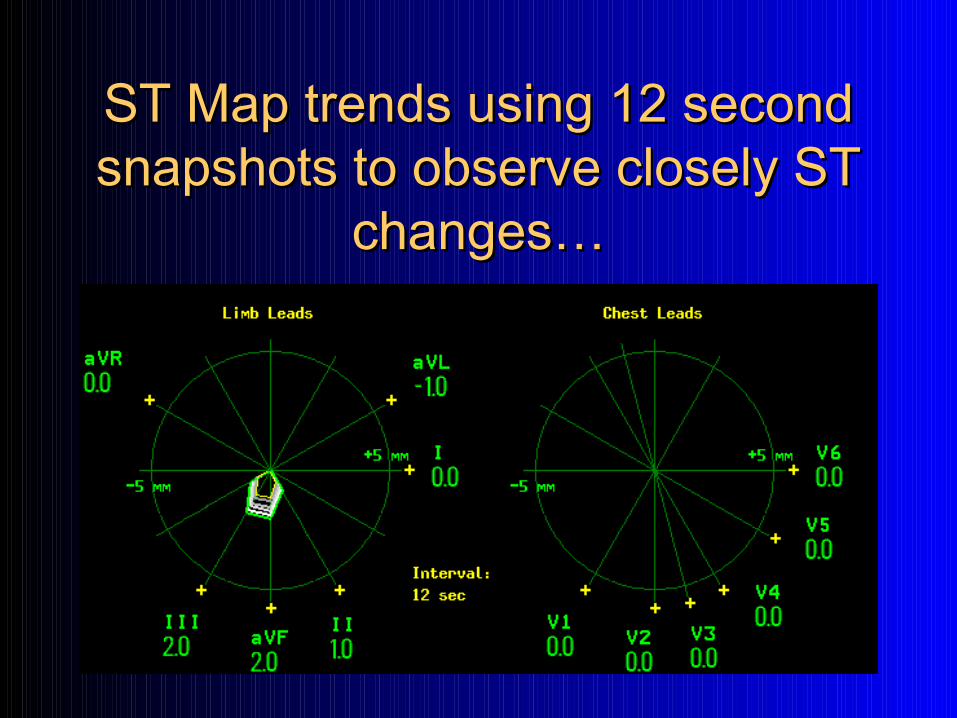
ST Map trends using 12 second ST Map trends using 12 second snapshots to observe closely ST snapshots to observe closely ST
changes…changes…
This episode of chest pain resolved spontaneously and the patient remained pain-
free.
The ST Map at 24hrs post angioplasty, showed that the inferior ST segments, were nearly
back to normal and that the lateral changes had resolved completely.
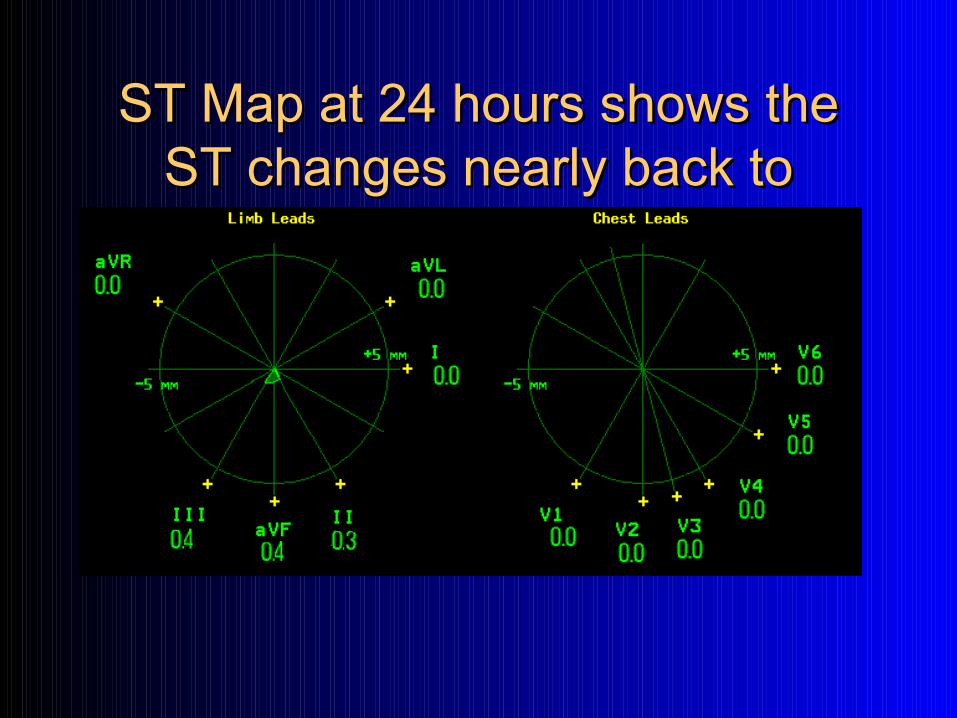
ST Map at 24 hours shows the ST Map at 24 hours shows the ST changes nearly back to ST changes nearly back to
normal…normal…
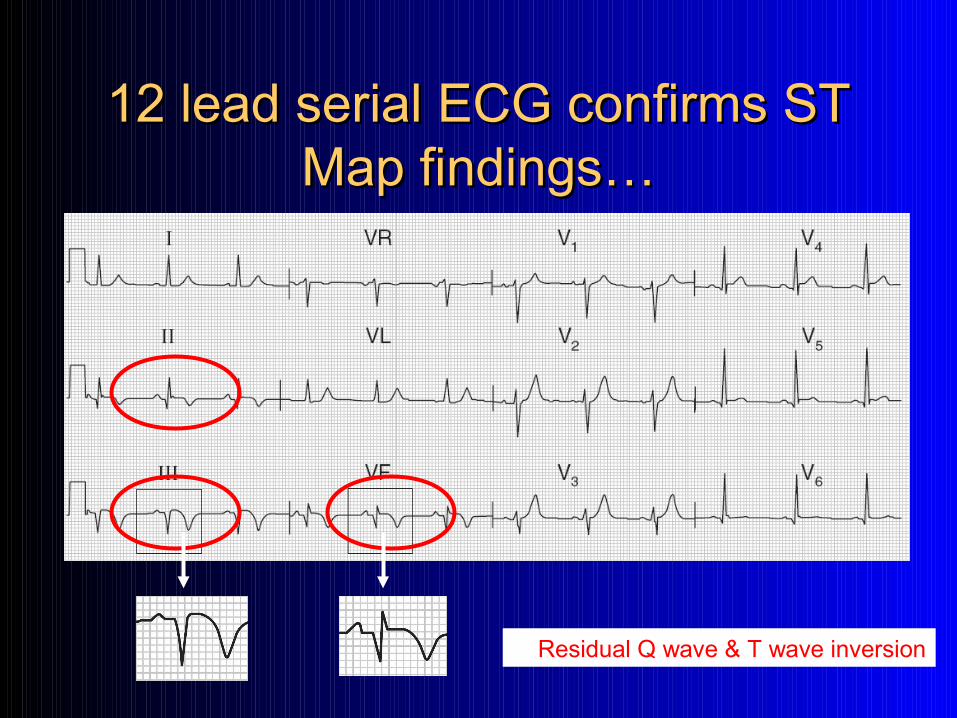
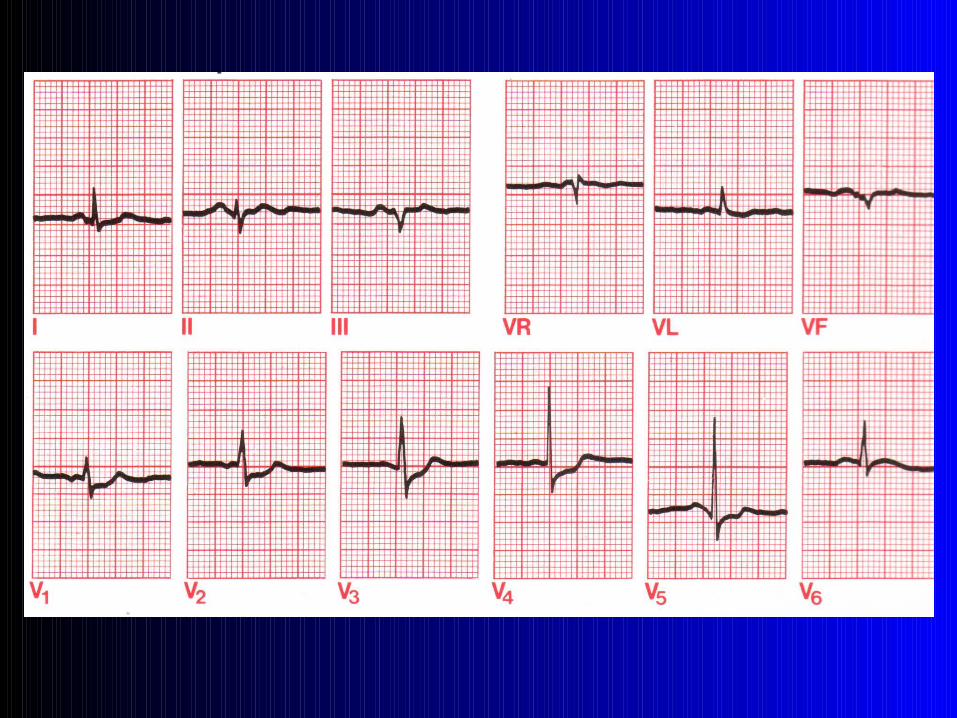
12 lead serial ECG confirms ST 12 lead serial ECG confirms ST Map findings…Map findings…
Residual Q wave & T wave inversion
The patient remained pain-free for the remainder of his stay in the CCU. After spending time on the telemetry floor, the patient was discharged
home 7 days post angioplasty.
“Using ST MapTM for monitoring ST segment monitoring, provides clinically useful information in a user-friendly manner”
Survey of use of ST-segment monitoring in patients with acute coronary syndromesPatton et al, AJCC Vol 10, No1, Pg 23-34
TM Philips Medical Systems

Identifying Intraventricular Identifying Intraventricular Conduction DefectsConduction Defects
RBBB, LBBB, LAH, LPH, Bifascicular & Trifascicular Blocks
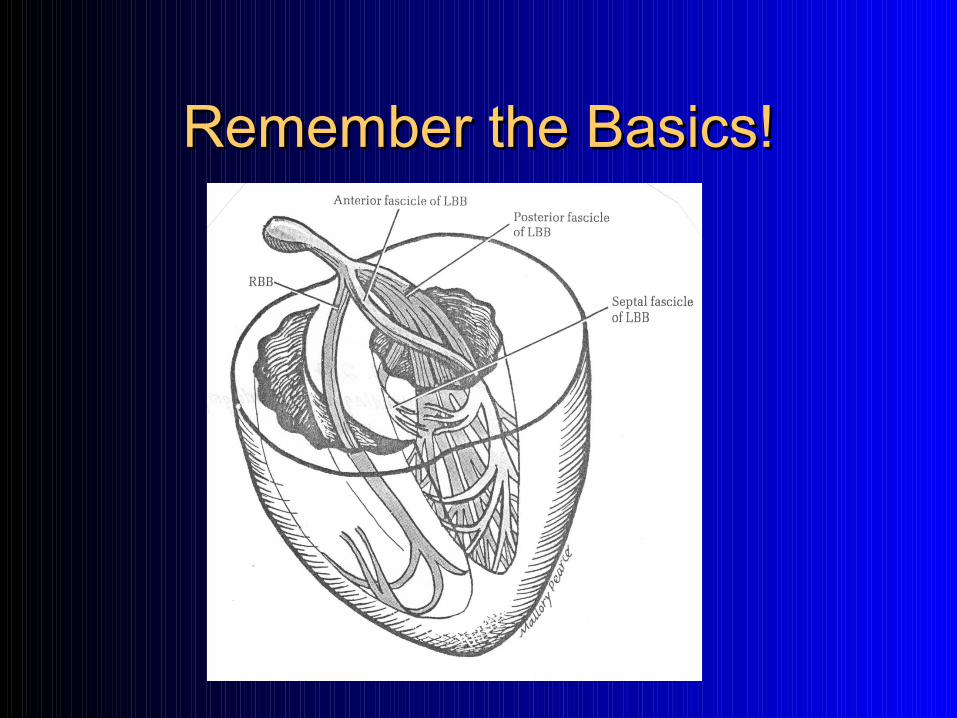
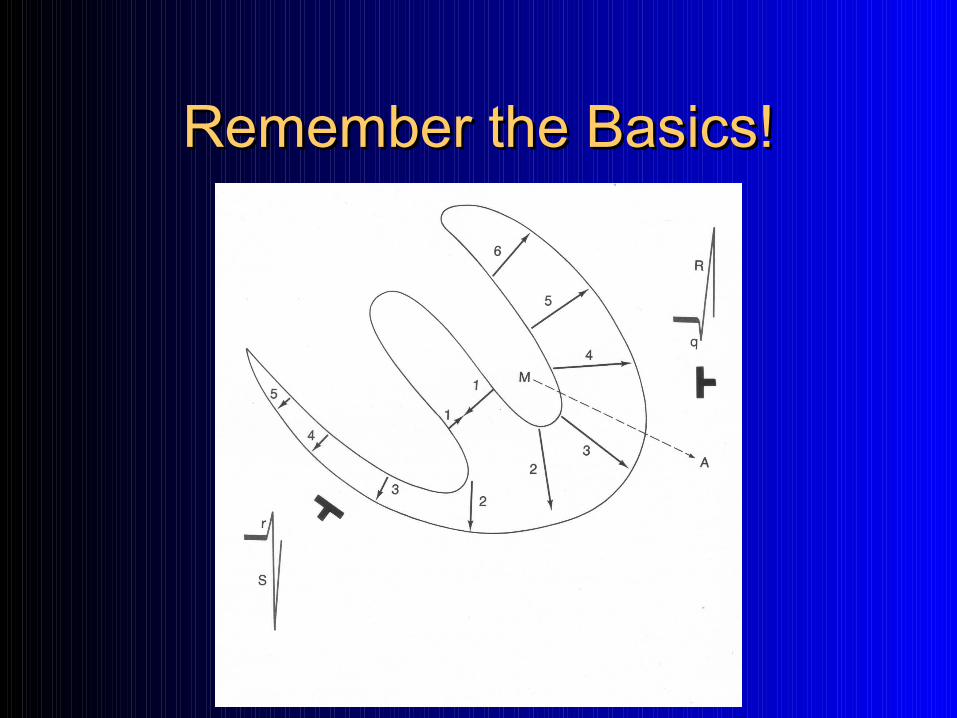
Remember the Basics!Remember the Basics!
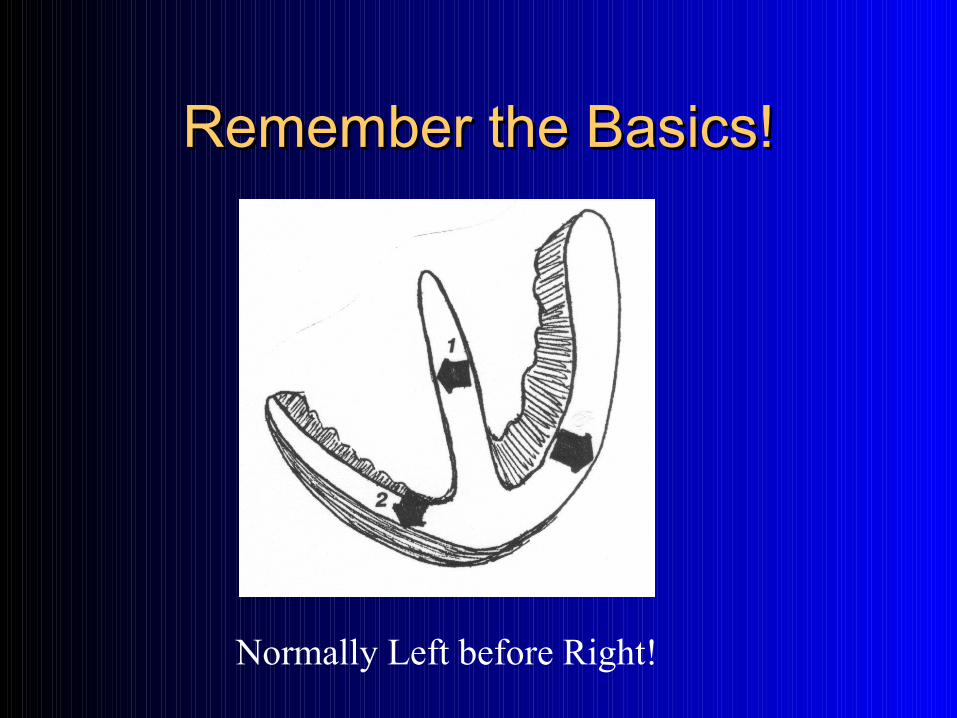
Remember the Basics!Remember the Basics!
Normally Left before Right!
Remember the Basics!Remember the Basics!
Remember the Basics!Remember the Basics!
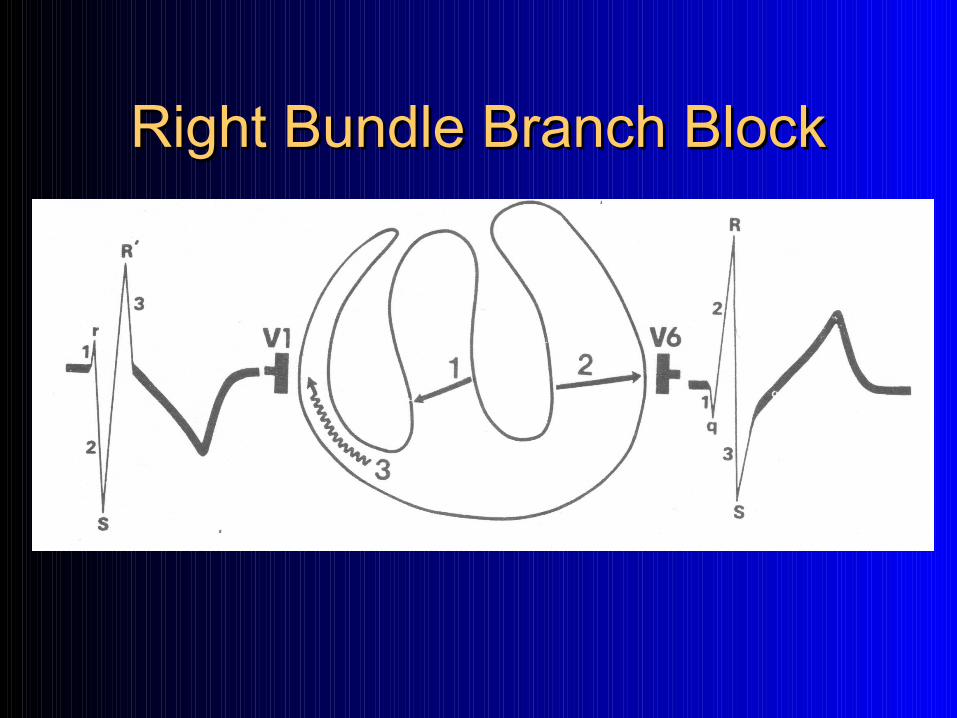
Right Bundle Branch BlockRight Bundle Branch Block
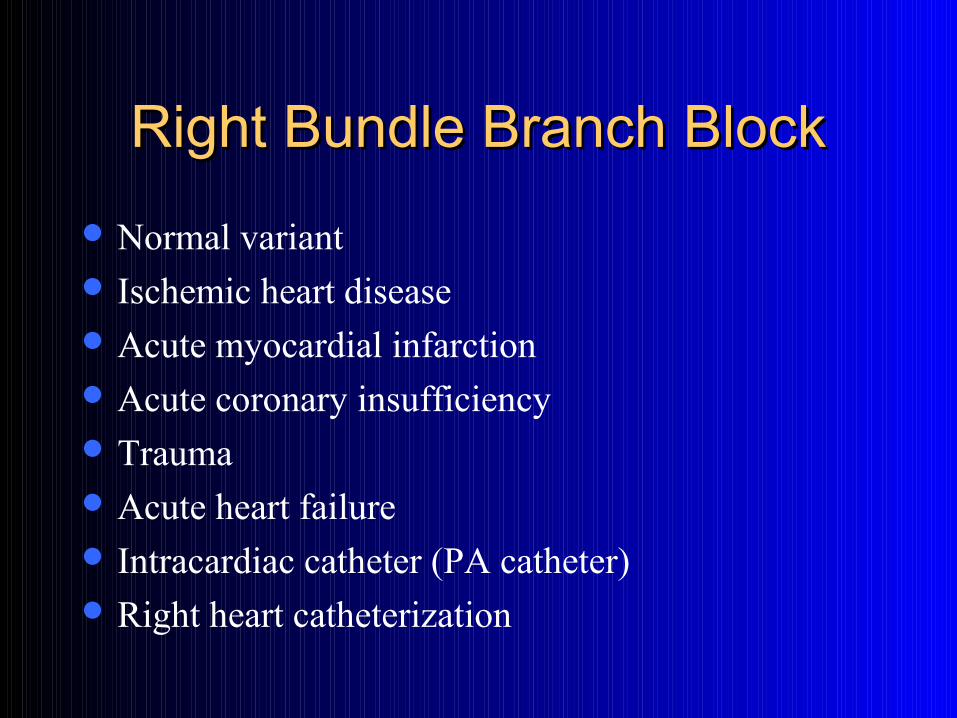
Right Bundle Branch BlockRight Bundle Branch Block
Normal variant Ischemic heart disease Acute myocardial infarction Acute coronary insufficiency Trauma Acute heart failure Intracardiac catheter (PA catheter) Right heart catheterization
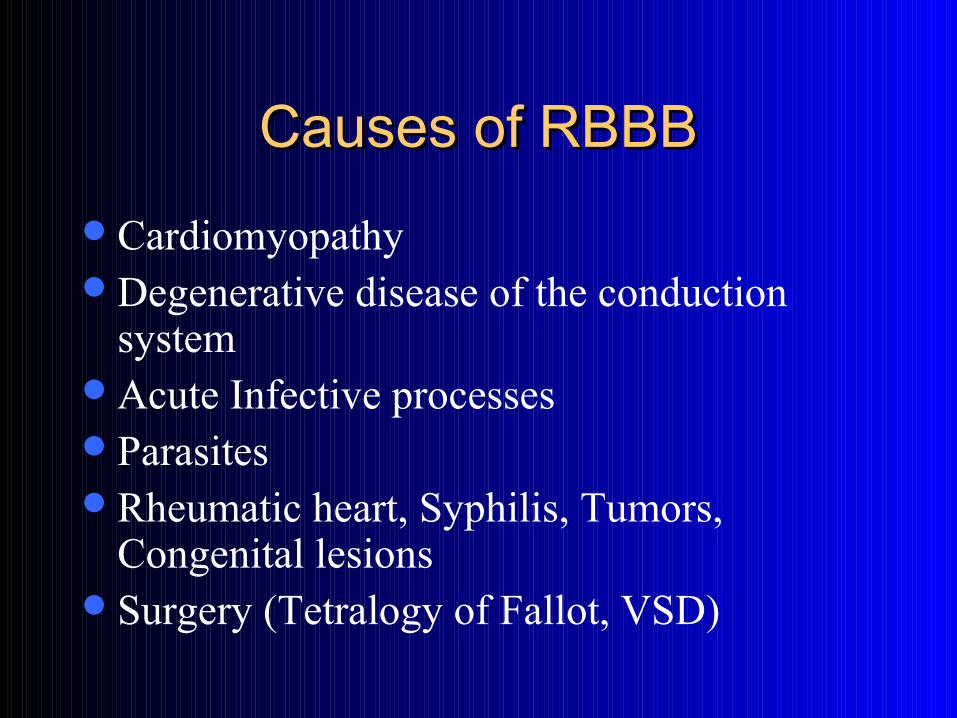
Causes of RBBBCauses of RBBB
CardiomyopathyDegenerative disease of the conduction
systemAcute Infective processesParasitesRheumatic heart, Syphilis, Tumors,
Congenital lesionsSurgery (Tetralogy of Fallot, VSD)
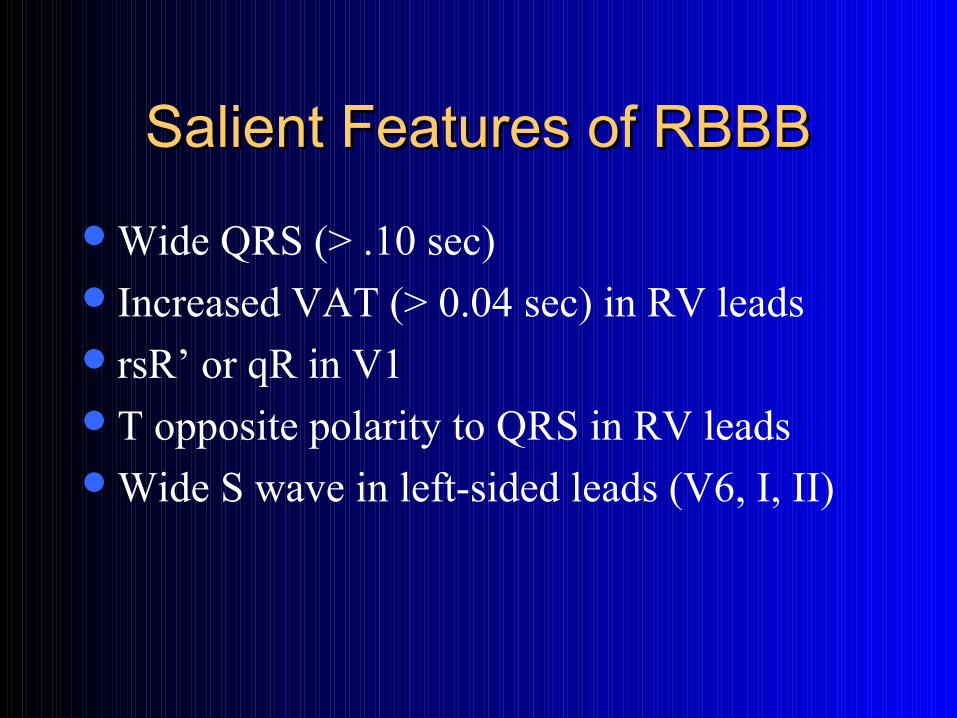
Salient Features of RBBBSalient Features of RBBB
Wide QRS (> .10 sec)Increased VAT (> 0.04 sec) in RV leadsrsR’ or qR in V1T opposite polarity to QRS in RV leadsWide S wave in left-sided leads (V6, I, II)
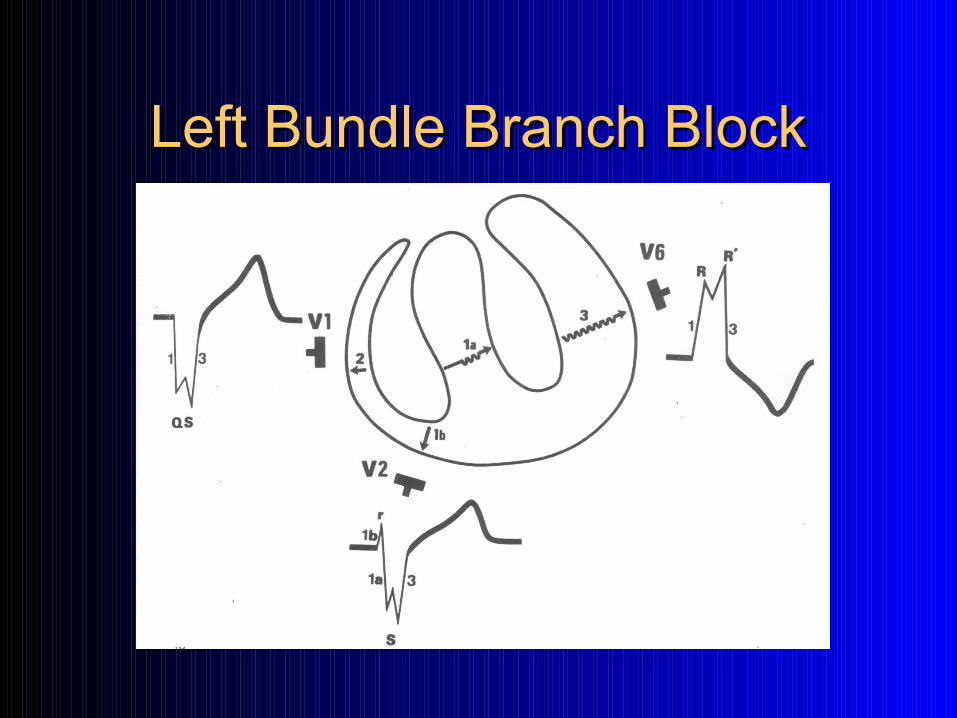
Left Bundle Branch BlockLeft Bundle Branch Block

Causes of LBBBCauses of LBBB
Not as common as Right Bundle Branch Block due to two separate fascicles (posterior fascicle has a dual blood supply and is much thicker)
Causes are the same as for Right Bundle Branch Block, but involving the Left Ventricle or Surgery to the Aortic Valve.
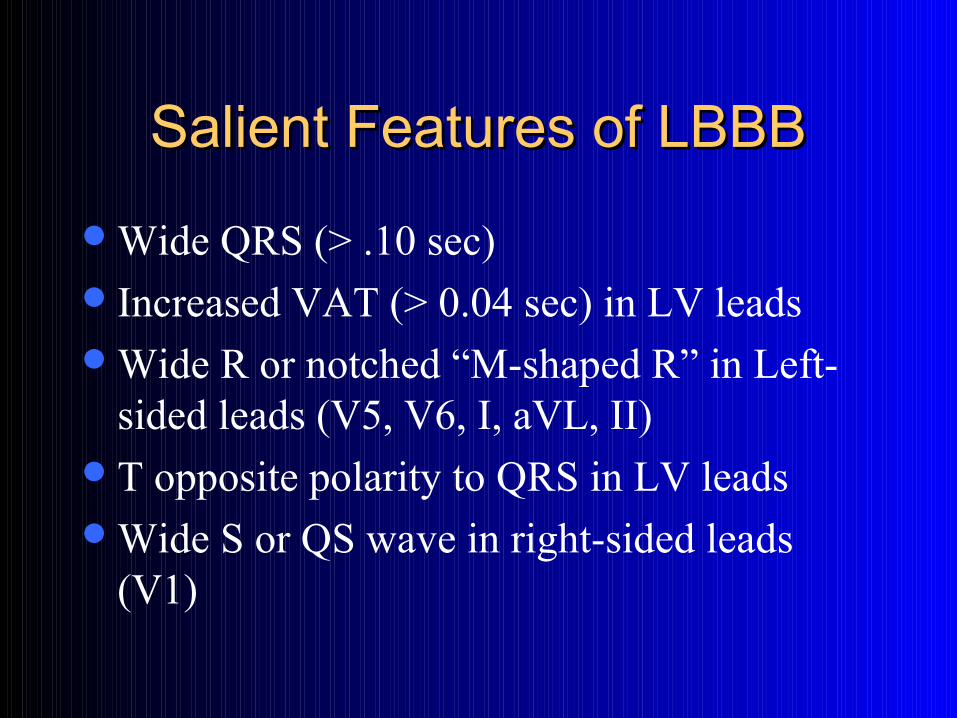
Salient Features of LBBBSalient Features of LBBB
Wide QRS (> .10 sec)Increased VAT (> 0.04 sec) in LV leadsWide R or notched “M-shaped R” in Left-
sided leads (V5, V6, I, aVL, II)T opposite polarity to QRS in LV leadsWide S or QS wave in right-sided leads
(V1)
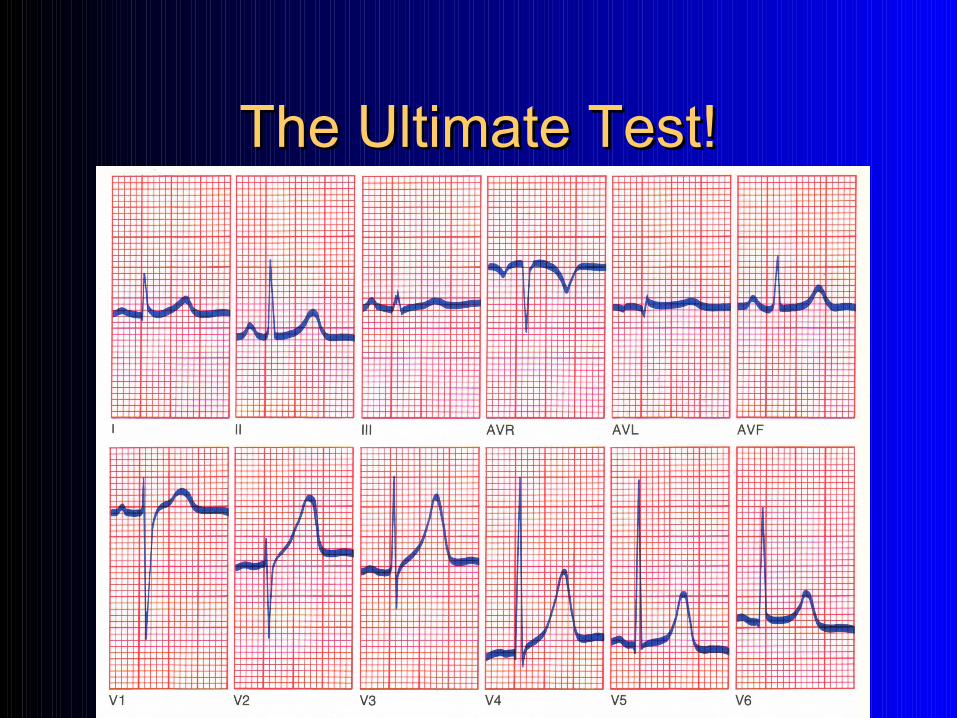
The Ultimate Test!The Ultimate Test!
To be continued …To be continued …

I’m 100% saturated!I’m 100% saturated!


Thank you!Thank you!