Embed Size (px)
Citation preview

Cost-Sharing for Plans Offered in Federally Facilitated or Partnership Marketplaces for 2015
Medical and Prescription Drug Deductibles
SOURCE: Kaiser Family Foundation analysis of Marketplace plans in the 37 states with Federally Facilitated or Partnership exchanges in 2015 (including New Mexico, Oregon, and Nevada). Data are from Healthcare.gov Health plan information for individuals and families available here: https://www.healthcare.gov/health-plan-information/
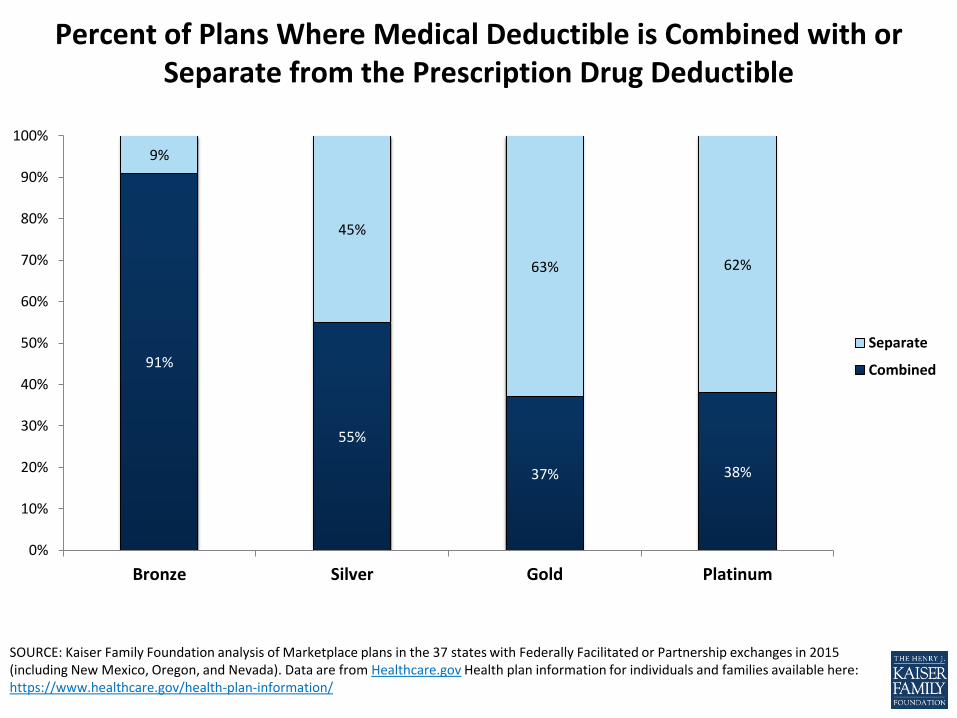
Percent of Plans Where Medical Deductible is Combined with or Separate from the Prescription Drug Deductible
91%
55%
37% 38%
9%
45%
63% 62%
0%
10%
20%
30%
40%
50%
60%
70%
80%
90%
100%
Bronze Silver Gold Platinum
Separate
Combined
SOURCE: Kaiser Family Foundation analysis of Marketplace plans in the 37 states with Federally Facilitated or Partnership exchanges in 2015 (including New Mexico, Oregon, and Nevada). Data are from Healthcare.gov Health plan information for individuals and families available here: https://www.healthcare.gov/health-plan-information/
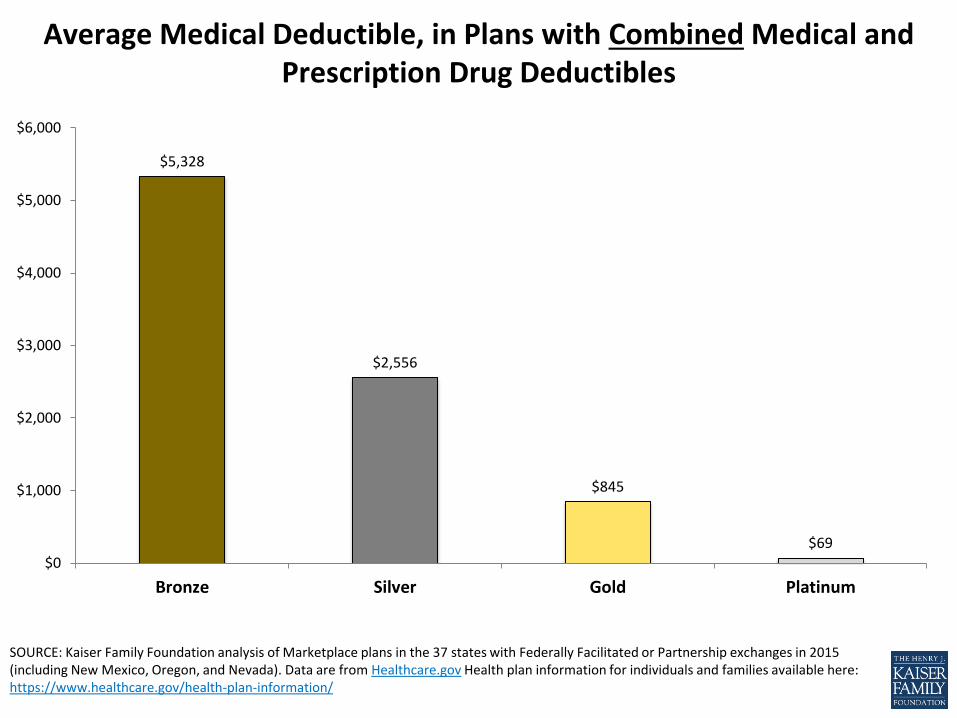
Average Medical Deductible, in Plans with Combined Medical and Prescription Drug Deductibles
$5,328
$2,556
$845
$69 $0
$1,000
$2,000
$3,000
$4,000
$5,000
$6,000
Bronze Silver Gold Platinum
SOURCE: Kaiser Family Foundation analysis of Marketplace plans in the 37 states with Federally Facilitated or Partnership exchanges in 2015 (including New Mexico, Oregon, and Nevada). Data are from Healthcare.gov Health plan information for individuals and families available here: https://www.healthcare.gov/health-plan-information/
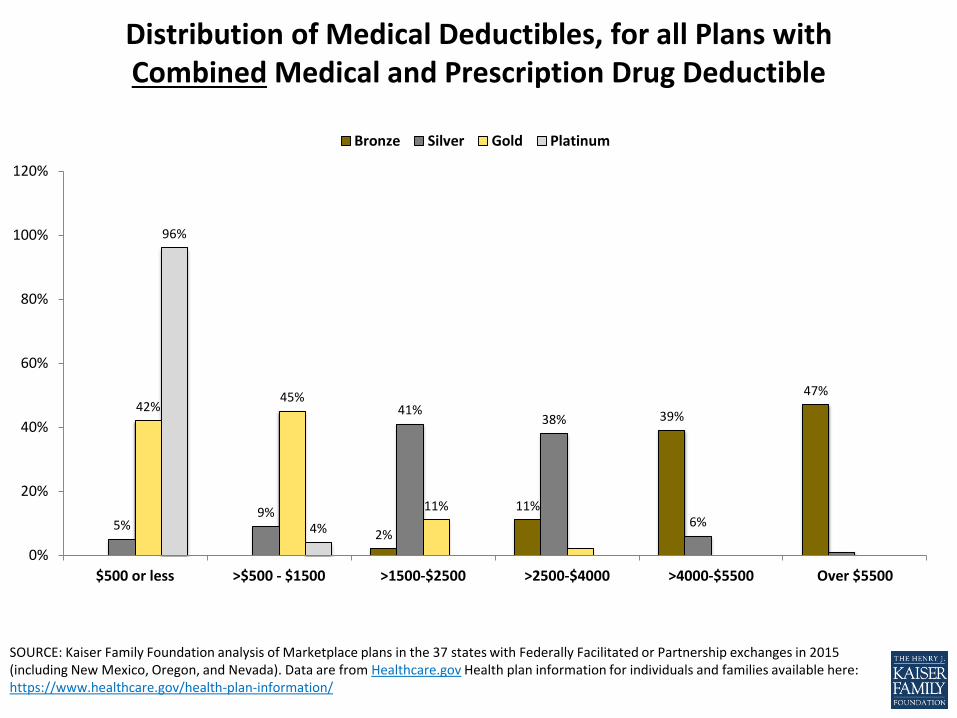
Distribution of Medical Deductibles, for all Plans with Combined Medical and Prescription Drug Deductible
2%
11%
39%
47%
5% 9%
41% 38%
6%
42% 45%
11%
96%
4%
0%
20%
40%
60%
80%
100%
120%
$500 or less >$500 - $1500 >1500-$2500 >2500-$4000 >4000-$5500 Over $5500
Bronze Silver Gold Platinum

SOURCE: Kaiser Family Foundation analysis of Marketplace plans in the 37 states with Federally Facilitated or Partnership exchanges in 2015 (including New Mexico, Oregon, and Nevada). Data are from Healthcare.gov Health plan information for individuals and families available here: https://www.healthcare.gov/health-plan-information/
Distribution of Medical Deductibles, for Bronze Plans with Combined Medical and Prescription Drug Deductible
0%
2%
11%
30%
34%
22%
0%
5%
10%
15%
20%
25%
30%
35%
40%
$2000 or less >$2000 -$2500 >$2500 - $4000 >$4000 - $5000 >$5000 - $6000 Over $6000
SOURCE: Kaiser Family Foundation analysis of Marketplace plans in the 37 states with Federally Facilitated or Partnership exchanges in 2015 (including New Mexico, Oregon, and Nevada). Data are from Healthcare.gov Health plan information for individuals and families available here: https://www.healthcare.gov/health-plan-information/
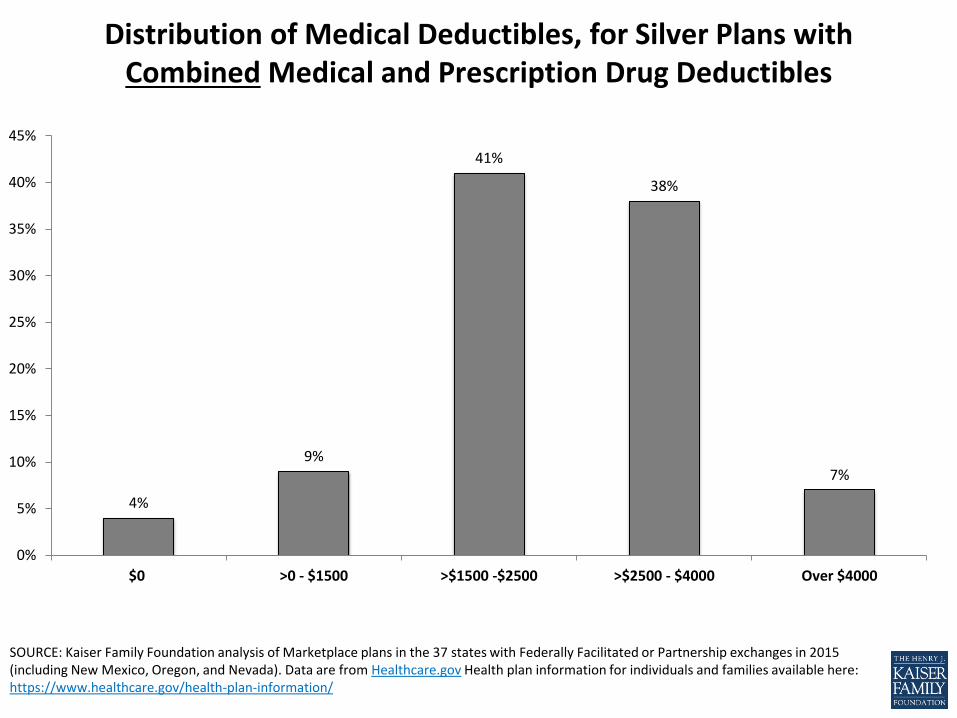
Distribution of Medical Deductibles, for Silver Plans with Combined Medical and Prescription Drug Deductibles
4%
9%
41%
38%
7%
0%
5%
10%
15%
20%
25%
30%
35%
40%
45%
$0 >0 - $1500 >$1500 -$2500 >$2500 - $4000 Over $4000
SOURCE: Kaiser Family Foundation analysis of Marketplace plans in the 37 states with Federally Facilitated or Partnership exchanges in 2015 (including New Mexico, Oregon, and Nevada). Data are from Healthcare.gov Health plan information for individuals and families available here: https://www.healthcare.gov/health-plan-information/
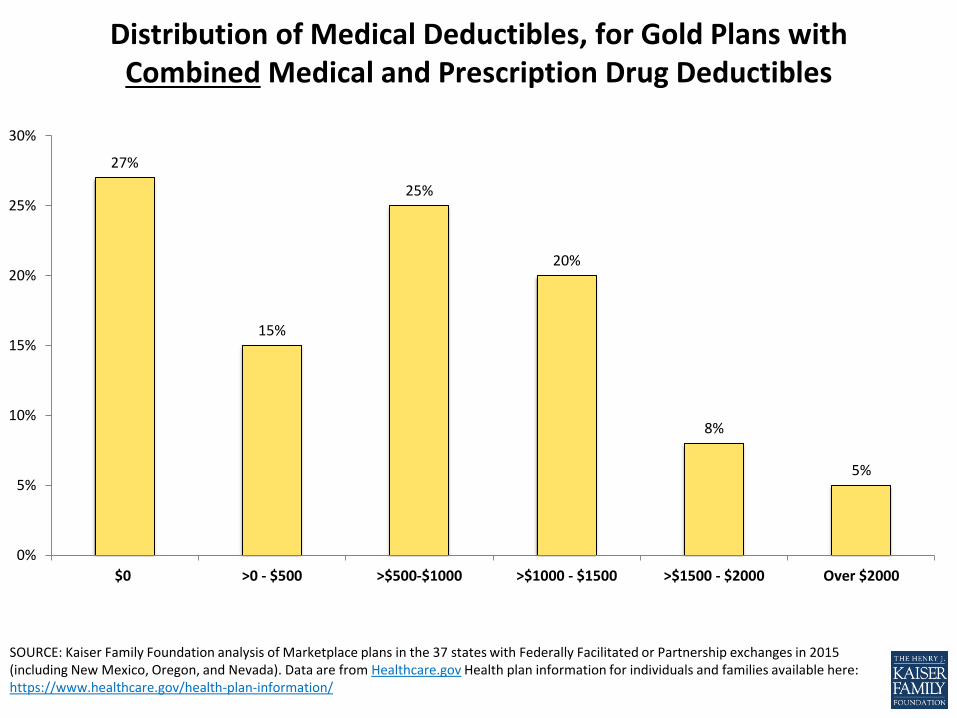
Distribution of Medical Deductibles, for Gold Plans with Combined Medical and Prescription Drug Deductibles
27%
15%
25%
20%
8%
5%
0%
5%
10%
15%
20%
25%
30%
$0 >0 - $500 >$500-$1000 >$1000 - $1500 >$1500 - $2000 Over $2000
SOURCE: Kaiser Family Foundation analysis of Marketplace plans in the 37 states with Federally Facilitated or Partnership exchanges in 2015 (including New Mexico, Oregon, and Nevada). Data are from Healthcare.gov Health plan information for individuals and families available here: https://www.healthcare.gov/health-plan-information/
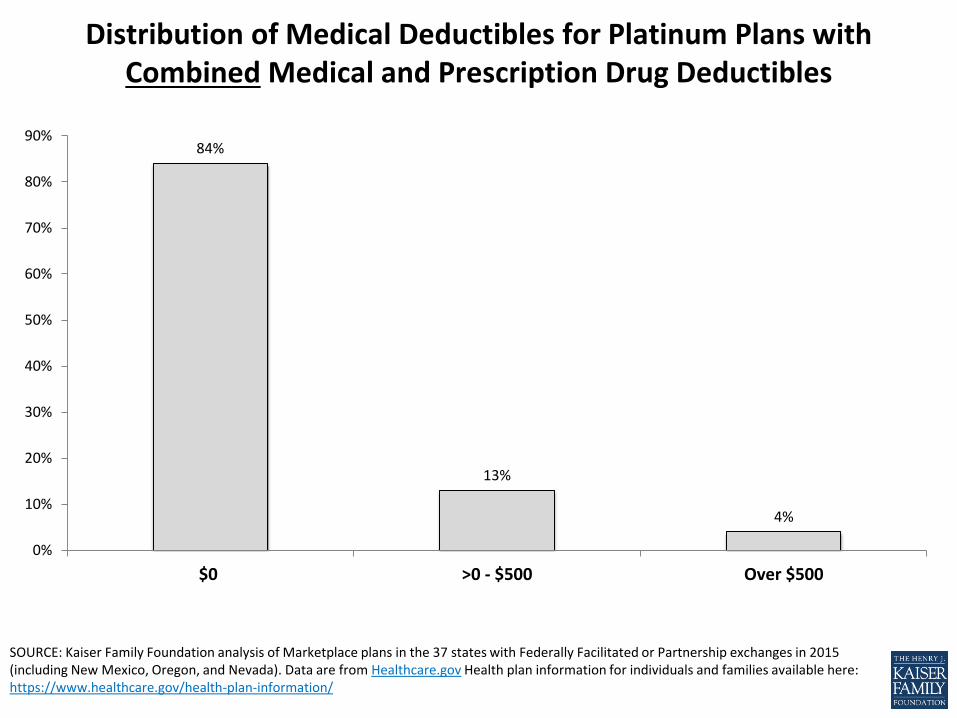
Distribution of Medical Deductibles for Platinum Plans with Combined Medical and Prescription Drug Deductibles
84%
13%
4%
0%
10%
20%
30%
40%
50%
60%
70%
80%
90%
$0 >0 - $500 Over $500
SOURCE: Kaiser Family Foundation analysis of Marketplace plans in the 37 states with Federally Facilitated or Partnership exchanges in 2015 (including New Mexico, Oregon, and Nevada). Data are from Healthcare.gov Health plan information for individuals and families available here: https://www.healthcare.gov/health-plan-information/
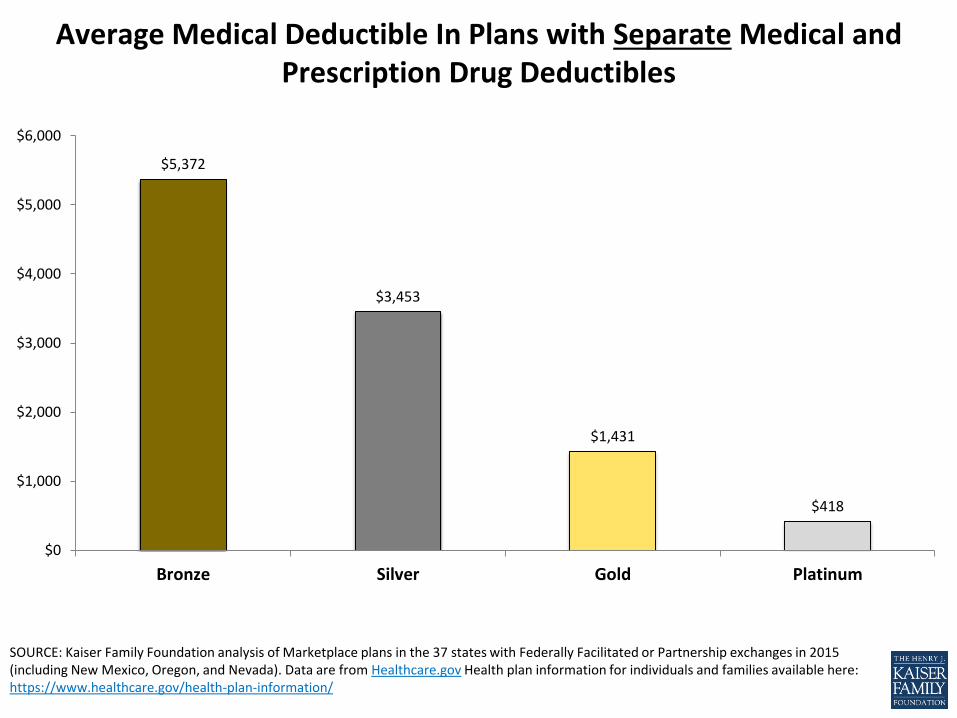
Average Medical Deductible In Plans with Separate Medical and Prescription Drug Deductibles
$5,372
$3,453
$1,431
$418
$0
$1,000
$2,000
$3,000
$4,000
$5,000
$6,000
Bronze Silver Gold Platinum
SOURCE: Kaiser Family Foundation analysis of Marketplace plans in the 37 states with Federally Facilitated or Partnership exchanges in 2015 (including New Mexico, Oregon, and Nevada). Data are from Healthcare.gov Health plan information for individuals and families available here: https://www.healthcare.gov/health-plan-information/
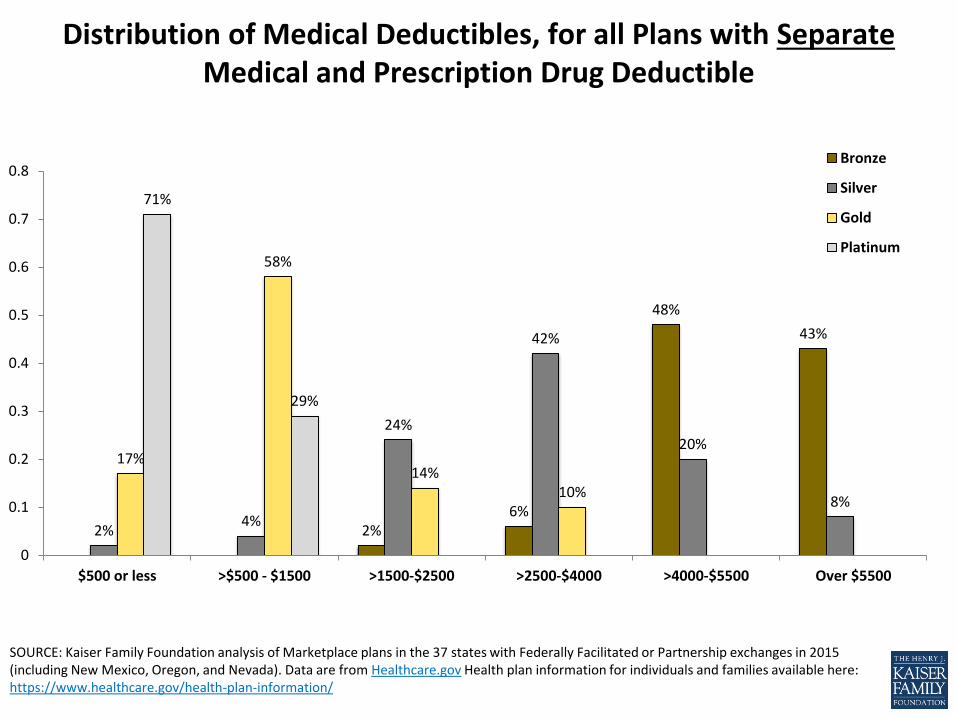
Distribution of Medical Deductibles, for all Plans with Separate Medical and Prescription Drug Deductible
2% 6%
48%
43%
2% 4%
24%
42%
20%
8%
17%
58%
14% 10%
71%
29%
0
0.1
0.2
0.3
0.4
0.5
0.6
0.7
0.8
$500 or less >$500 - $1500 >1500-$2500 >2500-$4000 >4000-$5500 Over $5500
Bronze
Silver
Gold
Platinum
SOURCE: Kaiser Family Foundation analysis of Marketplace plans in the 37 states with Federally Facilitated or Partnership exchanges in 2015 (including New Mexico, Oregon, and Nevada). Data are from Healthcare.gov Health plan information for individuals and families available here: https://www.healthcare.gov/health-plan-information/
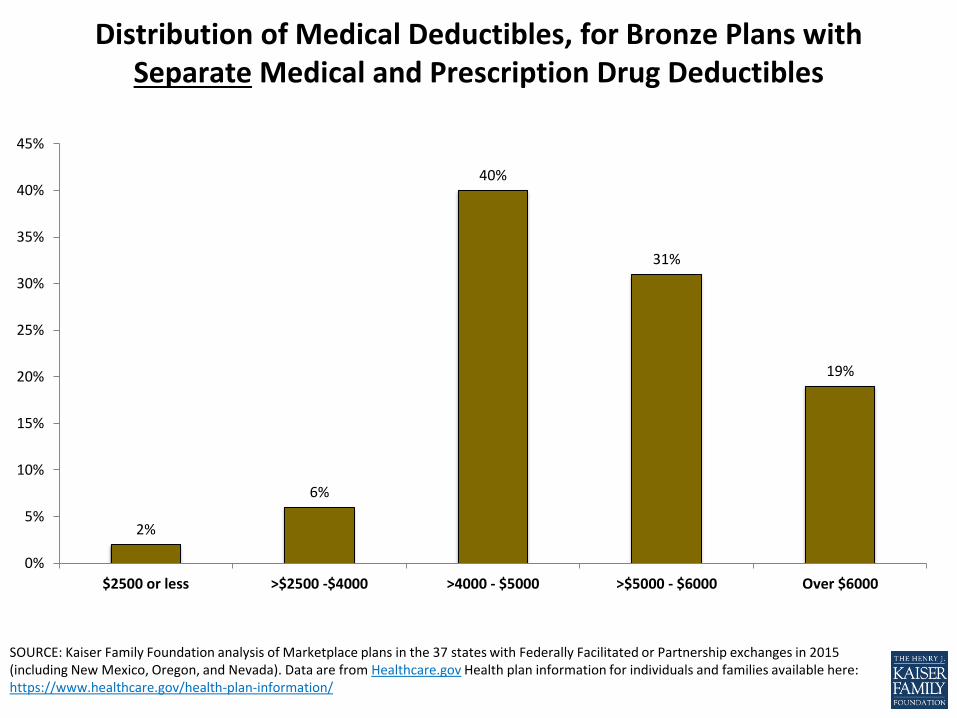
Distribution of Medical Deductibles, for Bronze Plans with Separate Medical and Prescription Drug Deductibles
2%
6%
40%
31%
19%
0%
5%
10%
15%
20%
25%
30%
35%
40%
45%
$2500 or less >$2500 -$4000 >4000 - $5000 >$5000 - $6000 Over $6000
SOURCE: Kaiser Family Foundation analysis of Marketplace plans in the 37 states with Federally Facilitated or Partnership exchanges in 2015 (including New Mexico, Oregon, and Nevada). Data are from Healthcare.gov Health plan information for individuals and families available here: https://www.healthcare.gov/health-plan-information/
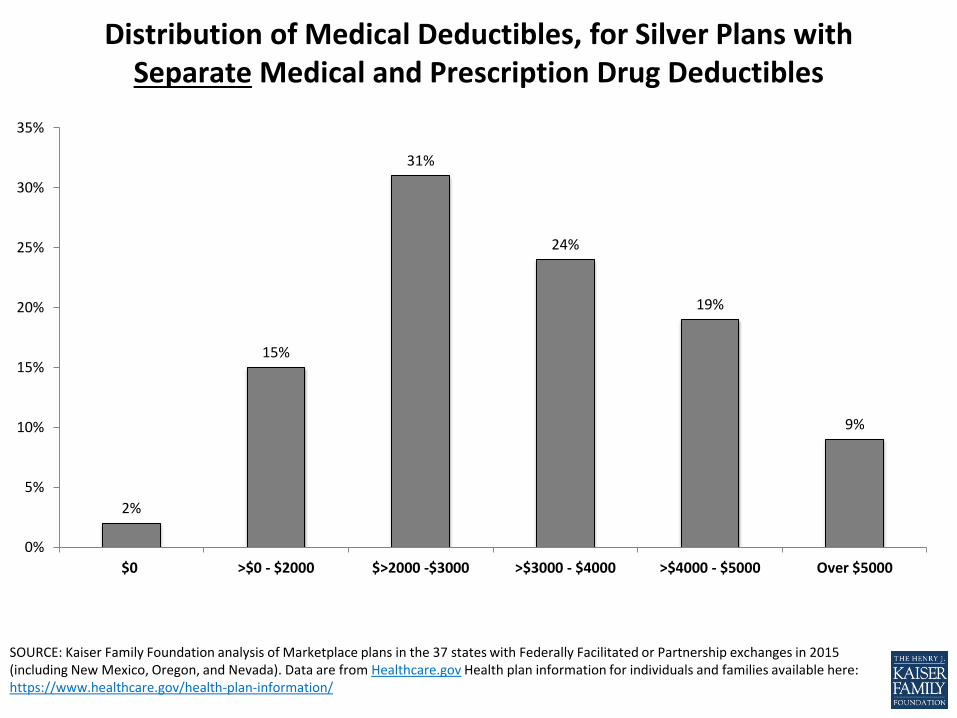
Distribution of Medical Deductibles, for Silver Plans with Separate Medical and Prescription Drug Deductibles
2%
15%
31%
24%
19%
9%
0%
5%
10%
15%
20%
25%
30%
35%
$0 >$0 - $2000 $>2000 -$3000 >$3000 - $4000 >$4000 - $5000 Over $5000
SOURCE: Kaiser Family Foundation analysis of Marketplace plans in the 37 states with Federally Facilitated or Partnership exchanges in 2015 (including New Mexico, Oregon, and Nevada). Data are from Healthcare.gov Health plan information for individuals and families available here: https://www.healthcare.gov/health-plan-information/
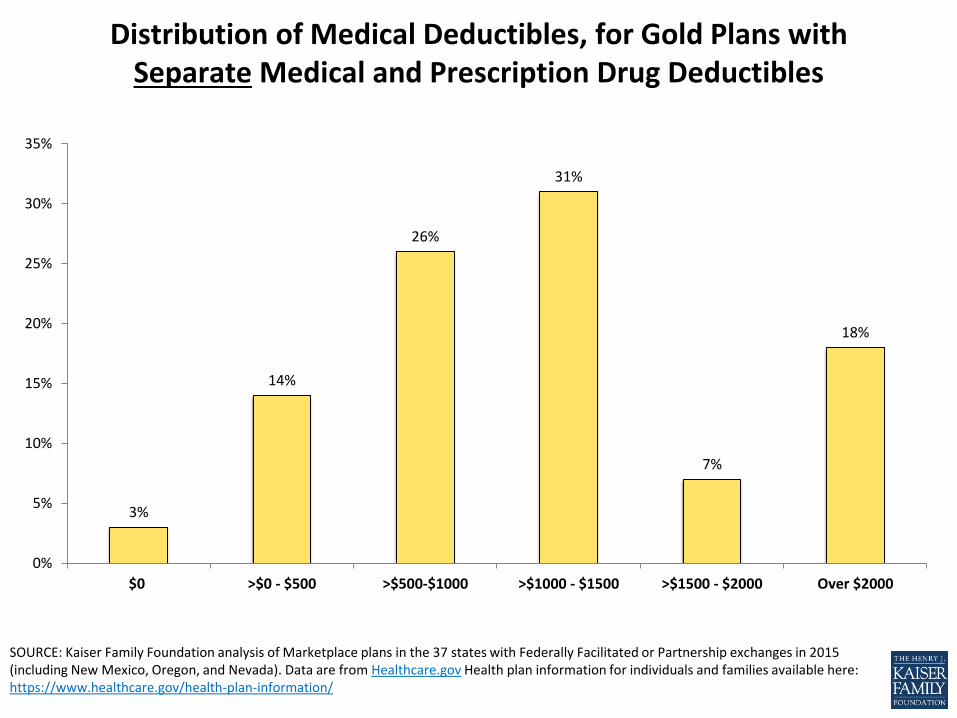
Distribution of Medical Deductibles, for Gold Plans with Separate Medical and Prescription Drug Deductibles
3%
14%
26%
31%
7%
18%
0%
5%
10%
15%
20%
25%
30%
35%
$0 >$0 - $500 >$500-$1000 >$1000 - $1500 >$1500 - $2000 Over $2000
SOURCE: Kaiser Family Foundation analysis of Marketplace plans in the 37 states with Federally Facilitated or Partnership exchanges in 2015 (including New Mexico, Oregon, and Nevada). Data are from Healthcare.gov Health plan information for individuals and families available here: https://www.healthcare.gov/health-plan-information/
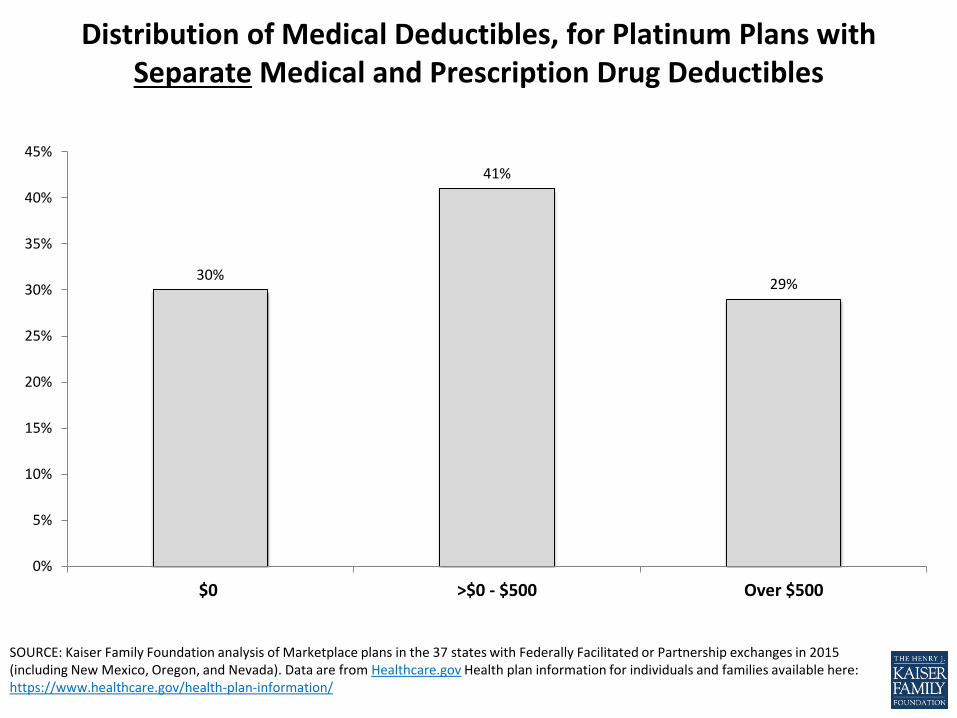
Distribution of Medical Deductibles, for Platinum Plans with Separate Medical and Prescription Drug Deductibles
30%
41%
29%
0%
5%
10%
15%
20%
25%
30%
35%
40%
45%
$0 >$0 - $500 Over $500

Separate Drug Deductibles
SOURCE: Kaiser Family Foundation analysis of Marketplace plans in the 37 states with Federally Facilitated or Partnership exchanges in 2015 (including New Mexico, Oregon, and Nevada). Data are from Healthcare.gov Health plan information for individuals and families available here: https://www.healthcare.gov/health-plan-information/
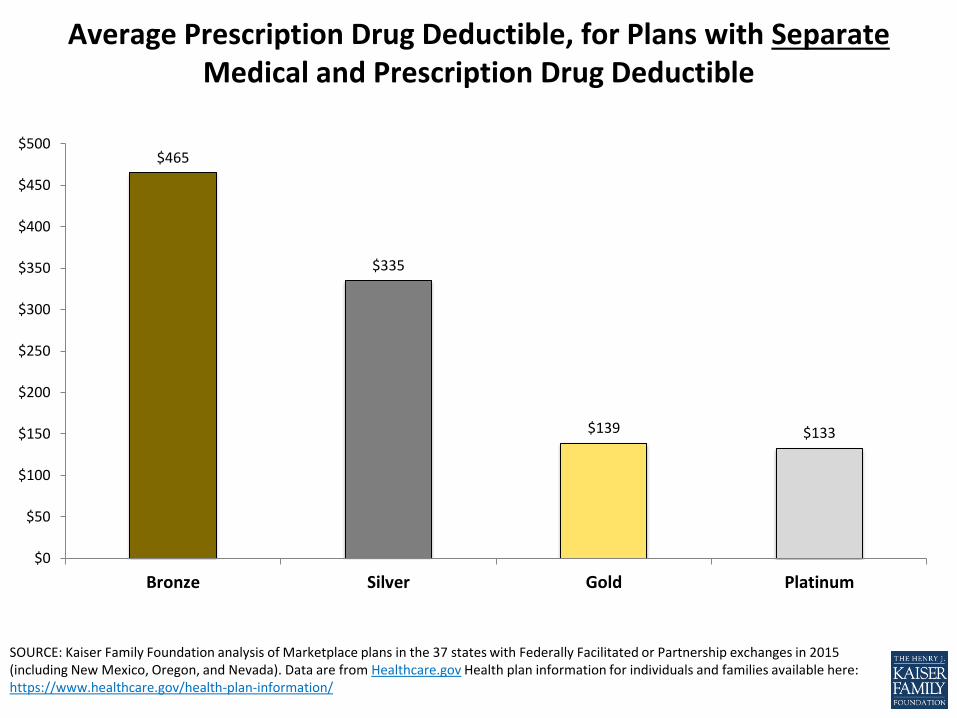
Average Prescription Drug Deductible, for Plans with Separate Medical and Prescription Drug Deductible
$465
$335
$139 $133
$0
$50
$100
$150
$200
$250
$300
$350
$400
$450
$500
Bronze Silver Gold Platinum
SOURCE: Kaiser Family Foundation analysis of Marketplace plans in the 37 states with Federally Facilitated or Partnership exchanges in 2015 (including New Mexico, Oregon, and Nevada). Data are from Healthcare.gov Health plan information for individuals and families available here: https://www.healthcare.gov/health-plan-information/
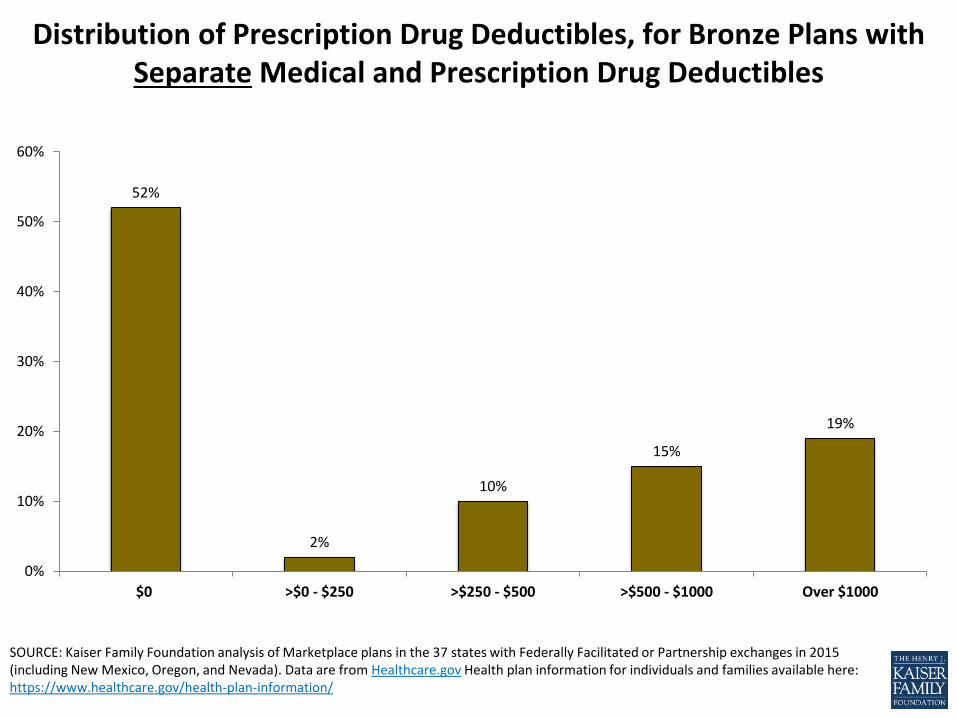
Distribution of Prescription Drug Deductibles, for Bronze Plans with Separate Medical and Prescription Drug Deductibles
52%
2%
10%
15%
19%
0%
10%
20%
30%
40%
50%
60%
$0 >$0 - $250 >$250 - $500 >$500 - $1000 Over $1000
SOURCE: Kaiser Family Foundation analysis of Marketplace plans in the 37 states with Federally Facilitated or Partnership exchanges in 2015 (including New Mexico, Oregon, and Nevada). Data are from Healthcare.gov Health plan information for individuals and families available here: https://www.healthcare.gov/health-plan-information/
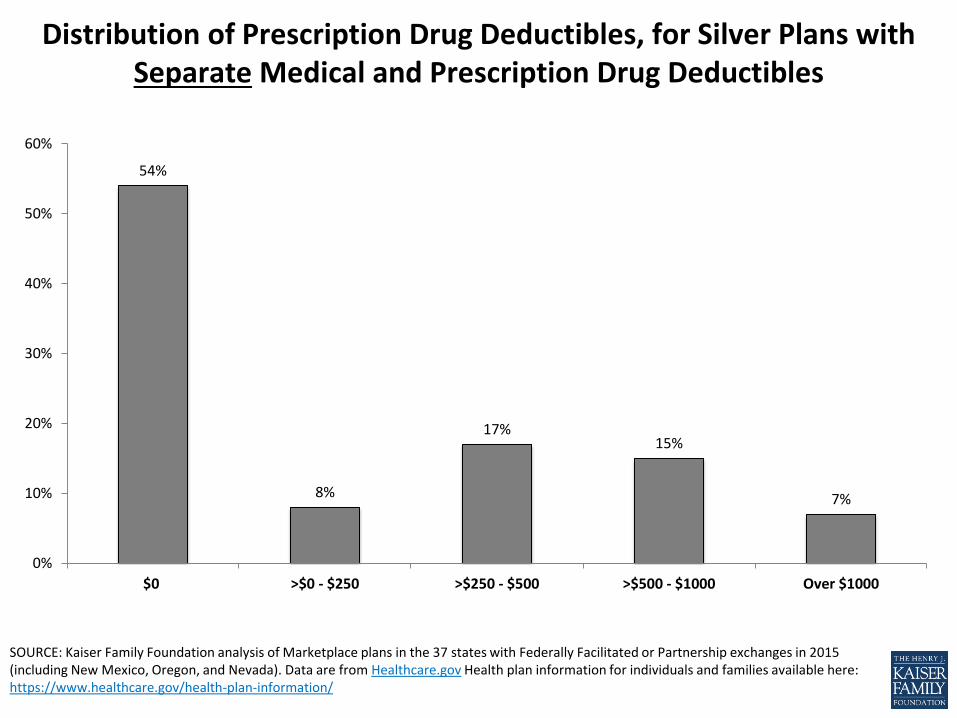
Distribution of Prescription Drug Deductibles, for Silver Plans with Separate Medical and Prescription Drug Deductibles
54%
8%
17% 15%
7%
0%
10%
20%
30%
40%
50%
60%
$0 >$0 - $250 >$250 - $500 >$500 - $1000 Over $1000
SOURCE: Kaiser Family Foundation analysis of Marketplace plans in the 37 states with Federally Facilitated or Partnership exchanges in 2015 (including New Mexico, Oregon, and Nevada). Data are from Healthcare.gov Health plan information for individuals and families available here: https://www.healthcare.gov/health-plan-information/
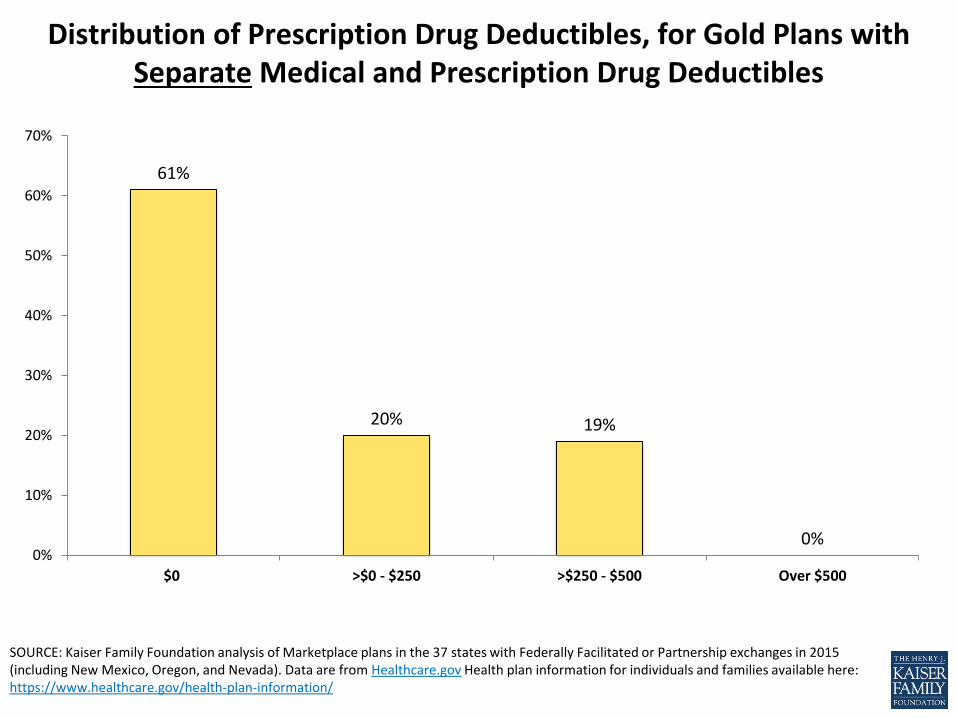
Distribution of Prescription Drug Deductibles, for Gold Plans with Separate Medical and Prescription Drug Deductibles
61%
20% 19%
0% 0%
10%
20%
30%
40%
50%
60%
70%
$0 >$0 - $250 >$250 - $500 Over $500
SOURCE: Kaiser Family Foundation analysis of Marketplace plans in the 37 states with Federally Facilitated or Partnership exchanges in 2015 (including New Mexico, Oregon, and Nevada). Data are from Healthcare.gov Health plan information for individuals and families available here: https://www.healthcare.gov/health-plan-information/
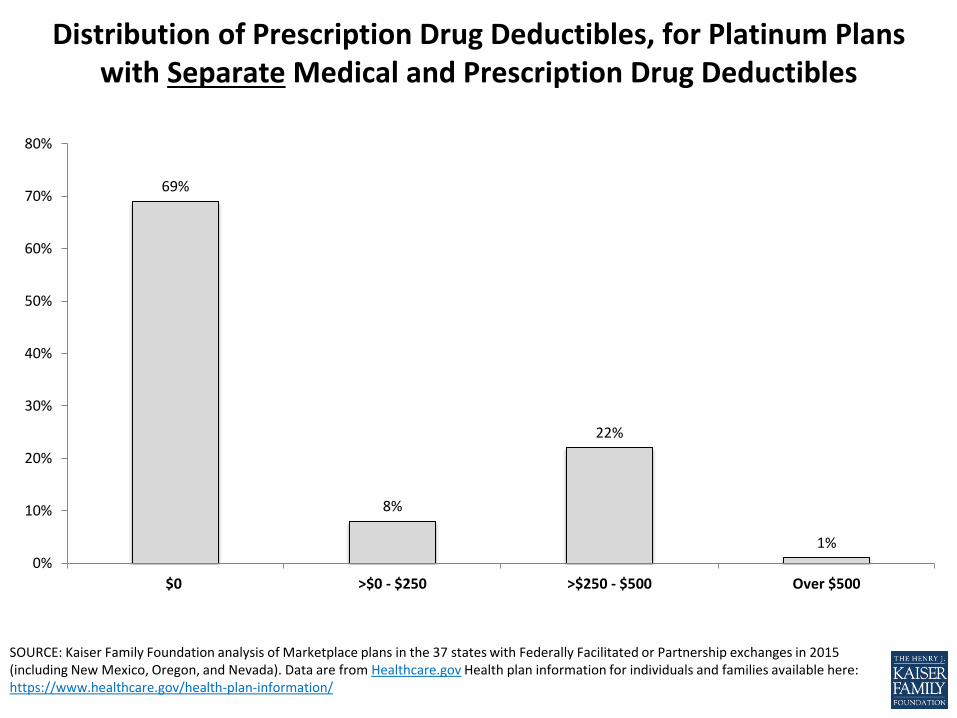
Distribution of Prescription Drug Deductibles, for Platinum Plans with Separate Medical and Prescription Drug Deductibles
69%
8%
22%
1%
0%
10%
20%
30%
40%
50%
60%
70%
80%
$0 >$0 - $250 >$250 - $500 Over $500

Inpatient Facility Cost Sharing
SOURCE: Kaiser Family Foundation analysis of Marketplace plans in the 37 states with Federally Facilitated or Partnership exchanges in 2015 (including New Mexico, Oregon, and Nevada). Data are from Healthcare.gov Health plan information for individuals and families available here: https://www.healthcare.gov/health-plan-information/
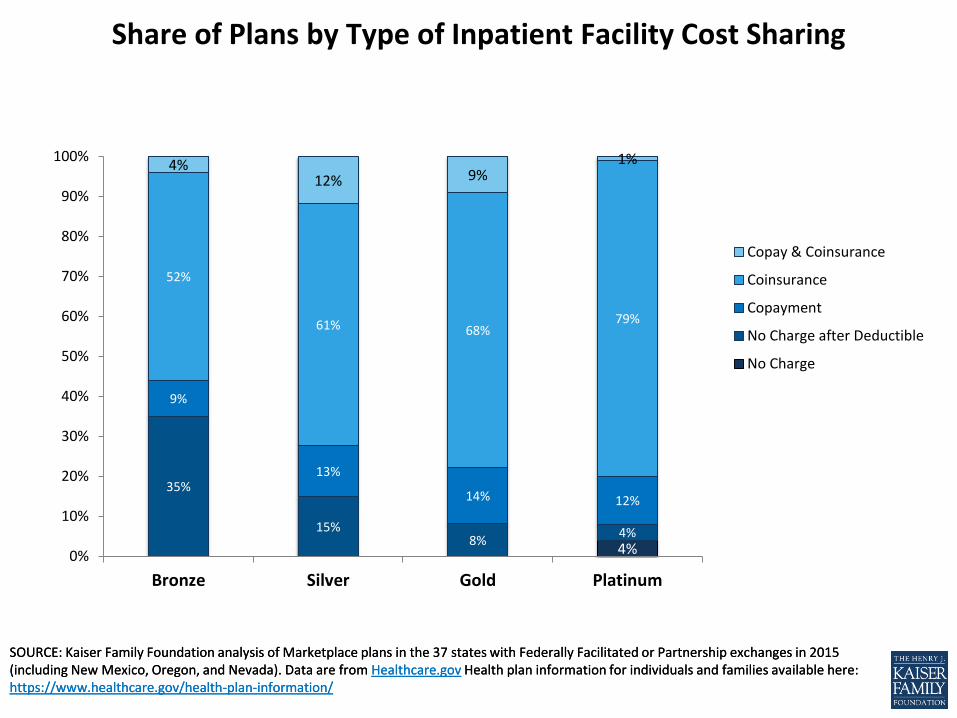
Share of Plans by Type of Inpatient Facility Cost Sharing
4%
35%
15% 8%
4%
9%
13%
14% 12%
52%
61% 68% 79%
4% 12% 9%
1%
0%
10%
20%
30%
40%
50%
60%
70%
80%
90%
100%
Bronze Silver Gold Platinum
Copay & Coinsurance
Coinsurance
Copayment
No Charge after Deductible
No Charge
SOURCE: Kaiser Family Foundation analysis of Marketplace plans in the 37 states with Federally Facilitated or Partnership exchanges in 2015 (including New Mexico, Oregon, and Nevada). Data are from Healthcare.gov Health plan information for individuals and families available here: https://www.healthcare.gov/health-plan-information/
SOURCE: Kaiser Family Foundation analysis of Marketplace plans in the 37 states with Federally Facilitated or Partnership exchanges in 2015 (including New Mexico, Oregon, and Nevada). Data are from Healthcare.gov Health plan information for individuals and families available here: https://www.healthcare.gov/health-plan-information/
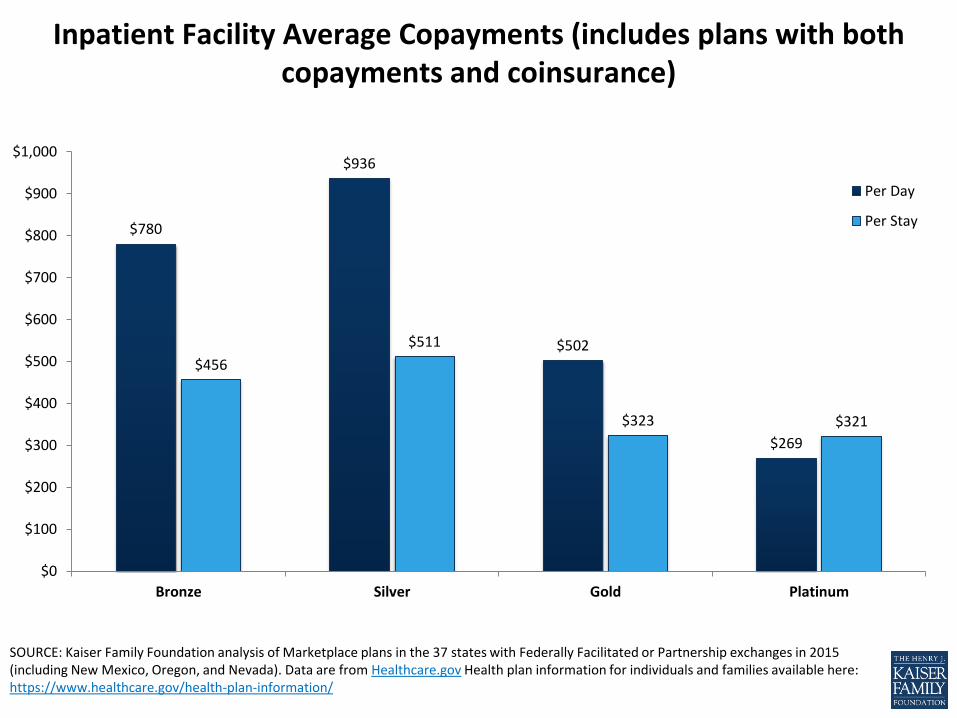
Inpatient Facility Average Copayments (includes plans with both copayments and coinsurance)
$780
$936
$502
$269
$456
$511
$323 $321
$0
$100
$200
$300
$400
$500
$600
$700
$800
$900
$1,000
Bronze Silver Gold Platinum
Per Day
Per Stay
SOURCE: Kaiser Family Foundation analysis of Marketplace plans in the 37 states with Federally Facilitated or Partnership exchanges in 2015 (including New Mexico, Oregon, and Nevada). Data are from Healthcare.gov Health plan information for individuals and families available here: https://www.healthcare.gov/health-plan-information/
Distribution of Inpatient Facility Copayments
7%
49%
6%
46%
19%
77%
48%
71%
27%
44%
34%
46%
47%
17%
52%
29%
20%
2%
15%
1%
19%
3%
0% 0%
33%
2%
29%
2% 16%
0% 0%
13%
2%
17%
5% 2% 0% 0%
0%
10%
20%
30%
40%
50%
60%
70%
80%
90%
100%
Bronze perday
Bronze perstay
Silver per day Silver per stay Gold per day Gold per stay Platinum perday
Platinum perstay
Over $1000
>$750 - $1000
>$500 - $750
>$250 - $500
$250 or less
SOURCE: Kaiser Family Foundation analysis of Marketplace plans in the 37 states with Federally Facilitated or Partnership exchanges in 2015 (including New Mexico, Oregon, and Nevada). Data are from Healthcare.gov Health plan information for individuals and families available here: https://www.healthcare.gov/health-plan-information/
Average Inpatient Facility Coinsurance Rate
32%
28%
20% 20%
0%
5%
10%
15%
20%
25%
30%
35%
Bronze Silver Gold Platinum
SOURCE: Kaiser Family Foundation analysis of Marketplace plans in the 37 states with Federally Facilitated or Partnership exchanges in 2015 (including New Mexico, Oregon, and Nevada). Data are from Healthcare.gov Health plan information for individuals and families available here: https://www.healthcare.gov/health-plan-information/
Distribution of Inpatient Facility Coinsurance Rates
5% 7% 15%
23%
52%
73%
84% 74%
25%
8%
1%
18% 12%
1% 3% 1%
0%
10%
20%
30%
40%
50%
60%
70%
80%
90%
100%
Bronze Silver Gold Platinum
Over 50%
>40%-50%
>30% - 40%
>20% - 30%
20% or less
Inpatient Physicians Cost Sharing
SOURCE: Kaiser Family Foundation analysis of Marketplace plans in the 37 states with Federally Facilitated or Partnership exchanges in 2015 (including New Mexico, Oregon, and Nevada). Data are from Healthcare.gov Health plan information for individuals and families available here: https://www.healthcare.gov/health-plan-information/
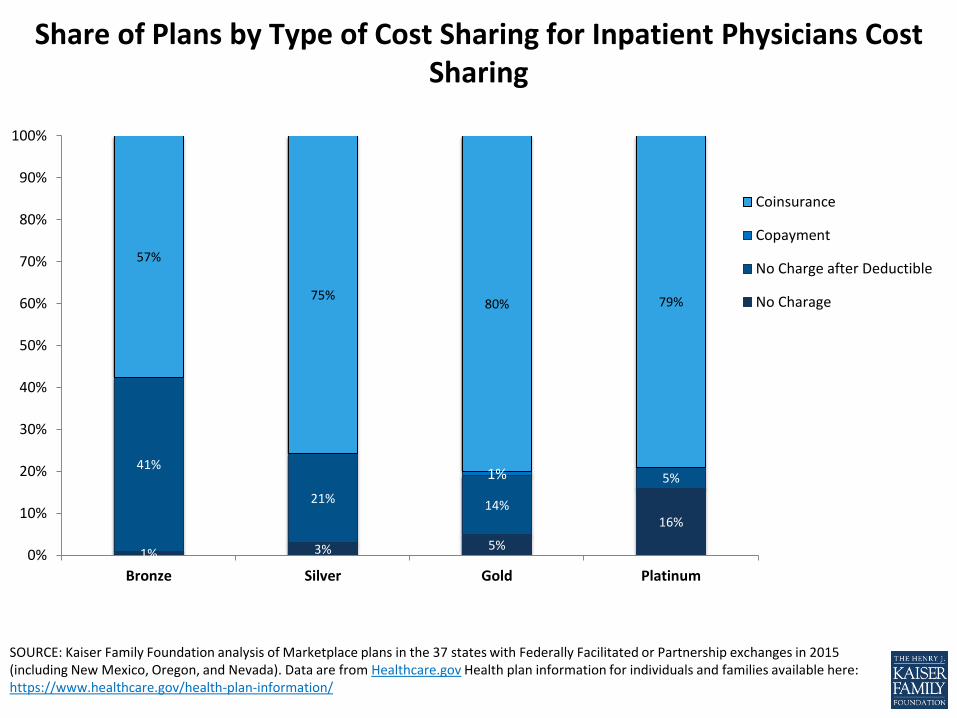
Share of Plans by Type of Cost Sharing for Inpatient Physicians Cost Sharing
1% 3% 5%
16%
41%
21% 14%
5% 1%
57%
75% 80% 79%
0%
10%
20%
30%
40%
50%
60%
70%
80%
90%
100%
Bronze Silver Gold Platinum
Coinsurance
Copayment
No Charge after Deductible
No Charage
SOURCE: Kaiser Family Foundation analysis of Marketplace plans in the 37 states with Federally Facilitated or Partnership exchanges in 2015 (including New Mexico, Oregon, and Nevada). Data are from Healthcare.gov Health plan information for individuals and families available here: https://www.healthcare.gov/health-plan-information/
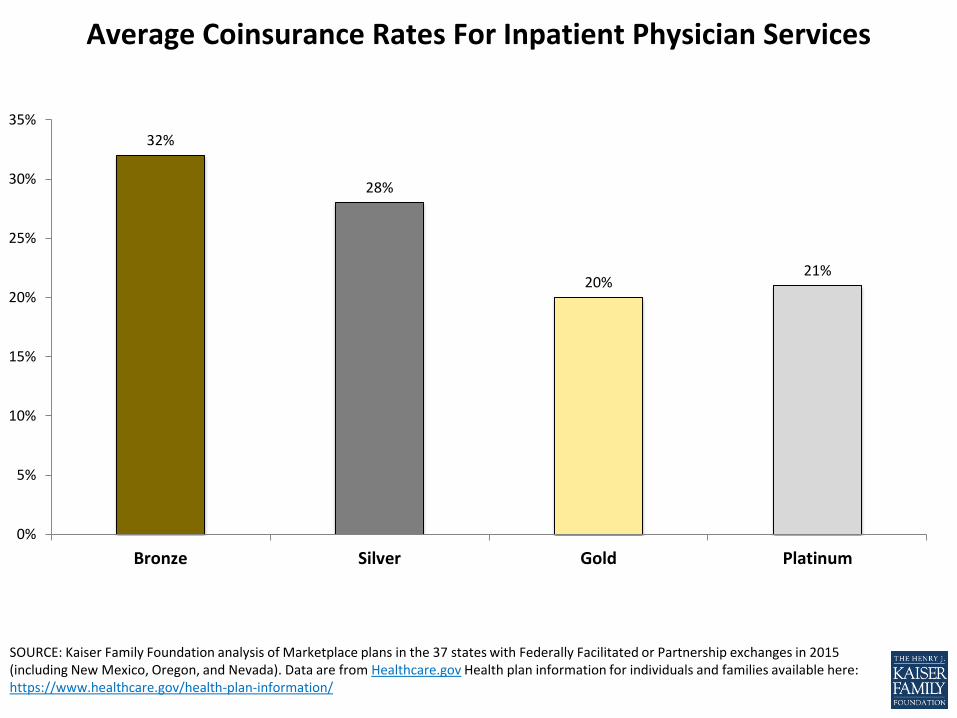
Average Coinsurance Rates For Inpatient Physician Services
32%
28%
20% 21%
0%
5%
10%
15%
20%
25%
30%
35%
Bronze Silver Gold Platinum
SOURCE: Kaiser Family Foundation analysis of Marketplace plans in the 37 states with Federally Facilitated or Partnership exchanges in 2015 (including New Mexico, Oregon, and Nevada). Data are from Healthcare.gov Health plan information for individuals and families available here: https://www.healthcare.gov/health-plan-information/
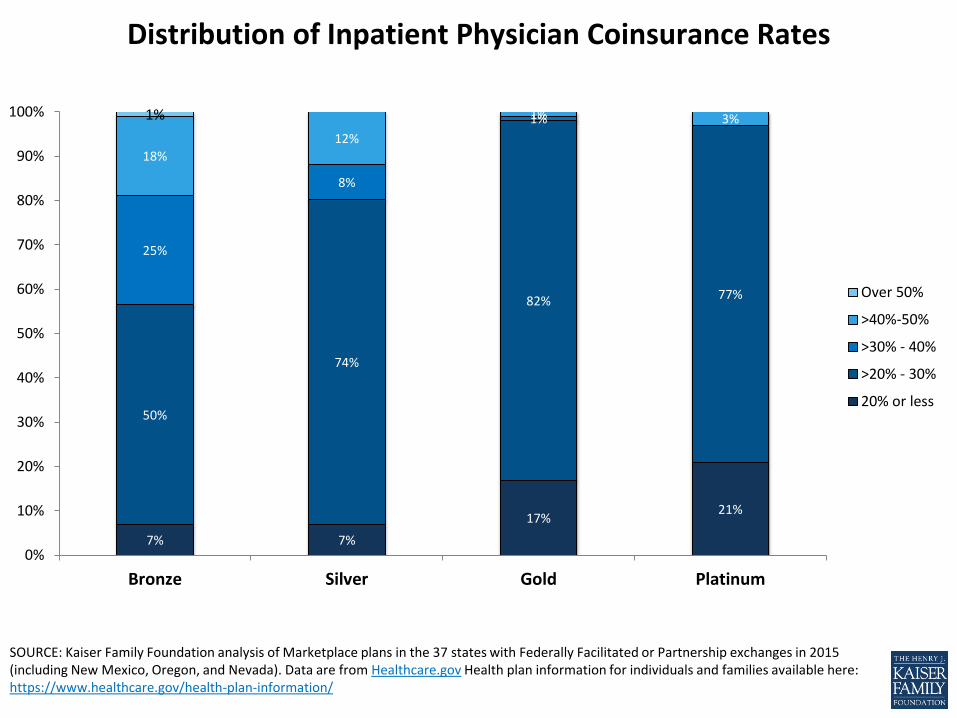
Distribution of Inpatient Physician Coinsurance Rates
7% 7%
17% 21%
50%
74%
82% 77%
25%
8%
1%
18%
12%
1% 3% 1%
0%
10%
20%
30%
40%
50%
60%
70%
80%
90%
100%
Bronze Silver Gold Platinum
Over 50%
>40%-50%
>30% - 40%
>20% - 30%
20% or less
Specialist and Primary Care Physician Office Visits

SOURCE: Kaiser Family Foundation analysis of Marketplace plans in the 37 states with Federally Facilitated or Partnership exchanges in 2015 (including New Mexico, Oregon, and Nevada). Data are from Healthcare.gov Health plan information for individuals and families available here: https://www.healthcare.gov/health-plan-information/
Share of Plans by Type of Cost Sharing for Primary Care Physician Visits (deductible may apply first)
1% 2% 1%
32%
10% 4%
39% 73% 83% 92%
24%
13% 10%
6% 6% 3% 2%
0%
10%
20%
30%
40%
50%
60%
70%
80%
90%
100%
Bronze Silver Gold Platinum
Copay & Coinsurance
Coinsurance
Copayment
No Charge after Deductible
No Charage
SOURCE: Kaiser Family Foundation analysis of Marketplace plans in the 37 states with Federally Facilitated or Partnership exchanges in 2015 (including New Mexico, Oregon, and Nevada). Data are from Healthcare.gov Health plan information for individuals and families available here: https://www.healthcare.gov/health-plan-information/
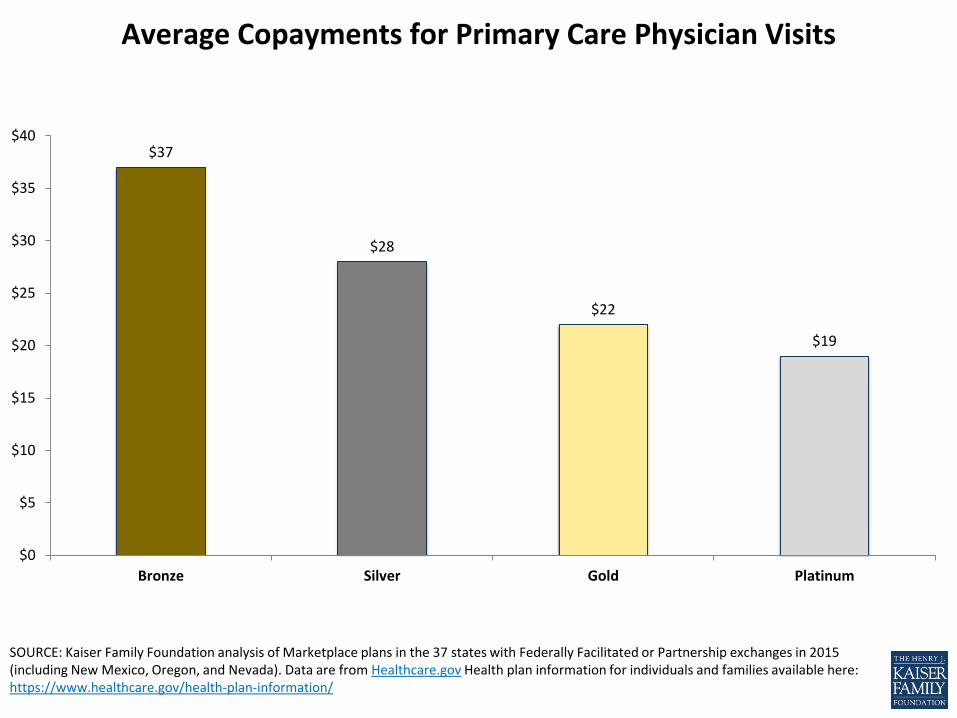
Average Copayments for Primary Care Physician Visits
$37
$28
$22
$19
$0
$5
$10
$15
$20
$25
$30
$35
$40
Bronze Silver Gold Platinum
SOURCE: Kaiser Family Foundation analysis of Marketplace plans in the 37 states with Federally Facilitated or Partnership exchanges in 2015 (including New Mexico, Oregon, and Nevada). Data are from Healthcare.gov Health plan information for individuals and families available here: https://www.healthcare.gov/health-plan-information/
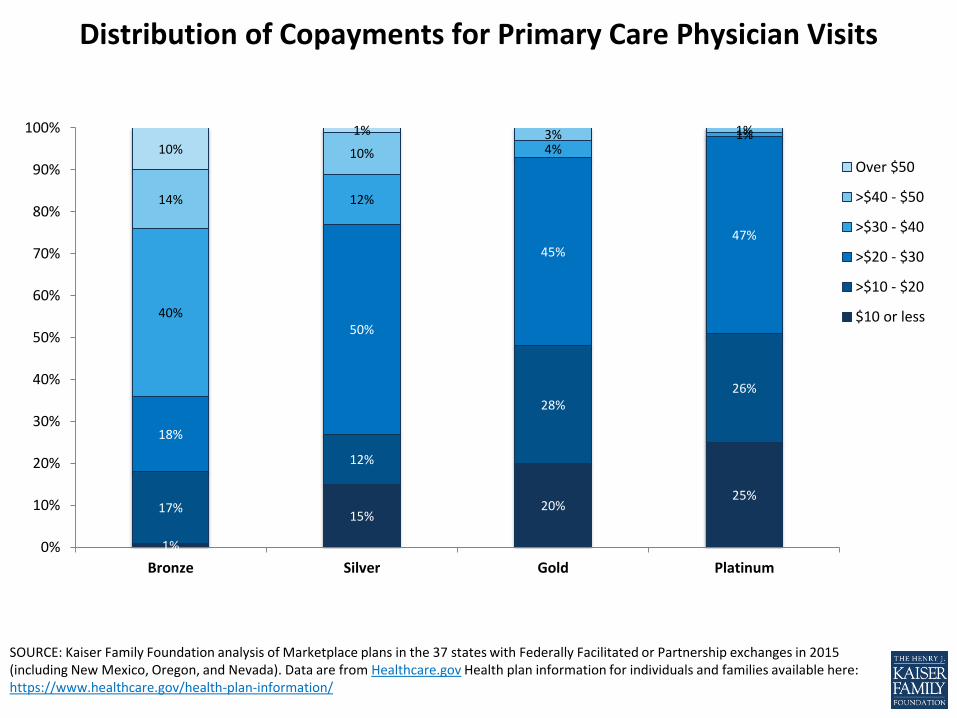
Distribution of Copayments for Primary Care Physician Visits
1%
15% 20%
25% 17%
12%
28% 26%
18%
50%
45% 47%
40%
12%
4% 1%
14%
10%
3% 1%
10%
1%
0%
10%
20%
30%
40%
50%
60%
70%
80%
90%
100%
Bronze Silver Gold Platinum
Over $50
>$40 - $50
>$30 - $40
>$20 - $30
>$10 - $20
$10 or less
SOURCE: Kaiser Family Foundation analysis of Marketplace plans in the 37 states with Federally Facilitated or Partnership exchanges in 2015 (including New Mexico, Oregon, and Nevada). Data are from Healthcare.gov Health plan information for individuals and families available here: https://www.healthcare.gov/health-plan-information/
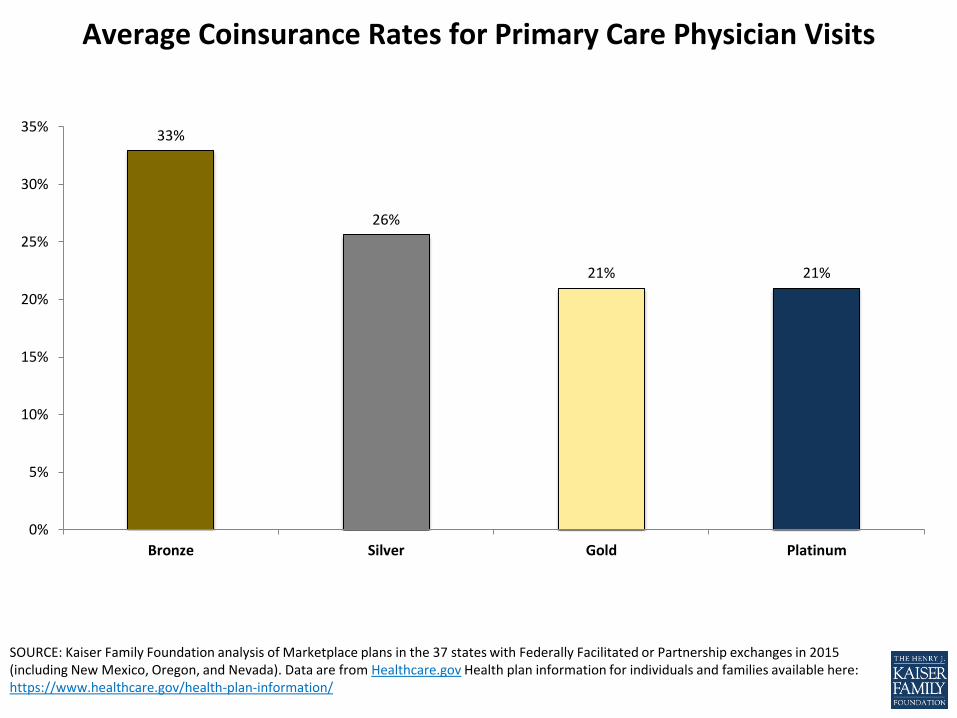
Average Coinsurance Rates for Primary Care Physician Visits
33%
26%
21% 21%
0%
5%
10%
15%
20%
25%
30%
35%
Bronze Silver Gold Platinum
SOURCE: Kaiser Family Foundation analysis of Marketplace plans in the 37 states with Federally Facilitated or Partnership exchanges in 2015 (including New Mexico, Oregon, and Nevada). Data are from Healthcare.gov Health plan information for individuals and families available here: https://www.healthcare.gov/health-plan-information/
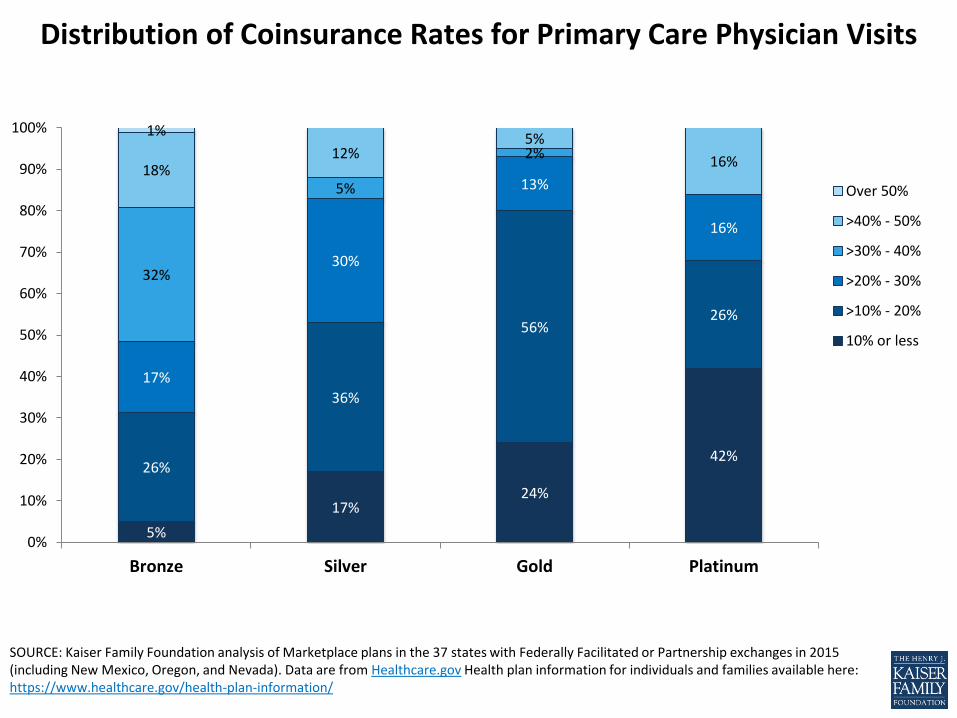
Distribution of Coinsurance Rates for Primary Care Physician Visits
5%
17% 24%
42% 26%
36%
56% 26%
17%
30%
13%
16%
32%
5%
2% 18%
12% 5%
16%
1%
0%
10%
20%
30%
40%
50%
60%
70%
80%
90%
100%
Bronze Silver Gold Platinum
Over 50%
>40% - 50%
>30% - 40%
>20% - 30%
>10% - 20%
10% or less
SOURCE: Kaiser Family Foundation analysis of Marketplace plans in the 37 states with Federally Facilitated or Partnership exchanges in 2015 (including New Mexico, Oregon, and Nevada). Data are from Healthcare.gov Health plan information for individuals and families available here: https://www.healthcare.gov/health-plan-information/
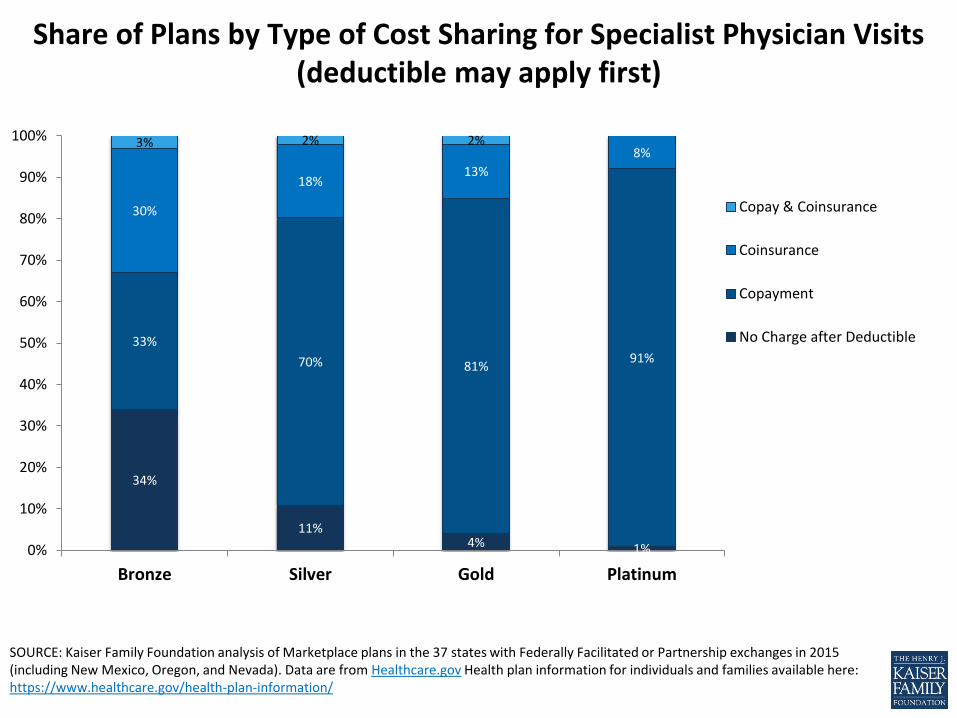
Share of Plans by Type of Cost Sharing for Specialist Physician Visits (deductible may apply first)
34%
11% 4% 1%
33%
70% 81% 91%
30%
18% 13%
8% 3% 2% 2%
0%
10%
20%
30%
40%
50%
60%
70%
80%
90%
100%
Bronze Silver Gold Platinum
Copay & Coinsurance
Coinsurance
Copayment
No Charge after Deductible
SOURCE: Kaiser Family Foundation analysis of Marketplace plans in the 37 states with Federally Facilitated or Partnership exchanges in 2015 (including New Mexico, Oregon, and Nevada). Data are from Healthcare.gov Health plan information for individuals and families available here: https://www.healthcare.gov/health-plan-information/
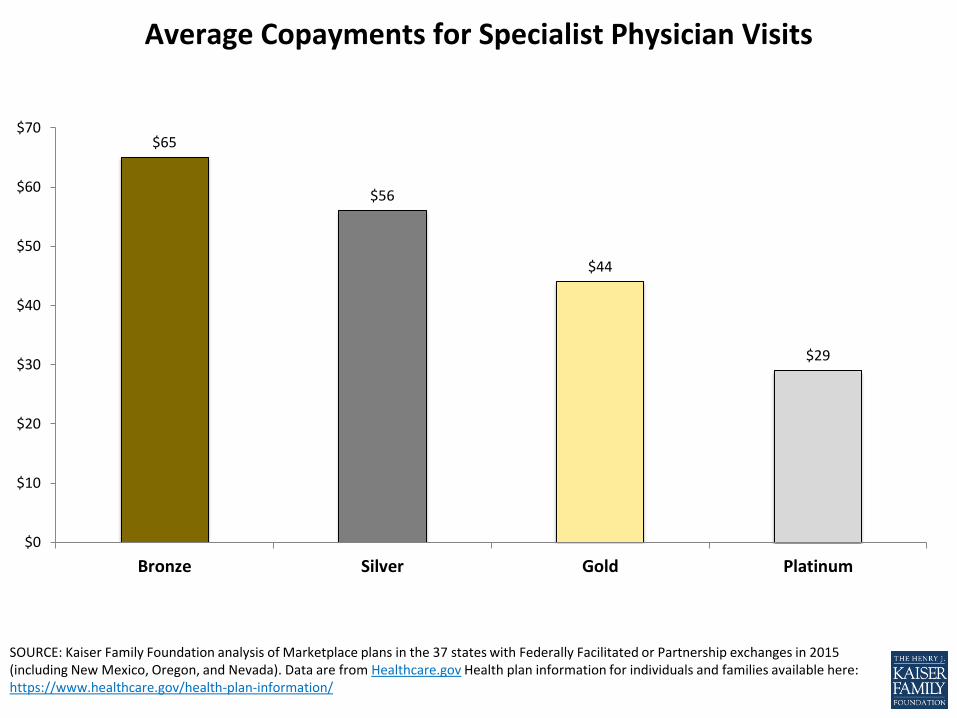
Average Copayments for Specialist Physician Visits
$65
$56
$44
$29
$0
$10
$20
$30
$40
$50
$60
$70
Bronze Silver Gold Platinum
SOURCE: Kaiser Family Foundation analysis of Marketplace plans in the 37 states with Federally Facilitated or Partnership exchanges in 2015 (including New Mexico, Oregon, and Nevada). Data are from Healthcare.gov Health plan information for individuals and families available here: https://www.healthcare.gov/health-plan-information/
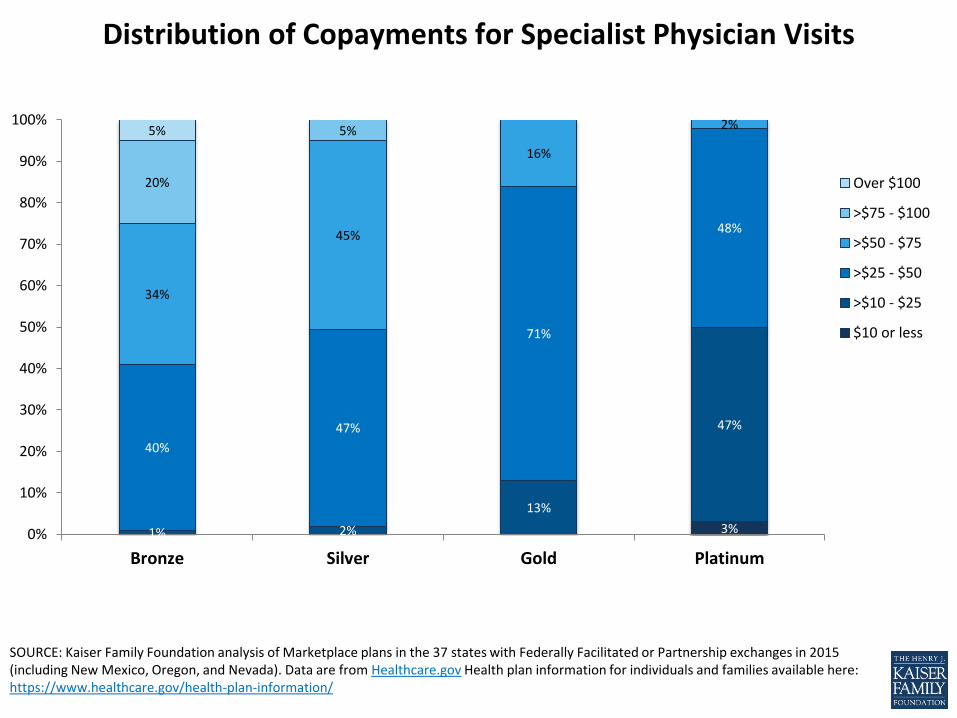
Distribution of Copayments for Specialist Physician Visits
3% 1% 2%
13%
47%
40%
47%
71%
48%
34%
45%
16%
2%
20%
5% 5%
0%
10%
20%
30%
40%
50%
60%
70%
80%
90%
100%
Bronze Silver Gold Platinum
Over $100
>$75 - $100
>$50 - $75
>$25 - $50
>$10 - $25
$10 or less
SOURCE: Kaiser Family Foundation analysis of Marketplace plans in the 37 states with Federally Facilitated or Partnership exchanges in 2015 (including New Mexico, Oregon, and Nevada). Data are from Healthcare.gov Health plan information for individuals and families available here: https://www.healthcare.gov/health-plan-information/
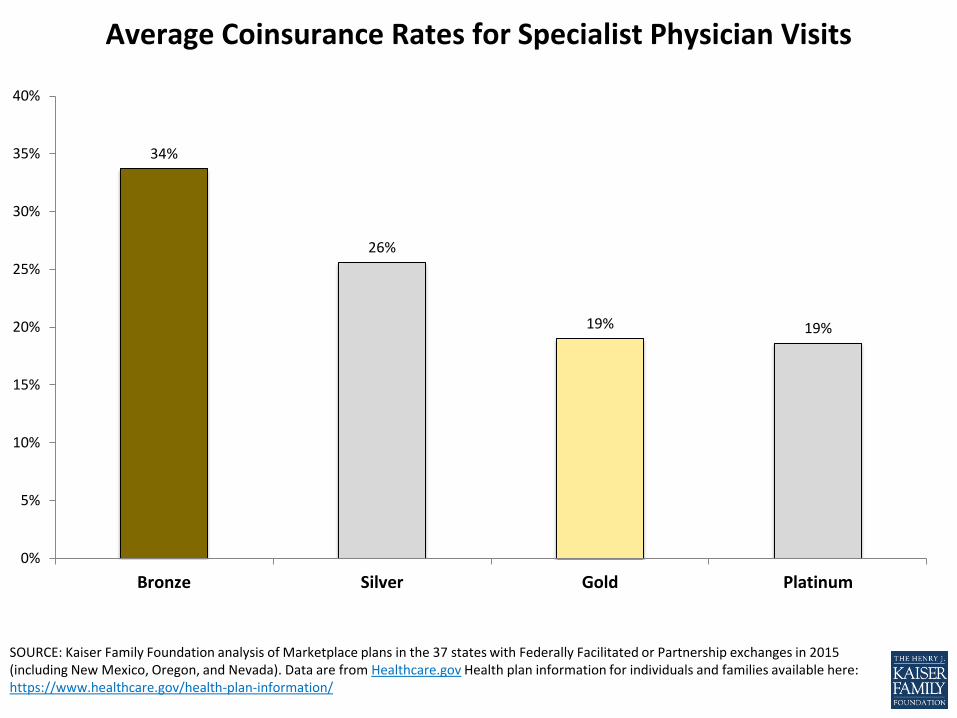
Average Coinsurance Rates for Specialist Physician Visits
34%
26%
19% 19%
0%
5%
10%
15%
20%
25%
30%
35%
40%
Bronze Silver Gold Platinum
SOURCE: Kaiser Family Foundation analysis of Marketplace plans in the 37 states with Federally Facilitated or Partnership exchanges in 2015 (including New Mexico, Oregon, and Nevada). Data are from Healthcare.gov Health plan information for individuals and families available here: https://www.healthcare.gov/health-plan-information/
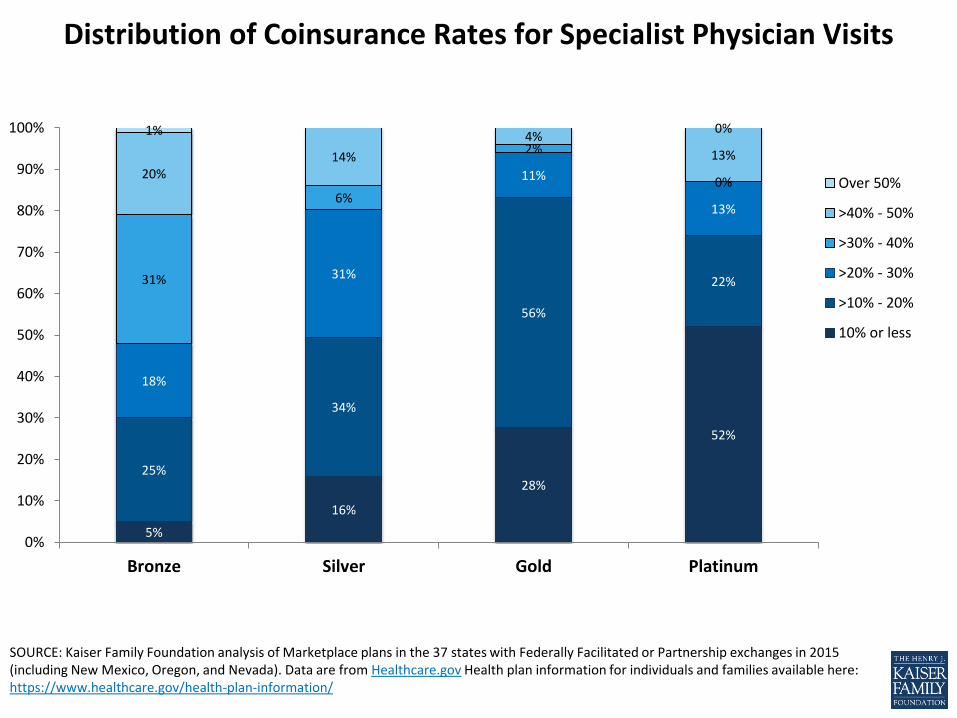
Distribution of Coinsurance Rates for Specialist Physician Visits
5%
16%
28%
52%
25%
34%
56%
22%
18%
31%
11%
13%
31%
6%
2%
0% 20%
14%
4%
13%
1% 0%
0%
10%
20%
30%
40%
50%
60%
70%
80%
90%
100%
Bronze Silver Gold Platinum
Over 50%
>40% - 50%
>30% - 40%
>20% - 30%
>10% - 20%
10% or less

Prescription Drug Cost Sharing
SOURCE: Kaiser Family Foundation analysis of Marketplace plans in the 37 states with Federally Facilitated or Partnership exchanges in 2015 (including New Mexico, Oregon, and Nevada). Data are from Healthcare.gov Health plan information for individuals and families available here: https://www.healthcare.gov/health-plan-information/
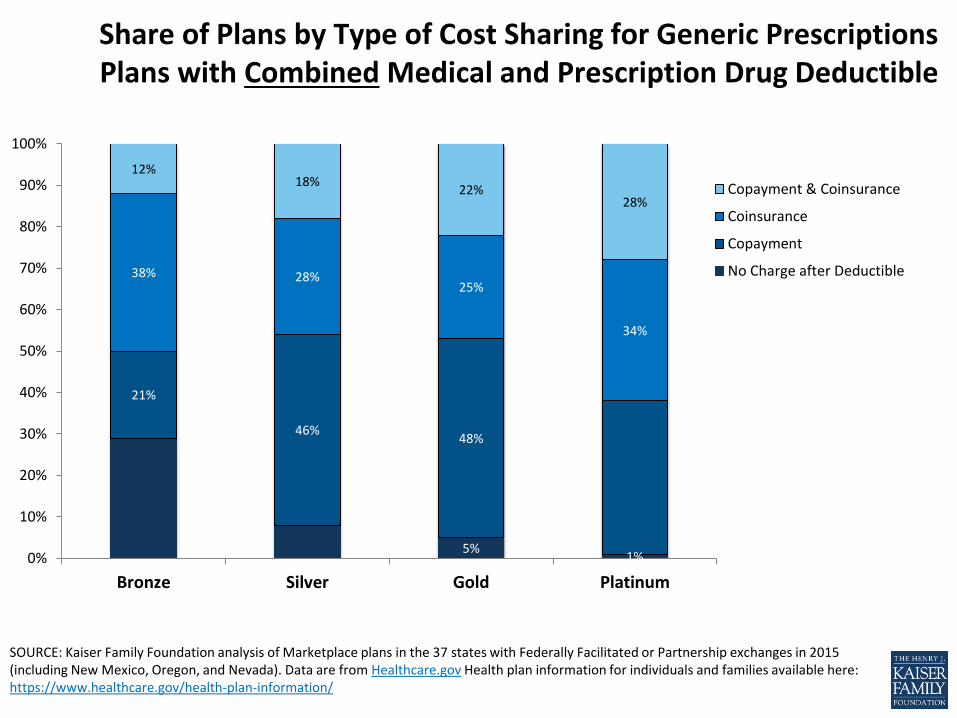
Share of Plans by Type of Cost Sharing for Generic Prescriptions Plans with Combined Medical and Prescription Drug Deductible
5% 1%
21%
46% 48%
38% 28% 25%
34%
12% 18%
22% 28%
0%
10%
20%
30%
40%
50%
60%
70%
80%
90%
100%
Bronze Silver Gold Platinum
Copayment & Coinsurance
Coinsurance
Copayment
No Charge after Deductible
SOURCE: Kaiser Family Foundation analysis of Marketplace plans in the 37 states with Federally Facilitated or Partnership exchanges in 2015 (including New Mexico, Oregon, and Nevada). Data are from Healthcare.gov Health plan information for individuals and families available here: https://www.healthcare.gov/health-plan-information/
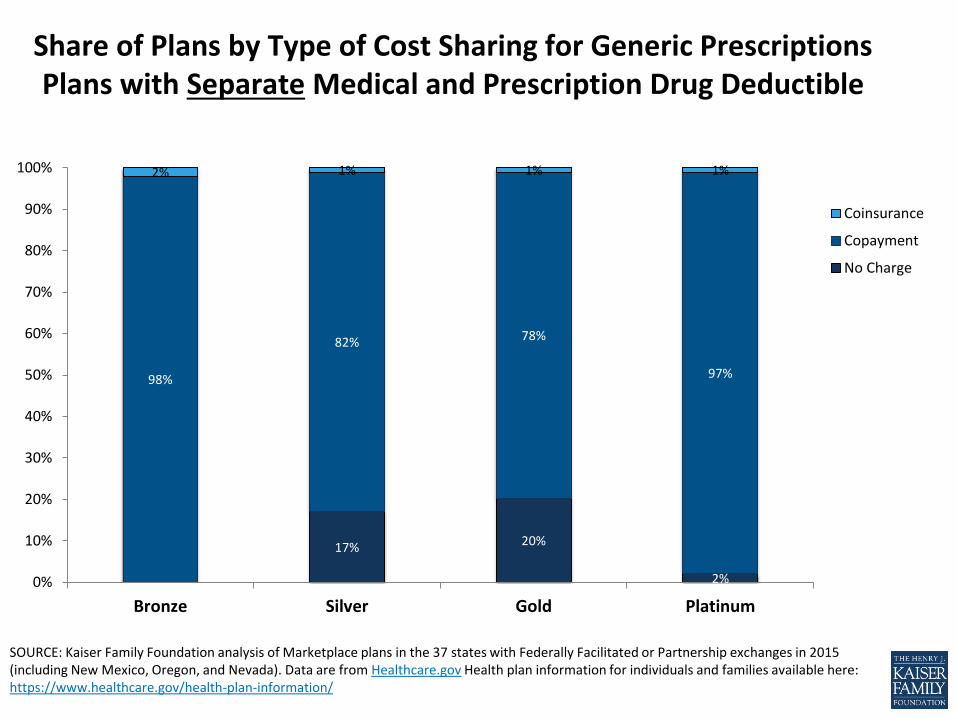
Share of Plans by Type of Cost Sharing for Generic Prescriptions Plans with Separate Medical and Prescription Drug Deductible
17% 20%
2%
98%
82% 78%
97%
2% 1% 1% 1%
0%
10%
20%
30%
40%
50%
60%
70%
80%
90%
100%
Bronze Silver Gold Platinum
Coinsurance
Copayment
No Charge
SOURCE: Kaiser Family Foundation analysis of Marketplace plans in the 37 states with Federally Facilitated or Partnership exchanges in 2015 (including New Mexico, Oregon, and Nevada). Data are from Healthcare.gov Health plan information for individuals and families available here: https://www.healthcare.gov/health-plan-information/
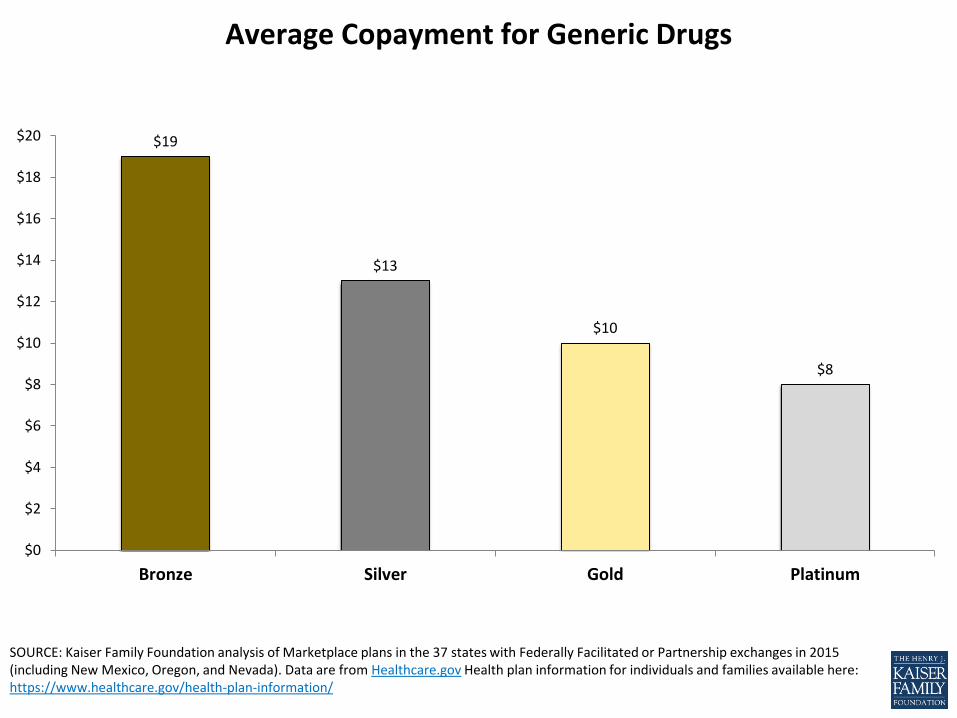
Average Copayment for Generic Drugs
$19
$13
$10
$8
$0
$2
$4
$6
$8
$10
$12
$14
$16
$18
$20
Bronze Silver Gold Platinum
SOURCE: Kaiser Family Foundation analysis of Marketplace plans in the 37 states with Federally Facilitated or Partnership exchanges in 2015 (including New Mexico, Oregon, and Nevada). Data are from Healthcare.gov Health plan information for individuals and families available here: https://www.healthcare.gov/health-plan-information/
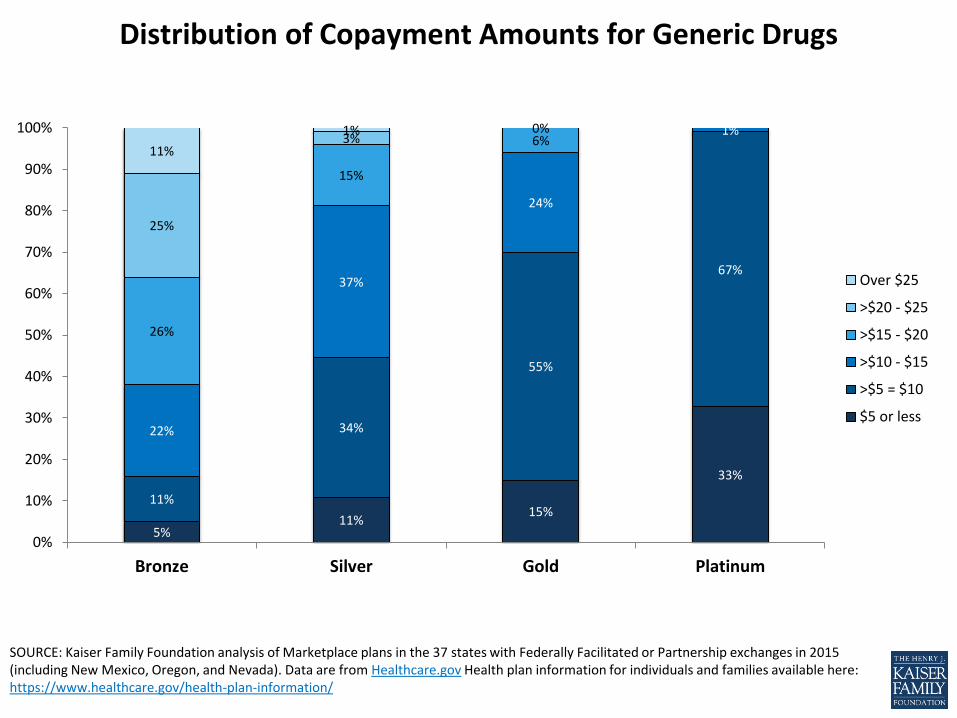
Distribution of Copayment Amounts for Generic Drugs
5% 11%
15%
33%
11%
34%
55%
67%
22%
37%
24%
1%
26%
15%
6%
25%
3% 0%
11%
1%
0%
10%
20%
30%
40%
50%
60%
70%
80%
90%
100%
Bronze Silver Gold Platinum
Over $25
>$20 - $25
>$15 - $20
>$10 - $15
>$5 = $10
$5 or less
SOURCE: Kaiser Family Foundation analysis of Marketplace plans in the 37 states with Federally Facilitated or Partnership exchanges in 2015 (including New Mexico, Oregon, and Nevada). Data are from Healthcare.gov Health plan information for individuals and families available here: https://www.healthcare.gov/health-plan-information/
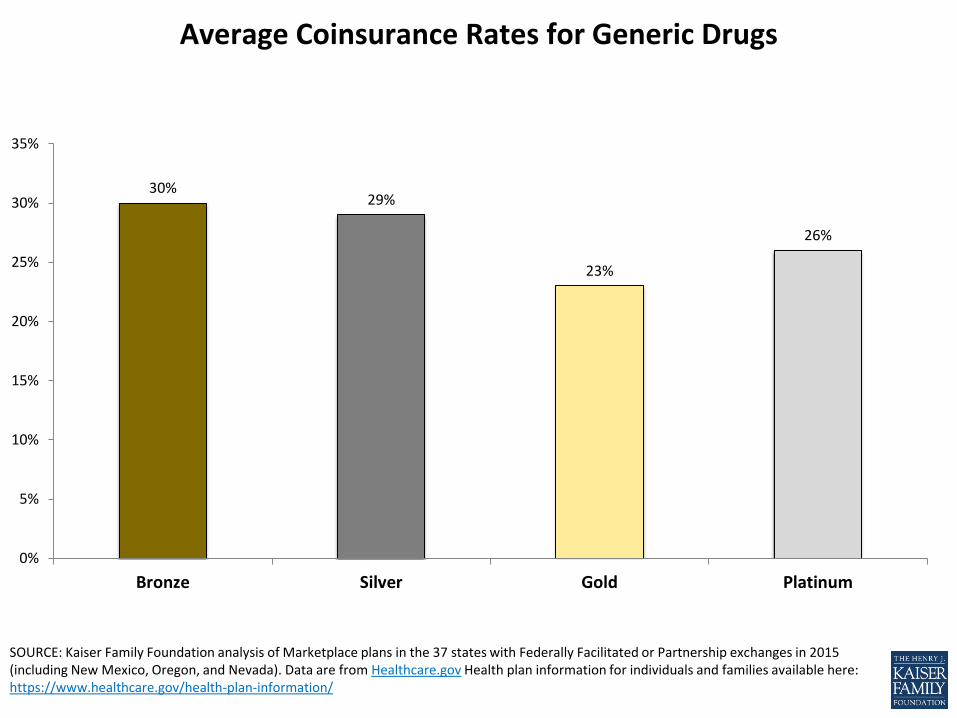
Average Coinsurance Rates for Generic Drugs
30% 29%
23%
26%
0%
5%
10%
15%
20%
25%
30%
35%
Bronze Silver Gold Platinum
SOURCE: Kaiser Family Foundation analysis of Marketplace plans in the 37 states with Federally Facilitated or Partnership exchanges in 2015 (including New Mexico, Oregon, and Nevada). Data are from Healthcare.gov Health plan information for individuals and families available here: https://www.healthcare.gov/health-plan-information/
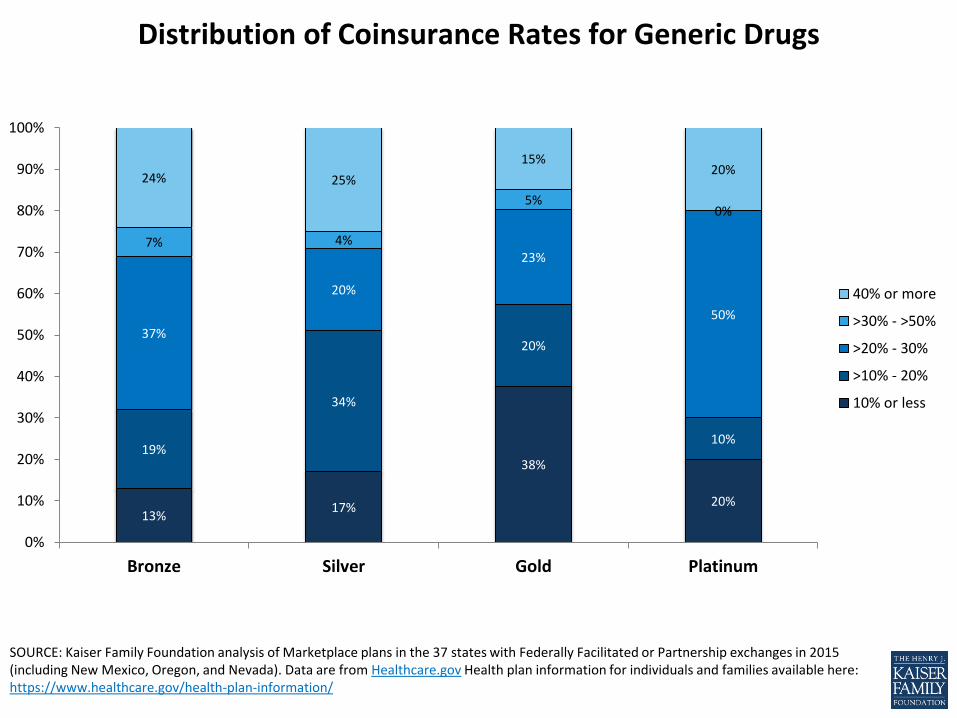
Distribution of Coinsurance Rates for Generic Drugs
13% 17%
38%
20%
19%
34%
20%
10%
37%
20%
23%
50%
7% 4%
5% 0%
24% 25%
15% 20%
0%
10%
20%
30%
40%
50%
60%
70%
80%
90%
100%
Bronze Silver Gold Platinum
40% or more
>30% - >50%
>20% - 30%
>10% - 20%
10% or less
SOURCE: Kaiser Family Foundation analysis of Marketplace plans in the 37 states with Federally Facilitated or Partnership exchanges in 2015 (including New Mexico, Oregon, and Nevada). Data are from Healthcare.gov Health plan information for individuals and families available here: https://www.healthcare.gov/health-plan-information/
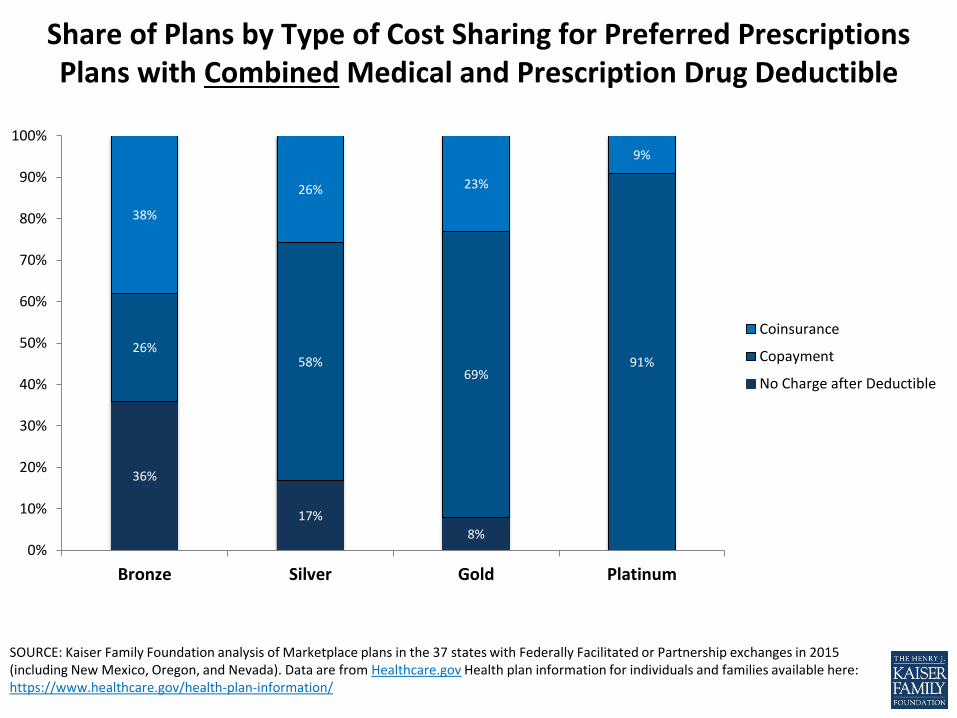
Share of Plans by Type of Cost Sharing for Preferred Prescriptions Plans with Combined Medical and Prescription Drug Deductible
36%
17%
8%
26% 58%
69% 91%
38%
26% 23%
9%
0%
10%
20%
30%
40%
50%
60%
70%
80%
90%
100%
Bronze Silver Gold Platinum
Coinsurance
Copayment
No Charge after Deductible

SOURCE: Kaiser Family Foundation analysis of Marketplace plans in the 37 states with Federally Facilitated or Partnership exchanges in 2015 (including New Mexico, Oregon, and Nevada). Data are from Healthcare.gov Health plan information for individuals and families available here: https://www.healthcare.gov/health-plan-information/
Share of Plans by Type of Cost Sharing for Preferred Prescriptions Plans with Separate Medical and Prescription Drug Deductible
81%
94% 93% 99%
19%
6% 7% 1%
0%
10%
20%
30%
40%
50%
60%
70%
80%
90%
100%
Bronze Silver Gold Platinum
Coinsurance
Copayment
SOURCE: Kaiser Family Foundation analysis of Marketplace plans in the 37 states with Federally Facilitated or Partnership exchanges in 2015 (including New Mexico, Oregon, and Nevada). Data are from Healthcare.gov Health plan information for individuals and families available here: https://www.healthcare.gov/health-plan-information/
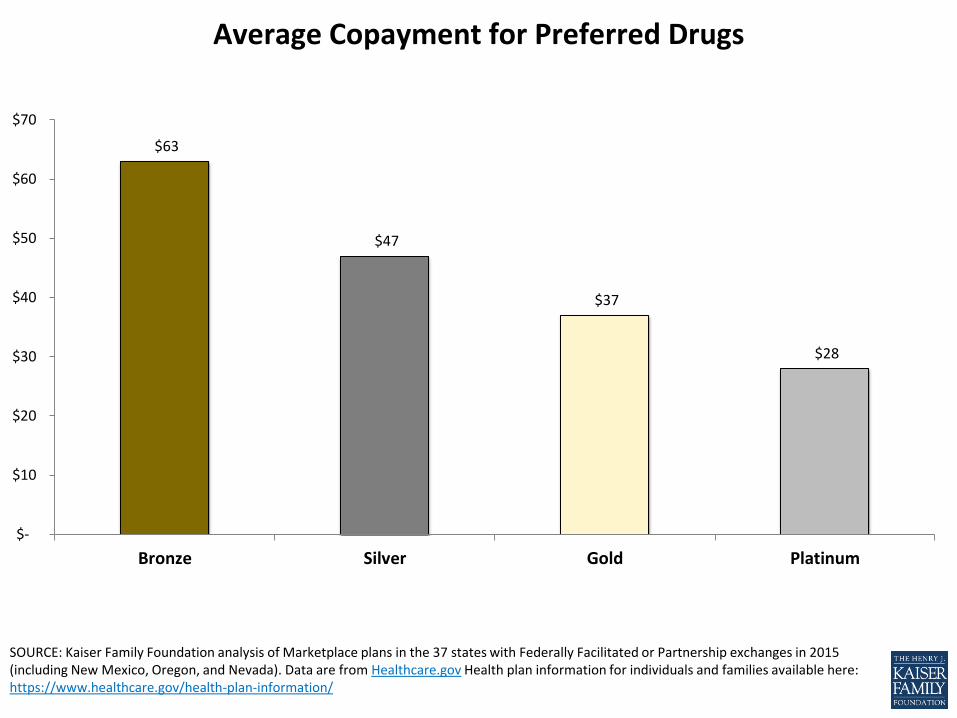
Average Copayment for Preferred Drugs
$63
$47
$37
$28
$-
$10
$20
$30
$40
$50
$60
$70
Bronze Silver Gold Platinum
SOURCE: Kaiser Family Foundation analysis of Marketplace plans in the 37 states with Federally Facilitated or Partnership exchanges in 2015 (including New Mexico, Oregon, and Nevada). Data are from Healthcare.gov Health plan information for individuals and families available here: https://www.healthcare.gov/health-plan-information/
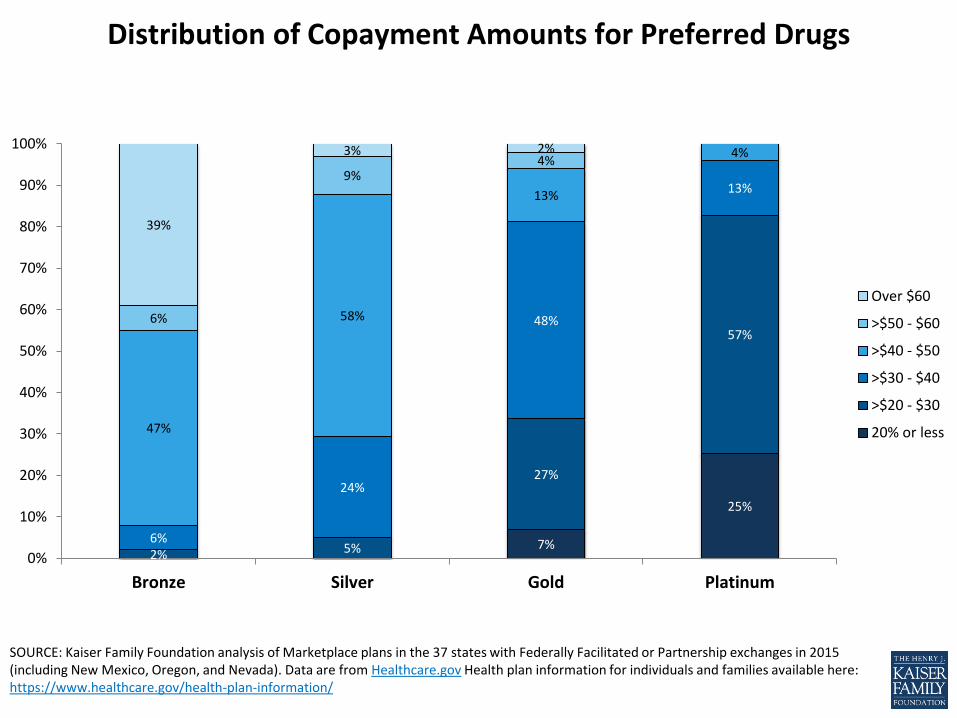
Distribution of Copayment Amounts for Preferred Drugs
7%
25%
2% 5%
27%
57%
6%
24%
48%
13%
47%
58%
13%
4%
6%
9% 4%
39%
3% 2%
0%
10%
20%
30%
40%
50%
60%
70%
80%
90%
100%
Bronze Silver Gold Platinum
Over $60
>$50 - $60
>$40 - $50
>$30 - $40
>$20 - $30
20% or less
SOURCE: Kaiser Family Foundation analysis of Marketplace plans in the 37 states with Federally Facilitated or Partnership exchanges in 2015 (including New Mexico, Oregon, and Nevada). Data are from Healthcare.gov Health plan information for individuals and families available here: https://www.healthcare.gov/health-plan-information/
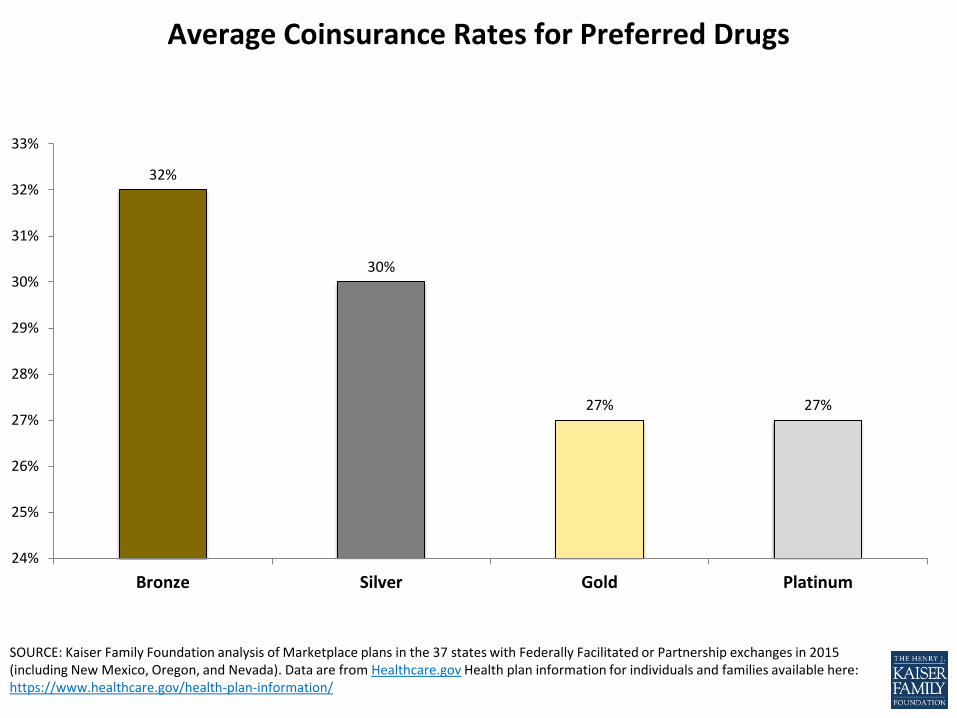
Average Coinsurance Rates for Preferred Drugs
32%
30%
27% 27%
24%
25%
26%
27%
28%
29%
30%
31%
32%
33%
Bronze Silver Gold Platinum
SOURCE: Kaiser Family Foundation analysis of Marketplace plans in the 37 states with Federally Facilitated or Partnership exchanges in 2015 (including New Mexico, Oregon, and Nevada). Data are from Healthcare.gov Health plan information for individuals and families available here: https://www.healthcare.gov/health-plan-information/
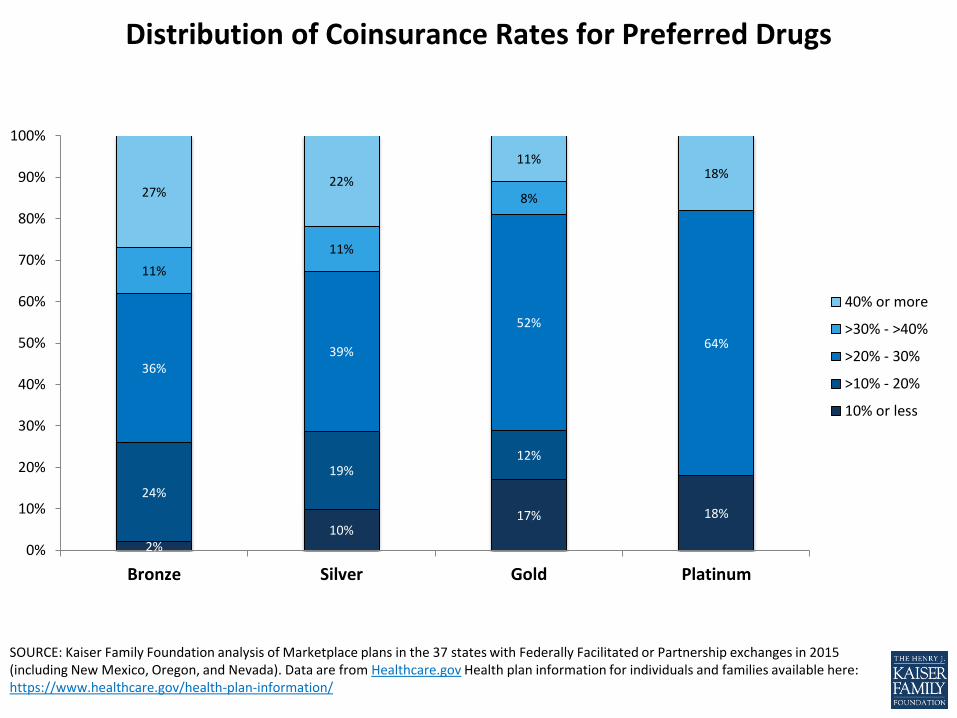
Distribution of Coinsurance Rates for Preferred Drugs
2% 10%
17% 18%
24%
19% 12%
36% 39%
52%
64%
11%
11%
8% 27% 22%
11% 18%
0%
10%
20%
30%
40%
50%
60%
70%
80%
90%
100%
Bronze Silver Gold Platinum
40% or more
>30% - >40%
>20% - 30%
>10% - 20%
10% or less
SOURCE: Kaiser Family Foundation analysis of Marketplace plans in the 37 states with Federally Facilitated or Partnership exchanges in 2015 (including New Mexico, Oregon, and Nevada). Data are from Healthcare.gov Health plan information for individuals and families available here: https://www.healthcare.gov/health-plan-information/
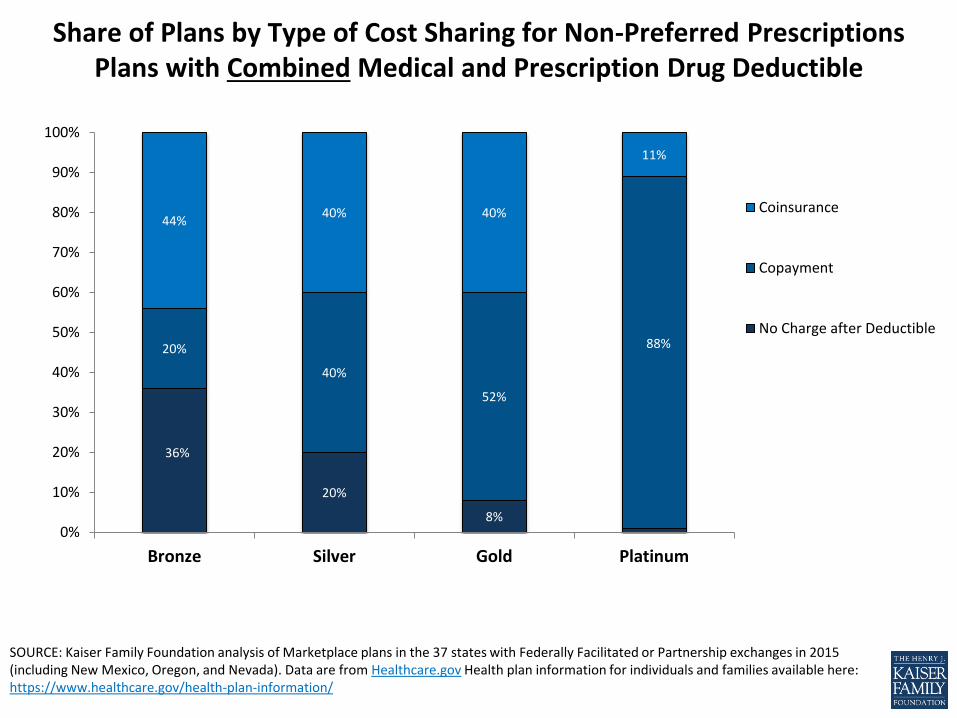
Share of Plans by Type of Cost Sharing for Non-Preferred Prescriptions Plans with Combined Medical and Prescription Drug Deductible
36%
20%
8%
20%
40%
52%
88%
44% 40% 40%
11%
0%
10%
20%
30%
40%
50%
60%
70%
80%
90%
100%
Bronze Silver Gold Platinum
Coinsurance
Copayment
No Charge after Deductible
SOURCE: Kaiser Family Foundation analysis of Marketplace plans in the 37 states with Federally Facilitated or Partnership exchanges in 2015 (including New Mexico, Oregon, and Nevada). Data are from Healthcare.gov Health plan information for individuals and families available here: https://www.healthcare.gov/health-plan-information/
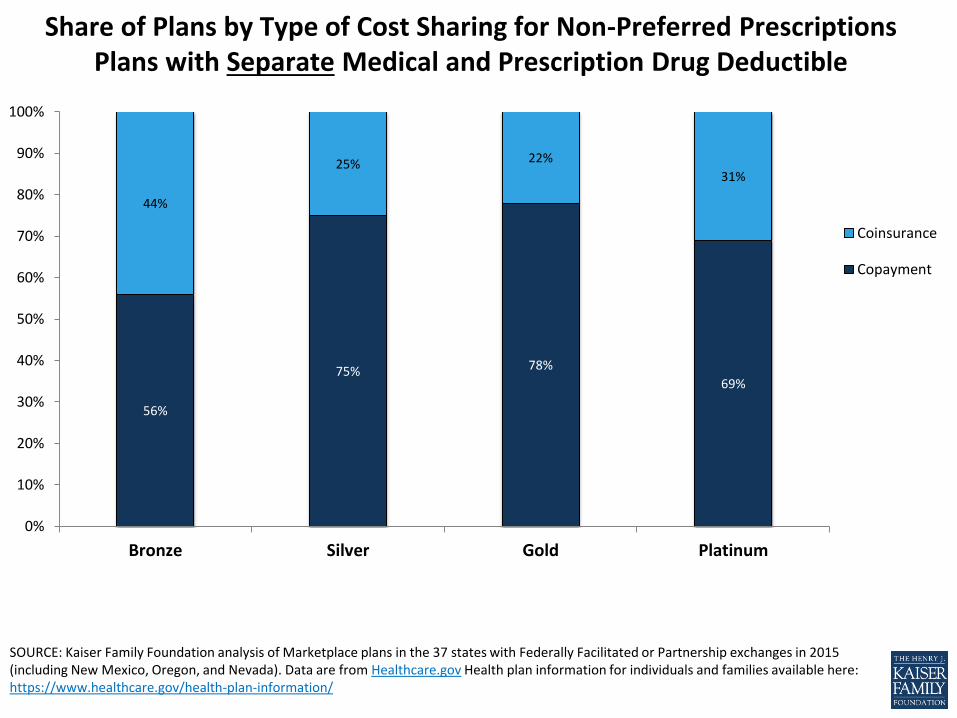
Share of Plans by Type of Cost Sharing for Non-Preferred Prescriptions Plans with Separate Medical and Prescription Drug Deductible
56%
75% 78%
69%
44%
25% 22%
31%
0%
10%
20%
30%
40%
50%
60%
70%
80%
90%
100%
Bronze Silver Gold Platinum
Coinsurance
Copayment
SOURCE: Kaiser Family Foundation analysis of Marketplace plans in the 37 states with Federally Facilitated or Partnership exchanges in 2015 (including New Mexico, Oregon, and Nevada). Data are from Healthcare.gov Health plan information for individuals and families available here: https://www.healthcare.gov/health-plan-information/
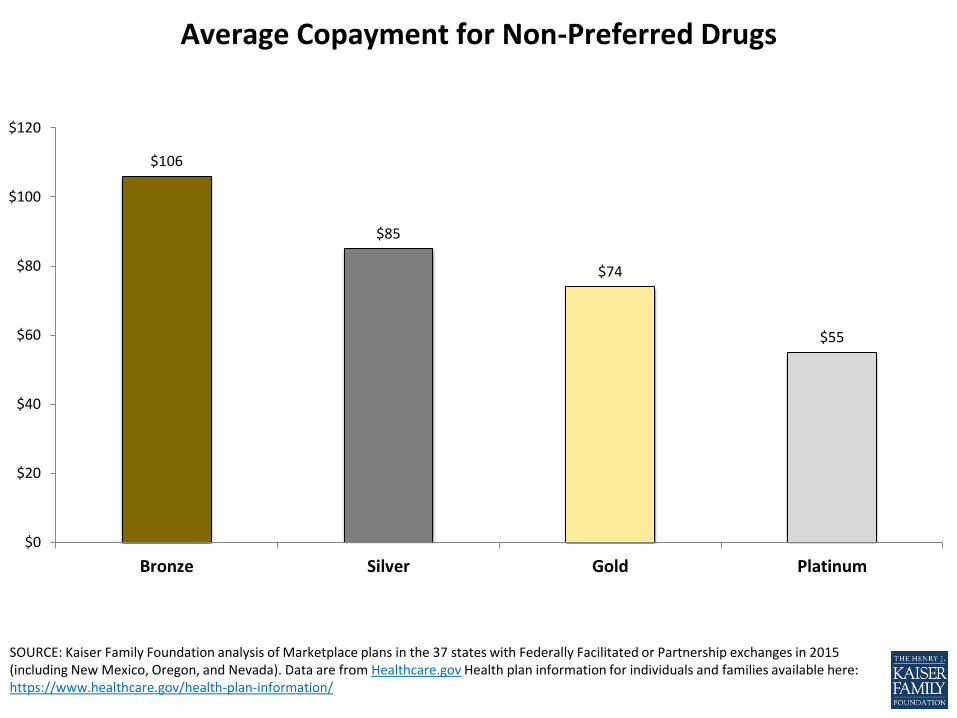
Average Copayment for Non-Preferred Drugs
$106
$85
$74
$55
$0
$20
$40
$60
$80
$100
$120
Bronze Silver Gold Platinum
SOURCE: Kaiser Family Foundation analysis of Marketplace plans in the 37 states with Federally Facilitated or Partnership exchanges in 2015 (including New Mexico, Oregon, and Nevada). Data are from Healthcare.gov Health plan information for individuals and families available here: https://www.healthcare.gov/health-plan-information/
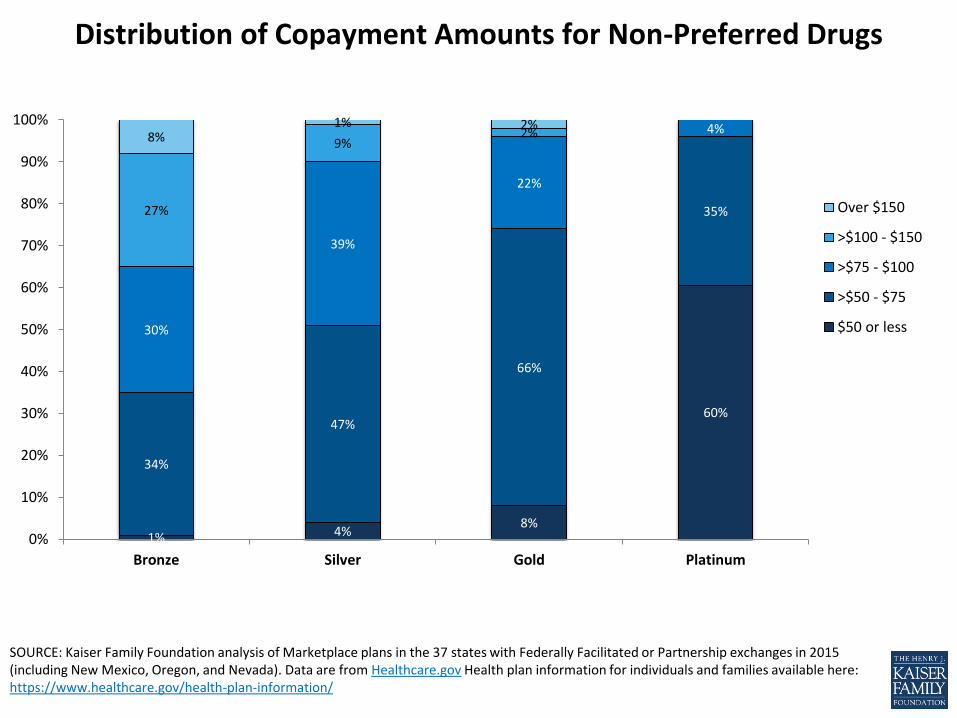
Distribution of Copayment Amounts for Non-Preferred Drugs
1% 4% 8%
60%
34%
47%
66%
35%
30%
39%
22%
4%
27%
9% 2% 8%
1% 2%
0%
10%
20%
30%
40%
50%
60%
70%
80%
90%
100%
Bronze Silver Gold Platinum
Over $150
>$100 - $150
>$75 - $100
>$50 - $75
$50 or less

SOURCE: Kaiser Family Foundation analysis of Marketplace plans in the 37 states with Federally Facilitated or Partnership exchanges in 2015 (including New Mexico, Oregon, and Nevada). Data are from Healthcare.gov Health plan information for individuals and families available here: https://www.healthcare.gov/health-plan-information/
Average Coinsurance Rates for Non-Preferred Drugs
37% 37%
34%
33%
31%
32%
33%
34%
35%
36%
37%
38%
Bronze Silver Gold Platinum

SOURCE: Kaiser Family Foundation analysis of Marketplace plans in the 37 states with Federally Facilitated or Partnership exchanges in 2015 (including New Mexico, Oregon, and Nevada). Data are from Healthcare.gov Health plan information for individuals and families available here: https://www.healthcare.gov/health-plan-information/
Distribution of Coinsurance Rates for Non-Preferred Drugs
2% 6%
13%
3%
17%
22%
19%
10%
29% 15% 10%
16%
51% 56% 58%
71%
0%
10%
20%
30%
40%
50%
60%
70%
80%
90%
100%
Bronze Silver Gold Platinum
>30% - <50%
>20% - 30%
>10% - 20%
10% or less
SOURCE: Kaiser Family Foundation analysis of Marketplace plans in the 37 states with Federally Facilitated or Partnership exchanges in 2015 (including New Mexico, Oregon, and Nevada). Data are from Healthcare.gov Health plan information for individuals and families available here: https://www.healthcare.gov/health-plan-information/
Share of Plans by Type of Cost Sharing for Specialty Prescriptions Plans with Combined Medical and Prescription Drug Deductible
36%
22%
10%
1%
3%
9%
8%
1%
61% 68%
82%
98%
1% 1%
0%
10%
20%
30%
40%
50%
60%
70%
80%
90%
100%
Bronze Silver Gold Platinum
Copayment and Coinsurance
Coinsurance
Copayment
No Charge after Deductible
SOURCE: Kaiser Family Foundation analysis of Marketplace plans in the 37 states with Federally Facilitated or Partnership exchanges in 2015 (including New Mexico, Oregon, and Nevada). Data are from Healthcare.gov Health plan information for individuals and families available here: https://www.healthcare.gov/health-plan-information/
Share of Plans by Type of Cost Sharing for Specialty Prescriptions Plans with Separate Medical and Prescription Drug Deductible
12%
33% 34% 33%
88%
67% 65% 67%
0%
10%
20%
30%
40%
50%
60%
70%
80%
90%
100%
Bronze Silver Gold Platinum
Coinsurance
Copayment
SOURCE: Kaiser Family Foundation analysis of Marketplace plans in the 37 states with Federally Facilitated or Partnership exchanges in 2015 (including New Mexico, Oregon, and Nevada). Data are from Healthcare.gov Health plan information for individuals and families available here: https://www.healthcare.gov/health-plan-information/
Average Copayment for Specialty Drugs
$174 $179
$160
$139
$0
$20
$40
$60
$80
$100
$120
$140
$160
$180
$200
Bronze Silver Gold Platinum
SOURCE: Kaiser Family Foundation analysis of Marketplace plans in the 37 states with Federally Facilitated or Partnership exchanges in 2015 (including New Mexico, Oregon, and Nevada). Data are from Healthcare.gov Health plan information for individuals and families available here: https://www.healthcare.gov/health-plan-information/
Distribution of Copayment Amounts for Specialty Drugs
16% 8%
15%
39%
25% 47%
58%
23%
39%
23%
13%
28%
12% 14%
5% 2%
8% 8% 8% 8%
0%
10%
20%
30%
40%
50%
60%
70%
80%
90%
100%
Bronze Silver Gold Platinum
Over $250
>$200 - $250
>$150 - $200
>$100 - $150
$100 or less
SOURCE: Kaiser Family Foundation analysis of Marketplace plans in the 37 states with Federally Facilitated or Partnership exchanges in 2015 (including New Mexico, Oregon, and Nevada). Data are from Healthcare.gov Health plan information for individuals and families available here: https://www.healthcare.gov/health-plan-information/
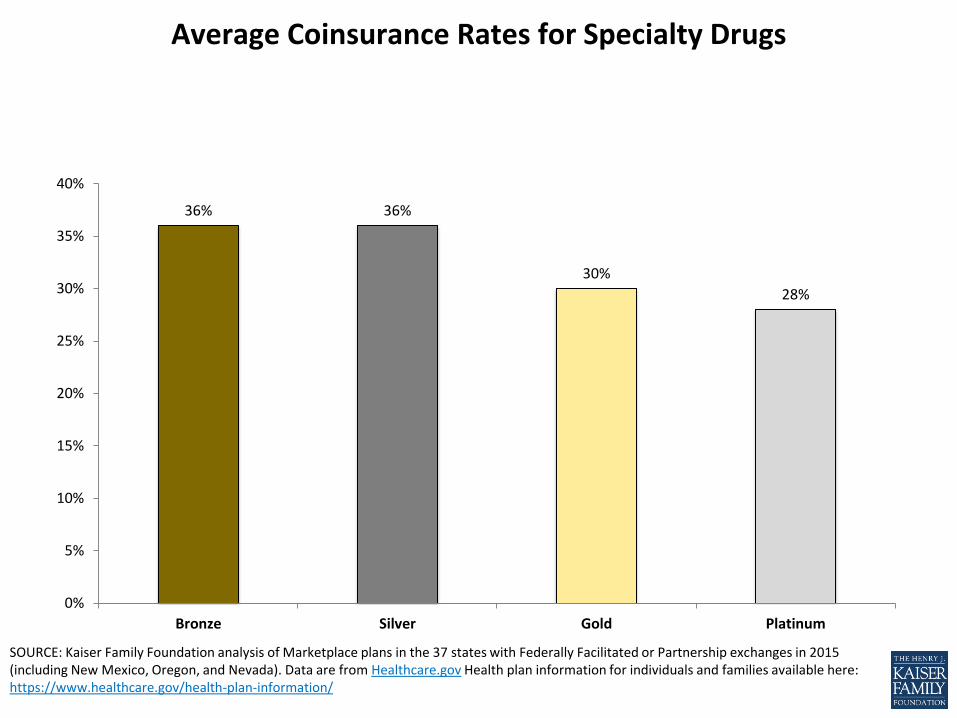
Average Coinsurance Rates for Specialty Drugs
36% 36%
30%
28%
0%
5%
10%
15%
20%
25%
30%
35%
40%
Bronze Silver Gold Platinum
SOURCE: Kaiser Family Foundation analysis of Marketplace plans in the 37 states with Federally Facilitated or Partnership exchanges in 2015 (including New Mexico, Oregon, and Nevada). Data are from Healthcare.gov Health plan information for individuals and families available here: https://www.healthcare.gov/health-plan-information/
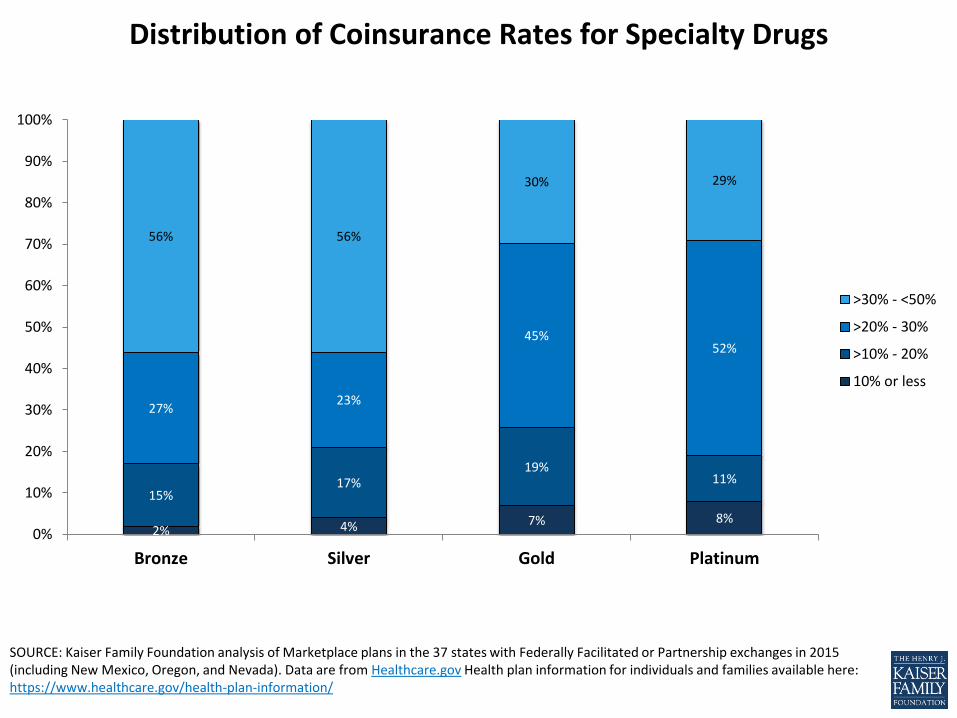
Distribution of Coinsurance Rates for Specialty Drugs
2% 4% 7% 8%
15% 17%
19% 11%
27% 23%
45% 52%
56% 56%
30% 29%
0%
10%
20%
30%
40%
50%
60%
70%
80%
90%
100%
Bronze Silver Gold Platinum
>30% - <50%
>20% - 30%
>10% - 20%
10% or less

Emergency Room Cost Sharing
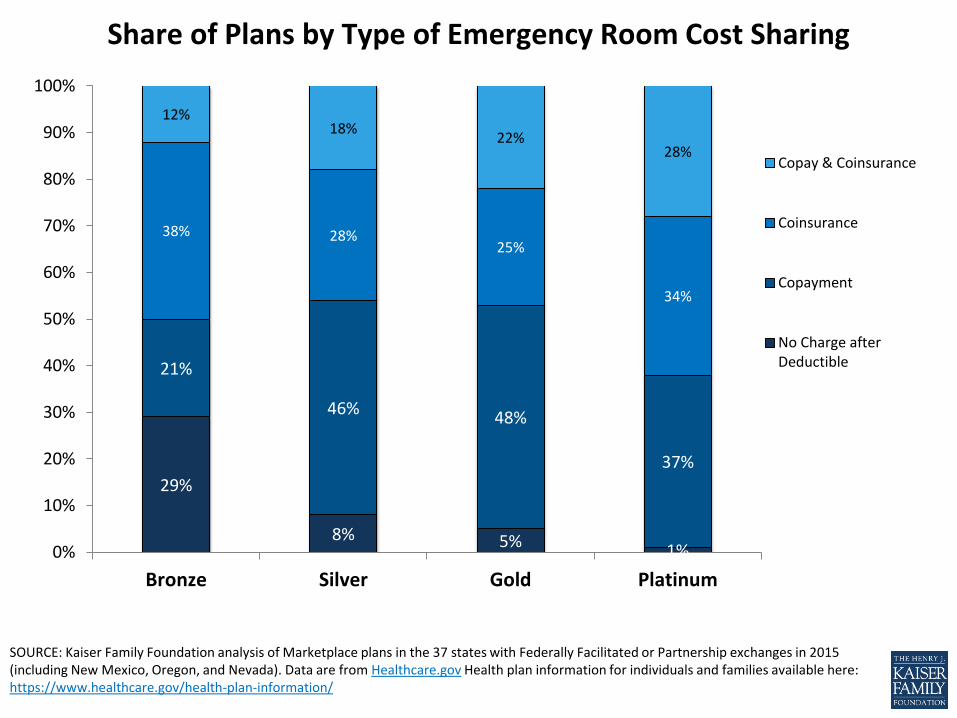
SOURCE: Kaiser Family Foundation analysis of Marketplace plans in the 37 states with Federally Facilitated or Partnership exchanges in 2015 (including New Mexico, Oregon, and Nevada). Data are from Healthcare.gov Health plan information for individuals and families available here: https://www.healthcare.gov/health-plan-information/
29%
8% 5% 1%
21%
46% 48%
37%
38% 28% 25%
34%
12% 18%
22% 28%
0%
10%
20%
30%
40%
50%
60%
70%
80%
90%
100%
Bronze Silver Gold Platinum
Copay & Coinsurance
Coinsurance
Copayment
No Charge afterDeductible
Share of Plans by Type of Emergency Room Cost Sharing
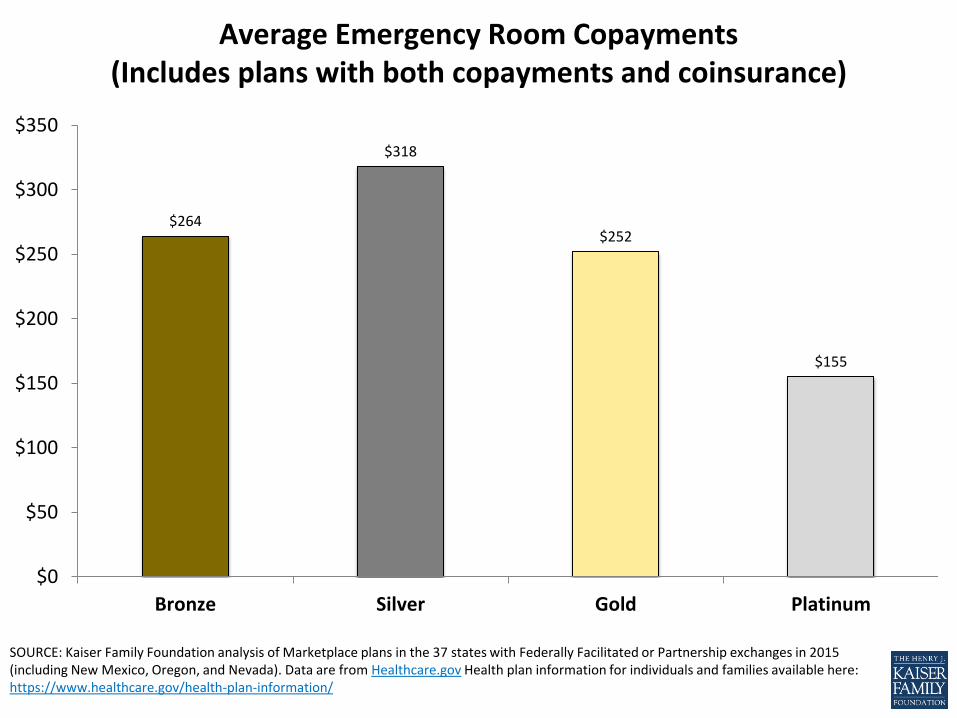
SOURCE: Kaiser Family Foundation analysis of Marketplace plans in the 37 states with Federally Facilitated or Partnership exchanges in 2015 (including New Mexico, Oregon, and Nevada). Data are from Healthcare.gov Health plan information for individuals and families available here: https://www.healthcare.gov/health-plan-information/
$264
$318
$252
$155
$0
$50
$100
$150
$200
$250
$300
$350
Bronze Silver Gold Platinum
Average Emergency Room Copayments (Includes plans with both copayments and coinsurance)
SOURCE: Kaiser Family Foundation analysis of Marketplace plans in the 37 states with Federally Facilitated or Partnership exchanges in 2015 (including New Mexico, Oregon, and Nevada). Data are from Healthcare.gov Health plan information for individuals and families available here: https://www.healthcare.gov/health-plan-information/
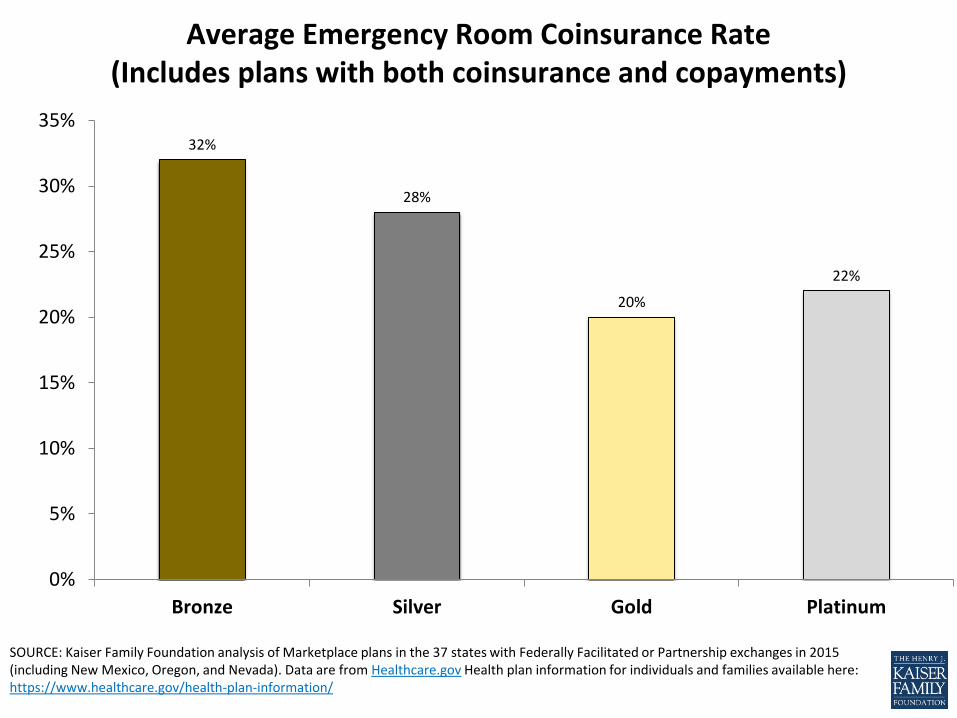
32%
28%
20%
22%
0%
5%
10%
15%
20%
25%
30%
35%
Bronze Silver Gold Platinum
Average Emergency Room Coinsurance Rate (Includes plans with both coinsurance and copayments)
Out-of-Pocket Maximums
SOURCE: Kaiser Family Foundation analysis of Marketplace plans in the 37 states with Federally Facilitated or Partnership exchanges in 2015 (including New Mexico, Oregon, and Nevada). Data are from Healthcare.gov Health plan information for individuals and families available here: https://www.healthcare.gov/health-plan-information/
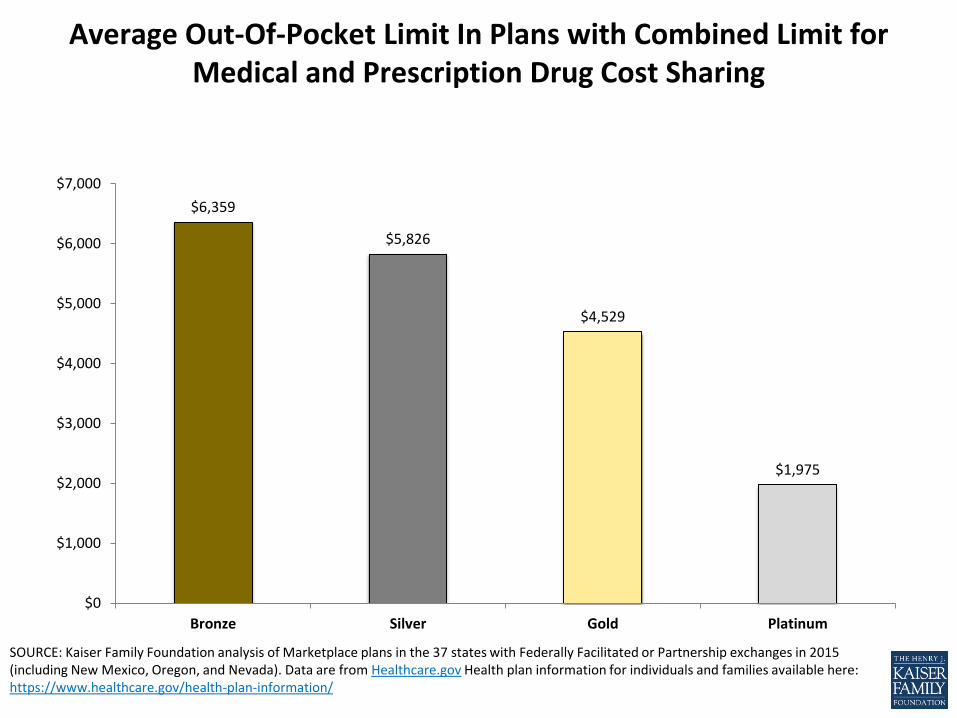
Average Out-Of-Pocket Limit In Plans with Combined Limit for Medical and Prescription Drug Cost Sharing
$6,359
$5,826
$4,529
$1,975
$0
$1,000
$2,000
$3,000
$4,000
$5,000
$6,000
$7,000
Bronze Silver Gold Platinum
SOURCE: Kaiser Family Foundation analysis of Marketplace plans in the 37 states with Federally Facilitated or Partnership exchanges in 2015 (including New Mexico, Oregon, and Nevada). Data are from Healthcare.gov Health plan information for individuals and families available here: https://www.healthcare.gov/health-plan-information/
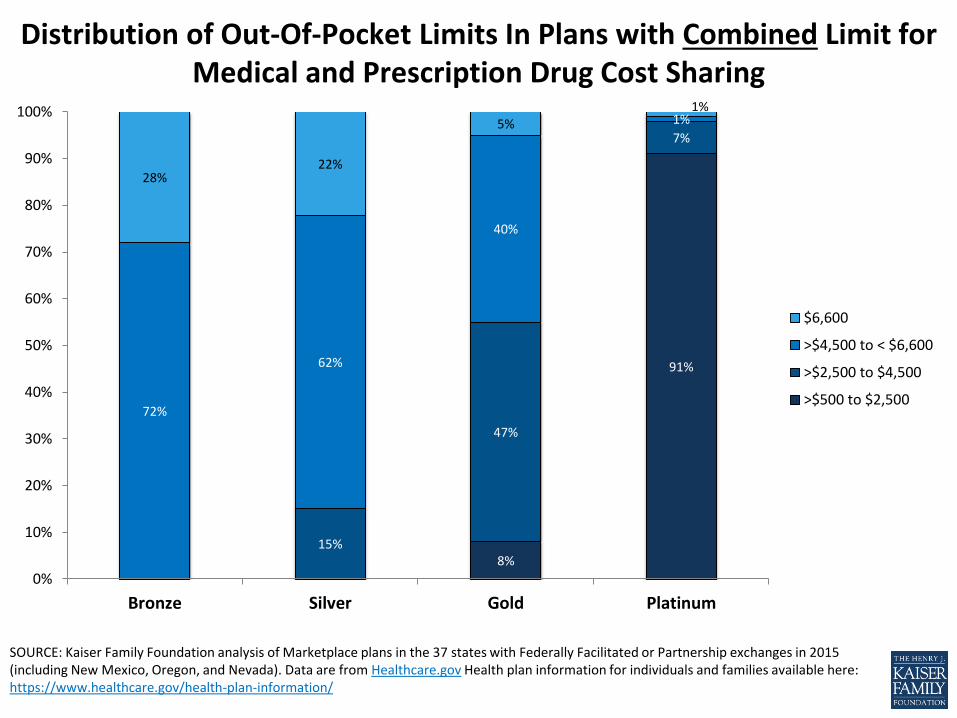
8%
91%
15%
47%
7%
72%
62%
40%
1%
28% 22%
5% 1%
0%
10%
20%
30%
40%
50%
60%
70%
80%
90%
100%
Bronze Silver Gold Platinum
$6,600
>$4,500 to < $6,600
>$2,500 to $4,500
>$500 to $2,500
Distribution of Out-Of-Pocket Limits In Plans with Combined Limit for Medical and Prescription Drug Cost Sharing