Embed Size (px)
Citation preview
Cardiovascular System
Physiology Lecture: 1 Abbas A. A. Shawka
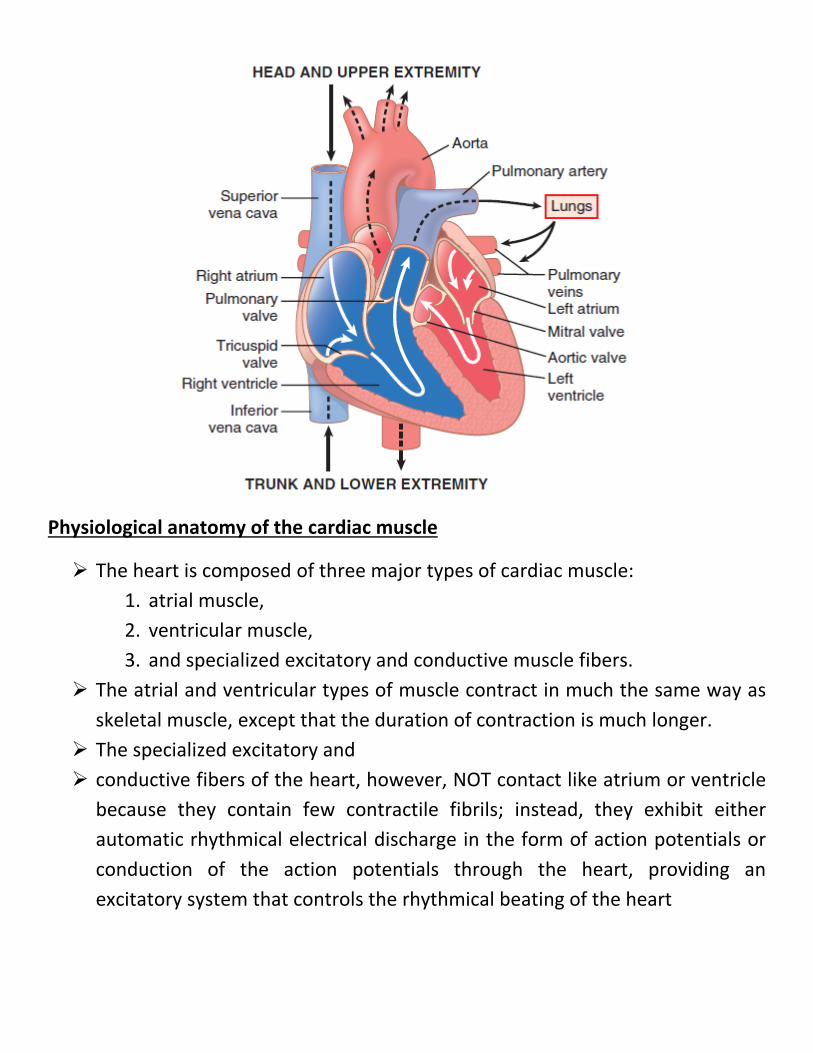
Physiological anatomy of the cardiac muscle
The heart is composed of three major types of cardiac muscle: 1. atrial muscle, 2. ventricular muscle, 3. and specialized excitatory and conductive muscle fibers.
The atrial and ventricular types of muscle contract in much the same way as skeletal muscle, except that the duration of contraction is much longer.
The specialized excitatory and conductive fibers of the heart, however, NOT contact like atrium or ventricle
because they contain few contractile fibrils; instead, they exhibit either automatic rhythmical electrical discharge in the form of action potentials or conduction of the action potentials through the heart, providing an excitatory system that controls the rhythmical beating of the heart
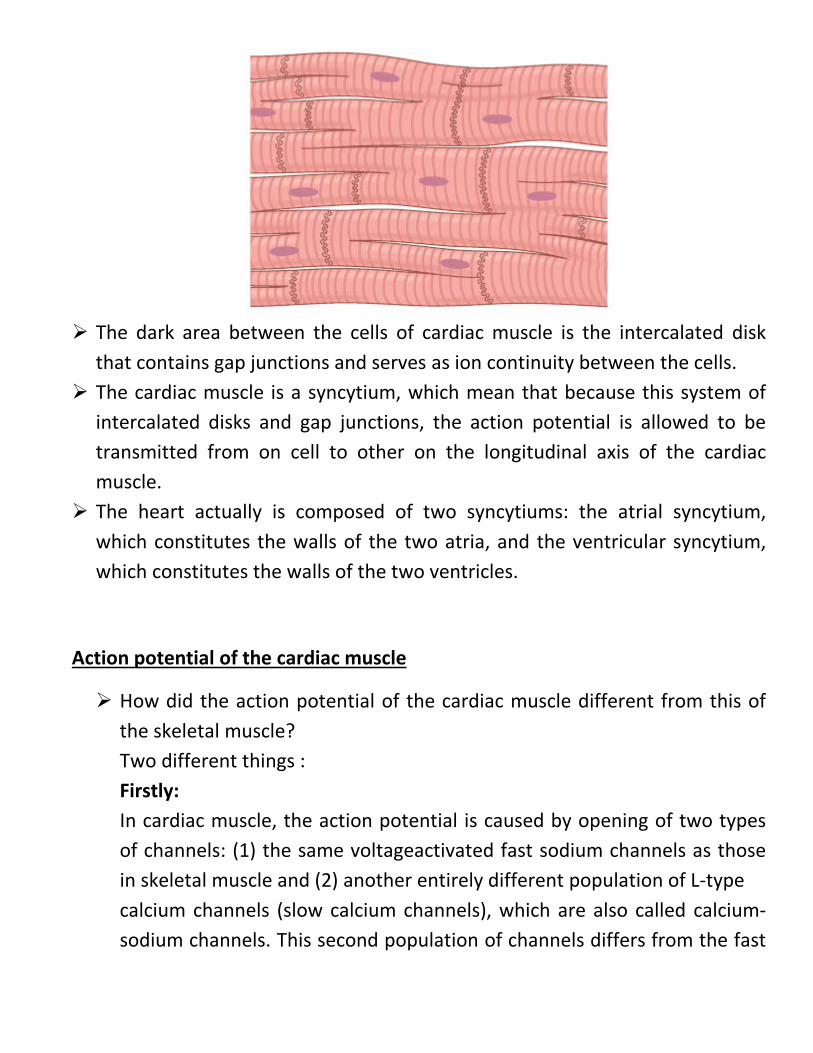
The dark area between the cells of cardiac muscle is the intercalated disk
that contains gap junctions and serves as ion continuity between the cells. The cardiac muscle is a syncytium, which mean that because this system of
intercalated disks and gap junctions, the action potential is allowed to be transmitted from on cell to other on the longitudinal axis of the cardiac muscle.
The heart actually is composed of two syncytiums: the atrial syncytium, which constitutes the walls of the two atria, and the ventricular syncytium, which constitutes the walls of the two ventricles.
Action potential of the cardiac muscle
How did the action potential of the cardiac muscle different from this of the skeletal muscle? Two different things : Firstly: In cardiac muscle, the action potential is caused by opening of two types of channels: (1) the same voltageactivated fast sodium channels as those in skeletal muscle and (2) another entirely different population of L-type calcium channels (slow calcium channels), which are also called calcium-sodium channels. This second population of channels differs from the fast
sodium channels in that they are slower to open and, even more important, remain open for several tenths of a second. Secondly, Immediately after the onset of the action potential, the permeability of the cardiac muscle membrane for potassium ions decreases about fivefold, an effect that does not occur in skeletal muscle.
The action potential of cardiac muscle characterized by appearing of plateau ( a prolonged in the period of depolarization ) .
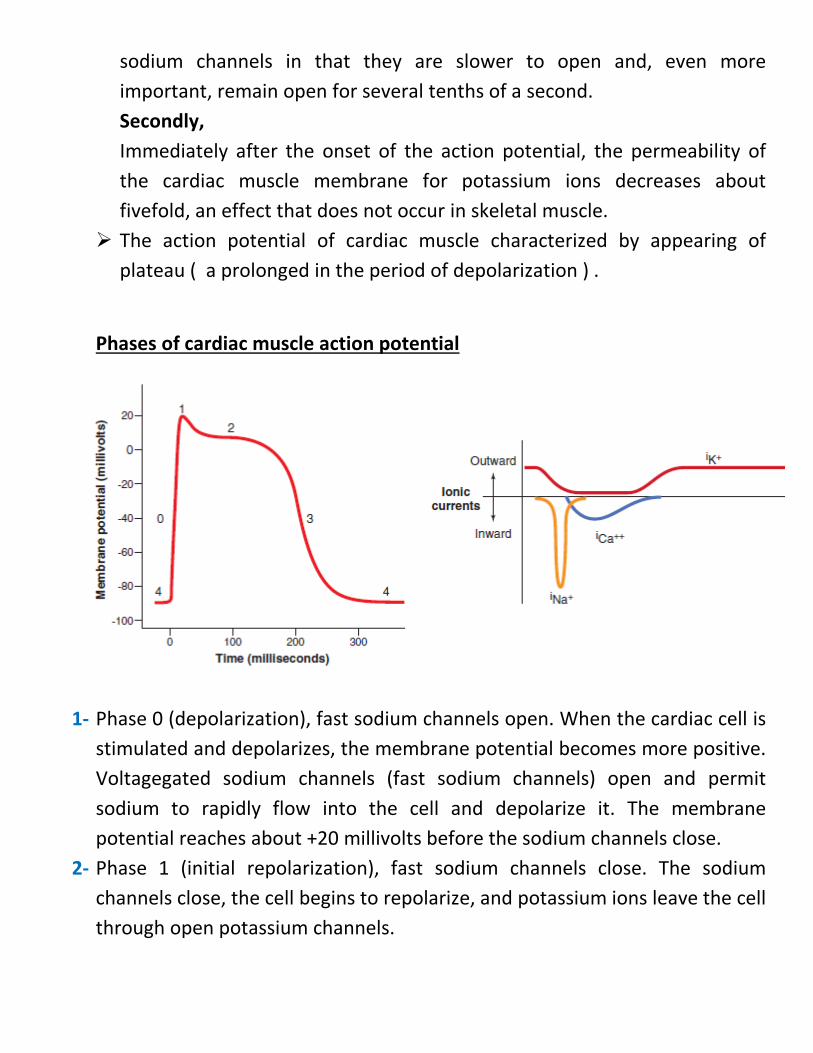
Phases of cardiac muscle action potential
1-
1- Phase 0 (depolarization), fast sodium channels open. When the cardiac cell is stimulated and depolarizes, the membrane potential becomes more positive. Voltagegated sodium channels (fast sodium channels) open and permit sodium to rapidly flow into the cell and depolarize it. The membrane potential reaches about +20 millivolts before the sodium channels close.
2- Phase 1 (initial repolarization), fast sodium channels close. The sodium channels close, the cell begins to repolarize, and potassium ions leave the cell through open potassium channels.
3- Phase 2 (plateau), calcium channels open and fast potassium channels close. A brief initial repolarization occurs and the action potential then plateaus as a result of (1) increased calcium ion permeability and (2) decreased potassium ion permeability. The voltage-gated calcium ion channels open slowly during phases 1 and 0, and calcium enters the cell. Potassium channels then close, and the combination of decreased potassium ion efflux and increased calcium ion influx causes the action potential to plateau.
4- Phase 3 (rapid repolarization), calcium channels close and slow potassium channels open. The closure of calcium ion channels and increased potassium ion permeability, permitting potassium ions to rapidly exit the cell, ends the plateau and returns the cell membrane potential to its resting level.
5- Phase 4 (resting membrane potential) averages about −90 millivolts.
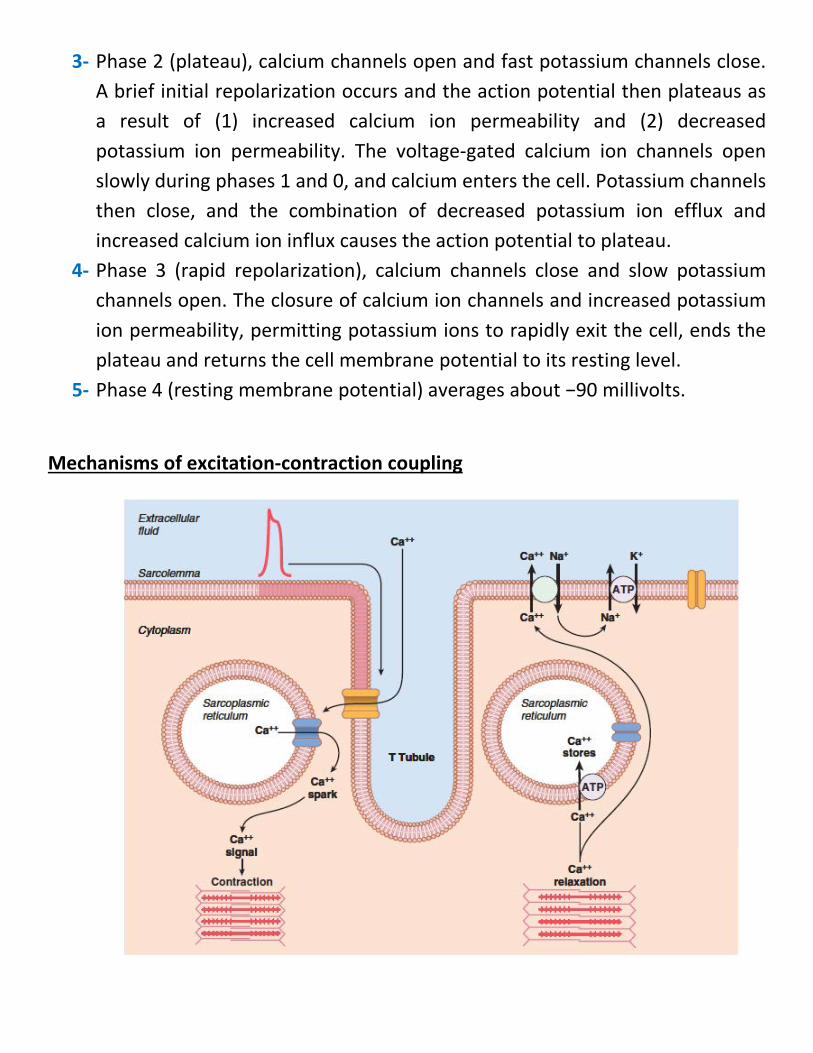
Mechanisms of excitation-contraction coupling
How we reach the reseting membrane potential ?
1- Pumping Ca++ outside through Na+ - Ca++ pump. 2- Pumping K+ inside through active Na+ - K+ pump.
We have two sources of Ca++ a. Ca++ that is reserved in the cisternae of the sarcoplasmic reticulum. b. Ca++ in extracellular fluid the spread through the T tubules system.
Most effective Ca++ is this from ECF that spread by T tubules system.
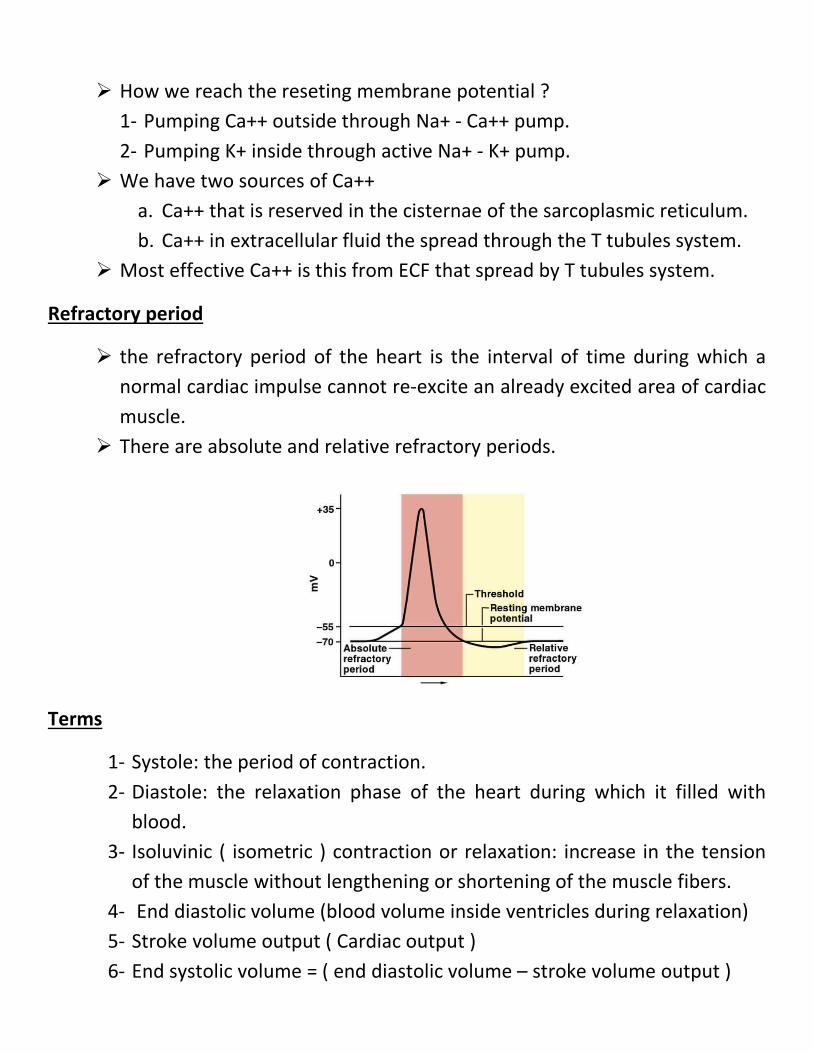
Refractory period
the refractory period of the heart is the interval of time during which a normal cardiac impulse cannot re-excite an already excited area of cardiac muscle.
There are absolute and relative refractory periods.
Terms
1- Systole: the period of contraction. 2- Diastole: the relaxation phase of the heart during which it filled with
blood. 3- Isoluvinic ( isometric ) contraction or relaxation: increase in the tension
of the muscle without lengthening or shortening of the muscle fibers. 4- End diastolic volume (blood volume inside ventricles during relaxation) 5- Stroke volume output ( Cardiac output ) 6- End systolic volume = ( end diastolic volume – stroke volume output )
7- Valves: four in numbers prevent backflow. 8- Preload: the degree of tension on the muscle when it begins to contract. 9- Afterload: specify the load against which the muscle exerts its contractile
force.
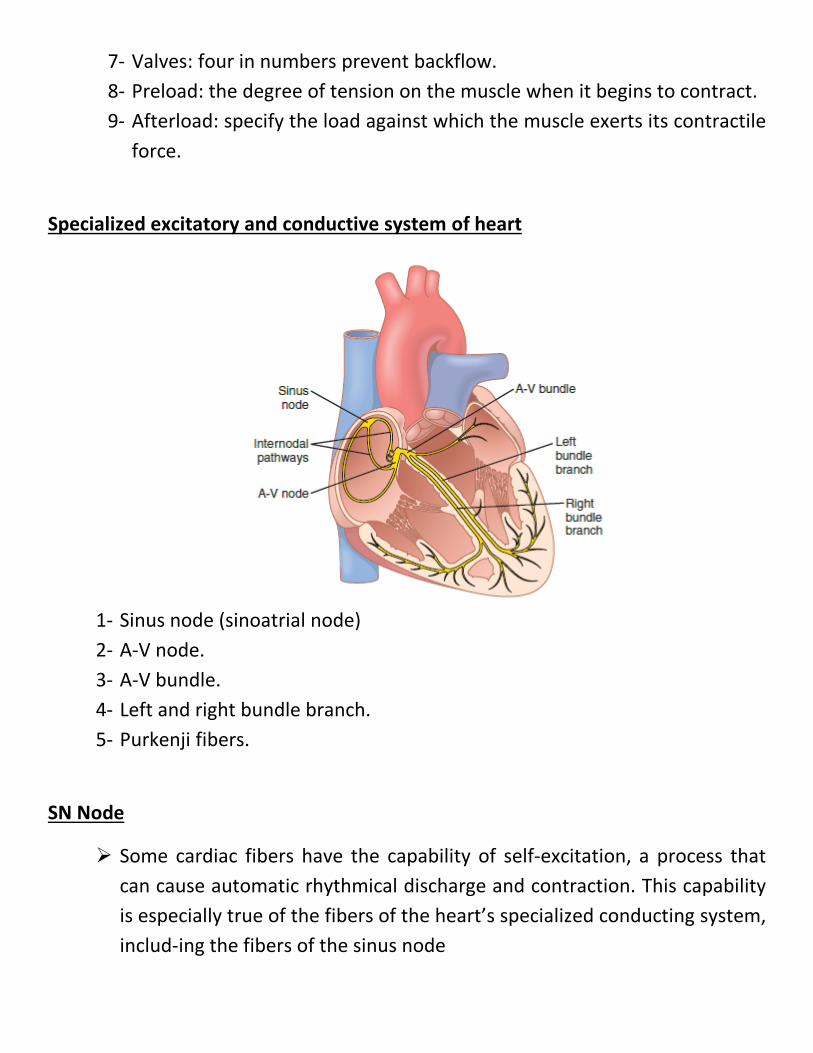
Specialized excitatory and conductive system of heart
1- Sinus node (sinoatrial node) 2- A-V node. 3- A-V bundle. 4- Left and right bundle branch. 5- Purkenji fibers.
SN Node
Some cardiac fibers have the capability of self-excitation, a process that can cause automatic rhythmical discharge and contraction. This capability is especially true of the fibers of the heart’s specialized conducting system, includ-ing the fibers of the sinus node
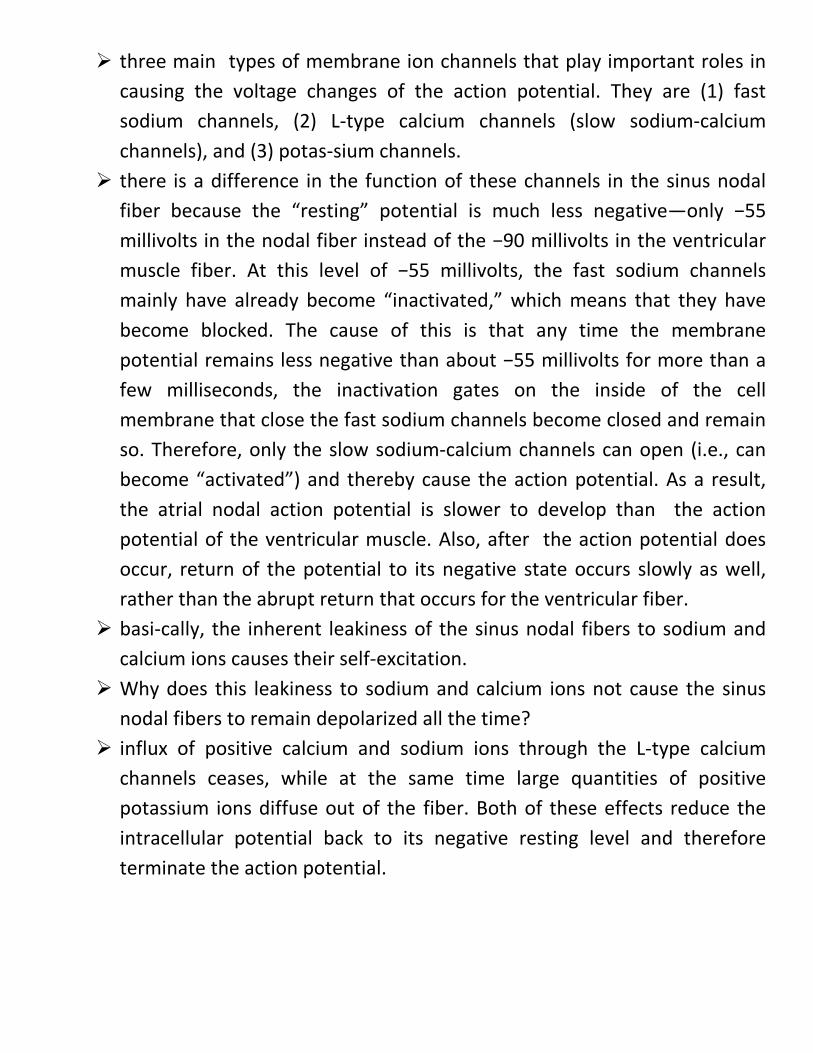
three main types of membrane ion channels that play important roles in causing the voltage changes of the action potential. They are (1) fast sodium channels, (2) L-type calcium channels (slow sodium-calcium channels), and (3) potas-sium channels.
there is a difference in the function of these channels in the sinus nodal fiber because the “resting” potential is much less negative—only −55 millivolts in the nodal fiber instead of the −90 millivolts in the ventricular muscle fiber. At this level of −55 millivolts, the fast sodium channels mainly have already become “inactivated,” which means that they have become blocked. The cause of this is that any time the membrane potential remains less negative than about −55 millivolts for more than a few milliseconds, the inactivation gates on the inside of the cell membrane that close the fast sodium channels become closed and remain so. Therefore, only the slow sodium-calcium channels can open (i.e., can become “activated”) and thereby cause the action potential. As a result, the atrial nodal action potential is slower to develop than the action potential of the ventricular muscle. Also, after the action potential does occur, return of the potential to its negative state occurs slowly as well, rather than the abrupt return that occurs for the ventricular fiber.
basi-cally, the inherent leakiness of the sinus nodal fibers to sodium and calcium ions causes their self-excitation.
Why does this leakiness to sodium and calcium ions not cause the sinus nodal fibers to remain depolarized all the time?
influx of positive calcium and sodium ions through the L-type calcium channels ceases, while at the same time large quantities of positive potassium ions diffuse out of the fiber. Both of these effects reduce the intracellular potential back to its negative resting level and therefore terminate the action potential.
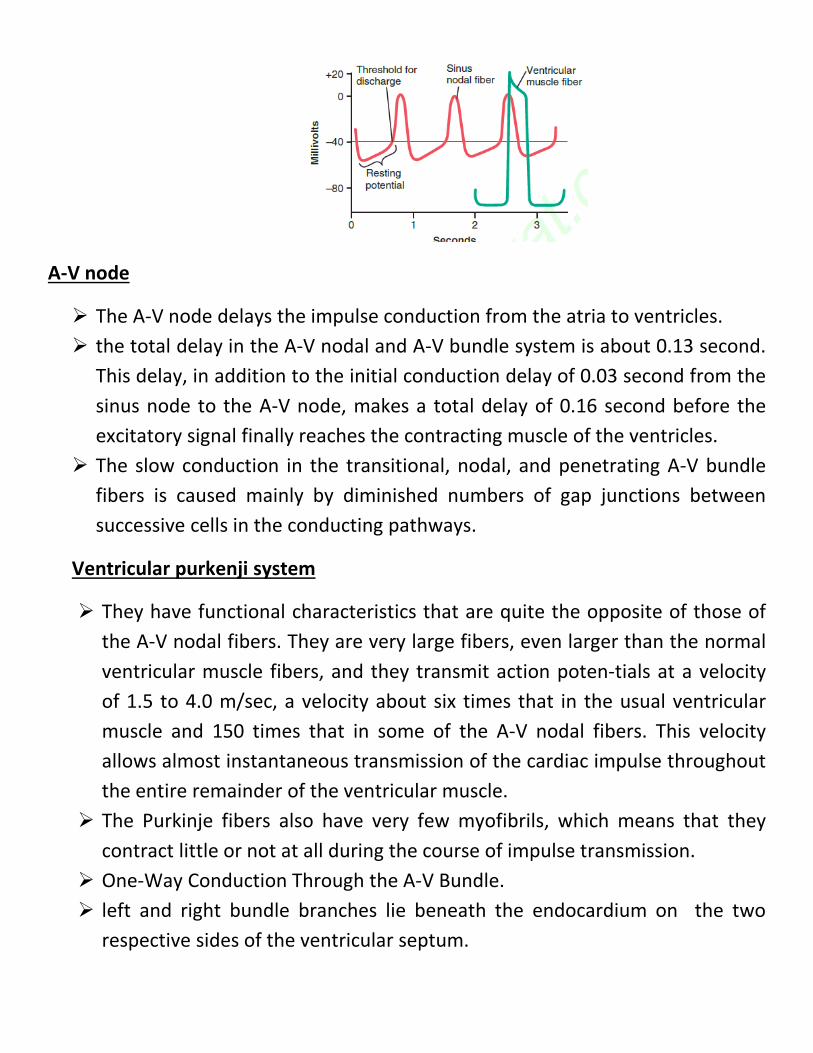
A-V node
The A-V node delays the impulse conduction from the atria to ventricles. the total delay in the A-V nodal and A-V bundle system is about 0.13 second.
This delay, in addition to the initial conduction delay of 0.03 second from the sinus node to the A-V node, makes a total delay of 0.16 second before the excitatory signal finally reaches the contracting muscle of the ventricles.
The slow conduction in the transitional, nodal, and penetrating A-V bundle fibers is caused mainly by diminished numbers of gap junctions between successive cells in the conducting pathways.
Ventricular purkenji system
They have functional characteristics that are quite the opposite of those of the A-V nodal fibers. They are very large fibers, even larger than the normal ventricular muscle fibers, and they transmit action poten-tials at a velocity of 1.5 to 4.0 m/sec, a velocity about six times that in the usual ventricular muscle and 150 times that in some of the A-V nodal fibers. This velocity allows almost instantaneous transmission of the cardiac impulse throughout the entire remainder of the ventricular muscle.
The Purkinje fibers also have very few myofibrils, which means that they contract little or not at all during the course of impulse transmission.
One-Way Conduction Through the A-V Bundle. left and right bundle branches lie beneath the endocardium on the two
respective sides of the ventricular septum.
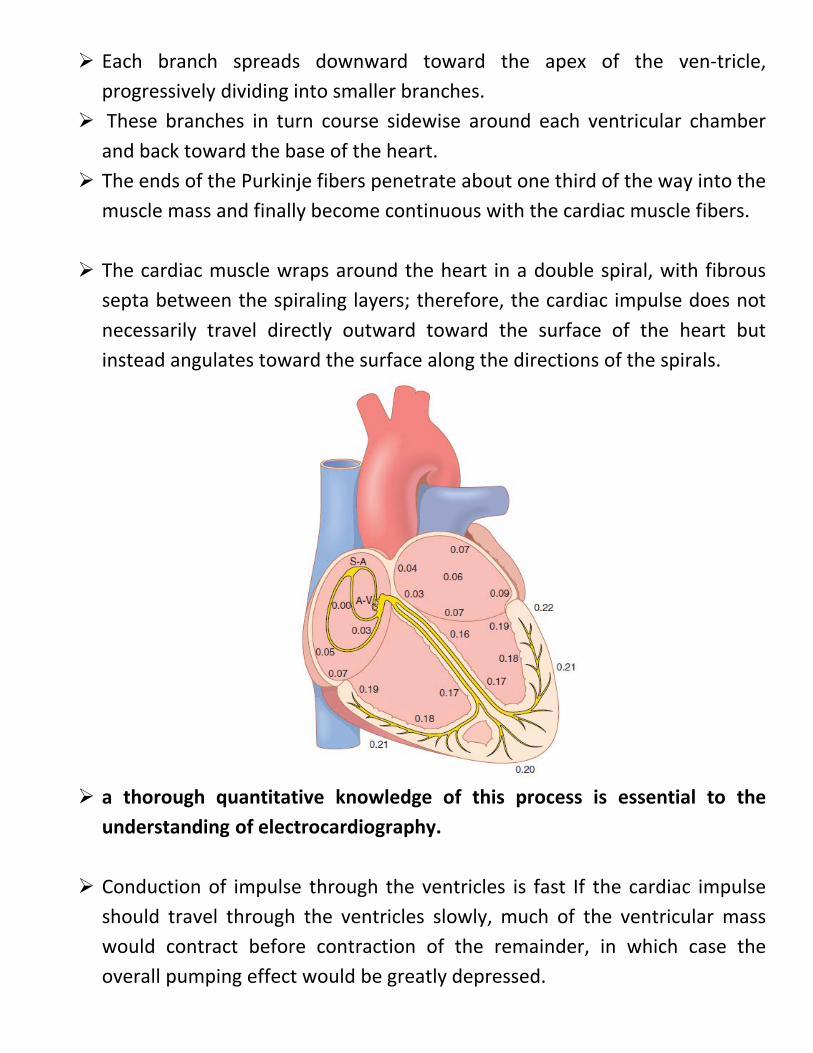
Each branch spreads downward toward the apex of the ven-tricle, progressively dividing into smaller branches.
These branches in turn course sidewise around each ventricular chamber and back toward the base of the heart.
The ends of the Purkinje fibers penetrate about one third of the way into the muscle mass and finally become continuous with the cardiac muscle fibers.
The cardiac muscle wraps around the heart in a double spiral, with fibrous septa between the spiraling layers; therefore, the cardiac impulse does not necessarily travel directly outward toward the surface of the heart but instead angulates toward the surface along the directions of the spirals.
a thorough quantitative knowledge of this process is essential to the
understanding of electrocardiography.
Conduction of impulse through the ventricles is fast If the cardiac impulse should travel through the ventricles slowly, much of the ventricular mass would contract before contraction of the remainder, in which case the overall pumping effect would be greatly depressed.
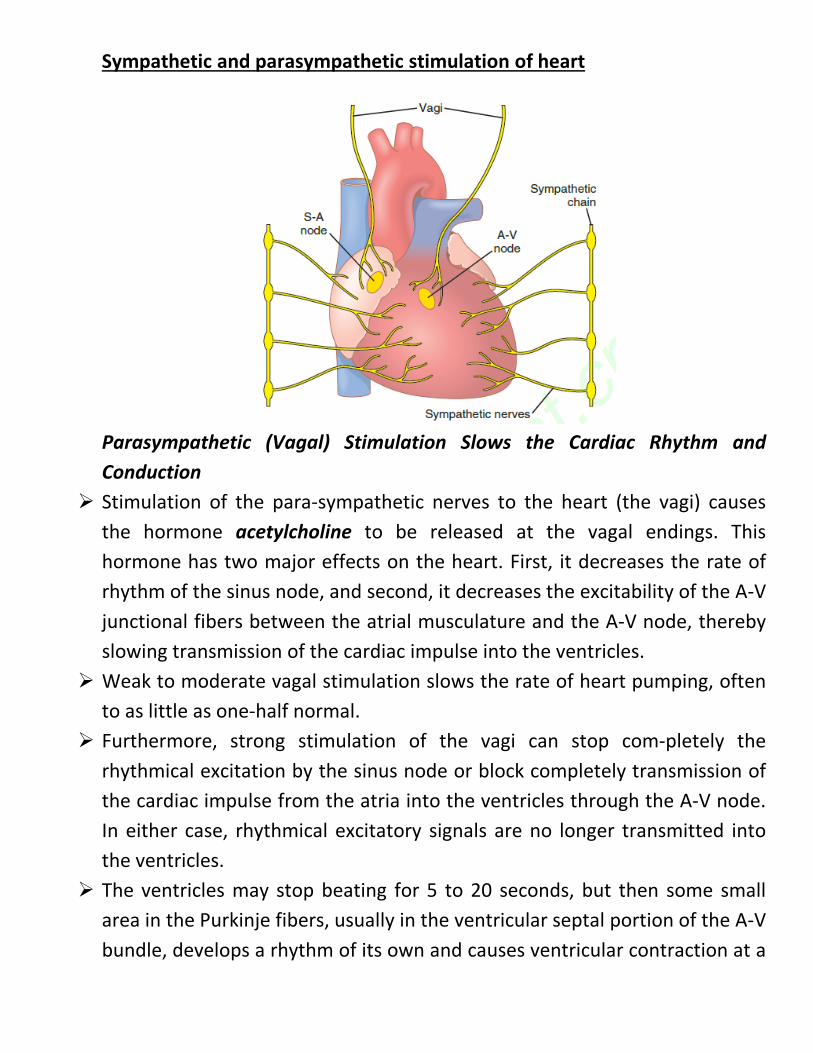
Sympathetic and parasympathetic stimulation of heart
Parasympathetic (Vagal) Stimulation Slows the Cardiac Rhythm and Conduction
Stimulation of the para-sympathetic nerves to the heart (the vagi) causes the hormone acetylcholine to be released at the vagal endings. This hormone has two major effects on the heart. First, it decreases the rate of rhythm of the sinus node, and second, it decreases the excitability of the A-V junctional fibers between the atrial musculature and the A-V node, thereby slowing transmission of the cardiac impulse into the ventricles.
Weak to moderate vagal stimulation slows the rate of heart pumping, often to as little as one-half normal.
Furthermore, strong stimulation of the vagi can stop com-pletely the rhythmical excitation by the sinus node or block completely transmission of the cardiac impulse from the atria into the ventricles through the A-V node. In either case, rhythmical excitatory signals are no longer transmitted into the ventricles.
The ventricles may stop beating for 5 to 20 seconds, but then some small area in the Purkinje fibers, usually in the ventricular septal portion of the A-V bundle, develops a rhythm of its own and causes ventricular contraction at a
rate of 15 to 40 beats per minute. This phenomenon is called ventricular escape.
Parasympathetic stimulation lead to hyperpolarization, the state of hyperpolarization makes the “resting” membrane potential of the sinus nodal fibers considerably more negative than usual, that is, −65 to −75 millivolts rather than the normal level of −55 to −60 mil-livolts. Therefore, the initial rise of the sinus nodal mem-brane potential caused by inward sodium and calcium leakage requires much longer to reach the threshold potential for excitation.
In the A-V node, a state of hyperpolarization caused by vagal stimulation
makes it difficult for the small atrial fibers entering the node to generate enough elec-tricity to excite the nodal fibers. Therefore, the safety factor for transmission of the cardiac impulse through the transitional fibers into the A-V nodal fibers decreases.
Sympathetic Stimulation Increases the Cardiac Rhythm and Conduction Stimulation of the sympathetic nerves releases the hormone
norepinephrine at the sympathetic nerve endings. Norepinephrine in turn stimulates beta-1 adrenergic receptors, which mediate the effects on heart rate.
the belief is that it increases the permeability of the fiber membrane to sodium and calcium ions. In the sinus node, an increase of sodium-calcium permeability causes a more positive resting potential and also causes an increased rate of upward drift of the diastolic membrane potential toward the threshold level for self-excitation, thus accelerating self-excitation and, therefore, increasing the heart rate.
In the A-V node and A-V bundles, increased sodium-calcium permeability makes it easier for the action poten-tial to excite each succeeding portion of the conducting fiber bundles, thereby decreasing the conduction time from the atria to the ventricles.
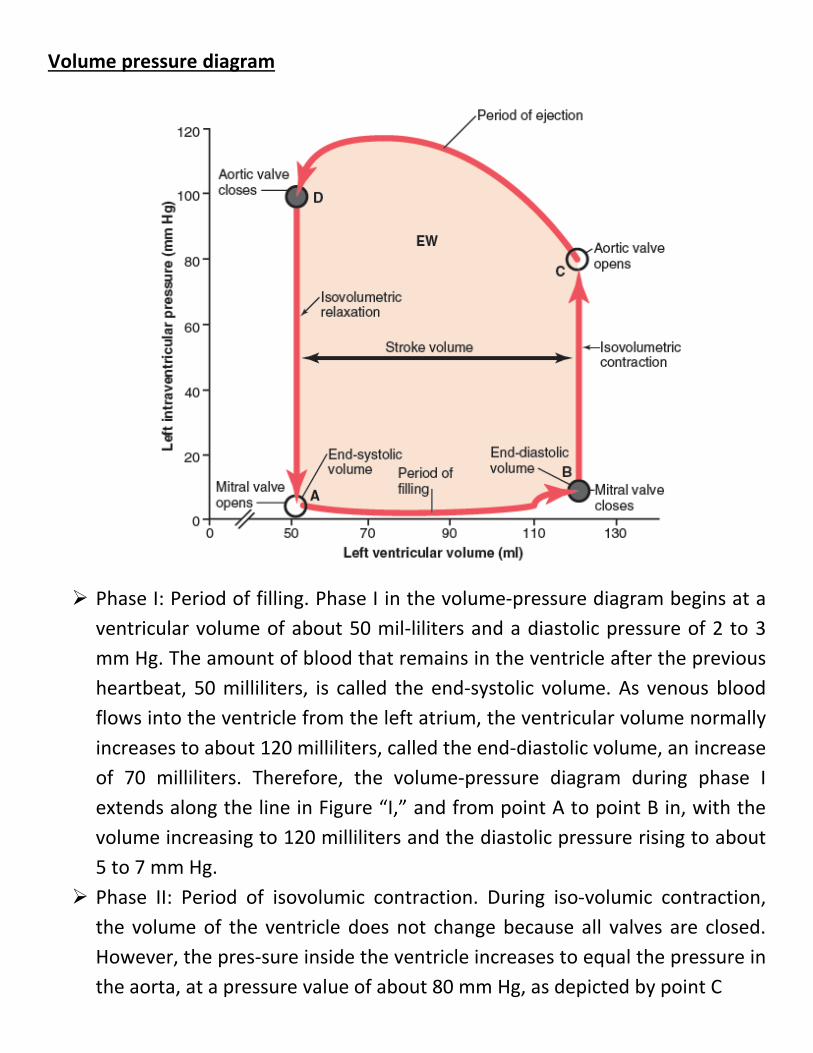
Volume pressure diagram
Phase I: Period of filling. Phase I in the volume-pressure diagram begins at a ventricular volume of about 50 mil-liliters and a diastolic pressure of 2 to 3 mm Hg. The amount of blood that remains in the ventricle after the previous heartbeat, 50 milliliters, is called the end-systolic volume. As venous blood flows into the ventricle from the left atrium, the ventricular volume normally increases to about 120 milliliters, called the end-diastolic volume, an increase of 70 milliliters. Therefore, the volume-pressure diagram during phase I extends along the line in Figure “I,” and from point A to point B in, with the volume increasing to 120 milliliters and the diastolic pressure rising to about 5 to 7 mm Hg.
Phase II: Period of isovolumic contraction. During iso-volumic contraction, the volume of the ventricle does not change because all valves are closed. However, the pres-sure inside the ventricle increases to equal the pressure in the aorta, at a pressure value of about 80 mm Hg, as depicted by point C
Phase III: Period of ejection. During ejection, the sys-tolic pressure rises even higher because of still more con-traction of the ventricle. At the same time, the volume of the ventricle decreases because the aortic valve has now opened and blood flows out of the ventricle into the aorta. the curve labeled “III,” or “period of ejection,” traces the changes in volume and systolic pressure during this period of ejection.
Phase IV: Period of isovolumic relaxation. At the end of the period of ejection (point D;), the aortic valve closes and the ventricular pressure falls back to the diastolic pressure level. The line labeled “IV traces this decrease in intraventricular pressure without any change in volume. Thus, the ventricle returns to its starting point, with about 50 milliliters of blood left in the ventricle and in an atrial pressure of 2 to 3 mmHg
Preload and afterload
For cardiac contraction, the preload is usually considered to be the end diastolic pressure when the ventricle has become filled.
The afterload of the ventricle is the pressure in the aorta leading from the ventricle
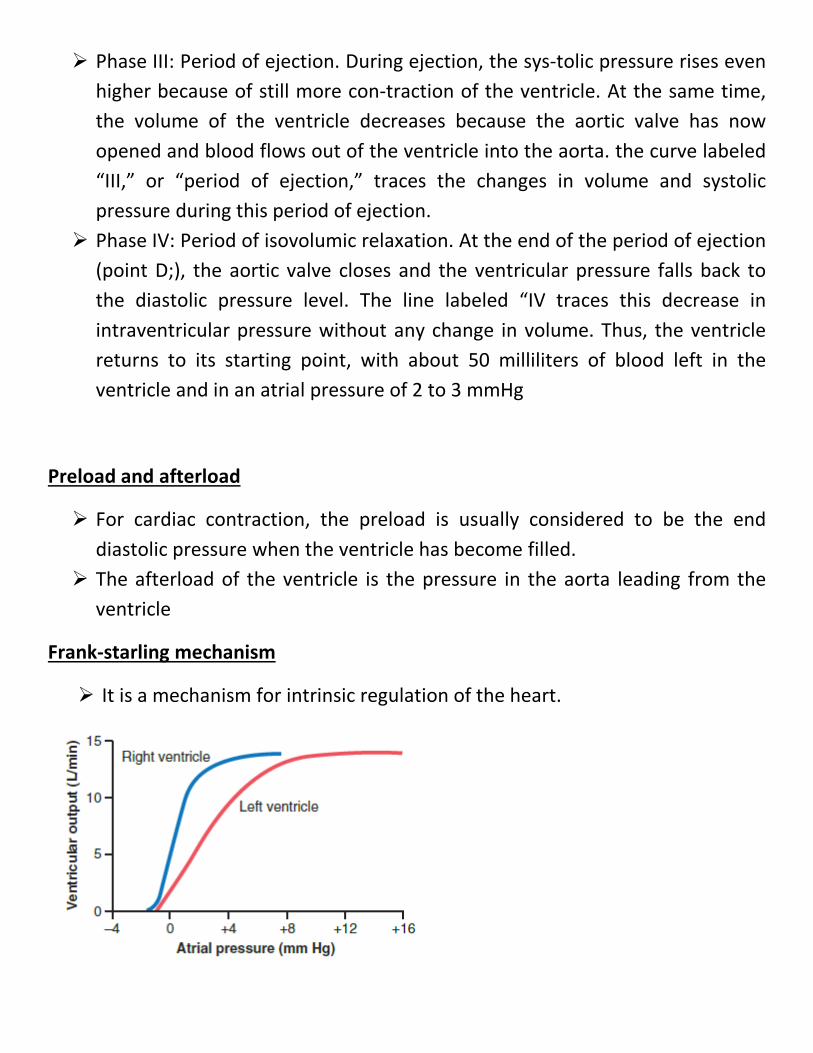
Frank-starling mechanism
It is a mechanism for intrinsic regulation of the heart.
As the venous return increases, the cardiac output ( stroke volume output ) increase too.
When an extra amount of blood flows into the ventricles, the cardiac muscle is stretched to a greater length. This stretching in turn causes the muscle to con-tract with increased force because the actin and myosin filaments are brought to a more nearly optimal degree of overlap for force generation. Therefore, the ventricle, because of its increased pumping, automatically pumps the extra blood into the arteries.
Increasing stretch ( end diastolic volume ) of the cardiac muscle will increase the contractility.
Note that as the atrial pressure for each side of the heart increases, the stroke work output for that side increases until it reaches the limit of the ventricle’s pumping ability.
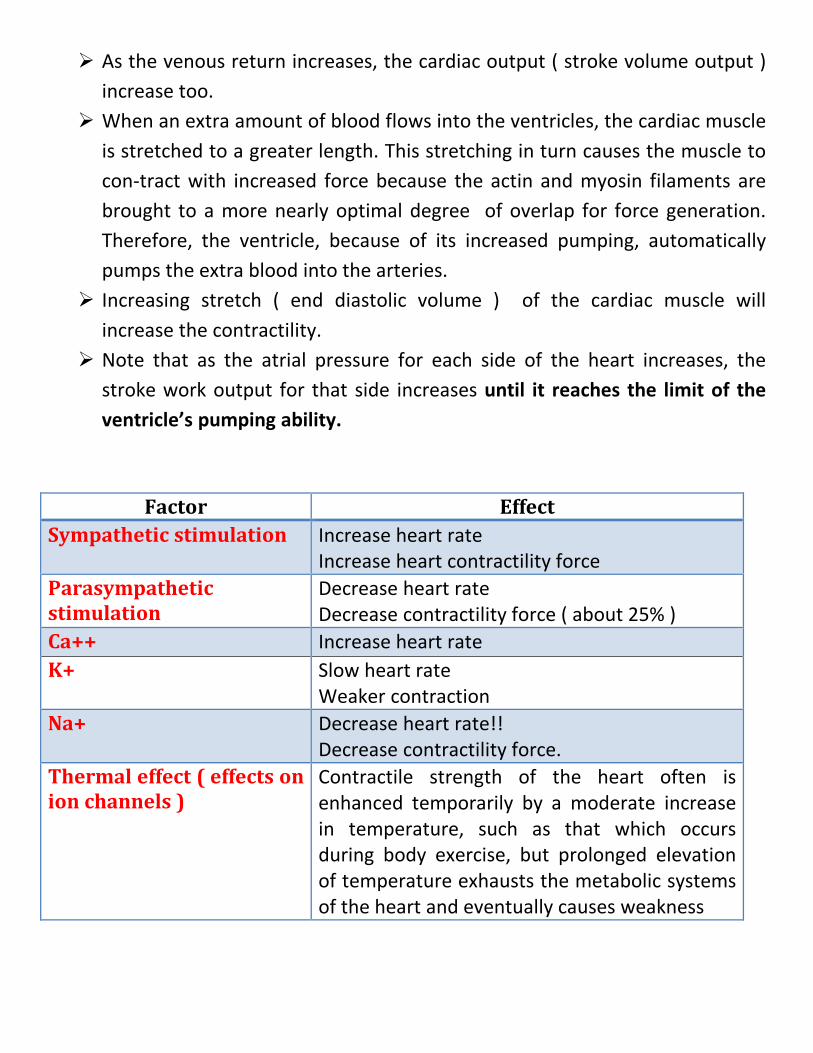
Factor Effect Sympathetic stimulation Increase heart rate
Increase heart contractility force Parasympathetic stimulation
Decrease heart rate Decrease contractility force ( about 25% )
Ca++ Increase heart rate K+ Slow heart rate
Weaker contraction Na+ Decrease heart rate!!
Decrease contractility force. Thermal effect ( effects on ion channels )
Contractile strength of the heart often is enhanced temporarily by a moderate increase in temperature, such as that which occurs during body exercise, but prolonged elevation of temperature exhausts the metabolic systems of the heart and eventually causes weakness
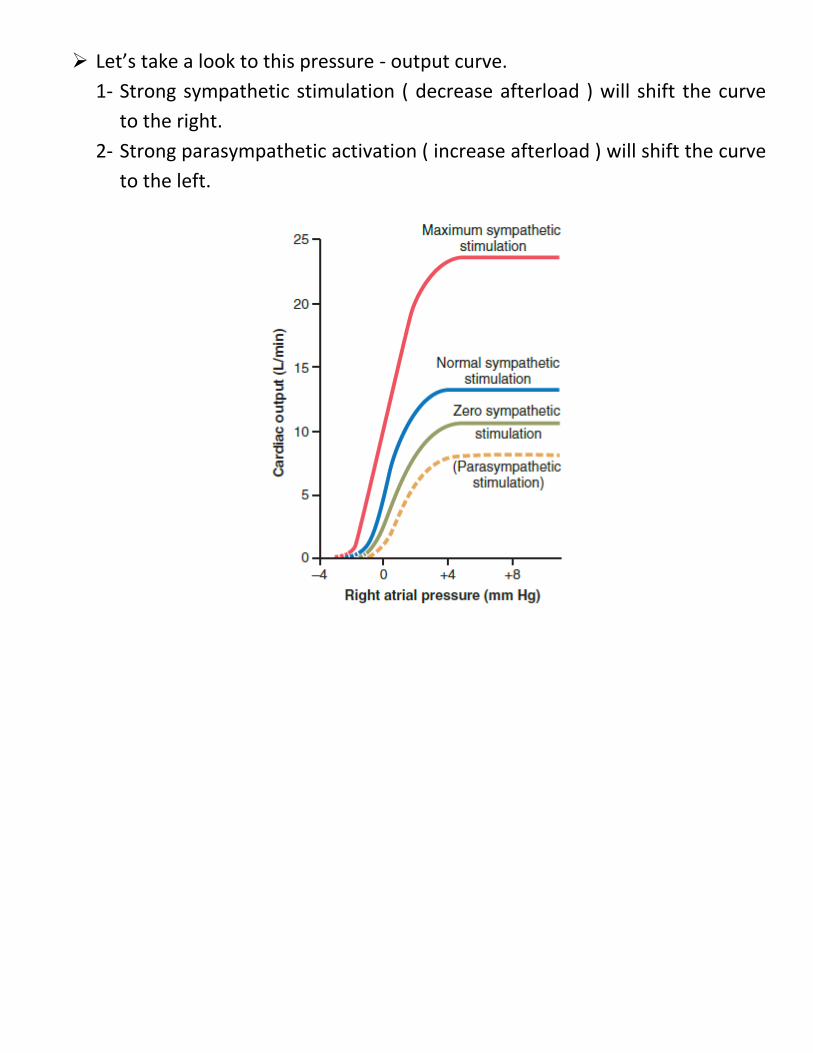
Let’s take a look to this pressure - output curve. 1- Strong sympathetic stimulation ( decrease afterload ) will shift the curve
to the right. 2- Strong parasympathetic activation ( increase afterload ) will shift the curve
to the left.