Embed Size (px)
Citation preview
Brewing Yeast Fermentation Performance
Brewing Yeast Fermentation PerformanceSecond edition
Edited by
KATHERINE SMARTOxford Brookes UniversityOxford, UK
© Blackwell Science 2003
Blackwell Science Ltd, a Blackwell PublishingCompanyEditorial Offices:
Blackwell Science, Inc., 350 Main Street,Malden, MA 02148-5018, USA
Tel: 1 1 781 388 8250Iowa State Press, a Blackwell Publishing Company, 2121 State Avenue, Ames, Iowa50014-8300, USA
Tel: 1 1 515 292 0140Blackwell Publishing Asia Pty, 550 SwanstonStreet, South Carlton, Victoria 3053, Australia
Tel: 1 61 (0)3 9347 0300Blackwell Wissenschafts Verlag,Kurf rstendamm 57, 10707 Berlin, Germany
Tel: 1 49 (0)30 32 79 060
The right of the Author to be identified as the Author of this Work has been asserted inaccordance with the Copyright, Designs andPatents Act 1988.
All rights reserved. No part of this publication maybe reproduced, stored in a retrieval system, ortransmitted, in any form or by any means,electronic, mechanical, photocopying, recording orotherwise, except as permitted by the UKCopyright, Designs and Patents Act 1988, withoutthe prior permission of the publisher.
First edition published 2000 Second edition published 2003
Library of CongressCataloging-in-Publication Data is available
ISBN 0-632-06498-6
A catalogue record for this title is available fromthe British Library
Typeset and produced by Gray Publishing,Tunbridge Wells, KentPrinted and bound in Great Britain by MPG Books Ltd, Bodmin, Cornwall
For further information on Blackwell Science, visitour website:
9600 Garsington Road, Oxford OX4 2DQ, UKTel: +44 (0)1865 776868 ++
www.blackwellpublishing.com
Contributors
A. AitchisonScottish Courage Brewing Ltd, Technical Centre, 160 Canongate, Edinburgh EH8 8DD, UK
P. AttfieldCentre for Fluorimetric Applications in Biotechnology, Department of BiologicalSciences, Macquarie University, North Ryde, Sydney, NSW 2109, Australia
B. AxcellThe South African Breweries Ltd, Corporate Technical Centre, PO Box 782178,Sandton 2146, South Africa
C.W. BamforthDepartment of Food Science & Technology, University of California, Davis, CA 95616-8598, USA
F.F. BauerDepartment of Microbiology and Institute for Wine Biotechnology, University ofStellenbosch, Stellenbosch 7600, South Africa
H. BergOy Sinebrychoff Ab, PO Box 87, FI-04201 Kerava, Finland
K. BerghofBIOTECON Diagnostics GmbH, Hermannswerder Haus 17, 14473 Potsdam,Germany
C. BoultonBass Brewers Ltd, Technical Centre, PO Box 12, Cross Street, Burton upon TrentDE14 1XH, UK
W. BoxBass Brewers Ltd, Technical Centre, PO Box 12, Cross Street, Burton upon TrentDE14 1XH, UK
A. BoydCentre for Fluorimetric Applications in Biotechnology, Department of BiologicalSciences, Macquarie University, North Ryde, Sydney, NSW 2109, Australia
P. ChambersSchool of Food Science and Technology, Victoria University, Werribee Campus,PO Box 14428, Melbourne City, Victoria 8001, Australia
M. ChandlerSchool of Food Science and Technology, Victoria University, Werribee Campus,PO Box 14428, Melbourne City, Victoria 8001, Australia
S. CollinUniversité Catholique de Louvain, Unité de Brasserie et des Industries Alimentaires,Croix du Sud 2/7, B-1348 Louvain-la-Neuve, Belgium
F.R. DalvauxCentre for Malting and Brewing Science, Faculty of Agricultural and AppliedBiological Sciences, Katholieke Universiteit Leuven, Kasteelpark Arenberg 22,3001 Heverlee, Belgium
I. DawesSchool of Biochemistry and Molecular Genetics, University of New South Wales,Sydney, NSW 2052, Australia
A. DebourgDepartment of Brewing Sciences and Fermentation Technologies, Institut Meurice,1 Avenue E. Gryson, B-1070 Brussels, Belgium
F.R. DelvauxCentre for Malting and Brewing Science, Faculty of Agricultural and AppliedBiological Sciences, Kathalieke Universiteit Leuven, Kasteelpark Arenberg 22,3001 Heverlee, Belgium
G. DerdelinckxCentre for Malting and Brewing Science, Faculty of Agricultural and AppliedBiological Sciences, Kathalieke Universiteit Leuven, Kasteelpark Arenberg 22,3001 Heverlee, Belgium
J. R. DickinsonCardiff School of Biosciences, Cardiff University, PO Box 915, Cardiff CF10 3TL, UK
M. DillemansDepartment of Brewing Sciences and Fermentation Technologies, Institut Meurice,1 Avenue E. Gryson, B-1070 Brussels, Belgium
J.-P. DufourDepartment of Food Science, University of Otago, PO Box 56, Dunedin, NewZealand
M. FandkeBIOTECON Diagnostics GmbH, Hermannswerder Haus 17, 14473 Potsdam,Germany
L. GijsUniversité Catholique de Louvain, Unité de Brasserie et des Industries Alimentaires,Croix du Sud 2/7, B-1348 Louvain-la-Neuve, Belgium
X. GreenScottish Courage Brewing Ltd, Technical Centre, 160 Canongate, Edinburgh EH8 8DD, UK
vi CONTRIBUTORS
S. GualdoniSchool of Biological and Molecular Sciences, Oxford Brookes University, GipsyLane, Oxford OX3 0BP, UK
T. GunasekeraCentre for Fluorimetric Applications in Biotechnology, Department of BiologicalSciences, Macquarie University, North Ryde, Sydney, NSW 2109, Australia
V. HigginsSchool of Biochemistry and Molecular Genetics, University of New South Wales,Sydney, NSW 2052, Australia
J.A. HodgsonScottish Courage Brewing Ltd, Technical Centre, Sugarhouse Close, 160 Canongate,Edinburgh EH8 8DD, UK
G.A. HulseThe South African Breweries, Beer Division, Brewing Research & DevelopmentDepartment, PO Box 782178, Sandton 2146, South Africa
K.J. HutterEichbaum Brauereien AG, Käfertaler Straße170, D-68169 Mannheim, Germany
C.L. JenkinsSchool of Biological and Molecular Sciences, Oxford Brookes University, Headington,Oxford OX3 0BP, UK
A.I. KennedyScottish Courage Brewing Ltd, Technical Centre, Sugarhouse Close, 160 Canongate,Edinburgh EH8 8DD, UK
M. KiehneBIOTECON Diagnostics GmbH, Hermannswerder Haus 17, 14473 Potsdam,Germany
O. KobayashiKirin Brewery Co., Ltd., Central Laboratories for Key Technology, 1-13-5, Fukuura,Kanazawa-ku, Yokohama-shi, Kanagawa 236-0004, Japan
C. LangeEichbaum Brauereien AG, Käfertaler Straße170, D-68169 Mannheim, Germany
A. LentiniCarlton and United Breweries Ltd/Foster’s Group Ltd, 4-6 Southampton Crescent,Abbotsford, Victoria 3067, Australia
P. MalcorpsInterbrew, Vaarstraat 94, B-3000 Leuven, Belgium
V. MartinSchool of Biological and Molecular Sciences, Oxford Brookes University, GipsyLane Campus, Headington, Oxford OX3 0BP, UK
CONTRIBUTORS vii
D.L. MaskellSchool of Biological and Molecular Sciences, Oxford Brookes University, GipsyLane, Headington, Oxford OX3 0BP, UK
N. MoonjaiCentre for Malting and Brewing Science, Faculty of Agricultural and AppliedBiological Sciences, Katholuke Universiteit Leuven, Kasteelpark Arenberg 22,3001 Heverlee, Belgium
E. PajunenOy Sinebrychoff Ab, PO Box 87, FI-04201 Kerava, Finland
A. PardigolBIOTECON Diagnostics GmbH, Hermannswerder Haus 17, 14473 Potsdam,Germany
P. PerpèteUniversité Catholique de Louvain, Unité de Brasserie et des Industries Alimentaires,Croix du Sud 2/7, B-1348 Louvain-la-Neuve, Belgium
C.D. PowellSchool of Biological and Molecular Sciences, Oxford Brookes University,Headington, Oxford OX3 0BP, UK
I.S. PretoriusDepartment of Microbiology and Institute for Wine Biotechnology, University ofStellenbosch, Stellenbosch 7600, South Africa
D.E. QuainBass Brewers, Technical Centre, PO Box 12, Cross Street, Burton-upon-TrentDE14 1XH, UK
B. RantaOy Sinebrychoff Ab, PO Box 87, FI-04201 Kerava, Finland
K.E. RichardsonWhite Labs, Inc., 7564 Trade Street, San Diego, CA 92121, USA
P. RogersCarlton and United Breweries Ltd/Foster’s Group Ltd, 4-6 Southampton Crescent,Abbotsford, Victoria 3067, Australia
A.J. SchieweWhite Labs, Inc., 7564 Trade Street, San Diego, CA 92121, USA
P. SilcockDepartment of Food Science, University of Otago, PO Box 56, Dunedin, NewZealand
O. SimalSchool of Biological and Molecular Sciences, Oxford Brookes University, GipsyLane, Oxford OX3 0BP, UK
viii CONTRIBUTORS
K. SimicKent Brewery, Carlton and United Breweries, Broadway, Sydney, NSW 2001, Australia
K.A. SmartSchool of Biological and Molecular Sciences, Oxford Brookes University, Gipsy LaneCampus, Headington, Oxford OX3 0BP, UK
P. Soininen-TengvallOy Sinebrychoff Ab, PO Box 87, FI-04201 Kerava, Finland
R.A. StaffordThe South African Breweries Ltd, Engineering Development, Corporate TechnicalCentre, PO Box 782178, Sandton, 2146, South Africa
G. StanleySchool of Food Science and Technology, Victoria University Werribee Campus,P.O. Box 14428 Melbourne City, Victoria 8001, Australia
B. TaidiScottish Courage Brewing Ltd, Technical Centre, 160 Canongate, Edinburgh EH88DD, UK
K. TanakaKirin Brewery Co., Ltd., Central Laboratories for Key Technology, 1-13-5, Fukuura,Kanazawa-ku, Yokohama-shi, Kanagawa 236-0004, Japan
K. TapaniOy Sinebrychoff Ab, PO Box 87, FI-04201 Kerava, Finland
A. TauschmannBIOTECON Diagnostics GmbH, Hermannswerder Haus 17, 14473 Potsdam,Germany
J.M. TheveleinLaboratory of Molecular Cell Biology, Department of Biology, KU Leuven,Kasteelpark Arenberg 31, B-3001 Leuven (Heverlee), Belgium
P. ThurstonScottish Courage Brewing Ltd, Berkshire Brewery, Imperial Way, Reading RG2 0PN, UK
L. Van NederveldeDepartment of Brewing Sciences and Fermentation Technologies, Institut Meurice,1 Avenue E. Gryson, B-1070 Brussels, Belgium
S.M. Van ZandyckeSMART Brewing Services, Oxford Brookes Enterprises, School of Biological andMolecular Sciences, Gipsy Lane, Oxford OX3 0BP, UK
D. VealCentre for Fluorimetric Applications in Biotechnology, Department of BiologicalSciences, Macquarie University, North Ryde, Sydney, NSW 2109, Australia
CONTRIBUTORS ix
H. VerachtertCentre for Malting and Brewing Science, Faculty of Agricultural and AppliedBiological Sciences, Katholieke Universiteit Leuven, Kasteelpark Arenberg 22,3001 Heverlee, Belgium
K.J. VerstrepenCentre for Malting and Brewing Science, Faculty of Agricultural and AppliedBiological Sciences, Katholieke Universiteit Leuven, Kasteelpark Arenberg 22,3001 Heverlee, Belgium
S. VincentKent Brewery, Carlton and United Breweries, Broadway, Sydney, NSW 2001,Australia
C.E. WhiteWhite Labs, Inc., 7564 Trade Street, San Diego, CA 92121, USA
L.R. WhiteWhite Labs, Inc., 7564 Trade Street, San Diego, CA 92121, USA
P.A. WhiteSchool of Biological and Molecular Sciences, Oxford Brookes University, GipsyLane Campus, Headington, Oxford OX3 0BP, UK
J. WinderickxLaboratory of Molecular Cell Biology, Department of Biology, KU Leuven,Kasteelpark Arenberg 31, B-3001 Leuven (Heverlee), Belgium
x CONTRIBUTORS
Contents
Contributors vPreface to the second edition xxvKatherine A. Smart
Part 1 Molecular Innovations 1
1 Analysis of karyotypic polymorphisms in a bottom-fermenting yeast strain by polymerase chain reaction 3K. Tanaka and O. Kobayashi
1.1 Introduction 31.2 Materials and methods 4
1.2.1 Strains and media 41.2.2 Pulsed field gel electrophoresis and Southern
hybridisation of chromosomal DNA 41.2.3 DNA manipulations and sequencing 41.2.4 Polymerase chain reaction procedures 4
1.3 Results and discussion 51.3.1 Chromosome length polymorphisms in a
bottom-fermenting yeast strain 51.3.2 Structure of the 840 kb chromosome 61.3.3 Structure of the 820 kb chromosome 61.3.4 Translocation point in the 960 kb chromosome 81.3.5 Development of the method for detection of the 960 kb
chromosome by polymerase chain reaction 101.4 Conclusions 11References 11
2 Fast detection of beer spoilage microorganisms by consensus polymerase chain reaction with foodproof® beer screening 13K. Berghof, M. Fandke, A. Pardigol, A. Tauschmann and M. Kiehne
2.1 Introduction 132.2 Materials and methods 14
2.2.1 LightCycler™ Technology 142.2.2 Design of the polymerase chain reaction 152.2.3 Analytical procedure 16
2.2.3.1 Microbiological enrichment 162.2.3.2 Sample preparation 162.2.3.3 Standard protocol for polymerase chain
reaction preparation 172.3 Results and discussion 18
2.3.1 Detection of bacteria 182.3.2 Identification of bacteria 19
2.4 Conclusions 20References 21
Part 2 Brewing Yeast Stress Responses During Handling 23
3 The impact of ethanol stress on yeast physiology 25A. Lentini, P. Rogers, V. Higgins, I. Dawes, M. Chandler, G. Stanley and P. Chambers
3.1 Introduction 253.2 Materials and methods 26
3.2.1 Yeast storage trials 263.2.1.1 Membrane lipid composition 263.2.1.2 Trehalose content 263.2.1.3 Yeast slurry pH 263.2.1.4 Yeast protease 263.2.1.5 Yeast viability 263.2.1.6 Yeast vitality 26
3.2.2 Gene array technology 273.3 Results and discussion 27
3.3.1 Impact of ethanol and temperature on thestructure of the yeast cell membrane 27
3.3.2 Cell-wall trehalose 283.3.3 Yeast slurry pH 293.3.4 Protease release from yeast 303.3.5 Yeast vitality 31
3.3.5.1 Acidification power test 313.3.5.2 Oxygen uptake rate 32
3.3.6 Changes in gene expression 323.3.6.1 Observations on using gene array technology 36
3.4 Conclusions 36Acknowledgements 37References 37
4 Yeast physical (shear) stress: the engineering perspective 39R.A. Stafford
4.1 Introduction 394.1.1 Yeast cell response to shear stress 404.1.2 Cell stimuli 404.1.3 Newton’s law of viscosity: a gross deforming force 414.1.4 Yeast rheology 414.1.5 Methods of estimating shear rate of agitated systems 424.1.6 Energy dissipation rate 434.1.7 Kolmogorov turbulence scale 434.1.8 Residence/exposure time 43
4.2 Conclusions 44
xii CONTENTS
Acknowledgements 44References 44
5 The osmotic stress response of ale and lager brewing yeast strains 46P.A. White, A.I. Kennedy and K.A. Smart
5.1 Introduction 465.2 Materials and methods 48
5.2.1 Yeast strains 485.2.2 Media and growth conditions 485.2.3 Osmotic challenge 485.2.4 Viability determinations 485.2.5 Glycerol determination 485.2.6 Preparation of cells for confocal microscopic analysis 49
5.2.6.1 Staining of vacuole lumen 495.2.6.2 Staining of tonoplast 495.2.6.3 Staining of plasma membrane 495.2.6.4 Visualisation of samples 49
5.3 Results and discussion 495.3.1 Osmotic stress tolerance of YPD-grown cells 49
5.3.1.1 Physiological state 495.3.1.2 Strain dependence 515.3.1.3 Solute considerations 51
5.3.2 Compatible solute accumulation 535.3.2.1 Physiological state 535.3.2.2 Strain dependence and glycerol accumulation 535.3.2.3 Solute considerations of glycerol accumulation 53
5.3.3 Vacuolar changes 565.3.3.1 Vacuolar morphology of YPD-grown cells 575.3.3.2 Vacuolar morphology of exponential-phase cells 575.3.3.3 Vacuolar fragmentation and osmotic stress 57
5.4 Conclusions 58Acknowledgements 59References 59
6 Brewing yeast oxidative stress responses: impact of brewery handling 61V. Martin, D.E. Quain and K.A. Smart
6.1 Introduction 616.2 Materials and methods 62
6.2.1 Yeast strains and growth conditions 626.2.2 Yeast sample collection 626.2.3 Determination of response to oxidative stress 626.2.4 Glutathione concentration 626.2.5 Protein extraction for enzymic assays by glass bead 62
cell lysis method6.2.6 Catalase activity 636.2.7 Glycogen and trehalose concentration 63
CONTENTS xiii
6.3 Results and discussion 636.3.1 Oxidative stress resistance is dependent on growth
phase, strain and medium 636.3.2 Defence mechanisms against hydrogen peroxide are
dependent on strain and medium 636.3.3 Cellular damage 666.3.4 Oxidative stress during the brewing process 676.3.5 Propagation 676.3.6 Pitching 686.3.7 Storage and acid washing 696.3.8 Serial repitching 70
6.4 Conclusions 71Acknowledgements 71References 72
Part 3 Wort Composition: Impact on Yeast Metabolism and Performance 75
7 Wort composition and beer quality 77C.W. Bamforth
7.1 Introduction 777.2 The relationship of wort composition to beer quality 787.3 The key components of wort 787.4 The impact of wort on the production of flavour
compounds by yeast 797.5 Models 817.6 Sources of variability in wort composition 837.7 Conclusions 84Acknowledgements 84References 84
8 Wort substitutes and yeast nutrition 86B. Taidi, A.I. Kennedy and J.A. Hodgson
8.1 Introduction 868.2 Materials and methods 87
8.2.1 Materials 878.2.2 Fully defined medium 878.2.3 Semi-defined medium 898.2.4 Analytical methods 89
8.3 Results and discussion 908.3.1 Fully defined medium 908.3.2 Semi-defined medium 92
8.4 Conclusions 95Acknowledgements 95References 95
xiv CONTENTS
9 Wort supplements: from yeast and for yeast 96M. Dillemans, L. Van Nedervelde and A. Debourg
9.1 Introduction 969.2 Materials and methods 97
9.2.1 Yeast strains 979.2.2 Fermentations 979.2.3 Measurement of glucose uptake 979.2.4 Measurement of fructose-2,6-biphosphate 989.2.5 Acidification power test 989.2.6 Determination of enzyme activities 989.2.7 Measurement of glycerol 989.2.8 Protein determination 999.2.9 Lipid extraction 999.2.10 Glycogen determination 999.2.11 Farnesol-induced growth inhibition 1009.2.12 Effect of ethanol and osmotic pressure on
growth on glucose and maltose 1009.2.13 Effect of ethanol and osmotic pressure on
fermentation power 1009.3 Results and discussion 100
9.3.1 Influence of yeast peptide complex on fermentation rate 1009.3.2 Influence of yeast peptide complex on
glucose metabolism 1019.3.3 Influence of yeast peptide complex on anabolic
enzyme activities 1039.3.4 Influence of yeast peptide complex on yeast synthesis 1059.3.5 Mode of action of yeast peptide complex 1069.3.6 Influence of yeast peptide complex on ethanol and
osmotic stresses of growing cells 107References 108
10 Unsaturated fatty acid supplementation of stationary-phase brewing yeast and its effects on growth and fermentation ability 110N. Moonjai, K.J. Verstrepen, F.R. Delvaux, G. Derdelinckx andH. Verachtert
10.1 Introduction 11010.2 Materials and methods 111
10.2.1 Yeast strain and maintenance 11110.2.2 Growth medium 11110.2.3 Yeast propagation 11110.2.4 Preparation of stationary-phase cells and unsaturated
fatty acid supplementation 11110.2.5 Analysis of pitching yeast 11210.2.6 Test fermentations 11210.2.7 Monitoring of fermentation 11310.2.8 Analysis of volatile esters and higher alcohols 113
CONTENTS xv
10.3 Results and discussion 11310.3.1 Unsaturated fatty acid supplementation of
pitching yeast 11310.3.2 Fermentation with unsaturated fatty
acid-supplemented yeast 11510.4 Conclusions 118References 118
11 Impact of wort composition on flocculation 120B. Axcell
11.1 Introduction 12011.2 Molecular mechanism of yeast flocculation 12111.3 Premature flocculation and beer quality 12311.4 The antimicrobial peptide hypothesis 12411.5 Possible mechanism for premature flocculation 12511.6 Conclusions 126References 127
Part 4 Yeast Quality Maintenance and Assessment 129
12 Management of multi-strain, multi-site yeast storage and supply 131A.I. Kennedy, B. Taidi, A. Aitchison and X. Green
12.1 Introduction 13112.1.1 Historical perspective 131
12.2 Yeast culture management 13212.2.1 Aims 13212.2.2 Strategies for strain maintenance 13212.2.3 Selection of master cultures 13312.2.4 Testing procedures 133
12.2.4.1 Flocculation (Tullo) and adhesion 13312.2.4.2 Sedimentation (Helm’s test) 13312.2.4.3 Sugar utilisation 13312.2.4.4 Head formation 13312.2.4.5 Petite stability 13412.2.4.6 Fermentation performance 134
12.2.5 Deposition in liquid nitrogen 13412.2.6 Cascade storage system 13412.2.7 Retrieval from liquid nitrogen and slope preparation 13412.2.8 Quality assurance 135
12.2.8.1 Freedom from contamination 13512.2.8.2 Petite mutants 13512.2.8.3 Viability 13512.2.8.4 Genetic confirmation of identity 135
12.2.9 Integrity of supply 13612.2.10 Statistics 136
xvi CONTENTS
12.3 Conclusions 136Acknowledgements 136References 136
13 Comparison of yeast viability/vitality methods and their relationship to fermentation performance 138L.R. White, K.E. Richardson, A.J. Schiewe and C.E. White
13.1 Introduction 13813.2 Materials and methods 139
13.2.1 Yeast 13913.2.2 Citrate methylene blue 13913.2.3 Alkaline methylene blue 13913.2.4 Alkaline methylene violet 13913.2.5 Acidification power 14013.2.6 Standard plate count 14013.2.7 Fermentation 140
13.3 Results and discussion 14013.3.1 Citrate methylene blue 14013.3.2 Alkaline stains 142
13.3.2.1 Alkaline methylene blue 14213.3.2.2 Alkaline methylene violet 14213.3.2.3 Acidification power test 14513.3.2.4 Standard plate count 14513.3.2.5 Yeast performance 145
13.4 Conclusions 145References 147
14 Yeast quality and fluorophore technologies 149S.M. Van Zandycke, O. Simal, S. Gualdoni andK.A. Smart
14.1 Introduction 14914.2 Materials and methods 153
14.2.1 Yeast strains and growth conditions 15314.2.2 Yeast starvation and heat treatment 15314.2.3 Citrate methylene violet 15314.2.4 MgANS 15414.2.5 Oxonol 15414.2.6 Propidium iodide 15414.2.7 Sytox orange 15414.2.8 Berberine 15414.2.9 FUN1 15514.2.10 Plate count 15514.2.11 Photographs 155
14.3 Results and discussion 155
CONTENTS xvii
14.3.1 Can fluorophores differentiate between viable and non-viable populations? 15514.3.1.1 Lager strain L138 15614.3.1.2 Ale strain 2593 157
14.3.2 Determination of yeast cell viability of starved populations 158
14.4 Conclusions 160Acknowledgements 160References 160
15 Vitality assessment using the fluorescent stain FUN1 162S.M. Van Zandycke, O. Simal and K.A. Smart
15.1 Introduction 16215.2 Materials and methods 164
15.2.1 Yeast strains and growth conditions 16415.2.2 Starvation and oxidative stress 16415.2.3 Acidification power test 16415.2.4 Glycogen and trehalose 16415.2.5 FUN1 stain for vitality assessment 165
15.3 Results and discussion 16515.3.1 Determination of yeast cell vitality of
starved stressed populations 16515.3.2 Determination of yeast cell vitality of oxidatively
stressed populations 16615.4 Conclusions 167Acknowledgements 167References 168
16 Flow cytometry: a new tool in brewing technology 169K.J. Hutter and C. Lange
16.1 Introduction 16916.2 Materials and methods 170
16.2.1 Glycogen content 17016.2.2 DNA content 17016.2.3 Detection of beer spoilage contaminants 17016.2.4 Flow cytometry 170
16.3 Results and discussion 171Acknowledgement 173References 173
17 Comparison of the methylene blue assay with a new flow-cytometric method for determining yeast viability in a brewery 174A. Boyd, T. Gunasekera, P. Attfield, K. Simic, S. Vincent andD. Veal
17.1 Introduction 174
xviii CONTENTS
17.2 Materials and methods 17517.2.1 Trial location and yeast analysed 17517.2.2 Methylene blue staining and microscopic analysis 17517.2.3 Oxonol staining and flow-cytometric analysis 17517.2.4 Statistical analyses 176
17.3 Results and discussion 17617.3.1 Comparison of viability assays 17617.3.2 Operator error and reproducibility of viability data 177
17.4 Conclusions 178Acknowledgements 179References 179
Part 5 The Role of Brewing Yeast in Beer Flavour Development 181
18 Formation and disappearance of diacetyl during lager fermentation 183C. Boulton and W. Box
18.1 Introduction 18318.2 Materials and methods 18418.3 Results and discussion 18418.4 Conclusions 193Acknowledgements 194References 194
19 The formation of higher alcohols 196J.R. Dickinson
19.1 Introduction 19619.2 Conclusions 204References 205
20 Methionine: a key amino acid for flavour biosynthesis in beer 206P. Perpète, L. Gijs and S. Collin
20.1 Introduction 20620.2 Materials and methods 207
20.2.1 Reagents 20720.2.2 Strains 20720.2.3 Culture media and sampling 20820.2.4 Methanethiol quantification 208
20.3 Results and discussion 208References 211
21 Control of ester synthesis during brewery fermentation 213J.-P. Dufour, Ph. Malcorps and P. Silcock
21.1 Introduction 21321.2 Ester formation and excretion during fermentation 215
CONTENTS xix
21.3 The rate-limiting factors of ester synthesis and the relationship between ester synthesis, lipid metabolism and growth 21521.3.1 Synthesis of the acetate esters 21621.3.2 Synthesis of the medium-chain fatty
acid esters (C6–C10) 21721.4 Parameters influencing the synthesis of beer esters 21821.5 Influence of the yeast characteristics on the synthesis of esters 219
21.5.1 Yeast strain 21921.5.2 Pitching rate 21921.5.3 Genetic and physiological instability of brewing yeast 219
21.6 Physicochemical and technological parameters affecting the production of esters during brewing fermentation 22121.6.1 Influence of lipids on ester synthesis 221
21.7 Influence of oxygen/air on ester synthesis 22221.7.1 Influence of the trace element: zinc 223
21.8 Influence of fermentation conditions 22421.8.1 Stirring 22421.8.2 Effect of carbon dioxide pressure 22421.8.3 Fermentation in cylindroconical fermenters 22421.8.4 Continuous fermentation and maturation 22521.8.5 Temperature 226
21.9 Contribution of esterase activities to beer ester levels 22621.10 Conclusions 227References 228
22 Genetic regulation of ester synthesis in yeast: new facts, insights and implications for the brewer 234K.J. Verstrepen, N. Moonjai, F.F. Bauer, G. Derdelinckx, J.-P. Dufour, J. Winderickx, J.M. Thevelein, I.S. Pretorius and F.R. Delvaux
22.1 Introduction 23422.2 Materials and methods 236
22.2.1 Microbial strains, media and culturing conditions 23622.2.2 DNA manipulations 23722.2.3 Fermentation experiments 23722.2.4 Sensory analysis 23822.2.5 Headspace analysis for the measurement of
acetaldehyde, ethyl acetate, n-propanol, isobutanol, isoamyl alcohol, isoamyl acetate and ethyl caproate 238
22.2.6 Liquid chromatography for the measurement of wort sugars 238
22.2.7 Carbon starvation 23822.2.8 RNA extraction and Northern analysis 239
xx CONTENTS
22.3 Results and discussion 23922.3.1 Activity of ATF1, ATF2 and EHT1 during
brewery fermentations 23922.3.2 Overexpression of ATF1 and ATF2 in brewing yeast: genetic
modification allows management of ester production 24022.3.3 ATF1 is regulated by glucose through the
cyclic AMP/protein kinase A signalling pathway 24222.4 Conclusions 245Acknowledgements 246References 246
Part 6 Yeast Handling: Objectives, Obstacles and Opportunities 249
23 Yeast Propagation 251G.A. Hulse
23.1 Introduction 25123.2 Historical perspective 25223.3 Current perspective 25223.4 Future perspectives 25523.5 Conclusions 255References 256
24 Serial repitching fermentation performance and functional biomarkers 257C.L. Jenkins, A.I. Kennedy, P. Thurston, J.A. Hodgson and K.A. Smart
24.1 Introduction 25724.2 Materials and methods 259
24.2.1 Yeast strains and growth conditions 25924.2.2 Citrate methylene violet 25924.2.3 MgANS 26024.2.4 Viability plate counts 26024.2.5 Intracellular glycogen and trehalose determination 26024.2.6 Determination of frequency of petite mutation 26024.2.7 Propensity to form petites 26024.2.8 Budding index 26124.2.9 Percentage of yeast solids 26124.2.10 Flocculation 26124.2.11 Cell-surface charge 26224.2.12 Hydrophobicity 26224.2.13 Vicinal diketone uptake 262
24.3 Results and discussion 26224.3.1 Impact of serial repitching on yeast quality 26224.3.2 Impact of serial repitching on petite mutation 265
CONTENTS xxi
24.3.3 Impact of serial repitching on the fermentation performance of lager brewing yeast 266
24.3.4 Impact of fermentation on the replicative capacity of lager brewing yeast 266
24.3.5 Impact of serial repitching on the attenuation of lager brewing yeast 267
24.3.6 Impact of serial repitching on the flavour development of lager brewing yeast 267
24.3.7 Impact of serial repitching on the flocculation capacity and cell-surface characteristics of lager brewing yeast 268
24.4 Conclusions 269Acknowledgements 269References 269
25 The impact of yeast cell age on fermentation, attenuation and flocculation 272C.D. Powell, D.E. Quain and K.A. Smart
25.1 Introduction 27225.2 Materials and methods 273
25.2.1 Yeast strains 27325.2.2 Preparation of aged cell fractions 27325.2.3 Sucrose gradients 273
25.2.3.1 Preparation of virgin cells 27325.2.4 Fermentations 27325.2.5 Measurement of cell flocculation 274
25.2.5.1 Helm’s test 27425.2.6 Cell-surface hydrophobicity 27425.2.7 Cell-surface charge 274
25.3 Results and discussion 27425.3.1 Age synchronisation of yeast 27425.3.2 Influence of cell age on the rate of sugar
utilisation during fermentation 27425.3.3 Impact of age on cell flocculation 27625.3.4 Relationship between age and cell hydrophobicity
and cell surface charge 27625.4 Conclusions 279Acknowledgements 279References 279
26 Chronological and replicative lifespan in lager brewing yeast 281D.L. Maskell, A.I. Kennedy, J.A. Hodgson andK.A. Smart
26.1 Introduction 28126.2 Materials and methods 283
26.2.1 Yeast strains 28326.2.2 Media and growth conditions 283
xxii CONTENTS
26.2.3 Micromanipulation 28326.2.3.1 Data analysis 284
26.2.4 Extended stationary phase 28426.2.5 Production of sucrose gradients 28426.2.6 Production of virgin and non-virgin populations 28426.2.7 Viability assessment 284
26.2.7.1 Citrate methylene violet 28426.2.7.2 Oxonol 28526.2.7.3 Plate counts 285
26.3 Results and discussion 28526.3.1 Replicative lifespan of four strains of lager brewing yeast 28526.3.2 Chronological lifespan of four strains of lager brewing yeast 28626.3.3 Is there a correlation between replicative and
chronological lifespan? 28726.3.4 Do chronologically aged brewing yeast cells
demonstrate a reduced replicative lifespan? 28826.4 Conclusions 289Acknowledgements 290References 290
27 Continuous primary fermentation of beer with immobilised yeast 293K. Tapani, P. Soininen-Tengvall, H. Berg, B. Ranta and E. Pajunen
27.1 Introduction 29327.2 Materials and methods 294
27.2.1 Yeast and wort 29427.2.2 Carrier 29427.2.3 Pilot plant unit 29427.2.4 Start-up procedures 29427.2.5 Basis for continuous fermentation 29527.2.6 Process conditions 29527.2.7 Analytical methods 295
27.2.7.1 Fermentation analyses 29527.2.7.2 Flavour compounds and vicinal diketones 29627.2.7.3 Fermentable sugars 29627.2.7.4 Microbiological analysis 296
27.3 Results and discussion 29627.3.1 Fermentation 29627.3.2 Flavour formation 29627.3.3 Vicinal diketones 29827.3.4 Free amino nitrogen 299
27.4 Conclusions 299Acknowledgements 300References 300
Index 303
CONTENTS xxiii
Preface to the second edition
Controlling the impact of stress on brewing biomass, predicting yeast activity andensuring consistent fermentation performance through successive fermentationsremain areas of active interest for the brewing industry.
To be able to control and perhaps even manipulate yeast activity, it is necessary toidentify factors that affect its functionality during fermentation. Genetic stability andintegrity are crucial to maintaining predictable performance. The brewing yeastgenome is inherently unstable, leading to the formation of nuclear and mitochondrialvariants during yeast handling and fermentation. Although recent molecular innovationsmay allow rapid detection of such occurrences, the causes and nature of the DNAdamage remain to be elucidated.
During handling and fermentation the yeast is subjected to a rapidly changingenvironment. There are many stresses to be considered, including physical stressessuch as shear, cold shock and hydrostatic pressure, and those created by the yeast’sown biochemical activity such as oxidative stress, nutrient limitation, anaerobiosis,osmotic stress, low pH, excess carbon dioxide and the formation of toxic metabolites.In addition, wort composition is a critical determinant of yeast performance and finalproduct quality. Batch-to-batch changes in component ratios inevitably contribute tothe variability in performance exhibited by a given slurry, yet few extensive studieshave been conducted in this area. This very variability in both wort composition andyeast quality is reflected in final beer quality and in particular beer flavour. The roleof the yeast cell in flavour attributes is therefore dependent on both intrinsic andextrinsic factors.
It is not unreasonable to suggest that the physiological condition of brewing yeastinfluences fermentation performance, therefore brewers require consistent yeastquality and quantity. Ensuring the correct quality can be achieved by adequate strainselection and maintenance though master culture storage regimes and effectivepropagation and yeast handling during serial repitching. Preventing slurry deteriora-tion through the use of immobilisation may prove successful but there is still arequirement to identify adequate biomarkers for slurry deterioration and potential to perform.
Katherine A. SmartRoyal Society Industrial Fellow
Scottish Courage Reader in Brewing Science

Part 1 Molecular Innovations
1 Analysis of Karyotypic Polymorphisms in a Bottom-fermenting Yeast Strain by Polymerase Chain Reaction
K. TANAKA and O. KOBAYASHI
Abstract Chromosomal rearrangement causes karyotypic variation in bottom-fermentingyeast. However, the molecular basis of this phenomenon has not yet been clearly defined.The complete genome sequence of Saccharomyces cerevisiae, which has been published,can be used for genome analysis of bottom-fermenting yeast. The chromosomal organisa-tion of a bottom-fermenting yeast strain is being investigated by pulsed field gel electro-phoresis and Southern hybridisation using more than 100 genes from all 16 chromosomesof S. cerevisiae as probes. In this study, the same techniques were used to detect the karyotypicpolymorphisms of single colonies isolated from a bottom-fermenting yeast strain.
Although the karyotypes of the isolated clones were almost the same, chromosomelength polymorphisms were observed in three chromosomes. These chromosomes wereinvestigated in detail and found to be chimeras, constructed from two different chromo-somes. In the junction of the chimeric chromosomes, either a retrotransposon Ty or thesubtelomeric gene COS was found to exist. This suggested that translocation resultingfrom homologous recombination produced these chimeric chromosomes.
Making use of the sequences of the junction regions, a new method to detect karyotypicchanges by polymerase chain reaction was developed. This new method is highly sensitive,and able to detect karyotypic changes within 2 days, from a single colony. This method led tothe observation that translocation occurred at a frequency of 10�5 during yeast cultivation.
1.1 Introduction
Genetic changes of bottom-fermenting yeast have been reported.1,2 Such changesmay give rise to instabilities and, therefore, affect the performance of the bottom-fermenting yeast during fermentation. To control the quality of yeast for fermentation,it is important to know the environmental factors that affect the occurrence of suchchanges. However, little is known of the mechanism by which genetic changes in bottom-fermenting yeasts occur. To investigate the mechanism of karyotypic changes, highlysensitive methods to detect genetic changes are required. Two types of method for the detection of chromosomal rearrangement have been developed. One type usesselectable marker genes on artificial loci.3,4 Although such methods give a rapid and ahighly sensitive analysis, naturally occurring chromosomal rearrangements cannot bedetected. The other type of method detects chromosome length polymorphisms usingpulsed field gel electrophoresis (PFGE).2 However, this latter method requires as longas 8 days to obtain results from the start of culture. Moreover, bottom-fermenting yeastshave many more chromosomes than laboratory yeasts, preventing adequate separationof each chromosome.
Bottom-fermenting yeasts are known to have an unusual genomic background.5
Not only are they polyploid strains, but they have at least two different genomic sets.
Brewing Yeast Fermentation Performance: Second edition
Edited by: KATHERINE SMART Copyright 0 Blackwell Science 2003
One genomic set is structurally similar to that of Saccharomyces cerevisiae strains,while another is structurally similar to that of S. bayanus. It has been suggested thatthis complicity makes it difficult to separate each chromosome sufficiently by PFGE.Some chromosomes separated by PFGE have been identified using the Southernhybridisation method.5,6 This method can detect karyotypic changes that cannot bedistinguished by PFGE. However, the sensitivity of this method is insufficient.
This objective of this study was the development of a novel and highly sensitivemethod to detect genetic changes in bottom-fermenting yeasts. Chromosome rearrange-ments were found in a bottom-fermenting yeast that could be detected using PFGEand Southern hybridisation. Chromosomal structure was investigated in detail toidentify specific regions for detection by polymerase chain reaction (PCR).
1.2 Materials and methods
1.2.1 Strains and media
KBY011 is a bottom-fermenting strain derived from the authors’ stock culture collec-tion. KY1165, KY1166, and KY1167 are single-colony isolates from KBY011. KT303and KT334 were derivatives of KY1166 and KY1167, respectively, in which theFLO11 gene was disrupted by insertion of YIp5.7 Cells were grown at 30°C in YPDA(1% yeast extract, 2% peptone, 2% dextrose, 0.02% adenine sulfate) broth or onYPDA plates containing 2% agar.
1.2.2 Pulsed field gel electrophoresis and Southern hybridisation of chromosomal DNA
Preparation of chromosomal DNA, PFGE and Southern hybridisation were carried outby the methods described previously.5 Genes on appropriate loci were selected from theSaccharomyces Genome Database (http://genome-www.stanford.edu/Saccharomyces/)and used as probes.
1.2.3 DNA manipulations and sequencing
Plasmid DNAs were purified using QIAGEN-tip 100 (Qiagen, USA). DNA digestionwith restriction enzymes, standard agarose gel electrophoresis and recovery of DNAfrom agarose gel were carried out according to the methods described by Sambrooket al.8 Small-scale chromosomal DNA extraction from yeast cells was carried out usingDr. GenTLE™ for Yeast and Gram Positive Bacteria Genome (Takara Shuzo, Japan).
DNA sequencing was performed by the method described by Sanger et al. using aDNA sequencing System (Applied Biosystems, USA).9 The results of sequencing wereanalysed using the DNASIS program (Hitachi Software Engineering, Japan).
1.2.4 Polymerase chain reaction procedures
Ex Taq DNA polymerase (Takara Shuzo, Japan) was used for PCR according to themanufacturer’s instructions. Standard PCR was performed with GeneAmp PCR system
4 BREWING YEAST FERMENTATION PERFORMANCE
9600 (Applied Biosystems, USA) using a programme consisting of one cycle of 5 minat 94°C followed by 30 cycles of 20 s at 98°C and 5 min at 68°C.
Semi-quantitative PCR was carried out as follows: genomic DNAs were isolatedfrom mixture of KY303 and KY334 cells and used for PCR amplification of the targetregion. YIp5 region inserted in the FLO11 locus in KY303 and KY334 were also ampli-fied and used as an internal standard. PCR products were analysed on agarose gel.The intensity of ethidium bromide stained bands were quantified using FluorImager595 (Amersham Pharmacia Biotech, UK) and standardised using the intensity of theinternal standard. Amounts of the PCR products were calculated using the intensityof the molecular weight marker.
1.3 Results and discussion
1.3.1 Chromosome length polymorphisms in a bottom-fermenting yeast strain
Bottom-fermenting yeast is thought to be a natural hybrid between S. cerevisiae andSaccharomyces bayanus. Some chromosomes of S. cerevisiae have been suggested to berearranged in S. bayanus by reciprocal translocation.10–12 Such S. bayanus-type chromo-somes have been also found in bottom-fermenting yeast strains.5,6 However, no reportshave appeared concerning the chromosomal organisation of bottom-fermenting yeasts.The chromosomal organisation of a stock of bottom-fermenting yeast strains was inves-tigated in detail using PFGE and Southern hybridisation (K. Tanaka, in preparation).During the investigation, translocations were found in a bottom-fermenting yeast strainwhich were not found in S. bayanus strains. It is possible that such translocations hadoccurred after the hybrid cross between S. cerevisiae and S. bayanus. The question hasbeen raised as to whether or not such translocated chromosomes are stable.
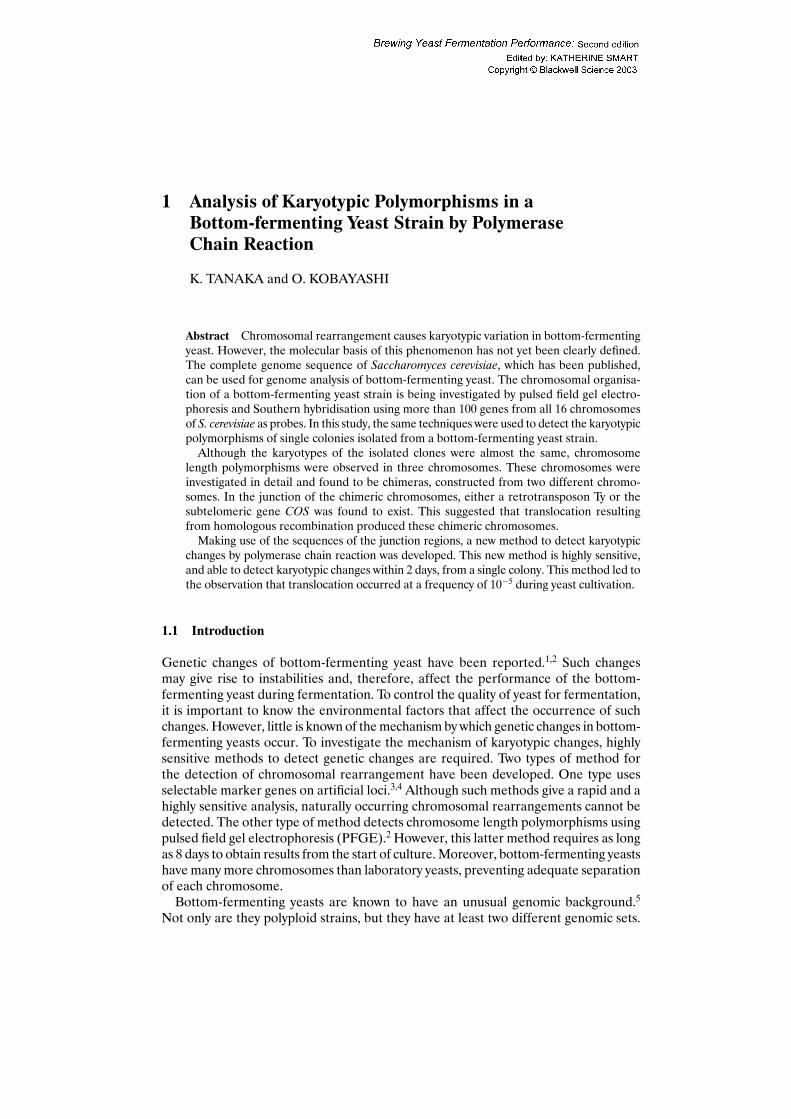
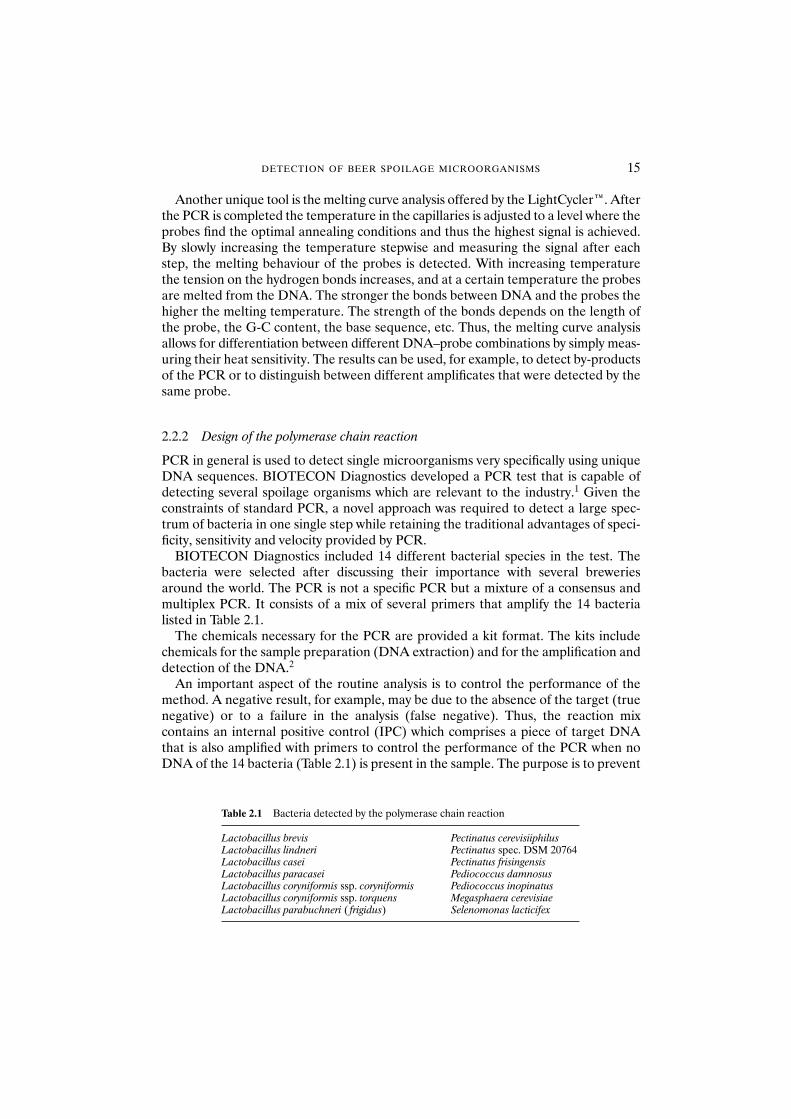
Single colonies were isolated from a bottom-fermenting yeast, KBY011, and chromo-somal organisation of these colony isolates was investigated. Figure 1.1 shows the lociof genes used as probes. Although the chromosomal organisation of these isolates wasalmost the same, three chromosomes were lost in some of the isolates (Fig. 1.2). The840 kb chromosome was detected using ERG6 (chromosome XIII) as a probe. The
ANALYSIS OF KARYOTYPIC POLYMORPHISMS 5
IV
VII
XII
XV
XVI
XIII
II
X
XIV
XI
V
VIII
IX
III
VI
I
Fig. 1.1 Genes used to detect the karyotypic changes in a bottom-fermenting yeast. Arrows indicate theloci in the Saccharomyces cerevisiae chromosome map.
820 kb chromosome was detected using DMC1 (chromosome V). The 960 kb chro-mosome was detected by SUC2 (chromosome IX). Further research was planned toclarify the structure of these chromosomes.
1.3.2 Structure of the 840 kb chromosome
The 840 kb chromosome may also be detected by some of the genes located on chromo-some XI. Therefore, PFGE and Southern analysis was performed using the geneslocated on chromosome XI or XIII as probes. The results are shown in Fig. 1.3. Concern-ing the probes from chromosome XI, the URA1 gene hybridised with the 840 kb chromo-some but the genes located on the region from ORD1 to SIR1 did not hybridise with it.Concerning the probes from chromosome XIII, the genes located on the region fromPHO84 to GUA1 hybridised with the 840 kb chromosome but the ADE4 gene did not.These results suggested that the 840 kb chromosome originated from a translocation ofthe left end of chromosome XI onto the right end of chromosome XIII.
1.3.3 Structure of the 820 kb chromosome
Figure 1.4 shows the results of PFGE and Southern analysis using the genes located onchromosome V as probes. All of the genes used hybridised with the 610 kb chromosome,
6 BREWING YEAST FERMENTATION PERFORMANCE
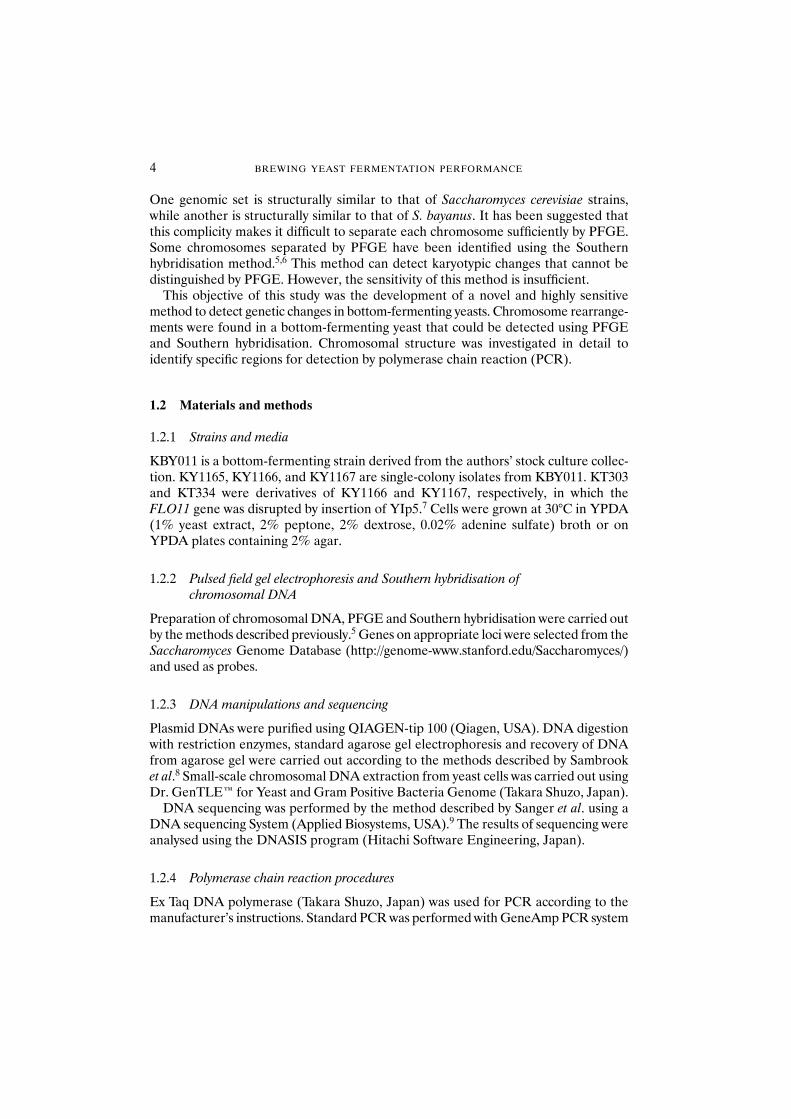
Fig. 1.2 (a) Electrophoretic karyotypes and (b–d) results of Southern hybridisation of single colonyisolates from a KBY011 with (b) ERG6, (c) DMC1, and (d) SUC2 genes as probes. Lane 1: KY1165; lane 2: KY1166; lane 3: KY1167.
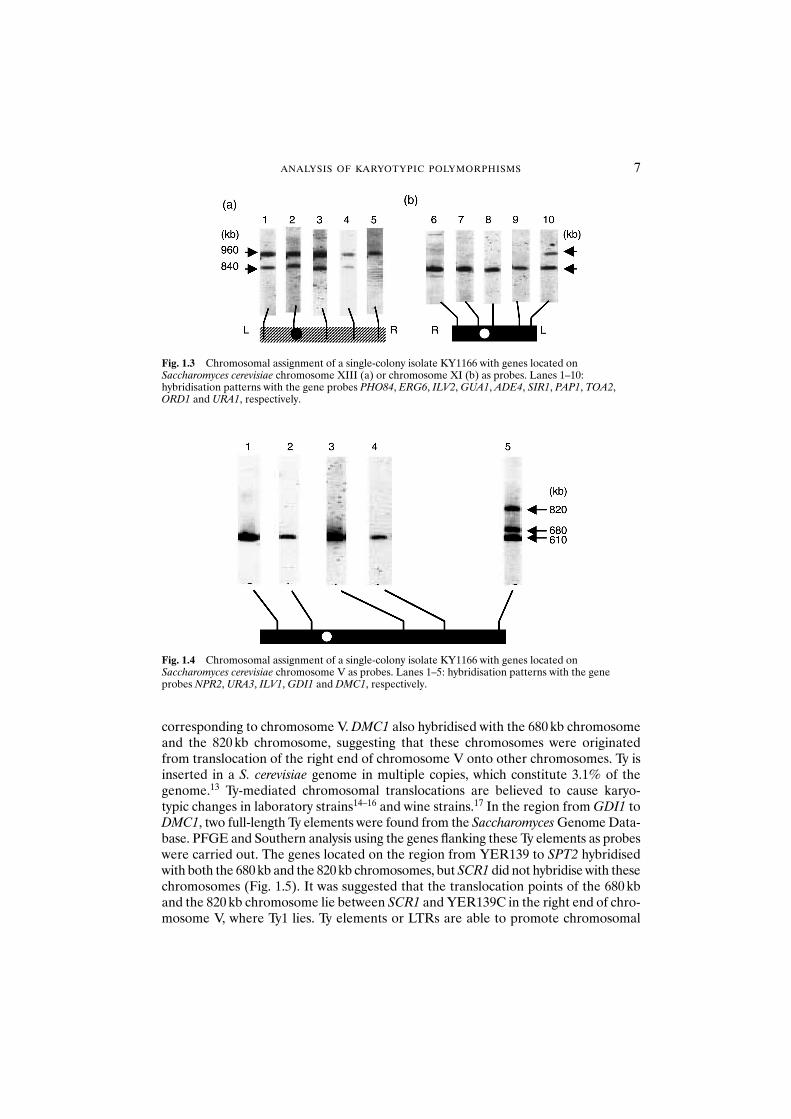
corresponding to chromosome V. DMC1 also hybridised with the 680 kb chromosomeand the 820 kb chromosome, suggesting that these chromosomes were originatedfrom translocation of the right end of chromosome V onto other chromosomes. Ty isinserted in a S. cerevisiae genome in multiple copies, which constitute 3.1% of thegenome.13 Ty-mediated chromosomal translocations are believed to cause karyo-typic changes in laboratory strains14–16 and wine strains.17 In the region from GDI1 toDMC1, two full-length Ty elements were found from the Saccharomyces Genome Data-base. PFGE and Southern analysis using the genes flanking these Ty elements as probeswere carried out. The genes located on the region from YER139 to SPT2 hybridisedwith both the 680 kb and the 820 kb chromosomes, but SCR1 did not hybridise with thesechromosomes (Fig. 1.5). It was suggested that the translocation points of the 680 kband the 820 kb chromosome lie between SCR1 and YER139C in the right end of chro-mosome V, where Ty1 lies. Ty elements or LTRs are able to promote chromosomal
ANALYSIS OF KARYOTYPIC POLYMORPHISMS 7
Fig. 1.3 Chromosomal assignment of a single-colony isolate KY1166 with genes located onSaccharomyces cerevisiae chromosome XIII (a) or chromosome XI (b) as probes. Lanes 1–10:hybridisation patterns with the gene probes PHO84, ERG6, ILV2, GUA1, ADE4, SIR1, PAP1, TOA2,ORD1 and URA1, respectively.
Fig. 1.4 Chromosomal assignment of a single-colony isolate KY1166 with genes located onSaccharomyces cerevisiae chromosome V as probes. Lanes 1–5: hybridisation patterns with the geneprobes NPR2, URA3, ILV1, GDI1 and DMC1, respectively.
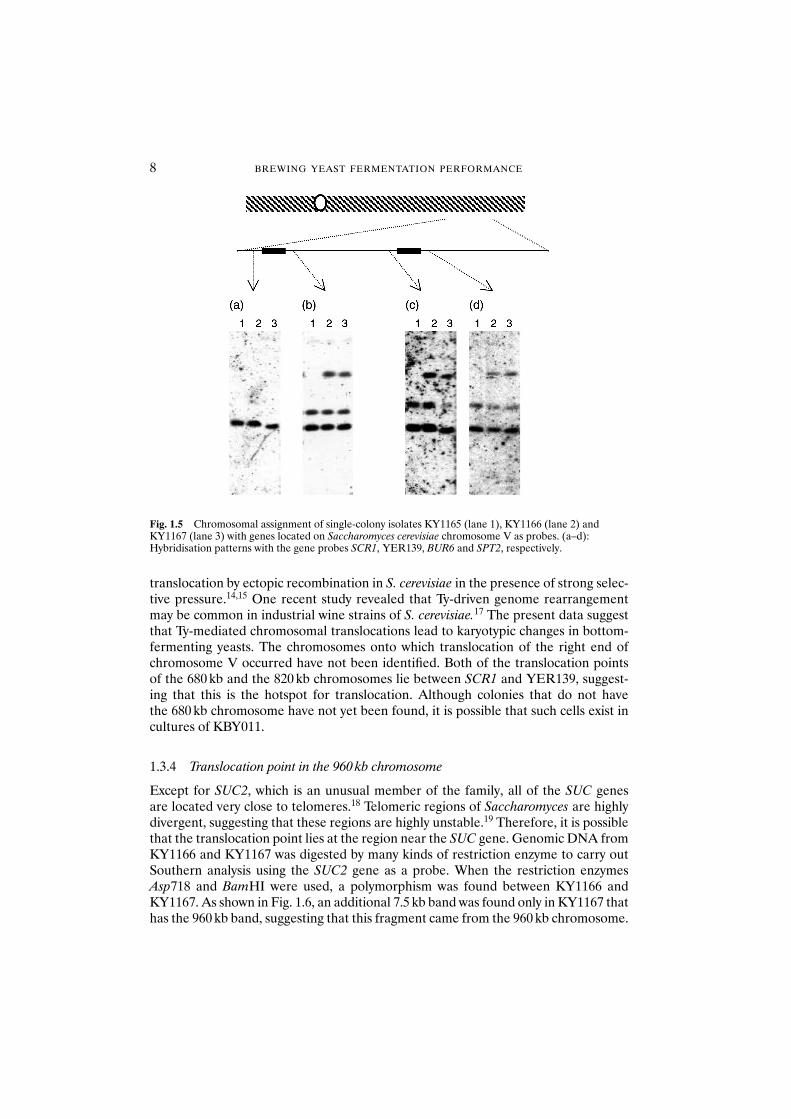
translocation by ectopic recombination in S. cerevisiae in the presence of strong selec-tive pressure.14,15 One recent study revealed that Ty-driven genome rearrangementmay be common in industrial wine strains of S. cerevisiae.17 The present data suggestthat Ty-mediated chromosomal translocations lead to karyotypic changes in bottom-fermenting yeasts. The chromosomes onto which translocation of the right end ofchromosome V occurred have not been identified. Both of the translocation points of the 680 kb and the 820 kb chromosomes lie between SCR1 and YER139, suggest-ing that this is the hotspot for translocation. Although colonies that do not have the 680 kb chromosome have not yet been found, it is possible that such cells exist incultures of KBY011.
1.3.4 Translocation point in the 960 kb chromosome
Except for SUC2, which is an unusual member of the family, all of the SUC genes are located very close to telomeres.18 Telomeric regions of Saccharomyces are highlydivergent, suggesting that these regions are highly unstable.19 Therefore, it is possiblethat the translocation point lies at the region near the SUC gene. Genomic DNA fromKY1166 and KY1167 was digested by many kinds of restriction enzyme to carry outSouthern analysis using the SUC2 gene as a probe. When the restriction enzymesAsp718 and BamHI were used, a polymorphism was found between KY1166 andKY1167. As shown in Fig. 1.6, an additional 7.5 kb band was found only in KY1167 thathas the 960 kb band, suggesting that this fragment came from the 960 kb chromosome.
8 BREWING YEAST FERMENTATION PERFORMANCE
Fig. 1.5 Chromosomal assignment of single-colony isolates KY1165 (lane 1), KY1166 (lane 2) andKY1167 (lane 3) with genes located on Saccharomyces cerevisiae chromosome V as probes. (a–d):Hybridisation patterns with the gene probes SCR1, YER139, BUR6 and SPT2, respectively.
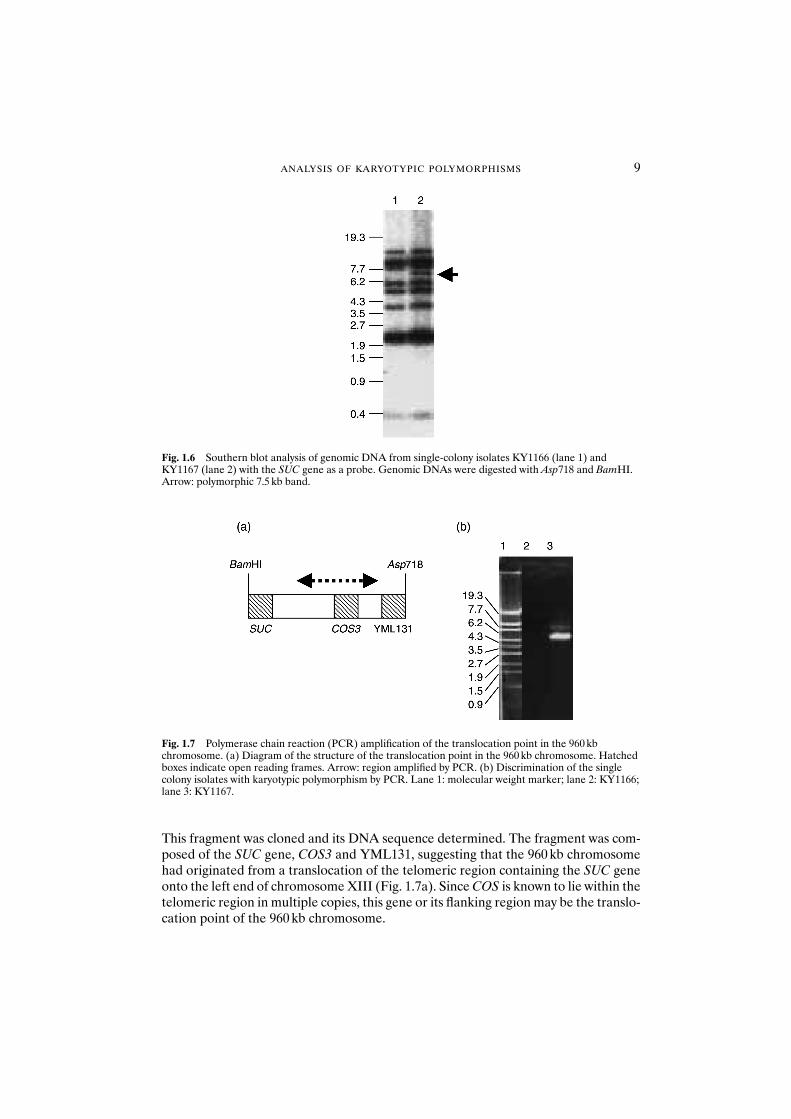
This fragment was cloned and its DNA sequence determined. The fragment was com-posed of the SUC gene, COS3 and YML131, suggesting that the 960 kb chromosomehad originated from a translocation of the telomeric region containing the SUC geneonto the left end of chromosome XIII (Fig. 1.7a). Since COS is known to lie within thetelomeric region in multiple copies, this gene or its flanking region may be the translo-cation point of the 960 kb chromosome.
ANALYSIS OF KARYOTYPIC POLYMORPHISMS 9
Fig. 1.6 Southern blot analysis of genomic DNA from single-colony isolates KY1166 (lane 1) andKY1167 (lane 2) with the SUC gene as a probe. Genomic DNAs were digested with Asp718 and BamHI.Arrow: polymorphic 7.5 kb band.
Fig. 1.7 Polymerase chain reaction (PCR) amplification of the translocation point in the 960 kbchromosome. (a) Diagram of the structure of the translocation point in the 960 kb chromosome. Hatchedboxes indicate open reading frames. Arrow: region amplified by PCR. (b) Discrimination of the singlecolony isolates with karyotypic polymorphism by PCR. Lane 1: molecular weight marker; lane 2: KY1166;lane 3: KY1167.
1.3.5 Development of the method for detection of the 960 kb chromosome bypolymerase chain reaction
PCR was used to develop a highly sensitive method for detection of the 960 kb chromo-some. The primers were designed to amplify the region from the SUC gene to YML131.The result is shown in Fig. 1.7b. The 4.5 kb fragment was amplified only from KY1167that has the 960 kb chromosome, suggesting that the specific region for this chromo-some was amplified. This result also indicates that the 4.5 kb region composed ofSUC, COS3 and YML131 exists only on the 960 kb chromosome. Therefore, it is sug-gested that the translocation at this point is involved in the occurrence of the 960 kbchromosome.
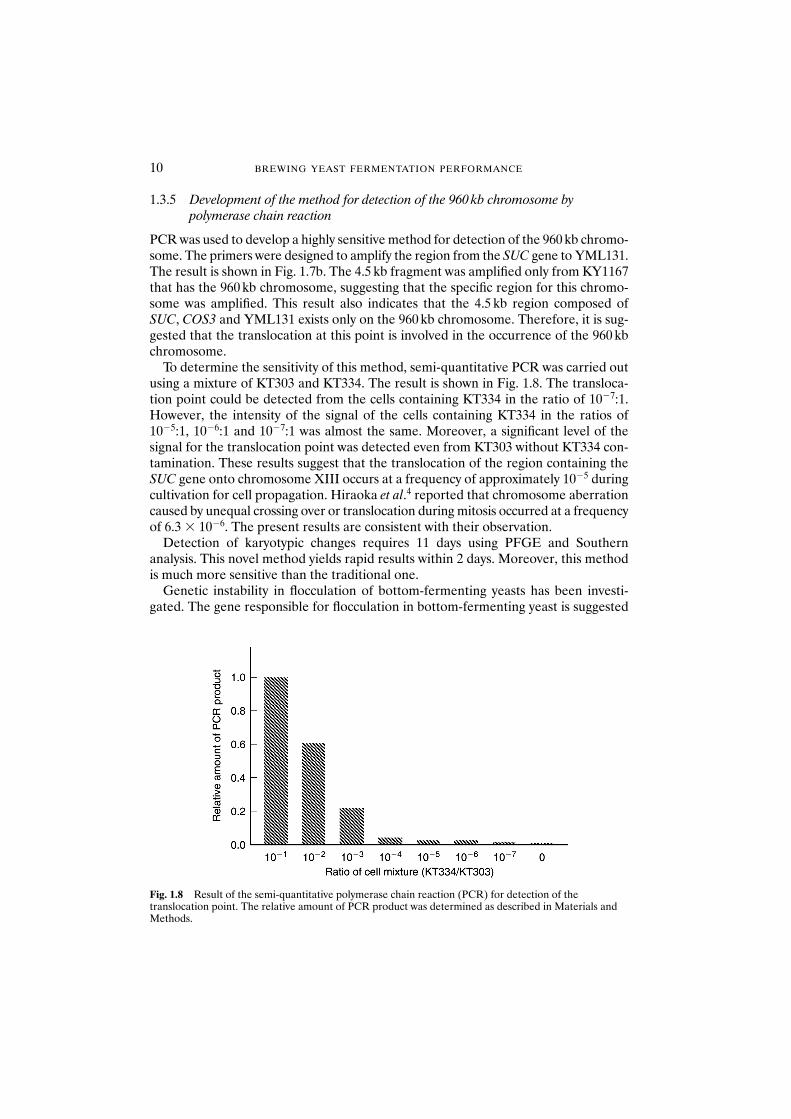
To determine the sensitivity of this method, semi-quantitative PCR was carried outusing a mixture of KT303 and KT334. The result is shown in Fig. 1.8. The transloca-tion point could be detected from the cells containing KT334 in the ratio of 10�7:1.However, the intensity of the signal of the cells containing KT334 in the ratios of10�5:1, 10�6:1 and 10�7:1 was almost the same. Moreover, a significant level of the signal for the translocation point was detected even from KT303 without KT334 con-tamination. These results suggest that the translocation of the region containing theSUC gene onto chromosome XIII occurs at a frequency of approximately 10�5 duringcultivation for cell propagation. Hiraoka et al.4 reported that chromosome aberrationcaused by unequal crossing over or translocation during mitosis occurred at a frequencyof 6.3 � 10�6. The present results are consistent with their observation.
Detection of karyotypic changes requires 11 days using PFGE and Southern analysis. This novel method yields rapid results within 2 days. Moreover, this methodis much more sensitive than the traditional one.
Genetic instability in flocculation of bottom-fermenting yeasts has been investi-gated. The gene responsible for flocculation in bottom-fermenting yeast is suggested
10 BREWING YEAST FERMENTATION PERFORMANCE
Fig. 1.8 Result of the semi-quantitative polymerase chain reaction (PCR) for detection of thetranslocation point. The relative amount of PCR product was determined as described in Materials andMethods.
to be Lg-FLO1.20 Methods using PCR to detect mutation of the Lg-FLO1 gene or itshomologue, which causes loss of flocculation ability, have been developed.21,22 Thepresent method can detect chromosomal rearrangement very close to the SUC gene,which may affect the brewing performance. It is suggested that a combination of thesemethods provides a useful tool in the control of yeast quality.
1.4 Conclusions
This study investigated the structure of the chromosomes that revealed polymorphismsin a bottom-fermenting yeast strain. These chromosomes were found to be caused bytranslocations and the translocation points were investigated in detail. Based on theresults, a PCR method was developed to detect translocation of the chromosomal endcontaining the SUC gene onto chromosome XIII. This method enabled the detectionof chromosomal rearrangements within 2 days. The translocation on this locus possi-bly occurs at a frequency of 10�5 during cultivation for cell propagation.
References
1. Pedersen, M.B. (1993) Instability of the brewers yeast genome. Proc. Congr. Eur. Brew. Conv. 24, 291–298.2. Casey, G.P. (1996) Practical applications of pulsed field electrophoresis and yeast chromosome finger-
printing brewing QA and R&D. Tech. Q. Master Brew. Assoc. Am. 33, 1–10.3. Fassulo, M.T. and Davis, R.W. (1988) Direction of chromosome rearrangements in Saccharomyces cere-
visiae by using of his3 recombinational substrates. Mol. Cell. Biol. 8, 4370–4380.4. Hiraoka, M., Watanabe, K., Umezu, K. and Maki, H. (2000) Spontaneous loss of heterozygosity in
diploid Saccharomyces cerevisiae cells. Genetics 156, 1531–1548.5. Tamai, Y., Momma, T., Yoshimoto, H. and Kaneko, Y. (1998) Co-existence of two types of chromo-
some in the bottom fermenting yeast, Saccharomyces pastorianus. Yeast 14, 923–933.6. Yamagishi, H. and Ogata, T. (1999) Chromosomal structure of bottom fermenting yeasts. System. Appl.
Microbiol. 22, 341–353.7. Struhl, K., Stinchcomb, D.T., Scherer, S. and Davis, R.W. (1978) High-frequency transformation of
yeast: autonomous replication of hybrid DNA molecules. Proc. Natl Acad. Sci. U.S.A. 76, 1035–1039.8. Sambrook, J., Fritsch, E.F. and Maniatis, T. (1989) Molecular Cloning: A Laboratory Manual. Cold
Spring Harbor Laboratory Press, Cold Spring Harbor, NY.9. Sanger, F., Nicklen, S. and Coulson, S. (1977) DNA sequencing with chain-terminating inhibitors.
Proc. Natl Acad. Sci. U.S.A. 74, 5463–5467.10. Ryu, S.-L., Murooka, Y. and Kaneko, Y. (1996) Genomic reorganization between two sibling yeast
species, Saccharomyces bayanus and Saccharomyces cerevisiae. Yeast 12, 757–764.11. Ryu, S.-L., Murooka, Y. and Kaneko, Y. (1998) Reciprocal translocation at duplicated RPL2 loci might
cause speciation of Saccharomyces bayanus and Saccharomyces cerevisiae. Curr. Genet. 33, 345–351.12. Fischer, G., James, S.A., Roberts, I.N. et al. (2000) Chromosomal evolution in Saccharomyces. Nature
405, 451–454.13. Kim, J.M.,Vanguri, S., Boeke, J.D. et al. (1998) Transposable elements and genome organisation: a
comprehensive survey of retrotransposons revealed by the complete Saccharomyces cerevisiae genomesequence. Genome Res. 8, 464–478.
14. Roeder, G.S. and Fink, G.R. (1980) DNA rearrangement associated with a transposable element inyeast. Cell 21, 239–249.
15. Kupiec, M. and Petes, T.D. (1988) Allelic and ectopic recombination between Ty elements in yeast.Genetics 119, 549–559.
16. Casaregola, S., Nguyen, H.V. Lepingle, A. et al. (1998) A family of laboratory strains of Saccharomycescerevisiae carry rearrangements involving chromosome I and III. Yeast 14, 551–564.
17. Rachidi, N., Barre, P. and Blondin, B. (1999) Multiple Ty-mediated chromosomal translocations lead tokaryotype change in a wine strain of Saccharomyces cerevisiae. Mol. Gen. Genet. 261, 841–850.
ANALYSIS OF KARYOTYPIC POLYMORPHISMS 11

18. Carlson, M., Celenza, J.L. and Eng, F.J. (1985) Evolution of the dispersed SUC gene family ofSaccharomyces cerevisiae by rearrangements of chromosome telomeres. Mol. Cell. Biol. 5, 2894–2902.
19. Horowitz, H., Thorburn, P. and Haber, J.E. (1984) Rearrangement of highly polymorphic regions neartelomeres of Saccharomyces cerevisiae. Mol. Cell. Biol. 4, 2509–2517.
20. Kobayashi, O., Hayashi, N., Kuroki, R. and Sone, H. (1998) Region of Flo1 proteins responsible forsugar recognition. J. Bacteriol. 180, 6503–6510.
21. Jibiki, M., Ishibashi, T., Yuuki, T. and Kagami, N. (2001) Application of polymerase chain reaction todetermine the flocculation properties of brewer’s lager yeast. J. Am. Soc. Brew. Chem. 59, 107–110.
22. Sato, M., Watari, J. and Shinotsuka, K. (2001) Genetic instability in flocculation of bottom-fermentingyeast. J. Am. Soc. Brew. Chem. 59, 130–134.
12 BREWING YEAST FERMENTATION PERFORMANCE
2 Fast Detection of Beer Spoilage Microorganisms byConsensus Polymerase Chain Reaction with foodproof®
Beer Screening
K. BERGHOF, M. FANDKE, A. PARDIGOL, A. TAUSCHMANN andM. KIEHNE
Abstract The use of polymerase chain reaction (PCR) in the brewing industry had beenlimited for several years to the research laboratory but never found its way into the routinelaboratory of the quality assurance department. This was due to the demand for well-trained people to carry out this analysis and to the laborious procedure that was necessaryto minimise the high risk of contamination and thus false-positive results, etc. With thenew LightCycler™ format of PCR and the ready-to-use kits of BIOTECON Diagnostics it is possible to profit from this very specific and sensitive method in a standard routine laboratory of a brewery. The test, foodproof® Beer Screening, detects 14 different beerspoilage bacteria in one single reaction. After a short enrichment of 24–48 h (recom-mended for routine use) of the sample (with or without yeast), preparation is very simpleand does not take longer than 25 min for 30 samples. The running time of the LightCycler™is approximately 1 h and offers real-time results that clearly indicate the presence orabsence of one or more of the 14 bacteria included in the test. In a second step that doesnot require any additional hands-on time, the bacteria can be identified in most cases on aspecies level. This is done by a melting curve analysis that exploits the different behaviourof probes when melted from the DNA. With the newly developed test the detection andidentification of beer spoilage organisms is possible within 48 h without laborious bio-chemical or molecular biological efforts. This allows PCR to be used for the first time in acommon laboratory of the brewing industry.
2.1 Introduction
The polymerase chain reaction (PCR) is a well-established tool for the fast andspecific detection of microorganisms. By this procedure a known and organism-specific piece of DNA is amplified in vitro and then detected in a second step. The selection of the DNA sequence allows very exact differentiation of the organisms.The high speed of this analysis compared with conventional microbiology is due to theamplification of the DNA, which is doubled in minutes, and thus much more rapidlythan the growth of complete cells, which normally takes hours, especially in the case of slowly growing beer spoilage bacteria. The PCR is also able to detect lowconcentrations of spoilage or pathogenic organisms. In the past, the method was very laborious and could only be performed by highly trained people in speciallyequipped laboratories. By using new technologies many complicated and problematicsteps have been eliminated, including the complicated preparation of the target DNAand the detection of the PCR products with gels or by enzyme-linked immunosorbentassay (ELISA).
Brewing Yeast Fermentation Performance: Second edition
Edited by: KATHERINE SMART Copyright 0 Blackwell Science 2003
2.2 Materials and methods
This chapter describes the technology platform, the design of the PCR reagents andthe use of the method in a routine laboratory. Since a commercial product is discussedsome details have been omitted.
2.2.1 LightCycler™ Technology
The LightCycler™ of Roche Diagnostics, which is used as the basis for the new kit ofBIOTECON Diagnostics, offers a number of advantages over conventional PCR. Thetime for the reaction is reduced by the new design of the reaction tubes (capillarieswith a reaction volume of 20 �l) and the tempering unit (heating coil). The capillaryoffers a very high surface-to-volume ratio, which enables the fast heat changes in thereaction tube that are necessary to carry out the PCR cycles. The combination of thecapillaries and air for rapid cycling allows a single PCR cycle to be carried out in lessthan 1 min.
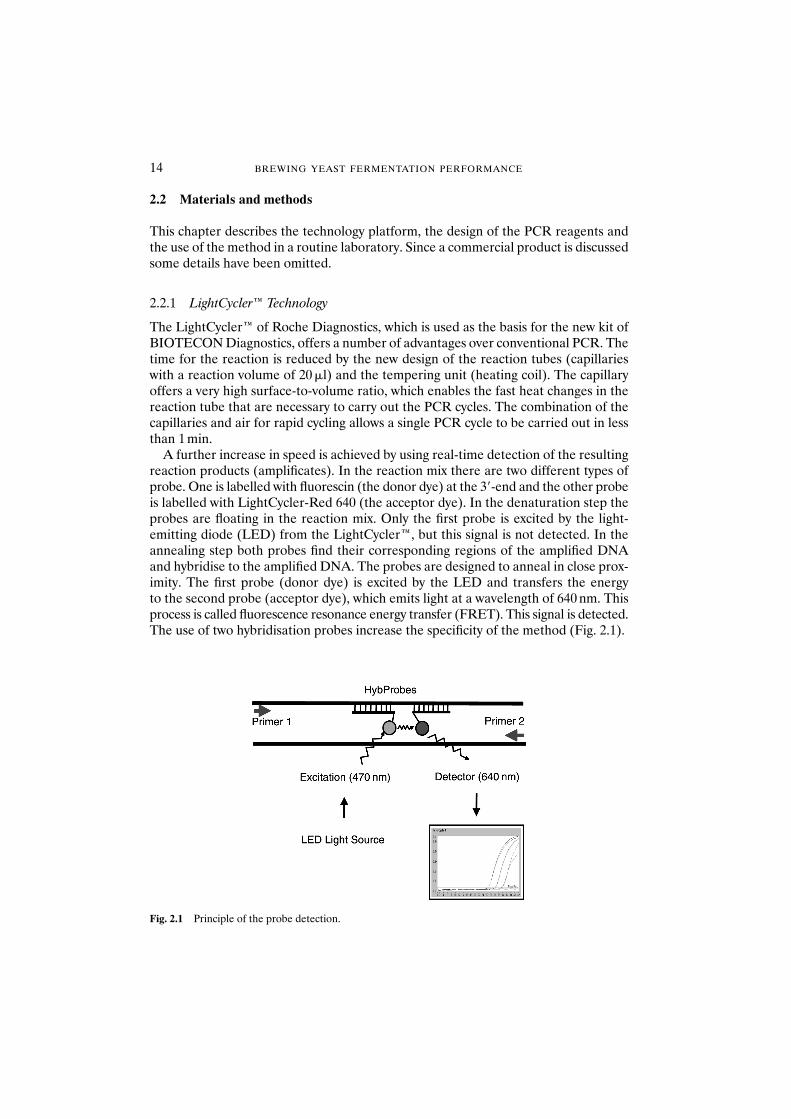
A further increase in speed is achieved by using real-time detection of the resultingreaction products (amplificates). In the reaction mix there are two different types ofprobe. One is labelled with fluorescin (the donor dye) at the 3�-end and the other probeis labelled with LightCycler-Red 640 (the acceptor dye). In the denaturation step theprobes are floating in the reaction mix. Only the first probe is excited by the light-emitting diode (LED) from the LightCycler™, but this signal is not detected. In theannealing step both probes find their corresponding regions of the amplified DNAand hybridise to the amplified DNA. The probes are designed to anneal in close prox-imity. The first probe (donor dye) is excited by the LED and transfers the energy to the second probe (acceptor dye), which emits light at a wavelength of 640 nm. Thisprocess is called fluorescence resonance energy transfer (FRET). This signal is detected.The use of two hybridisation probes increase the specificity of the method (Fig. 2.1).
14 BREWING YEAST FERMENTATION PERFORMANCE
Fig. 2.1 Principle of the probe detection.
Another unique tool is the melting curve analysis offered by the LightCycler™. Afterthe PCR is completed the temperature in the capillaries is adjusted to a level where theprobes find the optimal annealing conditions and thus the highest signal is achieved.By slowly increasing the temperature stepwise and measuring the signal after eachstep, the melting behaviour of the probes is detected. With increasing temperaturethe tension on the hydrogen bonds increases, and at a certain temperature the probesare melted from the DNA. The stronger the bonds between DNA and the probes thehigher the melting temperature. The strength of the bonds depends on the length ofthe probe, the G-C content, the base sequence, etc. Thus, the melting curve analysisallows for differentiation between different DNA–probe combinations by simply meas-uring their heat sensitivity. The results can be used, for example, to detect by-productsof the PCR or to distinguish between different amplificates that were detected by thesame probe.
2.2.2 Design of the polymerase chain reaction
PCR in general is used to detect single microorganisms very specifically using uniqueDNA sequences. BIOTECON Diagnostics developed a PCR test that is capable ofdetecting several spoilage organisms which are relevant to the industry.1 Given theconstraints of standard PCR, a novel approach was required to detect a large spec-trum of bacteria in one single step while retaining the traditional advantages of speci-ficity, sensitivity and velocity provided by PCR.
BIOTECON Diagnostics included 14 different bacterial species in the test. Thebacteria were selected after discussing their importance with several breweriesaround the world. The PCR is not a specific PCR but a mixture of a consensus andmultiplex PCR. It consists of a mix of several primers that amplify the 14 bacterialisted in Table 2.1.
The chemicals necessary for the PCR are provided a kit format. The kits includechemicals for the sample preparation (DNA extraction) and for the amplification anddetection of the DNA.2
An important aspect of the routine analysis is to control the performance of themethod. A negative result, for example, may be due to the absence of the target (truenegative) or to a failure in the analysis (false negative). Thus, the reaction mixcontains an internal positive control (IPC) which comprises a piece of target DNAthat is also amplified with primers to control the performance of the PCR when noDNA of the 14 bacteria (Table 2.1) is present in the sample. The purpose is to prevent
DETECTION OF BEER SPOILAGE MICROORGANISMS 15
Table 2.1 Bacteria detected by the polymerase chain reaction
Lactobacillus brevis Pectinatus cerevisiiphilusLactobacillus lindneri Pectinatus spec. DSM 20764Lactobacillus casei Pectinatus frisingensisLactobacillus paracasei Pediococcus damnosusLactobacillus coryniformis ssp. coryniformis Pediococcus inopinatusLactobacillus coryniformis ssp. torquens Megasphaera cerevisiaeLactobacillus parabuchneri ( frigidus) Selenomonas lacticifex
false-negative results due to inhibition or errors during the preparation of the PCR.The IPC is detected with a different pair of probes, where the acceptor probe is labelledwith LightCycler-Red 705, a dye emitting light at 705 nm. Thus, the signal can bedetected in a different channel of the LightCycler™. If a result is negative in the wild-type channel F2 (sample DNA) the control channel F3 has to be positive.
A further aspect is the prevention of cross-contamination by the amplificates ofearlier PCR runs. The PCR is carried out using uracil instead of thymine. Thus, theDNA amplificates produced are artificial and do not occur in nature. In addition, theirchemical composition is different from the DNA of the bacteria under investigation.The kits also contain the enzyme uracil-N-glycosylase (UNG), which is used to destroyall old amplificates containing uracil before running a new PCR. The target DNA ofthe bacteria is not affected. After an incubation period the enzyme UNG itself isdestroyed by heat and PCR with uracil can be carried out. This tool prevents false-positive results caused by cross-contamination of old amplificates. It does not preventfalse-positive results from cross-contamination with bacterial DNA.
2.2.3 Analytical procedure
2.2.3.1 Microbiological enrichment. BIOTECON Diagnostics recommends filtrationof the sample (e.g. 100–500 ml) and 50 mm cellulose-nitrate filters with 0.2 �m pores(Sartorius) are suitable. The drying of the filter during filtration should be avoided.The filter is quickly transferred to a small volume of enrichment broth (such as 10 mltubes of NBB broth; Döhler, Darmstadt, Germany, Art. No. 4723). The use of alterna-tive media is also possible. In this case it must be ensured that there is no interferencewith the amplification and/or detection via the LightCycler™. The enrichment shouldbe carried out as a standing culture at 28–30°C under anaerobic conditions for24–48 h (depending on the species). To detect very slow-growing bacteria such asLactobacillus lindneri or Pediococcus damnosus it may be necessary to increase the timeof enrichment until the density of 1–5 � 103 colony-forming units (cfu)/ml is achieved.From experience it is known that a smaller number of organisms (�100 cfu/ml) can bedetected with the system (data not shown), but for routine use it is useful to enrichuntil an amount of cells is reached which cannot be ‘lost’ during sample preparation(pipetting, diluting, etc.).
2.2.3.2 Sample preparation. The disintegration of the bacterial cells and the extrac-tion of the DNA are essential prerequisites. It is recommended that the samples are not prepared in the microbiological laboratory because of the high amount ofbacteria in the environment. The sample preparation should be conducted using thefollowing protocol.
1. The enrichment culture is mixed and transferred (1 ml) to a 1.5 ml reaction tube.2. The sample is then centrifuged at maximum speed (�15 000 g) for 5 min at room
temperature in a standard benchtop microcentrifuge. If the media for the enrich-ment are totally clear, the use of latex beads (Sigma; 10 �l of 1:10 in distilled waterdiluted suspension) is recommended before the centrifugation step to improvesedimentation.
16 BREWING YEAST FERMENTATION PERFORMANCE
3. Immediately after centrifugation the supernatant should be carefully removed bypipetting (not decanting) and discarding.
4. Lysis buffer is added to resuspend the pellet in 50 �l and mixed with an orbitalmixer (2 � 5 s). Tapping the reaction tube on the bench will allow particles to beremoved from its wall.
5. The suspension is incubated in a unit heater or water bath for 10 min at 95–100°C. The tubes have to be tightly closed (e.g. using lid clips) to prevent cross-contamination.
6. The lysate is then mixed for 10 s in an orbital mixer, at maximum speed.7. The lysate is then centrifuged at maximum speed (�15 000 g) for 30–60 s at room
temperature in a standard benchtop microcentrifuge.8. The lysate is stored at 4°C or on ice if the PCR is started immediately afterwards.
Otherwise, the prepared samples should be stored at �20°C. If the sample con-tains a high amount of yeast cells (e.g. pitching yeast) an additional centrifugationstep should be included in the protocol.
9. The enriched culture is mixed. If the sample has a very low fluid content it shouldbe diluted with one volume of NBB medium or another PCR-approved medium.
10. At this stage 1 ml is removed and transferred into a 1.5 ml Eppendorf cup.11. The sample is then centrifuged at 100 g (c. 1000 rpm in a standard benchtop cen-
trifuge) for 5 min at room temperature.12. The supernatant is then transferred to a new Eppendorf cup.13. Proceed with step 2 of the above protocol.
2.2.3.3 Standard protocol for polymerase chain reaction preparation. The followingsteps describe the preparation of the PCR.
1. All reagents are thawed, mixed gently (therefore not by vortexing) and cen-trifuged.
2. The PCR-Master-Mix (enzymes, nucleotides, etc.) is then transferred into a newsterile reaction tube. The ICP-Mix (internal control and primers) is then mixedwith the PCR-Master-Mix.
3. 17.5 �l of the Mix is transferred into all prepared capillaries.4. 2.5 �l of DNA sample lysate is pipetted into the capillaries prepared for sample
reactions and the capillaries are then sealed.5. 2.5 �l Negative Control (PCR water) is pipetted into the appropriate capillary and
sealed.6. 2.5 �l Positive Control (DNA of Selenomonas lacticifex) is pipetted into the appro-
priate capillary and sealed.7. The capillaries are placed into adapters and centrifuged at 700 g for 5 s to remove
air from the bottom of the capillaries.8. The capillaries are then placed in the rotor of the LightCycler™ instrument.9. The PCR is run.
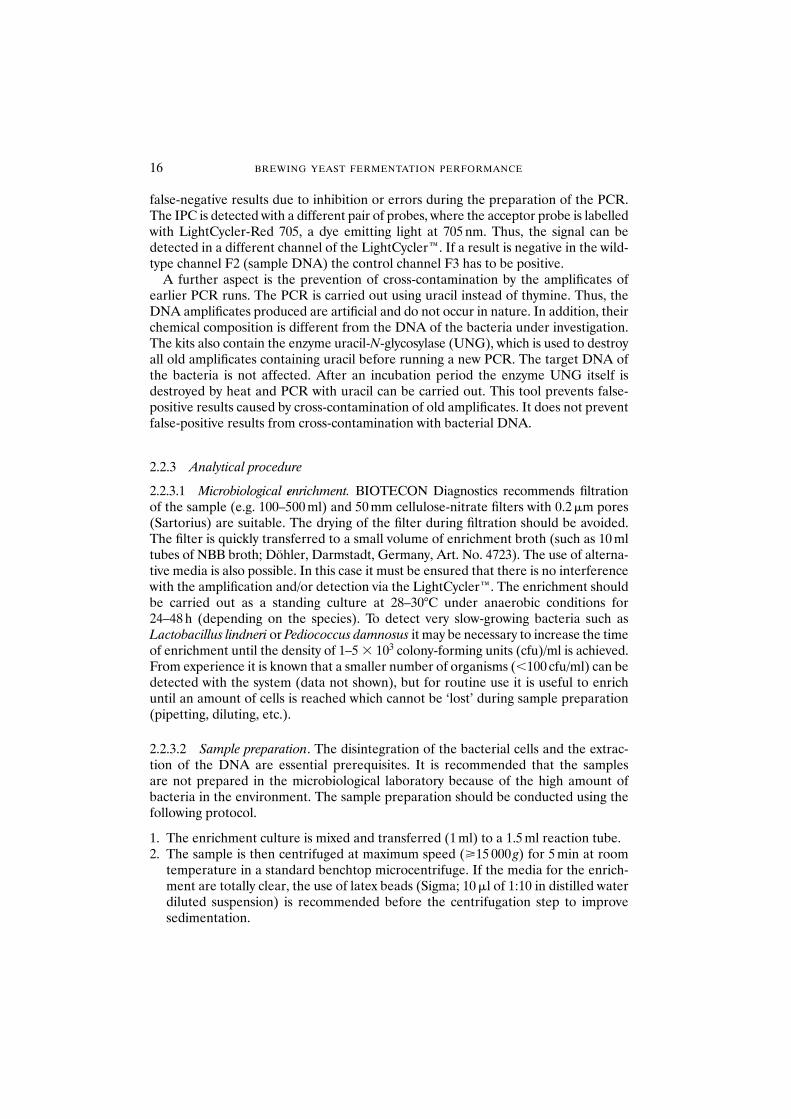
The LightCycler™ needs approximately 60 min for the PCR and another 20 min forthe melting curve analysis. The results can be monitored in real-time on the screen ofthe device. Figure 2.2 shows a typical temperature profile.
DETECTION OF BEER SPOILAGE MICROORGANISMS 17
2.3 Results and discussion
2.3.1 Detection of bacteria
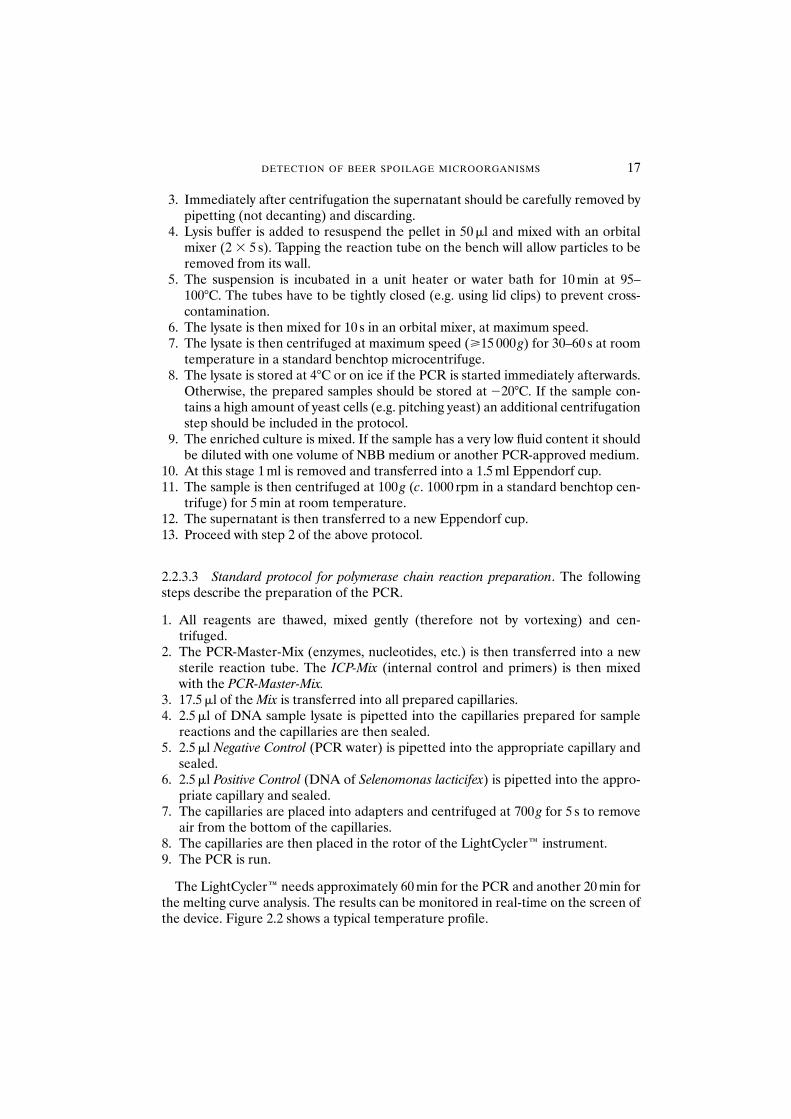
The first step in interpreting the data is the signal in the sample channel F2 of theLightCycler™. If the signal increases, as indicated in Fig. 2.3, one or more of the 14 bacteria in Table 2.1 is present. The signal increases exponentially, indicating the growing number of amplificates in the reaction mix after each cycle. The crossingpoint, that is the cycle number at which the signal rises above the background, repre-sents the value for the quantification of the bacteria in the sample. The lower thecrossing point the higher the amount of target DNA present in the sample. In the caseof an enrichment this value can only be used as a rough indicator because the speedof growth during the enrichment would not be known. A positive result does not yieldany information about the nature of contamination present, but it clearly indicates the presence of an obligatory beer spoilage bacterium and not only the presence of alactic acid bacterium. However, it should be noted that only the bacteria in Table 2.1are detected.
2.3.2 Identification of bacteria
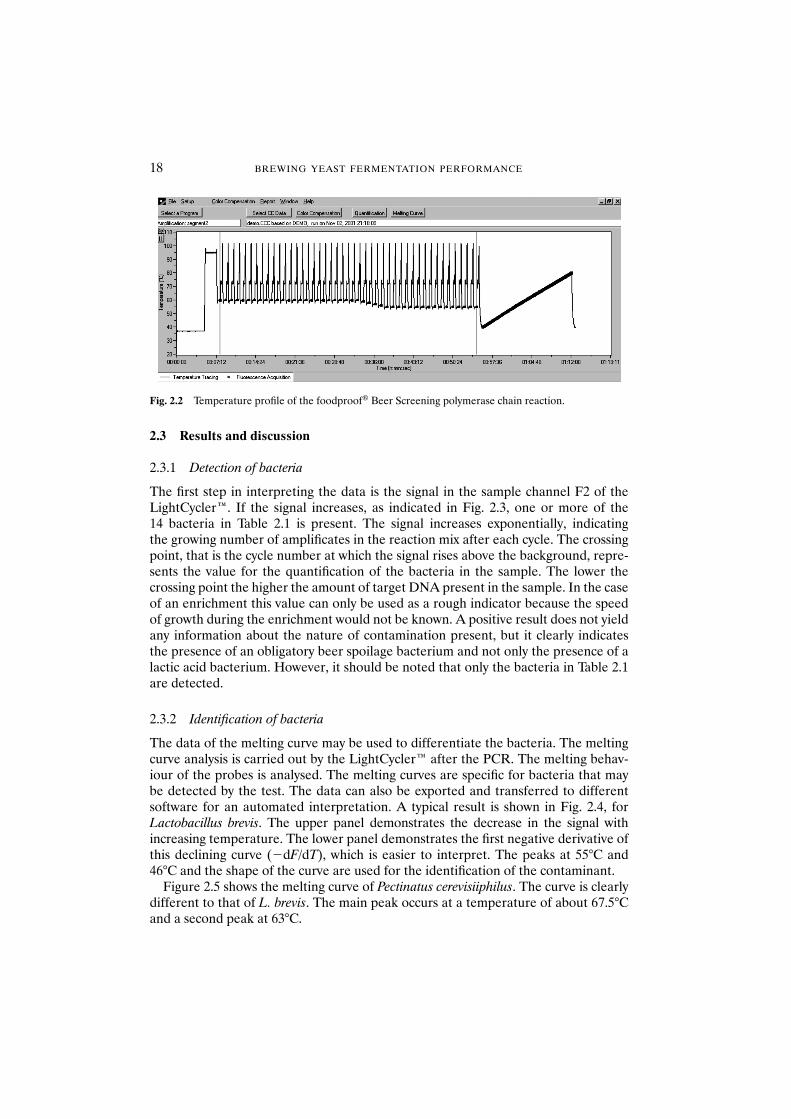
The data of the melting curve may be used to differentiate the bacteria. The meltingcurve analysis is carried out by the LightCycler™ after the PCR. The melting behav-iour of the probes is analysed. The melting curves are specific for bacteria that may be detected by the test. The data can also be exported and transferred to differentsoftware for an automated interpretation. A typical result is shown in Fig. 2.4, for Lactobacillus brevis. The upper panel demonstrates the decrease in the signal withincreasing temperature. The lower panel demonstrates the first negative derivative ofthis declining curve (�dF/dT), which is easier to interpret. The peaks at 55°C and46°C and the shape of the curve are used for the identification of the contaminant.
Figure 2.5 shows the melting curve of Pectinatus cerevisiiphilus. The curve is clearlydifferent to that of L. brevis. The main peak occurs at a temperature of about 67.5°Cand a second peak at 63°C.
18 BREWING YEAST FERMENTATION PERFORMANCE
Fig. 2.2 Temperature profile of the foodproof® Beer Screening polymerase chain reaction.
DETECTION OF BEER SPOILAGE MICROORGANISMS 19
Fig. 2.3 Positive results of a polymerase chain reaction run. Bottom line: negative control.
Fig. 2.4 Melting curve of Lactobacillus brevis.
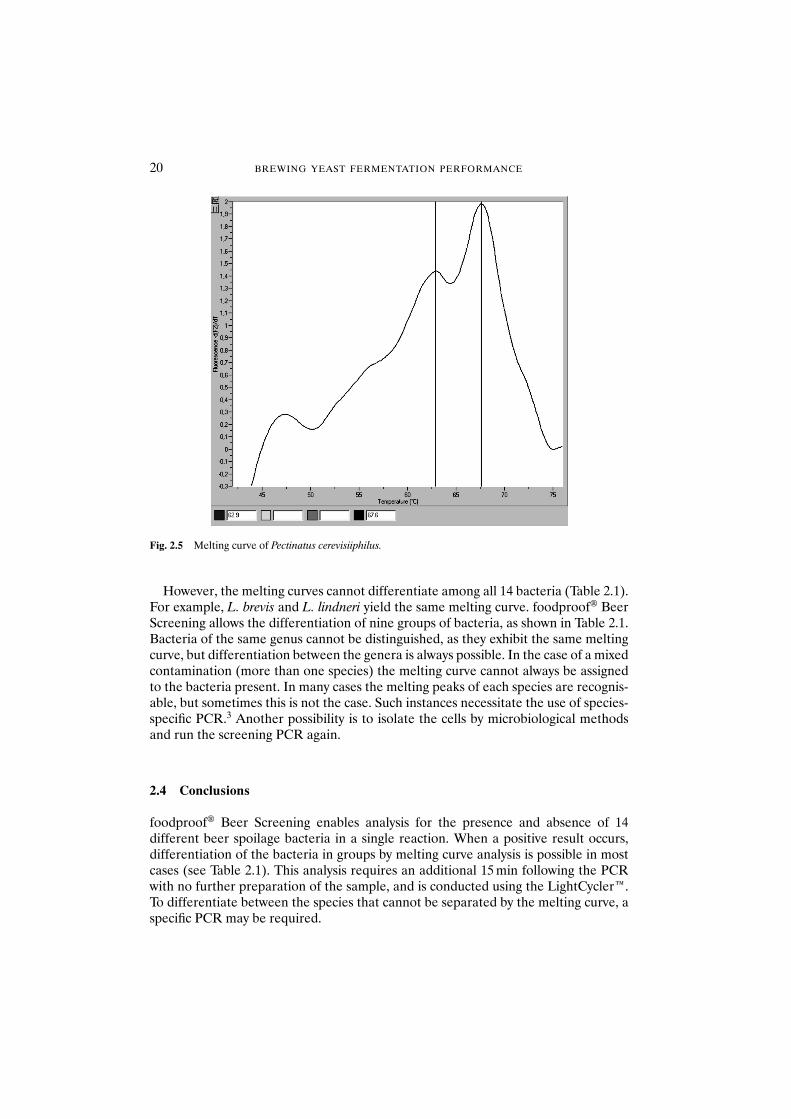
However, the melting curves cannot differentiate among all 14 bacteria (Table 2.1).For example, L. brevis and L. lindneri yield the same melting curve. foodproof® BeerScreening allows the differentiation of nine groups of bacteria, as shown in Table 2.1.Bacteria of the same genus cannot be distinguished, as they exhibit the same meltingcurve, but differentiation between the genera is always possible. In the case of a mixedcontamination (more than one species) the melting curve cannot always be assignedto the bacteria present. In many cases the melting peaks of each species are recognis-able, but sometimes this is not the case. Such instances necessitate the use of species-specific PCR.3 Another possibility is to isolate the cells by microbiological methodsand run the screening PCR again.
2.4 Conclusions
foodproof® Beer Screening enables analysis for the presence and absence of 14different beer spoilage bacteria in a single reaction. When a positive result occurs,differentiation of the bacteria in groups by melting curve analysis is possible in mostcases (see Table 2.1). This analysis requires an additional 15 min following the PCRwith no further preparation of the sample, and is conducted using the LightCycler™.To differentiate between the species that cannot be separated by the melting curve, aspecific PCR may be required.
20 BREWING YEAST FERMENTATION PERFORMANCE
Fig. 2.5 Melting curve of Pectinatus cerevisiiphilus.
This new approach to PCR detection of relevant beer spoilage bacteria allows theuse of this method as a quality-control tool in the routine laboratory of the brewery.The time savings compared with classical microbiology and the high specificity, sensi-tivity and quality of the results (detection and identification of groups) offer newopportunities to the user. The ready-to-use and brewery-tailored system reduces thetime for analysis drastically, with a single test.
References
1. Kiehne, M. (2001) Schnellnachweis von bierschädlichen Mikroorganismen mittels foodproof® BeerScreening. Brauerei Forum Nr. 3/2001, 72–73.
2. BIOTECON Diagnostics (2001) Fast detection of beer spoilage microorganisms drink. Technol. Market.March, 23–24.
3. Kiehne, M. (2001) Détection rapide des microorganismes de fermentation de la bière. LiquidesConditionnement No. 292, 32e année.
DETECTION OF BEER SPOILAGE MICROORGANISMS 21

Part 2 Brewing Yeast Stress Responses During Handling
3 The Impact of Ethanol Stress on Yeast Physiology
A. LENTINI, P. ROGERS, V. HIGGINS, I. DAWES, M. CHANDLER, G. STANLEY and P. CHAMBERS
Abstract The impact of ethanol stress on brewing yeast physiology is an area that is stillnot fully understood. It has been shown that ethanol, a product of the beer fermentationprocess, has the greatest impact on yeast performance, by inhibiting cell growth and via-bility, causing changes in metabolic pathways, cellular structure and function. The degreeof ethanol tolerance exhibited by a yeast cell will determine its suitability for fermentationas well as the number of times the yeast could be repitched into subsequent fermentations.This study investigated the impact of ethanol on the physiological status of brewing yeaston a structural and molecular basis. The first part of the study examined the yeast cell andchanges that occur within the cell membrane (structure and fluidity), cell-wall structure,protease release and overall vitality of the yeast during prolonged storage under varyingconditions of ethanol concentration and temperature. The characteristic physiologicalsigns of cell stress by ethanol are accompanied at the molecular level by the induction of stress response genes. These can then be related to changes in cell-wall composition,trehalose and stress proteins.
The last part of this study involved the examination of the technology of yeast genomeanalysis (Gene Microarrays), to monitor the impact of ethanol stress on gene expression.Yeast genome wide transcription analysis technology allows for the identification of geneswith significant and specific differential expression to changes in environmental condi-tions. The study identified a number of genes that were up-regulated when subjected toethanol stress. These include genes responsible for sugar metabolism, cell-wall structure,stress responses and transport functions.
It is envisaged that using gene expression analysis techniques will provide a process toidentify genes that can be monitored for their impact on yeast health and activity and canlead to a greater understanding of the physiological behaviour and structure of brewingyeast under various fermentation conditions.
3.1 Introduction
The principal role of brewing yeast during fermentation is to produce ethanol, carbondioxide and other flavour-active compounds. It is these by-products of fermentationthat distinguish a specific beer product from other compatible products. Whileethanol is seen as a desirable by-product of the fermentation process, its accumulationduring fermentation can result in a significant chemical stress on the physiological statusof the yeast cell. The impact of ethanol stress on brewing yeast has been previouslyreviewed by researchers.1–7 Ethanol as a chemical stressor inhibits cell growth and via-bility, and causes changes in metabolic pathways, increases in fermentation times,changes in yeast cell wall and membrane structure and function, and modifications ingene expression (i.e. induction of stress response genes).
To understand further the impact of ethanol stress on the physiological condition ofthe yeast cell (activity and health), with particular reference to lager yeast strains, thisstudy concentrated on three objectives:
• to better understand the interaction between environmental conditions and theyeast cell during the brewing process
Brewing Yeast Fermentation Performance: Second edition
Edited by: KATHERINE SMART Copyright 0 Blackwell Science 2003
• to determine how one can better diagnose and predict yeast performance in thepresence of ethanol stress factors
• to develop appropriate diagnostic technologies to identify indicators that will assist in the understanding and control of yeast performance in an ethanol-richenvironment.
As part of the study to understand better the impact of ethanol stress on brewingyeast, the following investigations were undertaken:
• investigation into the impact of ethanol stress on the physiological structure andfunction of brewing yeast during storage
• investigation into the yeast molecular responses to ethanol stress using gene arraytechnology, to identify those genes that are activated by the presence of ethanoland determine how these relate to the structure and function of the yeast cell.
3.2 Materials and methods
3.2.1 Yeast storage trials
Yeast storage trials were undertaken as previously described by Lentini et al.7 In brief,lager yeast was stored in a 2 litre vessel with pressure and temperature control. Thevessel maintained a carbon dioxide environment to minimise yeast exposure to oxygen.The vessels were stored at either 4 or 10°C. To determine the impact of ethanol stress,the yeast slurry was washed with non-alcoholic beer to remove any residual ethanoland then dosed with either 5 or 10% (v/v) food-grade ethanol. Samples were collectedon a daily basis to monitor cell membrane lipid composition, cell wall trehalose content,yeast slurry pH and protease levels in the slurry (excreted from the yeast cell), and tomonitor the viability and vitality of the stored yeast samples.
3.2.1.1 Membrane lipid composition. Saturated and unsaturated lipid composition ofthe brewing yeast was measured using the method described by Lentini et al.7
3.2.1.2 Trehalose content. Yeast cell wall trehalose was isolated and measured by themethod described by Stewart.8
3.2.1.3 Yeast slurry pH. The pH of the storage yeast samples was monitored using acalibrated Orian 520A pH meter and combined electrode.
3.2.1.4 Yeast protease. Yeast protease release into the cell’s environment was meas-ured using the method described by Mochaba et al.9
3.2.1.5 Yeast viability. The viability of the stored yeast samples was monitored usingthe methylene blue staining method.10
3.2.1.6 Yeast vitality. The vitality of the yeast sampled from the storage vessels wasmeasured using two previously described procedures: the acidification power test(APT)11 and oxygen uptake rate (OUR).12
26 BREWING YEAST FERMENTATION PERFORMANCE
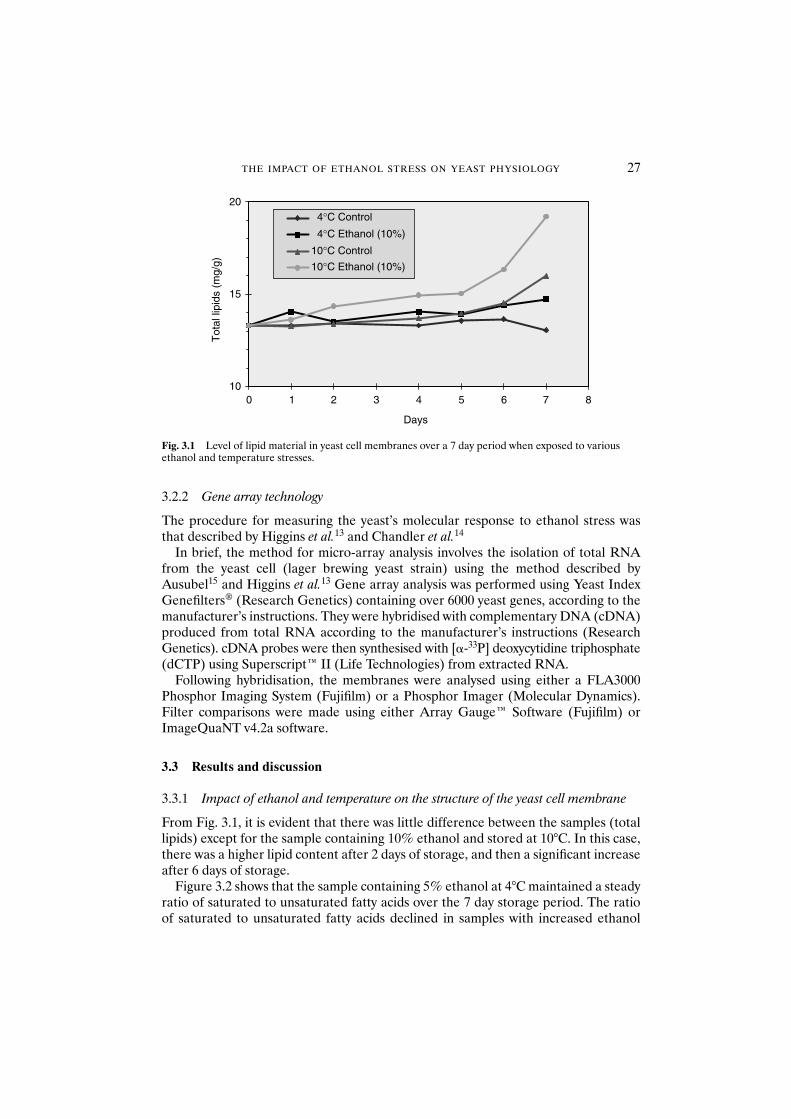
3.2.2 Gene array technology
The procedure for measuring the yeast’s molecular response to ethanol stress wasthat described by Higgins et al.13 and Chandler et al.14
In brief, the method for micro-array analysis involves the isolation of total RNAfrom the yeast cell (lager brewing yeast strain) using the method described byAusubel15 and Higgins et al.13 Gene array analysis was performed using Yeast IndexGenefilters® (Research Genetics) containing over 6000 yeast genes, according to themanufacturer’s instructions. They were hybridised with complementary DNA (cDNA)produced from total RNA according to the manufacturer’s instructions (ResearchGenetics). cDNA probes were then synthesised with [�-33P] deoxycytidine triphosphate(dCTP) using Superscript™ II (Life Technologies) from extracted RNA.
Following hybridisation, the membranes were analysed using either a FLA3000Phosphor Imaging System (Fujifilm) or a Phosphor Imager (Molecular Dynamics).Filter comparisons were made using either Array Gauge™ Software (Fujifilm) orImageQuaNT v4.2a software.
3.3 Results and discussion
3.3.1 Impact of ethanol and temperature on the structure of the yeast cell membrane
From Fig. 3.1, it is evident that there was little difference between the samples (totallipids) except for the sample containing 10% ethanol and stored at 10°C. In this case,there was a higher lipid content after 2 days of storage, and then a significant increaseafter 6 days of storage.
Figure 3.2 shows that the sample containing 5% ethanol at 4°C maintained a steadyratio of saturated to unsaturated fatty acids over the 7 day storage period. The ratioof saturated to unsaturated fatty acids declined in samples with increased ethanol
THE IMPACT OF ETHANOL STRESS ON YEAST PHYSIOLOGY 27
10
15
20
0
Days
Tot
al li
pids
(m
g/g)
4°C Control
4°C Ethanol (10%)
10°C Control
10°C Ethanol (10%)
1 2 3 4 5 6 7 8
Fig. 3.1 Level of lipid material in yeast cell membranes over a 7 day period when exposed to variousethanol and temperature stresses.
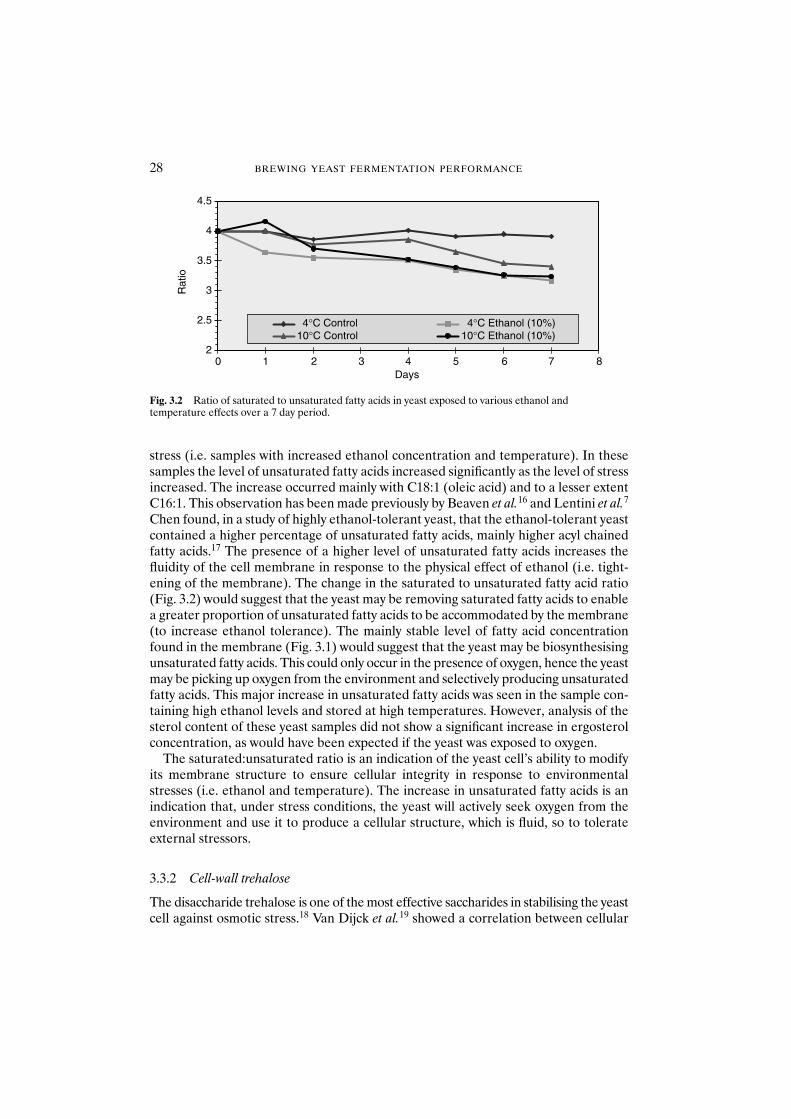
stress (i.e. samples with increased ethanol concentration and temperature). In thesesamples the level of unsaturated fatty acids increased significantly as the level of stressincreased. The increase occurred mainly with C18:1 (oleic acid) and to a lesser extentC16:1. This observation has been made previously by Beaven et al.16 and Lentini et al.7
Chen found, in a study of highly ethanol-tolerant yeast, that the ethanol-tolerant yeastcontained a higher percentage of unsaturated fatty acids, mainly higher acyl chainedfatty acids.17 The presence of a higher level of unsaturated fatty acids increases thefluidity of the cell membrane in response to the physical effect of ethanol (i.e. tight-ening of the membrane). The change in the saturated to unsaturated fatty acid ratio(Fig. 3.2) would suggest that the yeast may be removing saturated fatty acids to enablea greater proportion of unsaturated fatty acids to be accommodated by the membrane(to increase ethanol tolerance). The mainly stable level of fatty acid concentrationfound in the membrane (Fig. 3.1) would suggest that the yeast may be biosynthesisingunsaturated fatty acids. This could only occur in the presence of oxygen, hence the yeastmay be picking up oxygen from the environment and selectively producing unsaturatedfatty acids. This major increase in unsaturated fatty acids was seen in the sample con-taining high ethanol levels and stored at high temperatures. However, analysis of thesterol content of these yeast samples did not show a significant increase in ergosterolconcentration, as would have been expected if the yeast was exposed to oxygen.
The saturated:unsaturated ratio is an indication of the yeast cell’s ability to modifyits membrane structure to ensure cellular integrity in response to environmentalstresses (i.e. ethanol and temperature). The increase in unsaturated fatty acids is anindication that, under stress conditions, the yeast will actively seek oxygen from theenvironment and use it to produce a cellular structure, which is fluid, so to tolerateexternal stressors.
3.3.2 Cell-wall trehalose
The disaccharide trehalose is one of the most effective saccharides in stabilising the yeastcell against osmotic stress.18 Van Dijck et al.19 showed a correlation between cellular
28 BREWING YEAST FERMENTATION PERFORMANCE
2
2.5
3
3.5
4
4.5
0 1 2 3 4 5 6 7 8Days
Rat
io
4°C Control 4°C Ethanol (10%) 10°C Control 10°C Ethanol (10%)
Fig. 3.2 Ratio of saturated to unsaturated fatty acids in yeast exposed to various ethanol andtemperature effects over a 7 day period.
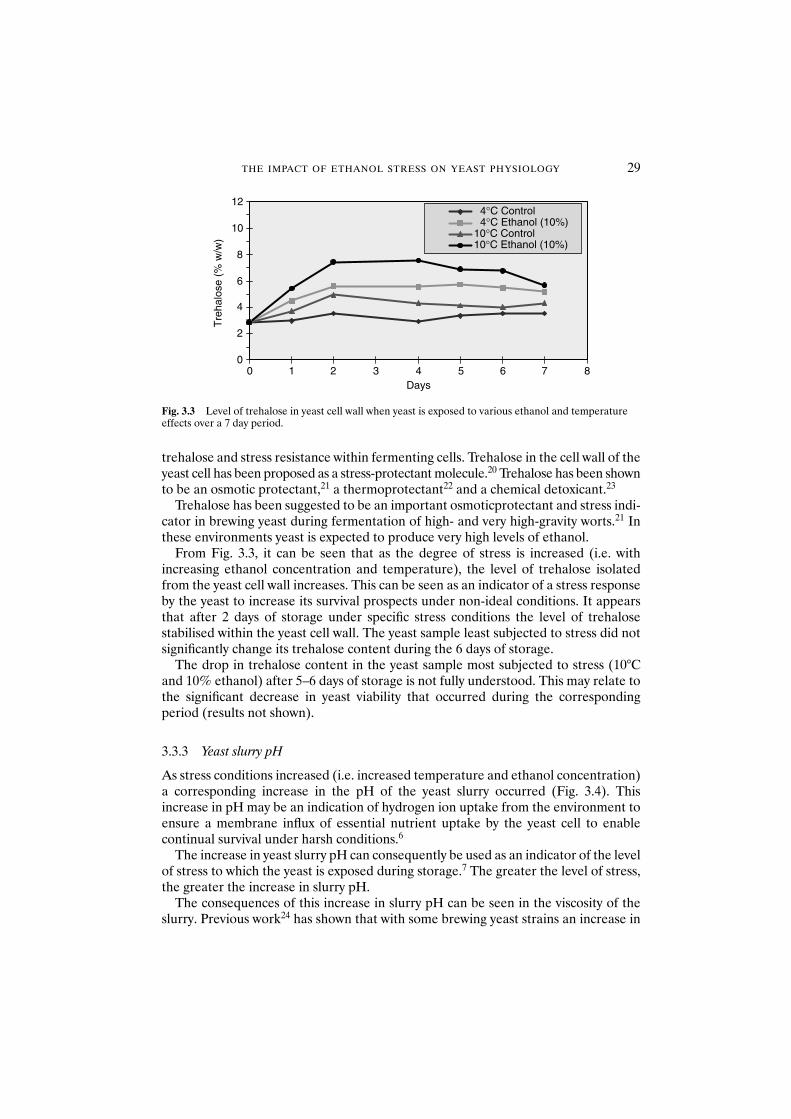
trehalose and stress resistance within fermenting cells. Trehalose in the cell wall of theyeast cell has been proposed as a stress-protectant molecule.20 Trehalose has been shownto be an osmotic protectant,21 a thermoprotectant22 and a chemical detoxicant.23
Trehalose has been suggested to be an important osmoticprotectant and stress indi-cator in brewing yeast during fermentation of high- and very high-gravity worts.21 Inthese environments yeast is expected to produce very high levels of ethanol.
From Fig. 3.3, it can be seen that as the degree of stress is increased (i.e. withincreasing ethanol concentration and temperature), the level of trehalose isolatedfrom the yeast cell wall increases. This can be seen as an indicator of a stress responseby the yeast to increase its survival prospects under non-ideal conditions. It appearsthat after 2 days of storage under specific stress conditions the level of trehalose stabilised within the yeast cell wall. The yeast sample least subjected to stress did notsignificantly change its trehalose content during the 6 days of storage.
The drop in trehalose content in the yeast sample most subjected to stress (10°Cand 10% ethanol) after 5–6 days of storage is not fully understood. This may relate tothe significant decrease in yeast viability that occurred during the correspondingperiod (results not shown).
3.3.3 Yeast slurry pH
As stress conditions increased (i.e. increased temperature and ethanol concentration)a corresponding increase in the pH of the yeast slurry occurred (Fig. 3.4). Thisincrease in pH may be an indication of hydrogen ion uptake from the environment toensure a membrane influx of essential nutrient uptake by the yeast cell to enable continual survival under harsh conditions.6
The increase in yeast slurry pH can consequently be used as an indicator of the levelof stress to which the yeast is exposed during storage.7 The greater the level of stress,the greater the increase in slurry pH.
The consequences of this increase in slurry pH can be seen in the viscosity of theslurry. Previous work24 has shown that with some brewing yeast strains an increase in
THE IMPACT OF ETHANOL STRESS ON YEAST PHYSIOLOGY 29
0
2
4
6
8
10
12
0 1 2 3 4 5 6 7 8Days
Tre
halo
se (
% w
/w)
4°C Control4°C Ethanol (10%)
10°C Control10°C Ethanol (10%)
Fig. 3.3 Level of trehalose in yeast cell wall when yeast is exposed to various ethanol and temperatureeffects over a 7 day period.
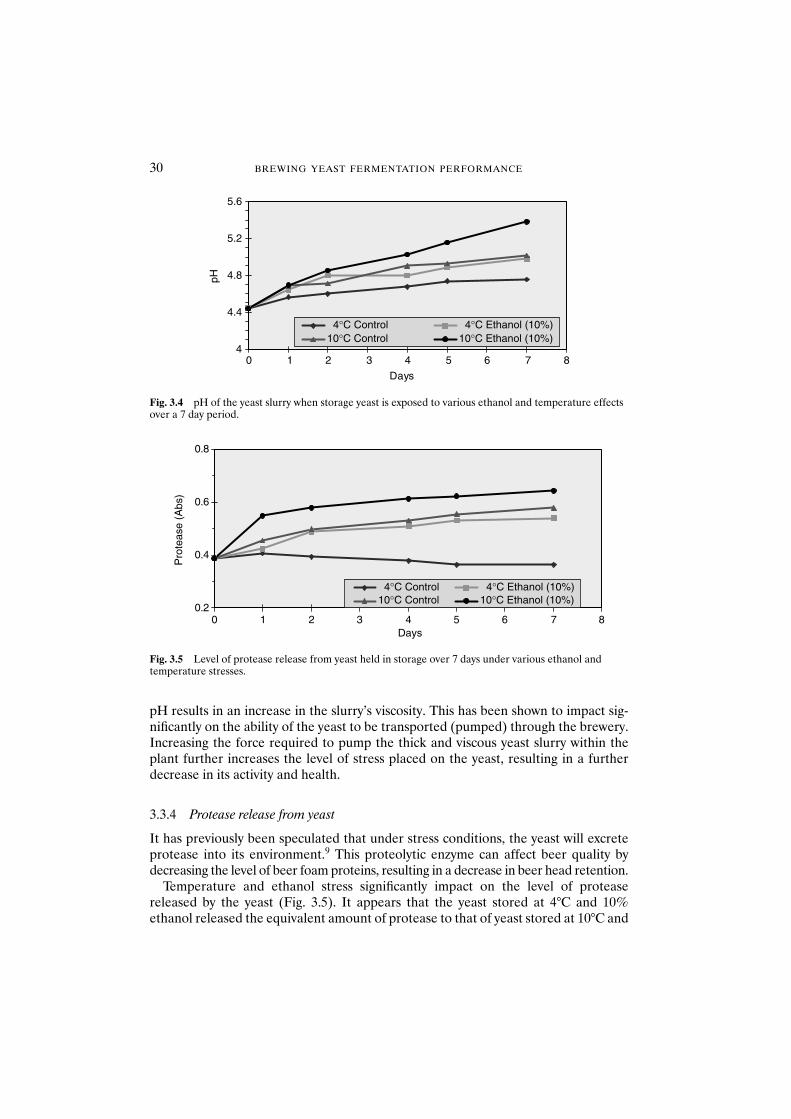
pH results in an increase in the slurry’s viscosity. This has been shown to impact sig-nificantly on the ability of the yeast to be transported (pumped) through the brewery.Increasing the force required to pump the thick and viscous yeast slurry within theplant further increases the level of stress placed on the yeast, resulting in a furtherdecrease in its activity and health.
3.3.4 Protease release from yeast
It has previously been speculated that under stress conditions, the yeast will excreteprotease into its environment.9 This proteolytic enzyme can affect beer quality bydecreasing the level of beer foam proteins, resulting in a decrease in beer head retention.
Temperature and ethanol stress significantly impact on the level of proteasereleased by the yeast (Fig. 3.5). It appears that the yeast stored at 4°C and 10%ethanol released the equivalent amount of protease to that of yeast stored at 10°C and
30 BREWING YEAST FERMENTATION PERFORMANCE
4
4.4
4.8
5.2
5.6
0 1 2 3 4 5 6 7 8
Days
pH
4°C Control 4°C Ethanol (10%)10°C Control 10°C Ethanol (10%)
Fig. 3.4 pH of the yeast slurry when storage yeast is exposed to various ethanol and temperature effectsover a 7 day period.
0.2
0.4
0.6
0.8
Pro
teas
e (A
bs)
4°C Control 4°C Ethanol (10%)10°C Control 10°C Ethanol (10%)
0 1 2 3 4 5 6 7 8Days
Fig. 3.5 Level of protease release from yeast held in storage over 7 days under various ethanol and temperature stresses.
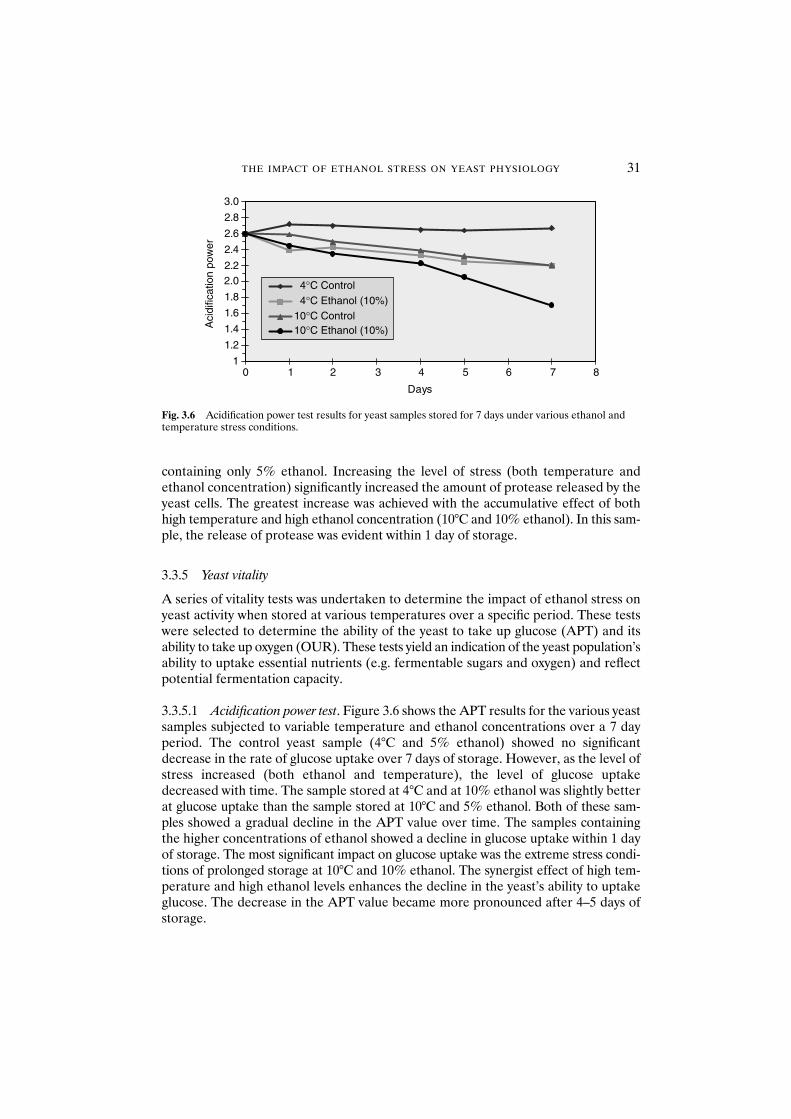
containing only 5% ethanol. Increasing the level of stress (both temperature andethanol concentration) significantly increased the amount of protease released by theyeast cells. The greatest increase was achieved with the accumulative effect of bothhigh temperature and high ethanol concentration (10°C and 10% ethanol). In this sam-ple, the release of protease was evident within 1 day of storage.
3.3.5 Yeast vitality
A series of vitality tests was undertaken to determine the impact of ethanol stress onyeast activity when stored at various temperatures over a specific period. These testswere selected to determine the ability of the yeast to take up glucose (APT) and itsability to take up oxygen (OUR). These tests yield an indication of the yeast population’sability to uptake essential nutrients (e.g. fermentable sugars and oxygen) and reflectpotential fermentation capacity.
3.3.5.1 Acidification power test. Figure 3.6 shows the APT results for the various yeastsamples subjected to variable temperature and ethanol concentrations over a 7 dayperiod. The control yeast sample (4°C and 5% ethanol) showed no significantdecrease in the rate of glucose uptake over 7 days of storage. However, as the level ofstress increased (both ethanol and temperature), the level of glucose uptakedecreased with time. The sample stored at 4°C and at 10% ethanol was slightly betterat glucose uptake than the sample stored at 10°C and 5% ethanol. Both of these sam-ples showed a gradual decline in the APT value over time. The samples containing the higher concentrations of ethanol showed a decline in glucose uptake within 1 dayof storage. The most significant impact on glucose uptake was the extreme stress condi-tions of prolonged storage at 10°C and 10% ethanol. The synergist effect of high tem-perature and high ethanol levels enhances the decline in the yeast’s ability to uptakeglucose. The decrease in the APT value became more pronounced after 4–5 days ofstorage.
THE IMPACT OF ETHANOL STRESS ON YEAST PHYSIOLOGY 31
1
1.2
1.4
1.6
1.8
2.02.2
2.4
2.6
2.8
3.0
0 1 2 3 4 5 6 7 8
Days
Aci
dific
atio
n po
wer
4°C Control4°C Ethanol (10%)
10°C Control10°C Ethanol (10%)
Fig. 3.6 Acidification power test results for yeast samples stored for 7 days under various ethanol andtemperature stress conditions.
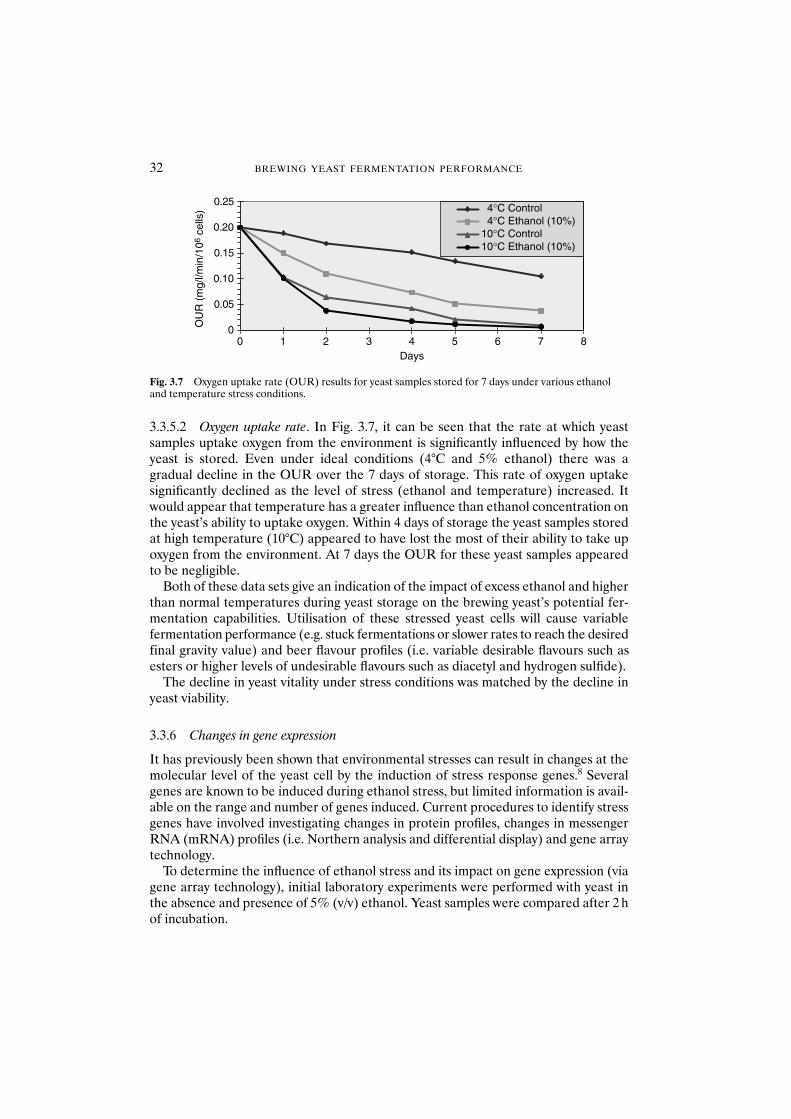
3.3.5.2 Oxygen uptake rate. In Fig. 3.7, it can be seen that the rate at which yeastsamples uptake oxygen from the environment is significantly influenced by how theyeast is stored. Even under ideal conditions (4°C and 5% ethanol) there was a gradual decline in the OUR over the 7 days of storage. This rate of oxygen uptakesignificantly declined as the level of stress (ethanol and temperature) increased. Itwould appear that temperature has a greater influence than ethanol concentration onthe yeast’s ability to uptake oxygen. Within 4 days of storage the yeast samples stored at high temperature (10°C) appeared to have lost the most of their ability to take upoxygen from the environment. At 7 days the OUR for these yeast samples appearedto be negligible.
Both of these data sets give an indication of the impact of excess ethanol and higherthan normal temperatures during yeast storage on the brewing yeast’s potential fer-mentation capabilities. Utilisation of these stressed yeast cells will cause variable fermentation performance (e.g. stuck fermentations or slower rates to reach the desiredfinal gravity value) and beer flavour profiles (i.e. variable desirable flavours such asesters or higher levels of undesirable flavours such as diacetyl and hydrogen sulfide).
The decline in yeast vitality under stress conditions was matched by the decline inyeast viability.
3.3.6 Changes in gene expression
It has previously been shown that environmental stresses can result in changes at themolecular level of the yeast cell by the induction of stress response genes.8 Severalgenes are known to be induced during ethanol stress, but limited information is avail-able on the range and number of genes induced. Current procedures to identify stressgenes have involved investigating changes in protein profiles, changes in messengerRNA (mRNA) profiles (i.e. Northern analysis and differential display) and gene arraytechnology.
To determine the influence of ethanol stress and its impact on gene expression (viagene array technology), initial laboratory experiments were performed with yeast inthe absence and presence of 5% (v/v) ethanol. Yeast samples were compared after 2 hof incubation.
32 BREWING YEAST FERMENTATION PERFORMANCE
0
0.05
0.10
0.15
0.20
0.25O
UR
(m
g/l/m
in/1
06 c
ells
) 4°C Control4°C Ethanol (10%)
10°C Control10°C Ethanol (10%)
0 1 2 3 4 5 6 7 8Days
Fig. 3.7 Oxygen uptake rate (OUR) results for yeast samples stored for 7 days under various ethanoland temperature stress conditions.
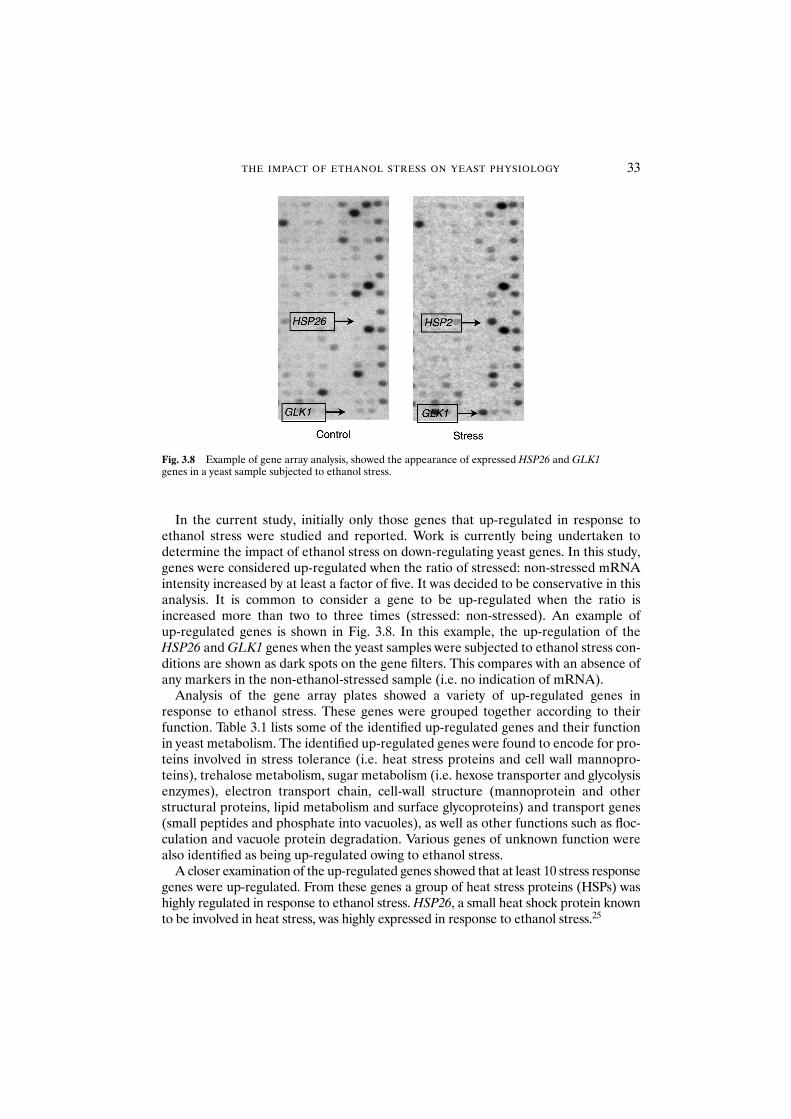
In the current study, initially only those genes that up-regulated in response toethanol stress were studied and reported. Work is currently being undertaken todetermine the impact of ethanol stress on down-regulating yeast genes. In this study,genes were considered up-regulated when the ratio of stressed: non-stressed mRNAintensity increased by at least a factor of five. It was decided to be conservative in thisanalysis. It is common to consider a gene to be up-regulated when the ratio isincreased more than two to three times (stressed: non-stressed). An example ofup-regulated genes is shown in Fig. 3.8. In this example, the up-regulation of theHSP26 and GLK1 genes when the yeast samples were subjected to ethanol stress con-ditions are shown as dark spots on the gene filters. This compares with an absence ofany markers in the non-ethanol-stressed sample (i.e. no indication of mRNA).
Analysis of the gene array plates showed a variety of up-regulated genes inresponse to ethanol stress. These genes were grouped together according to theirfunction. Table 3.1 lists some of the identified up-regulated genes and their functionin yeast metabolism. The identified up-regulated genes were found to encode for pro-teins involved in stress tolerance (i.e. heat stress proteins and cell wall mannopro-teins), trehalose metabolism, sugar metabolism (i.e. hexose transporter and glycolysisenzymes), electron transport chain, cell-wall structure (mannoprotein and otherstructural proteins, lipid metabolism and surface glycoproteins) and transport genes(small peptides and phosphate into vacuoles), as well as other functions such as floc-culation and vacuole protein degradation. Various genes of unknown function werealso identified as being up-regulated owing to ethanol stress.
A closer examination of the up-regulated genes showed that at least 10 stress responsegenes were up-regulated. From these genes a group of heat stress proteins (HSPs) washighly regulated in response to ethanol stress. HSP26, a small heat shock protein knownto be involved in heat stress, was highly expressed in response to ethanol stress.25
THE IMPACT OF ETHANOL STRESS ON YEAST PHYSIOLOGY 33
Fig. 3.8 Example of gene array analysis, showed the appearance of expressed HSP26 and GLK1genes in a yeast sample subjected to ethanol stress.
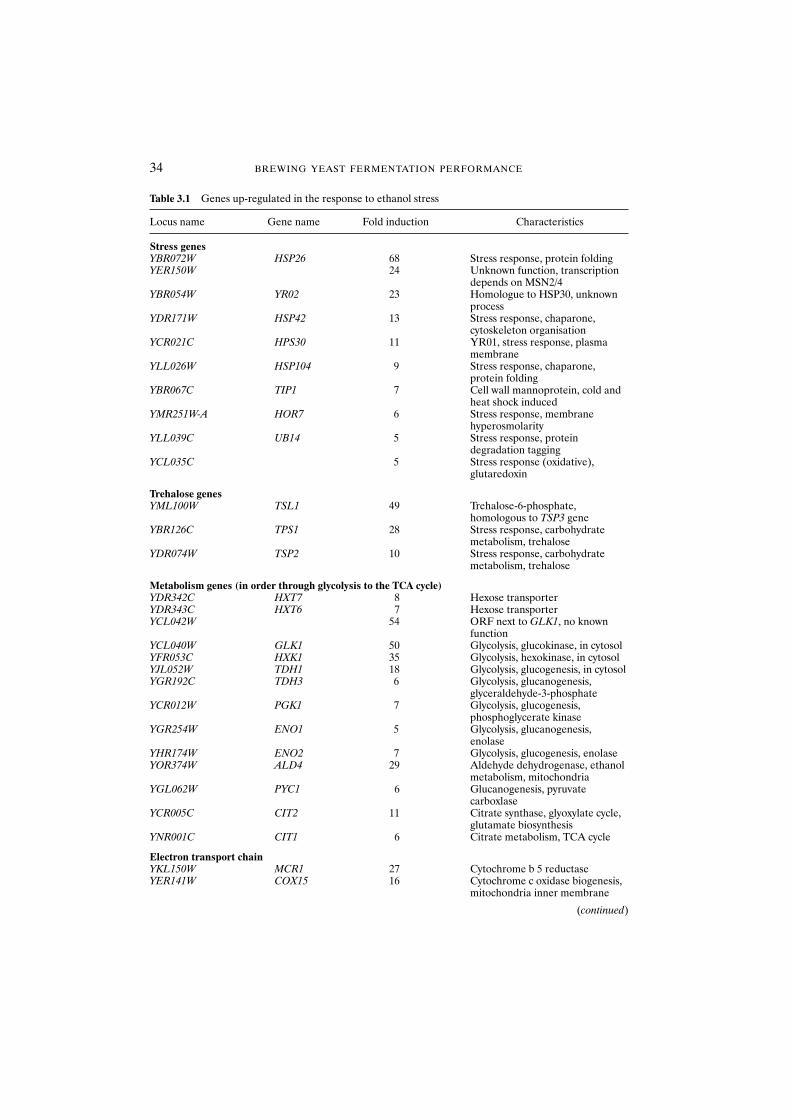
34 BREWING YEAST FERMENTATION PERFORMANCE
Table 3.1 Genes up-regulated in the response to ethanol stress
Locus name Gene name Fold induction Characteristics
Stress genesYBR072W HSP26 68 Stress response, protein foldingYER150W 24 Unknown function, transcription
depends on MSN2/4YBR054W YR02 23 Homologue to HSP30, unknown
processYDR171W HSP42 13 Stress response, chaparone,
cytoskeleton organisationYCR021C HPS30 11 YR01, stress response, plasma
membraneYLL026W HSP104 9 Stress response, chaparone,
protein foldingYBR067C TIP1 7 Cell wall mannoprotein, cold and
heat shock inducedYMR251W-A HOR7 6 Stress response, membrane
hyperosmolarityYLL039C UB14 5 Stress response, protein
degradation taggingYCL035C 5 Stress response (oxidative),
glutaredoxin
Trehalose genesYML100W TSL1 49 Trehalose-6-phosphate,
homologous to TSP3 geneYBR126C TPS1 28 Stress response, carbohydrate
metabolism, trehaloseYDR074W TSP2 10 Stress response, carbohydrate
metabolism, trehalose
Metabolism genes (in order through glycolysis to the TCA cycle)YDR342C HXT7 8 Hexose transporterYDR343C HXT6 7 Hexose transporterYCL042W 54 ORF next to GLK1, no known
functionYCL040W GLK1 50 Glycolysis, glucokinase, in cytosolYFR053C HXK1 35 Glycolysis, hexokinase, in cytosolYJL052W TDH1 18 Glycolysis, glucogenesis, in cytosolYGR192C TDH3 6 Glycolysis, glucanogenesis,
glyceraldehyde-3-phosphateYCR012W PGK1 7 Glycolysis, glucogenesis,
phosphoglycerate kinaseYGR254W ENO1 5 Glycolysis, glucanogenesis,
enolaseYHR174W ENO2 7 Glycolysis, glucogenesis, enolaseYOR374W ALD4 29 Aldehyde dehydrogenase, ethanol
metabolism, mitochondriaYGL062W PYC1 6 Glucanogenesis, pyruvate
carboxlaseYCR005C CIT2 11 Citrate synthase, glyoxylate cycle,
glutamate biosynthesisYNR001C CIT1 6 Citrate metabolism, TCA cycle
Electron transport chainYKL150W MCR1 27 Cytochrome b 5 reductaseYER141W COX15 16 Cytochrome c oxidase biogenesis,
mitochondria inner membrane
(continued)
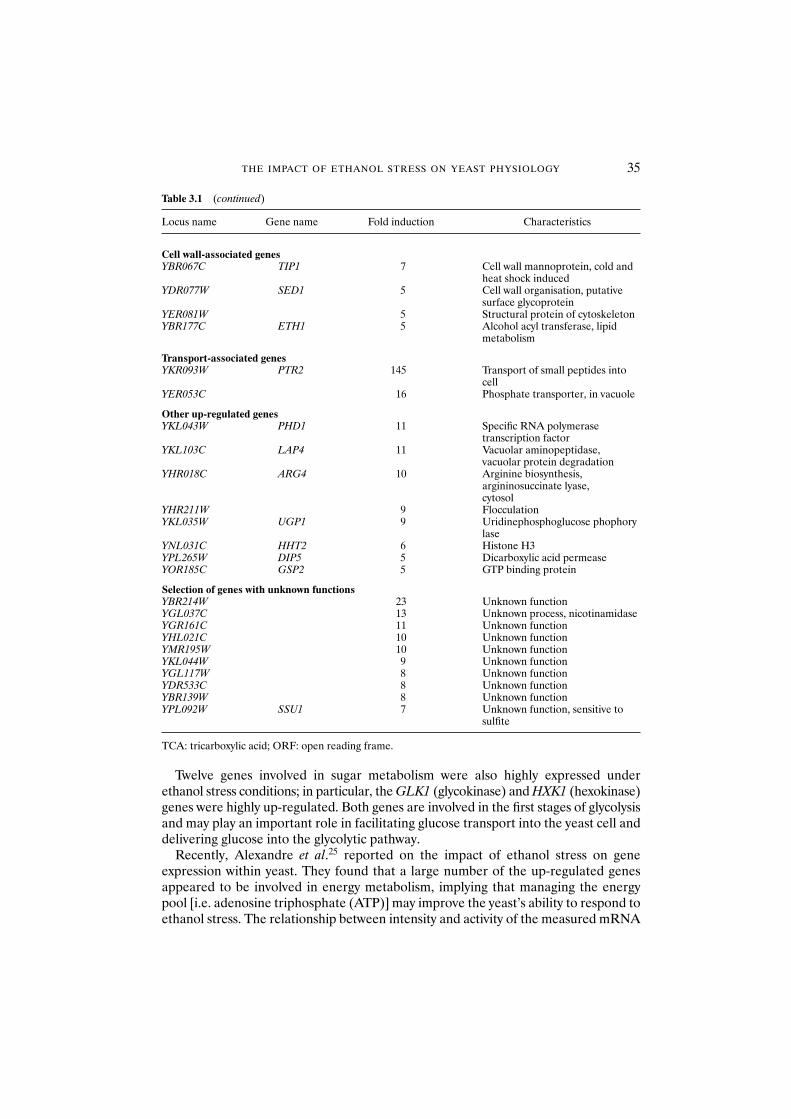
Twelve genes involved in sugar metabolism were also highly expressed underethanol stress conditions; in particular, the GLK1 (glycokinase) and HXK1 (hexokinase)genes were highly up-regulated. Both genes are involved in the first stages of glycolysisand may play an important role in facilitating glucose transport into the yeast cell anddelivering glucose into the glycolytic pathway.
Recently, Alexandre et al.25 reported on the impact of ethanol stress on geneexpression within yeast. They found that a large number of the up-regulated genesappeared to be involved in energy metabolism, implying that managing the energypool [i.e. adenosine triphosphate (ATP)] may improve the yeast’s ability to respond toethanol stress. The relationship between intensity and activity of the measured mRNA
THE IMPACT OF ETHANOL STRESS ON YEAST PHYSIOLOGY 35
Table 3.1 (continued)
Locus name Gene name Fold induction Characteristics
Cell wall-associated genesYBR067C TIP1 7 Cell wall mannoprotein, cold and
heat shock inducedYDR077W SED1 5 Cell wall organisation, putative
surface glycoproteinYER081W 5 Structural protein of cytoskeletonYBR177C ETH1 5 Alcohol acyl transferase, lipid
metabolism
Transport-associated genesYKR093W PTR2 145 Transport of small peptides into
cellYER053C 16 Phosphate transporter, in vacuole
Other up-regulated genesYKL043W PHD1 11 Specific RNA polymerase
transcription factorYKL103C LAP4 11 Vacuolar aminopeptidase,
vacuolar protein degradationYHR018C ARG4 10 Arginine biosynthesis,
argininosuccinate lyase,cytosol
YHR211W 9 FlocculationYKL035W UGP1 9 Uridinephosphoglucose phophory
laseYNL031C HHT2 6 Histone H3YPL265W DIP5 5 Dicarboxylic acid permeaseYOR185C GSP2 5 GTP binding protein
Selection of genes with unknown functionsYBR214W 23 Unknown functionYGL037C 13 Unknown process, nicotinamidaseYGR161C 11 Unknown functionYHL021C 10 Unknown functionYMR195W 10 Unknown functionYKL044W 9 Unknown functionYGL117W 8 Unknown functionYDR533C 8 Unknown functionYBR139W 8 Unknown functionYPL092W SSU1 7 Unknown function, sensitive to
sulfite
TCA: tricarboxylic acid; ORF: open reading frame.
spot cannot be fully understood until the level and specificity of proteins associatedwith the specific gene have been determined.
Many of the observations made here and in other studies on the physiological changesto the yeast cell during various stress conditions (i.e. changes in cell wall trehalose andmembrane lipid contents, the ability of the yeast to uptake glucose: acidificationpower test, cell surface properties, yeast growth rates, etc.) are reflected by the iden-tified genes that were up-regulated in the presence of ethanol stress. This study con-firms the yeast’s ability to respond to stress conditions on a molecular basis and thenecessary modifications to the yeast’s physiological status and function, to ensure thesurvival of the cell.
3.3.6.1 Observations on using gene array technology. In the course of using gene array technology to determine the impact of ethanol stress on yeast metabolism, the following observations were made. (i) Industrial yeast strains have a higher ratioof ribosomal RNA to mRNA than laboratory yeast strains. (ii) The quantity of RNAisolated from industrial cells was lower than for laboratory-grown yeast strains. (iii) Industrial yeast strains required at least 10 times the amount of total RNA to generate the cDNA probes. (iv) Current gene array filters are expensive and can only be reused up to three to five times. The development of newer and longer life(microchip-based) filters will significantly decrease the cost of the analysis, therebyincreasing the potential of this technique for becoming a standard biochemical analyt-ical tool.
3.4 Conclusions
The purpose of this study was to investigate the impact on the physiological structureand function of brewing yeast when subjected to ethanol stress over time, at both abiochemical and a molecular level. The contributory effect of temperature on ethanolstress was also examined. The results showed that ethanol stress in combination withhigh storage temperatures significantly impacted on the yeast cell wall and membranestructure, as well as it vitality and viability. It also caused the release of protease intoits surrounding environment, which could affect the quality of the final beer product(i.e. beer foam).
The study also tried to link changes that occur on a molecular basis with physicalcharacteristics of the yeast cell, by identifying those genes that are responsible forchanges made by the yeast to ensure survival under stress conditions (i.e. changes intrehalose levels in the cell wall, the lipid composition in yeast membrane and the yeastvitality). The current study only investigated those genes that up-regulated whenexposed to ethanol stress. Work is continuing to investigate further the impact of up-regulated as well as down-regulated genes on the yeast’s ability to adapt to chemicaland environmental stress conditions.
The use of gene expression analysis provides a process to identify genes that can bemonitored for their impact on yeast health and activity, thereby achieving a greaterunderstanding of the physiological behaviour and structure of brewing yeast undervarious fermentation conditions.
36 BREWING YEAST FERMENTATION PERFORMANCE
The advances being made in gene array technology will enable the use of real-timequantitative polymerase chain reaction technology to measure the level of specificidentified gene markers within the yeast, to detect conditions that may impact on itshealth or fermentation performance during storage or fermentation.
Acknowledgements
We would like to thank Carlton and United Breweries, The University of New SouthWales and Victoria University for their support.
References
1. Casey, G.P. and Ingledew, W.M. (1986) Ethanol tolerance in yeasts. CRC Crit. Rev. Microbiol. 13,219–280.
2. Jones, R.P. (1987) Factors affecting deactivation of yeast cells exposed to ethanol. J. Appl. Bacteriol. 63,153–164.
3. Jones, R.P. (1990) Roles for replicative inactivation in yeast ethanol fermentations. Crit. Rev.Biotechnol. 10, 205–222.
4. D’Amore, T. and Stewart, G.G. (1990) Ethanol tolerance of yeast. Enzyme Microb. Technol. 9, 322–330.5. D’Amore, T., Panchal, C.J., Russell, I. and Stewart, G.G. (1990) A study of ethanol tolerance in yeast.
Crit. Rev. Biotechnol. 9, 287–304.6. Walker, G.M. (1998) Yeast: Physiology and Biotechnology. John Wiley and Sons, Chichester,
pp. 163–167.7. Lentini, A., Mariani, M., Takis, S. et al. (1998) An overview of the physiological changes to the struc-
ture and activity of the yeast cell during fermentation, storage and when subjected to successiverepitchings. Proc. 25th Conv. Inst. Brew. Asia Pacific Sect., Perth.
8. Stewart, P.R. (1975) Analytical methods for yeast. In Methods in Cell Biology, Vol. XII, Prescott, D.M.(ed.). Academic Press, London, pp. 111–145.
9. Mochaba, F.M., O’Conner-Cox, E.S.C. and Axcell, B.C. (1995) Practical implications of yeast proteaseactivity. Proc. Inst. Brew. Conv. Central and Southern Africa Sect., Victoria Falls, 5, 152–158.
10. Institute of Brewing (1997) Methods of Analysis, Vol. 2, Microbiology, Section 21.33, Assessment of YeastViability. IOB, London.
11. Opekarova, M. and Sigler, K. (1982) Acidification power: indicator of metabolic activity and autolyticchanges in Saccharomyces cerevisiae. Fol. Microbiol. 27, 395–403.
12. Kara, B.V., Dauod, I. and Searle, B. (1987) Assessment of yeast quality. Proc. 21st Cong. Eur. Brew.Conv., Madrid, pp. 409–416.
13. Higgins, V.J., Oliver, A.D., Day, R.E. et al. (2001) Application of genome-wide transcriptional analysisto identify genetic markers useful in industrial fermentations. Proc. 28th Cong. Eur. Brew. Conv.,Budapest.
14. Chandler, M., Stanley, G., Rogers, P. and Chambers, P. (2001) Profiling ethanol stress response genesin Saccharomyces cerevisiae. Proc. XXth Int. Conf. Yeast Genet. Molec. Biol., Prague.
15. Ausubel, F. (1998) Current Protocols in Molecular Biology. Greene, New York.16. Beaven, M.J., Charpentier, C. and Rose, A.H. (1982) Production and tolerance of ethanol in
relation to phospholipid fatty acyl composition of Saccharomyces cerevisiae. J. Gen. Microbiol. 128,1447–1455.
17. Chen, E.C. (1981) Release of fatty acids as a consequence of yeast autolysis. J. Am. Soc. Brew. Chem.39, 117–124.
18. Crowe, J.H., Crowe, L.M. and Chapman, D. (1984) Preservation of membranes in anhydrobioticorganisms: the role of trehalose. Science 223, 701–703.
19. Van Dijck, P., Colavizza, D., Smet, P. and Thevelein, J.M. (1995) Differential importance of trehalosein stress resistance in fermenting and non-fermenting Saccharomyces ceravisiae cells. Appl. Environ.Microbiol. 61, 109–115.
20. Wiemken, A. (1990) Trehaole in yeast: stress protectant rather than reserve carbohydrate? Antonie vanLeeuwenhoek 58, 209–217.
THE IMPACT OF ETHANOL STRESS ON YEAST PHYSIOLOGY 37

21. Majara, M., O’Conner-Cox, E.S.C. and Axcell, B.C. (1996) Trehalose – an osmoprotectant and stressindicator compound in high and very high gravity brewing. J. Am. Soc. Brew. Chem. 54, 149–154.
22. DeVirgillo, C., Hottiger, T., Dominguez, J. et al. (1994) The role of trehalose systhesis for the acquitionof thermotolerance in yeast. 1. Genetic evidence that trehalose is a thermoprotectant. Eur. J. Biochem.219, 179–186.
23. Attfield, P.V. (1987) Trehalose accumulates in Saccharomyces ceravisae during exposure to agents thatinduce heat shock response. FEBS Lett. 225, 259–263.
24. Lentini, A., Hawthorne, D.B. and Kavanagh, T.E. (1992) A rheological study of yeast during handlingand storage. Proc. 22nd Conv. Inst. Brew. Aust. N.Z. Sect., Melbourne, p. 198.
25. Alexandre, H., Ansanay-Galeote, V., Dequin, S. and Blondin, B. (2001) Global gene expression duringshort term ethanol stress in Saccharomyces cerevisae. FEBS Lett. 498, 98–103.
38 BREWING YEAST FERMENTATION PERFORMANCE
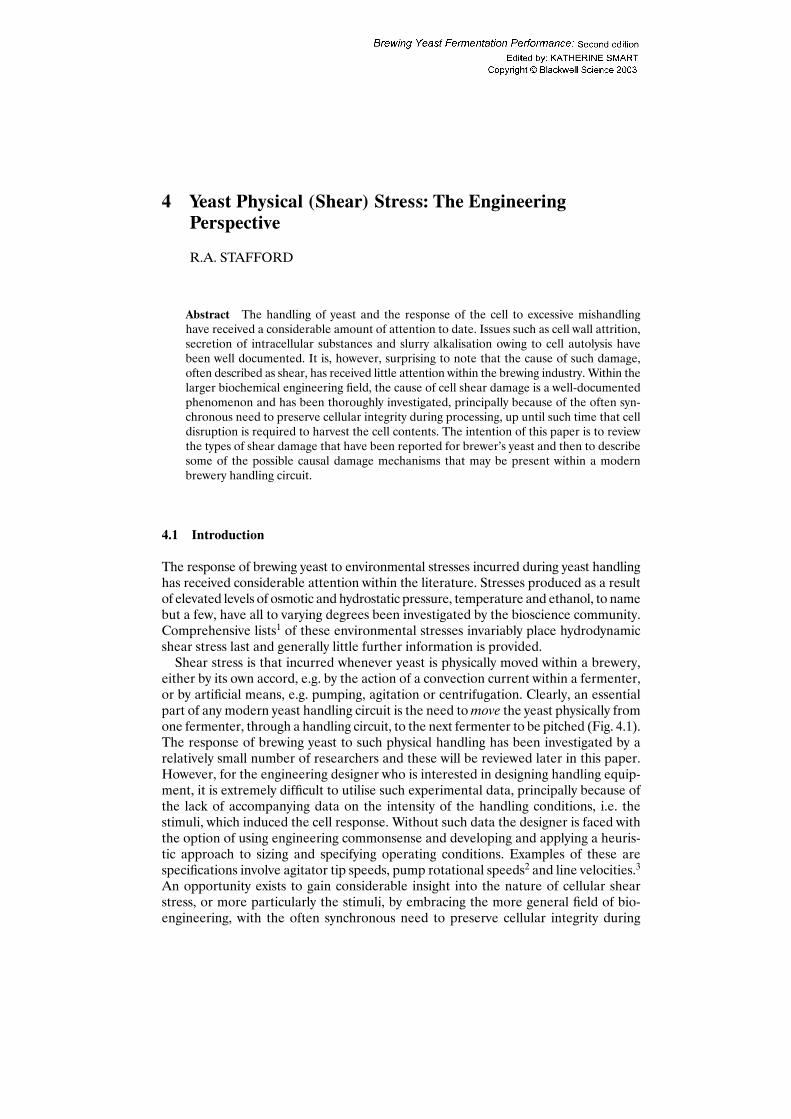
4 Yeast Physical (Shear) Stress: The EngineeringPerspective
R.A. STAFFORD
Abstract The handling of yeast and the response of the cell to excessive mishandlinghave received a considerable amount of attention to date. Issues such as cell wall attrition,secretion of intracellular substances and slurry alkalisation owing to cell autolysis havebeen well documented. It is, however, surprising to note that the cause of such damage,often described as shear, has received little attention within the brewing industry. Within thelarger biochemical engineering field, the cause of cell shear damage is a well-documentedphenomenon and has been thoroughly investigated, principally because of the often syn-chronous need to preserve cellular integrity during processing, up until such time that celldisruption is required to harvest the cell contents. The intention of this paper is to reviewthe types of shear damage that have been reported for brewer’s yeast and then to describesome of the possible causal damage mechanisms that may be present within a modernbrewery handling circuit.
4.1 Introduction
The response of brewing yeast to environmental stresses incurred during yeast handlinghas received considerable attention within the literature. Stresses produced as a resultof elevated levels of osmotic and hydrostatic pressure, temperature and ethanol, to namebut a few, have all to varying degrees been investigated by the bioscience community.Comprehensive lists1 of these environmental stresses invariably place hydrodynamicshear stress last and generally little further information is provided.
Shear stress is that incurred whenever yeast is physically moved within a brewery,either by its own accord, e.g. by the action of a convection current within a fermenter,or by artificial means, e.g. pumping, agitation or centrifugation. Clearly, an essentialpart of any modern yeast handling circuit is the need to move the yeast physically fromone fermenter, through a handling circuit, to the next fermenter to be pitched (Fig. 4.1).The response of brewing yeast to such physical handling has been investigated by arelatively small number of researchers and these will be reviewed later in this paper.However, for the engineering designer who is interested in designing handling equip-ment, it is extremely difficult to utilise such experimental data, principally because ofthe lack of accompanying data on the intensity of the handling conditions, i.e. thestimuli, which induced the cell response. Without such data the designer is faced withthe option of using engineering commonsense and developing and applying a heuris-tic approach to sizing and specifying operating conditions. Examples of these arespecifications involve agitator tip speeds, pump rotational speeds2 and line velocities.3
An opportunity exists to gain considerable insight into the nature of cellular shearstress, or more particularly the stimuli, by embracing the more general field of bio-engineering, with the often synchronous need to preserve cellular integrity during
Brewing Yeast Fermentation Performance: Second edition
Edited by: KATHERINE SMART Copyright 0 Blackwell Science 2003
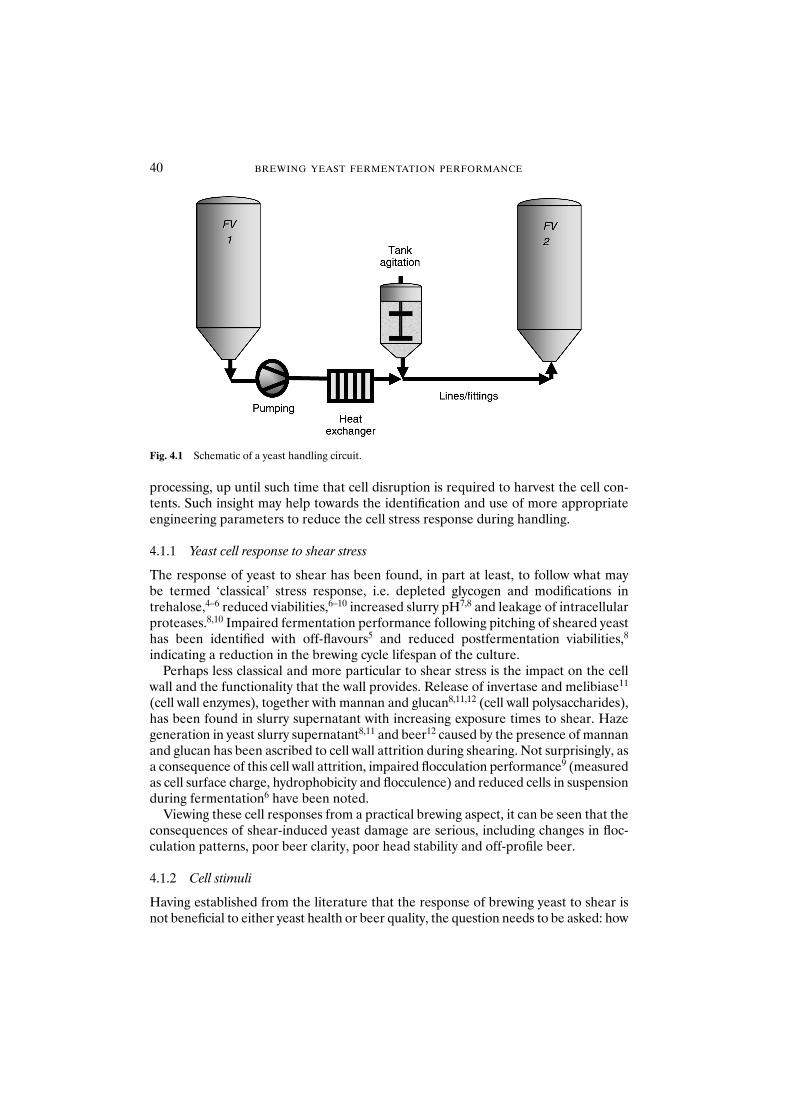
processing, up until such time that cell disruption is required to harvest the cell con-tents. Such insight may help towards the identification and use of more appropriateengineering parameters to reduce the cell stress response during handling.
4.1.1 Yeast cell response to shear stress
The response of yeast to shear has been found, in part at least, to follow what may be termed ‘classical’ stress response, i.e. depleted glycogen and modifications in trehalose,4–6 reduced viabilities,6–10 increased slurry pH7,8 and leakage of intracellularproteases.8,10 Impaired fermentation performance following pitching of sheared yeasthas been identified with off-flavours5 and reduced postfermentation viabilities,8
indicating a reduction in the brewing cycle lifespan of the culture.Perhaps less classical and more particular to shear stress is the impact on the cell
wall and the functionality that the wall provides. Release of invertase and melibiase11
(cell wall enzymes), together with mannan and glucan8,11,12 (cell wall polysaccharides),has been found in slurry supernatant with increasing exposure times to shear. Hazegeneration in yeast slurry supernatant8,11 and beer12 caused by the presence of mannanand glucan has been ascribed to cell wall attrition during shearing. Not surprisingly, asa consequence of this cell wall attrition, impaired flocculation performance9 (measuredas cell surface charge, hydrophobicity and flocculence) and reduced cells in suspensionduring fermentation6 have been noted.
Viewing these cell responses from a practical brewing aspect, it can be seen that theconsequences of shear-induced yeast damage are serious, including changes in floc-culation patterns, poor beer clarity, poor head stability and off-profile beer.
4.1.2 Cell stimuli
Having established from the literature that the response of brewing yeast to shear isnot beneficial to either yeast health or beer quality, the question needs to be asked: how
40 BREWING YEAST FERMENTATION PERFORMANCE
Fig. 4.1 Schematic of a yeast handling circuit.
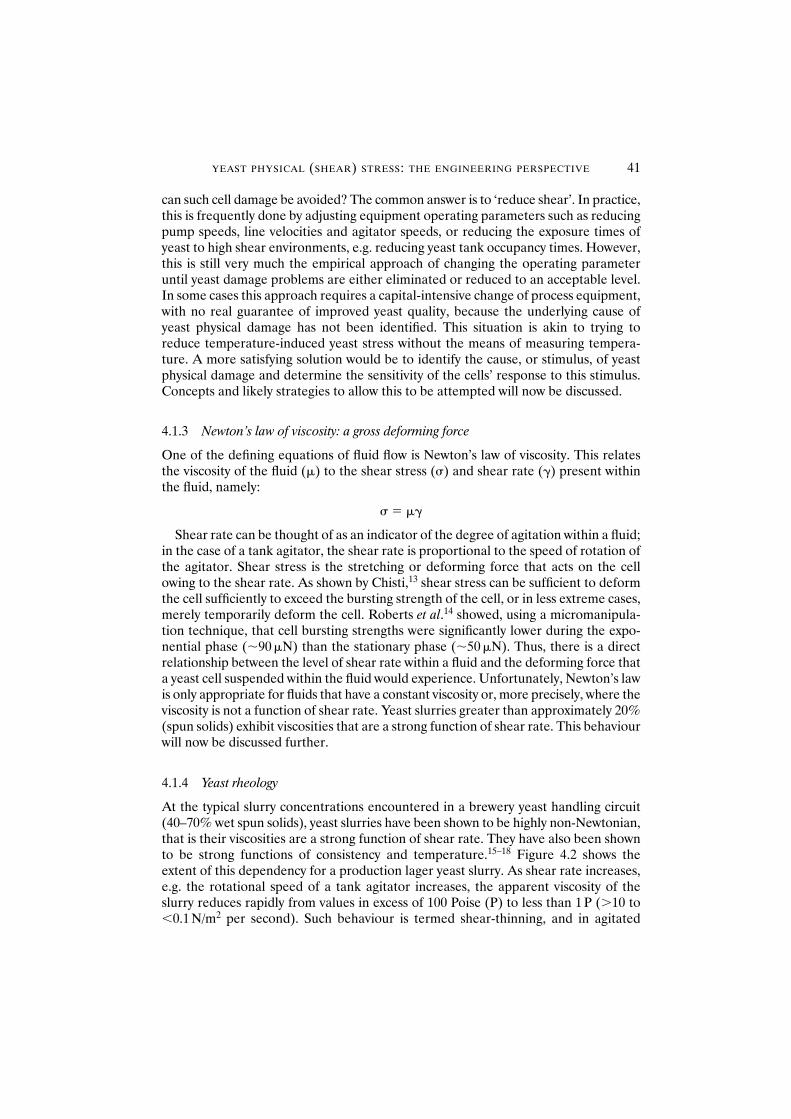
can such cell damage be avoided? The common answer is to ‘reduce shear’. In practice,this is frequently done by adjusting equipment operating parameters such as reducingpump speeds, line velocities and agitator speeds, or reducing the exposure times ofyeast to high shear environments, e.g. reducing yeast tank occupancy times. However,this is still very much the empirical approach of changing the operating parameteruntil yeast damage problems are either eliminated or reduced to an acceptable level.In some cases this approach requires a capital-intensive change of process equipment,with no real guarantee of improved yeast quality, because the underlying cause ofyeast physical damage has not been identified. This situation is akin to trying toreduce temperature-induced yeast stress without the means of measuring tempera-ture. A more satisfying solution would be to identify the cause, or stimulus, of yeastphysical damage and determine the sensitivity of the cells’ response to this stimulus.Concepts and likely strategies to allow this to be attempted will now be discussed.
4.1.3 Newton’s law of viscosity: a gross deforming force
One of the defining equations of fluid flow is Newton’s law of viscosity. This relatesthe viscosity of the fluid (�) to the shear stress () and shear rate () present withinthe fluid, namely:
� �
Shear rate can be thought of as an indicator of the degree of agitation within a fluid;in the case of a tank agitator, the shear rate is proportional to the speed of rotation ofthe agitator. Shear stress is the stretching or deforming force that acts on the cellowing to the shear rate. As shown by Chisti,13 shear stress can be sufficient to deformthe cell sufficiently to exceed the bursting strength of the cell, or in less extreme cases,merely temporarily deform the cell. Roberts et al.14 showed, using a micromanipula-tion technique, that cell bursting strengths were significantly lower during the expo-nential phase (�90 �N) than the stationary phase (�50 �N). Thus, there is a directrelationship between the level of shear rate within a fluid and the deforming force thata yeast cell suspended within the fluid would experience. Unfortunately, Newton’s lawis only appropriate for fluids that have a constant viscosity or, more precisely, where theviscosity is not a function of shear rate. Yeast slurries greater than approximately 20%(spun solids) exhibit viscosities that are a strong function of shear rate. This behaviourwill now be discussed further.
4.1.4 Yeast rheology
At the typical slurry concentrations encountered in a brewery yeast handling circuit(40–70% wet spun solids), yeast slurries have been shown to be highly non-Newtonian,that is their viscosities are a strong function of shear rate. They have also been shownto be strong functions of consistency and temperature.15–18 Figure 4.2 shows theextent of this dependency for a production lager yeast slurry. As shear rate increases,e.g. the rotational speed of a tank agitator increases, the apparent viscosity of theslurry reduces rapidly from values in excess of 100 Poise (P) to less than 1 P (�10 to�0.1 N/m2 per second). Such behaviour is termed shear-thinning, and in agitated
YEAST PHYSICAL (SHEAR) STRESS: THE ENGINEERING PERSPECTIVE 41
vessels it accounts for the generally poor mixing performance of conventional yeastagitators.19 Localised high shear regions near the impeller produces low viscosities,which aid mixing. However, in the bulk of the tank, away from the impeller, the shearrates are lower, resulting in a higher viscosity which produces poorer mixing. Not onlydoes this behaviour produce poor mixing, but it results in a split population of cells,which have quite different exposure cycles to high shear conditions.
Clearly, specification of a single value of viscosity applicable throughout an entire yeasthandling circuit is inappropriate. However, no generic yeast rheology data exist as cellstrain, flocculation behaviour, slurry pH20,21 and cell size all influence rheological behav-iour; hence, in practice, such arbitrary use of a single viscosity value is commonplace.
4.1.5 Methods of estimating shear rate of agitated systems
Perhaps the most common implicit indicator of shear rate is the concept of agitatortip speed ut. This is calculated by:
ut � Nda
where N is the agitator rotational speed (revolutions/s) and da is the agitator diameter.In practice, modern yeast tank agitators commonly run with tip speeds between 2 and3 m/s, with the rotational speed being adjusted for the agitator diameter. The use of tipspeed as an indicator of shear rate is also found in industrial bioreactors, where 5.5 m/sis a typical figure across several scales of reactors.22 This approach is a simple one toapply and for agitators of approximately the same size it has a sound basis. However,if substantial variations in agitator diameter are considered, then its use is contradictedby the Otto–Metzner correlation.23 This relates the agitator rotational speed to themean shear rate (–) around the agitator by an empirical constant (k),
– � kN
Hence, if a constant tip speed condition is applied, then agitators of smallerdiameter produce higher values of average shear rate, which may stimulate a greaterstress response from yeast cells.
42 BREWING YEAST FERMENTATION PERFORMANCE
0.1
1
10
100
1000
0 50 100 150 200 250 300 350 400 450 500
Shear rate (/s)
App
aren
t vis
cosi
ty (
Poi
se)
Fig. 4.2 Variation in apparent viscosity with shear rate for a production lager yeast slurry of approximately 50% (spun wet solids), showing prominent shear-thinning behaviour.
4.1.6 Energy dissipation rate
As stated earlier, an important aspect of yeast handling is the need to move yeast phys-ically around the brewery. This is done using pumps, agitators, etc., which transferenergy into the yeast slurry which may ultimately be dissipated into the yeast cells withpotentially damaging effects. Quantification of energy dissipation could be used to describe the damage potential of a process. In the case of an agitator, for example,the energy delivered can be easily measured, or estimated using the power numberconcept;24 however, the difficulty is assessing what volume (or mass) of yeast thisenergy is dissipated within. The most obvious volume to use is the volume of yeastcontained within an agitated yeast tank, but this assumes homogeneous energy dissi-pation. This is far from the case in practice, with energy dissipation rates measured inclose proximity to the agitator being up to 15 times the mean value dissipated in theentire tank volume.25
4.1.7 Kolmogorov turbulence scale
As stated above, any form of fluid movement will ultimately dissipate energy intoyeast cells that are present within the fluid. The mechanism for energy transfer fromfluid to cell is that of eddy dissipation, where energy within the fluid is considered tobe transmitted from successive eddies, reducing in size, until viscosity ultimatelydissipates the energy as heat (viscous dissipation). Eddies (or vortices) are rotationalturbulent structures present within fluids, the size of which can be characterised bythe Kolmogorov length scale of turbulence �:
where � is the kinematic viscosity and ε is the energy dissipation rate per unit mass. It is generally believed that for eddy dissipation to be detrimental to cells, � must besmaller than the physical size of the cells. If the eddy is larger, i.e. � � cell size, thenthe cell will be entrained into the eddy and will change its orientation to reduce theshear forces acting upon it. Alternatively, if � � cell size, then the eddy has insuffi-cient energy to entrain the cell and instead locally dissipates its kinetic energy, as heat,at the cell wall.
This indicator of cell damage potential is complicated by the difficulty in estimatingappropriate values of viscosity for a non-Newtonian system together with an energydissipation rate for such an inhomogeneous system as found within a yeast tank.Furthermore, from the previous discussion of cell deformation due to the action ofshear stress, entrainment in an eddy, i.e. � � cell size, may be sufficient to deform thecell temporarily, which could induce a cell stress response.
4.1.8 Residence/exposure time
One solution to reducing the potential of a process to damage yeast is to reduce theresidence or exposure time of the yeast to that process. Hence, in yeast tanks, for
� ��3
0 25
ε
.
YEAST PHYSICAL (SHEAR) STRESS: THE ENGINEERING PERSPECTIVE 43
instance, either occupancy time within the tank could be reduced, or intermittentagitation could be used to reduce the effective contact time. In the case of green beer centrifuges, reduced flow rates, which produce longer yeast retention timesbetween desludgings, have been found to produce increased beer haze attributed tocell wall attrition.12
A further complication of considering residence time is illustrated by the case ofpipe transfer under laminar or turbulent conditions. In general, turbulent flow con-ditions would be considered to be more energetic and hence stressful to yeast.However, Robinson26 showed that laminar transfers induced a greater response inyeast than turbulent ones (as measured by increased protease release and reducedfermentation rates). This behaviour was attributed to the interaction between the res-idence time of the near-wall regions (where the shear stresses are higher) and theaverage velocity in these regions (lower in the case of laminar than turbulent). Hence,although the near-wall region is more intense in turbulent flow, the residence time inthis region is significantly shorter, suggesting that a minimum contact time is requiredto produce a cellular response.
4.2 Conclusions
The response of brewing yeast to hydrodynamic shear stress has been shown to bedeleterious to both yeast health and function, and beer quality. Despite this, themajority of brewing research literature has focused on the response of the cell to shear stress, and the nature and quantification of the shear stress (the stimuli) have been largely ignored. Several concepts have been introduced from the biochemicalengineering field, which may offer the opportunity to resolve this. Some of thedifficulties associated with the potential use of these concepts have been discussedand it has been proposed that the principal barrier to their incorporation is the lack of understanding of yeast slurry rheology. Studies to date have shown that yeastrheology is complex and strongly multifactorial, which may make its determinationfor process design or optimisation prohibitively time-consuming or expensive.
Acknowledgements
The Directors of The South African Breweries are thanked for permission to publishthis work. Thomas Stoupis, ICBD, Heriot-Watt University, UK, is thanked for lengthydiscussions on this topic and Professor Graham Stewart, ICBD, is thanked for initiat-ing the author’s interest in this area.
References
1. Walker, G.M. (1998) Yeast Physiology and Biotechnology. John Wiley and Sons, London.2. Jespen, E. (2000) APV, Denmark. Personal communication.3. Ball, A. (1994) Brewery yeast routing principles. Brewer February, 53–56.
44 BREWING YEAST FERMENTATION PERFORMANCE
4. Sall, C.J., Seipp, J.F. and Pringle, A.T. (1988) Changes in brewer’s yeast during storage and the effectof these changes on subsequent fermentation performance. J. Am. Soc. Brew. Chem. 46, 23–25.
5. Pickerell, A.T.W., Hwang, A. and Axcell, B.C. (1991) Impact of yeast-handling procedures on beerflavour development during fermentation. J. Am. Soc. Brew. Chem. 49, 87–92.
6. McCaig, R. and Bendiak, D.S. (1985) Yeast handling studies. I. Agitation of stored pitching yeast. J. Am. Soc. Brew. Chem. 43, 114–118.
7. Kawamura, K., Makotot, M., Jimbo, E. and Okamato, Y. (1999) The development and successful operation of a sanitary yeast tank with a stirrer capable of uniform mixing without damage to the yeast.Proc. Eur. Brew. Cong. 83, 719–726.
8. Stafford, R.A., Barnes, Z.C. and Stoupis, T. (2001) A comparison of traditional and novel yeast-tankagitator systems. Proc. 8th Conv. Inst. Guild Brew. Africa Sect., Sun City, pp. 150–156.
9. Harrison, S.T.L. and Robinson, A. (2001) Disk stack centrifugation for the recovery of brewers’ yeast:its effect on yeast cell surface, flocculation and fermentation performance. Proc. 8th Conv. Inst. GuildBrew. Africa Sect., Sun City, pp. 157–164.
10. Harrison, S.T.L., Basson, L., Robinson, A. et al. (1997) Mechanical handling of brewer’s yeast duringcropping and its effect on yeast quality. Proc. 6th Conv. Inst. Brew. Central and Southern Africa Sect.,Durban, pp. 55–60.
11. Lewis, M.J. and Poerwantaro, W.M. (1991) Release of haze material from the cell walls of agitatedyeast. J. Am. Soc. Brew. Chem. 49, 43–46.
12. Siebert, K.J., Stenroos, L.E., Reid, D.S. and Grabowski, D. (1987) Filtration difficulties resulting fromdamage to yeast during centrifugation. Tech. Q. Master Brew. Assoc. Am. 24, 1–8.
13. Chisti, Y. (2001) Hydrodynamic damage to animal cells. Crit. Rev. Biotechnol. 21, 67–110.14. Roberts, A.D., Zhang, Z., Young, T.W. and Thomas, C.R. (1994) Direct determination of the strength
of brewing yeast cells using micromanipulation. Proc. 1994 Inst. Chem. Eng. Res. Symp. pp. 73–75.15. Reuß, M., Josic , D., Popovic , M. and Bronn, W.K. (1979) Viscosity of yeast suspensions. Eur. J. Appl.
Microbiol. 8, 167–175.16. Aiba, S., Kitai, S. and Ishida, N. (1962) Density of yeast cell and viscosity of its suspension. J. Gen. Appl.
Microbiol. 8, 103–108.17. Fatile, I.A. (1985) Rheological behaviour of concentrated yeast suspensions. J. Chem. Technol.
Biotechnol. 35B, 94–100.18. Lenoël, M., Meunier, J-P., Moll, M. and Midoux, N. (1987) Improved system for stabilising yeast fer-
menting power during storage. Proc. Eur. Brew. Cong. 43, 425–432.19. McCabe, W.L., Smith, J.C. and Harriott, P. (1985) Unit Operations of Chemical Engineering, 4th edn.
McGraw-Hill, New York, p. 229.20. Wheacroft, R., Lentini, A., Tai, L. et al. (1993) Critical control points analysis for optimising yeast hand-
ling. Proc. 4th Conv. Inst. Brew. Central and Southern Africa Sect. pp. 153–160.21. El-Temtamy, S., Farahat, L., Nour el-din, A. and Gaber, A. (1982) Non-Newtonian behaviour of yeast
suspensions. Eur. J. Appl. Microbiol. Technol. 15, 156–160.22. Einsele, A. (1978) Scaling-up biorectors. Process Biochem. July, 13–14.23. Metzner, A.B., Feehs, R.H., Ramos, H.L. et al. (1961) Agitation of viscous Newtonian and non-
Newtonian fluids. J. Am. Inst. Chem. Eng. 7, 3–9.24. Cliffe, K. (1988) Bioreactors. In: Biotechnology for Engineers (Biological Systems in Technological
Processes), Spragg, A. (ed.). Ellis Horwood, pp. 277–301.25. Baldyga, J. and Bourne, J.R. (1988) Calculation of micromixing in inhomogeneous stirred tank reac-
tors. Chem. Eng. Res. Dev. 66, 33–38.26. Robinson, A. (2001) Mechanical handling effects on brewers’ yeast. PhD Thesis, University of Cape
Town, South Africa.
YEAST PHYSICAL (SHEAR) STRESS: THE ENGINEERING PERSPECTIVE 45
5 The Osmotic Stress Response of Ale and Lager BrewingYeast Strains
P.A. WHITE, A.I. KENNEDY and K.A. SMART
Abstract Brewing yeast is subjected to biological, chemical and physical stress during fer-mentation and yeast handling. It has been recognised that the transfer of yeast from slurrystorage to pitching environments represents a potential source of osmotic stress, exacer-bated by the use of high-gravity worts. One general mechanism used as a response tohypertonic conditions is the accumulation of compatible solutes. Compatible solutes canbe defined as being those osmolytes that may be accumulated by the cell to increaseinternal osmolarity, and thus increase the retrieval of water from the environment, with-out affecting the biochemical or physical processes in the cell.
In the brewing context, the accumulation of compatible solutes occurs on inoculation ofyeast biomass into the wort. The relative concentration of these osmolytes may thereforeindicate brewing yeast stress and subsequently capacity to ferment. This paper addressesthe problematic area of determining a possible biomarker of osmotic stress, by examiningthe potential role of glycerol, a molecule implicated in the osmotic stress response. Glycerolaccumulation during osmotic stress is dependent on strain, physiological state of the popu-lation and the solute used to elicit the osmotic stress response. The physiological responsesto osmotic stress are discussed in terms of viability (as determined by transmembranepotential and intracellular reducing power) and vacuolar changes.
5.1 Introduction
It is generally accepted that the physiological state of the yeast directly influences fer-mentation performance and resulting beer quality. The requirement of the brewingindustry to obtain information concerning the quality of brewing yeast has been thedriving force for research concerning brewing yeast stress responses.1 To date, the influ-ence of osmotic stress on yeast quality and subsequent fermentation performance hasreceived relatively little attention, although it is an important consideration whereveracid washing and pitching into high- and very high-gravity worts is practised.2–4
Although both hypotonic (where the osmolarity of intracellular fluids is higher thanthe external medium) and hypertonic (the converse) transitions occur within the brew-ing process, the former stress predominates. Indeed, there is a positive correlationbetween the degree of hypertonic stress imposed during pitching and the gravity of thewort used. High- and very high-gravity brewing therefore imparts two forms of stresson brewing yeast,3 albeit at different stages of fermentation, in the form of osmoticstress and ethanol toxicity.
Several strategies may be used to combat cellular exposure to hyperosmotic stress(Fig. 5.1). Where the stress imposed is limited by either duration or magnitude, theinitial response will involve osmotolerance; in some cases this will involve the accu-mulation of osmoprotectant molecules. These molecules stabilise cellular compon-ents such as membranes, enzymes, other proteins and possibly nucleic acids, with little
Brewing Yeast Fermentation Performance: Second edition
Edited by: KATHERINE SMART Copyright 0 Blackwell Science 2003
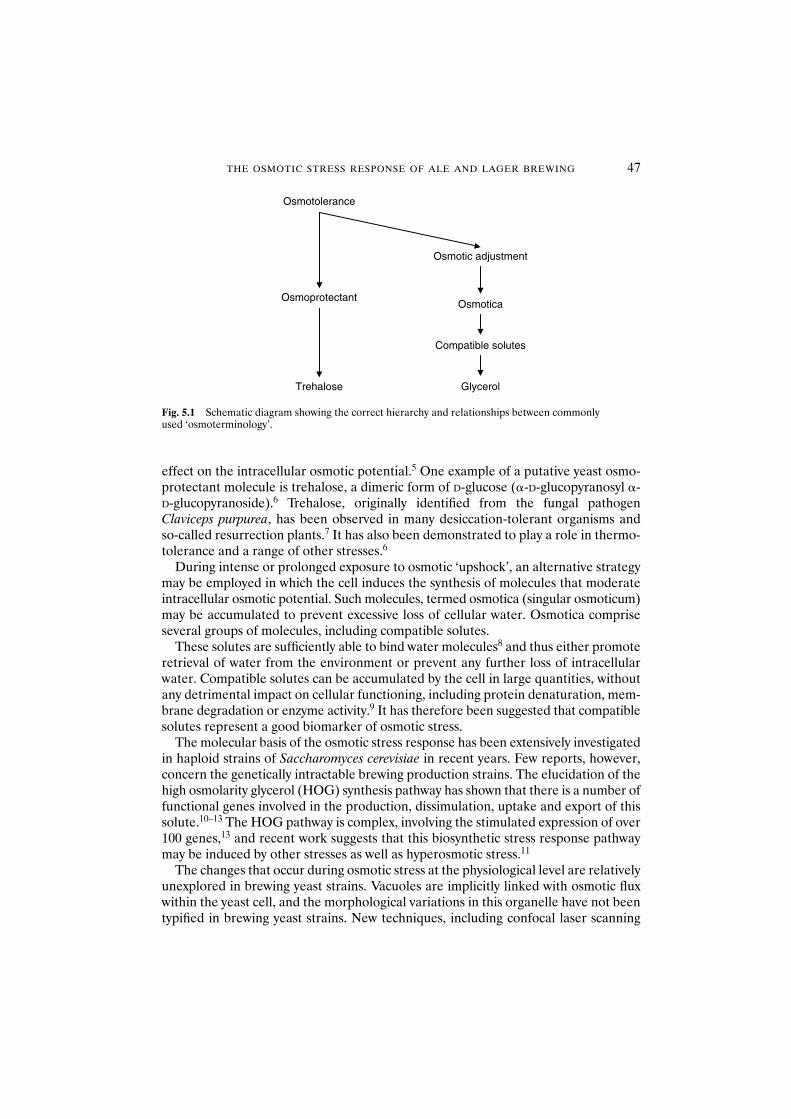
THE OSMOTIC STRESS RESPONSE OF ALE AND LAGER BREWING 47
effect on the intracellular osmotic potential.5 One example of a putative yeast osmo-protectant molecule is trehalose, a dimeric form of D-glucose (�-D-glucopyranosyl �-D-glucopyranoside).6 Trehalose, originally identified from the fungal pathogenClaviceps purpurea, has been observed in many desiccation-tolerant organisms and so-called resurrection plants.7 It has also been demonstrated to play a role in thermo-tolerance and a range of other stresses.6
During intense or prolonged exposure to osmotic ‘upshock’, an alternative strategymay be employed in which the cell induces the synthesis of molecules that moderateintracellular osmotic potential. Such molecules, termed osmotica (singular osmoticum)may be accumulated to prevent excessive loss of cellular water. Osmotica compriseseveral groups of molecules, including compatible solutes.
These solutes are sufficiently able to bind water molecules8 and thus either promoteretrieval of water from the environment or prevent any further loss of intracellularwater. Compatible solutes can be accumulated by the cell in large quantities, withoutany detrimental impact on cellular functioning, including protein denaturation, mem-brane degradation or enzyme activity.9 It has therefore been suggested that compatiblesolutes represent a good biomarker of osmotic stress.
The molecular basis of the osmotic stress response has been extensively investigatedin haploid strains of Saccharomyces cerevisiae in recent years. Few reports, however,concern the genetically intractable brewing production strains. The elucidation of thehigh osmolarity glycerol (HOG) synthesis pathway has shown that there is a number offunctional genes involved in the production, dissimulation, uptake and export of thissolute.10–13 The HOG pathway is complex, involving the stimulated expression of over100 genes,13 and recent work suggests that this biosynthetic stress response pathwaymay be induced by other stresses as well as hyperosmotic stress.11
The changes that occur during osmotic stress at the physiological level are relativelyunexplored in brewing yeast strains. Vacuoles are implicitly linked with osmotic fluxwithin the yeast cell, and the morphological variations in this organelle have not beentypified in brewing yeast strains. New techniques, including confocal laser scanning
Osmotolerance
Osmotic adjustment
Osmotica
Compatible solutes
Glycerol
Trehalose
Osmoprotectant
Fig. 5.1 Schematic diagram showing the correct hierarchy and relationships between commonly used ‘osmoterminology’.
48 BREWING YEAST FERMENTATION PERFORMANCE
microscopy, and newly developed fluorochromes specific for the vacuolar lumen andtonoplast, allow visualisation of changes to this organelle during osmotic stress.
5.2 Materials and methods
5.2.1 Yeast strains
Four production strains of lager brewing yeast (designated SCB1–4) and three pro-duction strains of ale brewing yeast (designated SCB5–8) were obtained from ScottishCourage Brewing Ltd (Edinburgh, UK).
5.2.2 Media and growth conditions
Strains were stored on beads at �80°C in YPD containing 20% (w/v) glycerol. Stockcultures were maintained and grown on YPD medium (1% w/v yeast extract, 2% w/vbacteriological peptone and 2% D-glucose solidified with 1.2% w/v agar). Yeasts weregrown aerobically in 100 ml of YPD at 25°C in 250 ml Erlenmeyer flasks with constantagitation at 120 rpm in YPD medium. Cell growth was monitored using a Shimadzuspectrophotometer at 600 nm.
5.2.3 Osmotic challenge
Yeast cells were harvested at the required phase of growth and washed twice in phos-phate buffer, pH 5.9 (89.85 ml 0.1 M NaH2PO4:10.15 ml 0.1 M Na2HPO4 diluted to200 ml). Cells were resuspended in 100 ml of either sterile deionised water, sorbitol(6, 12, 18, 24 and 30% w/v) or NaCl (6, 12, 18, 24 and 30% w/v) to 1 � 106 cells/ml, andincubated on an orbital shaker at 25°C and 120 rpm for 48 h.
5.2.4 Viability determinations
Aliquots of cell suspensions (each 1 ml) were washed and resuspended in single-strength phosphate-buffered saline (PBS) (NaCl 7.650 g/dm3, Na2HPO4 0.724 g/dm3,KH2PO4 0.210 g/dm3, adjusted to pH 7.4 with 1 M NaOH). The bright-field dye citratemethylene violet14 and the fluorescent dyes hemi-MgANS15 and propidium iodide16
were used to distinguish between viable and non-viable cells. One-hundred cells wereenumerated for each replicate. Three replicates per sample were analysed.
5.2.5 Glycerol determination
Triplicate cell suspension (1 � 109 cells total number) were washed twice in phos-phate buffer, pH 5.9, and resuspended in 1 ml boiling Tris–HCl, pH 7.0 [50 ml 0.5 MTris(hydroxymethyl) aminomethane:46.8 ml 0.5 M HCl diluted to a total of 200 ml], andboiled for 10 min. The lysed cells were centrifuged at 4000 rpm for 10 min to removecellular debris, and the supernatant was assayed for glycerol enzymically usingBoehringer-Mannheim kit no. E0148 270, according to the method of Hounsa et al.17
THE OSMOTIC STRESS RESPONSE OF ALE AND LAGER BREWING 49
5.2.6 Preparation of cells for confocal microscopic analysis
5.2.6.1 Staining of vacuole lumen. Cells were washed twice in phosphate buffer, pH5.9, and stained using the procedures outlined in Table 5.1.
5.2.6.2 Staining of tonoplast. Cells were washed twice in phosphate buffer, pH 5.9, andresuspended in 10 mM HEPES buffer, pH 7.4 (2-hydroxyethylpiperazine-N�-2-ethanesulfonic acid), 5% glucose to 1 � 106 cells/ml. The tonoplast marker MDY-64(Molecular Probes, The Netherlands) was added to a final concentration of 10 mMand incubated at room temperature for 10 min before analysis using fluorescencemicroscopy.
5.2.6.3 Staining of plasma membrane. Cells were washed twice in phosphate buffer,pH 5.9, and resuspended in 10 mM HEPES buffer, pH 7.4, 5% glucose to 1 � 106
cells/ml. The membrane marker Cell-Tracker™ blue CMAC (Molecular Probes, TheNetherlands) was added to a final concentration of 10 mM and incubated at roomtemperature for 10 min before analysis using fluorescence microscopy.
5.2.6.4 Visualisation of samples. Cells were immobilised on microscope slides in 2%low gelling temperature (LGT) agarose and examined using a Zeiss® 510 confocallaser scanning microscope. Fluorochromes were excited using three laser lines, Argonat 488 nm and two helium/neon lines at 543 and 633 nm, respectively. Detection offluorescence was achieved using a �63 plan neofluor objective and the appropriatefilter sets.
5.3 Results and discussion
5.3.1 Osmotic stress tolerance of YPD-grown cells
5.3.1.1 Physiological state. The response of haploid S. cerevisiae strains to stress has been demonstrated to be dependent on the physiological state of the cells,17 withstationary-phase populations showing a greater resistance to a number of stressesthan exponential-phase cells.18,19 For both lager and ale strains, cells grown to stationaryphase exhibited a greater resistance to osmotic stress than those at exponential phase,
Table 5.1 Vacuole lumen staining procedures used in this study
Dye Buffer Incubation Cell Dye final time concentration concentration
C-DCFDA 50 mM sodium citrate, 10 min (RT) 1 � 106/ml 10 mMpH 5, 2% glucose
FUN1™ 10 mM sodium HEPES, 20 min 1 � 106/ml 15 �MpH 7.2, 2% glucose (RT, in dark)
LysoTracker™ Single-strength PBS 10 min (RT) 1 � 106/ml 100 nMGreen
HEPES: N-2-hydroxyethylpiperazine-N�-2-ethanesulfonic acid; PBS: phosphate-buffered saline; RT: room temperature.
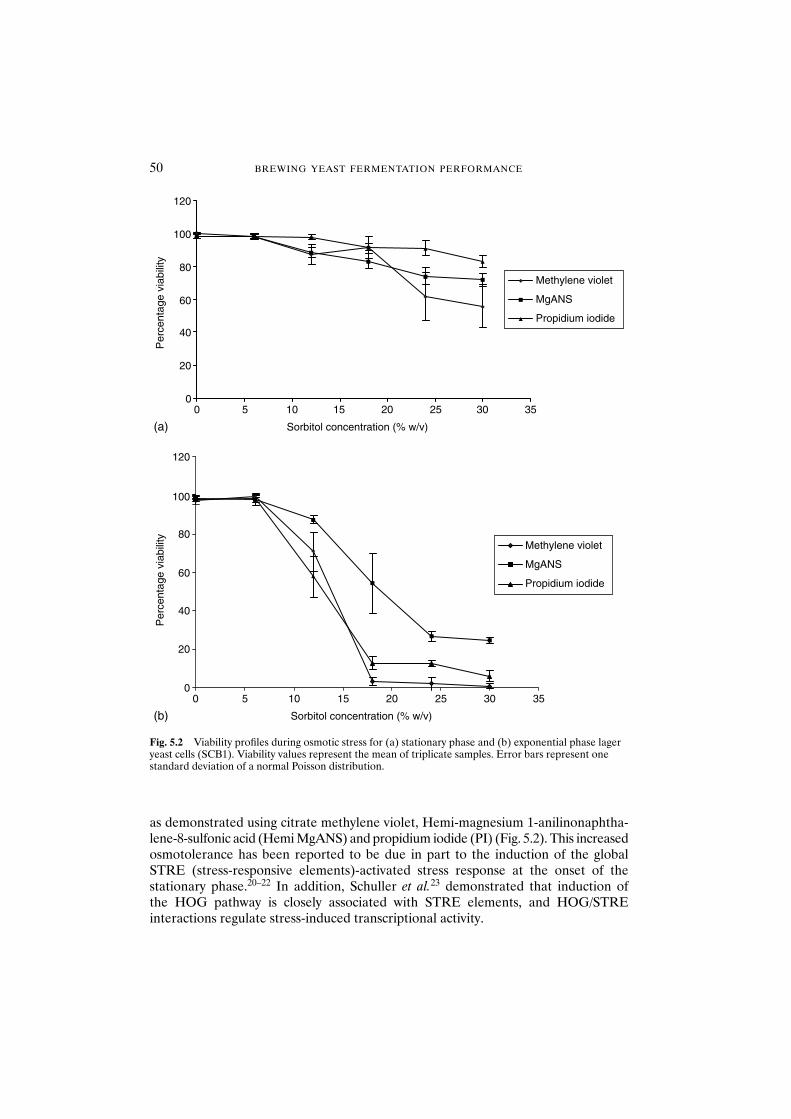
50 BREWING YEAST FERMENTATION PERFORMANCE
as demonstrated using citrate methylene violet, Hemi-magnesium 1-anilinonaphtha-lene-8-sulfonic acid (Hemi MgANS) and propidium iodide (PI) (Fig. 5.2). This increasedosmotolerance has been reported to be due in part to the induction of the globalSTRE (stress-responsive elements)-activated stress response at the onset of thestationary phase.20–22 In addition, Schuller et al.23 demonstrated that induction of the HOG pathway is closely associated with STRE elements, and HOG/STRE interactions regulate stress-induced transcriptional activity.
(a)
0
20
40
60
80
100
120
0 5 10 15 20 25 30 35
Sorbitol concentration (% w/v)
Per
cent
age
viab
ility
0
20
40
60
80
100
120
0 5 10 15 20 25 30 35
Sorbitol concentration (% w/v)
Per
cent
age
viab
ility
Methylene violet
MgANS
Propidium iodide
Methylene violet
MgANS
Propidium iodide
(b)
Fig. 5.2 Viability profiles during osmotic stress for (a) stationary phase and (b) exponential phase lageryeast cells (SCB1). Viability values represent the mean of triplicate samples. Error bars represent onestandard deviation of a normal Poisson distribution.
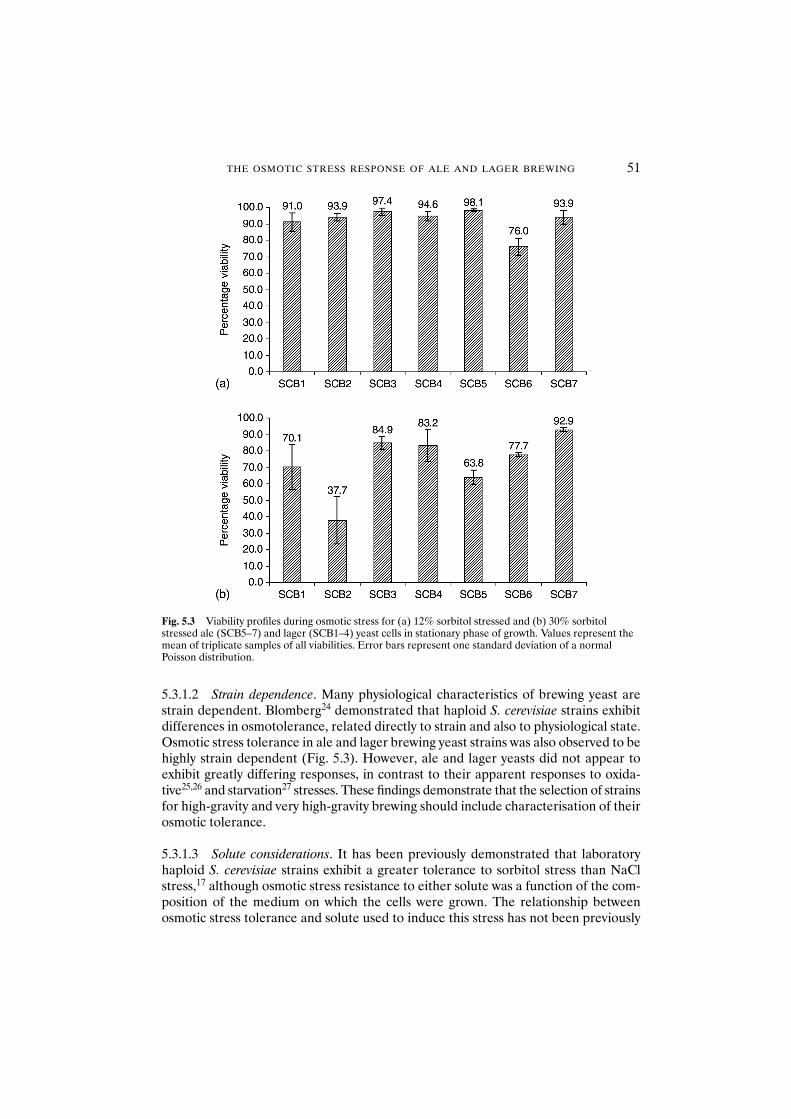
THE OSMOTIC STRESS RESPONSE OF ALE AND LAGER BREWING 51
5.3.1.2 Strain dependence. Many physiological characteristics of brewing yeast arestrain dependent. Blomberg24 demonstrated that haploid S. cerevisiae strains exhibitdifferences in osmotolerance, related directly to strain and also to physiological state.Osmotic stress tolerance in ale and lager brewing yeast strains was also observed to behighly strain dependent (Fig. 5.3). However, ale and lager yeasts did not appear toexhibit greatly differing responses, in contrast to their apparent responses to oxida-tive25,26 and starvation27 stresses. These findings demonstrate that the selection of strainsfor high-gravity and very high-gravity brewing should include characterisation of theirosmotic tolerance.
5.3.1.3 Solute considerations. It has been previously demonstrated that laboratoryhaploid S. cerevisiae strains exhibit a greater tolerance to sorbitol stress than NaClstress,17 although osmotic stress resistance to either solute was a function of the com-position of the medium on which the cells were grown. The relationship betweenosmotic stress tolerance and solute used to induce this stress has not been previously
Fig. 5.3 Viability profiles during osmotic stress for (a) 12% sorbitol stressed and (b) 30% sorbitolstressed ale (SCB5–7) and lager (SCB1–4) yeast cells in stationary phase of growth. Values represent themean of triplicate samples of all viabilities. Error bars represent one standard deviation of a normalPoisson distribution.
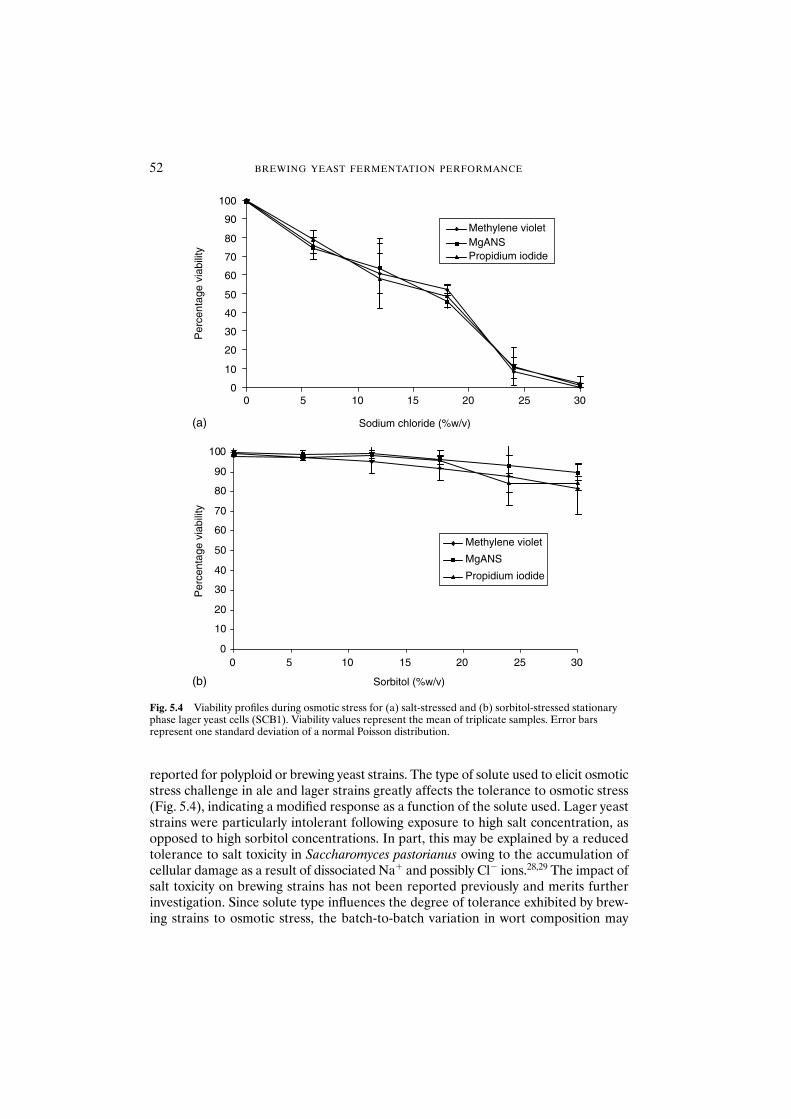
52 BREWING YEAST FERMENTATION PERFORMANCE
reported for polyploid or brewing yeast strains. The type of solute used to elicit osmoticstress challenge in ale and lager strains greatly affects the tolerance to osmotic stress(Fig. 5.4), indicating a modified response as a function of the solute used. Lager yeaststrains were particularly intolerant following exposure to high salt concentration, asopposed to high sorbitol concentrations. In part, this may be explained by a reducedtolerance to salt toxicity in Saccharomyces pastorianus owing to the accumulation ofcellular damage as a result of dissociated Na� and possibly Cl� ions.28,29 The impact ofsalt toxicity on brewing strains has not been reported previously and merits furtherinvestigation. Since solute type influences the degree of tolerance exhibited by brew-ing strains to osmotic stress, the batch-to-batch variation in wort composition may
(a)
(b)
00 5
0 5
10
20
30
40
50
60
70
80
90
100
10 15 20 25 30
Sodium chloride (%w/v)
Per
cent
age
viab
ility
Methylene violetMgANSPropidium iodide
0
10
20
30
40
50
60
70
80
90
100
10 15 20 25 30
Sorbitol (%w/v)
Per
cent
age
viab
ility
Methylene violet
MgANS
Propidium iodide
Fig. 5.4 Viability profiles during osmotic stress for (a) salt-stressed and (b) sorbitol-stressed stationaryphase lager yeast cells (SCB1). Viability values represent the mean of triplicate samples. Error barsrepresent one standard deviation of a normal Poisson distribution.
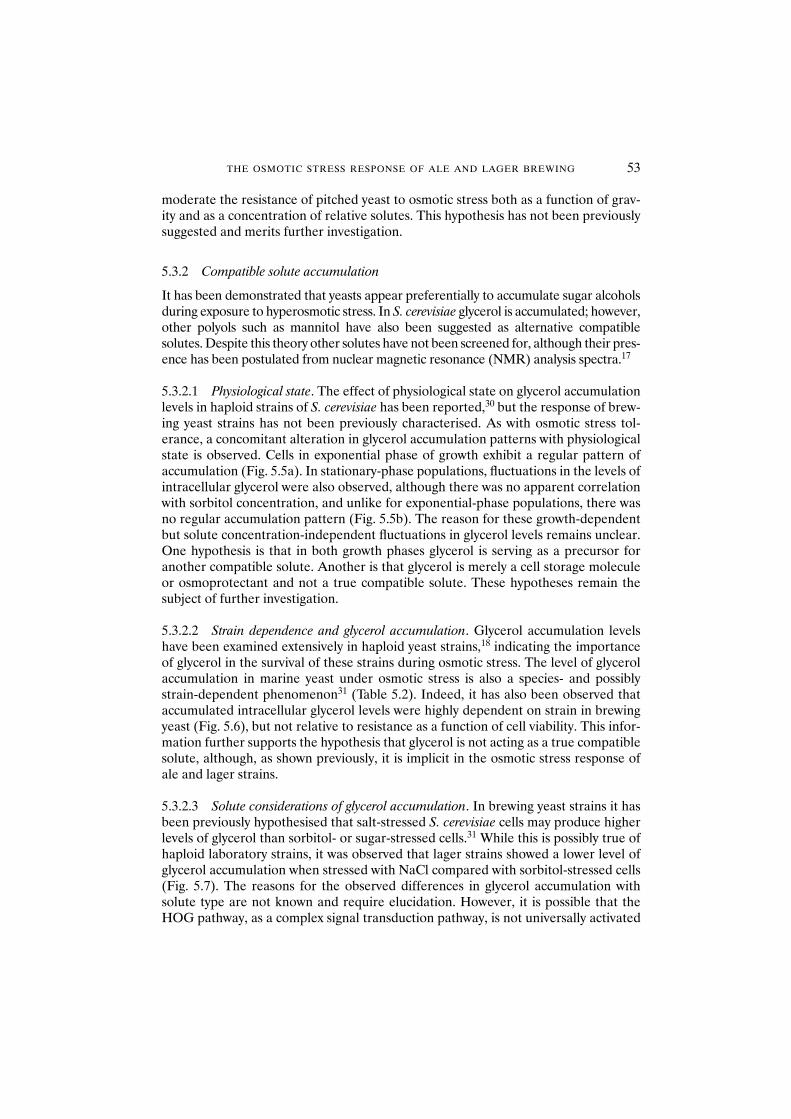
moderate the resistance of pitched yeast to osmotic stress both as a function of grav-ity and as a concentration of relative solutes. This hypothesis has not been previouslysuggested and merits further investigation.
5.3.2 Compatible solute accumulation
It has been demonstrated that yeasts appear preferentially to accumulate sugar alcoholsduring exposure to hyperosmotic stress. In S. cerevisiae glycerol is accumulated; however,other polyols such as mannitol have also been suggested as alternative compatiblesolutes. Despite this theory other solutes have not been screened for, although their pres-ence has been postulated from nuclear magnetic resonance (NMR) analysis spectra.17
5.3.2.1 Physiological state. The effect of physiological state on glycerol accumulationlevels in haploid strains of S. cerevisiae has been reported,30 but the response of brew-ing yeast strains has not been previously characterised. As with osmotic stress tol-erance, a concomitant alteration in glycerol accumulation patterns with physiologicalstate is observed. Cells in exponential phase of growth exhibit a regular pattern ofaccumulation (Fig. 5.5a). In stationary-phase populations, fluctuations in the levels ofintracellular glycerol were also observed, although there was no apparent correlationwith sorbitol concentration, and unlike for exponential-phase populations, there wasno regular accumulation pattern (Fig. 5.5b). The reason for these growth-dependentbut solute concentration-independent fluctuations in glycerol levels remains unclear.One hypothesis is that in both growth phases glycerol is serving as a precursor foranother compatible solute. Another is that glycerol is merely a cell storage moleculeor osmoprotectant and not a true compatible solute. These hypotheses remain thesubject of further investigation.
5.3.2.2 Strain dependence and glycerol accumulation. Glycerol accumulation levelshave been examined extensively in haploid yeast strains,18 indicating the importanceof glycerol in the survival of these strains during osmotic stress. The level of glycerolaccumulation in marine yeast under osmotic stress is also a species- and possiblystrain-dependent phenomenon31 (Table 5.2). Indeed, it has also been observed thataccumulated intracellular glycerol levels were highly dependent on strain in brewingyeast (Fig. 5.6), but not relative to resistance as a function of cell viability. This infor-mation further supports the hypothesis that glycerol is not acting as a true compatiblesolute, although, as shown previously, it is implicit in the osmotic stress response ofale and lager strains.
5.3.2.3 Solute considerations of glycerol accumulation. In brewing yeast strains it hasbeen previously hypothesised that salt-stressed S. cerevisiae cells may produce higherlevels of glycerol than sorbitol- or sugar-stressed cells.31 While this is possibly true ofhaploid laboratory strains, it was observed that lager strains showed a lower level ofglycerol accumulation when stressed with NaCl compared with sorbitol-stressed cells(Fig. 5.7). The reasons for the observed differences in glycerol accumulation withsolute type are not known and require elucidation. However, it is possible that theHOG pathway, as a complex signal transduction pathway, is not universally activated
THE OSMOTIC STRESS RESPONSE OF ALE AND LAGER BREWING 53
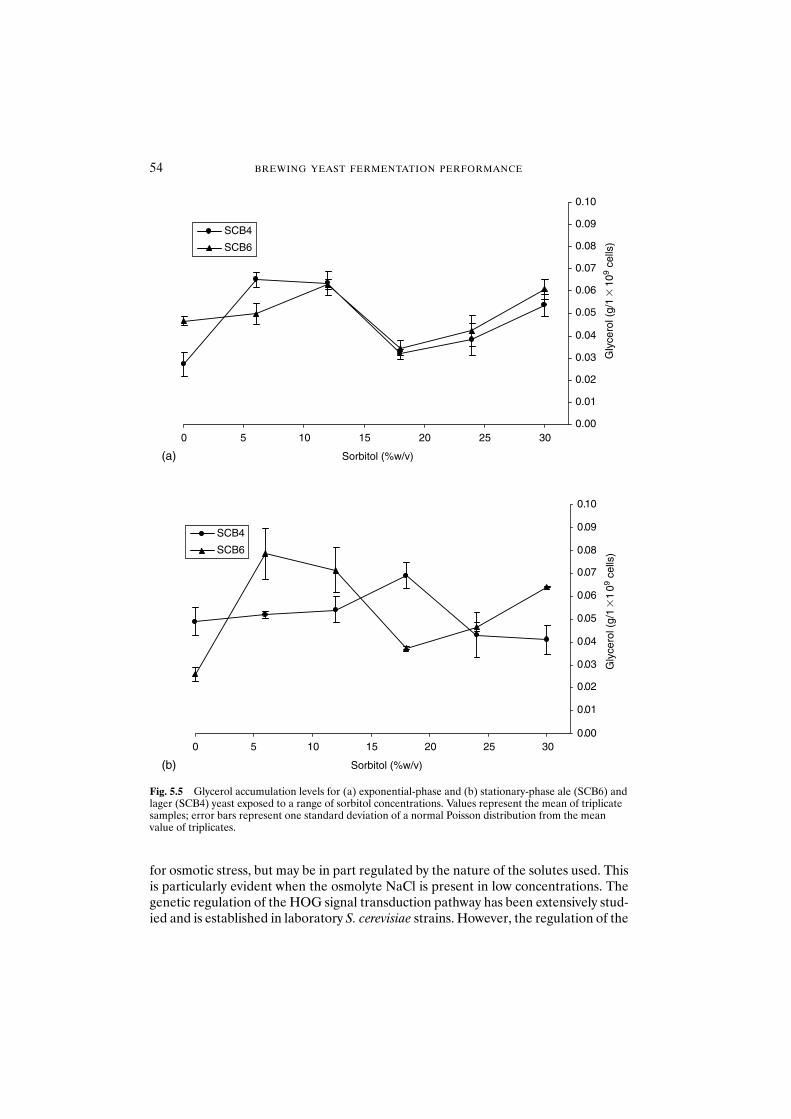
54 BREWING YEAST FERMENTATION PERFORMANCE
for osmotic stress, but may be in part regulated by the nature of the solutes used. Thisis particularly evident when the osmolyte NaCl is present in low concentrations. Thegenetic regulation of the HOG signal transduction pathway has been extensively stud-ied and is established in laboratory S. cerevisiae strains. However, the regulation of the
(a)
0.00
0.01
0.02
0.03
0.04
0.05
0.06
0.07
0.08
0.09
0.10
0 5 10 15 20 25 30
Sorbitol (%w/v)
Gly
cero
l (g/
1�
109
cells
)
SCB4
SCB6
SCB4
SCB6
(b)
0.01
0.00
0.02
0.03
0.04
0.05
0.06
0.07
0.08
0.09
0.10
0 5 10 15 20 25 30
Sorbitol (%w/v)
Gly
cero
l (g/
1�
109
cells
)
Fig. 5.5 Glycerol accumulation levels for (a) exponential-phase and (b) stationary-phase ale (SCB6) andlager (SCB4) yeast exposed to a range of sorbitol concentrations. Values represent the mean of triplicatesamples; error bars represent one standard deviation of a normal Poisson distribution from the meanvalue of triplicates.
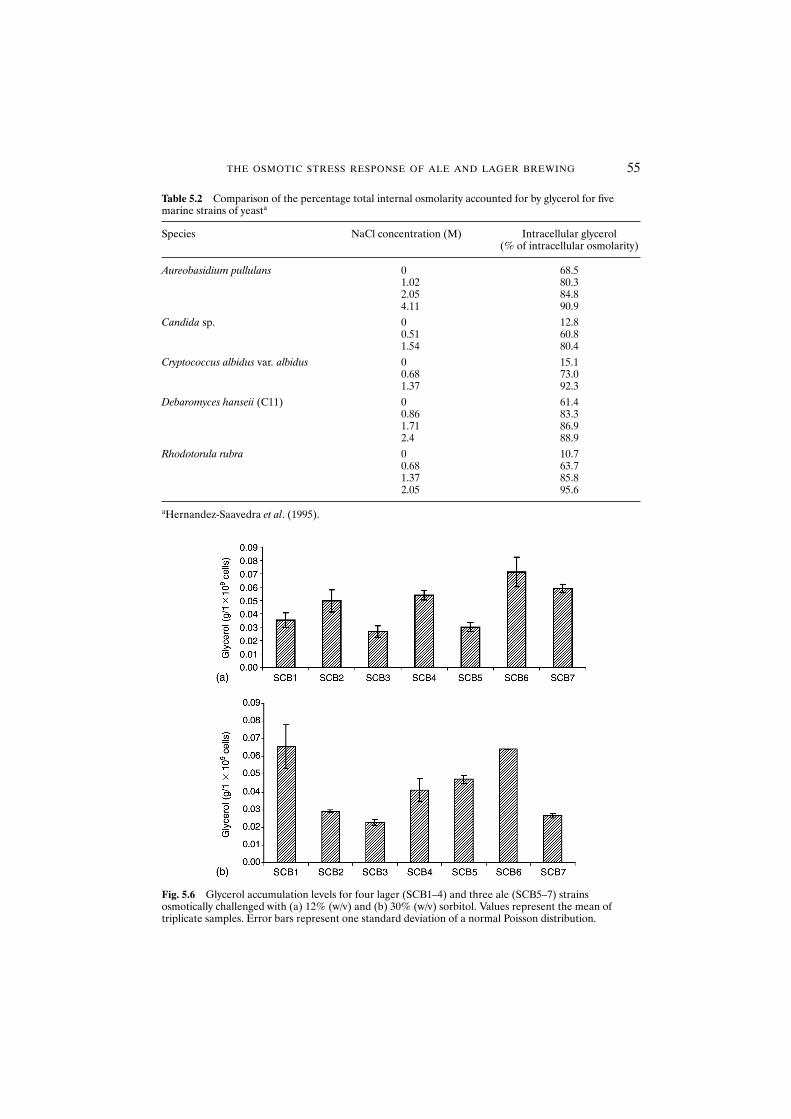
THE OSMOTIC STRESS RESPONSE OF ALE AND LAGER BREWING 55
Table 5.2 Comparison of the percentage total internal osmolarity accounted for by glycerol for fivemarine strains of yeasta
Species NaCl concentration (M) Intracellular glycerol (% of intracellular osmolarity)
Aureobasidium pullulans 0 68.51.02 80.32.05 84.84.11 90.9
Candida sp. 0 12.80.51 60.81.54 80.4
Cryptococcus albidus var. albidus 0 15.10.68 73.01.37 92.3
Debaromyces hanseii (C11) 0 61.40.86 83.31.71 86.92.4 88.9
Rhodotorula rubra 0 10.70.68 63.71.37 85.82.05 95.6
aHernandez-Saavedra et al. (1995).
Fig. 5.6 Glycerol accumulation levels for four lager (SCB1–4) and three ale (SCB5–7) strains osmotically challenged with (a) 12% (w/v) and (b) 30% (w/v) sorbitol. Values represent the mean of triplicate samples. Error bars represent one standard deviation of a normal Poisson distribution.
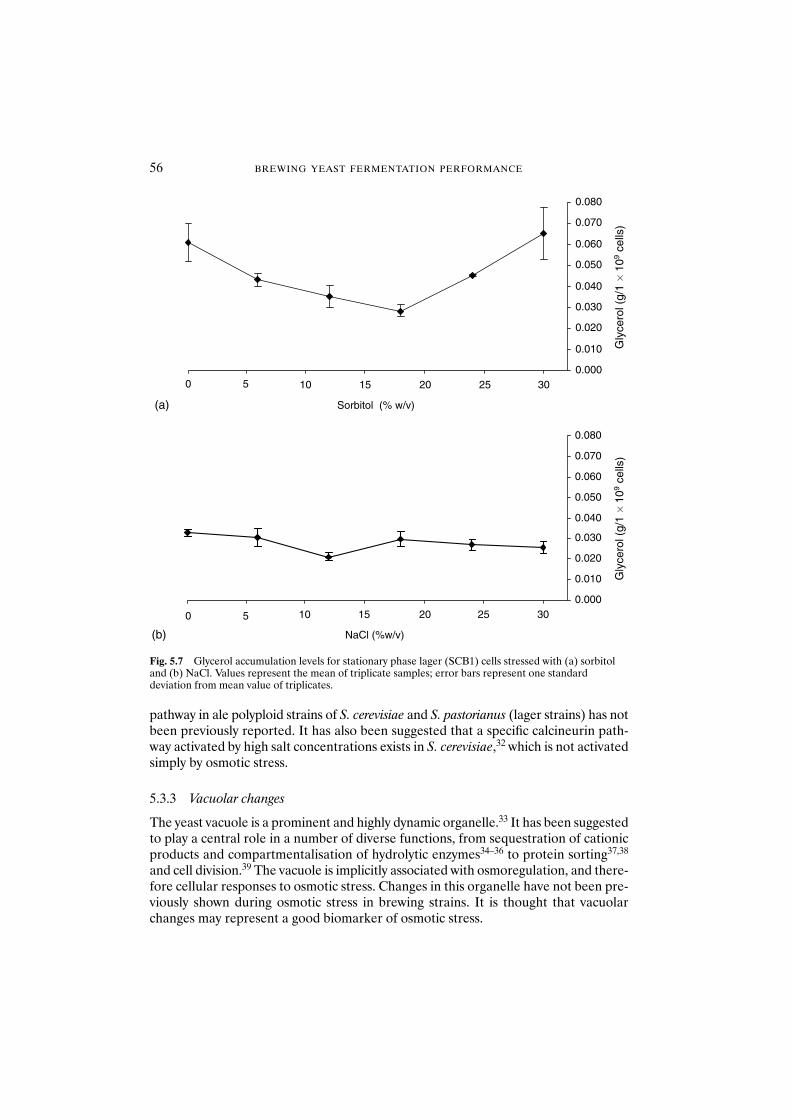
56 BREWING YEAST FERMENTATION PERFORMANCE
pathway in ale polyploid strains of S. cerevisiae and S. pastorianus (lager strains) has notbeen previously reported. It has also been suggested that a specific calcineurin path-way activated by high salt concentrations exists in S. cerevisiae,32 which is not activatedsimply by osmotic stress.
5.3.3 Vacuolar changes
The yeast vacuole is a prominent and highly dynamic organelle.33 It has been suggestedto play a central role in a number of diverse functions, from sequestration of cationicproducts and compartmentalisation of hydrolytic enzymes34–36 to protein sorting37,38
and cell division.39 The vacuole is implicitly associated with osmoregulation, and there-fore cellular responses to osmotic stress. Changes in this organelle have not been pre-viously shown during osmotic stress in brewing strains. It is thought that vacuolarchanges may represent a good biomarker of osmotic stress.
(a)
0.000
0.010
0.020
0.030
0.040
0.050
0.060
0.070
0.080
0 5
0 5
10 15 20 25 30
Sorbitol (% w/v)
Gly
cero
l (g/
1 �
109
cells
)(b)
0.000
0.010
0.020
0.030
0.040
0.050
0.060
0.070
0.080
10 15 20 25 30
NaCl (%w/v)
Gly
cero
l (g/
1 �
109
cells
)
Fig. 5.7 Glycerol accumulation levels for stationary phase lager (SCB1) cells stressed with (a) sorbitoland (b) NaCl. Values represent the mean of triplicate samples; error bars represent one standard deviation from mean value of triplicates.
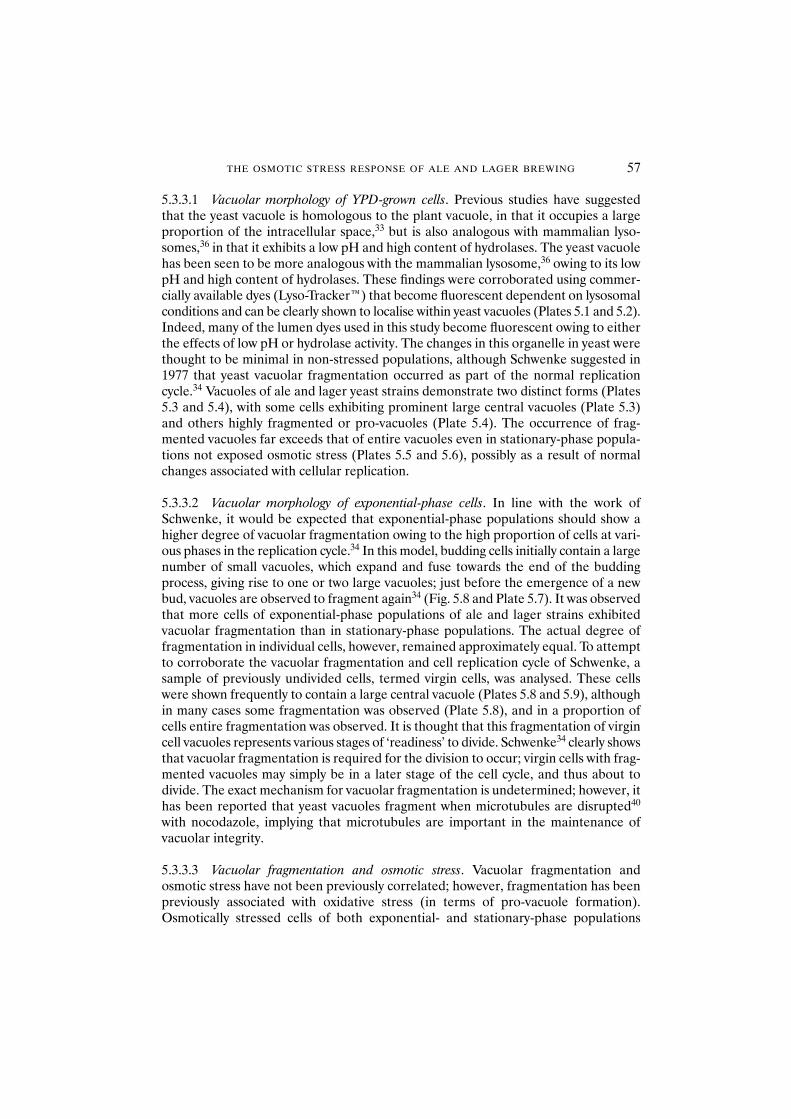
THE OSMOTIC STRESS RESPONSE OF ALE AND LAGER BREWING 57
5.3.3.1 Vacuolar morphology of YPD-grown cells. Previous studies have suggestedthat the yeast vacuole is homologous to the plant vacuole, in that it occupies a largeproportion of the intracellular space,33 but is also analogous with mammalian lyso-somes,36 in that it exhibits a low pH and high content of hydrolases. The yeast vacuolehas been seen to be more analogous with the mammalian lysosome,36 owing to its lowpH and high content of hydrolases. These findings were corroborated using commer-cially available dyes (Lyso-Tracker™) that become fluorescent dependent on lysosomalconditions and can be clearly shown to localise within yeast vacuoles (Plates 5.1 and 5.2).Indeed, many of the lumen dyes used in this study become fluorescent owing to eitherthe effects of low pH or hydrolase activity. The changes in this organelle in yeast werethought to be minimal in non-stressed populations, although Schwenke suggested in1977 that yeast vacuolar fragmentation occurred as part of the normal replicationcycle.34 Vacuoles of ale and lager yeast strains demonstrate two distinct forms (Plates5.3 and 5.4), with some cells exhibiting prominent large central vacuoles (Plate 5.3)and others highly fragmented or pro-vacuoles (Plate 5.4). The occurrence of frag-mented vacuoles far exceeds that of entire vacuoles even in stationary-phase popula-tions not exposed osmotic stress (Plates 5.5 and 5.6), possibly as a result of normalchanges associated with cellular replication.
5.3.3.2 Vacuolar morphology of exponential-phase cells. In line with the work ofSchwenke, it would be expected that exponential-phase populations should show ahigher degree of vacuolar fragmentation owing to the high proportion of cells at vari-ous phases in the replication cycle.34 In this model, budding cells initially contain a largenumber of small vacuoles, which expand and fuse towards the end of the buddingprocess, giving rise to one or two large vacuoles; just before the emergence of a newbud, vacuoles are observed to fragment again34 (Fig. 5.8 and Plate 5.7). It was observedthat more cells of exponential-phase populations of ale and lager strains exhibitedvacuolar fragmentation than in stationary-phase populations. The actual degree offragmentation in individual cells, however, remained approximately equal. To attemptto corroborate the vacuolar fragmentation and cell replication cycle of Schwenke, asample of previously undivided cells, termed virgin cells, was analysed. These cellswere shown frequently to contain a large central vacuole (Plates 5.8 and 5.9), althoughin many cases some fragmentation was observed (Plate 5.8), and in a proportion ofcells entire fragmentation was observed. It is thought that this fragmentation of virgincell vacuoles represents various stages of ‘readiness’ to divide. Schwenke34 clearly showsthat vacuolar fragmentation is required for the division to occur; virgin cells with frag-mented vacuoles may simply be in a later stage of the cell cycle, and thus about todivide. The exact mechanism for vacuolar fragmentation is undetermined; however, ithas been reported that yeast vacuoles fragment when microtubules are disrupted40
with nocodazole, implying that microtubules are important in the maintenance ofvacuolar integrity.
5.3.3.3 Vacuolar fragmentation and osmotic stress. Vacuolar fragmentation andosmotic stress have not been previously correlated; however, fragmentation has beenpreviously associated with oxidative stress (in terms of pro-vacuole formation).Osmotically stressed cells of both exponential- and stationary-phase populations
58 BREWING YEAST FERMENTATION PERFORMANCE
demonstrated a high degree of vacuolar fragmentation (Plate 5.10). It was, however,impossible to differentiate between fragmentation due to osmotic stress and that dueto the progression through the cell cycle.
5.4 Conclusions
The viability and vitality of brewing yeast cultures directly affect fermentation per-formance and final beer quality.1 As yeast is subject to a range of stress factors duringbrewery handling, it is important to identify the impact of these stresses on yeast qual-ity and thus capacity to perform. Elucidation of the physiological responses to stresswill therefore provide information concerning possible biomarkers of exposure tostressful conditions. Identification of a suitable biomarker of osmotic stress will allowinformed decisions to be made concerning high-gravity brewing and pitching rates.Brewing yeast osmotolerance was shown to be highly strain dependent, as were thelevels of intracellular glycerol accumulated during osmotic stress. Glycerol did notrepresent a good biomarker of osmotic stress as its intracellular abundance was seento be dependent on strain, physiological state and the solute used to elicit the osmoticstress response. Vacuolar fragmentation could not be correlated to osmotic stress.Indeed, it was dependent on a number of physiological and environmental conditions,including normal growth and division, and therefore cannot be used as a biomarker ofosmotic stress. The exact cytological processes governing fragmentation were notdetermined, although these processes, along with cellular solute accumulation, remainthe subject of further research.
Fig. 5.8 Diagrammatic representation of vacuolar changes during the normal replication cycle.(Adapted from Schwenke, 1977.)
THE OSMOTIC STRESS RESPONSE OF ALE AND LAGER BREWING 59
Acknowledgements
Philip White is funded by the J & J Morison educational fund, and the authors wouldlike to thank Mrs Pamela Morison-Inches for her support. The authors are indebtedto the directors of Scottish Courage Brewing Ltd for the kind permission to publishthis work. Thanks also go to Miss Alexandra Patmanidi for constant help and supportand Mrs Dawn Maskell for her help in the preparation and isolation of virgin cells.Katherine Smart is the Scottish Courage Reader in Brewing Science and gratefullyacknowledges the support provided by the directors of Scottish Courage Brewing Ltd.Katherine Smart is also a Royal Society Industrial Fellow and gratefully acknowl-edges the support provided by the Royal Society and the BBSRC.
References
1. Smart, K. (2000) The death of the yeast cell. In: Brewing Yeast Fermentation Performance, Smart, K.(ed.). Blackwell Science, Oxford, pp. 105–113.
2. Panchal, C.J. and Stewart, G.G. (1980) The effect of osmotic pressure on the production and excretionof ethanol and glycerol in brewing yeast strains. J. Inst. Brew. 86, 207–210.
3. Hammond, J., Davis, D., Lee, M. and Storey, K. (2001) Does osmotic pressure affect yeastperformance in high gravity fermentation? Proc. Eur. Brew. Conv., Budapest.
4. Nagodawithana, T.W., Castellano, C. and Steinkraus, K.H. (1974) Appl. Microbiol. 28, 383.5. Reed, H.R. (1984) Use and abuse of osmo-terminology. Plant Cell Environ. 7, 165–170.6. Wiemken, A. (1990) Trehalose in yeast: stress protectant rather than reserve carbohydrate. Antonie van
Leeuwenhoek 58, 209–217.7. Singer, M.A. and Lindquist, S. (1998) Thermotolerance in Saccharomyces cerevisiae: the Yin and Yang
of trehalose. Trends Biotechnol. 16, 460–468.8. Galinski, E.A., Stein, M., Amendt, B. and Kinder, M. (1997) The kosmotropic (structure-forming)
effect of compensatory solutes. Comp. Biochem. Physiol. 117A, 357–365.9. Gilbert, G.A., Gadush, M.V., Wilson, C. and Madore, M.A. (1998) Amino acid accumulation in sink
and source tissues of Coleus blumei Benth. during salinity stress. J. Exp. Bot. 49, 107–114.10. Raitt, D.C., Posas, F. and Saito, H. (2000) Yeast CDc42 GTPase and Ste20 PAK-like kinase regulate
Sho1-dependent activation of the hog1 MAPK pathway. EMBO J. 19, 4623–4631.11. Garay-Arroyo, A. and Covarrubias, A.A. (1999) Three genes whose expression is induced by stress in
Saccharomyces cerevisiae. Yeast 15, 879–892.12. Kapteyn, J.C., ter Riet, B., Vink, E. et al. (2001) Low external pH induces HOG1-dependent changes
in the organization of the Saccharomyces cerevisiae cell wall. Mol. Microbiol. 39, 469–479.13. Tamás, M.J., Luyten, K., Sutherland, F.C.W. et al. (2000) Fpsp1p controls the accumulation and release
of the compatible solute glycerol in yeast osmoregulation. Mol. Microbiol. 31, 1087–1104.14. Smart, K.A., Chambers, K.M., Lambert, I. and Jenkins, C. (1999) Use of methylene violet staining
procedures to determine yeast viability and vitality. J. Am. Soc. Brew. Chem. 57, 18–23.15. McCaig, R. (1990) Evaluation of the fluorescent dye 1-anilino-8-naphthalene sulfonic acid for yeast
viability determination. J. Am. Soc. Brew. Chem. 48, 22–25.16. Deere, D., Shen, J., Vesey, G., Bell, P., Bissinger, P. and Veal, D. (1998) Flow cytometry and cell sorting
for yeast viability assessment and cell selection. Yeast 14, 147–160. 17. Hounsa, C.G., Brandt, E.V., Thevelein, J. et al. (1998) Role of trehalose in survival of Saccharomyces
cerevisiae under osmotic stress. Microbiology 144, 671–680.18. Hohmann, S. (1997) Shaping up: the response of yeast to osmotic stress. In: Yeast Stress Responses,
Hohmann, S. and Mager, W.H. (eds), R.G. Landes, Austin, TX, pp. 101–146.19. Jamieson, D.J. (1998) Oxidative stress responses of the yeast Saccharomyces cerevisiae. Yeast 14,
1511–1572.20. Siderius, M. and Mager, W.H. (1997) General stress response: in search of a common denominator.
In: Yeast Stress Responses, Hohmann, S. and Mager, W.H. (eds). R.G. Landes, Austin, TX, pp. 213–230.
21. Mager, W.H. and Moradas-Ferreira, P.M. (1993) Stress response of yeast. Biochem. J. 290, 1–13.22. Smart, K.A. (2001) The management of yeast stress. Proc. Eur. Brew. Conv., Budapest.
23. Schüller, C., Brewster, J.L., Alexander, M.R. et al. (1994) The HOG pathway controls osmotic regulationof transcription via the stress-response element (STRE) of the Saccharomyces cerevisiae CTT1 gene.EMBO J. 13, 4382–4389.
24. Blomberg, A. (1997) The osmotic hypersensitivity of the yeast Saccharomyces cerevisiae is strain andgrowth media dependent: quantitative aspects of the phenomenon. Yeast 13, 529–539.
25. Martin, V., Quain, D.E. and Smart, K.A. (1999) The oxidative stress response of ale and lager yeaststrains. Eur. Brew. Conv. Cong. 27, 679–686.
26. Martin. V., Quain, D.E. and Smart, K.A. (2000) The oxidative stress response of ale and lager yeaststrains. In: Brewing Yeast Fermentation Performance, Smart, K. (ed.). Blackwell Science, Oxford, pp. 97–105.
27. Rhymes, M.R. and Smart, K.A. (1996) Effect of starvation on the surface properties of brewing yeast.Proc. 2nd Conv. Ferm. Physiol. Inst. Chem. Eng., Brighton, pp. 34–36.
28. Serrano, R. (1996) Salt tolerance in plants and microorganisms: toxicity targets and defence responses.Int. Rev. Cytol. 165, 1–52.
29. Serrano, R., Márquez, J.A. and Ríos, G. (1997) Crucial factors in salt stress tolerance. In: Yeast StressResponses, Hohmann, S. and Mager, W.H. (eds). R.G. Landes, Austin, TX, pp. 147–170.
30. Blomberg, A., Larsson, C. and Gustafsson, L. (1988) Microcalorimetric monitoring of growth ofSaccharomyces cerevisiae: osmotolerance in relation to physiological state. J. Bacteriol. 170, 4562–4568.
31. Hernandez-Saavedra, N.Y., Ochoa, J.L. and Vazquez-Dulhalt, R. (1995) Osmotic adjustment inmarine yeast. J. Plankton Res. 17, 59–69.
32. Eriksson, P., Alipour, H., Adler, L. and Blomberg, A. (2000) Rap1p-binding sites in the Saccharomycescerevisiae GPD1 promoter are involved in its response to NaCl. J. Biol. Chem. 275, 29368–29376.
33. Klionsky, D.J. (1998) Nonclassical protein sorting to the yeast vacuole. J. Biol. Chem. 273, 10807–10810.34. Schwenke, J. (1977) Characteristics and integration of the yeast vacuole and cellular functions. Phys.
Vég. 15, 491–517.35. Nishikawa, S., Umemoto, N., Oshumi, Y. et al. (1990) Biogenesis of vacuolar glycoproteins of yeast
Saccharomyces cerevisiae. J. Biol. Chem. 265, 7440–7448.36. Spormann, D.O., Heim, J. and Wolf, D. (1992) Biogenesis of the yeast vacuole (Lysosome). J. Biol.
Chem. 267, 8021–8029.37. Banta, L.M., Robinson, J.S., Klionsky, D. and Emr, S.D. (1988) Organelle assembly in yeast: charac-
terisation of yeast mutants defective in vacuolar biogenesis and protein sorting. J. Cell Biol. 107,1369–1383.
38. Chiang, H.L. (1995) Protein targeting and degradation in the yeast vacuole. Can. J. Bot. 73 (Suppl. 1),S347–S351.
39. Schwenke, J. (1991) Vacuoles, internal membranous systems and vesicles. In: Rose, A. And Harrison,J.S. eds. The Yeasts, Vol. 4, 2nd edn. Academic Press, New York.
40. Guthrie, B.A. and Wickner, W. (1988) Yeast vacuole fragment when microtubules are disrupted. J. Cell Biol. 107, 115–120.
60 BREWING YEAST FERMENTATION PERFORMANCE
6 Brewing Yeast Oxidative Stress Responses: Impact of Brewery Handling
V. MARTIN, D.E. QUAIN and K.A. SMART
Abstract Oxidative stress may be defined as the response to cellular damage generated byreactive oxygen species such as superoxide anions and hydrogen peroxide. These compoundsare generated as by-products during yeast aerobic metabolism and may damage cellularmacromolecules such as lipids, proteins and DNA. Cellular damage incurred as a conse-quence of exposure to reactive oxygen species may result in lipid peroxidation, protein car-bonyl formation and DNA base modifications. Primary defences are provided by enzymessuch as superoxide dismutases (SOD1 and SOD2) and catalases (CTT1 and CTA1),although other non-enzymic antioxidants (e.g. glutathione) may also provide protection.
During the brewing process, exposure to oxidative stress may occur as a consequence ofyeast propagation, storage and fermentation conditions. It is suggested that exposure tooxidants may influence yeast physiological condition and therefore subsequent fermenta-tion performance and beer quality.
Production ale and lager strains were grown in YPD (yeast extract, bacteriological pep-tone and D-glucose) or wort to achieve populations exhibiting exponential or stationaryphase and were exposed to oxidants such as menadione (a generator of superoxide anions)and hydrogen peroxide to establish the influence of strain type and media composition onresistance. The relationship between oxidative stress resistance and extent of primaryantioxidant defence was investigated for these strains following growth on YPD, wort anddefined wort substitute.
Resistance to oxidants, oxidative stress defence mechanisms and cellular damage wereobserved to be strain dependent and affected by media composition and growth phase.The relationship between oxidative stress defence and damage levels is currently underinvestigation.
6.1 Introduction
Oxidative stress is associated with cells responding to and protecting themselves fromreactive oxygen species.1 Reactive oxygen species [ROS; superoxide anions (O2
·�),hydrogen peroxide (H2O2) and hydroxy (OH�) radicals] may result in damage to cel-lular macromolecules such as lipids, proteins and DNA,2,3 and are mainly generatedduring yeast aerobic metabolism.3,4 Although brewing fermentations are essentiallyanaerobic, yeast cells are exposed to oxygen during propagation, at pitching5 and duringstorage if preaerated,6 representing a potential source of oxidative stress. Cell defen-ces against ROS are provided by enzymes (superoxide dismutases and catalases) and other non-enzymic antioxidants (glutathione, metal ions, vitamins C and E).1,3,4
It is suggested that oxidative stress may affect yeast quality and subsequently fermen-tation performance.
The tolerance of production strains of ale and lager yeast to exogenously generatedoxidative stress in the form of hydrogen peroxide has been investigated. The relation-ship between the resistance to this oxidant and the cellular antioxidant defence (total
Brewing Yeast Fermentation Performance: Second edition
Edited by: KATHERINE SMART Copyright 0 Blackwell Science 2003
catalase activity and cellular glutathione concentration) has been examined for aleand lager strains grown in YPD and wort.
The existence of oxidative stress during yeast handling and its effect on fermentationperformance have not been extensively studied. The aim of this work was to investigatethe occurrence of oxidative stress and cellular response during yeast handling.
6.2 Materials and methods
6.2.1 Yeast strains and growth conditions
Three lager (BB10, BB11 and BB28) and two ale (BB3 and BB18) production strainswere obtained from Bass Brewers (Burton upon Trent, UK). Yeast cells were grownaerobically in 250 ml flasks containing 50 ml of YPD (1% w/v yeast extract, 2% w/v bac-teriological peptone and 2% w/v D-glucose) at 25°C on an orbital shaker at 120 rpm.Yeast populations were harvested in the mid-exponential or stationary phase.
6.2.2 Yeast sample collection
Samples were collected in the brewery (Bass Brewers), from propagation vessels,from fermenter vessels at the end of fermentation and from storage vessels, duringstorage and before and after acid washing.
6.2.3 Determination of response to oxidative stress
Yeast cells were washed three times in sterile deionised water and resuspended ineither water, H2O2 (0.01, 0.1 and 1% w/v) or menadione (10, 50, 100, 200 mM) to afinal cell concentration of 1 � 105 cells/ml and incubated at 25°C on an orbital shakerat 120 rpm. Cell viability was assessed using plate counts on YPD and expressed as apercentage of viability.
6.2.4 Glutathione concentration
Yeast cells were harvested by centrifugation and washed three times in cold (4°C)sterile deionised water. Cells were resuspended in 500 �l metaphosphoric acid 5%(w/v). Cell suspensions were repeatedly boiled and immersed in liquid nitrogen (sixtimes) to achieve cell lysis. The supernatant was retained for analysis. Glutathioneconcentration was determined using the assay kit from Calbiochem (La Jolla, CA,USA) and expressed as nmol/cell.
6.2.5 Protein extraction for enzymic assays by glass bead cell lysis method
Yeast cells were harvested by centrifugation and washed three times in cold (4°C)sterile deionised water. Cells were resuspended in 100 �l fresh buffer [Tris pH 7.550 mM, ethylenediaminetetra-acetate (EDTA) 0.5 mM, Triton X100 0.1% (v/v) andthe following protease inhibitors suspended in dimethyl sulfoxide (DMSO) 100%,
62 BREWING YEAST FERMENTATION PERFORMANCE
tosylphenylalanine chloromethyl ketone (TPCK) 0.25 mM, tosyllysine chloromethylketone (TLCK) 0.25 mM, or in absolute methanol, phenylmethylsulfonyl fluoride(PMSF) 0.5 mM]. To this suspension 100 �l of acid washed glass beads (0.5 mm) wasadded. The samples were vortexed for 3 min and centrifuged at 2100 g for 10 min, andthe resulting supernatant retained for analysis. The total protein concentration fromeach extract was determined using a BioRad protein assay kit (BioRad Laboratories,München, Germany).
6.2.6 Catalase activity
Protein extracts were obtained following the glass bead lysis method. Cellular catalaseactivity was determined according to the methods of Aebi7 and Izawa et al.8 Thecatalase activity was expressed as units per gram of protein.
6.2.7 Glycogen and trehalose concentration
Glycogen and trehalose concentrations were determined using the method by Parrouet al.9 The glycogen and trehalose concentrations were expressed as mg equivalentglucose per 108 cells.
6.3 Results and discussion
6.3.1 Oxidative stress resistance is dependent on growth phase, strain and medium
For haploid strains of Saccharomyces cerevisiae the response of YPD-grown exponential- and stationary-phase cells to H2O2 has been established,4 with stationary-phase cells exhibiting greater resistance than exponential-phase cells.
YPD-grown brewing yeast cells also exhibited an increased resistance for stationary-phase populations and a reduced resistance for exponential-phase cells followingexposure to exogenous H2O2
10 (Fig. 6.1).Viability for all strains decreased with the duration of exposure to H2O2 and the
rate of cell death was dependent on the concentration of oxidant. For brewing yeastgrown in YPD, H2O2 tolerance was reported to be strain dependent, with the alestrains being more sensitive than the lager strains for both exponential- and stationary-phase populations10 (Fig. 6.2).
The tolerance to H2O2 was reported to be medium dependent. Indeed, brewingyeast stationary-phase cells grown in wort exhibited lower tolerance than cells grownin YPD, with the exception of strain BB11 (Fig. 6.3).
6.3.2 Defence mechanisms against hydrogen peroxide are dependent on strain and medium
The primary defences against hydrogen peroxide are provided by catalases (CTT1and CTA1); however, other non-enzymic antioxidants such as glutathione may alsoprotect the cell.1,3,4
BREWING YEAST OXIDATIVE STRESS RESPONSES 63
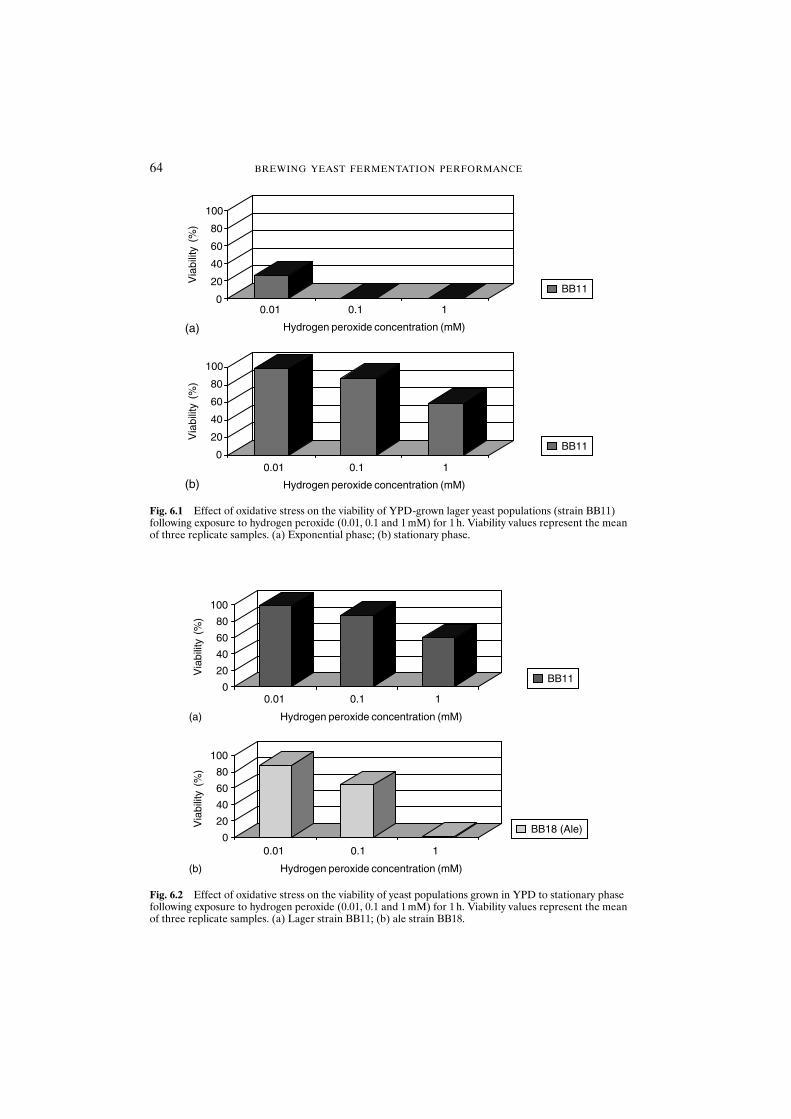
64 BREWING YEAST FERMENTATION PERFORMANCE
0.01 0.1 1
Hydrogen peroxide concentration (mM)
0
20
40
60
80
100
Via
bilit
y (%
)
(a)
0.01 0.1 1
Hydrogen peroxide concentration (mM)
0
20
40
60
80
100
Via
bilit
y (%
)
(b)
BB11
BB18 (Ale)
Fig. 6.2 Effect of oxidative stress on the viability of yeast populations grown in YPD to stationary phasefollowing exposure to hydrogen peroxide (0.01, 0.1 and 1 mM) for 1 h. Viability values represent the meanof three replicate samples. (a) Lager strain BB11; (b) ale strain BB18.
0
20
40
60
80
100
0
20
40
60
80
100
0.01
BB11
BB11
Via
bilit
y (%
)V
iabi
lity
(%)
0.1 1
Hydrogen peroxide concentration (mM)
0.01 0.1 1
Hydrogen peroxide concentration (mM)
(a)
(b)
Fig. 6.1 Effect of oxidative stress on the viability of YPD-grown lager yeast populations (strain BB11)following exposure to hydrogen peroxide (0.01, 0.1 and 1 mM) for 1 h. Viability values represent the meanof three replicate samples. (a) Exponential phase; (b) stationary phase.
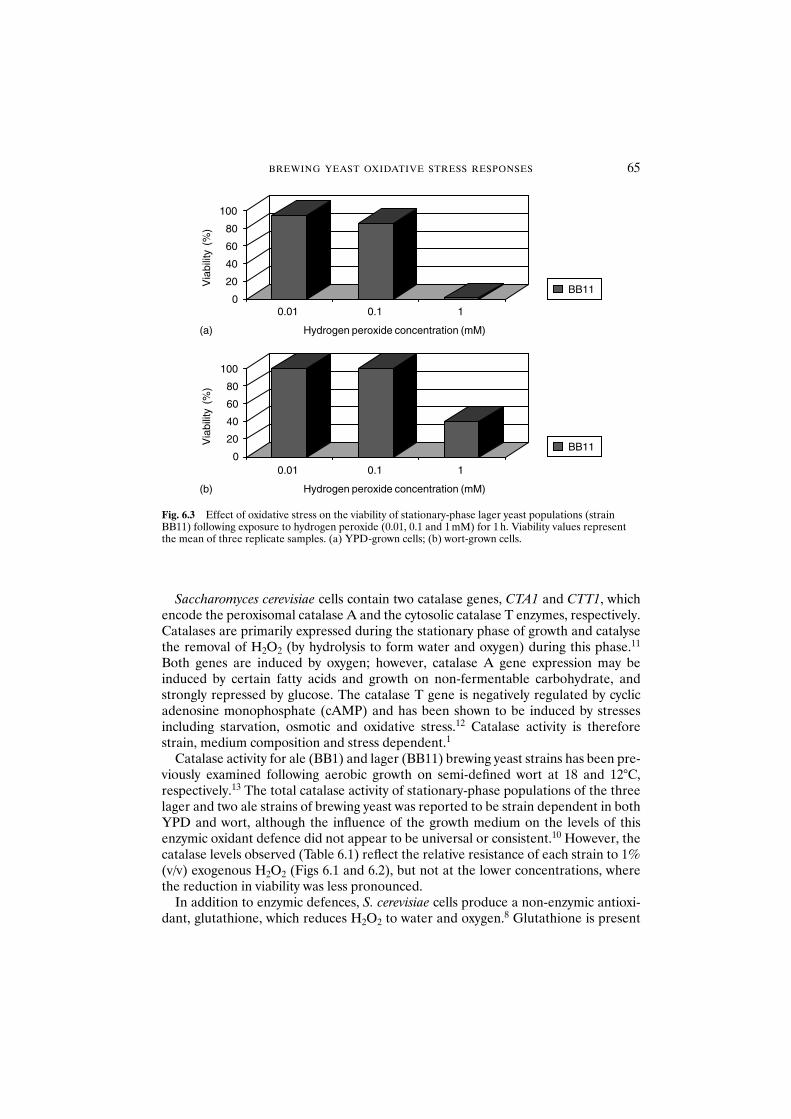
Saccharomyces cerevisiae cells contain two catalase genes, CTA1 and CTT1, whichencode the peroxisomal catalase A and the cytosolic catalase T enzymes, respectively.Catalases are primarily expressed during the stationary phase of growth and catalysethe removal of H2O2 (by hydrolysis to form water and oxygen) during this phase.11
Both genes are induced by oxygen; however, catalase A gene expression may beinduced by certain fatty acids and growth on non-fermentable carbohydrate, andstrongly repressed by glucose. The catalase T gene is negatively regulated by cyclicadenosine monophosphate (cAMP) and has been shown to be induced by stressesincluding starvation, osmotic and oxidative stress.12 Catalase activity is thereforestrain, medium composition and stress dependent.1
Catalase activity for ale (BB1) and lager (BB11) brewing yeast strains has been pre-viously examined following aerobic growth on semi-defined wort at 18 and 12°C,respectively.13 The total catalase activity of stationary-phase populations of the threelager and two ale strains of brewing yeast was reported to be strain dependent in bothYPD and wort, although the influence of the growth medium on the levels of thisenzymic oxidant defence did not appear to be universal or consistent.10 However, thecatalase levels observed (Table 6.1) reflect the relative resistance of each strain to 1%(v/v) exogenous H2O2 (Figs 6.1 and 6.2), but not at the lower concentrations, wherethe reduction in viability was less pronounced.
In addition to enzymic defences, S. cerevisiae cells produce a non-enzymic antioxi-dant, glutathione, which reduces H2O2 to water and oxygen.8 Glutathione is present
BREWING YEAST OXIDATIVE STRESS RESPONSES 65
0.01 0.1 1
Hydrogen peroxide concentration (mM)
0
20
40
60
80
100V
iabi
lity
(%)
(a)
BB11
BB11
0.01 0.1 1
Hydrogen peroxide concentration (mM)
0
20
40
60
80
100
Via
bilit
y (%
)
(b)
Fig. 6.3 Effect of oxidative stress on the viability of stationary-phase lager yeast populations (strainBB11) following exposure to hydrogen peroxide (0.01, 0.1 and 1 mM) for 1 h. Viability values representthe mean of three replicate samples. (a) YPD-grown cells; (b) wort-grown cells.
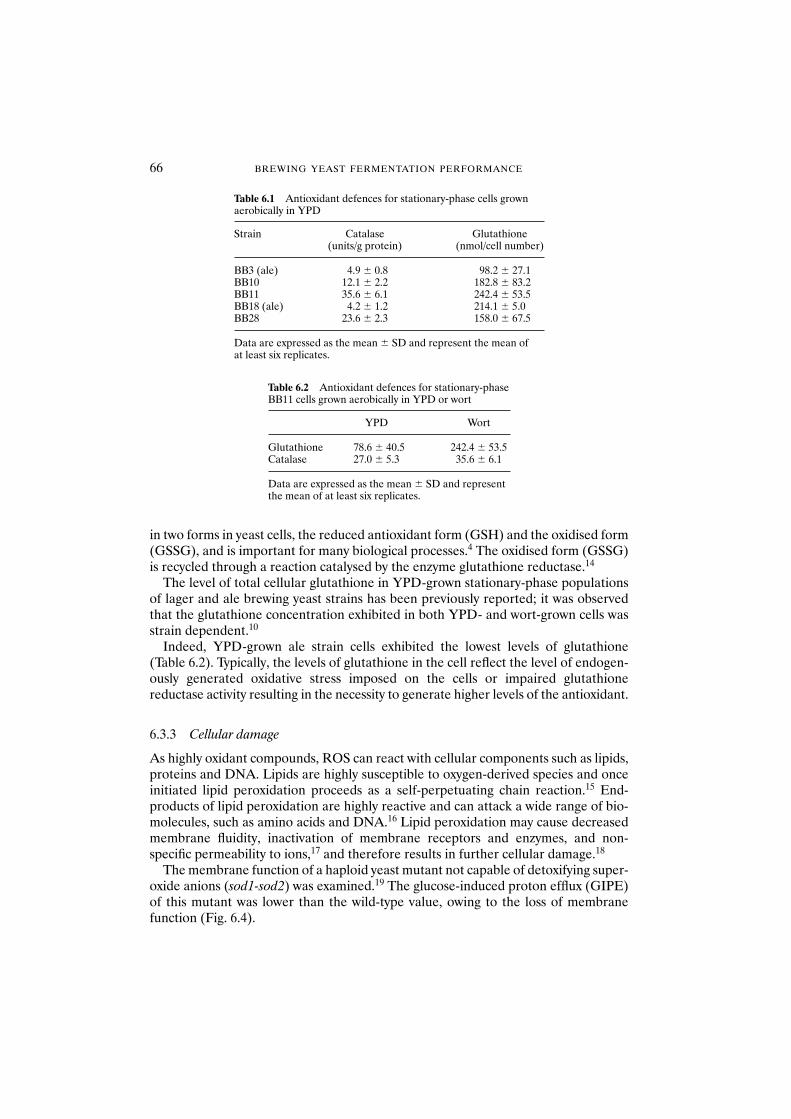
in two forms in yeast cells, the reduced antioxidant form (GSH) and the oxidised form(GSSG), and is important for many biological processes.4 The oxidised form (GSSG)is recycled through a reaction catalysed by the enzyme glutathione reductase.14
The level of total cellular glutathione in YPD-grown stationary-phase populationsof lager and ale brewing yeast strains has been previously reported; it was observedthat the glutathione concentration exhibited in both YPD- and wort-grown cells wasstrain dependent.10
Indeed, YPD-grown ale strain cells exhibited the lowest levels of glutathione (Table 6.2). Typically, the levels of glutathione in the cell reflect the level of endogen-ously generated oxidative stress imposed on the cells or impaired glutathione reductase activity resulting in the necessity to generate higher levels of the antioxidant.
6.3.3 Cellular damage
As highly oxidant compounds, ROS can react with cellular components such as lipids,proteins and DNA. Lipids are highly susceptible to oxygen-derived species and onceinitiated lipid peroxidation proceeds as a self-perpetuating chain reaction.15 End-products of lipid peroxidation are highly reactive and can attack a wide range of bio-molecules, such as amino acids and DNA.16 Lipid peroxidation may cause decreasedmembrane fluidity, inactivation of membrane receptors and enzymes, and non-specific permeability to ions,17 and therefore results in further cellular damage.18
The membrane function of a haploid yeast mutant not capable of detoxifying super-oxide anions (sod1-sod2) was examined.19 The glucose-induced proton efflux (GIPE)of this mutant was lower than the wild-type value, owing to the loss of membranefunction (Fig. 6.4).
66 BREWING YEAST FERMENTATION PERFORMANCE
Table 6.1 Antioxidant defences for stationary-phase cells grown aerobically in YPD
Strain Catalase Glutathione (units/g protein) (nmol/cell number)
BB3 (ale) 4.9 � 0.8 98.2 � 27.1BB10 12.1 � 2.2 182.8 � 83.2BB11 35.6 � 6.1 242.4 � 53.5BB18 (ale) 4.2 � 1.2 214.1 � 5.0BB28 23.6 � 2.3 158.0 � 67.5
Data are expressed as the mean � SD and represent the mean of at least six replicates.
Table 6.2 Antioxidant defences for stationary-phaseBB11 cells grown aerobically in YPD or wort
YPD Wort
Glutathione 78.6 � 40.5 242.4 � 53.5Catalase 27.0 � 5.3 35.6 � 6.1
Data are expressed as the mean � SD and representthe mean of at least six replicates.
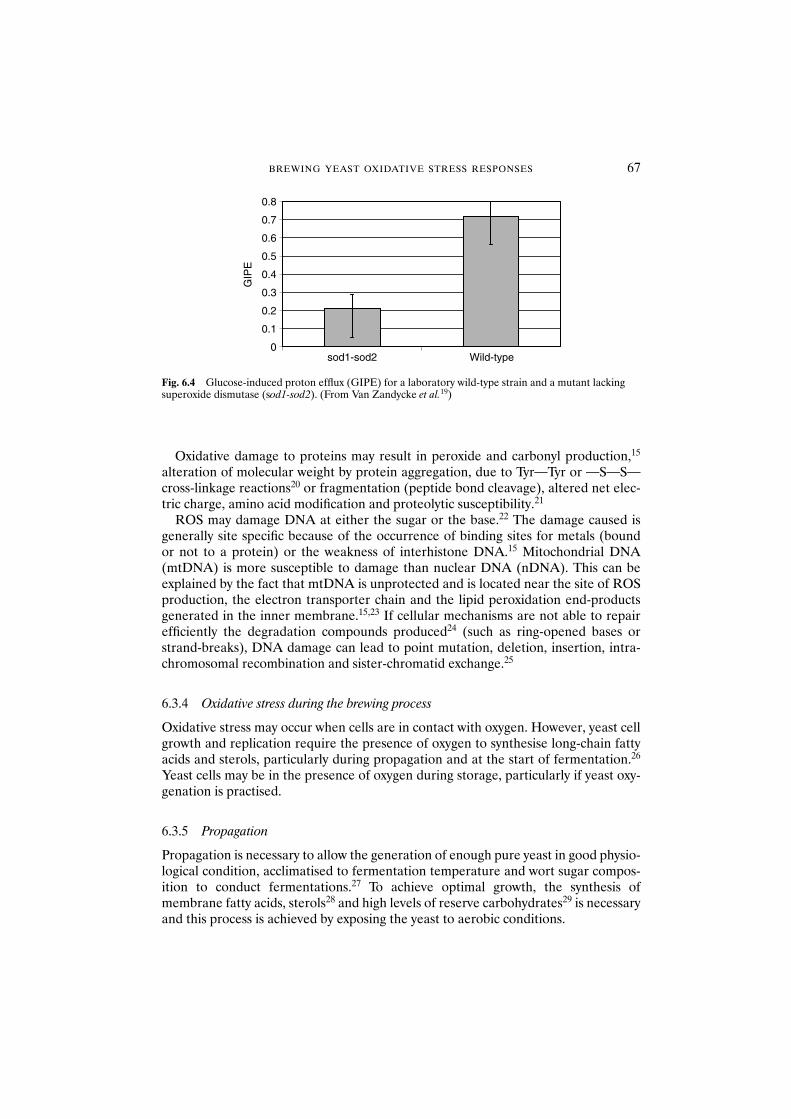
Oxidative damage to proteins may result in peroxide and carbonyl production,15
alteration of molecular weight by protein aggregation, due to TyrˆTyr or ˆSˆSˆ
cross-linkage reactions20 or fragmentation (peptide bond cleavage), altered net elec-tric charge, amino acid modification and proteolytic susceptibility.21
ROS may damage DNA at either the sugar or the base.22 The damage caused isgenerally site specific because of the occurrence of binding sites for metals (bound or not to a protein) or the weakness of interhistone DNA.15 Mitochondrial DNA(mtDNA) is more susceptible to damage than nuclear DNA (nDNA). This can beexplained by the fact that mtDNA is unprotected and is located near the site of ROSproduction, the electron transporter chain and the lipid peroxidation end-productsgenerated in the inner membrane.15,23 If cellular mechanisms are not able to repairefficiently the degradation compounds produced24 (such as ring-opened bases orstrand-breaks), DNA damage can lead to point mutation, deletion, insertion, intra-chromosomal recombination and sister-chromatid exchange.25
6.3.4 Oxidative stress during the brewing process
Oxidative stress may occur when cells are in contact with oxygen. However, yeast cellgrowth and replication require the presence of oxygen to synthesise long-chain fattyacids and sterols, particularly during propagation and at the start of fermentation.26
Yeast cells may be in the presence of oxygen during storage, particularly if yeast oxy-genation is practised.
6.3.5 Propagation
Propagation is necessary to allow the generation of enough pure yeast in good physio-logical condition, acclimatised to fermentation temperature and wort sugar compos-ition to conduct fermentations.27 To achieve optimal growth, the synthesis ofmembrane fatty acids, sterols28 and high levels of reserve carbohydrates29 is necessaryand this process is achieved by exposing the yeast to aerobic conditions.
BREWING YEAST OXIDATIVE STRESS RESPONSES 67
0
0.1
0.2
0.3
0.4
0.5
0.6
0.7
0.8
sod1-sod2 Wild-type
GIP
E
Fig. 6.4 Glucose-induced proton efflux (GIPE) for a laboratory wild-type strain and a mutant lackingsuperoxide dismutase (sod1-sod2). (From Van Zandycke et al.19)
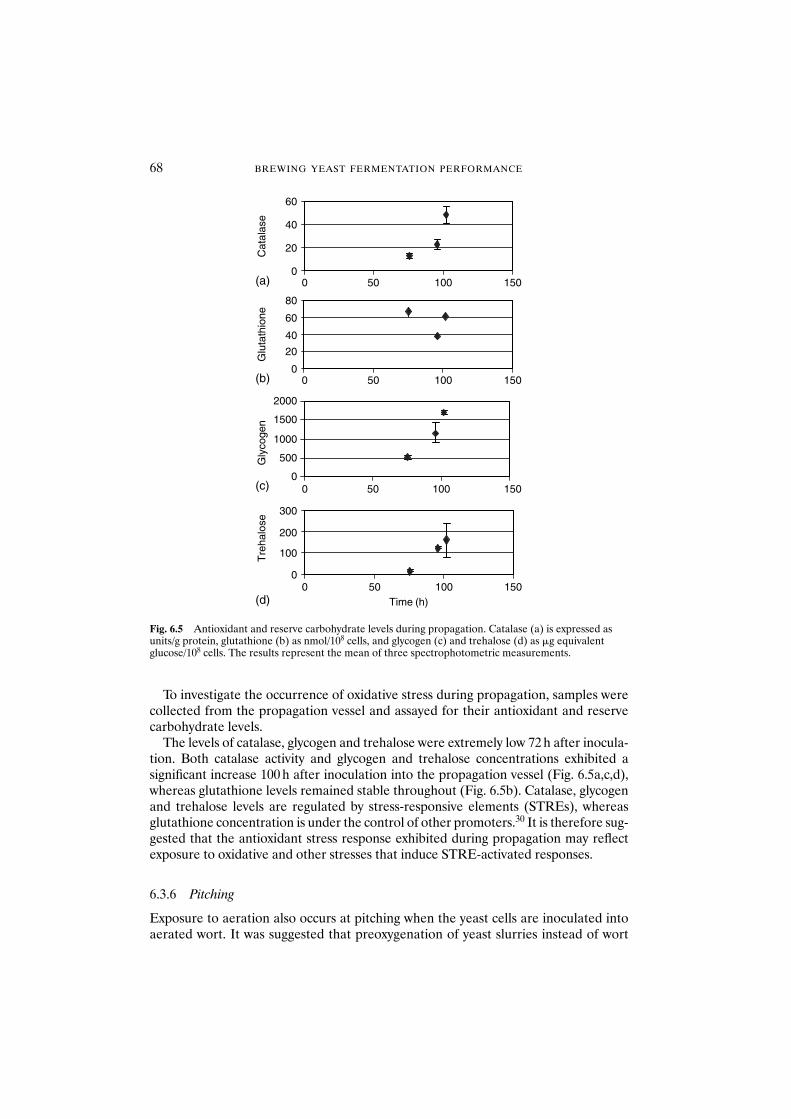
To investigate the occurrence of oxidative stress during propagation, samples werecollected from the propagation vessel and assayed for their antioxidant and reservecarbohydrate levels.
The levels of catalase, glycogen and trehalose were extremely low 72 h after inocula-tion. Both catalase activity and glycogen and trehalose concentrations exhibited a significant increase 100 h after inoculation into the propagation vessel (Fig. 6.5a,c,d),whereas glutathione levels remained stable throughout (Fig. 6.5b). Catalase, glycogenand trehalose levels are regulated by stress-responsive elements (STREs), whereasglutathione concentration is under the control of other promoters.30 It is therefore sug-gested that the antioxidant stress response exhibited during propagation may reflectexposure to oxidative and other stresses that induce STRE-activated responses.
6.3.6 Pitching
Exposure to aeration also occurs at pitching when the yeast cells are inoculated intoaerated wort. It was suggested that preoxygenation of yeast slurries instead of wort
68 BREWING YEAST FERMENTATION PERFORMANCE
0
20
40
60
0 50 100 150
Cat
alas
e
(a)
0 50 100 1500
20
40
60
80
Glu
tath
ione
(b)
0
500
1000
1500
2000
0 50 100 150
Gly
coge
n
(c)
0
100
200
300
Time (h)0 50 100 150
Tre
halo
se
(d)
Fig. 6.5 Antioxidant and reserve carbohydrate levels during propagation. Catalase (a) is expressed asunits/g protein, glutathione (b) as nmol/108 cells, and glycogen (c) and trehalose (d) as �g equivalent glucose/108 cells. The results represent the mean of three spectrophotometric measurements.
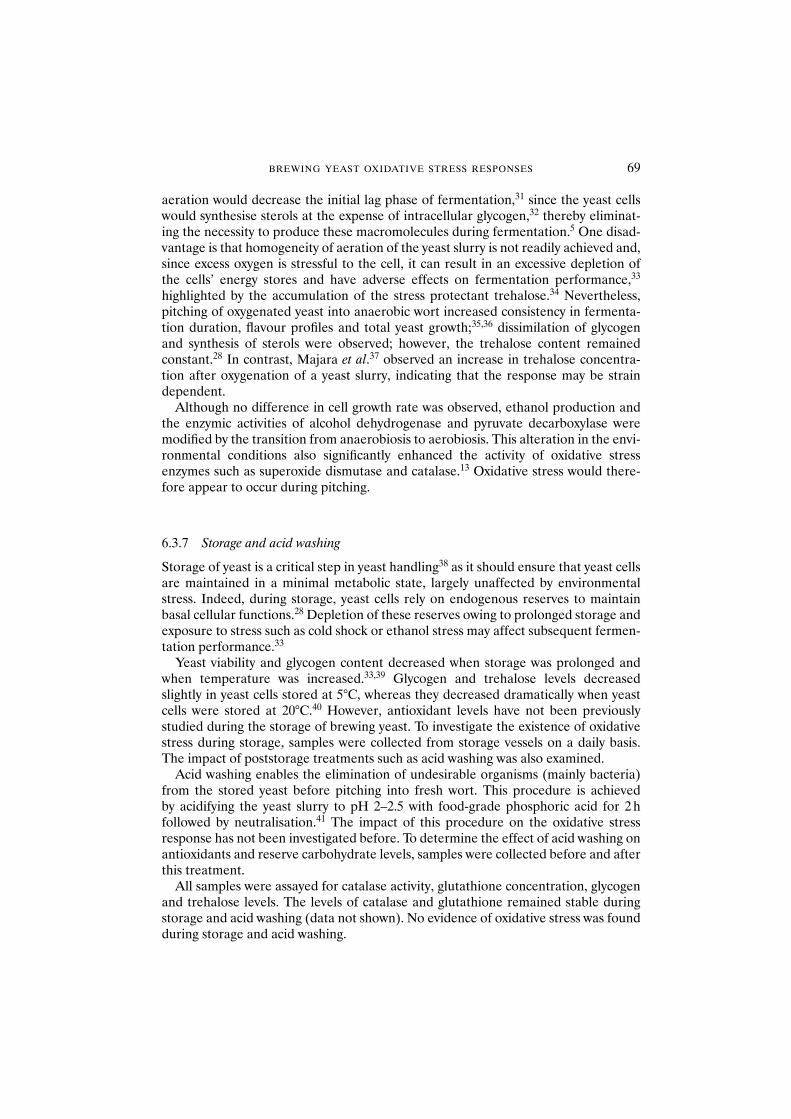
aeration would decrease the initial lag phase of fermentation,31 since the yeast cellswould synthesise sterols at the expense of intracellular glycogen,32 thereby eliminat-ing the necessity to produce these macromolecules during fermentation.5 One disad-vantage is that homogeneity of aeration of the yeast slurry is not readily achieved and,since excess oxygen is stressful to the cell, it can result in an excessive depletion of the cells’ energy stores and have adverse effects on fermentation performance,33
highlighted by the accumulation of the stress protectant trehalose.34 Nevertheless,pitching of oxygenated yeast into anaerobic wort increased consistency in fermenta-tion duration, flavour profiles and total yeast growth;35,36 dissimilation of glycogenand synthesis of sterols were observed; however, the trehalose content remained constant.28 In contrast, Majara et al.37 observed an increase in trehalose concentra-tion after oxygenation of a yeast slurry, indicating that the response may be strain dependent.
Although no difference in cell growth rate was observed, ethanol production andthe enzymic activities of alcohol dehydrogenase and pyruvate decarboxylase weremodified by the transition from anaerobiosis to aerobiosis. This alteration in the envi-ronmental conditions also significantly enhanced the activity of oxidative stressenzymes such as superoxide dismutase and catalase.13 Oxidative stress would there-fore appear to occur during pitching.
6.3.7 Storage and acid washing
Storage of yeast is a critical step in yeast handling38 as it should ensure that yeast cellsare maintained in a minimal metabolic state, largely unaffected by environmentalstress. Indeed, during storage, yeast cells rely on endogenous reserves to maintainbasal cellular functions.28 Depletion of these reserves owing to prolonged storage andexposure to stress such as cold shock or ethanol stress may affect subsequent fermen-tation performance.33
Yeast viability and glycogen content decreased when storage was prolonged andwhen temperature was increased.33,39 Glycogen and trehalose levels decreasedslightly in yeast cells stored at 5°C, whereas they decreased dramatically when yeastcells were stored at 20°C.40 However, antioxidant levels have not been previouslystudied during the storage of brewing yeast. To investigate the existence of oxidativestress during storage, samples were collected from storage vessels on a daily basis.The impact of poststorage treatments such as acid washing was also examined.
Acid washing enables the elimination of undesirable organisms (mainly bacteria)from the stored yeast before pitching into fresh wort. This procedure is achieved by acidifying the yeast slurry to pH 2–2.5 with food-grade phosphoric acid for 2 h followed by neutralisation.41 The impact of this procedure on the oxidative stressresponse has not been investigated before. To determine the effect of acid washing onantioxidants and reserve carbohydrate levels, samples were collected before and afterthis treatment.
All samples were assayed for catalase activity, glutathione concentration, glycogenand trehalose levels. The levels of catalase and glutathione remained stable duringstorage and acid washing (data not shown). No evidence of oxidative stress was foundduring storage and acid washing.
BREWING YEAST OXIDATIVE STRESS RESPONSES 69
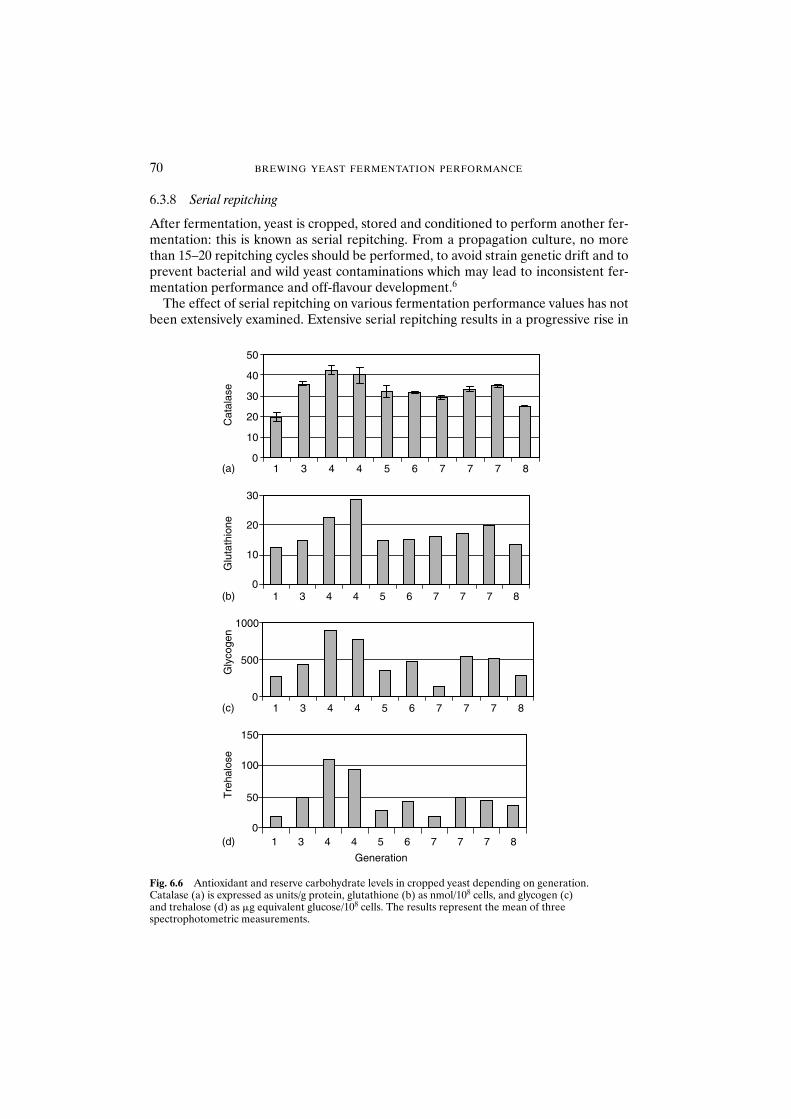
6.3.8 Serial repitching
After fermentation, yeast is cropped, stored and conditioned to perform another fer-mentation: this is known as serial repitching. From a propagation culture, no morethan 15–20 repitching cycles should be performed, to avoid strain genetic drift and toprevent bacterial and wild yeast contaminations which may lead to inconsistent fer-mentation performance and off-flavour development.6
The effect of serial repitching on various fermentation performance values has notbeen extensively examined. Extensive serial repitching results in a progressive rise in
70 BREWING YEAST FERMENTATION PERFORMANCE
Generation
0
10
20
30
40
50
1 3 4 4 5 6 7 7 7 8
Cat
alas
e
(a)
1 3 4 4 5 6 7 7 7 8
Glu
tath
ione
0
10
20
30
(b)
1 3 4 4 5 6 7 7 7 8
Gly
coge
n
0
500
1000
(c)
1 3 4 4 5 6 7 7 7 8
Tre
halo
se
0
50
100
150
(d)
Fig. 6.6 Antioxidant and reserve carbohydrate levels in cropped yeast depending on generation.Catalase (a) is expressed as units/g protein, glutathione (b) as nmol/108 cells, and glycogen (c) and trehalose (d) as �g equivalent glucose/108 cells. The results represent the mean of three spectrophotometric measurements.
cell surface charge and flocculation capacity.42–44 In addition, trehalose levelsincreased with generation number, whereas glycogen contents declined from propa-gation to the second generation, but subsequently returned to propagation levels.44
Samples were collected from yeast containment vessels (YCVs) immediately aftercropping and analysed for catalase activity, glutathione concentration, glycogen andtrehalose levels.
The levels of antioxidant molecules and reserve carbohydrates remained stablethroughout serial repitching (Fig. 6.6). However, samples from the fourth generation,which originated from the same yeast slurry and wort batch, exhibited higher concen-trations on the four parameters studied. Therefore, it is postulated that the variationsobserved may be the result of wort composition effects rather than yeast generationnumber per se.
6.4 Conclusions
The tolerance of brewing yeast strains to exogenous H2O2 stress was dependent onstrain and the phase of growth exhibited by the cell population. Lager strainsappeared to be more resistant than ale strains, although the reason for this is notknown. Cellular catalase activity and glutathione content indicate that the level ofdefence against H2O2 was strain dependent. While the catalase levels appeared to bedirectly related to the resistance of the strains to oxidative stress, the glutathione con-tent of the cells was inversely related to the activity of this enzyme; glutathione maytherefore compensate for reduced catalase activity and vice versa. Indeed, a recentstudy suggested that glutathione and catalase represent redundant H2O2 detoxifica-tion systems,45 and this implies that other defence systems may be important duringthis form of stress.
Catalase activity, glycogen and trehalose concentrations exhibited a significantincrease during propagation, whereas glutathione levels remained stable. The genesinvolved in catalase, glycogen and trehalose biosynthesis or recycling are under con-trol of promoters called (general) STREs, which mediate the activation of genes afterheat shock, high salt or oxidative stresses.46 Glutathione concentration is not regu-lated by STREs but by the YAP1 pathway.47 Therefore, the observations reportedherein may be the consequence of exposure to a combination of stresses rather thanto oxidative stress alone during propagation. No evidence of oxidative stress wasfound during storage, acid washing or cropping.
Acknowledgements
Veronique Martin and Katherine Smart gratefully acknowledge the support of BassBrewers Ltd, and would like to thank Wendy Box and David Ruddlesden for theirhelp with the sample collection. Veronique Martin is supported by the Henry MitchellScholarship. Katherine Smart is the Scottish Courage Reader in Brewing Science andgratefully acknowledges the support of the Royal Society, BBSRC and EPSRC for theaward of her Royal Society Industrial Fellowship. The authors would like to thank theDirectors of Bass Brewers for kind permission to publish this work.
BREWING YEAST OXIDATIVE STRESS RESPONSES 71
References
1. Santoro, N. and Thiele, D.J. (1997) Oxidative stress responses in yeast. In: Yeast Stress Responses,Hohmann, S. and Mager, W.H. (eds). Springer, Heidelberg, pp. 171–212.
2. Fridovitch, I. (1978) The biology of free radicals. Science 201, 875–879.3. Gralla, E.B. and Kosman, D.J. (1992) Molecular genetics of superoxide dismutases in yeasts and
related fungi. Adv. Genet. 30, 251–319.4. Jamieson, D.J. (1998) Oxidative stress responses of the yeast Saccharomyces cerevisiae. Yeast 14,
1511–1527.5. Boulton, C.A. and Quain, D.E. (1987) Yeast, oxygen and the control of brewery fermentations. Proc.
Eur. Brew. Conv. Cong., Madrid, 21, 401–408.6. Boulton, C.A. (1991) Yeast management and the control of brewery fermentations. Brew. Guardian
April, 25–29.7. Aebi, H. (1984) Catalase in vitro. Methods Enzymol. 105, 121–126.8. Izawa, S., Inoue, Y. and Kimura, A. (1995) Oxidative stress response in yeast: effect of glutathione on
adaptation to hydrogen peroxide stress in Saccharomyces cerevisiae. FEBS Lett. 368, 73–76.9. Parrou, J.L., Teste, M.A. and Francois, J. (1997) Effects of various types of stress on the metabolism of
reserve carbohydrates in Saccharomyces cerevisiae: genetic evidence for a stress-induced recycling ofglycogen and trehalose. Microbiology 143, 891–900.
10. Martin, V., Quain, D.E. and Smart, K.A. (1999) The oxidative stress response of ale and lager yeaststrains. Proc. Eur. Brew. Conv., Cannes, 1999, pp. 679–686.
11. Izawa, S., Inoue, Y. and Kimura, A. (1996) Importance of catalase in the adaptive response to hydro-gen peroxide: analysis of acatalasaemic Saccharomyces cerevisiae. Biochem. J. 320, 61–67.
12. Ruis, H. and Hamilton, B. (1992) Molecular Biology of Free Radical Scavenging Systems. Cold SpringHarbor Laboratory Press, Cold Spring Harbor, NY, pp. 153–172.
13. Clarkson, S.P., Large, P.J., Boulton, C.A. and Bamforth, C.W. (1991) Synthesis of superoxide dismu-tases, catalases and other enzymes and oxygen and superoxide toxicity during changes in oxygen con-centration in cultures of brewing yeast. Yeast 7, 91–103.
14. Collinson, L.P. and Dawes, I.W. (1995) Inducibility of the response of yeast cells to peroxide stress.Gene 156, 123–127.
15. Cheeseman, K.H. and Slater, T.F. (1993) An introduction to free radical biochemistry. Br. Med. Bull. 49,481–493.
16. Bucala, R. (1996) Lipid and lipoprotein oxidation: basic mechanisms and unresolved questions in vivo.Redox Report 2, 291–307.
17. Gutteridge, J.M.C. and Halliwell, B. (1990) The measurement and mechanism of lipid peroxidation inbiological systems. Trends Biochem. Sci. 15, 129–135.
18. Moradas-Ferreira, P., Costa, V., Piper, P. and Mager, W. (1996) The molecular defences against reactiveoxygen species. Mol. Microbiol. 19, 651–658.
19. Van Zandycke, S.M., Siddique, R. and Smart, K.A. (2001) Carbohydrate utilization and membranepotential. Proc. Eur. Brew. Conv., Budapest.
20. Stadtman, E.R. (1993) Oxidation of free amino acids and amino acid residues in proteins by radiolysisand by metal-catalyzed reactions. Annu. Rev. Biochem. 62, 797–821.
21. Davies, K.J.A. (1987) Protein damage and degradation by oxygen radicals. J. Biol. Chem. 262,9895–9901.
22. Wiseman, H. and Halliwell, B. (1996) Damage to DNA by reactive oxygen and nitrogen species: role ininflammatory disease and progression of cancer. Biochem. J. 313, 17–29.
23. Halliwell, B. and Gutteridge, J.M.C. (1999) Free Radicals in Biology and Medicine. Clarendon Press,Oxford.
24. Imlay, J.A. and Linn, S. (1988) DNA damage and oxygen radical toxicity. Science 240, 1302–1309.25. Boiteux, S. and Radicella, J.P. (1999) Base excision repair of 8-hydroxyguanine protects DNA from
endogenous oxidative stress. Biochimie 81, 59–67.26. Quain, D.E. (1986) Differentiation of brewing yeast. J. Inst. Brew. Centenary Rev. 92, 435–438.27. Masschelein, C.A., Borremans, E. and Van de Winkel, L. (1994) Application of exponentially-fed-
batch cultures to the propagation of brewing yeast. Proc. Inst. Brew., Asia Pacific Sect. 23, 104–108.28. Boulton, C.A. (2000) Trehalose, glycogen and sterols. Proc. Brew. Yeast Ferm. Perform. Cong. 2, 10–19.29. Lillie, S.H. and Pringle, J.R. (1980) Reserve carbohydrate metabolism in Saccharomyces cerevisiae:
responses to nutrient limitation. J. Bacteriol. 143, 1384–1394.30. Maris, A.F., Kern, A.L., Picada, J.N. et al. (2000) Glutathione, but not transcription factor Yap1, is
required for carbon source-dependent resistance to oxidative stress in Saccharomyces cerevisiae. Curr.Genet. 37, 175–182.
72 BREWING YEAST FERMENTATION PERFORMANCE
31. Jakobsen, M. (1982) The effect of yeast handling procedures on yeast oxygen requirement and fer-mentation. Proc. Conv. Inst. Brew., Aust. N.Z. Sect., Perth, pp. 132–137.
32. Quain, D.E., Thurston, P.A. and Tubb, R.S. (1981) The structural and storage carbohydrates ofSaccharomyces cerevisiae: changes during fermentation of wort and a role for glycogen catabolism inlipid biosynthesis. J. Inst. Brew. 87, 108–111.
33. McCaig, R. and Bendiak, D.S. (1985) Yeast handling studies. I. Agitation of stored pitching yeast. J. Am. Soc. Brew. Chem. 43, 114–118.
34. Callaerts, G., Iserentant, D. and Verachtert, H. (1993) Relationship between trehalose and sterol accu-mulation during oxygenation of cropped yeast. J. Am. Soc. Brew. Chem. 51, 75–77.
35. Boulton, C.A. and Quain, D.E. (1999) A novel system for propagation of brewing yeast. Proc. Eur.Brew. Conv., Cannes, 1999, pp. 647–654.
36. Sasaki, N., Yasuda, Y., Imai, T. et al. (2000) The effect of wort aeration using a high oxygen concentra-tion on fermentation, yeast physiology and the quality of the finished beer. Tech. Q. Master Brew. Assoc.Am. 37, 27–30.
37. Majara, M., O’Connor-Cox, E.S.C. and Axcell, B.C. (1996) Trehalose – a stress protectant and stressindicator compound for yeast exposed to adverse conditions. J. Am. Soc. Brew. Chem. 54, 221–227.
38. O’Connor-Cox, E.S.C. (1998) Improving yeast handling in the brewery. Part 2: Yeast collection. Brew.Guardian 127(2), 22–34.
39. McCaig, R. and Bendiak, D.S. (1985) Yeast handling studies. II. Temperature of storage of pitchingyeast. J. Am. Soc. Brew. Chem. 43, 119–122.
40. Morimura, S., Hino, T., Kida, K. and Maemura, H. (1998) Storage of pitching yeast for the productionof whisky. J. Inst. Brew. 104, 213–216.
41. Simpson, W.J. and Hammond, J.R.M. (1989) The response of brewing yeasts to acid washing. J. Inst.Brew. 95, 347–354.
42. Smart, K.A. and Whisker, S. (1996) Effect of serial repitching on the fermentations properties and con-dition of brewing yeast. J. Am. Soc. Brew. Chem. 54, 41–44.
43. Teixeira, J.M., Teixeira, J.A., Mota, M. et al. (1991) The influence of cell wall composition of a brewer’sflocculent lager yeast on sedimentation during successive industrial fermentations. Proc. Eur. Brew.Conv. Cong., Lisbon, 23, 241–248.
44. Jenkins, C., Kennedy, A.I., Thurston, P., Hodgson, J.A. and Smart K.A. (2001). Impact of serialrepitching and wort compostion on fermentation performance and organelle integrity of lager brewingyeast. Proc. Eur. Brew. Conv., Budapest.
45. Grant, C.M., Perrone, G. and Dawes, I.W. (1998) Glutathione and catalase provide overlappingdefences for protection against hydrogen peroxide in the yeast Saccharomyces cerevisiae. Biochem.Biophys. Res. Commun. 253, 893–898.
46. Mager, H.M. and Hohmann, S. (1997) Stress response mechanisms in the yeast Saccharomyces cerevisiae. In: Yeast Stress Responses, Hohmann, S. and Mager, W.H. (eds). R.G. Landes, Austin, TX, pp. 1–5.
47. Grant, C.M., Collinson, L.P., Roe, J.-H. and Dawes, I.W. (1996) Yeast glutathione reductase is requiredfor protection against oxidative stress and is a target gene for yAP-1 transcriptional regulation. Mol.Microbiol. 21, 171–179.
BREWING YEAST OXIDATIVE STRESS RESPONSES 73

Part 3 Wort Composition: Impact on Yeast Metabolismand Performance
7 Wort Composition and Beer Quality
C.W. BAMFORTH
Abstract Whereas much attention has been lavished on ensuring consistency in yeastquality and quantity in pursuit of controlled fermentation, the significance of variations inwort composition has been paid spasmodic attention. Wort has a huge direct influence onbeer quality, through its components surviving into the product to determine colour, clar-ity, foam, safety and wholesomeness and some key aspects of flavour, but also through itsimpact on yeast performance. While the gross impact that the individual wort componentshave on yeast physiology and surface behaviour and therefore beer quality is documentedin the literature, there is remarkably little appreciation of how much significance can beattached to batch-to-batch fluctuation in wort composition. It is suggested that the mostuseful index of tolerance is the flavour compound(s) that displays the most sensitive reac-tion to a change in one or more wort components. Building on this information, there is anurgent need for the construction of models relating wort composition and yeast quality andquantity to flavour compound production. Such models will aid the brewer in decisions con-cerning how much effort is needed to control wort composition and to what tolerance.
7.1 Introduction
Libraries are replete with volumes describing the formulation of media for industrialfermentations (see, for example, Ref. 1). For the most part, however, commercial fermentations are targeted on the production of high yields of either an organism ora single product produced by that organism. In such situations it is entirely feasiblesystematically to deduce optimised fermentation conditions, for example by changingmedium ingredients one at a time to arrive at the appropriate level of each or byadding ingredients to a steady-state continuous culture.
In the case of brewery fermentations, however, there is a somewhat different scen-ario. In this case the product of interest is essentially the spent growth medium. Ratherthan worrying (for the most part) about the yield of the organism itself or the yield of asingle end-product, brewers are concerned with an optimised balance of molecules leftbehind after the yeast has done its job. The medium, wort, is far less defined than thatwhich is used for most industrial fermentations.
Rather than the mixing of a relatively few pure ingredients to produce the medium,wort is derived from vegetative (and therefore inherently variable) sources (malt,adjuncts, hops) in processes controlled by coarse parameters such as time, tempera-ture and solid–liquid ratio. The analytical specifications applied to the wort, too, arerelatively broad and by no means is there batch-to-batch measurement of the individ-ual substances (e.g. sugars, amino acids, vitamins, inorganic ions, lipids) on which theyeast depends for its metabolism. Most brewers will rely simply on overall strength ofthe wort (specific gravity) as an index of quantity, assuming that the relative balance ofcarbohydrates, nitrogenous constituents and other materials is remaining constant.
Brewing Yeast Fermentation Performance: Second edition
Edited by: KATHERINE SMART Copyright 0 Blackwell Science 2003
Just about the only wort components that they will individually specify and quantify arethe oxygen dosed in before fermentation and zinc, when added.
Is this, or is it not, an excessively simplistic stance? That is the nub of this thesis.
7.2 The relationship of wort composition to beer quality
Wort can impinge upon beer quality in two ways: (i) through its impact on yeast, and(ii) directly, in terms of materials passing into the beer without being affected (for themost part) by yeast.
Taking the second of these, it is easy to establish that more aspects of beer quality(positive and negative) are a direct consequence of the wort rather than through itsbeing ‘modified’ by yeast. The colour of beer is generally established in the brewhouseor earlier, through either melanoidin formation in malt kilning and roasting and wortboiling, or the oxidation of polyphenolics in mashing and boiling.2 The colloidal sus-ceptibility of beer is very largely established upstream of the fermenter, in terms of sen-sitive polypeptides, tannoids, glucans, oxalate, etc.3 Foam is a consequence primarily of amphipathic polypeptides derived from cereals and bitter compounds from hops.Indeed, yeast is a nuisance to foam (with the exception of its role in developing car-bonation).4 Foaming in the fermenter tends to remove surface-active materials; shorterchain fatty acids released by yeast are foam negative, as too is ethanol itself, and ailingyeast releases proteolytic enzymes that cut away at foaming proteins.4 The most seri-ous episodes of gushing can be directly linked to malt and, in turn, to infected grain.5
The majority of food safety issues have been linked to wort components,6 althoughequally the wholesome materials (other than alcohol) such as vitamins, silicate, fibreand polyphenols emerge from the wort.7 Finally, a good proportion of the flavourcomes from the wort, whether malt8 or hop derived.9
Therefore, regarding the impact of wort on beer quality through the mediacy ofyeast, beyond the production of ethanol and carbon dioxide, the primary concern iswith matters of flavour (leaving aside considerations of the health of the yeast col-lected at the end of fermentation and its relationship to the wort that it has just beentackling). The spectrum of flavour-active materials produced by yeast depends on themedium in which it is growing, both via that medium’s impact on the extent of yeastgrowth and on the metabolic fluxes within the yeast, and also because yeast will con-vert some materials in the medium directly to flavoursome materials (e.g. dimethylsulfoxide10). Equally, there may be components in the wort that block these changestaking place (in this specific example, methionine sulfoxide11). Finally, there can bematerials present in this medium that influence a yeast’s physical behaviour (e.g. floc-culation12) and this will impact on its ability to ferment.
As this chapter is part of a book on yeast, it will focus on the wort–yeast interface,leaving aside consideration of the direct impact of wort on beer quality.
7.3 The key components of wort
The general state of knowledge of the key ingredients of wort as they pertain to yeastperformance is well understood and was succinctly summarised by John Hammond in
78 BREWING YEAST FERMENTATION PERFORMANCE
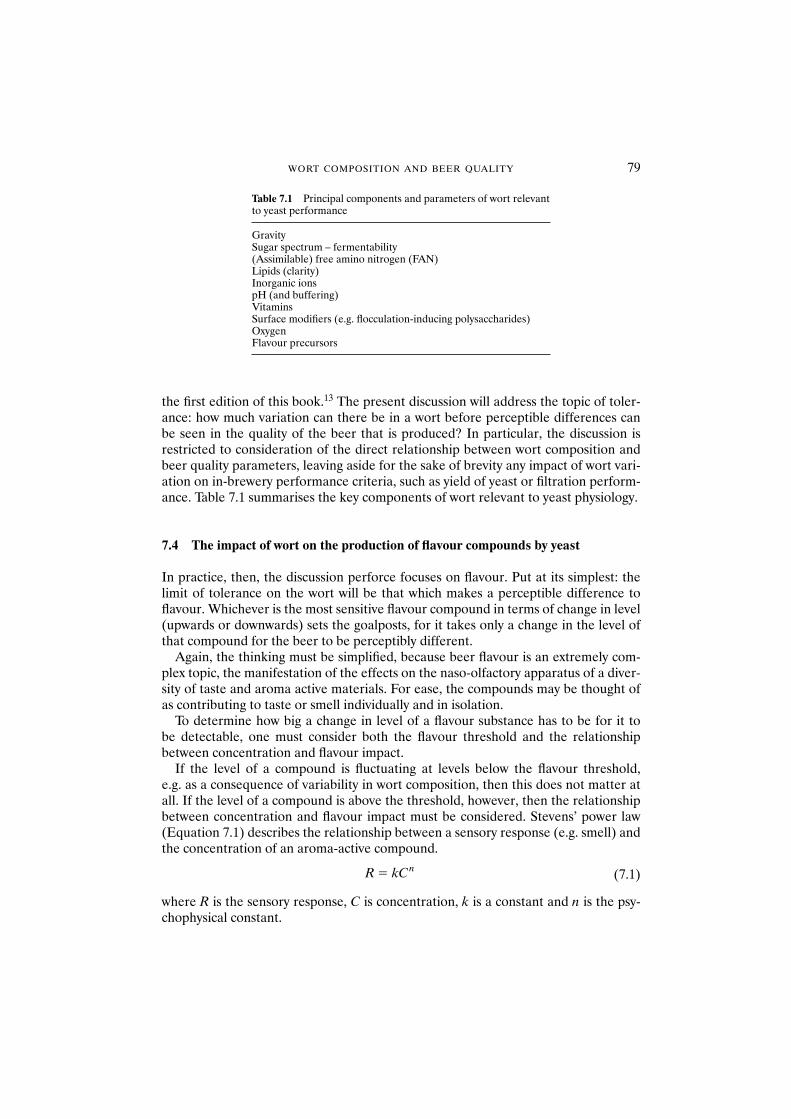
the first edition of this book.13 The present discussion will address the topic of toler-ance: how much variation can there be in a wort before perceptible differences can be seen in the quality of the beer that is produced? In particular, the discussion isrestricted to consideration of the direct relationship between wort composition andbeer quality parameters, leaving aside for the sake of brevity any impact of wort vari-ation on in-brewery performance criteria, such as yield of yeast or filtration perform-ance. Table 7.1 summarises the key components of wort relevant to yeast physiology.
7.4 The impact of wort on the production of flavour compounds by yeast
In practice, then, the discussion perforce focuses on flavour. Put at its simplest: thelimit of tolerance on the wort will be that which makes a perceptible difference toflavour. Whichever is the most sensitive flavour compound in terms of change in level(upwards or downwards) sets the goalposts, for it takes only a change in the level ofthat compound for the beer to be perceptibly different.
Again, the thinking must be simplified, because beer flavour is an extremely com-plex topic, the manifestation of the effects on the naso-olfactory apparatus of a diver-sity of taste and aroma active materials. For ease, the compounds may be thought ofas contributing to taste or smell individually and in isolation.
To determine how big a change in level of a flavour substance has to be for it to be detectable, one must consider both the flavour threshold and the relationshipbetween concentration and flavour impact.
If the level of a compound is fluctuating at levels below the flavour threshold, e.g. as a consequence of variability in wort composition, then this does not matter atall. If the level of a compound is above the threshold, however, then the relationshipbetween concentration and flavour impact must be considered. Stevens’ power law(Equation 7.1) describes the relationship between a sensory response (e.g. smell) andthe concentration of an aroma-active compound.
(7.1)
where R is the sensory response, C is concentration, k is a constant and n is the psy-chophysical constant.
R kCn�
WORT COMPOSITION AND BEER QUALITY 79
Table 7.1 Principal components and parameters of wort relevant to yeast performance
GravitySugar spectrum – fermentability(Assimilable) free amino nitrogen (FAN)Lipids (clarity)Inorganic ionspH (and buffering)VitaminsSurface modifiers (e.g. flocculation-inducing polysaccharides)OxygenFlavour precursors
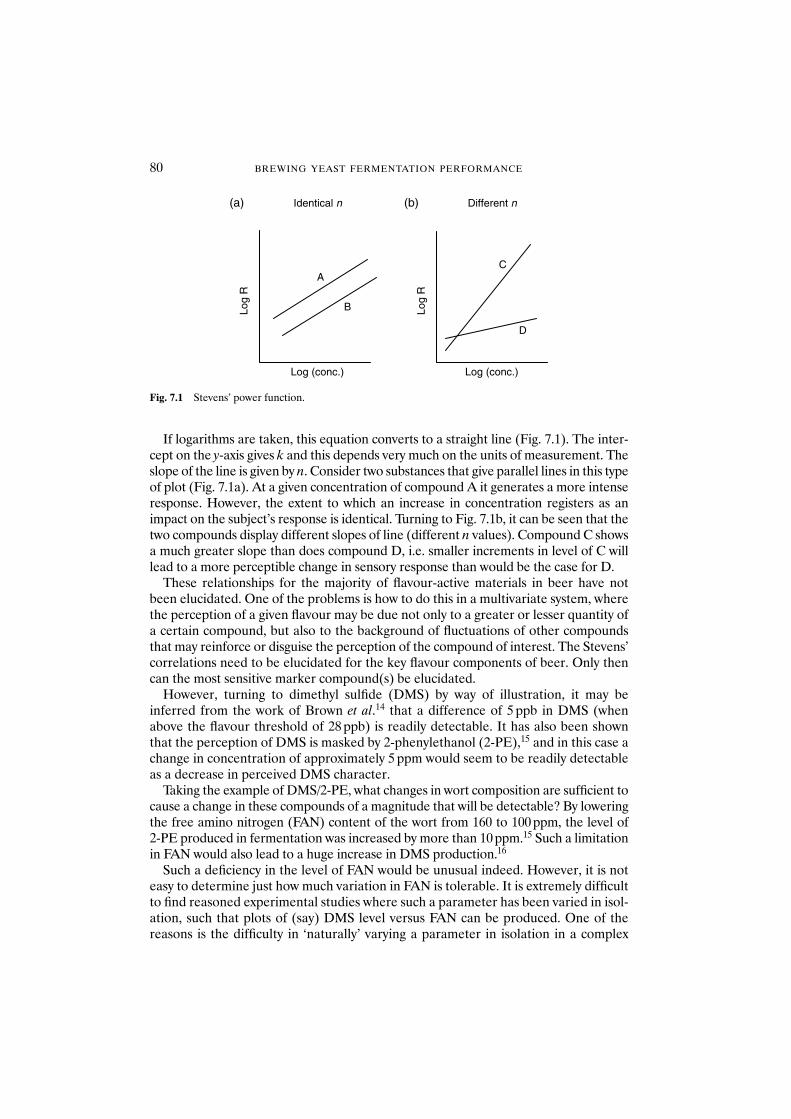
If logarithms are taken, this equation converts to a straight line (Fig. 7.1). The inter-cept on the y-axis gives k and this depends very much on the units of measurement. Theslope of the line is given by n. Consider two substances that give parallel lines in this typeof plot (Fig. 7.1a). At a given concentration of compound A it generates a more intenseresponse. However, the extent to which an increase in concentration registers as animpact on the subject’s response is identical. Turning to Fig. 7.1b, it can be seen that thetwo compounds display different slopes of line (different n values). Compound C showsa much greater slope than does compound D, i.e. smaller increments in level of C willlead to a more perceptible change in sensory response than would be the case for D.
These relationships for the majority of flavour-active materials in beer have notbeen elucidated. One of the problems is how to do this in a multivariate system, wherethe perception of a given flavour may be due not only to a greater or lesser quantity ofa certain compound, but also to the background of fluctuations of other compoundsthat may reinforce or disguise the perception of the compound of interest. The Stevens’correlations need to be elucidated for the key flavour components of beer. Only thencan the most sensitive marker compound(s) be elucidated.
However, turning to dimethyl sulfide (DMS) by way of illustration, it may beinferred from the work of Brown et al.14 that a difference of 5 ppb in DMS (whenabove the flavour threshold of 28 ppb) is readily detectable. It has also been shownthat the perception of DMS is masked by 2-phenylethanol (2-PE),15 and in this case achange in concentration of approximately 5 ppm would seem to be readily detectableas a decrease in perceived DMS character.
Taking the example of DMS/2-PE, what changes in wort composition are sufficient tocause a change in these compounds of a magnitude that will be detectable? By loweringthe free amino nitrogen (FAN) content of the wort from 160 to 100 ppm, the level of 2-PE produced in fermentation was increased by more than 10 ppm.15 Such a limitationin FAN would also lead to a huge increase in DMS production.16
Such a deficiency in the level of FAN would be unusual indeed. However, it is noteasy to determine just how much variation in FAN is tolerable. It is extremely difficultto find reasoned experimental studies where such a parameter has been varied in isol-ation, such that plots of (say) DMS level versus FAN can be produced. One of the reasons is the difficulty in ‘naturally’ varying a parameter in isolation in a complex
80 BREWING YEAST FERMENTATION PERFORMANCE
Log
R
Log
R
(a) (b)
Log (conc.) Log (conc.)
A
B
C
D
Identical n Different n
Fig. 7.1 Stevens’ power function.
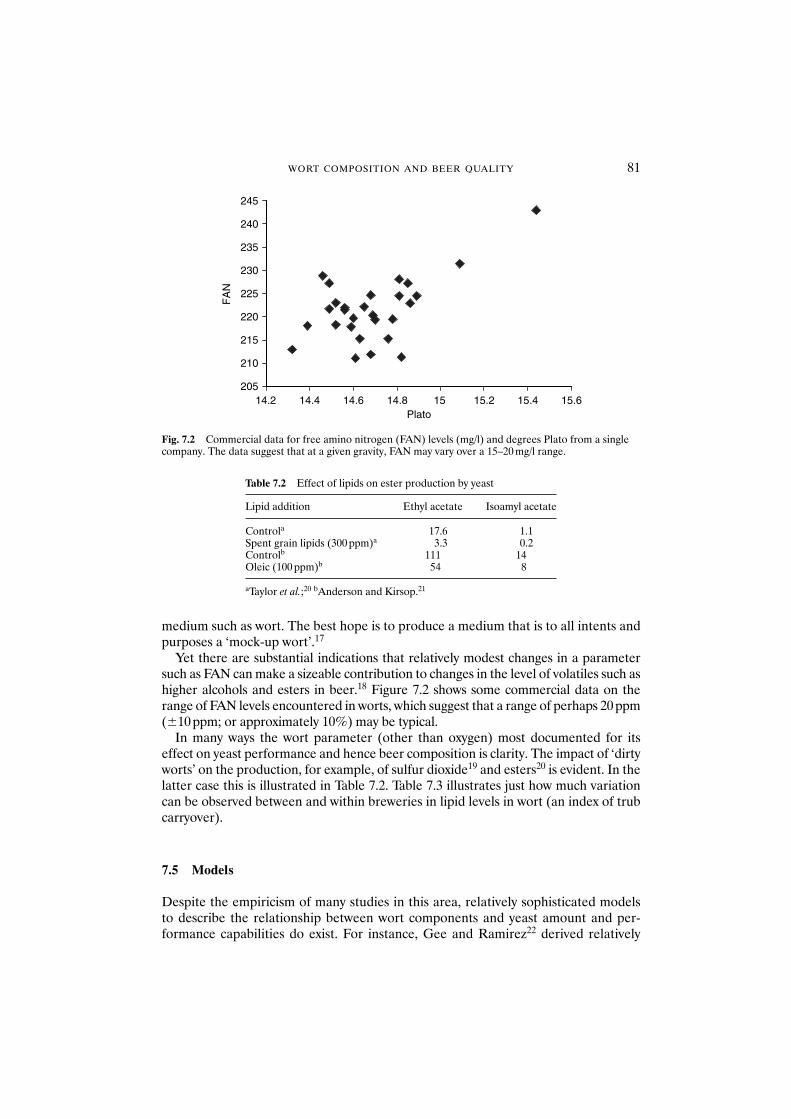
medium such as wort. The best hope is to produce a medium that is to all intents andpurposes a ‘mock-up wort’.17
Yet there are substantial indications that relatively modest changes in a parametersuch as FAN can make a sizeable contribution to changes in the level of volatiles such ashigher alcohols and esters in beer.18 Figure 7.2 shows some commercial data on therange of FAN levels encountered in worts, which suggest that a range of perhaps 20 ppm(�10 ppm; or approximately 10%) may be typical.
In many ways the wort parameter (other than oxygen) most documented for itseffect on yeast performance and hence beer composition is clarity. The impact of ‘dirtyworts’ on the production, for example, of sulfur dioxide19 and esters20 is evident. In thelatter case this is illustrated in Table 7.2. Table 7.3 illustrates just how much variationcan be observed between and within breweries in lipid levels in wort (an index of trubcarryover).
7.5 Models
Despite the empiricism of many studies in this area, relatively sophisticated models to describe the relationship between wort components and yeast amount and per-formance capabilities do exist. For instance, Gee and Ramirez22 derived relatively
WORT COMPOSITION AND BEER QUALITY 81
205
210
215
220
225
230
235
240
245
14.2 14.4 14.6 14.8 15 15.2 15.4 15.6Plato
FA
N
Fig. 7.2 Commercial data for free amino nitrogen (FAN) levels (mg/l) and degrees Plato from a singlecompany. The data suggest that at a given gravity, FAN may vary over a 15–20 mg/l range.
Table 7.2 Effect of lipids on ester production by yeast
Lipid addition Ethyl acetate Isoamyl acetate
Controla 17.6 1.1Spent grain lipids (300 ppm)a 3.3 0.2Controlb 111 14Oleic (100 ppm)b 54 8
aTaylor et al.;20 bAnderson and Kirsop.21
straightforward equations to explain the production of volatiles such as higher alcoholsand esters in brewery fermentations. Examples are given in Equations 7.2 and 7.3.
Formation of esters:
(7.2)
where IAc � concentration of isoamyl acetate, YIAc � yield coefficient, moles IAc /molesIA, �IA � specific rate of isoamyl alcohol formation, and X � yeast concentration.
It is apparent that the rate of production of an ester such as isoamyl acetate is inherentlydependent on the production of its precursor isoamyl alcohol (�IA), and on the yeast con-centration (X).
Formation of higher alcohols:
(7.3)
where IA � concentration of isoamyl alcohol, YIA/S � yield of isoamyl alcohol by syn-thetic pathway, YIA/E � yield of isoamyl alcohol by Ehrlich pathway, �x � specificyeast growth rate, X � yeast concentration, KI,L � inhibition constant for leucine,L � leucine concentration, and �L � specific rate of leucine uptake.
The production of isoamyl alcohols is affected by the rate of yeast growth (which will bedetermined by various factors) and by the presence of inhibitors that block the biosyn-thetic pathway.
It is apparent from these equations that relevant factors are the amount of yeast pres-ent and its condition and ability to grow (specific growth rate). The equations illustratehow the amount of ester is a direct consequence of the extent to which the precursorhigher alcohol is produced. Most importantly, the equations illustrate how levels ofindividual amino acids (such as leucine) are important because they inhibit the syn-thetic pathway of higher alcohol production. In other words, it is a matter of knowingnot only how much total FAN is present, but equally what is the balance of amino acids.
By inserting real-life numbers into this type of equation it is possible to gain someidea of the extent to which a change in the level of individual amino acids and of theother parameters influences the production of volatiles such as esters. There is a realneed for this type of model to be developed (probably using artificial worts of increasing
d[IA]
d
K
K IA /S
I,L
I,LIA /E L
tY X
LY Xx� �
�� �
d[IA
d c
IA IAc
]
tY X� �
82 BREWING YEAST FERMENTATION PERFORMANCE
Table 7.3 Variation in lipid content of commercial worts
Brewery Total lipids (C6 to C18:3) (ppm)
Median High Low
1 10.1 18.8 4.02 5.5 9.1 4.13 9.8 48.3 5.84 5.1 15.2 3.45 8.1 83.0 3.16 6.9 15.5 5.17 8.0 61.4 4.2
complexity) for all aspects of brewing yeast fermentations and for models to be testedin worts displaying natural variation.
The models ought also to take cognisance of the fact that the preferred wort com-position can differ for different yeasts and different generations of the same yeast. Thiswas well illustrated by Quilliam et al.,23 who showed that first generation yeast grown ina medium containing 190 mg/l FAN produced the same levels of ethyl acetate as sixthgeneration yeast presented with 280 mg/l FAN.
7.6 Sources of variability in wort composition
Wort composition may change as a result of variations in water composition, grist composition and brewhouse conditions. Assuming that the last of these variables iscontrolled (although variations in wort clarity beg the question of whether this is uni-versally the case), then it may be surmised that the main source of variation will bewater and grist. The former is more readily regulated, through water treatment proto-cols. Regarding the grist, it is likely that brewing syrups, produced from relatively purestarches by controlled enzymic and acid hydrolysis, will be more defined than malts.
The scenario with regard to the malt is complex. In the conversion of barley to sweetwort thought the mediacy of malting and mashing, a plethora of substrates, enzymicand non-enzymic reactions, specific and non-specific inhibitors and activators is atplay. Season upon season, variety by variety, changes occur in the relative balance ofsubstrates in the barley, in its physiological capabilities and therefore in its behaviourin malting and mashing. All that the maltster and brewer can hope to do is apply real-istic and meaningful specifications to barley and malt that can be responded to throughthe adjustment of processing conditions to obtain wort displaying the greatest practicalconsistency.24
There is no space here to discuss the wealth of knowledge concerning the biochem-istry and chemistry of breakdown of barley polymers and their conversion into wortcomponents. It is important to recognise, however, that new discoveries to add to analready complex body of received wisdom are coming to the fore regularly. Consider,for instance, the observations of Stenholm and Home that limit dextrinase is more heattolerant than was hitherto believed to be the case, and is particularly prevalent if themash pH is lowered, say to 5.4.25 The implication is that relatively subtle changes in pHcan have a substantial effect on fermentability and on the ratio of assimilable sugars toassimilable nitrogen. Most brewers would be comfortable with a pH range of 0.1 eitherside of the target, and yet that could have a profound impact on wort composition (andmore besides26).
Another area in which a large quantity of new data is emerging is that of proteindegradation. Work in Jones’ laboratory showed, inter alia, that there are more than 40 active proteolytic enzymes in malt,27 and moreover that these can variously beblocked by inhibitors originating in malt which, when released, suppress proteolysis in mashing.28 The extent to which all this varies between varieties, malts with differ-ent properties, under different mashing conditions, etc., has not been fully elucidated.Therefore, a clear picture of something as fundamental as the ranges that can beobserved in the balance of the various amino acids in malts and worts produced under
WORT COMPOSITION AND BEER QUALITY 83
different conditions is certainly not available, despite the obvious need for this information.
7.7 Conclusions
Much effort has been devoted in recent years to achieving fermentation control inbreweries. Through the introduction of robust pitching control systems and attentionto the viability and vitality of yeast, the yeast component is surely attended to suffi-ciently. In contrast, with the exception of control of oxygen, overall strength, absenceof starch and perhaps clarity, wort remains largely unspecified, other than perhapscoarse adjustments made on periodic checking of parameters such as free amino nitro-gen. While no brewer really questions the fact that yeast performance, both physicaland metabolic, is influenced hugely by the wort, the precise extent to which batch-to-batch and season-to-season variations in the wort impact on fermentation perform-ance and beer quality is uncertain. No wonder many brewers are now focusing in onthe magnitude and significance of variations in the major wort parameters. The mostfeasible way to tackle this may be to work with increasingly complex model wort sys-tems using yeasts with different characteristics (e.g. strain, age, size). This is a dauntingchallenge. However, the fact that brewers are already for the most part able to pro-duce beer of rather impressive consistency, without too much paranoia concerning thewort, suggests that the problem is not insurmountable.
Acknowledgements
I am very grateful to the commercial brewing companies who volunteered informa-tion for this study and am pleased to respect their anonymity.
References
1. Ertola, R.J., Giulietti, A.M. and Castillo, F.J. (1995) Design, formulation and optimization of media.In: Bireactor System Design, Asenjo, J.A. and Merchuk, J.C. (eds). Marcel Dekker, New York, pp. 89–137.
2. Smedley, S.M. (1992) Colour determination of beer using tristimulus values. J. Inst. Brew. 98, 497–504.3. Bamforth, C.W. (1999) Beer haze. J. Am. Soc. Brew. Chem. 57, 81–90.4. Bamforth, C.W. (1999) Bringing matters to a head: the status of research on beer foam. Proc. Eur. Brew.
Conv. Foam Symp. Amsterdam, pp. 10–23.5. Munar, M.J. and Sebree, B. (1997) Gushing – a maltster’s view. J. Am. Soc. Brew. Chem. 55, 119–122.6. Long, D.E. (1999) From cobalt to chloropropanol: de tribulationibus aptis cervisiis imbibendis. J. Inst.
Brew. 105, 79–84.7. Baxter, E.D. (1996) Beer is good for you – discuss. Brewer 92, 63–66.8. Moir, M. (1989) Effects of raw materials on flavour and aroma. Brew. Guardian 118(9), 64–71.9. Moir, M. (2000) Hops – a millennium review. J. Am. Soc. Brew. Chem. 58, 131–146.
10. Anness, B.J., Bamforth, C.W. and Wainwright, T. (1979) The measurement of dimethyl sulfoxide in barley and malt and its reduction to dimethyl sulfide by yeast. J. Inst. Brew. 85, 346–349.
11. Gibson, R.M., Large, P.J., Anness, B.J. and Bamforth, C.W. (1983) The identity of an inhibitor in wortof dimethyl sulfoxide reductase from yeast. J. Inst. Brew. 89, 215–218.
84 BREWING YEAST FERMENTATION PERFORMANCE
12. Herrera, V.E. and Axcell, B.C. (1991) Induction of premature yeast flocculation by a polysaccharidefraction isolated from malt husk. J. Inst. Brew. 97, 359–366.
13. Hammond, J. (2000) Yeast growth and nutrition. In: Brewing Yeast Fermentation Performance, Smart, K.(ed.). Blackwell Science, Oxford, pp. 77–85.
14. Brown, D.G.W., Clapperton, J.F., Meilgaard, M.C. and Moll, M. (1978) Flavor thresholds of added substances. J. Am. Soc. Brew. Chem. 36, 73–80.
15. Hegarty, P.K., Parsons, R., Bamforth, C.W. and Molzahn, S.W. (1995) Phenyl ethanol – a factor deter-mining lager character. Proc. Eur. Brew. Conv. Cong., Brussels, pp. 515–522.
16. Gibson, R.M., Large, P.J. and Bamforth, C.W. (1985) The influence of assimilable nitrogen compoundsin wort on the ability of yeast to reduce dimethyl sulfoxide. J. Inst. Brew. 91, 401–405.
17. Kennedy, A.I., Taidi, B., Dolan, J.L. and Holdgson, J.A. (1997) Optimisation of a fully defined mediumfor yeast fermentation studies. Food Technol. Biotechnol. 35, 261–265.
18. Äyräpää, T. (1967) Formation of higher alcohols from 14C-labelled valine and leucine. J. Inst. Brew. 73,17–33.
19. Dufour, J.-P., Carpentier, B., Kulakumba, M. et al. (1989) Alteration of SO2 production during fer-mentation. Proc. Eur. Brew. Conv. Cong. Zurich, pp. 331–338.
20. Taylor, G.T., Thurston, P.A. and Kirsop, B.H. (1979) The influence of lipids derived from malt spentgrains on yeast metabolism and fermentation. J. Inst. Brew. 85, 219–227.
21. Anderson, R.G. and Kirsop, B.H. (1974) The control of volatile ester synthesis during the fermentationof wort of high specific gravity. J. Inst. Brew. 80, 48–55.
22. Gee, D.A. and Ramirez, W.F. (1994) A flavour model for beer fermentation. J. Inst. Brew. 100, 321–329.23. Quilliam, W., Hulse, G. and Cameron-Clarke, A. (2000) Yeast management and fermentation per-
formance. In: Brewing Yeast Fermentation Performance, Smart, K. (ed.) Blackwell Science, Oxford, pp. 189–200.
24. Bamforth, C.W. (1999) A critical assessment of malt analysis from the brewer’s perspective. Tech. Q.Master Brew. Assoc. Am. 36, 301–306.
25. Stenholm, K. and Home, S. (1999) A new approach to limit dextrinase and its role in mashing. J. Inst.Brew. 105, 205–210.
26. Bamforth, C.W. (2001) pH in brewing: an overview. Tech. Q. Master Brew. Assoc. Am. 38, 1–8.27. Zhang, N.Y. and Jones, B.L. (1995) Characterisation of germinated barley endoproteolytic enzymes by
2-dimensional gel electrophoresis. J. Cereal Sci. 21, 145–153.28. Jones, B.L. and Marinac, L.A. (2000) Purification and partial characterisation of a second cysteine pro-
teinase inhibitor from ungerminated barley (Hordeum vulgare L.). J. Agric. Food Chem. 48, 257–264.
WORT COMPOSITION AND BEER QUALITY 85
8 Wort Substitutes and Yeast Nutrition
B. TAIDI, A.I. KENNEDY and J.A. HODGSON
Abstract Brewing research and the study of yeast physiology have always been hamperedby the batch-to-batch variation in the exact composition of wort. Wort production is a bio-chemical process, using biological material, naturally leading to variations in the exactchemical composition of wort.
Long-term fermentation and physiological studies require the formulation of defined orsemi-defined media that mimic wort in their nutritional composition. Any ‘artificial wort’would require reproducibility of recipe and similarity of composition to brewing wort,including carbohydrate and free amino nitrogen spectra. Unlike most physiological stud-ies where the medium composition is adjusted to provide balanced growth, wort is amedium that causes unbalanced and restricted growth of yeast. Any physiological studiesperformed in the context of brewing have to reflect this unbalanced composition.
Two media, one fully defined and one semi-defined, suitable for use as wort substitutesare discussed in light of yeast nutrition under brewing conditions. Some laboratory studiesperformed with these media are also outlined, as a demonstration of the potential appli-cation of these media.
8.1 Introduction
Brewing research and the study of yeast physiology have always been hampered by thevariation in the exact composition of wort. Wort production is a biochemical processusing biological materials and naturally leads to wort batches with variable compos-ition. Variations in wort composition originate from batch-to-batch variations in rawmaterials, time-related deterioration of the raw materials in storage and variations inprocess control during wort production.
Normally, all-malt wort can provide all of the nutrients required by brewing yeast,with the exception of unsaturated fatty acids, sterols and possibly zinc.1 Oxygenationof wort overcomes the deficiency of unsaturated fatty acid and sterols. Zinc sulfate isoften added to wort as a source of zinc ions. The major soluble components of wortare fermentable carbohydrates, amino acids, peptides, proteins, lipids, metal ions andnon-metal ions. Although some of these wort compounds can be measured with rela-tive ease, it is impractical to measure all the components of wort and hence it is notpossible to establish the differences between batches of wort. In addition, there aremany undefined insoluble and microscopic components in wort. This makes it diffi-cult to perform a long-term study of yeast physiology as the medium used would varyover the course of the investigation.
Any attempts to stabilise wort microbiologically will change its composition. Heatingprocesses such as autoclaving or pasteurisation affect the mineral and vitamin levels,colour, carbohydrate composition and particle content of wort. Stabilisation throughsterile filtration would remove any particulate matter. In addition, filtration is onlypractical on a very small scale owing to rapid filter blockage. The particulate matter in
Brewing Yeast Fermentation Performance: Second edition
Edited by: KATHERINE SMART Copyright 0 Blackwell Science 2003
WORT SUBSTITUTES AND YEAST NUTRITION 87
wort (trub) is known to provide nutrients for yeast growth as well as physically increas-ing the rate of CO2 release.2 Particulate matter in wort generally increases the fermen-tation rate and trub concentration is highly variable between batches of wort.
Various ways of obtaining a constant or totally reproducible ‘wort’ have beenattempted. Large batches of wort have been dried, stored and reconstituted in smallamounts as required. Reconstitution of wort can be performed reproducibly, butwould not necessarily reflect the original composition of wort. Proteins and mineralscan precipitate during the drying process and do not necessarily redissolve upon recon-stitution with water. The process would also affect the pH and the buffering capacity ofthe wort. Storage of wort by freezing would have similar problems associated with it.
In terms of nutrition, yeast requires macronutrients such as fermentable carbohy-drates as a source of carbon, amino acids as a source of nitrogen, and oxygen to pro-vide a source of unsaturated fatty acids and sterols. Many micronutrients such asvitamins, non-metal ions such as phosphate and sulfate ions, and metal ions are alsorequired by yeast. Any artificial wort would have to reflect the concentration of thesemacronutrients and micronutrients. Preferably, the concentration of wort compon-ents should be reflected in terms of their bioavailability to yeast rather than their total concentration in wort. Many of the ions, for instance, are bound by naturalchelating agents in wort and are unavailable to the yeast.
In this paper, two ‘synthetic wort’ media are described. A fully defined medium3
was developed and tested against wort with ale and lager yeast strains. A semi-definedmedium4 is also described which was used to perform studies on ester formation.
8.2 Materials and methods
8.2.1 Materials
Bottom-fermenting ale and lager yeast strains currently used by Scottish CourageBrewing Ltd were chosen for this study. Lager or ale wort from full production scalewas used in the laboratory experiments. Bacto yeast nitrogen base without aminoacids (YNB w/o aa) and ammonium sulfate was obtained from Difco (0335-15-9)(UK). Amino acids, carbohydrates and other general laboratory reagents wereobtained from Sigma-Aldrich (UK).
Brewing syrup was obtained from brewing sites and had a carbohydrate compos-ition reflecting that of wort (Table 8.1). Corn steep liquor (CSL) was obtained as asample and had a free amino nitrogen (FAN) concentration of 30 g/l.
8.2.2 Fully defined medium
The fully defined medium was prepared by supplementing YNB w/o aa and ammo-nium sulfate with a mixture of fermentable sugars to give an initial gravity of 1055°.The ratio of the various carbohydrates (Table 8.2) was based on those found in brew-ery worts. The assimilable nitrogen was supplied as a mixture of amino acids andammonium sulfate (Table 8.3), resulting in an FAN concentration of 153 mg/l in thedefined medium. The medium was further supplemented with 0.625 g/l citric acid and
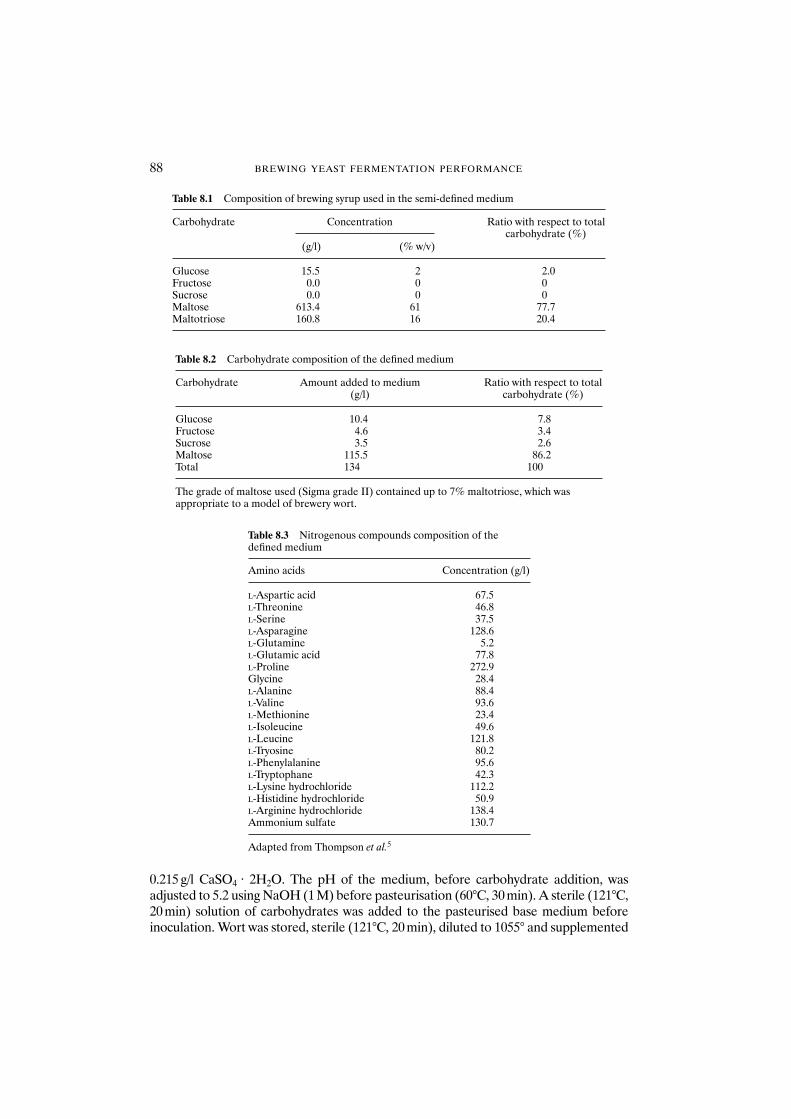
88 BREWING YEAST FERMENTATION PERFORMANCE
0.215 g/l CaSO4 · 2H2O. The pH of the medium, before carbohydrate addition, wasadjusted to 5.2 using NaOH (1 M) before pasteurisation (60°C, 30 min). A sterile (121°C,20 min) solution of carbohydrates was added to the pasteurised base medium beforeinoculation. Wort was stored, sterile (121°C, 20 min), diluted to 1055° and supplemented
Table 8.1 Composition of brewing syrup used in the semi-defined medium
Carbohydrate Concentration Ratio with respect to total
(g/l) (% w/v)carbohydrate (%)
Glucose 15.5 2 2.0Fructose 0.0 0 0Sucrose 0.0 0 0Maltose 613.4 61 77.7Maltotriose 160.8 16 20.4
Table 8.2 Carbohydrate composition of the defined medium
Carbohydrate Amount added to medium Ratio with respect to total (g/l) carbohydrate (%)
Glucose 10.4 7.8Fructose 4.6 3.4Sucrose 3.5 2.6Maltose 115.5 86.2Total 134 100
The grade of maltose used (Sigma grade II) contained up to 7% maltotriose, which wasappropriate to a model of brewery wort.
Table 8.3 Nitrogenous compounds composition of thedefined medium
Amino acids Concentration (g/l)
L-Aspartic acid 67.5L-Threonine 46.8L-Serine 37.5L-Asparagine 128.6L-Glutamine 5.2L-Glutamic acid 77.8L-Proline 272.9Glycine 28.4L-Alanine 88.4L-Valine 93.6L-Methionine 23.4L-Isoleucine 49.6L-Leucine 121.8L-Tryosine 80.2L-Phenylalanine 95.6L-Tryptophane 42.3L-Lysine hydrochloride 112.2L-Histidine hydrochloride 50.9L-Arginine hydrochloride 138.4Ammonium sulfate 130.7
Adapted from Thompson et al.5
with ZnSO4 · 7H2O (0.7 mg/l) before use. Both defined medium and wort wereaerated (sterile air, 20 min) through gas distribution tubes before inoculation.
Fermentations were carried out using EBC tubes [Institute of Brewing (IOB)Methods of Analysis]. The inoculation rates for both lager and ale yeast strains were2.0 � 107 viable cells/ml. Ale fermentations were carried out at 20°C and lagerfermentations at 15°C, both followed by chilling to 4°C to separate the yeast.Fermentations were carried out in triplicate.
For shake-flask cultures, YNB w/o aa containing ammonium phosphate (3.31 g/l),citric acid (4.20 g/l) and calcium sulfate (0.22 g/l) was prepared in concentrated formwithout a carbon source. The pH of the media was adjusted to 6.0 before filter-sterilisation into sterile conical flasks (250 ml). Carbohydrate solutions of glucose, mal-tose or fructose were sterilised (121°C, 20 min) and mixed with the contents of the flasksat the appropriate concentrations to a total volume of 100 ml. The total assimilablenitrogen content of the medium was 1.76 g N/l. The flasks were inoculated with 1 � 106
cells/ml of a production lager strain and incubated at 27°C on a shaker (200 rpm).
8.2.3 Semi-defined medium
The medium was prepared by mixing the appropriate amounts of brewing syrup, tapwater and CSL. CSL contains organic acids, of which lactic acid is the major compon-ent. The lactic acid was partially removed by adjusting the pH of the medium to 5.5 by the addition of CaCO3. The medium was then autoclaved, cooled to 4°C, allowedto settle overnight and decanted to remove the calcium lactate precipitate. Bufferingof the medium was provided by the addition of citric acid (1.0 g/l) and adjusting thepH to 5.2 using NaOH.
Fermentations were performed in duplicate at 1 litre scale in a model system con-sisting of 1 litre measuring cylinders fitted with rubber bungs and a one-way valve toallow escape of CO2 gas from the fermentations. These 1 litre tall tubes were ster-ilised by autoclaving (121°C, 15 min) before, the addition of medium. The fermenta-tion temperature was a constant 15°C. A production lager strain of yeast at a pitchingrate of 5.5 g/l was used. The yeast was acid-washed before pitching. Once target pres-ent gravity (PG) had been reached the fermentations were chilled to 4°C to allowyeast settlement and sample processing.
8.2.4 Analytical methods
Samples were withdrawn periodically from fermentations for immediate yeast cellconcentration and viability determination (IOB Methods of Analysis). The clarifiedsupernatants (2000 g, 10 min) of these samples were used for specific gravity and pHmeasurements. The specific gravity of samples was measured using a DMA 55 calcu-lating density meter (Anton Paar, UK). A pH probe (Orion) was used for pH meas-urement. End-of-fermentation samples, free of the bulk of the yeast population, werestored at 4°C until analysed for headspace components and total vicinal diketones(TVD). Samples for FAN analysis were stored at �18°C. Carbohydrates were meas-ured by high-performance liquid chromatography (HPLC), and volatile headspacecomponents and TVD (diacetyl and 2,3-pentanedione) by headspace gas injection gas
WORT SUBSTITUTES AND YEAST NUTRITION 89
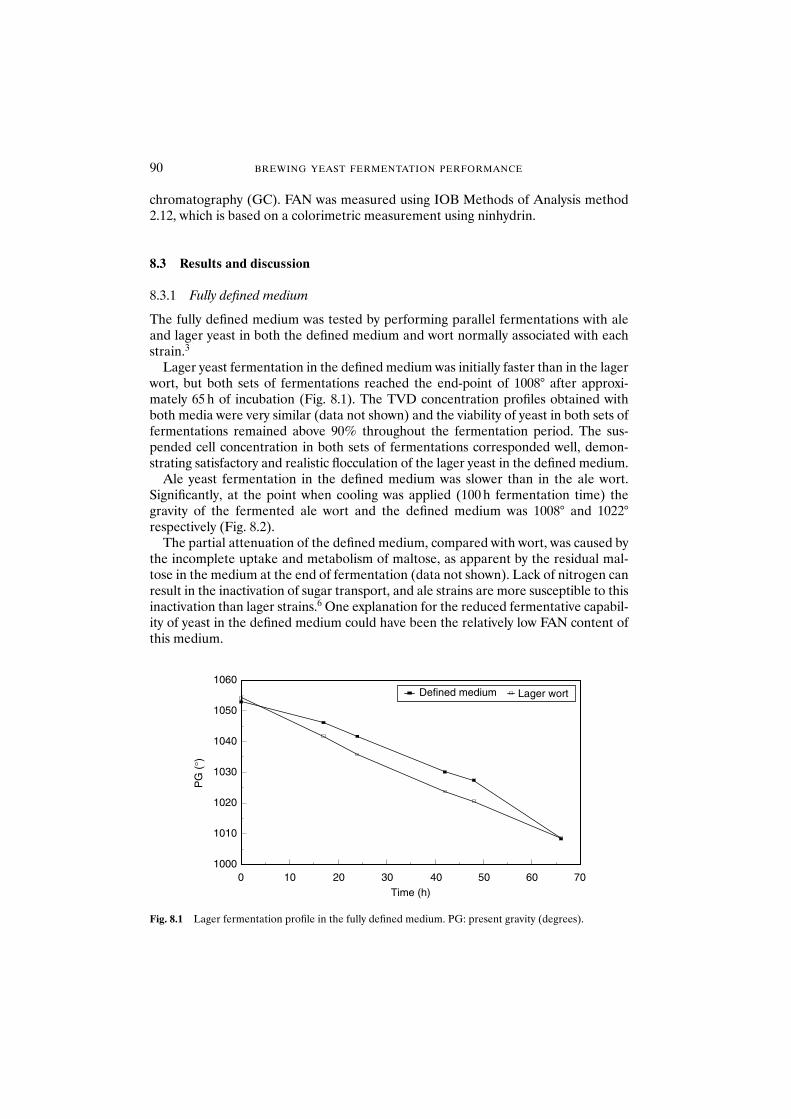
90 BREWING YEAST FERMENTATION PERFORMANCE
chromatography (GC). FAN was measured using IOB Methods of Analysis method2.12, which is based on a colorimetric measurement using ninhydrin.
8.3 Results and discussion
8.3.1 Fully defined medium
The fully defined medium was tested by performing parallel fermentations with aleand lager yeast in both the defined medium and wort normally associated with eachstrain.3
Lager yeast fermentation in the defined medium was initially faster than in the lagerwort, but both sets of fermentations reached the end-point of 1008° after approxi-mately 65 h of incubation (Fig. 8.1). The TVD concentration profiles obtained withboth media were very similar (data not shown) and the viability of yeast in both sets offermentations remained above 90% throughout the fermentation period. The sus-pended cell concentration in both sets of fermentations corresponded well, demon-strating satisfactory and realistic flocculation of the lager yeast in the defined medium.
Ale yeast fermentation in the defined medium was slower than in the ale wort.Significantly, at the point when cooling was applied (100 h fermentation time) thegravity of the fermented ale wort and the defined medium was 1008° and 1022°respectively (Fig. 8.2).
The partial attenuation of the defined medium, compared with wort, was caused bythe incomplete uptake and metabolism of maltose, as apparent by the residual mal-tose in the medium at the end of fermentation (data not shown). Lack of nitrogen canresult in the inactivation of sugar transport, and ale strains are more susceptible to thisinactivation than lager strains.6 One explanation for the reduced fermentative capabil-ity of yeast in the defined medium could have been the relatively low FAN content ofthis medium.
0 10 20 30 40 50 60 70Time (h)
1000
1010
1020
1030
1040
1050
1060
PG
(°)
Defined medium Lager wort
Fig. 8.1 Lager fermentation profile in the fully defined medium. PG: present gravity (degrees).
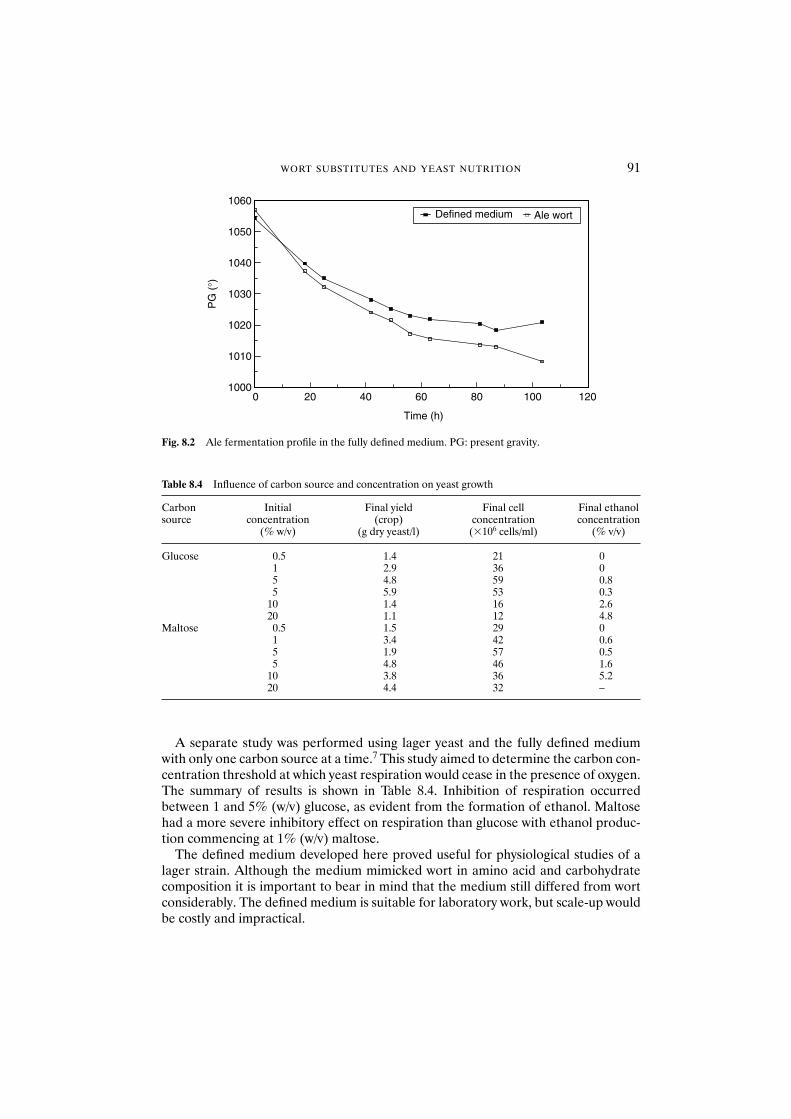
WORT SUBSTITUTES AND YEAST NUTRITION 91
A separate study was performed using lager yeast and the fully defined mediumwith only one carbon source at a time.7 This study aimed to determine the carbon con-centration threshold at which yeast respiration would cease in the presence of oxygen.The summary of results is shown in Table 8.4. Inhibition of respiration occurredbetween 1 and 5% (w/v) glucose, as evident from the formation of ethanol. Maltosehad a more severe inhibitory effect on respiration than glucose with ethanol produc-tion commencing at 1% (w/v) maltose.
The defined medium developed here proved useful for physiological studies of alager strain. Although the medium mimicked wort in amino acid and carbohydratecomposition it is important to bear in mind that the medium still differed from wortconsiderably. The defined medium is suitable for laboratory work, but scale-up wouldbe costly and impractical.
1000
1010
1020
1030
1040
1050
1060
0 20 40 60 80 100 120
Time (h)
PG
(°)
Defined medium Ale wort
Fig. 8.2 Ale fermentation profile in the fully defined medium. PG: present gravity.
Table 8.4 Influence of carbon source and concentration on yeast growth
Carbon Initial Final yield Final cell Final ethanol source concentration (crop) concentration concentration
(% w/v) (g dry yeast/l) (�106 cells/ml) (% v/v)
Glucose 0.5 1.4 21 01 2.9 36 05 4.8 59 0.85 5.9 53 0.3
10 1.4 16 2.620 1.1 12 4.8
Maltose 0.5 1.5 29 01 3.4 42 0.65 1.9 57 0.55 4.8 46 1.6
10 3.8 36 5.220 4.4 32 –

92 BREWING YEAST FERMENTATION PERFORMANCE
8.3.2 Semi-defined medium
A semi-defined medium was developed which was cheap and relatively easy to pro-duce in large batches using brewery equipment.4 The intention was to produce a semi-defined medium that could be used in scale-up experiments even at pilot scale.Extensive medium development was performed before the semi-defined formulationwas finally reached. As well as CSL, sugar molasses, a combination of CSL and sugarmolasses, yeast extract and a number of commercially available yeast foods weretested for their suitability as nutritional supplements. These experiments all demon-strated CSL to be the best supplement in terms of resulting in the fastest fermentationrates (data not shown).
A general problem encountered during medium development was the low buffer-ing capacity of media composed chiefly of brewing syrup and water (data not shown).The supplements often also lacked buffering capacity and did not provide pH stabil-isation for the medium. CSL, with a typical pH of approximately 2, contains lactic acidand other organic acids. Although lactic acid is a component of some German worts,in this study the removal of lactic acid was desired. Following the removal of lacticacid, buffering was provided with the addition of a small (1.0 g/l) amount of citric acidand adjustment of the pH to 5.2 with NaOH.
The medium formulated as a result of the above experiments was used to investi-gate the independent relationship of wort original gravity (OG) and FAN concentra-tion on ester production by a production lager strain. Fermentations were performedin duplicate, as outlined in Table 8.5.
The average PG profiles of the fermentations are shown in Fig. 8.3. Fermentationsat higher OG values took longer to reach completion than those starting at a lowerOG. Fermentations with higher FAN concentrations reached completion sooner. Thecombined effect of FAN and OG was that fermentations with the lower OG andhigher FAN concentrations were faster than those with high OG and low PG. The fer-mentations were chilled after they reached target PG, except for the fermentationwith an OG of 1050° and a FAN concentration of 180 mg/l, which was stopped beforereaching target PG because of time constraints.
The fermented wort was analysed for n-propanol, phenylethylalcohol, iso-butanol, isoamylalcohol, total higher alcohols, phenylethylacetate, isoamylacetate,
Table 8.5 Experimental set-up for studying the relationship ofwort original gravity (OG) and free amino nitrogen (FAN) concentration with production of volatiles
Fermentation OG FAN Volume of CSL added(°) (mg/l) (ml)
1, 2 1060 180 63, 4 1060 150 55, 6 1060 120 47, 8 1060 90 39, 10 1060 180 611, 12 1060 150 513, 14 1060 120 415, 16 1060 90 3
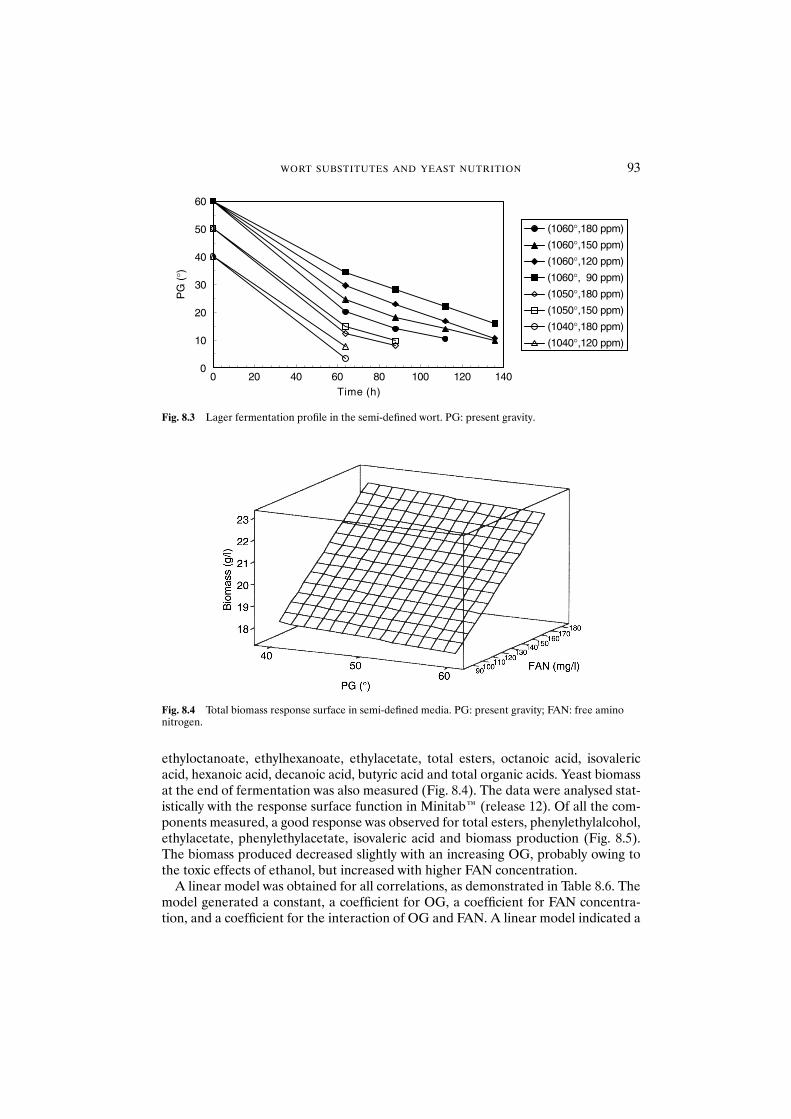
WORT SUBSTITUTES AND YEAST NUTRITION 93
ethyloctanoate, ethylhexanoate, ethylacetate, total esters, octanoic acid, isovalericacid, hexanoic acid, decanoic acid, butyric acid and total organic acids. Yeast biomassat the end of fermentation was also measured (Fig. 8.4). The data were analysed stat-istically with the response surface function in Minitab™ (release 12). Of all the com-ponents measured, a good response was observed for total esters, phenylethylalcohol,ethylacetate, phenylethylacetate, isovaleric acid and biomass production (Fig. 8.5).The biomass produced decreased slightly with an increasing OG, probably owing tothe toxic effects of ethanol, but increased with higher FAN concentration.
A linear model was obtained for all correlations, as demonstrated in Table 8.6. Themodel generated a constant, a coefficient for OG, a coefficient for FAN concentra-tion, and a coefficient for the interaction of OG and FAN. A linear model indicated a
0
10
20
30
40
50
60
0 20 40 60 80 100 120 140Time (h)
PG
(°)
(1060°,180 ppm)
(1060°,150 ppm)
(1060°,120 ppm)
(1060°, 90 ppm)
(1050°,180 ppm)
(1050°,150 ppm)
(1040°,180 ppm)
(1040°,120 ppm)
Fig. 8.3 Lager fermentation profile in the semi-defined wort. PG: present gravity.
Fig. 8.4 Total biomass response surface in semi-defined media. PG: present gravity; FAN: free aminonitrogen.
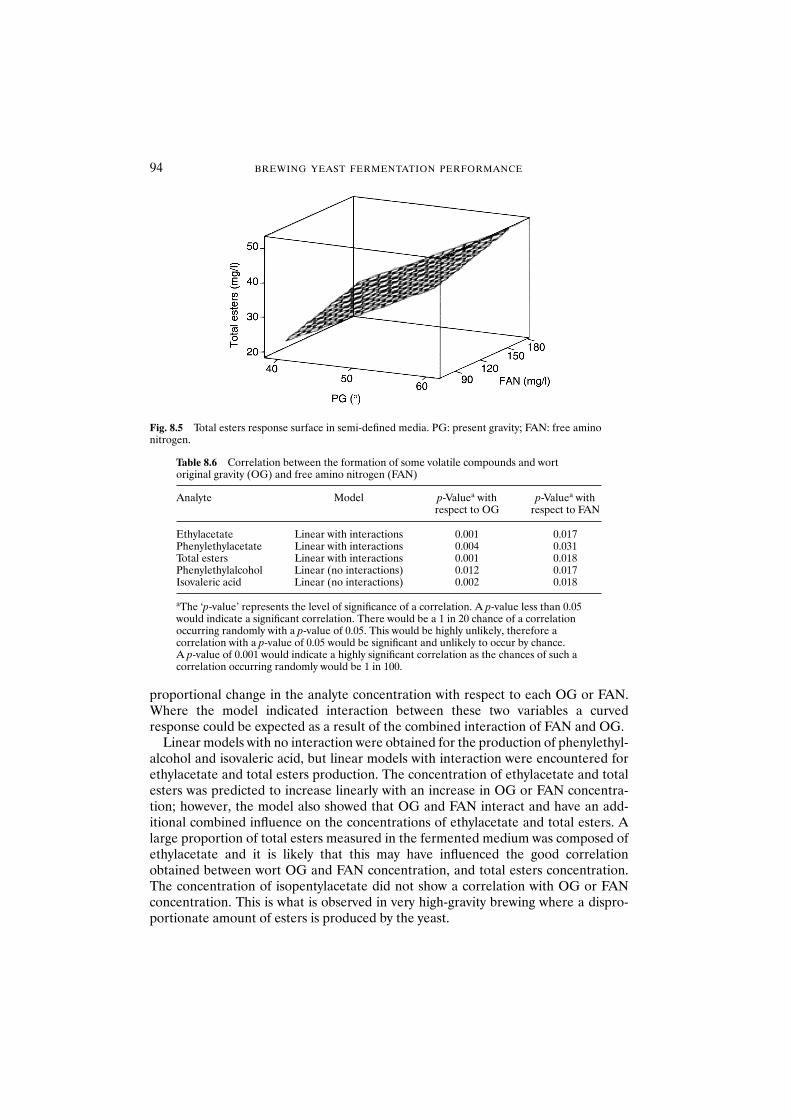
94 BREWING YEAST FERMENTATION PERFORMANCE
proportional change in the analyte concentration with respect to each OG or FAN.Where the model indicated interaction between these two variables a curvedresponse could be expected as a result of the combined interaction of FAN and OG.
Linear models with no interaction were obtained for the production of phenylethyl-alcohol and isovaleric acid, but linear models with interaction were encountered forethylacetate and total esters production. The concentration of ethylacetate and totalesters was predicted to increase linearly with an increase in OG or FAN concentra-tion; however, the model also showed that OG and FAN interact and have an add-itional combined influence on the concentrations of ethylacetate and total esters. Alarge proportion of total esters measured in the fermented medium was composed ofethylacetate and it is likely that this may have influenced the good correlationobtained between wort OG and FAN concentration, and total esters concentration.The concentration of isopentylacetate did not show a correlation with OG or FANconcentration. This is what is observed in very high-gravity brewing where a dispro-portionate amount of esters is produced by the yeast.
Fig. 8.5 Total esters response surface in semi-defined media. PG: present gravity; FAN: free aminonitrogen.
Table 8.6 Correlation between the formation of some volatile compounds and wort original gravity (OG) and free amino nitrogen (FAN)
Analyte Model p-Valuea with p-Valuea with respect to OG respect to FAN
Ethylacetate Linear with interactions 0.001 0.017Phenylethylacetate Linear with interactions 0.004 0.031Total esters Linear with interactions 0.001 0.018Phenylethylalcohol Linear (no interactions) 0.012 0.017Isovaleric acid Linear (no interactions) 0.002 0.018
aThe ‘p-value’ represents the level of significance of a correlation. A p-value less than 0.05would indicate a significant correlation. There would be a 1 in 20 chance of a correlationoccurring randomly with a p-value of 0.05. This would be highly unlikely, therefore a correlation with a p-value of 0.05 would be significant and unlikely to occur by chance. A p-value of 0.001 would indicate a highly significant correlation as the chances of such a correlation occurring randomly would be 1 in 100.
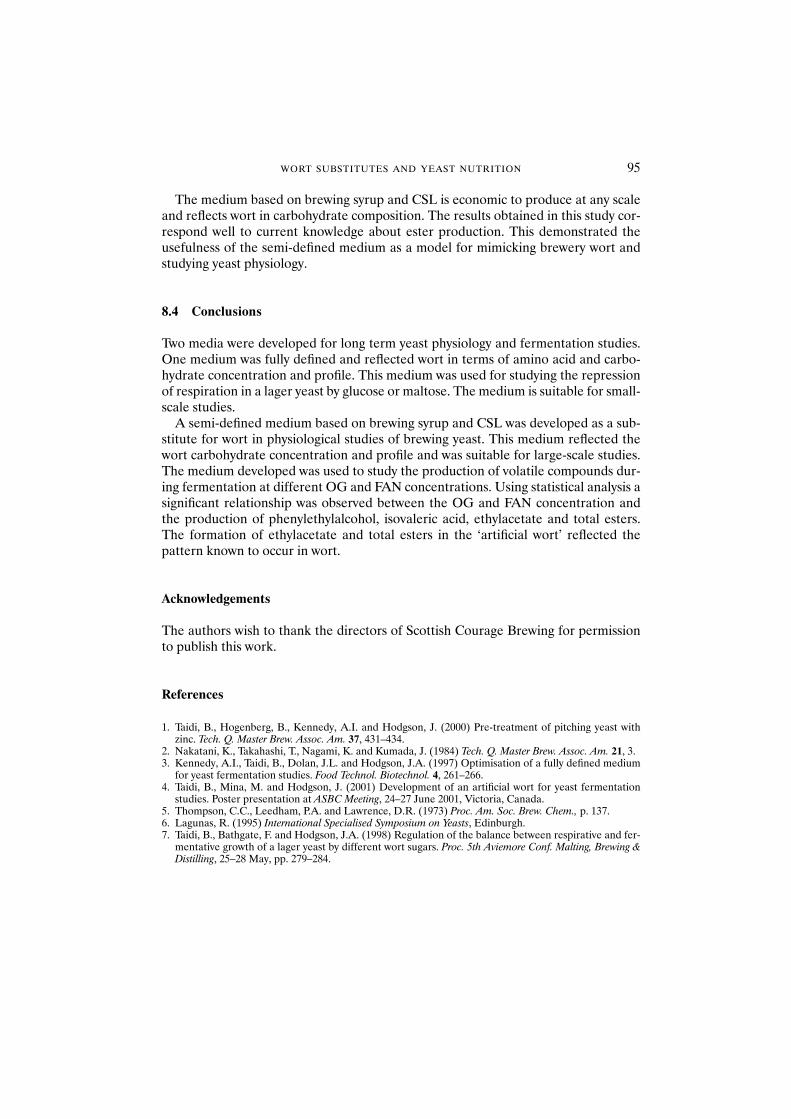
WORT SUBSTITUTES AND YEAST NUTRITION 95
The medium based on brewing syrup and CSL is economic to produce at any scaleand reflects wort in carbohydrate composition. The results obtained in this study cor-respond well to current knowledge about ester production. This demonstrated theusefulness of the semi-defined medium as a model for mimicking brewery wort andstudying yeast physiology.
8.4 Conclusions
Two media were developed for long term yeast physiology and fermentation studies.One medium was fully defined and reflected wort in terms of amino acid and carbo-hydrate concentration and profile. This medium was used for studying the repressionof respiration in a lager yeast by glucose or maltose. The medium is suitable for small-scale studies.
A semi-defined medium based on brewing syrup and CSL was developed as a sub-stitute for wort in physiological studies of brewing yeast. This medium reflected thewort carbohydrate concentration and profile and was suitable for large-scale studies.The medium developed was used to study the production of volatile compounds dur-ing fermentation at different OG and FAN concentrations. Using statistical analysis asignificant relationship was observed between the OG and FAN concentration andthe production of phenylethylalcohol, isovaleric acid, ethylacetate and total esters.The formation of ethylacetate and total esters in the ‘artificial wort’ reflected the pattern known to occur in wort.
Acknowledgements
The authors wish to thank the directors of Scottish Courage Brewing for permissionto publish this work.
References
1. Taidi, B., Hogenberg, B., Kennedy, A.I. and Hodgson, J. (2000) Pre-treatment of pitching yeast withzinc. Tech. Q. Master Brew. Assoc. Am. 37, 431–434.
2. Nakatani, K., Takahashi, T., Nagami, K. and Kumada, J. (1984) Tech. Q. Master Brew. Assoc. Am. 21, 3.3. Kennedy, A.I., Taidi, B., Dolan, J.L. and Hodgson, J.A. (1997) Optimisation of a fully defined medium
for yeast fermentation studies. Food Technol. Biotechnol. 4, 261–266.4. Taidi, B., Mina, M. and Hodgson, J. (2001) Development of an artificial wort for yeast fermentation
studies. Poster presentation at ASBC Meeting, 24–27 June 2001, Victoria, Canada.5. Thompson, C.C., Leedham, P.A. and Lawrence, D.R. (1973) Proc. Am. Soc. Brew. Chem., p. 137.6. Lagunas, R. (1995) International Specialised Symposium on Yeasts, Edinburgh.7. Taidi, B., Bathgate, F. and Hodgson, J.A. (1998) Regulation of the balance between respirative and fer-
mentative growth of a lager yeast by different wort sugars. Proc. 5th Aviemore Conf. Malting, Brewing &Distilling, 25–28 May, pp. 279–284.
9 Wort Supplements: From Yeast and For Yeast
M. DILLEMANS, L. VAN NEDERVELDE and A. DEBOURG
Abstract Yeast performance and vitality are not constant parameters during successivefermentations, particularly on high-gravity wort. Indeed, yeast is exposed to many stresses,including osmotic, temperature and ethanol shocks. Nevertheless, if yeast has been able toadapt its metabolism to more stressful environmental conditions over the centuries, it mustcontain some factors allowing resistance to stress.
A novel yeast peptide complex (YPC) was partially purified from yeast. It stimulated thegrowth and fermentation power of brewing yeast and increased ethanol tolerance consid-erably. The addition of this factor to wort of original gravities of 12–24° Plato enabled anincrease in fermentation rate and ethanol production. It also maintained the stability ofyeast performance during successive high-gravity wort fermentations.
YPC increased the energetic level by stimulating glucose metabolism. Indeed, the resultsindicate at least three ways in which the YPC controls glycolysis in yeast: it stimulated glucoseuptake, increased the intracellular concentration of fructose-2,6-biphosphate and increasedpyruvate decarboxylase activity. Moreover, the addition of YPC had a stimulatory effecton many enzymes, starting from the utilisation of pyruvate, the key intermediate in anabolicprocess, and other important metabolic enzymes such as citrate synthase, acetyl coenzyme Acarboxylase or ATPase.
The results also showed that YPC exhibited an insulin-mimetic activity not only on gly-colysis but also on overall metabolism, stimulating mitochondrial enzymes, confirming thecrucial role of mitochondrial energy-generating systems in the biosynthesis of cell materialand conferring resistance to stress under fermentation conditions. It has already beenestablished that the level of energy is an essential parameter for inducing resistance mech-anisms. Referring to results on fermentation power and yeast performance during successivehigh-gravity wort fermentations, it could be suggested that YPC would also improve yeastresistance to stress. Indeed, the results show that the yeast factor, when added to the culture,stimulated growth under all conditions and reduced considerably the effect of osmotic oralcoholic stress on yeast growth.
9.1 Introduction
An important development in current brewing technology is the fermentation of high-gravity worts and subsequent dilution to the desired product strength at the end offermentation. Although this method is the most cost-effective, it has a negative effecton yeast performance and vitality during successive fermentations.1,2
Yeast performance and vitality are not constant parameters during successivefermentations, particularly on high-gravity wort.1 Indeed, yeast is exposed to manystresses, including osmotic and ethanol shocks, that have a negative effect on yeastperformance.
Nevertheless, since yeast has been able to adapt its metabolism over centuries tomore stressed environmental conditions, the cell must contain some factors allowingresistance to stress. Indeed, for yeast, it has been demonstrated that, apart from heat,
Brewing Yeast Fermentation Performance: Second edition
Edited by: KATHERINE SMART Copyright 0 Blackwell Science 2003
WORT SUPPLEMENTS: FROM YEAST AND FOR YEAST 97
other stress agents can induce the synthesis of heat shock proteins that are a prerequis-ite for the development of stress tolerance by yeast.3
Recently, the first results have been presented concerning the partial purification ofa yeast factor (termed yeast peptide complex or YPC) that has a positive effect on yeastmetabolism. The purified fraction isolated from brewing yeast by a four-step procedurewas characterised as a low molecular weight water-soluble substance. Amino acid analy-sis revealed the presence of aspartic acid, glutamic acid, glycine and cysteine as the mainamino acids. Although aromatic compounds were not detected, some ultraviolet-absorbing (260 nm) chemical structure was shown to be present. Moreover, analysis byinductively coupled plasma (ICP) spectrometry indicated the presence of potassium[9 mg/g dry weight (DW)], phosphorous (1.1 mg/g DW) and sodium (0.4 mg/g DW).4
Previous work also indicated that YPC is able to stimulate the fermentation rate andimprove the attenuation of the wort, and that this influence persists during successivefermentations of high-gravity worts.4
Therefore, the aim of this chapter is to present the effects of this novel peptide factoron yeast metabolism and to summarise the molecular basis of YPC’s stimulating effectson yeast fermentation performance and resistance to stresses.
9.2 Materials and methods
9.2.1 Yeast strains
The strains used in this study were Saccharomyces cerevisiae ale strain no.391 and S. cerevisiae lager strain no.353 for the fermentation experiments, and laboratory strainYF for enzymic assays, all from the collection of the Department of Brewing Sciencesand Fermentation Technology of the Institut Meurice (Brussels, Belgium).
9.2.2 Fermentations
Fermentations were conducted in EBC tall tube fermentors. Industrial wort at 12° Platowas adjusted to 19° Plato with high-maltose corn syrup. The fermentations were carriedout in duplicate or triplicate at 12 or 21°C with lager and ale strains, respectively. The pitching rate was 7.5 g wet weight/l (2.8 �107 cell/ml) for the lager strain and 5 g wet weight/l (2 �107cell/ml) for the ale strain. In the series of consecutive fermentations,the yeast was collected at the end of the fermentation by centrifuging at 5000 rpm for2 min; the cropped yeast was just resuspended in fresh wort and used immediately topitch the next fermentation.
Samples were taken throughout the fermentations and analysed for the following:ethanol concentration by head-space gas chromatography; viability using the methyl-ene blue stain; wort gravity using the Anton Paar DMA46 densitometer and yeastgrowth by the measurement of optical density at 660 nm.
9.2.3 Measurement of glucose uptake
After 1.5 h of anaerobic incubation in potassium phosphate buffer with glucose in thepresence or absence of YPC, the reaction was started with the addition of a pulse of
tritiated 2-deoxyglucose (5 �Ci taken from a solution of 10.98 Ci/mmol). Samples(each 500 �l) were removed at specified time intervals during the first 12 min, filteredon a filter (Membranefilter 0.45 �m, 25 mm, Millipore) and washed with 30 ml of ice-cold water. The filters were added to scintillation liquid and radioactivity wasmonitored by a scintillation spectrometer (Packard).
9.2.4 Measurement of fructose-2,6-biphosphate
Samples of yeast incubated in glucose 27 mM phosphate buffer (with the necessarytested substances) were removed at specified time intervals during the first 3 h, filteredon a filter (Membranefilter 0.45 �m, 45 mm; Millipore), washed rapidly with 30 ml ofice-cold water, weighted and frozen in liquid nitrogen.
The extraction was done in 0.25 M Na2CO3 at 90°C as described by François et al.5
The fructose-2,6-biphosphate concentration was measured enzymically according toBergmeyer6 and related to the cell dry weight.
9.2.5 Acidification power test
Cells were grown in glucose minimal medium until the end of exponential phase, har-vested and resuspended in 0.5 M potassium phosphate buffer–glucose 1%, pH 6.4, for1 h with or without the addition of YPC (1 mg/ml). Washed cells were then resuspendedin water at 30°C for the determination of extracellular acidification. The external pHwas measured with an Orion pH-meter model 720 A. Before the addition of glucose(100 mM), the pH of the cell suspension, preincubated or not with specific substanceswas adjusted to about 7 and a baseline was established for 10 min. H� efflux from thecells after addition of glucose was measured for another 10 min at 30°C.
9.2.6 Determination of enzyme activities
Cells were grown to stationary phase on minimal glucose medium then harvested bycentrifugation, and washed with 0.1 M potassium phosphate buffer, pH 6.4. The yeastwas depleted of endogenous substrates by shaking in this buffer at room temperature for1 h. The cells (2 �107 cells/ml) were then centrifuged and resuspended in fresh buffercontaining glucose 27 mM in the presence of YPC (1 mg/ml). After 2 h of anaerobicincubation, the yeast suspension was centrifuged and the pellet was resuspended in0.5 M potassium phosphate buffer, pH 6.4, and crushed in a French pressure cell. Theextract was centrifuged at 12 000 rpm for 20 min and the supernatant was collected.
The different enzyme activities were measured according to methods described byDillemans et al.7
9.2.7 Measurement of glycerol
Cells were grown in glucose minimal medium until the end of exponential phase, har-vested and resuspended (cell density was 75 mg wet weight/ml) in glucose-minimalmedium and incubated anaerobically for 2 h with or without the two specific sub-stances YPC (1 mg/ml) and diacylglycerol (DAG, 0.4 mg/ml).
98 BREWING YEAST FERMENTATION PERFORMANCE
WORT SUPPLEMENTS: FROM YEAST AND FOR YEAST 99
Glycerol production was determined by high-performance liquid chromatography(HPLC) using a Waters 600E system equipped with a Waters 410 refractometer detector(34°C) and fitted with a Shodex Ionpack KC-810 P precolumn and two Shodex IonpackKC-811 columns (60°C). A solution of perchloric acid (2 ml 60%/l of milliQ water)was used as eluent at a flow rate of 0.6 ml/min.
9.2.8 Protein determination
The protein content of whole cells was assayed by a modified biuret method. A fresh10 ml sample of the culture (2–3 g dry weight/l) was centrifuged, and the yeast waswashed twice with distilled water and resuspended in 5 ml of water.
The concentrate was boiled in 1 M KOH for 10 min and then cooled on ice.CuSO4 � 5H2O was then added to a final concentration of 25 mM. After 5 min, themixture was centrifuged at 13 000 rpm in an Ependorf bench-top centrifuge for 2 minand the absorbance of the supernatant was read at 550 nm with bovine serum albuminas standard.
9.2.9 Lipid extraction
The washed cells (150–500 mg dry weight) were suspended in 5 ml 0.2 M KCl contain-ing 5 mM ethylenediaminetetra-acetate (EDTA), and the lipids extracted as follows.Cells were disrupted by three passages through the French press. The yeast extractobtained was then mixed with 20 ml chloroform–methanol (1:2, v/v). After extensivestirring, 6 ml chloroform and 6 ml 0.2 M KCl containing 5 mM EDTA were added. The resulting two phases were separated by centrifugation at 6000 rpm for 2 min.The lower chloroform phase was evaporated under nitrogen and the pellet was storedin a solution of hexane at �20°C until required. Free fatty acids and ergosterolwere analysed by gas chromatography using a Delsi Nermag DI 200 gas chromatographequipped with a flame ionisation detector (360°C) and fitted with a 30 m � 0.25 mminternal diameter WCOT fused silica 0.1 �m coating CP-Sil-5CB apolar capillarycolumn (Chrompack). Hydrogen was used as a carrier gas at a flow rate of 1.5 ml/minand the oven temperature programme used was 50°C, followed by an increase of10°C/min to 340°C and of 1°C/min to 360°C. This temperature was held for 10 min.
9.2.10 Glycogen determination
Cells collected by either centrifugation or membrane filtration were suspendedin 1 ml of Na2CO3 solution 0.25 M and heated for 90 min on a boiling water bath.After cooling, 0.2 ml of the well-mixed suspension was acidified with 3 M aceticacid, shifting the pH to 4.6–5.2, and the volume was made up to 1 ml with 0.2 M Na acetate buffer, pH 4.8. For enzymic hydrolysis of the glycogen, 10 �l of amylo-glucosidase (1.4 U) was added and the suspension was incubated for 2 h at 37°C. The samples were neutralised with buffered KOH (1 M triethanolamine–HCl:10 NKOH:1 M acetic acid, v/v/v 3:0.8:0.2) for glucose determination using Boehringer kitno.716 251.
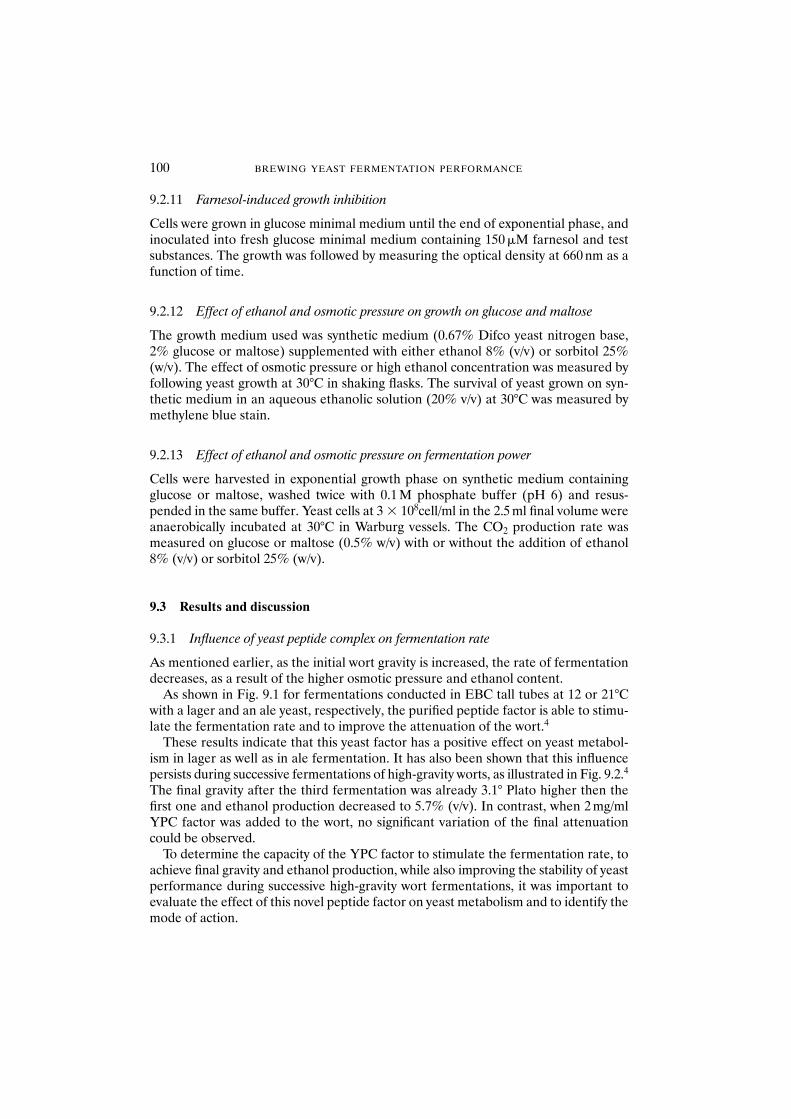
9.2.11 Farnesol-induced growth inhibition
Cells were grown in glucose minimal medium until the end of exponential phase, andinoculated into fresh glucose minimal medium containing 150 �M farnesol and testsubstances. The growth was followed by measuring the optical density at 660 nm as afunction of time.
9.2.12 Effect of ethanol and osmotic pressure on growth on glucose and maltose
The growth medium used was synthetic medium (0.67% Difco yeast nitrogen base,2% glucose or maltose) supplemented with either ethanol 8% (v/v) or sorbitol 25%(w/v). The effect of osmotic pressure or high ethanol concentration was measured byfollowing yeast growth at 30°C in shaking flasks. The survival of yeast grown on syn-thetic medium in an aqueous ethanolic solution (20% v/v) at 30°C was measured bymethylene blue stain.
9.2.13 Effect of ethanol and osmotic pressure on fermentation power
Cells were harvested in exponential growth phase on synthetic medium containingglucose or maltose, washed twice with 0.1 M phosphate buffer (pH 6) and resus-pended in the same buffer. Yeast cells at 3 � 108cell/ml in the 2.5 ml final volume wereanaerobically incubated at 30°C in Warburg vessels. The CO2 production rate wasmeasured on glucose or maltose (0.5% w/v) with or without the addition of ethanol8% (v/v) or sorbitol 25% (w/v).
9.3 Results and discussion
9.3.1 Influence of yeast peptide complex on fermentation rate
As mentioned earlier, as the initial wort gravity is increased, the rate of fermentationdecreases, as a result of the higher osmotic pressure and ethanol content.
As shown in Fig. 9.1 for fermentations conducted in EBC tall tubes at 12 or 21°Cwith a lager and an ale yeast, respectively, the purified peptide factor is able to stimu-late the fermentation rate and to improve the attenuation of the wort.4
These results indicate that this yeast factor has a positive effect on yeast metabol-ism in lager as well as in ale fermentation. It has also been shown that this influencepersists during successive fermentations of high-gravity worts, as illustrated in Fig. 9.2.4
The final gravity after the third fermentation was already 3.1° Plato higher then thefirst one and ethanol production decreased to 5.7% (v/v). In contrast, when 2 mg/mlYPC factor was added to the wort, no significant variation of the final attenuationcould be observed.
To determine the capacity of the YPC factor to stimulate the fermentation rate, toachieve final gravity and ethanol production, while also improving the stability of yeastperformance during successive high-gravity wort fermentations, it was important toevaluate the effect of this novel peptide factor on yeast metabolism and to identify themode of action.
100 BREWING YEAST FERMENTATION PERFORMANCE
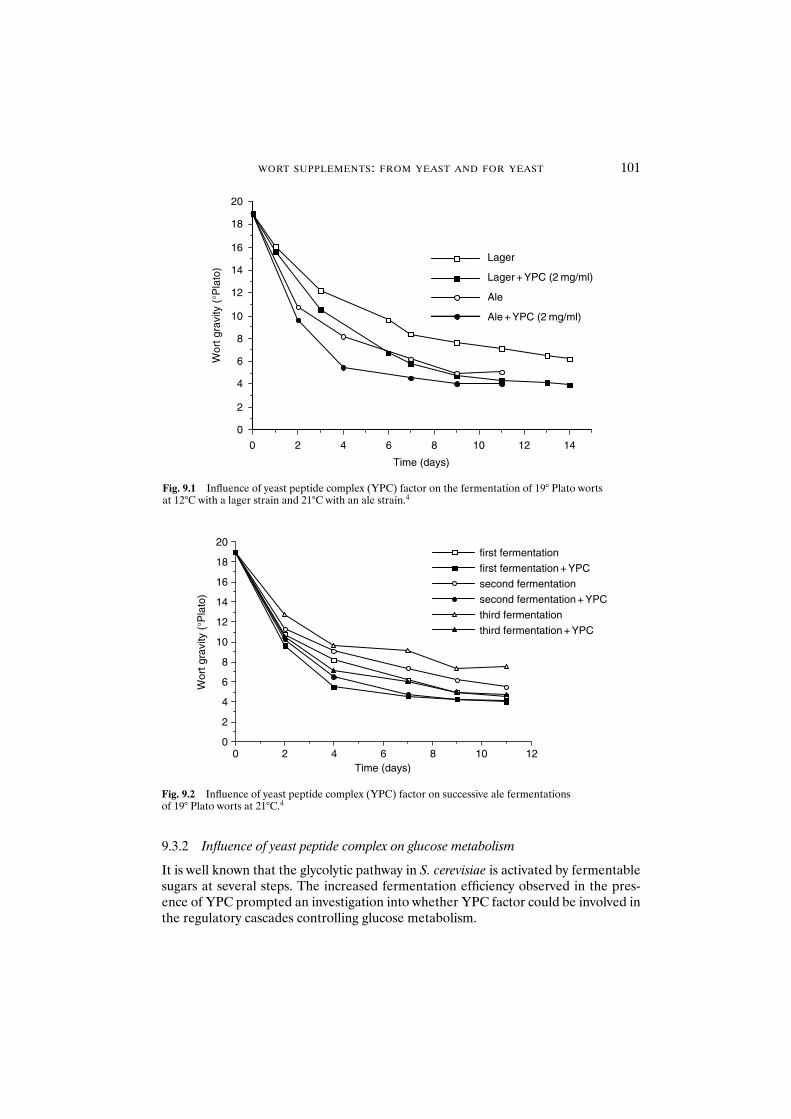
WORT SUPPLEMENTS: FROM YEAST AND FOR YEAST 101
9.3.2 Influence of yeast peptide complex on glucose metabolism
It is well known that the glycolytic pathway in S. cerevisiae is activated by fermentablesugars at several steps. The increased fermentation efficiency observed in the pres-ence of YPC prompted an investigation into whether YPC factor could be involved inthe regulatory cascades controlling glucose metabolism.
14121086420
0
2
4
6
8
10
12
14
16
18
20
Lager + YPC (2 mg/ml)
Lager
Ale
Ale + YPC (2 mg/ml)
Wor
t gra
vity
(°P
lato
)
Time (days)
Fig. 9.1 Influence of yeast peptide complex (YPC) factor on the fermentation of 19° Plato worts at 12°C with a lager strain and 21°C with an ale strain.4
1210864200
2
4
6
8
10
12
14
16
18
20first fermentation
first fermentation + YPC
second fermentation
second fermentation + YPC
third fermentation
third fermentation + YPC
Time (days)
Wor
t gra
vity
(°P
lato
)
Fig. 9.2 Influence of yeast peptide complex (YPC) factor on successive ale fermentations of 19° Plato worts at 21°C.4
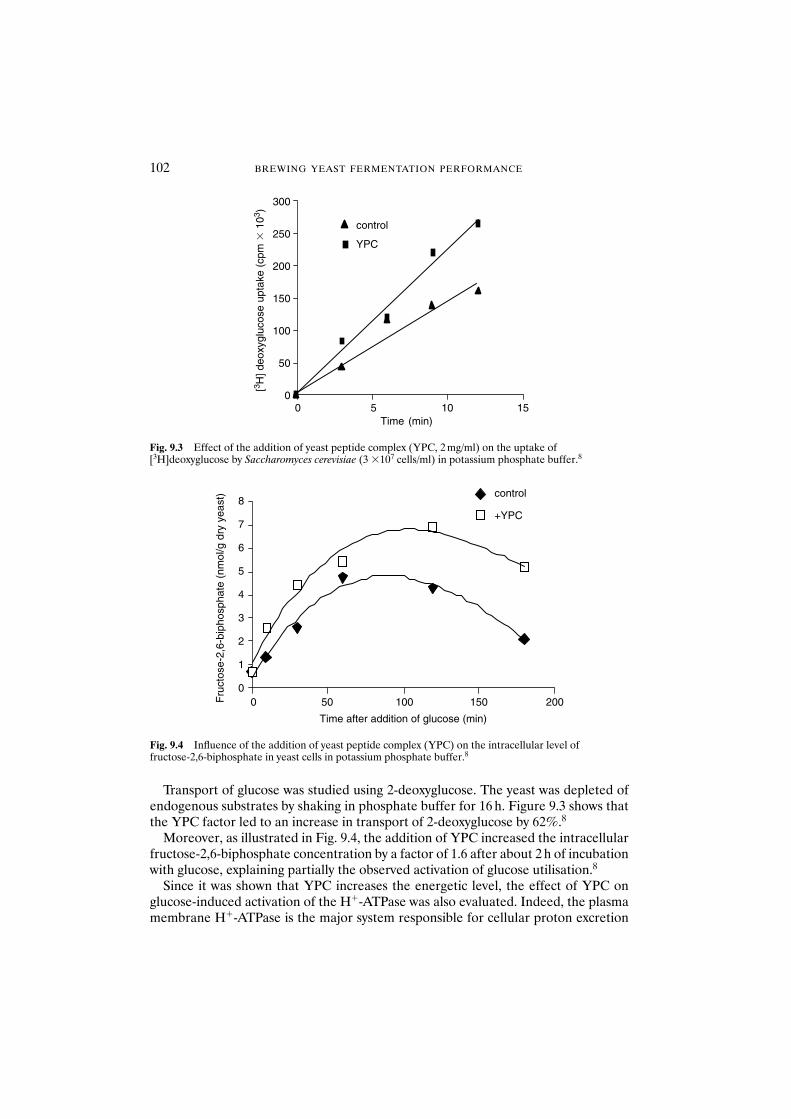
102 BREWING YEAST FERMENTATION PERFORMANCE
Transport of glucose was studied using 2-deoxyglucose. The yeast was depleted ofendogenous substrates by shaking in phosphate buffer for 16 h. Figure 9.3 shows thatthe YPC factor led to an increase in transport of 2-deoxyglucose by 62%.8
Moreover, as illustrated in Fig. 9.4, the addition of YPC increased the intracellularfructose-2,6-biphosphate concentration by a factor of 1.6 after about 2 h of incubationwith glucose, explaining partially the observed activation of glucose utilisation.8
Since it was shown that YPC increases the energetic level, the effect of YPC on glucose-induced activation of the H�-ATPase was also evaluated. Indeed, the plasmamembrane H�-ATPase is the major system responsible for cellular proton excretion
[3 H] d
eoxy
gluc
ose
upta
ke (
cpm
� 1
03 )
0
50
100
150
200
250
300
1050 15Time (min)
control
YPC
Fig. 9.3 Effect of the addition of yeast peptide complex (YPC, 2 mg/ml) on the uptake of [3H]deoxyglucose by Saccharomyces cerevisiae (3 �107 cells/ml) in potassium phosphate buffer.8
00
1
8
7
6
5
4
3
2
50 100 150 200
Time after addition of glucose (min)
Fru
ctos
e-2,
6-bi
phos
phat
e (n
mol
/g d
ry y
east
) control
+YPC
Fig. 9.4 Influence of the addition of yeast peptide complex (YPC) on the intracellular level of fructose-2,6-biphosphate in yeast cells in potassium phosphate buffer.8
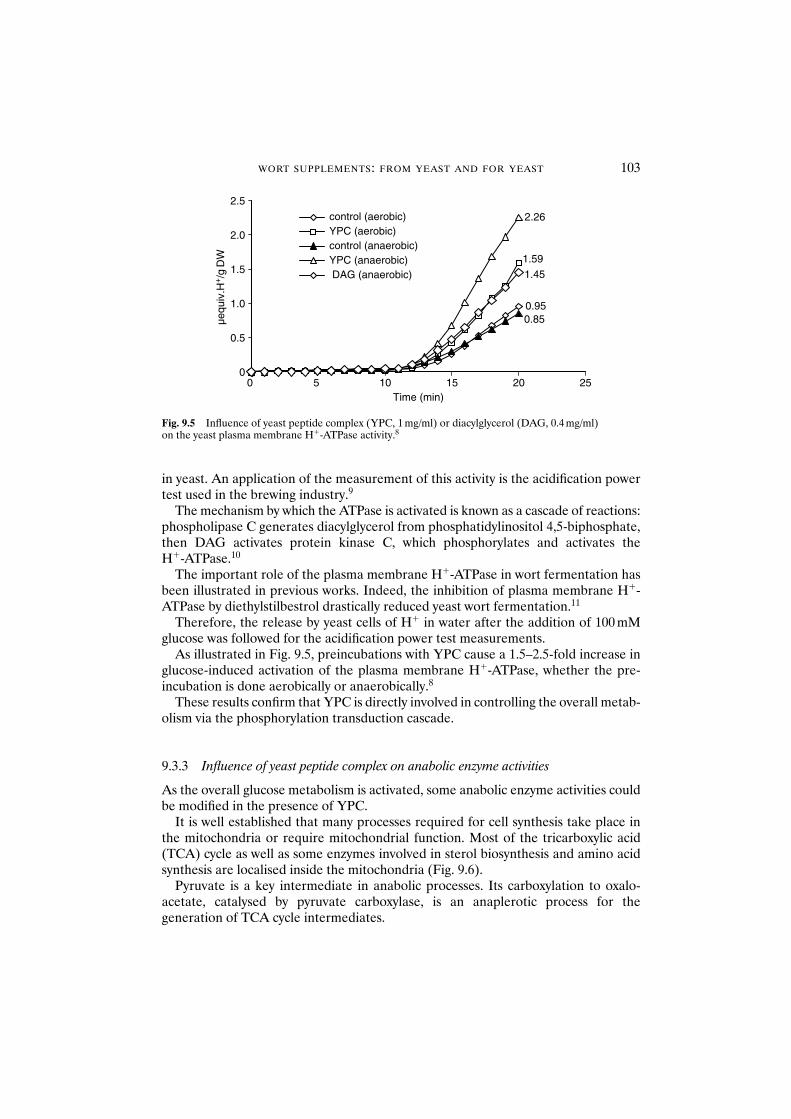
WORT SUPPLEMENTS: FROM YEAST AND FOR YEAST 103
in yeast. An application of the measurement of this activity is the acidification powertest used in the brewing industry.9
The mechanism by which the ATPase is activated is known as a cascade of reactions:phospholipase C generates diacylglycerol from phosphatidylinositol 4,5-biphosphate,then DAG activates protein kinase C, which phosphorylates and activates the H�-ATPase.10
The important role of the plasma membrane H�-ATPase in wort fermentation hasbeen illustrated in previous works. Indeed, the inhibition of plasma membrane H�-ATPase by diethylstilbestrol drastically reduced yeast wort fermentation.11
Therefore, the release by yeast cells of H� in water after the addition of 100 mMglucose was followed for the acidification power test measurements.
As illustrated in Fig. 9.5, preincubations with YPC cause a 1.5–2.5-fold increase inglucose-induced activation of the plasma membrane H�-ATPase, whether the pre-incubation is done aerobically or anaerobically.8
These results confirm that YPC is directly involved in controlling the overall metab-olism via the phosphorylation transduction cascade.
9.3.3 Influence of yeast peptide complex on anabolic enzyme activities
As the overall glucose metabolism is activated, some anabolic enzyme activities couldbe modified in the presence of YPC.
It is well established that many processes required for cell synthesis take place inthe mitochondria or require mitochondrial function. Most of the tricarboxylic acid(TCA) cycle as well as some enzymes involved in sterol biosynthesis and amino acidsynthesis are localised inside the mitochondria (Fig. 9.6).
Pyruvate is a key intermediate in anabolic processes. Its carboxylation to oxalo-acetate, catalysed by pyruvate carboxylase, is an anaplerotic process for thegeneration of TCA cycle intermediates.
µequ
iv.H
+/g
DW
0
0.5
1.0
1.5
2.0
2.5
0 5 10 15 20 25Time (min)
control (aerobic)YPC (aerobic)control (anaerobic)YPC (anaerobic) DAG (anaerobic)
2.26
1.59
1.45
0.950.85
Fig. 9.5 Influence of yeast peptide complex (YPC, 1 mg/ml) or diacylglycerol (DAG, 0.4 mg/ml) on the yeast plasma membrane H�-ATPase activity.8
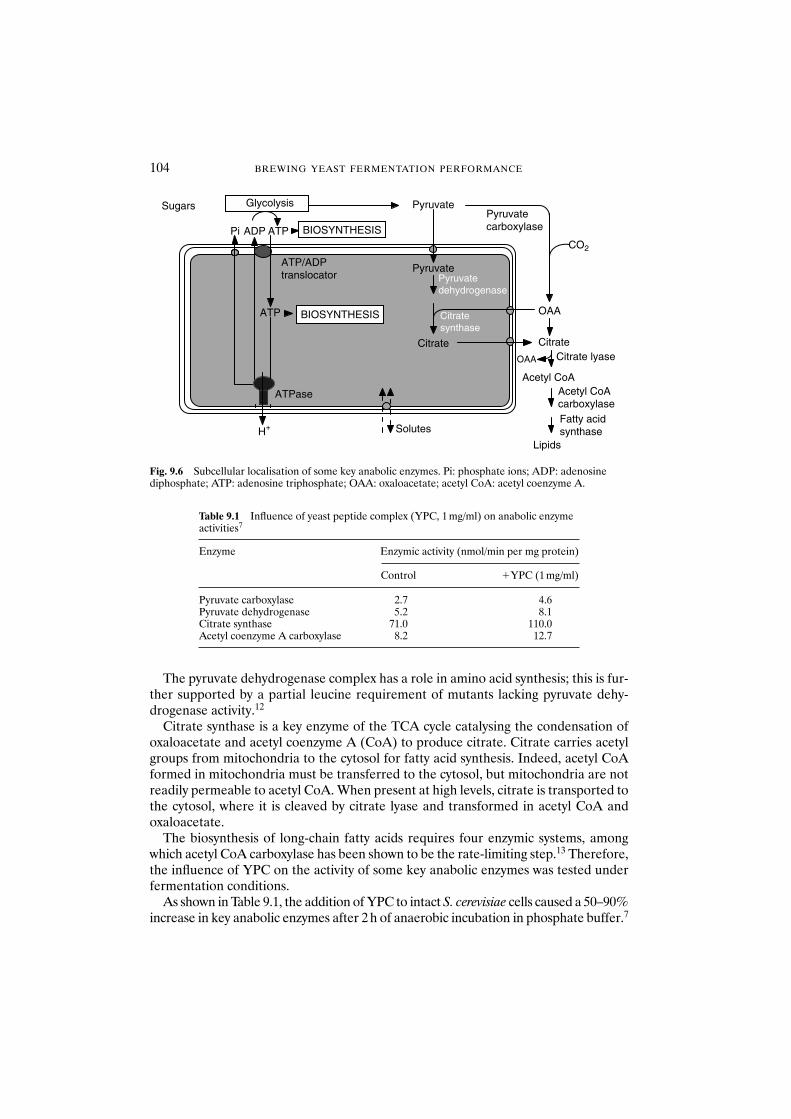
104 BREWING YEAST FERMENTATION PERFORMANCE
The pyruvate dehydrogenase complex has a role in amino acid synthesis; this is fur-ther supported by a partial leucine requirement of mutants lacking pyruvate dehy-drogenase activity.12
Citrate synthase is a key enzyme of the TCA cycle catalysing the condensation ofoxaloacetate and acetyl coenzyme A (CoA) to produce citrate. Citrate carries acetylgroups from mitochondria to the cytosol for fatty acid synthesis. Indeed, acetyl CoAformed in mitochondria must be transferred to the cytosol, but mitochondria are notreadily permeable to acetyl CoA. When present at high levels, citrate is transported tothe cytosol, where it is cleaved by citrate lyase and transformed in acetyl CoA andoxaloacetate.
The biosynthesis of long-chain fatty acids requires four enzymic systems, amongwhich acetyl CoA carboxylase has been shown to be the rate-limiting step.13 Therefore,the influence of YPC on the activity of some key anabolic enzymes was tested underfermentation conditions.
As shown in Table 9.1, the addition of YPC to intact S. cerevisiae cells caused a 50–90%increase in key anabolic enzymes after 2 h of anaerobic incubation in phosphate buffer.7
Sugars
ATP
Pi ADP ATP
Pyruvate
Pyruvate
Citrate
OAA
LipidsH+ Solutes
ATPase
ATP/ADPtranslocator
BIOSYNTHESIS
BIOSYNTHESIS
Pyruvatecarboxylase
Acetyl CoAcarboxylaseFatty acidsynthase
Pyruvatedehydrogenase
Citratesynthase
CO2
Acetyl CoA
Citrate lyaseCitrate
Glycolysis
OAA
Fig. 9.6 Subcellular localisation of some key anabolic enzymes. Pi: phosphate ions; ADP: adenosine diphosphate; ATP: adenosine triphosphate; OAA: oxaloacetate; acetyl CoA: acetyl coenzyme A.
Table 9.1 Influence of yeast peptide complex (YPC, 1 mg/ml) on anabolic enzymeactivities7
Enzyme Enzymic activity (nmol/min per mg protein)
Control �YPC (1 mg/ml)
Pyruvate carboxylase 2.7 4.6Pyruvate dehydrogenase 5.2 8.1Citrate synthase 71.0 110.0Acetyl coenzyme A carboxylase 8.2 12.7
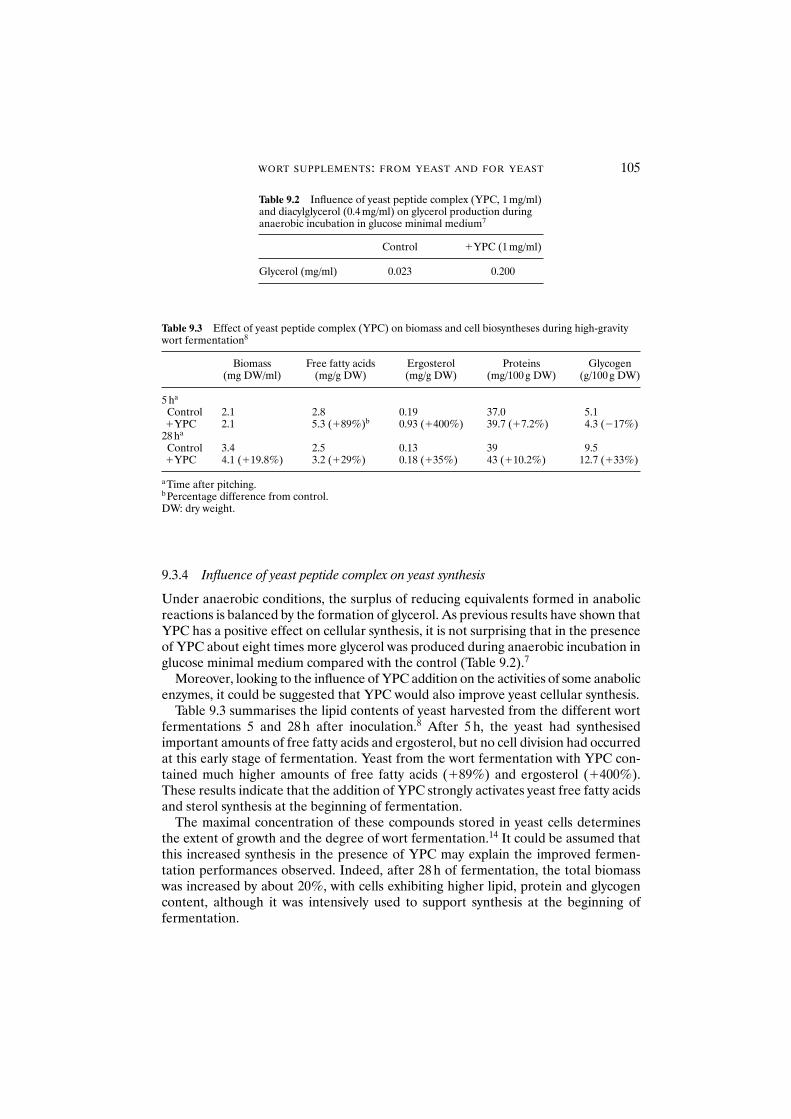
WORT SUPPLEMENTS: FROM YEAST AND FOR YEAST 105
9.3.4 Influence of yeast peptide complex on yeast synthesis
Under anaerobic conditions, the surplus of reducing equivalents formed in anabolicreactions is balanced by the formation of glycerol. As previous results have shown thatYPC has a positive effect on cellular synthesis, it is not surprising that in the presenceof YPC about eight times more glycerol was produced during anaerobic incubation inglucose minimal medium compared with the control (Table 9.2).7
Moreover, looking to the influence of YPC addition on the activities of some anabolicenzymes, it could be suggested that YPC would also improve yeast cellular synthesis.
Table 9.3 summarises the lipid contents of yeast harvested from the different wortfermentations 5 and 28 h after inoculation.8 After 5 h, the yeast had synthesisedimportant amounts of free fatty acids and ergosterol, but no cell division had occurredat this early stage of fermentation. Yeast from the wort fermentation with YPC con-tained much higher amounts of free fatty acids (�89%) and ergosterol (�400%).These results indicate that the addition of YPC strongly activates yeast free fatty acidsand sterol synthesis at the beginning of fermentation.
The maximal concentration of these compounds stored in yeast cells determinesthe extent of growth and the degree of wort fermentation.14 It could be assumed thatthis increased synthesis in the presence of YPC may explain the improved fermen-tation performances observed. Indeed, after 28 h of fermentation, the total biomasswas increased by about 20%, with cells exhibiting higher lipid, protein and glycogencontent, although it was intensively used to support synthesis at the beginning offermentation.
Table 9.2 Influence of yeast peptide complex (YPC, 1 mg/ml)and diacylglycerol (0.4 mg/ml) on glycerol production duringanaerobic incubation in glucose minimal medium7
Control �YPC (1 mg/ml)
Glycerol (mg/ml) 0.023 0.200
Table 9.3 Effect of yeast peptide complex (YPC) on biomass and cell biosyntheses during high-gravitywort fermentation8
Biomass Free fatty acids Ergosterol Proteins Glycogen(mg DW/ml) (mg/g DW) (mg/g DW) (mg/100 g DW) (g/100 g DW)
5 ha
Control 2.1 2.8 0.19 37.0 5.1�YPC 2.1 5.3 (�89%)b 0.93 (�400%) 39.7 (�7.2%) 4.3 (�17%)
28 ha
Control 3.4 2.5 0.13 39 9.5�YPC 4.1 (�19.8%) 3.2 (�29%) 0.18 (�35%) 43 (�10.2%) 12.7 (�33%)
aTime after pitching.bPercentage difference from control.DW: dry weight.
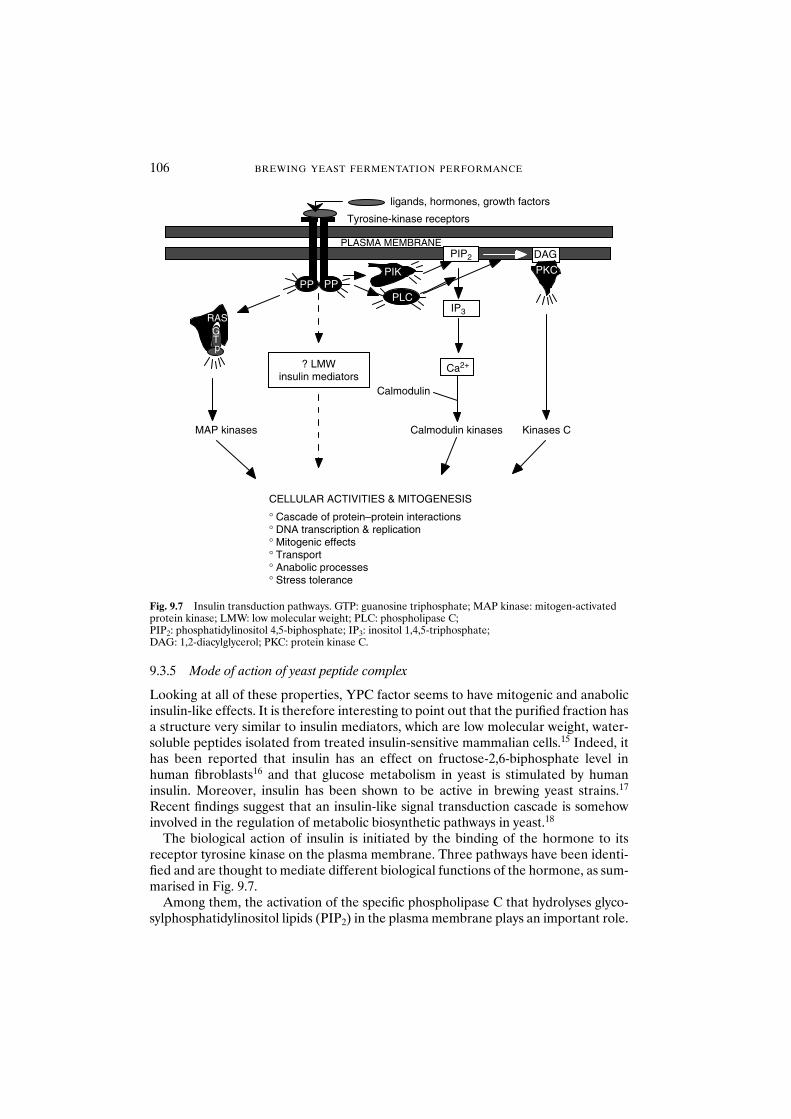
106 BREWING YEAST FERMENTATION PERFORMANCE
9.3.5 Mode of action of yeast peptide complex
Looking at all of these properties, YPC factor seems to have mitogenic and anabolicinsulin-like effects. It is therefore interesting to point out that the purified fraction hasa structure very similar to insulin mediators, which are low molecular weight, water-soluble peptides isolated from treated insulin-sensitive mammalian cells.15 Indeed, ithas been reported that insulin has an effect on fructose-2,6-biphosphate level inhuman fibroblasts16 and that glucose metabolism in yeast is stimulated by humaninsulin. Moreover, insulin has been shown to be active in brewing yeast strains.17
Recent findings suggest that an insulin-like signal transduction cascade is somehowinvolved in the regulation of metabolic biosynthetic pathways in yeast.18
The biological action of insulin is initiated by the binding of the hormone to itsreceptor tyrosine kinase on the plasma membrane. Three pathways have been identi-fied and are thought to mediate different biological functions of the hormone, as sum-marised in Fig. 9.7.
Among them, the activation of the specific phospholipase C that hydrolyses glyco-sylphosphatidylinositol lipids (PIP2) in the plasma membrane plays an important role.
PIP2 DAG
IP3
PLASMA MEMBRANE
Ca2+
Calmodulin
PKC
Tyrosine-kinase receptors
ligands, hormones, growth factors
Calmodulin kinases Kinases C
RAS
MAP kinases
RASG T p
CELLULAR ACTIVITIES & MITOGENESIS
PLC
PIKPP PP
? LMWinsulin mediators
° Cascade of protein–protein interactions° DNA transcription & replication° Mitogenic effects° Transport° Anabolic processes° Stress tolerance
Fig. 9.7 Insulin transduction pathways. GTP: guanosine triphosphate; MAP kinase: mitogen-activatedprotein kinase; LMW: low molecular weight; PLC: phospholipase C; PIP2: phosphatidylinositol 4,5-biphosphate; IP3: inositol 1,4,5-triphosphate; DAG: 1,2-diacylglycerol; PKC: protein kinase C.
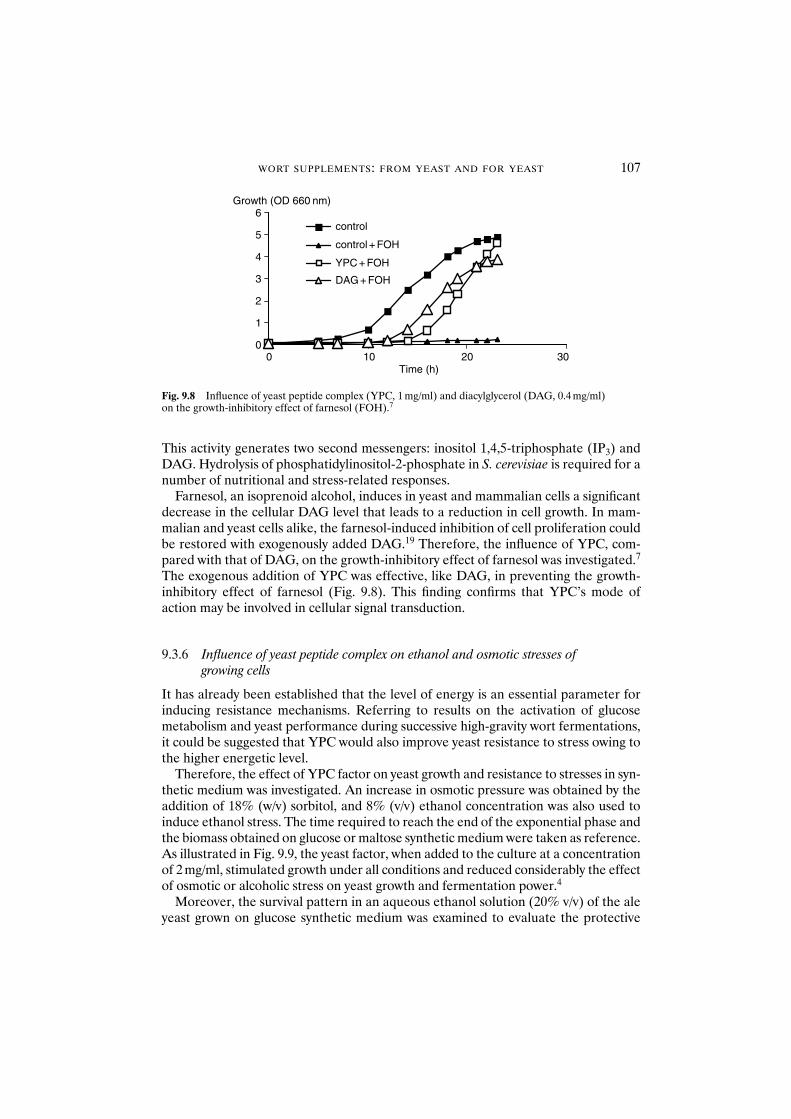
WORT SUPPLEMENTS: FROM YEAST AND FOR YEAST 107
This activity generates two second messengers: inositol 1,4,5-triphosphate (IP3) andDAG. Hydrolysis of phosphatidylinositol-2-phosphate in S. cerevisiae is required for anumber of nutritional and stress-related responses.
Farnesol, an isoprenoid alcohol, induces in yeast and mammalian cells a significantdecrease in the cellular DAG level that leads to a reduction in cell growth. In mam-malian and yeast cells alike, the farnesol-induced inhibition of cell proliferation couldbe restored with exogenously added DAG.19 Therefore, the influence of YPC, com-pared with that of DAG, on the growth-inhibitory effect of farnesol was investigated.7
The exogenous addition of YPC was effective, like DAG, in preventing the growth-inhibitory effect of farnesol (Fig. 9.8). This finding confirms that YPC’s mode ofaction may be involved in cellular signal transduction.
9.3.6 Influence of yeast peptide complex on ethanol and osmotic stresses ofgrowing cells
It has already been established that the level of energy is an essential parameter forinducing resistance mechanisms. Referring to results on the activation of glucosemetabolism and yeast performance during successive high-gravity wort fermentations,it could be suggested that YPC would also improve yeast resistance to stress owing tothe higher energetic level.
Therefore, the effect of YPC factor on yeast growth and resistance to stresses in syn-thetic medium was investigated. An increase in osmotic pressure was obtained by theaddition of 18% (w/v) sorbitol, and 8% (v/v) ethanol concentration was also used toinduce ethanol stress. The time required to reach the end of the exponential phase andthe biomass obtained on glucose or maltose synthetic medium were taken as reference.As illustrated in Fig. 9.9, the yeast factor, when added to the culture at a concentrationof 2 mg/ml, stimulated growth under all conditions and reduced considerably the effectof osmotic or alcoholic stress on yeast growth and fermentation power.4
Moreover, the survival pattern in an aqueous ethanol solution (20% v/v) of the aleyeast grown on glucose synthetic medium was examined to evaluate the protective
Growth (OD 660 nm)
0
1
2
3
4
5
6
3020100Time (h)
control
control + FOH
YPC + FOH
DAG + FOH
Fig. 9.8 Influence of yeast peptide complex (YPC, 1 mg/ml) and diacylglycerol (DAG, 0.4 mg/ml) on the growth-inhibitory effect of farnesol (FOH).7
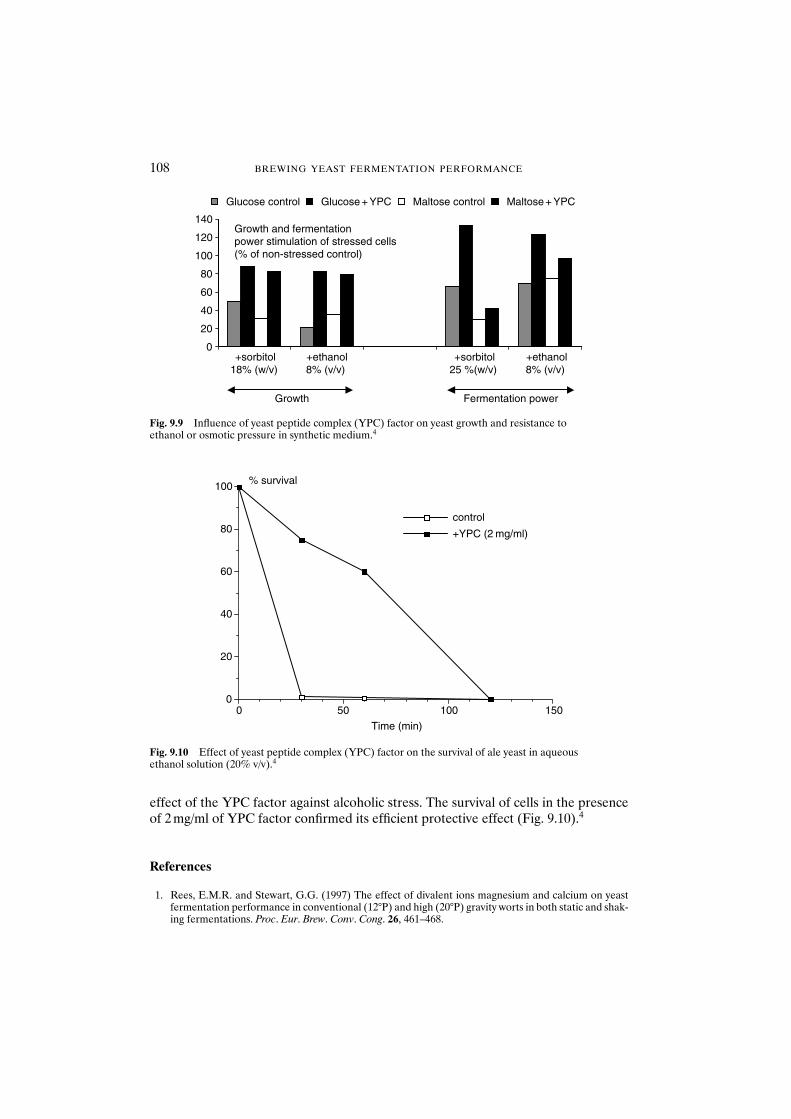
108 BREWING YEAST FERMENTATION PERFORMANCE
effect of the YPC factor against alcoholic stress. The survival of cells in the presenceof 2 mg/ml of YPC factor confirmed its efficient protective effect (Fig. 9.10).4
References
1. Rees, E.M.R. and Stewart, G.G. (1997) The effect of divalent ions magnesium and calcium on yeastfermentation performance in conventional (12°P) and high (20°P) gravity worts in both static and shak-ing fermentations. Proc. Eur. Brew. Conv. Cong. 26, 461–468.
0
20
40
60
80
100
120
140
Glucose control Glucose + YPC Maltose control Maltose + YPC
Growth Fermentation power
Growth and fermentationpower stimulation of stressed cells(% of non-stressed control)
+sorbitol18% (w/v)
+ethanol8% (v/v)
+sorbitol25 %(w/v)
+ethanol8% (v/v)
Fig. 9.9 Influence of yeast peptide complex (YPC) factor on yeast growth and resistance to ethanol or osmotic pressure in synthetic medium.4
1501005000
20
40
60
80
100
control
+YPC (2 mg/ml)
Time (min)
% survival
Fig. 9.10 Effect of yeast peptide complex (YPC) factor on the survival of ale yeast in aqueous ethanol solution (20% v/v).4
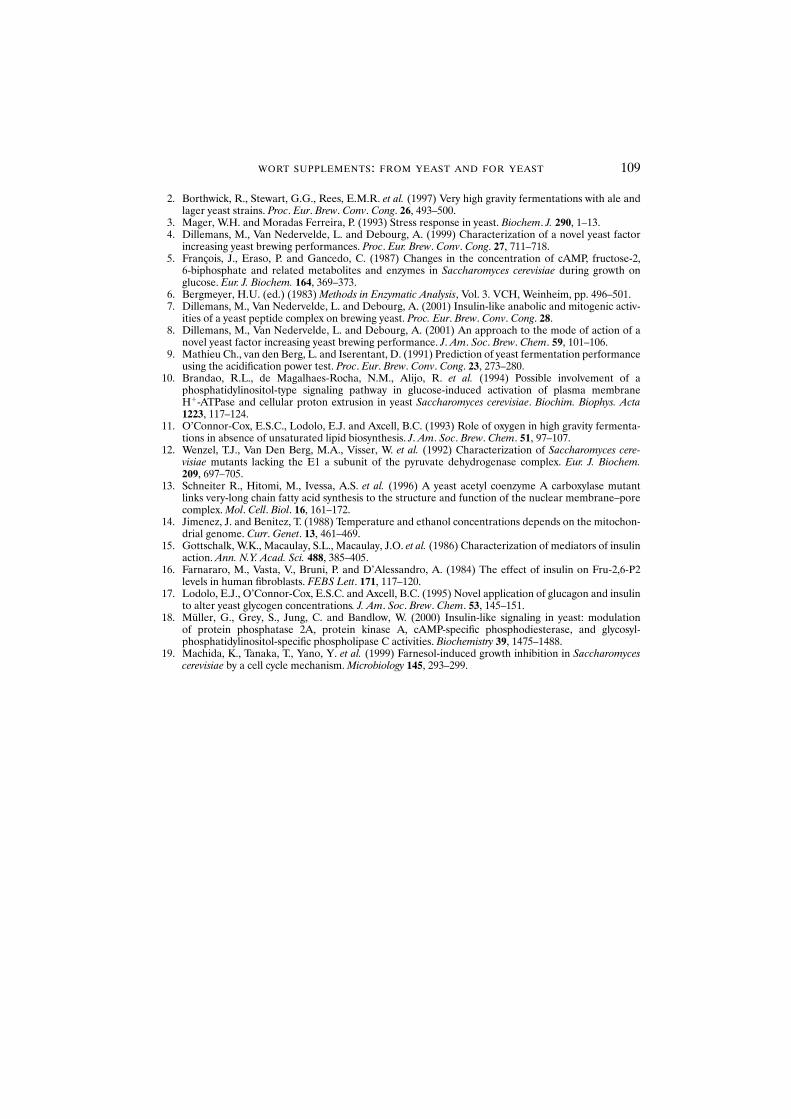
2. Borthwick, R., Stewart, G.G., Rees, E.M.R. et al. (1997) Very high gravity fermentations with ale andlager yeast strains. Proc. Eur. Brew. Conv. Cong. 26, 493–500.
3. Mager, W.H. and Moradas Ferreira, P. (1993) Stress response in yeast. Biochem. J. 290, 1–13.4. Dillemans, M., Van Nedervelde, L. and Debourg, A. (1999) Characterization of a novel yeast factor
increasing yeast brewing performances. Proc. Eur. Brew. Conv. Cong. 27, 711–718.5. François, J., Eraso, P. and Gancedo, C. (1987) Changes in the concentration of cAMP, fructose-2,
6-biphosphate and related metabolites and enzymes in Saccharomyces cerevisiae during growth on glucose. Eur. J. Biochem. 164, 369–373.
6. Bergmeyer, H.U. (ed.) (1983) Methods in Enzymatic Analysis, Vol. 3. VCH, Weinheim, pp. 496–501.7. Dillemans, M., Van Nedervelde, L. and Debourg, A. (2001) Insulin-like anabolic and mitogenic activ-
ities of a yeast peptide complex on brewing yeast. Proc. Eur. Brew. Conv. Cong. 28.8. Dillemans, M., Van Nedervelde, L. and Debourg, A. (2001) An approach to the mode of action of a
novel yeast factor increasing yeast brewing performance. J. Am. Soc. Brew. Chem. 59, 101–106.9. Mathieu Ch., van den Berg, L. and Iserentant, D. (1991) Prediction of yeast fermentation performance
using the acidification power test. Proc. Eur. Brew. Conv. Cong. 23, 273–280.10. Brandao, R.L., de Magalhaes-Rocha, N.M., Alijo, R. et al. (1994) Possible involvement of a
phosphatidylinositol-type signaling pathway in glucose-induced activation of plasma membraneH�-ATPase and cellular proton extrusion in yeast Saccharomyces cerevisiae. Biochim. Biophys. Acta1223, 117–124.
11. O’Connor-Cox, E.S.C., Lodolo, E.J. and Axcell, B.C. (1993) Role of oxygen in high gravity fermenta-tions in absence of unsaturated lipid biosynthesis. J. Am. Soc. Brew. Chem. 51, 97–107.
12. Wenzel, T.J., Van Den Berg, M.A., Visser, W. et al. (1992) Characterization of Saccharomyces cere-visiae mutants lacking the E1 a subunit of the pyruvate dehydrogenase complex. Eur. J. Biochem.209, 697–705.
13. Schneiter R., Hitomi, M., Ivessa, A.S. et al. (1996) A yeast acetyl coenzyme A carboxylase mutantlinks very-long chain fatty acid synthesis to the structure and function of the nuclear membrane–porecomplex. Mol. Cell. Biol. 16, 161–172.
14. Jimenez, J. and Benitez, T. (1988) Temperature and ethanol concentrations depends on the mitochon-drial genome. Curr. Genet. 13, 461–469.
15. Gottschalk, W.K., Macaulay, S.L., Macaulay, J.O. et al. (1986) Characterization of mediators of insulinaction. Ann. N.Y. Acad. Sci. 488, 385–405.
16. Farnararo, M., Vasta, V., Bruni, P. and D’Alessandro, A. (1984) The effect of insulin on Fru-2,6-P2levels in human fibroblasts. FEBS Lett. 171, 117–120.
17. Lodolo, E.J., O’Connor-Cox, E.S.C. and Axcell, B.C. (1995) Novel application of glucagon and insulinto alter yeast glycogen concentrations. J. Am. Soc. Brew. Chem. 53, 145–151.
18. Müller, G., Grey, S., Jung, C. and Bandlow, W. (2000) Insulin-like signaling in yeast: modulation of protein phosphatase 2A, protein kinase A, cAMP-specific phosphodiesterase, and glycosyl-phosphatidylinositol-specific phospholipase C activities. Biochemistry 39, 1475–1488.
19. Machida, K., Tanaka, T., Yano, Y. et al. (1999) Farnesol-induced growth inhibition in Saccharomycescerevisiae by a cell cycle mechanism. Microbiology 145, 293–299.
WORT SUPPLEMENTS: FROM YEAST AND FOR YEAST 109
10 Unsaturated Fatty Acid Supplementation ofStationary-phase Brewing Yeast and its Effectson Growth and Fermentation Ability
N. MOONJAI, K.J. VERSTREPEN, F.R. DELVAUX, G. DERDELINCKXand H. VERACHTERT
Abstract Supplementation of stationary-phase yeast with an unsaturated fatty acid (UFA),linoleic acid, resulted in an increased intracellular UFA content. However, the glycogenlevel was decreased, concomitant with an increase in trehalose content compared withunsupplemented cells. The behaviour of supplemented cells during the following fermen-tation of a synthetic medium (0 ppm dissolved oxygen) containing 8% (w/v) glucose wasinvestigated. The effects of supplementation of the medium with UFA were compared.Growth in the fermentation pitched with unsupplemented cells was restricted and the viabil-ity was low, resulting in a slow fermentation. Yeast growth was restored and the fermentationability was significantly improved when supplemented pitching yeast was used. Moreover,using supplemented pitching yeast did not result in a reduction in acetate esters synthesiscompared with UFA supplementation of the medium. From the results achieved under theexperimental conditions used here, it suggested that the use of UFA-supplemented pitchingyeast in brewery fermentations may be a convenient way to revitalise the cropped yeastused for pitching in the subsequent fermentation.
10.1 Introduction
In traditional batch brewing practice, yeast is reused in successive fermentation cycles.However, the physiological condition of cropped yeast is quite poor because of thedepletion of sterols and unsaturated fatty acids (UFAs). Insufficient levels lead to analteration in membrane structure and membrane-linked biochemical processes.Therefore, the yeast taken from a previous fermentation cycle must be revitalised andgiven the opportunity to synthesise appropriate levels of these essential membranecompounds. To satisfy this requirement the brewer aerates the wort for a short periodbefore pitching. This enables the lipid synthesis necessary for cell growth. However, itis difficult to control wort aeration.1,2
Another possibility for the yeast to regenerate the necessary lipids during fermenta-tion is the uptake of some of these lipids from the surrounding medium.3,4 It has beenshown that addition of lipids, especially UFAs, to wort can eliminate the requirementfor wort aeration.5,6 Oxygen and UFAs promote yeast growth; however, their presenceduring wort fermentation drastically decreases the synthesis of volatile esters, whichare extremely important for beer flavour.7–11 As a consequence, the brewer constantlyhas to control the oxygen and fatty acid contents of wort and their respective undesirableside-effects. A general review of the problems was published by Moonjai et al.12
This study investigated the possibility of adding UFAs to the stationary-phase yeastobtained at the end of a fermentation cycle. The effects of UFA supplementation of
Brewing Yeast Fermentation Performance: Second edition
Edited by: KATHERINE SMART Copyright 0 Blackwell Science 2003
cropped yeast, before pitching, on yeast growth and fermentation ability in the nextfermentation were studied.
10.2 Materials and methods
10.2.1 Yeast strain and maintenance
All experiments were carried out with an industrial brewing strain of yeast, Saccharomyces cerevisiae carlsbergensis KUL-CMBS 12, which was maintained on wortagar (Difco Laboratories, Detroit, MI, USA) plates and stored at 4°C.
10.2.2 Growth medium
Yeast cells were grown in synthetic medium containing (per litre): 80 g of glucose (SigmaChemical Co., St Louis, MO, USA), 6.5 g of yeast extract (Difco Laboratories), 2.6 gof (NH4)2SO4, 2.72 g of KH2PO4, 0.5 g of MgSO4 · 7H2O and 0.5 g of CaCl2 · 2H2O.Zinc (ZnCl2) was added to a final concentration of 0.2 mg/l. Polypropylene glycol 2000(Sigma-Aldrich Chemie, Germany) (200 mg/l) was also added as an antifoam reagent.The pH was brought to 5.2 by means of citrate buffer (0.04 M) containing (per litre ofmedium) 1.5 g of citric acid and 6.0 g of sodium citrate. To avoid excessive Mailardreaction during autoclaving, a glucose solution was prepared and autoclaved sep-arately. After autoclaving at 1.0 kg/cm2 and 121°C for 15 min, portions were combinedwhile still hot. This synthetic medium was used in all propagations and fermentations.
10.2.3 Yeast propagation
A yeast colony was removed from a stock plate and inoculated onto a wort agar slantin a sterile tube. After incubation at 27°C for 48 h, the slant culture was stored at 4°C.When required, 5 ml of synthetic medium was added into the slant culture, which wasthen gently agitated to disperse yeast and form a suspension. The yeast suspensionwas inoculated into a cottonwool-stopped 250 ml Erlenmeyer flask containing 150 mlof synthetic medium. Yeast propagation was carried at 20°C for 48 h with orbital shakingat 150 rpm. Yeast cells were harvested by centrifugation at 4000 rpm for 5 min andpitched into fresh medium for a next fermentation at a rate of 15 � 106 cells/ml.
10.2.4 Preparation of stationary-phase cells and unsaturated fatty acidsupplementation
Stationary-phase cells were prepared from a fermentation performed in an airlock-stopped 1 litre Erlenmeyer flask containing 500 ml of synthetic medium. The mediumwas aerated to contain 8 ppm dissolved oxygen at the start of fermentation. Afterpitching, nitrogen gas was passed through the headspace at a flow rate of 1.5 l/min for5 min. Fermentation was carried out at 20°C for 72 h with magnetic stirring at 150 rpmto obtain stationary-phase cells. Before harvesting, linoleic acid (Sigma ChemicalCo.) was added to the culture. An aliquot solution of linoleic acid in ethanol (0.5 ml)
UFA SUPPLEMENTATION OF STATIONARY-PHASE BREWING YEAST 111
was added into the 500 ml fermentation culture to a final concentration of 60 mg/l.After supplementation with linoleic acid, the yeast culture was incubated for a further12 h under the same conditions as during the fermentation. Control yeast culture wastreated in the same way, but 0.5 ml ethanol without linoleic acid was added to this cul-ture. Subsequently, yeast cells were harvested by centrifugation at 4000 rpm for 5 minand quickly washed twice with cold water (4°C). These cells were pitched in a freshmedium for the test fermentations at a rate of 15 � 106 cells/ml. The rest of the yeastpellets were weighed and stored at �20°C for further analysis.
10.2.5 Analysis of pitching yeast
After thawing, the yeast pellets were resuspended in cold (4°C) 0.8% NaCl solution toa concentration of 0.1 g wet cells/ml. Cell dry weight (CDW) was determined by drying1 ml of this cell suspension at 105°C for 2 h. The CDW/ml of cell suspension was cal-culated for the determination of fatty acids, glycogen and trehalose content of yeast.
To determine total fatty acid composition of yeast, i.e. free fatty acids and fatty acylresidues of major classes of lipids (acylglycerols and phospholipids) during fermentation,0.5 g wet cells (5 ml cell suspension) was disrupted by alkaline saponification carriedout at 100°C for 30 min and total fatty acids were extracted with hexane as describedby Chen13 with some modification. Heptadecanoic acid (Sigma Chemical Co.) wasused as an internal standard. The fatty acids were methylated by boron trifluoride inmethanol (14% solution) and the fatty acid methyl esters were analysed by gas chro-matography (Varian 3300; Varian Association, Walnut Creek, CA, USA) equippedwith a flame ionisation detector. The capillary column was an Alltech Heliflex AT-225(Alltech Associated, Deerfield, IL, USA) with 30 m length, 0.32 mm internal diameterand 0.25 �m film thickness. Chromatography was performed under the following condi-tions: oven temperature was increased from 150 to 210°C at a rate of 6°C/min with3 min holding time, injector temperature was 250°C and detector temperature was230°C. The carrier gas was helium.
The glycogen content of yeast was determined using method 4 of Quain.14 The glyco-gen was extracted from 0.1 g wet cells (1 ml cell suspension). The extract was incubatedwith 1.4 U/ml amyloglucosidase (Boehringer Mannheim, Germany) at 37°C for 2 h andthe resulting glucose was determined spectrophotometrically at wavelength of 505 nmusing a glucose oxidase diagnostic kit (Sigma Diagnostics, St Louis, MO, USA).Trehalose was extracted from 0.1 g wet cells (1 ml cell suspension) with cold 0.5 Mtrichloroacetic acid, as described by Trevelyan and Harrison.15 The extract was assayedfor anthrone-positive material as described by Spiro.16 The results were comparedagainst a glucose standard analysed spectrophotometrically at a wavelength of 625 nm.Glycogen and trehalose levels were expressed as equivalent mg glucose/g CDW.
10.2.6 Test fermentations
All test fermentations were performed in a stirred 5 litre jar fermentor (BioFlow III;New Brunswick Scientific, Edison, NJ, USA) containing 3 litres of fresh fermentationmedium, and the temperature was kept constant at 15°C with stirring at 100 rpm. Beforepitching, the fermentation medium was de-aerated. This medium contained 0 ppm
112 BREWING YEAST FERMENTATION PERFORMANCE
UFA SUPPLEMENTATION OF STATIONARY-PHASE BREWING YEAST 113
dissolved oxygen, obtained by passing filtered nitrogen gas through the medium for10 min at 15°C, with agitation at 500 rpm. The final content of dissolved oxygen wasmeasured by means of a dissolved oxygen meter (Oxi 340-A/SET; Weilheim, Germany).Linoleic acid (C18:2)-supplemented medium was prepared by adding a solution ofC18:2 in ethanol (3 ml) into de-aerated medium to a final concentration of 15 mg/l.An equal volume of ethanol (without C18:2) was added to the other cultures. Residualoxygen was removed from the headspace by flushing the headspace with nitrogen gasat a flow rate of 1.5 l/min for 5 min after pitching and continuously flushing at a flow rateof 30 ml/min during fermentation to avoid any further entry of oxygen. At regulartime intervals 100 ml samples were removed for further analysis.
10.2.7 Monitoring of fermentation
Yeast growth was monitored by measuring the concentration of cells in the fermentingmedium by means of optical density at wavelength of 600 nm. Cells were also countedwith the Thoma counting chamber and cell viability was assessed using the methyleneblue staining technique.17 The percentage of unstained cells was recorded as the via-bility. Yeast cells were harvested by centrifugation at 4000 rpm for 5 min. The gravityof centrifuged fermenting medium was measured using a digital density meter (PaarDSA 48�SP-1; Anton PAAR KG, Graz, Austria) to determine the apparent attenua-tion and the ethanol content. A 5 ml aliquot of centrifuged fermenting medium wasput into a 20 ml vial, which was immediately capped and quickly frozen, after which itwas analysed for volatile compounds.
10.2.8 Analysis of volatile esters and higher alcohols
Volatile compounds were determined by headspace gas chromatography (Perkin ElmerAutosystem XL) equipped with a flame ionisation detector. Samples were heated for16 min at 60°C in the headspace autosampler (Perkin Elmer Headspace Sampler HS-40).Esters and higher alcohols were separated using a 50 m WCOT fused silica capillarycolumn coated with CP-Wax 52CB, with 1.2 �m film thickness and 0.32 mm internaldiameter. The following conditions were applied: injector temperature was 180°C;initial oven temperature was 75°C and held for 6 min, and increased at 25°C/min to110°C, held for 3.5 min; detector temperature was 250°C. The carrier gas was helium.
10.3 Results and discussion
10.3.1 Unsaturated fatty acid supplementation of pitching yeast
This study investigated the effects of UFA supplementation of yeast cells before pitching.Yeast obtained at the end of a fermentation cycle was supplemented with UFA. Tonarrow the effects, linoleic acid (C18:2) was used throughout. Unlike some other yeastgenera, Saccharomyces yeast cannot synthesise C18:2, which makes it easier to followthe uptake and cellular fate of the added fatty acid. A synthetic medium containing 8%
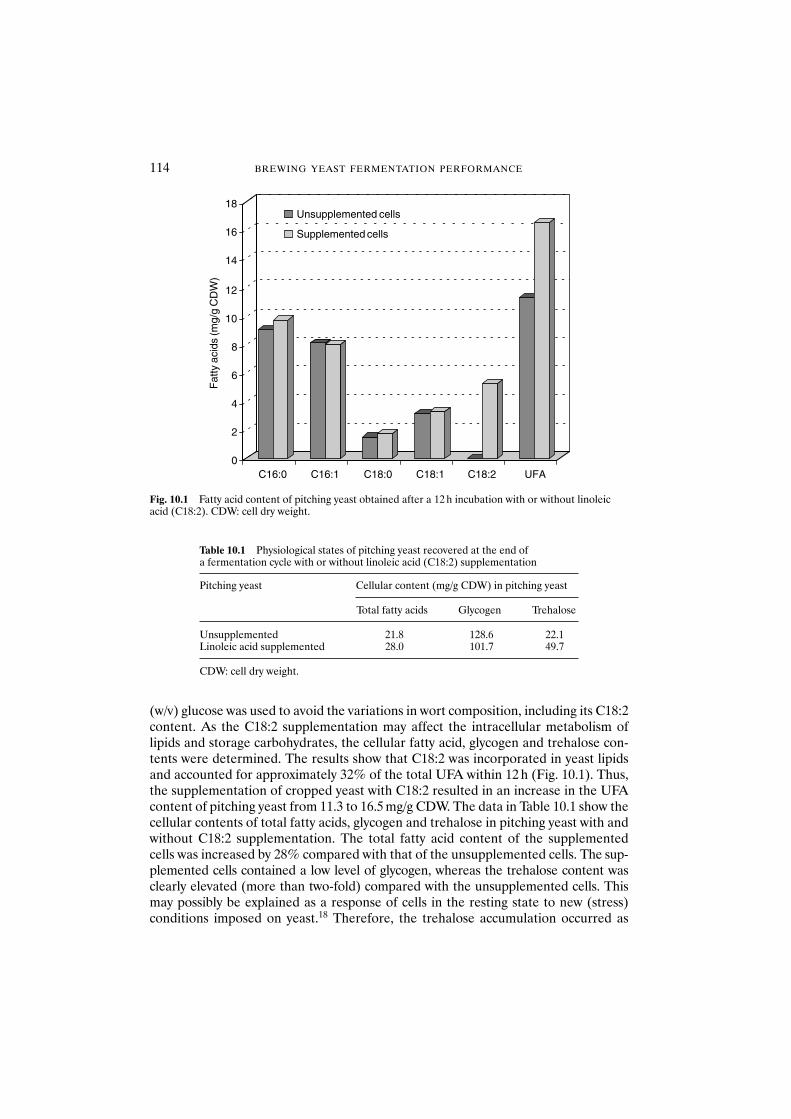
114 BREWING YEAST FERMENTATION PERFORMANCE
(w/v) glucose was used to avoid the variations in wort composition, including its C18:2content. As the C18:2 supplementation may affect the intracellular metabolism oflipids and storage carbohydrates, the cellular fatty acid, glycogen and trehalose con-tents were determined. The results show that C18:2 was incorporated in yeast lipidsand accounted for approximately 32% of the total UFA within 12 h (Fig. 10.1). Thus,the supplementation of cropped yeast with C18:2 resulted in an increase in the UFAcontent of pitching yeast from 11.3 to 16.5 mg/g CDW. The data in Table 10.1 show thecellular contents of total fatty acids, glycogen and trehalose in pitching yeast with andwithout C18:2 supplementation. The total fatty acid content of the supplementedcells was increased by 28% compared with that of the unsupplemented cells. The sup-plemented cells contained a low level of glycogen, whereas the trehalose content wasclearly elevated (more than two-fold) compared with the unsupplemented cells. Thismay possibly be explained as a response of cells in the resting state to new (stress)conditions imposed on yeast.18 Therefore, the trehalose accumulation occurred as
0
2
4
6
8
10
12
14
16
18F
atty
aci
ds (m
g/g
CD
W)
C16:0 C16:1 C18:0 C18:1 C18:2 UFA
Unsupplemented cells
Supplemented cells
Fig. 10.1 Fatty acid content of pitching yeast obtained after a 12 h incubation with or without linoleicacid (C18:2). CDW: cell dry weight.
Table 10.1 Physiological states of pitching yeast recovered at the end of a fermentation cycle with or without linoleic acid (C18:2) supplementation
Pitching yeast Cellular content (mg/g CDW) in pitching yeast
Total fatty acids Glycogen Trehalose
Unsupplemented 21.8 128.6 22.1Linoleic acid supplemented 28.0 101.7 49.7
CDW: cell dry weight.
UFA SUPPLEMENTATION OF STATIONARY-PHASE BREWING YEAST 115
a stress response and the carbon used for trehalose synthesis partially derived fromglycogen dissimilation.19 A similar increase in trehalose at the expense of glycogen wasalso reported by Callaerts et al.20 when cropped yeast was oxygenated. The trehalosecontent of the pitching yeast had no effect on growth and fermentative ability duringthe subsequent fermentation; however, a high level of trehalose seemed to sustain cellviability in the first hours of fermentation.21 The level of glycogen in pitching yeast wasan important consideration since glycogen was the sole source of energy for lipid syn-thesis during the initial stage of fermentation.22 Although this may generate a problemfor the repitching of supplemented yeast, this was not the case as a high level of cellularUFA could probably compensate for the low glycogen level.
10.3.2 Fermentation with unsaturated fatty acid-supplemented yeast
To study the effects of the UFA linoleic acid, supplementation of pitching yeast ongrowth and fermentation ability during subsequent fermentation, three different fer-mentations were compared. All fermentations were pitched with yeast cells harvestedfrom a previous standard fermentation after a further 12 h with or without C18:2 sup-plementation. The first fermentation was pitched with the C18:2-unsupplemented cells.The second fermentation was carried out with the same cells but the medium was sup-plemented with C18:2 to a final concentration of 15 mg/l. The third fermentation waspitched with yeast cells that received a 12 h incubation with C18:2 before pitching.
Yeast growth was determined by following the changes in optical density of culturemedium and in cell numbers during fermentation, as shown in Fig. 10.2a and b,respectively. The results show that the growth of unsupplemented cells was very limited.The maximum cell numbers reached only 37 � 106 cells/ml. In contrast, supplemen-tation of the medium with linoleic acid led to a large increase of yeast growth as themaximum cell numbers reached were increased to 71 � 106 cells/ml. These resultsconfirm that C18:2 supplementation to the fermentation significantly promoted yeastgrowth.9 Surprisingly, when C18:2-supplemented cells were pitched in unsupplementedmedium, growth was restored and the maximum cell numbers reached were increasedby 42% compared with fermentation with unsupplemented cells.
The viability changes during fermentation are shown in Fig. 10.2c. In general, theviability recovered at the beginning of the subsequent fermentation owing to cellreplication, but decreased at the end of the fermentation.23 The results of this experi-ment show that the viability of unsupplemented cells in unsupplemented mediumremained low (�90%) throughout the fermentation. In contrast, the viability wasgreatly improved where C18:2 was present, either in the medium or in the pitchingyeast, and remained high (�95%) until the end of the fermentation.
Figure 10.3 shows the decreases in gravity of fermented medium throughout thefermentations. The fermentation with the unsupplemented yeast cells in the unsupple-mented medium was very slow. It took more than 120 h to reach the maximum attenu-ation, corresponding to an ethanol concentration of 5.0% (v/v) (data not shown). Thiscould be expected as the yeast cells were depleted in UFA and did not receive those lipidsin the medium. Furthermore, there was no oxygen available in the medium (0 ppmdissolved oxygen), so UFA synthesis was impossible. This caused a poor yeast growthand thus a slow fermentation. By supplementation of the medium with C18:2, the
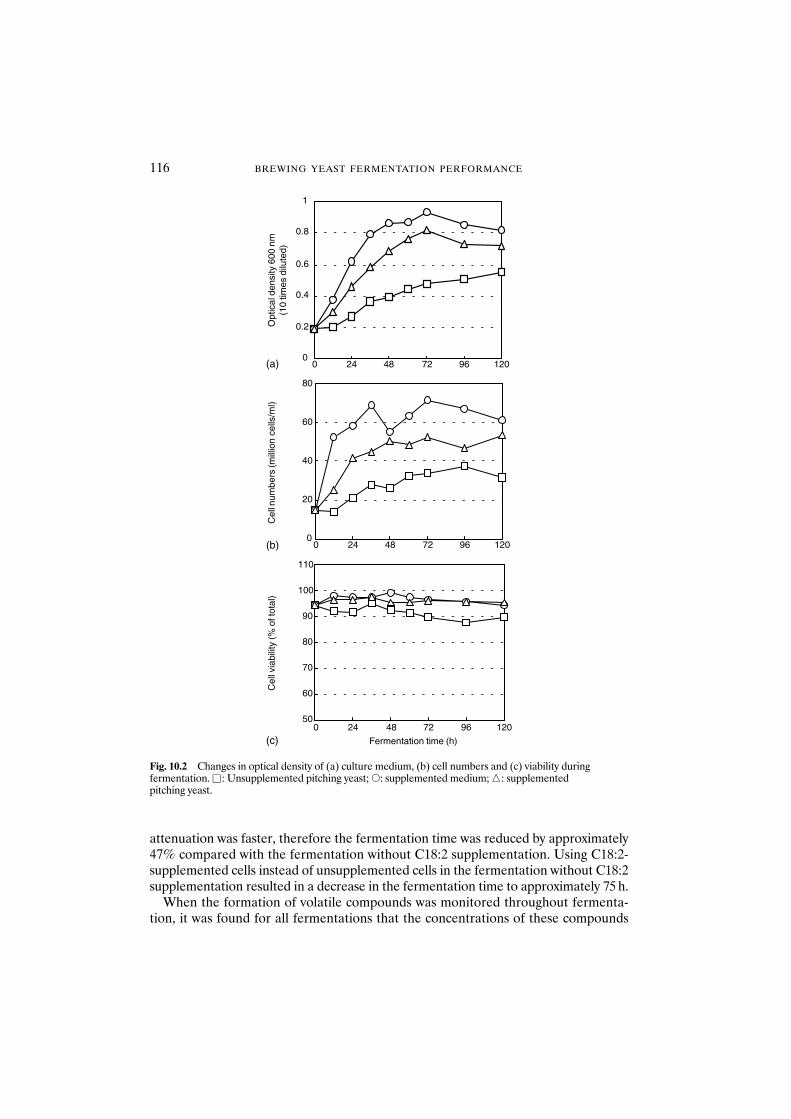
116 BREWING YEAST FERMENTATION PERFORMANCE
attenuation was faster, therefore the fermentation time was reduced by approximately47% compared with the fermentation without C18:2 supplementation. Using C18:2-supplemented cells instead of unsupplemented cells in the fermentation without C18:2supplementation resulted in a decrease in the fermentation time to approximately 75 h.
When the formation of volatile compounds was monitored throughout fermenta-tion, it was found for all fermentations that the concentrations of these compounds
50
60
70
80
90
100
110
(c) Fermentation time (h)
Cel
l via
bilit
y (%
of t
otal
)
0
20
40
60
80
(b)
Cel
l num
bers
(mill
ion
cells
/ml)
0
0.2
0.4
0.6
0.8
1
0 24 48 72 96 120
0 24 48 72 96 120
0 24 48 72 96 120
(a)
Opt
ical
den
sity
600
nm
(10
times
dilu
ted)
Fig. 10.2 Changes in optical density of (a) culture medium, (b) cell numbers and (c) viability duringfermentation. �: Unsupplemented pitching yeast; �: supplemented medium; �: supplemented pitching yeast.
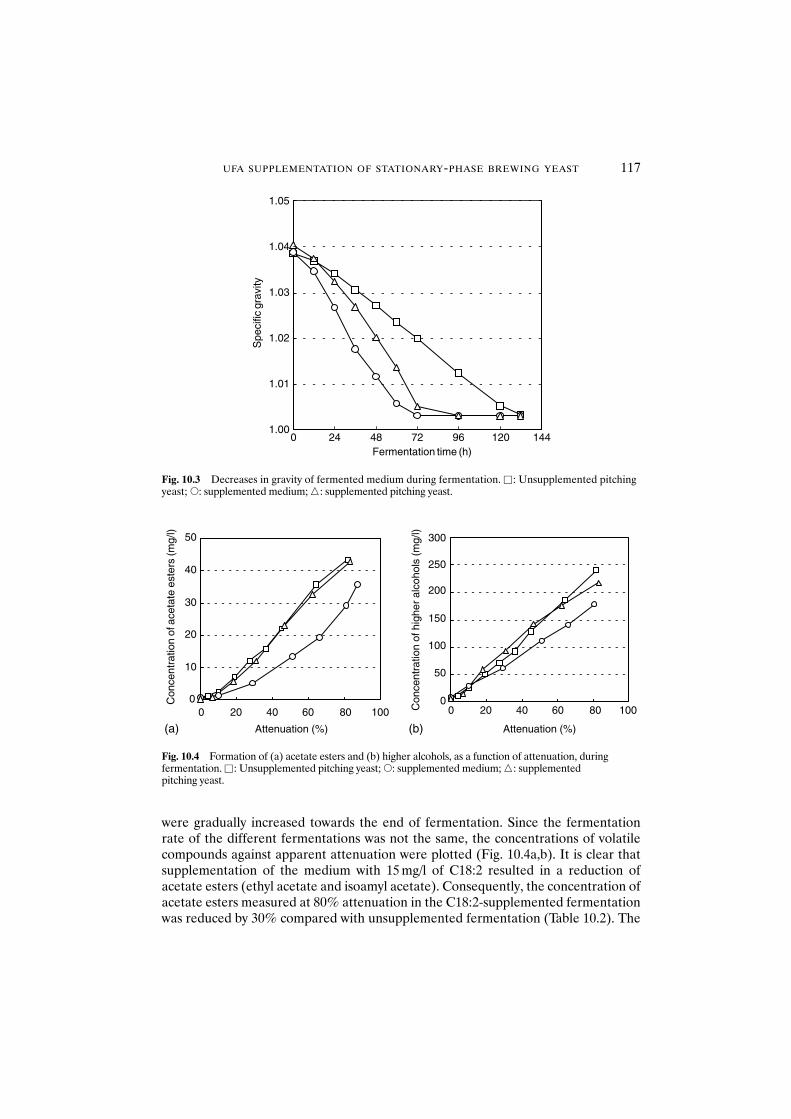
UFA SUPPLEMENTATION OF STATIONARY-PHASE BREWING YEAST 117
were gradually increased towards the end of fermentation. Since the fermentationrate of the different fermentations was not the same, the concentrations of volatilecompounds against apparent attenuation were plotted (Fig. 10.4a,b). It is clear thatsupplementation of the medium with 15 mg/l of C18:2 resulted in a reduction ofacetate esters (ethyl acetate and isoamyl acetate). Consequently, the concentration ofacetate esters measured at 80% attenuation in the C18:2-supplemented fermentationwas reduced by 30% compared with unsupplemented fermentation (Table 10.2). The
1.00
1.01
1.02
1.03
1.04
1.05
0 24 48 72 96 120 144Fermentation time (h)
Spe
cific
gra
vity
Fig. 10.3 Decreases in gravity of fermented medium during fermentation. �: Unsupplemented pitchingyeast; �: supplemented medium; �: supplemented pitching yeast.
0
10
20
30
40
50
0 20 40 60 80 100 0 20 40 60 80 1000
50
100
150
200
250
300
(a) (b)Attenuation (%) Attenuation (%)
Con
cent
ratio
n of
ace
tate
est
ers
(mg/
l)
Con
cent
ratio
n of
hig
her
alco
hols
(m
g/l)
Fig. 10.4 Formation of (a) acetate esters and (b) higher alcohols, as a function of attenuation, duringfermentation. �: Unsupplemented pitching yeast; �: supplemented medium; �: supplemented pitching yeast.
118 BREWING YEAST FERMENTATION PERFORMANCE
Table 10.2 Concentration of volatile compounds in fermented medium at 80% attenuation
Volatile compounds Concentration of volatile compounds (mg/l) measured at80% attenuation
Unsupplemented Supplemented Supplementedpitching yeast medium pitching yeast
Ethyl acetate 38.7 26.5 36.8Isoamyl acetate 3.7 2.3 4.5Total acetate esters 42.4 28.8 41.3
Propanol 16.3 16.3 19.8Isobutanol 62.2 45.7 47.4Isoamyl alcohol 152.5 118.8 140.0Total higher alcohols 231.0 180.8 207.2
concentrations of higher alcohols (propanol, isobutanol and isoamyl alcohol) werealso reduced. In the case where C18:2-supplemented pitching yeast cells were used,the production of acetate esters was as high as in C18:2 unsupplemented fermenta-tion pitched with unsupplemented cells. It seemed likely that the C18:2 content ofsupplemented pitching yeast did not affect the synthesis of esters during fermenta-tion. This is explained by the lower initial intracellular content in C18:2, owing to thesupplementation of the pitching yeast occurring in the resting state in an exhaustedfermentation medium. This explanation was excluded where the pitching yeast cellswere enriched by C18:2 supplementation during propagation.11
10.4 Conclusions
The possibility was investigated of restoring the yeast cell membrane optimal compos-ition through supplementation of pitching yeast with a UFA as an alternative to wortoxygenation. In particular, the effects on acetate ester synthesis were considered. The results indicate that supplementation of cropped yeast with linoleic acid, beforepitching, may be a convenient way to improve the physiological conditions of pitchingyeast without affecting the yeast growth and the fermentation rate, while the produc-tion of volatile compounds is enhanced. This technique may therefore offer a valuablealternative for the current practice of wort aeration and fatty acid supplementation. Inthese experiments a synthetic complex medium was used and further research isneeded using wort.
References
1. Searle, B.A. and Kirsop, B.H. (1979) Sugar utilization by a brewing yeast in relation to the growth andmaintenance phase of metabolism. J. Inst. Brew. 85, 342–345.
2. Boulton, C.A. and Quain, D.E. (1987) Yeast, oxygen and the control of brewery fermentations. Proc. Eur. Brew. Conv. Cong. 21, 401–408.
3. Chen, E.C.H. (1980) Utilization of wort fatty acids by yeast during fermentation. J. Am. Soc. Brew.Chem. 38, 148–153.
4. DeVries, K. (1990) Determination of free fatty acids in wort and beer. J. Am. Soc. Brew. Chem. 48,13–17.
5. David, M.H. and Kirsop, B.H. (1972) The varied response of brewing yeasts to oxygen and sterol treat-ment. J. Am. Soc. Brew. Chem. 30, 14–16.
6. Taylor, G.T., Thurston, P.A. and Kirsop, B.H. (1979) The influence of lipids derived from malt spentgrains on yeast metabolism and fermentation. J. Inst. Brew. 85, 219–227.
7. Dufour, J.P. and Malcorp, M. (1994) Ester synthesis during fermentation: enzyme characterization andmodulation mechanism. Proc. 4th Aviemore Conference on Malting, Brewing and Distilling, Institute ofBrewing, Aviemore, pp. 137–151.
8. Fujji, T., Kobayashi, O., Yoshimoto, H. et al. (1997) Effects of aeration and unsaturated fatty acids onexpression of the Saccharomyces cerevisiae alcohol acetyltransferase gene. J. Appl. Environ. Microbiol.63, 910–915.
9. Quain, D.E. (1988) Studies on yeast physiology – impact on fermentation performance and productquality. J. Inst. Brew. 95, 315–323.
10. Thurston, P.A., Quain, D.E. and Tubb, R.S. (1982) Lipid metabolism and the regulation of volatileester synthesis in Saccharomyces cerevisiae. J. Inst. Brew. 88, 90–94.
11. Thurston, P.A., Taylor, R. and Ahvenainen, J. (1981) Effects of linoleic acid supplements on the synthesisby yeast of lipids and acetate esters. J. Inst. Brew. 87, 92–95.
12. Moonjai, N., Delvaux, F.R., Derdelinckx, G. and Verachtert, H. (2000) Unsaturated fatty acid supple-mentation of stationary phase brewing yeast. Cerevisia 3, 37–50.
13. Chen, E.C.-H. (1981) Fatty acid profiles of some cultured and wild yeasts in brewery. J. Am. Soc. Brew.Chem. 39, 117–124.
14. Quain, D.E. (1981) The determination of glycogen in yeasts. J. Inst. Brew. 87, 289–291.15. Trevelyan, W.E. and Harrison, J.S. (1956) Studies on yeast metabolism. J. Biochem. 63, 23–33.16. Spiro, R.G. (1966) Analysis of sugar found in glycoprotiens. Methods Enzymol. 8, 3–5.17. EBC Analytica Microbiologica, Method 3.2.1.1 (1992).18. Lillie, S.H. and Pringle, J.R. (1980) Reserve carbohydrate metabolism in S. cerevisiae: responses to
nutrient limitation. J. Bacteriol. 143, 1384–1394.19. Wiemken, A. (1990) Trehalose in yeast: stress protectant rather than reserve carbohydrate. Antonie van
Leeuwenhoek 58, 209–217.20. Callaerts, G., Iserentant, D. and Verachtert, H. (1993) Relationship between trehalose and sterol accu-
mulation during oxygenation of cropped yeast. J. Am. Soc. Brew. Chem. 51, 75–77.21. Guldfeldt, L.U. and Arneborg, N. (1998) The effect of yeast trehalose content at pitching on fermen-
tation performance during brewing fermentations. J. Inst. Brew. 104, 37–39.22. Quain, D.E. and Tubb, R.S. (1982) The important of glycogen in brewing yeast. Master Brew. Assoc.
Am. Tech. Q. 19, 29–33.23. Cunningham, S. and Stewart, G.G. (2000) Acid washing and serial repitching a brewing ale strain of
Saccharomyces cerevisiae in high gravity wort and the role of wort oxygenation conditions. J. Inst. Brew.106, 389–402.
UFA SUPPLEMENTATION OF STATIONARY-PHASE BREWING YEAST 119
11 Impact of Wort Composition on Flocculation
B. AXCELL
Abstract Traditionally, wort has been regarded as a source of nutrients for yeasts.However, since the late 1950s several brewers have reported that some worts contain sub-stances that can affect yeast flocculation, particularly by causing this to happen prematurelybefore fermentation is complete. More recent work has shown that the situation may bemore complex than originally thought and that actual damage to the yeast membrane mayalso occur, which then interferes with the uptake of sugars. The lack of attenuation oftenseen in such worts may therefore be due to factors modifying the cell membrane as opposedsimply to causing the yeast to drop out of suspension. The impact of the malting and brew-ing process on wort composition is reviewed and a hypothesis for premature flocculation is proposed.
11.1 Introduction
Wort is a complex ‘soup’ of carbohydrates, proteins, lipids and their various degradationproducts, together with polyphenols, hop compounds, and a variety of organic andinorganic molecules. Generally speaking, this spectrum of compounds (plus a littleoxygen) will provide yeast with all the nutrients it needs to grow and convert sugar toalcohol. Some brewers believe that zinc and some other trace metals may be limitingand will add supplements before pitching the yeast. In general, the pattern of fermen-tation is predictable for a given wort composition, and the alcohol yield and yeastgrowth patterns follow expected trends. Occasionally, however, the yeast growth andflocculation patterns show abnormal characteristics and the amount of carbohydrateconverted to alcohol is less than expected.1,2 The brewer often reacts to this scenarioby assuming that there is a deficiency in the wort caused by a change in the malt thathas been processed. Zinc3 and the combination of zinc and manganese are essentialfor efficient yeast fermentation. Biotin4 is also an essential cofactor and biotin-deficientworts have resulted in very poor yeast growth. Oxygen deficiencies can also give riseto slow and incomplete fermentation. Another possibility is that the yeast used was oflow vitality for some reason.
However, rather than a deficiency, several compounds present in wort have alsobeen shown to produce tailing fermentations or impact on yeast flocculation patterns.For example, furfural and hydroxymethyl furfural5 are known to reduce fermentationrates, possibly by acting as sugar mimics and blocking the sites of sugar uptake. In thelate 1950s, researchers at Kirin in Japan started to report on the impact of several sub-stances that caused premature flocculation of their yeast.6,7 Kudo6 found that an acidhydrolysate of spent grain that he termed ‘Barmigen’ produced early flocculation ofthe yeast. Preliminary work indicated that Barmigen was a type of humic acid. Thesame author7 also isolated a substance called ‘Treberin’ from Japanese six-row barleymalt that had a similar effect on yeast. Acid hydrolysis of this substance yieldedglucose, xylose and arabinose, indicating that treberin was a gum-like polysaccharide.
Brewing Yeast Fermentation Performance: Second edition
Edited by: KATHERINE SMART Copyright 0 Blackwell Science 2003
IMPACT OF WORT COMPOSITION ON FLOCCULATION 121
In 1975, Morimoto et al.8 isolated an arabinoxylan–protein complex from wort, whichproduced similar effects. Fujii and Horie9 isolated a factor from wort in the same year,which caused premature flocculation and, when analysed, was shown to be an acidicpolysaccharide containing protein. The fact that treatment with Pronase caused lossof activity suggested for the first time that protein played an essential role in this factor.
In the late 1970s some of the breweries of South African breweries also experi-enced problems with the yeast flocculating prematurely and tailing fermentations.1 Afactor was isolated from malt husk that was found to generate these problem fermen-tations when added back to a ‘normal’ all-malt wort in 2 litre laboratory EBC fer-mentations. This factor appeared to be produced in the steeping process and was veryheat stable as well as resistant to wide changes in pH. Further work in this area10,11
identified a high molecular weight polysaccharide containing arabinose, xylose, glucose,mannose, galactose and rhamnose, together with an acidic sugar component. It waspostulated through immunoelectron microscopy that this polysaccharide binds to theyeast cell surface and produces its effect by cross-bridging adjacent cells. The bindingwith the yeast cell was suggested to be via lectin-like proteins, which act as cell-surfacereceptors. N-Acetylglucosamine was shown to inhibit premature flocculation throughhapten-type inhibition and it was possible to unbind the polysaccharide factor fromflocculated yeast cells by incubating them with a solution containing glucose, man-nose and N-acetylglucosamine.
More recently, Axcell et al.2 proposed a hypothesis for premature flocculationinvoking the presence of antimicrobial peptides in wort. It was postulated that anti-microbial peptides (4–10 kDa), because of their cationic nature, would bind not only to yeast, but also to high molecular weight polysaccharides which would then cross-react with other yeast cells, generating flocs and causing premature flocculation. Thelow molecular weights of the peptides would have made them difficult to detect in thepresence of high molecular weight polysaccharides, which may explain the focus onpolysaccharides in many of the previous papers.
11.2 Molecular mechanism of yeast flocculation
Brewing yeast, Saccharomyces cerevisiae, flocculates spontaneously at the end offermentation. For bottom-fermenting strains, the flocs settle to the bottom of thefermenter and the majority of cells can then be easily removed from the fermentedwort. Flocculation is a reversible, active aggregation of cells into flocs and its timing in the fermentation process is important to achieve good beer quality. Aggregation ofmicroorganisms is not limited to yeast but also occurs among a wide variety ofbacteria, filamentous fungi and algae.12 Premature flocculation hampers completefermentation of the growth medium, whereas failure of the cells to flocculate at the end of the fermentation process necessitates the use of centrifugation or otherseparation techniques to remove the cells.
Early theories on flocculation supposed that cells behaved as negatively chargedcolloids.13 Subsequent theories postulated calcium bridging, whereby calcium ionslinked adjacent cells by coupling to carboxyl groups.14 However, the inhibition of floc-culation by specific sugars such as mannose could not be explained by these theories.
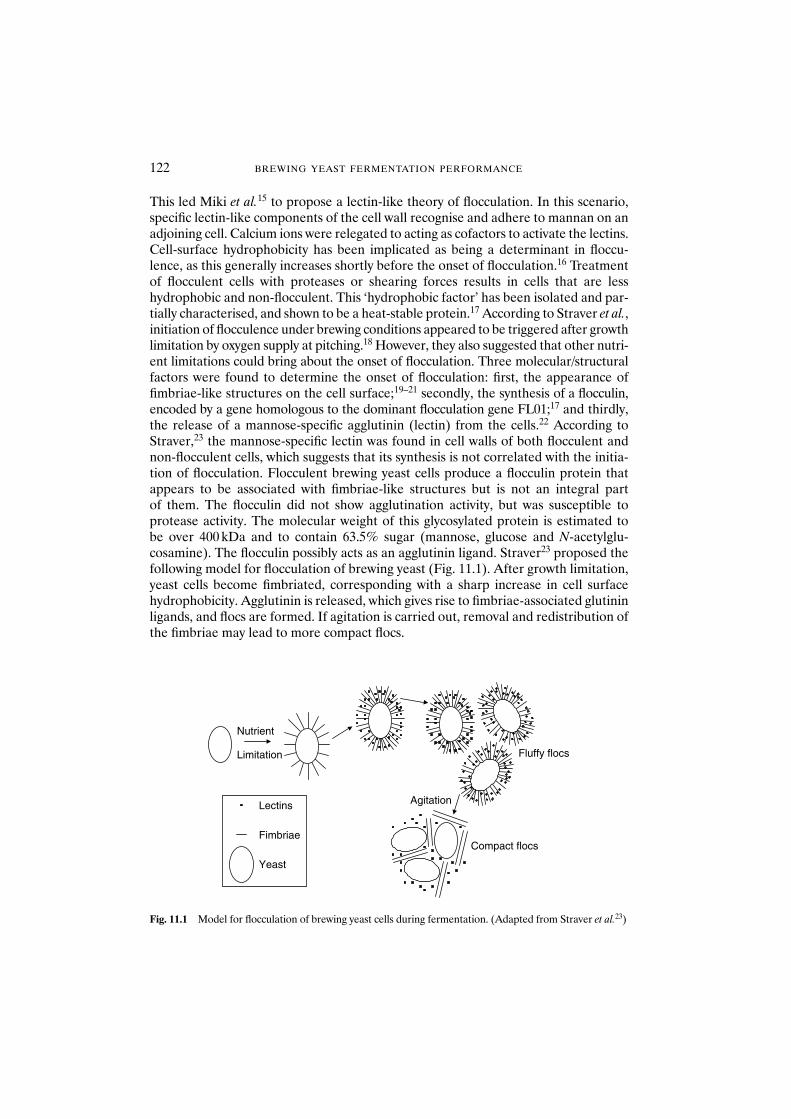
122 BREWING YEAST FERMENTATION PERFORMANCE
This led Miki et al.15 to propose a lectin-like theory of flocculation. In this scenario,specific lectin-like components of the cell wall recognise and adhere to mannan on anadjoining cell. Calcium ions were relegated to acting as cofactors to activate the lectins.Cell-surface hydrophobicity has been implicated as being a determinant in floccu-lence, as this generally increases shortly before the onset of flocculation.16 Treatmentof flocculent cells with proteases or shearing forces results in cells that are lesshydrophobic and non-flocculent. This ‘hydrophobic factor’ has been isolated and par-tially characterised, and shown to be a heat-stable protein.17 According to Straver et al.,initiation of flocculence under brewing conditions appeared to be triggered after growthlimitation by oxygen supply at pitching.18 However, they also suggested that other nutri-ent limitations could bring about the onset of flocculation. Three molecular/structuralfactors were found to determine the onset of flocculation: first, the appearance offimbriae-like structures on the cell surface;19–21 secondly, the synthesis of a flocculin,encoded by a gene homologous to the dominant flocculation gene FL01;17 and thirdly,the release of a mannose-specific agglutinin (lectin) from the cells.22 According toStraver,23 the mannose-specific lectin was found in cell walls of both flocculent andnon-flocculent cells, which suggests that its synthesis is not correlated with the initia-tion of flocculation. Flocculent brewing yeast cells produce a flocculin protein thatappears to be associated with fimbriae-like structures but is not an integral part of them. The flocculin did not show agglutination activity, but was susceptible toprotease activity. The molecular weight of this glycosylated protein is estimated to be over 400 kDa and to contain 63.5% sugar (mannose, glucose and N-acetylglu-cosamine). The flocculin possibly acts as an agglutinin ligand. Straver23 proposed thefollowing model for flocculation of brewing yeast (Fig. 11.1). After growth limitation,yeast cells become fimbriated, corresponding with a sharp increase in cell surfacehydrophobicity. Agglutinin is released, which gives rise to fimbriae-associated glutininligands, and flocs are formed. If agitation is carried out, removal and redistribution ofthe fimbriae may lead to more compact flocs.
Nutrient
Limitation Fluffy flocs
Agitation
Compact flocs
Lectins
Fimbriae
Yeast
Fig. 11.1 Model for flocculation of brewing yeast cells during fermentation. (Adapted from Straver et al.23)
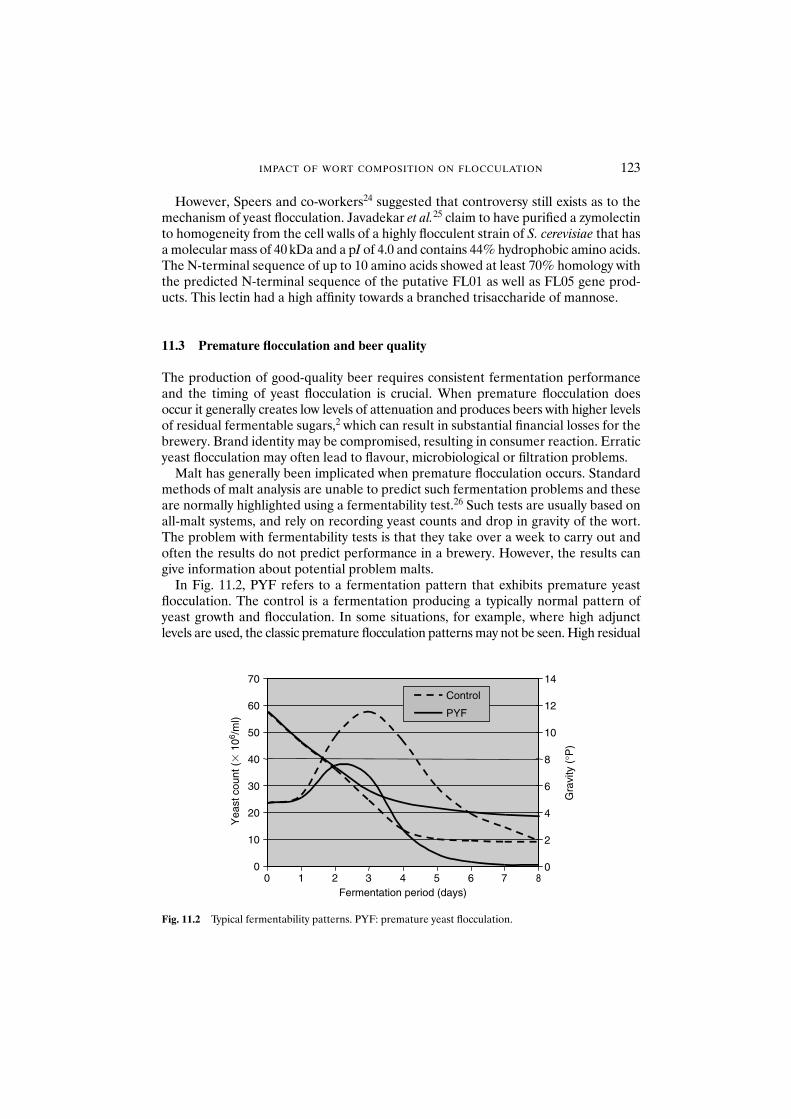
IMPACT OF WORT COMPOSITION ON FLOCCULATION 123
However, Speers and co-workers24 suggested that controversy still exists as to themechanism of yeast flocculation. Javadekar et al.25 claim to have purified a zymolectinto homogeneity from the cell walls of a highly flocculent strain of S. cerevisiae that hasa molecular mass of 40 kDa and a pI of 4.0 and contains 44% hydrophobic amino acids.The N-terminal sequence of up to 10 amino acids showed at least 70% homology withthe predicted N-terminal sequence of the putative FL01 as well as FL05 gene prod-ucts. This lectin had a high affinity towards a branched trisaccharide of mannose.
11.3 Premature flocculation and beer quality
The production of good-quality beer requires consistent fermentation performanceand the timing of yeast flocculation is crucial. When premature flocculation doesoccur it generally creates low levels of attenuation and produces beers with higher levelsof residual fermentable sugars,2 which can result in substantial financial losses for thebrewery. Brand identity may be compromised, resulting in consumer reaction. Erraticyeast flocculation may often lead to flavour, microbiological or filtration problems.
Malt has generally been implicated when premature flocculation occurs. Standardmethods of malt analysis are unable to predict such fermentation problems and theseare normally highlighted using a fermentability test.26 Such tests are usually based onall-malt systems, and rely on recording yeast counts and drop in gravity of the wort.The problem with fermentability tests is that they take over a week to carry out andoften the results do not predict performance in a brewery. However, the results cangive information about potential problem malts.
In Fig. 11.2, PYF refers to a fermentation pattern that exhibits premature yeastflocculation. The control is a fermentation producing a typically normal pattern ofyeast growth and flocculation. In some situations, for example, where high adjunctlevels are used, the classic premature flocculation patterns may not be seen. High residual
0
10
20
30
40
50
60
70
0 1 2 3 4 5 6 7 8Fermentation period (days)
Yea
st c
ount
(�
106 /
ml)
0
2
4
6
8
10
12
14
Control
PYF
Gra
vity
(°P
)
Fig. 11.2 Typical fermentability patterns. PYF: premature yeast flocculation.
sugar concentrations are an indication of problematic malt and this is recorded in thefermentability test as high residual gravities at the end of fermentation. Commercially,such malts produce beers that have high real extract values and poor levels of alcoholconversion. If sucrose is used as the adjunct, this may leave residual fructose in thebeer and produce beer with a significant sweet note. Typically, rousing the yeast doesnot alleviate the problem, although the introduction of fresh yeast will often resultin continued fermentation. Previous observations2 have shown that in a commercialsituation, some breweries are more prone to these fermentation problems than others.Breweries that run bright worts would appear to be more susceptible than these runningcloudier worts. The reduced fermentability is not just due to a lack of nucleation sitesin the clearer worts, as the addition of protein-based ‘yeast foods’ did not improvematters.27 If dextrose adjuncts are used, residual glucose is not necessarily a problem,but maltose and maltrotriose can be found in the final beer at excessive levels.
One question arising out of the above observation is whether or not premature floc-culation is always linked to these low-attenuation fermentations. When prematureflocculation does occur, the fermented wort always has a higher residual gravity thannormal. This may be due to there being too little yeast left in suspension to finish thefermentation or because sugar uptake is impaired. In those cases where the yeast doesnot prematurely flocculate, it would seem that sugar uptake is definitely impaired andrequires fresh yeast addition to finalise the fermentation.
11.4 The antimicrobial peptide hypothesis
In 2000, Axcell et al.2 suggested that the phenomenon of tailing fermentations andpremature flocculation may be linked and that the prime causative agents may beantimicrobial peptides of the lipid transfer protein (LTP) or thionin type.
As far back as 1970,28 Okado et al. isolated a substance from wheat and barley that wastoxic to yeast. In a second paper29 they demonstrated that although this substance wastoxic at 4 ppm, it was able to inhibit the uptake of glucose when present at one-tenth ofthis concentration without causing death of the cell. This ‘toxin’ had a molecular weightof 9.8 kDa and an isoelectric point of greater than 10. It was identified as a peptide thatwas resistant to proteolysis and heat, but that its effects on yeast could be reduced by thepresence of divalent ions such as calcium. These attributes are general properties ofsome antimicrobial peptide groups such as the thionins and non-specific LTPs.
Non-specific LTPs in plants are a family of homologous peptides that have molecu-lar weights between 9 and 10 kDa. Within the brewing literature, LTP is perhaps bestknown for its putative role in producing a stable foam on beer.30,31 The name LTP wasoriginally proposed as these polypeptides were able to transfer different kinds of lipidbetween liposomes and mitochondria in vitro.32 More recently, Molina et al.33 andTerras et al.34 demonstrated that LTP2, LTP3 and LTP4 can exhibit potent antimicro-bial activity against a range of bacterial and fungal pathogens. Another group of smallcysteine-rich basic polypeptides with antimicrobial activity that can be inhibited bycalcium ions is the thionins. These have molecular weights in the 4–5 kDa range.Okada’s toxin could therefore be an LTP type of polypeptide or a thionin dimer.Thionin dimers have been shown to bind to yeast through an electrostatic action with
124 BREWING YEAST FERMENTATION PERFORMANCE
the negatively charged membrane phospholipids.35 Their strong cationic and amphi-pathic character allows them to interact between hydrophobic aliphatic acyl chainsand the polar head groups in contact with the aqueous environment and cause disrup-tion of the membrane function.
As stated earlier, much of the initial work carried out on premature flocculationhighlighted the role of complex carbohydrates.6–11 These were produced either fromextraction of spent grains or by washing yeast that had prematurely flocculated with�-methylmannoside. These polysaccharides contained a variety of sugars (xylose, ara-binose, glucose, mannose, galactose, rhamnose), but also often contained acidic groupssuch as uronic acid moieties. However, antibodies produced to these carbohydratesthat were isolated in the laboratory failed to discriminate between control malts andthose causing premature flocculation, suggesting that these polysaccharides werepresent in both types of malt (W. Vundla, South African Breweries, personal commu-nication, 2001) at similar levels. Fujii and Horie9 found that an acidic polysaccharidecontaining protein was responsible for premature flocculation in their breweries andthat after treatment with pronase this activity was lost. The diverse nature of thesugars reported in these complexes, however, suggests that they are not specific poly-saccharide components derived from the malt but rather a mixture of sugars that haveassociated together. The research of Fujii and Horie also indicates the essential roleof the protein component and would suggest that carbohydrate alone cannot bringabout premature flocculation. Earlier work1,10,11 focused on carbohydrate, but therewere always traces of protein present, which were interpreted at the time as being con-taminants. More recent work2 has concentrated on cationic polypeptides and theirpotential involvement in abnormal fermentations.
Samples of whole malt exhibiting premature flocculation can be washed in distilledwater; when this water extract is added back to a malt exhibiting normal fermentationpatterns, premature flocculation will result. The factor(s) present in this aqueousextract are heat stable and resistant to a wide range of pH. They have been shown tobe antifungal when assayed against Penicillium, and to contain LTPs using an antibodycapture enzyme-linked immunosorbent assay (ELISA) system with rabbit anti-LTP1polyclonal antibodies.2
11.5 Possible mechanism for premature flocculation
Early work by Okada had already demonstrated that the binding of his ‘toxin’ was tonegative charges on the yeast, which could be alleviated by high levels of calcium ions.He furthermore demonstrated that flocculent yeast was more susceptible than non-flocculent yeast to this peptide. As the mannose-specific lectin appears to be producedby both flocculent and non-flocculent yeast, this would not seem to be important inmediating the binding. The hydrophobic factor or the flocculin could, however, beinvolved. As most antimicrobial peptides isolated from plants are cationic and amphi-pathic it is likely that they would act in a similar manner to Okada’s toxin. They appearto change and disrupt membrane integrity, leading to impairment of sugar uptake andresulting in leakage of cell constituents. However, the present author’s results wouldsupport the view that while these peptides, when present, can cause poor attenuation,
IMPACT OF WORT COMPOSITION ON FLOCCULATION 125
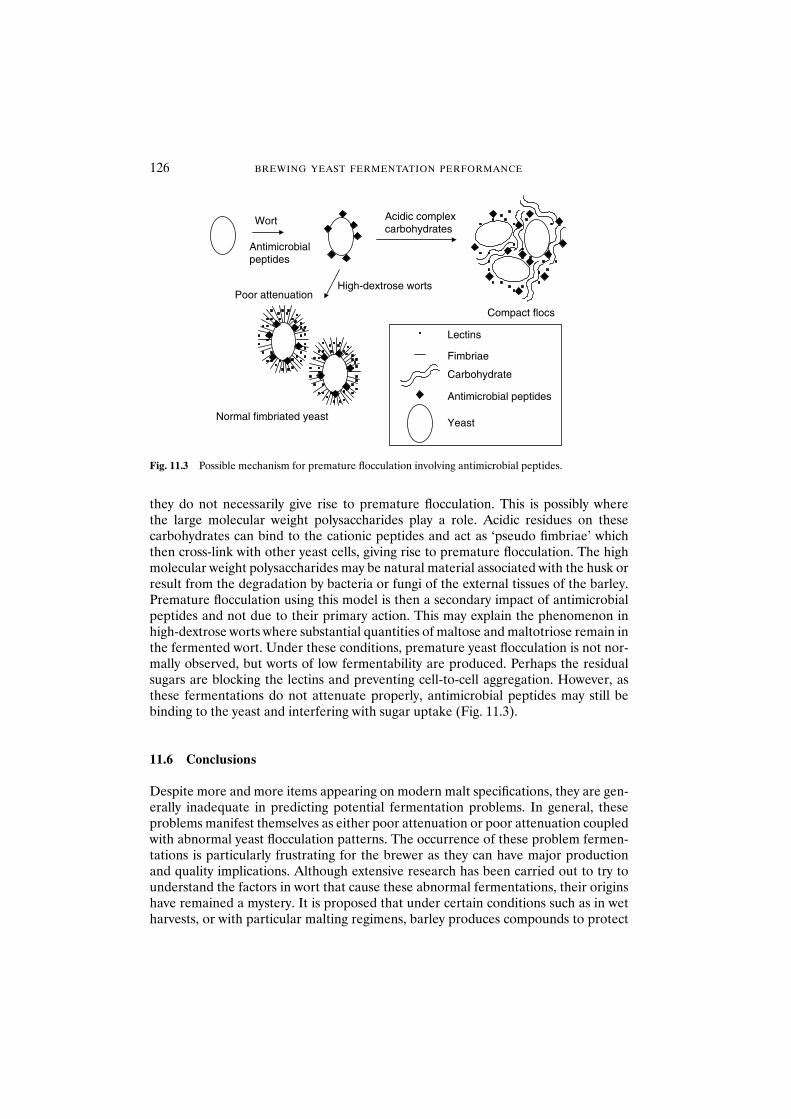
126 BREWING YEAST FERMENTATION PERFORMANCE
they do not necessarily give rise to premature flocculation. This is possibly where the large molecular weight polysaccharides play a role. Acidic residues on thesecarbohydrates can bind to the cationic peptides and act as ‘pseudo fimbriae’ whichthen cross-link with other yeast cells, giving rise to premature flocculation. The highmolecular weight polysaccharides may be natural material associated with the husk orresult from the degradation by bacteria or fungi of the external tissues of the barley.Premature flocculation using this model is then a secondary impact of antimicrobialpeptides and not due to their primary action. This may explain the phenomenon inhigh-dextrose worts where substantial quantities of maltose and maltotriose remain inthe fermented wort. Under these conditions, premature yeast flocculation is not nor-mally observed, but worts of low fermentability are produced. Perhaps the residualsugars are blocking the lectins and preventing cell-to-cell aggregation. However, asthese fermentations do not attenuate properly, antimicrobial peptides may still bebinding to the yeast and interfering with sugar uptake (Fig. 11.3).
11.6 Conclusions
Despite more and more items appearing on modern malt specifications, they are gen-erally inadequate in predicting potential fermentation problems. In general, theseproblems manifest themselves as either poor attenuation or poor attenuation coupledwith abnormal yeast flocculation patterns. The occurrence of these problem fermen-tations is particularly frustrating for the brewer as they can have major productionand quality implications. Although extensive research has been carried out to try tounderstand the factors in wort that cause these abnormal fermentations, their originshave remained a mystery. It is proposed that under certain conditions such as in wetharvests, or with particular malting regimens, barley produces compounds to protect
Wort
Antimicrobialpeptides
Compact flocs
Acidic complexcarbohydrates
High-dextrose wortsPoor attenuation
Lectins
Fimbriae
Carbohydrate
Antimicrobial peptides
Normal fimbriated yeastYeast
Fig. 11.3 Possible mechanism for premature flocculation involving antimicrobial peptides.
IMPACT OF WORT COMPOSITION ON FLOCCULATION 127
itself against microbial attack. These compounds are generally small polypeptidesthat are heat and pH stable and are located on the outside of the grain. In brewing,they are extracted into the wort, survive the wort boiling stage and remain active duringfermentation. The antimicrobial peptides are strongly cationic and amphipathic andwill bind to negative groups on the yeast, eventually disrupting membrane integrityand interfering with sugar uptake. Complex, high molecular weight carbohydratespresent in the wort and derived from the malt can bind to these polypeptides andform ‘pseudo-fimbriae’, which can then react with lectins on other yeast cells, formingcompact flocs and bringing about premature flocculation. Currently, this remains justa hypothesis and further work is required to verify this proposal. However, this hypoth-esis explains most of the observations reported previously in the literature and goessome way towards explaining why both the malting process and the brewing processmay minimise or accentuate these problems. For example, one malting plant may pro-vide more anaerobic conditions than another, and this may lead to the rapid growthof certain microorganisms and generate a response by the germinating barley. In anotherexample, wort produced in one brewery may contain more lipid material than onefrom another location and this lipid may then be able to ‘titrate’ out the antimicrobialpeptides so that they cannot subsequently bind to the yeast.
Wort, therefore, cannot simply be looked at as a medium containing appropriatenutrients for the fermentation of yeast. It is a very complex liquid and may containmany compounds that can influence fermentation and flocculation.
Within the brewing industry, very few brewers measure much more than wort colour,pH, bitterness and gravity. Ultimately, to improve the prediction of fermentation per-formance, it may be necessary to define wort composition more accurately and have afew more key definitive measures in place.
References
1. Axcell, B.C., Tulej, R. and Mulder, C.J. (1986) The influence of the malting process on maltfermentability performance. Proc. 19th Conv. Inst. Brew., Aust. N.Z. Sect. pp. 163–169.
2. Axcell, B.C., van Nierop, S. and Vundla, W. (2000) Malt induced premature yeast flocculation. Tech. Q.Master Brew. Assoc. Am. 37, 501–504.
3. Ault, R.G. and Whitehouse, A.G.R. (1952) Determination of zinc in beer and brewing materials. J. Inst. Brew. 58, 136–139.
4. McLeod, A.M. (1979) The Physiology of Malting in Brewing Science, Vol. 1, Pollack, J.R.A. (ed.).Academic Press, London.
5. Ingram, M., Mossel, D.A.A. and de Lange, P. (1955) Factors, produced in sugar-acid browning reactions,which inhibit fermentation. Chem. Ind. 63–64.
6. Kudo, S. (1958) Studies on yeast flocculation. Rep. Res. Lab. Kirin Brew. Co. Ltd 1, 47–51.7. Kudo, S. and Kijima, M. (1960) Studies of yeast flocculation. Rep. Res. Lab. Kirin Brew. Co. Ltd 3, 33–37.8. Morimoto, K., Shimazu, T., Fujii, T. and Horie, Y. (1975) Some substances in malt inducing early floc-
culation of yeast. Rep. Res. Lab. Kirin Brew. Co. Ltd 18, 63–74.9. Fujii, T. and Horie, Y. (1975) Some substances in malt inducing early flocculation of yeast, Part 2.
Rep. Res. Lab. Kirin Brew. Co. Ltd 18, 75–85.10. Herrera, V.E. and Axcell, B.C. (1991) Induction of premature yeast flocculation by a polysaccharide
fraction isolated from malt husk. J. Inst. Brew. 97, 359–366.11. Herrera, V.E. and Axcell, B.C. (1991) Studies on the binding between yeast and a malt polysaccharide
that induces heavy yeast flocculation. J. Inst. Brew. 97, 367–373.12. Straver, M.H., Kijne, J.W. and Smit, G. (1993) Cause and control of flocculation in yeast. Trends
Biotechnol. 11, 228–232.
13. Kruyt, H.R. (1952) In: Colloid Science, Vol. 1, Kruyt, H.R. (ed.). Elsevier, Amsterdam, pp. 1–57.14. Mill, P.J. (1964) Nature of the interactions between flocculent cells in Saccharomyces cerevisiae. J. Gen.
Microbiol. 35, 61–68.15. Miki, B.L.A., Poon, N.H., James, A.P. and Seligy, V.L. (1982) Possible mechanisms for flocculation
interaction governed by gene FL01 in Saccharomyces cerevisiae. J. Bacteriol. 150, 887–889.16. Smit, G., Straver, M.H., Lugtenberg, B.J.J. and Kijne, J.W. (1992) Flocculence of Saccharomyces cerevisiae
cells is induced by nutrient limitation, with cell surface hydrophobicity as a major determinant. Appl.Environ. Microbiol. 58, 3709–3714.
17. Straver, M.H., Smit, G. and Kijne, J.W. (1994) Purification and partial characterisation of a flocculinfrom brewers yeast. Appl. Environ. Microbiol. 60, 2754–2758.
18. Straver, M.H., Smit, G. and Kijne, J.W. (1993) Determinants of flocculence of brewers yeast duringfermentation in wort. Yeast 9, 527–532.
19. Day, A.W., Poon, N.H. and Stewart, G.G. (1975) Fungal fimbriae, III, The effect on flocculation inSaccharomyces cerevisiae. Can. J. Microbiol. 21, 558–564.
20. Stewart, G.G. (1981) The genetic manipulation of industrial yeast strains. Can. J. Microbiol. 27,973–990.
21. Straver, M.H., Smit, G. and Kijne, J.W. (1994) Induced cell surface hydrophobicity influences flocculationof brewer’s yeast in a flocculation assay. In: Colloids Surfaces B: Biointerfaces. Elsevier, Amsterdam.
22. Straver, M.H., Traas, V.M., Smit, G. and Kijne, J.W. (1994) Isolation and partial purification ofmannose – specific agglutinin from brewers yeast involved in flocculation. Yeast 10, 1183–1193.
23. Straver, M.H. (1993) Molecular mechanism of yeast flocculation. PhD Thesis, State University ofLeiden, The Netherlands.
24. Jin, Y.-L., Ritcey, L.L., Speers, R.A. and Dolphin, P.J. (2001) Effect of cell surface hydrophobicity,charge, and zymolectin density on the flocculation of Saccharomyces cerevisiae. J. Am. Soc. Brew. Chem.59, 1–9.
25. Javadekar, V.S., Sivaraman, H., Sainkar, S.R. and Khan, M.I. (2000) A mannose-binding protein fromthe cell surface of flocculent Saccharomyces cerevisiae (NCIM 3528): its role in flocculation. Yeast 16,99–110.
26. Kruger, L., Ryder, D.S., Alcock, C. and Murray, J. (1982) Malt quality. Prediction of malt fermentability,Part 1. Tech. Qu. Master Brew. Assoc. Am. 19, 45–51.
27. Axcell, B.C., Kruger, L. and Allan, G. (1988) Some investigative studies with yeast foods. Proc. 20thConv. Inst. Brew., Aust. N.Z. Sect., Brisbane, pp. 201–209.
28. Okada, T., Yoshizumi, H. and Terashima, Y. (1970) A lethal toxic substance for brewing yeast in wheatand barley, Part I. Agric. Biol. Chem. 34, 1084–1088.
29. Okada, T. and Yoshizumi, H. (1970) A lethal toxic substance for brewing yeast in wheat and barley, Part II.Agric. Biol. Chem. 34, 1089–1094.
30. Sorensen, S.B., Bech, L.M., Muldbjerg, M. et al. (1993) Barley lipid transfer protein I is involved in beerfoam formation. Tech. Q. Master Brew. Assoc. Am. 30, 136–145.
31. Lusk, L.T., Goldstein, H. and Ryder, D. (1995) Independent role of beer proteins, melanoidins andpolysaccharides in foam formation. J. Am. Soc. Brew. Chem. 53, 93–103.
32. Molina, A. and Garcia-Olmedo, F. (1993) Developmental and pathogen-induced expression of threebarley genes encoding lipid transfer proteins. Plant J. 4, 983–991.
33. Molina, A., Segura, A. and Garcia-Olmedo, F. (1993) Lipid transfer proteins (nsLTPs) from barley andmaize leaves are potent inhibitors of bacterial and fungal plant pathogens. FEBS Lett. 316, 199–122.
34. Terras, F.R.G., Schoofs, H., De Bolle, M.F.C. et al. (1992) Analysis of two novel classes of antifungalproteins from radish (Raphanus sativus L.) seeds. J. Biol. Chem. 267, 15301–15309.
35. Therissen, K., Ghazi, A., De Samblanx, G.W. et al. (1996) Fungal membrane responses induced byplant defensins and thionins. J. Biol. Chem. 271, 15018–15025.
128 BREWING YEAST FERMENTATION PERFORMANCE

Part 4 Yeast Quality Maintenance and Assessment
12 Management of Multi-strain, Multi-site Yeast Storage and Supply
A.I. KENNEDY, B. TAIDI, A. AITCHISON andX. GREEN
Abstract Amalgamation of brewing companies and the continued increase in national andinternational franchise/contract brewing operations have resulted in brewing companiesand individual breweries handling an ever-increasing number of yeast strains. Geneticallystable, aseptic and confidential storage of a master culture of each yeast strain is essential.It is common practice for brewery yeast cultures to be used to pitch fermentations for amaximum of 10 times, after which each pitching yeast slurry at each brewery is replaced bya new culture of yeast. Centrally held master cultures are used to supply fresh yeast forbrewery propagation and subsequent fermentations.
The method of choice for long-term yeast strain storage is using liquid nitrogen, amethod that has been employed by Scottish Courage Brewing Ltd since 1983. Master cul-tures were selected from brewery yeast populations after performing a range of micro-biological, biochemical and fermentation tests on the isolates. Franchise partners havesupplied other yeast strains. This presentation will describe the ‘cascade’ system used byScottish Courage for the storage of its brewing yeast strains. The master cultures are heldin straws placed in close proximity to or within liquid nitrogen. Agar slopes (slants) aremade from master cultures and quality assured following ISO 9000 accredited method-ology. Batches of approximately 20 slopes are made from the culture in each straw. Oneslope is always sacrificed to test the batch for microbiological contamination, viability andrespiratory-deficient yeast mutants (petites). In addition, the identity of each batch ofslopes is confirmed using molecular biology analysis techniques such as polymerase chainreaction. Duplicate cultures of all yeast strains are held confidentially by the NationalCollection of Yeast Cultures as a back-up.
In total, 12 brewing yeast strain master cultures are held at the Scottish Courage Tech-nical Centre in Edinburgh using liquid nitrogen storage. These strains are used to supply10 breweries with over 600 agar slopes between them during the course of each year. Theyeast storage and supply management systems in place have proved to be robust and reli-able over a number of years, giving breweries in the group confidence in the quality of theyeast supplied to initiate brewery propagations.
12.1 Introduction
12.1.1 Historical perspective
Traditionally, the majority of breweries produced either ales or lagers, and each brew-ery would use a single yeast strain (or even a mixed culture) to brew all of its products.In many cases there would be little or no strain maintenance, with the yeast pitchedfrom one fermentation to the next ad infinitum. This situation can be seen to persistto the present day in a few smaller ale breweries in the UK, especially those usingmixed strains. Simple procedures had subsequently been introduced into a number of
Brewing Yeast Fermentation Performance: Second edition
Edited by: KATHERINE SMART Copyright 0 Blackwell Science 2003
breweries where the brewing strain was maintained by regular subculturing ontoslopes made from solidified wort.
During the 1970s, significant changes in market forces resulted in a requirement forthe production of ales and lagers in the same brewery. Fortunately, the yeast strainsinvolved were usually easily distinguishable using simple microbiological techniques,and most brewers had moved away from mixed cultures to single-strain cultures forproduction. Also at this time, the microbiological support and techniques available tohelp the brewer were becoming more and more advanced.
The late 1980s onwards saw a dramatic change in the way that many brewing com-panies operated, especially in the UK. The 1990s was a decade of take-over, amalgam-ation and consolidation in the brewing industry, and also saw a dramatic rise in thelevel of contract and franchise brewing being undertaken. Today, this has resulted ina small number of large companies who now focus more on brands rather than genericproducts, and who must be able to demonstrate brand integrity, be it internally or,more likely, to a franchise partner.
All of these factors have resulted in brewing companies and individual brewerieshandling more brewing yeast strains concurrently than ever before. The need for areliable and secure system of brewing yeast strain maintenance and starter culturesupply has therefore become a priority for many brewing companies.
12.2 Yeast culture management
12.2.1 Aims
A good yeast strain management system in a large, modern, multi-site brewing com-pany must ensure the integrity of strain supply. The stability of desirable characteris-tics of each yeast strain involved must be assured, and the introduction of undesirabletraits minimised, usually by the regular introduction of new yeast cultures. Systems inplace must be not only cost-effective, but also secure, as individual brewing yeaststrains can be one of the most important assets owned by a brewing company.
12.2.2 Strategies for strain maintenance
Historically, various methods have been used for preserving brewing yeast cultures,1
including the ‘nil option’ (pitch on continually), subculturing (broth to broth, or slopeto slope), desiccation, lyophilisation and cryopreservation (either at �70°C, orat �196°C in liquid nitrogen). Several studies have demonstrated that cryopreserva-tion in liquid nitrogen is the method of choice for the maintenance of yeast cultures,both for the optimal storage of the yeast strains2,3 and for a positive impact on subse-quent fermentation performance.4
Up until the early 1980s Scottish Courage, like many other brewing companies,maintained their brewing yeast strains by regular subculture onto agar slopes andstorage at 4°C. Cryopreservation, using liquid nitrogen, was introduced in 1983 tohelp overcome the potential problems of genetic variation exacerbated by the subcul-turing regimen.1 For a number of years after the introduction of cryopreservation,
132 BREWING YEAST FERMENTATION PERFORMANCE
each brewing yeast strain was reselected annually from a culture in use in the breweryat that time. This ‘annual master’ was stored in liquid nitrogen and used to supplystarter cultures to the breweries for the next 12 months. After several years, whenconfidence in the stability of the liquid nitrogen system had been built up, it wasdecided to select a single ‘master culture’ of each strain in use and lay down sufficientstocks of the culture to guarantee supply for a considerable length of time.
12.2.3 Selection of master cultures
A master culture for each production strain was selected from the existing brewerypopulation or previous annual master cultures held in liquid nitrogen, based on theresults of a number of tests, as detailed below. One-hundred isolates from eachsource were tested and the six ‘best’ (from a single source) pooled to produce the mas-ter culture. Six isolates were pooled rather than selecting a single isolate, as there wasalways the possibility that a single clone could be lacking an important attribute thathad not been tested for (e.g. enzyme activity), which could cause problems in subse-quent fermentations.
12.2.4 Testing procedures
One-hundred isolates, picked from a wort agar plate, were grown in small culturebottles using a rich classification medium and underwent a range of tests. A typicalprofile for each brewing yeast strain had already been defined.
12.2.4.1 Flocculation (Tullo) and adhesion. After incubation the culture supernatantwas carefully decanted and the adhesion of the yeast sediment to the bottle wasobserved and recorded. The sediment was then suspended and the degree of floccu-lation assessed visually. The flocculation category of the yeast was classified by theTullo system.
12.2.4.2 Sedimentation (Helm’s test). Yeast taken from the classification culture bot-tles was fermented in test-tubes of broth. The yeast was suspended in the incubatedsedimentation tubes by vortexing, and an absorptiometer, measuring the transmittanceof white light with a 609 nm filter, was used to assess the degree of sedimentation.
12.2.4.3 Sugar utilisation. Yeast from classification culture bottles was inoculatedinto carbohydrate broths and incubated for 7 days at 27°C. Fermentation-positiveyeast isolates were those that fermented the carbohydrate provided, and producedcarbon dioxide and sediment (biomass). The carbohydrate sources used were galactose,meliobiose and maltotriose. Atypical isolates were quickly identified.
12.2.4.4 Head formation. Wort in tall test-tubes was inoculated with yeast isolates(again taken from the classification culture bottles) and incubated for 3 days at roomtemperature. After incubation, the top of the fermented wort was examined for theformation of a yeasty head. Comparison of the head formation characteristics of anumber of isolates indicated whether the isolate was normal or atypical.
YEAST STORAGE AND SUPPLY MANAGEMENT 133
12.2.4.5 Petite stability. Loss of mitochondrial function can occur spontaneously inindividual brewing yeast cells. This mutation results in an inability to respire carbonsources and gives a low yield of biomass relative to normal cells under aerobic conditions (e.g. during yeast propagation). A high percentage of petite mutants in a brewing yeast population can give a risk of excessive diacetyl formation. The small colonies produced by these mutant cells on agar plates gives rise to the term ‘petite’.Respiratory-deficient cells are unable to reduce tetrazolium dye to a coloured form.Normal colonies are red–pink, whereas petite colonies are white after exposure to anindicator dye. A ‘healthy’ brewing yeast culture should have less than 2% petite colonies in the population.
12.2.4.6 Fermentation performance. Laboratory-scale (2 litre EBC tall tubes) and pilotbrewery-scale (36 hl fermentation vessels) trials were carried out, and a large range ofparameters was monitored to ensure that the expected fermentation performancewas achieved.
12.2.5 Deposition in liquid nitrogen
Following the fermentation trials, the six pooled isolates were deposited into the liquidnitrogen storage system. The yeast was grown for 3 days in YM broth and a cell countand viability measurement were carried out to confirm successful propagation. Thecell count was adjusted to 1 � 107 cells/ml and mixed with an equal amount of cryo-protectant (glycerol). Small sections of autoclaved drinking straw were filled with theculture and heat sealed. After slow freezing overnight, five straws were placed in eachcolour-coded cryo-vial and the vials were then deposited into the liquid nitrogen bank.The straws were held just above the liquid level, at a temperature of about �145°C.
12.2.6 Cascade storage system
A ‘cascade’ storage system was used to ensure an almost infinite supply of the desig-nated master culture of each brewery yeast strain. Fifty straws of the yeast were pre-pared (master culture) and stored in liquid nitrogen. One straw was retrieved andused to prepare 50 more straws (the working master culture). A single straw from theworking master culture was then removed from storage and used to prepare 20 slopes,as detailed below. These slopes were then subjected to the same range of tests as wasused to select the master culture from the brewery population, ensuring that therehad been no drift in desirable characteristics. Only after the yeast propagated fromone of these slopes had undergone successful fermentation trials, at laboratory (EBCtall tubes), pilot brewery and full production scale, was the master culture held in liquid nitrogen ‘signed off’ as the true master culture. Once the 50 straws of the work-ing master culture have been exhausted, a second true master straw can be used toprepare 50 more, so providing an almost indefinite supply of yeast.
12.2.7 Retrieval from liquid nitrogen and slope preparation
On removal from liquid nitrogen storage, a straw of yeast was placed in sterile salineat room temperature to thaw gradually. The straw was then surface-sterilised with
134 BREWING YEAST FERMENTATION PERFORMANCE
methylated spirits and cut open aseptically. The contents were mixed and 0.05 ml wasadded to 0.95 ml of YM broth (recovery medium). After 3 days’ incubation at 27°C,this yeast culture was used to prepare a batch of slopes. Pre-prepared YM slopes wereused, and 20 were inoculated from each liquid nitrogen straw, then incubated for 3 days at 27°C.
12.2.8 Quality assurance
Two slopes from each batch prepared were sacrificed, and underwent a battery of testsbefore the rest of the batch could be certified as ready for release to the breweries toinitiate new propagations.
12.2.8.1 Freedom from contamination. Yeast growth on a slope was slurried withsterile saline and plated out onto a range of selective agars to examine for microbialcontamination:
• YM � copper for Saccharomyces wild yeasts• lysine agar for non-Saccharomyces wild yeasts• WLN at 37°C for ale/lager yeast cross-contamination• WLD for aerobic bacteria• Raka Ray agar (anaerobic incubation) for anaerobic, beer spoilage bacteria• WLN at 27°C for 7 days for colony morphology check.
12.2.8.2 Petite mutants. The level of petite mutants in the yeast population on thesacrificed slope was determined as before.
12.2.8.3 Viability. The viability of the yeast on the freshly grown slope was measuredusing the methylene violet stain5 before despatch. Levels close to 100% were expectedand achieved routinely.
12.2.8.4 Genetic confirmation of identity. The identity of the yeast on the sacrificedslope was confirmed before dispatch using genetic techniques. With a large number ofdifferent yeast strains being held at a central facility, it is imperative that the correctyeast strain is supplied on each occasion.
The DNA of Saccharomyces yeast is packaged into 17 chromosomes which range in length from 0.031 to 0.85 nm. The contour-clamped homogeneous electric field(CHEF)6 electophoresis technique can be used to separate the chromosomes on thebasis of their lengths to give a specific fingerprint of the yeast strain. Unfortunately, anumber of closely related yeast strains, presumably from a very similar genetic origin,cannot be identified using this technique. A second technique must be used to separatethese yeasts (usually lager strains).
Target nucleotide sequences (specific to each Scottish Courage brewing yeast strain)can be copied repeatedy using the polymerase chain reaction (PCR) technique. Suffi-cient quantities of the DNA segments can be produced within a few hours so that thepresence or absence of the specific sequences can be determined by electrophoresis.Details of the specific DNA primers used in this work have been published previously.7
YEAST STORAGE AND SUPPLY MANAGEMENT 135
12.2.9 Integrity of supply
A colour-coding system is used for each individual yeast strain, from liquid nitrogenstraw through to prepared yeast slopes ready for delivery. After preparation, thoseslopes under test are physically segregated from those ‘certified’ for release. Each slopeis labelled with a unique batch number and ‘use by’ date (16 weeks from the date ofpreparation). A certificate of analysis is sent out with each batch of slopes, and uponarrival at the brewery a form is returned confirming the identity of the yeast and itscondition. The whole yeast management and supply system is the subject of regularaudit, both internal and by external bodies such as BSI (as part of ongoing ISO 9001accreditation).
At the beginning of each year, a monthly delivery schedule for yeast slopes isdevised. Extra slopes are prepared to allow an early response to ad hoc requests forslopes. Batches of slopes, packed in insulated boxes with ice packs, are sent to thebreweries using an overnight courier service and are subjected to standard storage,recovery and laboratory propagation procedures.8
12.2.10 Statistics
In total, 12 brewing yeast strains are involved, and 10 brewing sites across the UK andworld-wide are supplied with yeast slopes from the central facility. Approximately 600slopes are dispatched each year. Capital outlay for the equipment was approximately£10 000, with an ongoing cost of weekly liquid nitrogen delivery. The maintenance ofthe culture collection and slope preparation takes up approximately 50% of a techni-cian’s time.
12.3 Conclusions
Seventeen years’ experience of liquid nitrogen storage has confirmed it to be the bestavailable method for the maintenance of brewing yeast strains. Six years’ experienceof using the cascade system has shown it to be ideal for the robust, reliable and securestorage of yeast master cultures and supply of starter culture slopes. This is evidencedby feedback from the breweries involved, who report reproducibility of propagationand consistency of fermentation performance. The systems in place have proven to beboth flexible and cost-effective for a large, multi-site brewing group.
Acknowledgements
The authors would like to thank the directors of Scottish Courage Brewing Ltd forpermission to publish this article.
References
1. Kirsop, B.E. and Doyle, A. (1991) Maintenance of Microorganisms and Cells. A Manual of LaboratoryMethods. Academic Press, London.
136 BREWING YEAST FERMENTATION PERFORMANCE
2. Russell, I. and Stewart, G.G. (1981) Liquid nitrogen storage of yeast cultures compared to more trad-itional storage methods. J. Am. Soc. Brew. Chem. 39, 19–24.
3. Walker, G.M. (1998) Yeast Physiology and Biotechnology. Wiley, Chichester.4. Hulse, G., Bihl, G., Morakile, G. and Axcell, B. (2000) Optimisation of storage and propagation for con-
sistent lager fermentations. In: Brewing Yeast Fermentation Performance, Smart, K. (ed.). BlackwellScience, Oxford, pp. 161–169.
5. Smart, K.A., Chambers, K.M., Lambert, I. et al. (1999) Use of methylene violet staining procedures todetermine yeast viability and vitality. J. Am. Soc. Brew. Chem. 57, 18–23.
6. Pedersen, M.G. (1994) Molecular analysis of yeast DNA – tools for pure yeast maintenance in the brewery. J. Am. Soc. Brew. Chem. 52, 23–27.
7. Coakley, M., Ross, R.P. and Donnelly, D. (1996) Application of the polymerase chain reaction to therapid analysis of brewery yeast strains. J. Inst. Brew. 102, 349–354.
8. Kennedy, A.I. (2000) Yeast handling in the brewery. In: Brewing Yeast Fermentation Performance, Smart,K. (ed.). Blackwell Science, Oxford, pp. 129–134.
YEAST STORAGE AND SUPPLY MANAGEMENT 137
13 Comparison of Yeast Viability/Vitality Methods andTheir Relationship to Fermentation Performance
L.R. WHITE, K.E. RICHARDSON, A.J. SCHIEWE and C.E. WHITE
Abstract In the brewhouse, consistent beer production is the ultimate goal. Experiencedbrewers implement techniques and methods to curb inconsistencies. Command over rawingredients, sanitation, fermentation and packaging is desired. Because yeast lendstremendous flavour and character to beer, brewers attempt to determine yeast quality bymeasurement of its viability and/or its vitality. Ascertaining the physiological condition ofyeast is useful information for creating a consistent product.
Small-scale microbreweries face an even greater challenge, with limited laboratory equip-ment and space. In this study, various methods were applied for determining yeast viabilityand vitality that could be easily replicated in most microbreweries. Recently, the accuracy ofthe standard methylene blue viability stain has been questioned. Improved reliability andreproducibility with other staining methods, such as methylene violet, have recentlyemerged within the brewing industry. This laboratory compared citrate methylene blue,alkaline methylene violet, alkaline methylene blue (AMB), acidification power (AP) andstandard plate count against fermentation studies to determine the best method for assess-ing yeast viability and vitality. Laboratory-grown ale and lager yeast were followed over a 6 month storage period, viability and vitality were measured, and small-scale fermentationwas performed at various intervals.
Vital dye results were unreliable for aged, poor cell wall-defined yeast. AMB and AP werefound to have the best correlation between apparent viability/vitality and fermentationperformance for yeast with well-defined cell walls. AP gave the most accurate time-lineevaluation of yeast and correlation with yeast performance.
13.1 Introduction
In the brewhouse, yeast is susceptible to changes in pH, temperature, oxygen, ethanol,CO2, nutrition and gravity, to name a few factors. Stressed yeast may lose its ability toreplicate, become unable to ferment or die. Ascertaining the condition of the yeast isuseful in repitching a consistent number of ‘live’ yeast cells.1
Breweries have attempted to determine yeast quality by measurement of viability (thepercentage of live cells within a population) and/or vitality (metabolically active yeast).Methods for testing the viability and vitality of yeast cells centre around three generalprinciples: loss of replication capability, cell damage and loss of metabolic activity.2
Vital dyes have become the standard for viability testing. Vital dye staining challengesthe integrity of the cell wall as well as the ability of the cell to reduce or extrude the dyeand remain colourless.3 Methylene blue staining has been the standard for assessingyeast viability since the 1920s.2,4 However, this method has recently been questionedgiven its poor reproducibility and inaccuracy with apparent viability below 90%.5 Otherdyes, such as methylene violet, have recently been introduced as an improved staining
Brewing Yeast Fermentation Performance: Second edition
Edited by: KATHERINE SMART Copyright 0 Blackwell Science 2003
COMPARISON OF YEAST VIABILITY/VITALITY METHODS 139
alternative.6 Fluorescent staining procedures have also been attempted (reviewed else-where in this book). Finally, the acidification power test, which measures the ability ofthe yeast cell to retain proper intracellular and extracellular hydrogen ion concentra-tions, is a relatively simple measurement of vitality7 and has been previously suggestedas an alternative to vital stains.6
This study compared citrate methylene blue (CMB), citrate methylene violet (CMV),alkaline methylene blue (AMB), acidification power (AP) and standard plate count(SPC) against fermentation studies to determine the best method for assessing yeastviability.
13.2 Materials and methods
13.2.1 Yeast
Several White Labs commercial strains of Saccharomyces cerevisiae were used forexperimental protocols. Yeast was grown aerobically in a sterile malt media and storedat 4°C until analysis. The age of yeast reflects the date from which the yeast was stored.Yeast was allowed to reach room temperature and then diluted with sterile deionisedwater to reach a concentration of 1 � 107 cells/ml. Heat-stressed (HS) yeast was placedin a 87.8°C (190°F) water bath for 3 min. Heat-killed (HK) yeast was subjected to 4 minof microwaving at high power.
13.2.2 Citrate methylene blue
Methylene blue was dissolved in a sodium citrate solution (2%) to a final concentra-tion of 0.01%. Yeast was diluted with sterile deionised water to reach a concentrationof 1 � 107 cells/ml suspension. Then, 0.5 ml of yeast suspension was added to 0.5 mlCMB and gently agitated. The solution was examined microscopically after 2 min.Dark blue cells were counted as dead. The viability was tested in duplicate unlessresults were greater than 0.2% different. An additional count was performed if such adiscrepancy existed. The mean viability counts were represented according to themethods outlined previously.6,8
13.2.3 Alkaline methylene blue
A methylene blue stock solution (0.1%) was diluted 10-fold with a 0.1 M glycine buffersolution, pH 10.6. Then, 0.5 ml of yeast suspension (1 � 107 cells/ml) was added to0.5 ml of alkaline methylene blue staining solution, mixed and incubated for 15 min atroom temperature. Yeast cells were examined microscopically and medium to darkblue cells were recorded as dead, while pale blue and unstained cells were counted asliving. The viability was tested in triplicate. The mean viability counts were representedaccording to the methods outlined previously.6
13.2.4 Alkaline methylene violet
The same method of preparation was used as with AMB, substituting methylene violet3 RAX for methylene blue. Cells were considered dead if they displayed any variation
140 BREWING YEAST FERMENTATION PERFORMANCE
of pink colour. The viability was tested in triplicate. The mean viability counts wererepresented according to the methods outlined previously.6
13.2.5 Acidification power
The pH meter was calibrated using the two-buffer method before each series of assays.Deionised water pH was adjusted to approximately 6.5 pH for AP studies. Steriledeionised water (15 ml) was placed in a 50 ml conical centrifuge tube containing a con-ical stir bar. The pH of the water was monitored for 5 min with constant stirring. At theend of 5 min, a pH reading was recorded (AP0) and 5 ml of concentrated yeast slurry(1 � 109 cells/ml) was added to the centrifuge tube. The yeast suspension was allowedto stir for 10 min, after which the pH was recorded (AP10). Immediately after therecording of the AP10, 5 ml of 20% glucose solution was added to the yeast suspensionand allowed to incubate for 10 min. At the end of 10 min the final pH reading wasrecorded (AP20). The acidification power was calculated by subtracting the AP20 fromthe AP0 reading. The assay was conducted in triplicate and the data were representedas the mean value obtained according to the method of Kara et al.7
13.2.6 Standard plate count
Yeast was diluted with sterile deionised water to achieve a concentration of 1–3 �103cells/ml. Then, 0.1 ml of diluted yeast solution was plated on 100 � 15 mm nutrientagar plates by spreading. Plates were incubated at 30°C for approximately 42 h.Individual colonies were counted and viability was reported as a mean percentage.
13.2.7 Fermentation
Fermentation to evaluate yeast performance was carried out in 2 litre flasks contain-ing approximately 1500 ml of sterile wort with an original gravity of �1.040. Cultureswere pitched with 1 � 106 cells/ml per degree Plato. Cultures were monitored byrecording pH and percentage of sugar.
13.3 Results and discussion
13.3.1 Citrate methylene blue
Methylene blue is an autoxidisable dye, whereby entry into the cytoplasm of a livingcell results in its oxidation to the colourless leuco-form.6 It is further suggested thatliving but damaged cell membranes may result in the occurrence of variable cellshading, which is likely to be responsible for inconsistent viability counts. Moreover,viability assessments conducted by different operators can yield data with errormargins within the range 10–20%. The accuracy of the methylene blue procedure hasbeen reported by some researchers to be reliable only at viabilities greater than 90%.5 It has also been reported that methylene blue will yield viabilities as high as30–40% at 0% true viability.
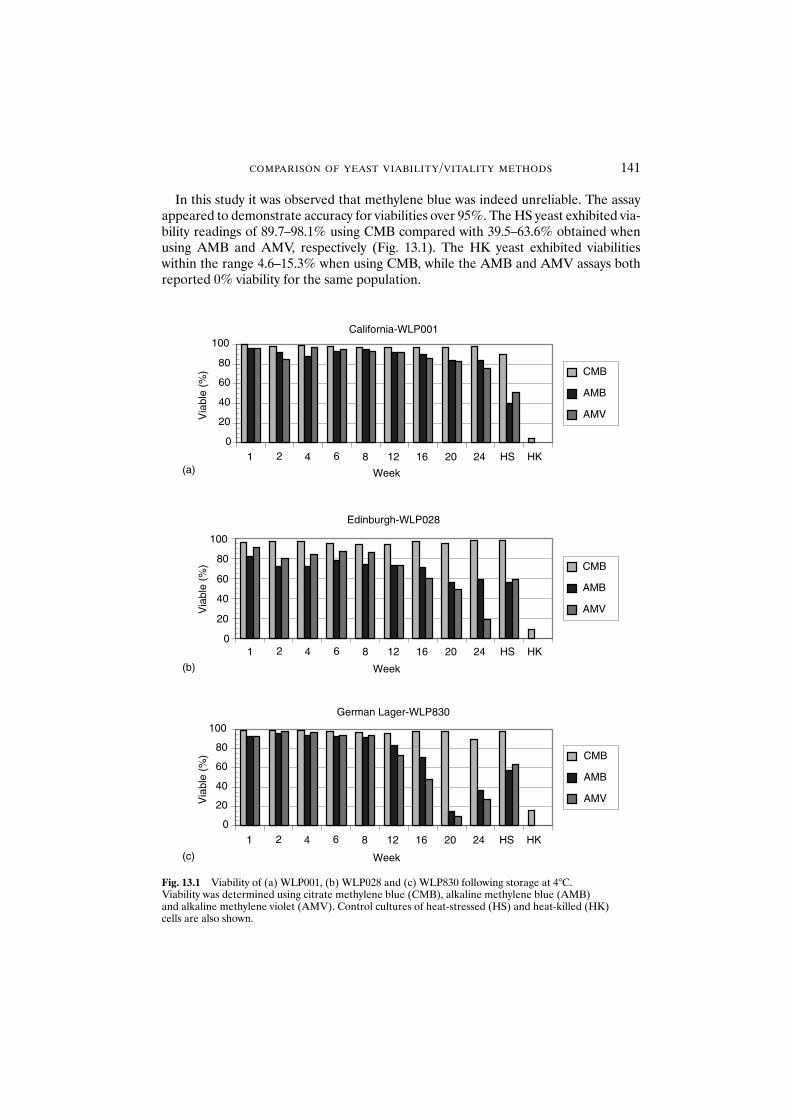
COMPARISON OF YEAST VIABILITY/VITALITY METHODS 141
In this study it was observed that methylene blue was indeed unreliable. The assayappeared to demonstrate accuracy for viabilities over 95%. The HS yeast exhibited via-bility readings of 89.7–98.1% using CMB compared with 39.5–63.6% obtained whenusing AMB and AMV, respectively (Fig. 13.1). The HK yeast exhibited viabilitieswithin the range 4.6–15.3% when using CMB, while the AMB and AMV assays bothreported 0% viability for the same population.
California-WLP001
0
20
40
60
80
100
81 642 12 16 20 24 HS HK
81 642 12 16 20 24 HS HK
81 642 12 16 20 24 HS HK
Week
Via
ble
(%) CMB
AMB
AMV
Edinburgh-WLP028
0
20
40
60
80
100
Week
Week
Via
ble
(%) CMB
AMB
AMV
German Lager-WLP830
0
20
40
60
80
100
Via
ble
(%) CMB
AMB
AMV
(a)
(b)
(c)
Fig. 13.1 Viability of (a) WLP001, (b) WLP028 and (c) WLP830 following storage at 4°C. Viability was determined using citrate methylene blue (CMB), alkaline methylene blue (AMB) and alkaline methylene violet (AMV). Control cultures of heat-stressed (HS) and heat-killed (HK) cells are also shown.
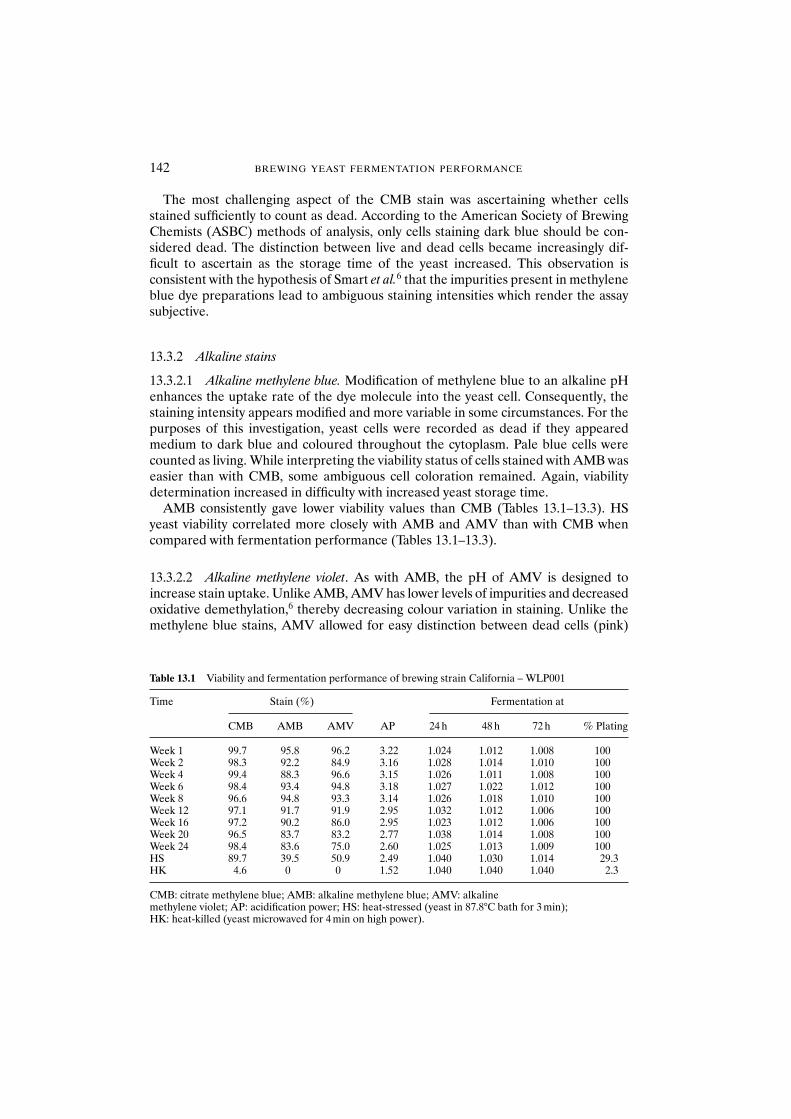
142 BREWING YEAST FERMENTATION PERFORMANCE
The most challenging aspect of the CMB stain was ascertaining whether cellsstained sufficiently to count as dead. According to the American Society of BrewingChemists (ASBC) methods of analysis, only cells staining dark blue should be con-sidered dead. The distinction between live and dead cells became increasingly dif-ficult to ascertain as the storage time of the yeast increased. This observation isconsistent with the hypothesis of Smart et al.6 that the impurities present in methyleneblue dye preparations lead to ambiguous staining intensities which render the assaysubjective.
13.3.2 Alkaline stains
13.3.2.1 Alkaline methylene blue. Modification of methylene blue to an alkaline pHenhances the uptake rate of the dye molecule into the yeast cell. Consequently, thestaining intensity appears modified and more variable in some circumstances. For thepurposes of this investigation, yeast cells were recorded as dead if they appearedmedium to dark blue and coloured throughout the cytoplasm. Pale blue cells werecounted as living. While interpreting the viability status of cells stained with AMB waseasier than with CMB, some ambiguous cell coloration remained. Again, viabilitydetermination increased in difficulty with increased yeast storage time.
AMB consistently gave lower viability values than CMB (Tables 13.1–13.3). HSyeast viability correlated more closely with AMB and AMV than with CMB whencompared with fermentation performance (Tables 13.1–13.3).
13.3.2.2 Alkaline methylene violet. As with AMB, the pH of AMV is designed toincrease stain uptake. Unlike AMB, AMV has lower levels of impurities and decreasedoxidative demethylation,6 thereby decreasing colour variation in staining. Unlike themethylene blue stains, AMV allowed for easy distinction between dead cells (pink)
Table 13.1 Viability and fermentation performance of brewing strain California – WLP001
Time Stain (%) Fermentation at
CMB AMB AMV AP 24 h 48 h 72 h % Plating
Week 1 99.7 95.8 96.2 3.22 1.024 1.012 1.008 100Week 2 98.3 92.2 84.9 3.16 1.028 1.014 1.010 100Week 4 99.4 88.3 96.6 3.15 1.026 1.011 1.008 100Week 6 98.4 93.4 94.8 3.18 1.027 1.022 1.012 100Week 8 96.6 94.8 93.3 3.14 1.026 1.018 1.010 100Week 12 97.1 91.7 91.9 2.95 1.032 1.012 1.006 100Week 16 97.2 90.2 86.0 2.95 1.023 1.012 1.006 100Week 20 96.5 83.7 83.2 2.77 1.038 1.014 1.008 100Week 24 98.4 83.6 75.0 2.60 1.025 1.013 1.009 100HS 89.7 39.5 50.9 2.49 1.040 1.030 1.014 29.3HK 4.6 0 0 1.52 1.040 1.040 1.040 2.3
CMB: citrate methylene blue; AMB: alkaline methylene blue; AMV: alkaline methylene violet; AP: acidification power; HS: heat-stressed (yeast in 87.8°C bath for 3 min); HK: heat-killed (yeast microwaved for 4 min on high power).
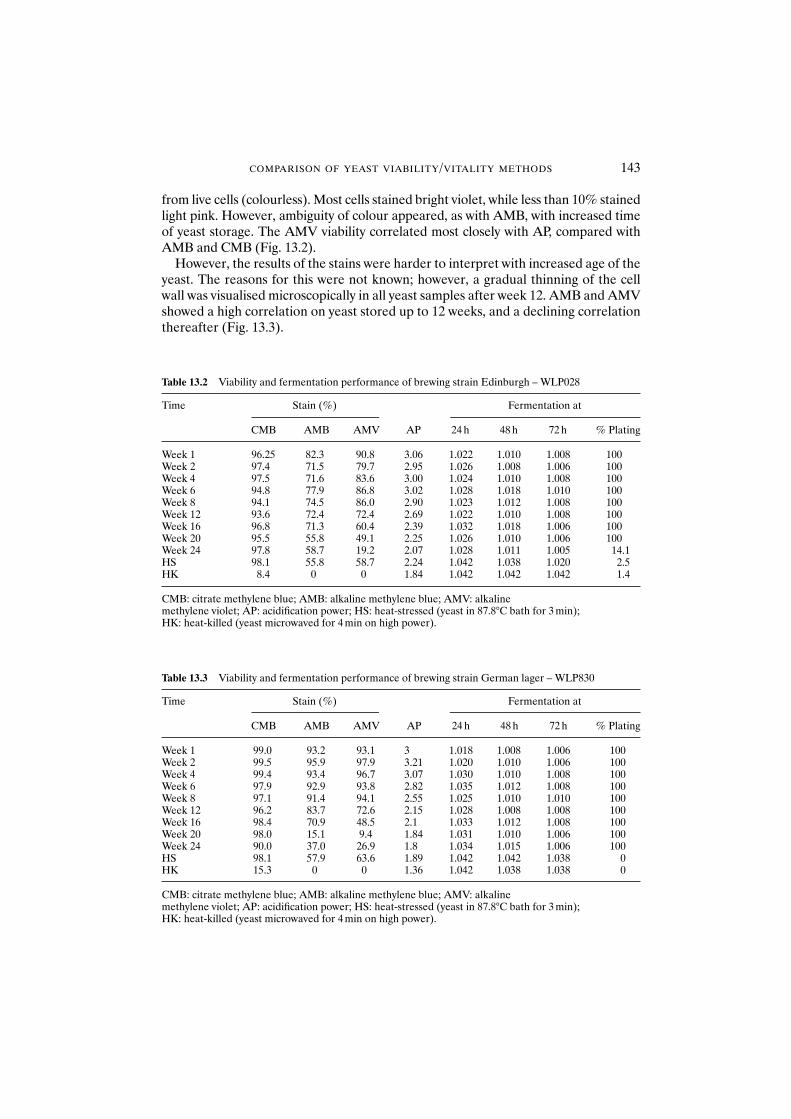
COMPARISON OF YEAST VIABILITY/VITALITY METHODS 143
from live cells (colourless). Most cells stained bright violet, while less than 10% stainedlight pink. However, ambiguity of colour appeared, as with AMB, with increased timeof yeast storage. The AMV viability correlated most closely with AP, compared withAMB and CMB (Fig. 13.2).
However, the results of the stains were harder to interpret with increased age of theyeast. The reasons for this were not known; however, a gradual thinning of the cellwall was visualised microscopically in all yeast samples after week 12. AMB and AMVshowed a high correlation on yeast stored up to 12 weeks, and a declining correlationthereafter (Fig. 13.3).
Table 13.2 Viability and fermentation performance of brewing strain Edinburgh – WLP028
Time Stain (%) Fermentation at
CMB AMB AMV AP 24 h 48 h 72 h % Plating
Week 1 96.25 82.3 90.8 3.06 1.022 1.010 1.008 100Week 2 97.4 71.5 79.7 2.95 1.026 1.008 1.006 100Week 4 97.5 71.6 83.6 3.00 1.024 1.010 1.008 100Week 6 94.8 77.9 86.8 3.02 1.028 1.018 1.010 100Week 8 94.1 74.5 86.0 2.90 1.023 1.012 1.008 100Week 12 93.6 72.4 72.4 2.69 1.022 1.010 1.008 100Week 16 96.8 71.3 60.4 2.39 1.032 1.018 1.006 100Week 20 95.5 55.8 49.1 2.25 1.026 1.010 1.006 100Week 24 97.8 58.7 19.2 2.07 1.028 1.011 1.005 14.1HS 98.1 55.8 58.7 2.24 1.042 1.038 1.020 2.5HK 8.4 0 0 1.84 1.042 1.042 1.042 1.4
CMB: citrate methylene blue; AMB: alkaline methylene blue; AMV: alkaline methylene violet; AP: acidification power; HS: heat-stressed (yeast in 87.8°C bath for 3 min); HK: heat-killed (yeast microwaved for 4 min on high power).
Table 13.3 Viability and fermentation performance of brewing strain German lager – WLP830
Time Stain (%) Fermentation at
CMB AMB AMV AP 24 h 48 h 72 h % Plating
Week 1 99.0 93.2 93.1 3 1.018 1.008 1.006 100Week 2 99.5 95.9 97.9 3.21 1.020 1.010 1.006 100Week 4 99.4 93.4 96.7 3.07 1.030 1.010 1.008 100Week 6 97.9 92.9 93.8 2.82 1.035 1.012 1.008 100Week 8 97.1 91.4 94.1 2.55 1.025 1.010 1.010 100Week 12 96.2 83.7 72.6 2.15 1.028 1.008 1.008 100Week 16 98.4 70.9 48.5 2.1 1.033 1.012 1.008 100Week 20 98.0 15.1 9.4 1.84 1.031 1.010 1.006 100Week 24 90.0 37.0 26.9 1.8 1.034 1.015 1.006 100HS 98.1 57.9 63.6 1.89 1.042 1.042 1.038 0HK 15.3 0 0 1.36 1.042 1.038 1.038 0
CMB: citrate methylene blue; AMB: alkaline methylene blue; AMV: alkaline methylene violet; AP: acidification power; HS: heat-stressed (yeast in 87.8°C bath for 3 min); HK: heat-killed (yeast microwaved for 4 min on high power).
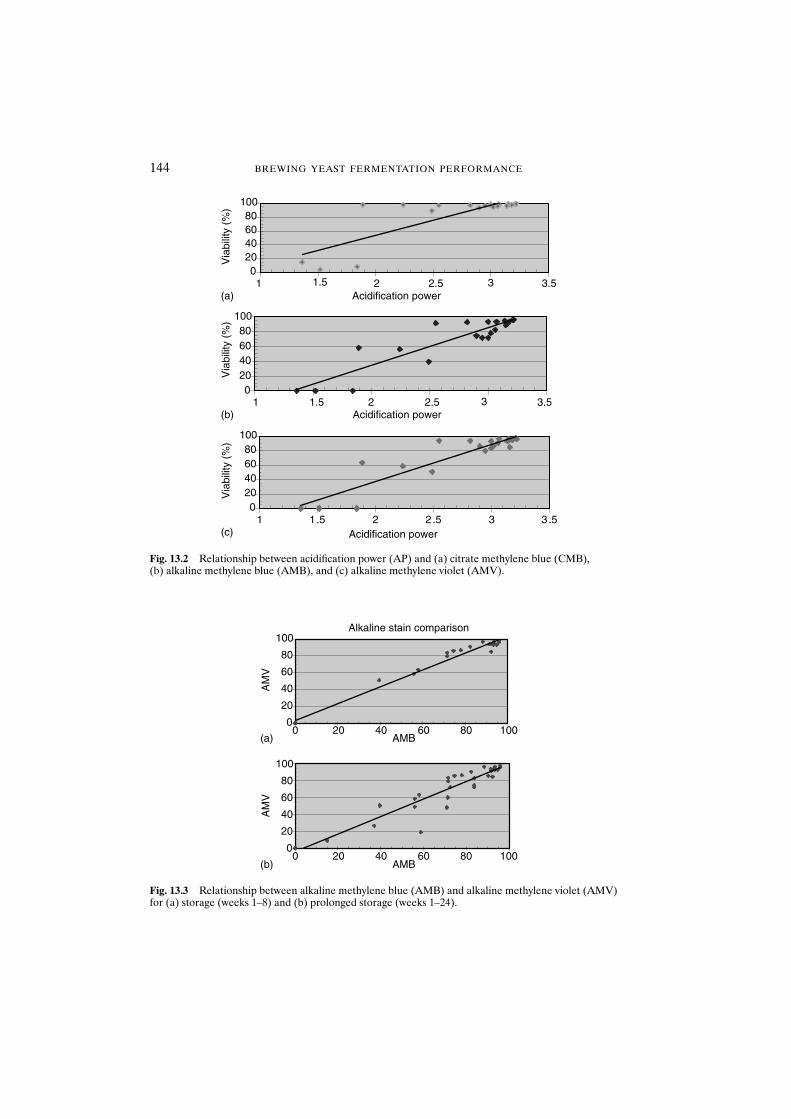
144 BREWING YEAST FERMENTATION PERFORMANCE
0
20
40
60
80
100
AMB
Alkaline stain comparison
0 10080604020
AMB0 10080604020
(a)
AM
V
0
20
40
60
80
100
(b)
AM
V
Fig. 13.3 Relationship between alkaline methylene blue (AMB) and alkaline methylene violet (AMV)for (a) storage (weeks 1–8) and (b) prolonged storage (weeks 1–24).
020406080
100
3Acidification power
Via
bilit
y (%
)
3.52.51.51 2(a)
Via
bilit
y (%
)
020406080
100
Acidification power3 3.52.51.51 2
(b)
Via
bilit
y (%
)
020406080
100
1 1.5 2 2.5 3 3.5Acidification power(c)
Fig. 13.2 Relationship between acidification power (AP) and (a) citrate methylene blue (CMB), (b) alkaline methylene blue (AMB), and (c) alkaline methylene violet (AMV).
COMPARISON OF YEAST VIABILITY/VITALITY METHODS 145
13.3.2.3 Acidification power test. The AP test is designed to test both the glycolyticactivity and endogenous reserves of the yeast cell to maintain a fixed ratio betweenintracellular and extracellular hydrogen ion concentrations. Water pH variation wasadjusted to around 6.5 for all AP trials. Initial water calibration helped to obtain con-sistent and comparable results. Overall, the AP values displayed a downward trendwith increased time of yeast storage (Tables 13.1–13.3). AP values correlated moreclosely with AMV than with either AMB or CMB (Fig. 13.2).
13.3.2.4 Standard plate count. The data obtained using the SPC technique did not cor-respond to the vital dye data obtained. In all cases except where the yeast had been heatshocked (HS) or heat killed (HK), the colony number was greater than the number ofcells plated. The only instance where the SPC was indicative of the apparent viabilitywas in the cases of the HS and HK yeast (Tables 13.1–13.3).
13.3.2.5 Yeast performance. Yeast performance in this study specifically refers to theability of the yeast to attenuate malt wort. Measurement of sugar percentage wasobtained throughout the 72 h test period (Fig. 13.4). Figure 13.5 compares AP withthe specific gravity of fermentation at 24, 48 and 72 h. The most dramatic comparisonbetween yeast performance and apparent viability can be seen with the HS yeast.Fermentation did occur with the HS yeast, although there was a longer lag time toattenuation and higher specific gravity at 72 h. The alkaline stains and AP most closelypredicted viability and fermentation performance (Tables 13.1–13.3).
Yeast storage had more effect on lager fermentation than on ale fermentation. At72 h, week 8 yeast had a 12.5% increase in sugar percentage compared with week 4,while having only a 1.22% difference in AMV values, 2.6% difference in AMB values,0.1% difference in CMB values and 4.36% difference in AP values. In WLP001 fer-mentation, the final specific gravity readings differed by only 0.6%, despite a range ofviability/vitality values (excluding HS and HK yeast) (Fig. 13.4).
13.4 Conclusions
The results of this study indicate that the standard CMB assay is accurate only for yeastwith high cell viability (�95%). SPC is an inaccurate means to assess yeast viability.The AP test appears reliable in reporting vitality, although should not be used as a solemeans of interpreting yeast health. While the alkaline stains (AMB, AMV) are easy touse and require approximately 15 min to complete, AMV is preferred for its easier dis-tinction between live and dead cells. However, the results of the stains became harderto interpret with increasing age of the yeast. This is possibly due to the deterioration ofthe cell wall and/or plasma membrane. A gradual thinning of the cell wall was visu-alised microscopically in all yeast samples after week 12.
The results of this study add evidence to the inaccuracy of the standard CMB assay,and suggest that interpreting yeast health should be a multi-technique approach as the‘vitality’ or ‘viability’ of yeast is reflected in multiple cell systems.
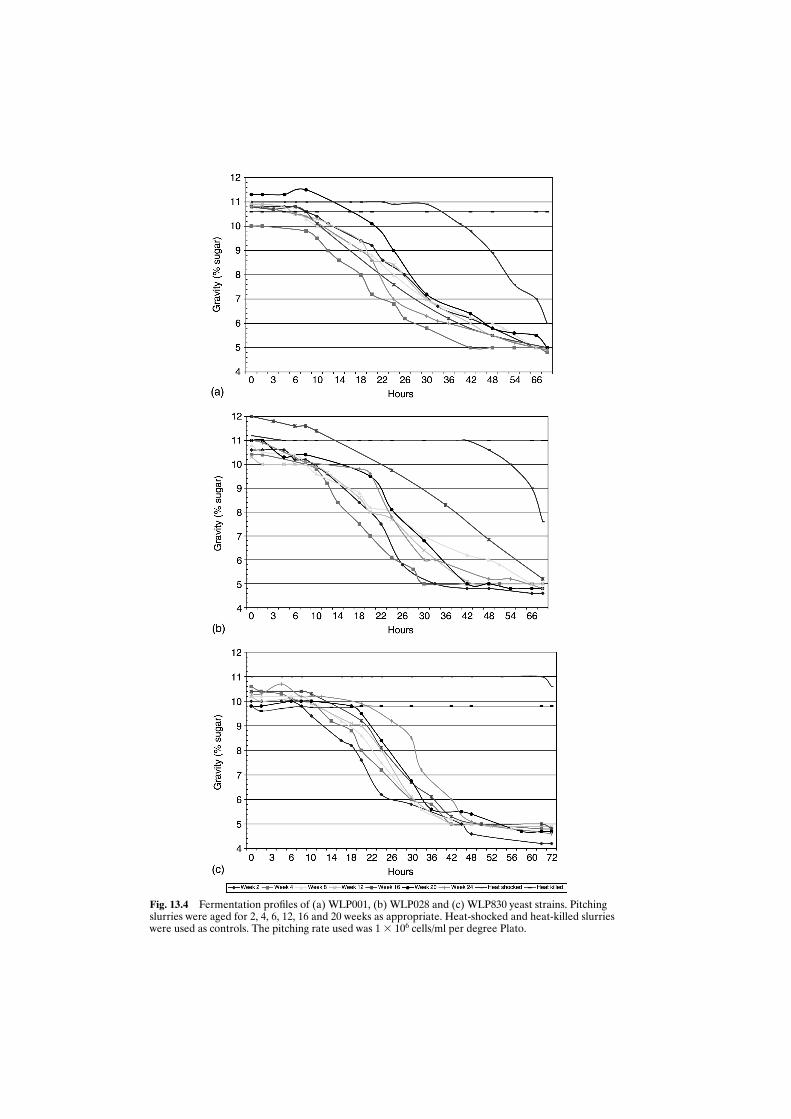
Fig. 13.4 Fermentation profiles of (a) WLP001, (b) WLP028 and (c) WLP830 yeast strains. Pitchingslurries were aged for 2, 4, 6, 12, 16 and 20 weeks as appropriate. Heat-shocked and heat-killed slurrieswere used as controls. The pitching rate used was 1 � 106 cells/ml per degree Plato.
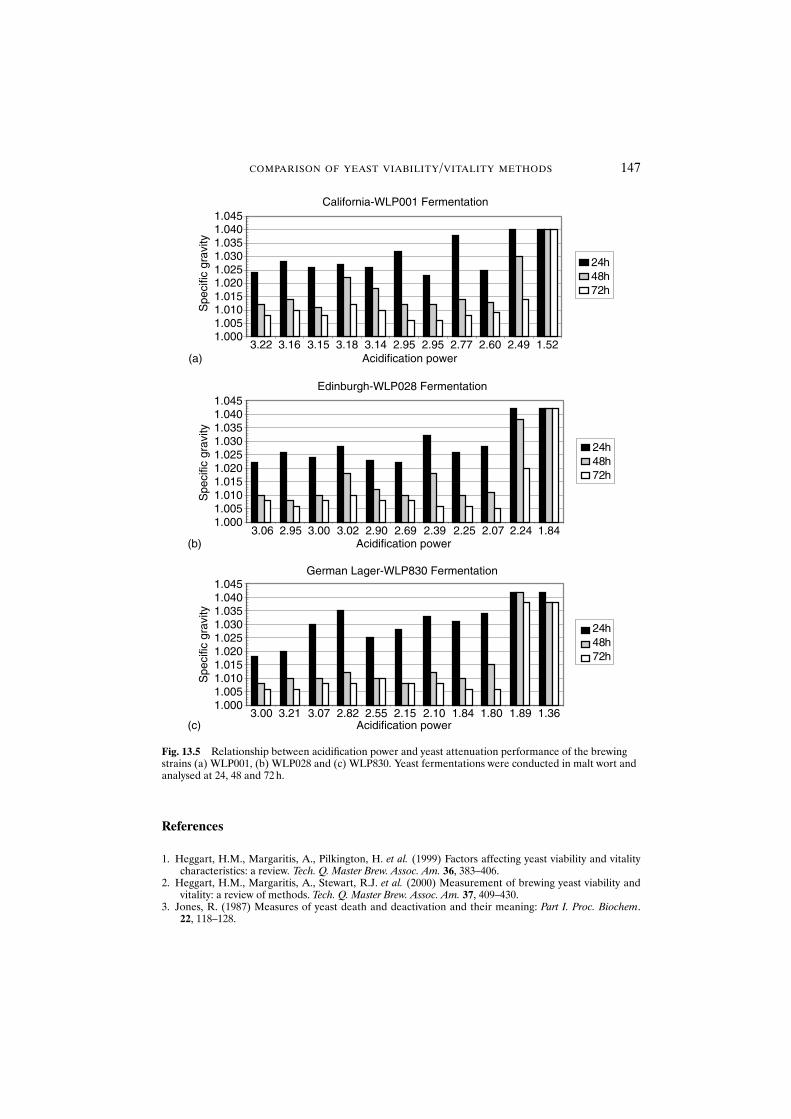
COMPARISON OF YEAST VIABILITY/VITALITY METHODS 147
References
1. Heggart, H.M., Margaritis, A., Pilkington, H. et al. (1999) Factors affecting yeast viability and vitalitycharacteristics: a review. Tech. Q. Master Brew. Assoc. Am. 36, 383–406.
2. Heggart, H.M., Margaritis, A., Stewart, R.J. et al. (2000) Measurement of brewing yeast viability andvitality: a review of methods. Tech. Q. Master Brew. Assoc. Am. 37, 409–430.
3. Jones, R. (1987) Measures of yeast death and deactivation and their meaning: Part I. Proc. Biochem. 22, 118–128.
California-WLP001 Fermentation
1.0001.0051.0101.0151.0201.0251.0301.0351.0401.045
3.22 3.16 3.15(a)
(b)
(c)
3.18 3.14 2.95 2.95 2.77 2.60 2.49 1.52
3.06 2.95 3.00 3.02 2.90 2.69 2.39 2.25 2.07 2.24 1.84
3.00 3.21 3.07 2.82 2.55 2.15 2.10 1.84 1.80 1.89 1.36
Acidification power
Spe
cific
gra
vity
Spe
cific
gra
vity
Spe
cific
gra
vity
24 h48 h72 h
Edinburgh-WLP028 Fermentation
1.0001.0051.0101.0151.0201.0251.0301.0351.0401.045
Acidification power
24 h48 h72 h
German Lager-WLP830 Fermentation
1.0001.0051.0101.0151.0201.0251.0301.0351.0401.045
Acidification power
24 h48 h72 h
Fig. 13.5 Relationship between acidification power and yeast attenuation performance of the brewingstrains (a) WLP001, (b) WLP028 and (c) WLP830. Yeast fermentations were conducted in malt wort andanalysed at 24, 48 and 72 h.

148 BREWING YEAST FERMENTATION PERFORMANCE
4. American Society of Brewing Chemists (1992) Microscopic yeast cell counting, yeast-4. In: Methods ofAnalysis of the ASBC, 8th edn. ASBC, St Paul, MN, pp. 1–2.
5. O’Conner-Cox, E., Mochaba, F.M., Lodolo, E.J. et al. (1997) Methylene blue staining: use at your ownrisk. Tech. Q. Master Brew. Assoc. Am. 34, 306–312.
6. Smart, K.A., Chambers, K.M., Jenkins, C. and Smart, C.A. (1999) Use of methylene violet staining pro-cedures to determine yeast viability and vitality. J. Am. Soc. Brew. Chem. 57, 18–23.
7. Kara, B.V., Simpson, W.J. and Hammond, J.R.M. (1988) Prediction of the fermentation performance ofbrewing yeast with the acidification power test. J. Inst. Brew. 94, 153–158.
8. American Society of Brewing Chemists (1992) Yeast stains, yeast-3. In: Methods of Analysis of the ASBC,8th edn. ASBC, St Paul, MN, pp. 1–3.
14 Yeast Quality and Fluorophore Technologies
S.M. VAN ZANDYCKE, O. SIMAL, S. GUALDONI and K.A. SMART
Abstract The assessment of pitching and cropping yeast quality is important in the attain-ment of adequate fermentation performance. Viability and vitality are common terms usedto describe the quality of yeast. Viability corresponds to the percentage of dead cells in asample, whereas vitality represents the physiological state of the yeast.
Methylene blue remains an industry standard for viability assessment, even though theefficiency of this stain is highly controversial. It has been suggested that methylene violetmight provide a more accurate and reproducible assessment of viability than methyleneblue, owing to the occurrence of impurities in the latter. The objective of this study was toidentify an alternative viability assessment to bright-field reductive dye techniques usingfluorophores.
Two genetically distinct brewing strains were used: a lager strain (L138) and an ale strain(NCYC2593). Viability studies were performed on yeast cell populations exhibiting differentviabilities, obtained from mixing heat-treated and stationary-phase cells. In addition, cohortsof cells were submitted to starvation and oxidative stress and were assessed for viability.Viability was determined using the fluorophore dyes oxonol [DiBAC4(3)], MgANS, berber-ine, sytox orange, propidium iodide and FUN1, and compared with conventional bright-fielddyes such as methylene violet.
Oxonol successfully distinguished between live and dead cells without ambiguity, regardlessof the yeast strain employed. In addition, with the exception of FUN1, fluorophore stainingwas perceived to be less subjective to the operator than were bright-field dyes, owing to thelack of intermediate colour variations. It is suggested that fluorophore technology mayrepresent a simple reproducible alternative to methylene blue.
14.1 Introduction
Viability is defined as a cell’s ability to bud and grow, however slowly,1 and this may betermed replicative potential.2 The ability to assess accurately the viability of a brewingyeast culture is necessary to maintain fermentation performance and produce a stand-ard, uniform product. Long storage periods and physiological stress occurring duringthe brewing process can seriously impair the relative vigour of yeast slurries, resultingin loss of viability.
The industry standard to measure viability remains the citrate methylene blue assay;3
however, it has been demonstrated that this stain may be inaccurate for viabilitieslower than 90%.4,5 An alternative to this stain has been suggested by Smart et al.5 withthe use of methylene violet, which contains fewer impurities than methylene blue andas a consequence is less subjective to the operator.
Since the early 1990s fluorescence has become a common way of assessing viabilityin a wide variety of cells, including those of animal origin as well as bacteria and yeast.6
However, as early as 1969, Graham and Caiger7 demonstrated the advantage of usingfluorophores as an alternative to methylene blue.
Brewing Yeast Fermentation Performance: Second edition
Edited by: KATHERINE SMART Copyright 0 Blackwell Science 2003
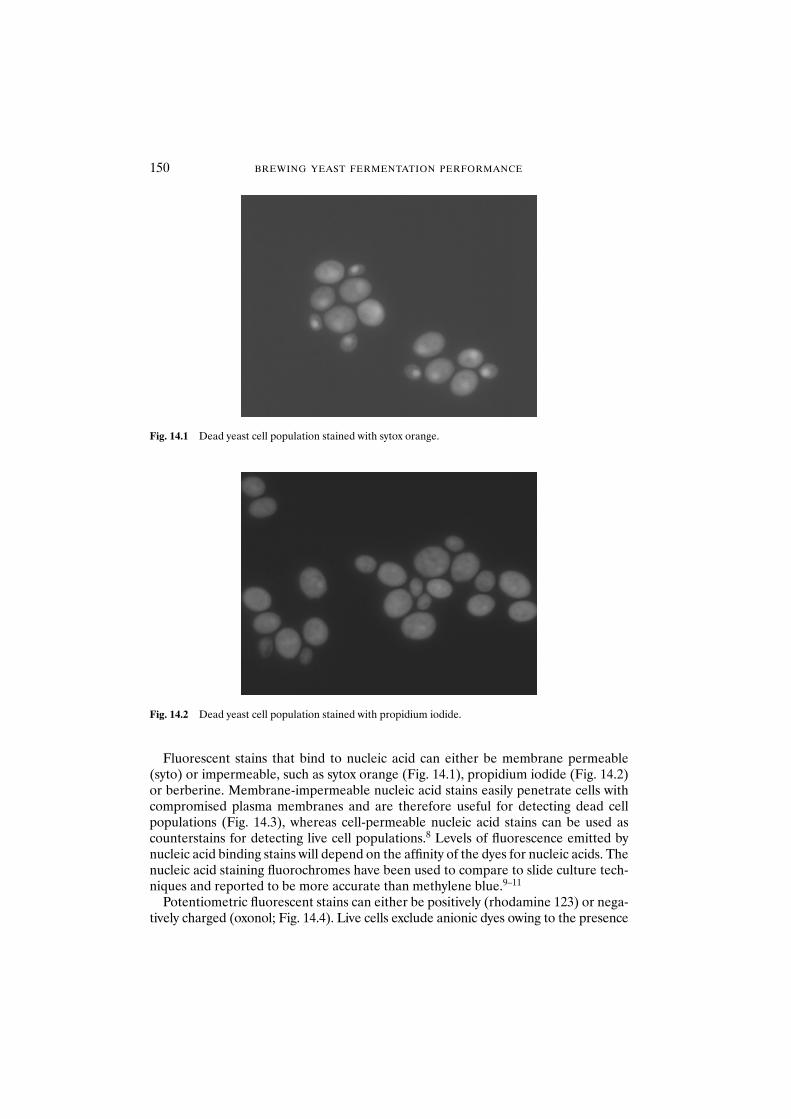
Fluorescent stains that bind to nucleic acid can either be membrane permeable(syto) or impermeable, such as sytox orange (Fig. 14.1), propidium iodide (Fig. 14.2)or berberine. Membrane-impermeable nucleic acid stains easily penetrate cells withcompromised plasma membranes and are therefore useful for detecting dead cellpopulations (Fig. 14.3), whereas cell-permeable nucleic acid stains can be used ascounterstains for detecting live cell populations.8 Levels of fluorescence emitted bynucleic acid binding stains will depend on the affinity of the dyes for nucleic acids. Thenucleic acid staining fluorochromes have been used to compare to slide culture tech-niques and reported to be more accurate than methylene blue.9–11
Potentiometric fluorescent stains can either be positively (rhodamine 123) or nega-tively charged (oxonol; Fig. 14.4). Live cells exclude anionic dyes owing to the presence
150 BREWING YEAST FERMENTATION PERFORMANCE
Fig. 14.1 Dead yeast cell population stained with sytox orange.
Fig. 14.2 Dead yeast cell population stained with propidium iodide.
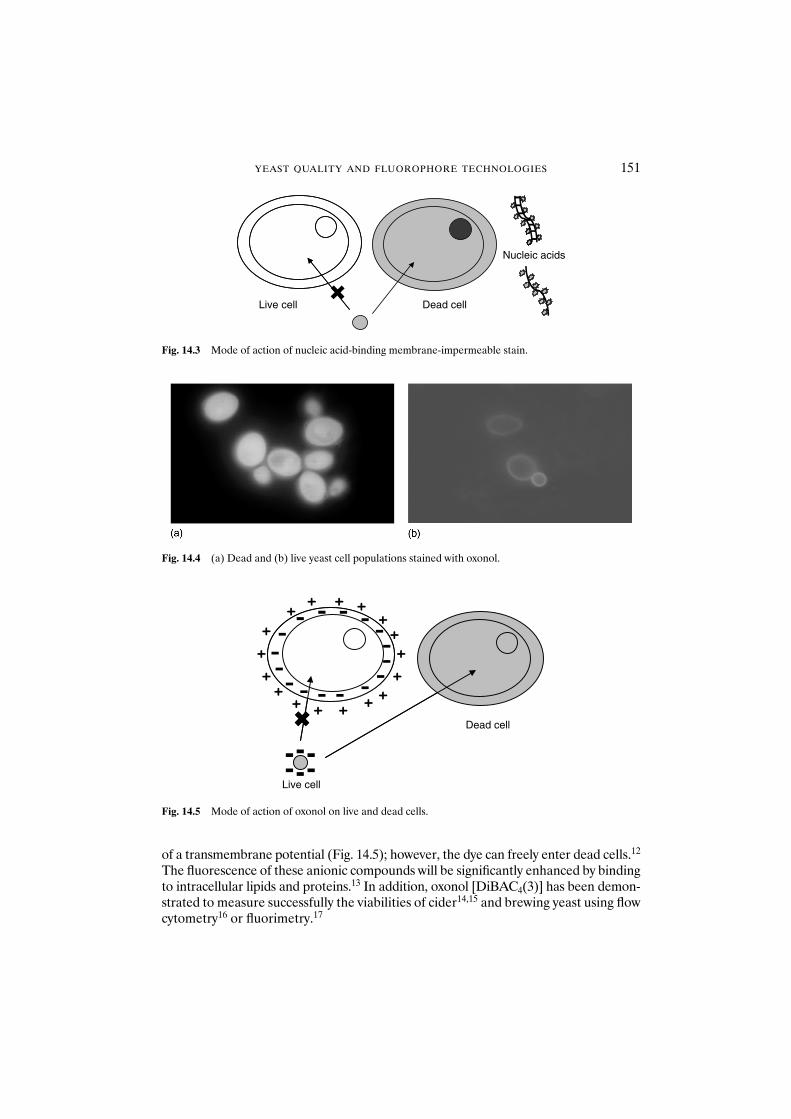
of a transmembrane potential (Fig. 14.5); however, the dye can freely enter dead cells.12
The fluorescence of these anionic compounds will be significantly enhanced by bindingto intracellular lipids and proteins.13 In addition, oxonol [DiBAC4(3)] has been demon-strated to measure successfully the viabilities of cider14,15 and brewing yeast using flowcytometry16 or fluorimetry.17
YEAST QUALITY AND FLUOROPHORE TECHNOLOGIES 151
Dead cellLive cell
Nucleic acids
Fig. 14.3 Mode of action of nucleic acid-binding membrane-impermeable stain.
Fig. 14.4 (a) Dead and (b) live yeast cell populations stained with oxonol.
+
+
++
+
+
++
+
++
+++
++
+
Live cell
Dead cell
Fig. 14.5 Mode of action of oxonol on live and dead cells.
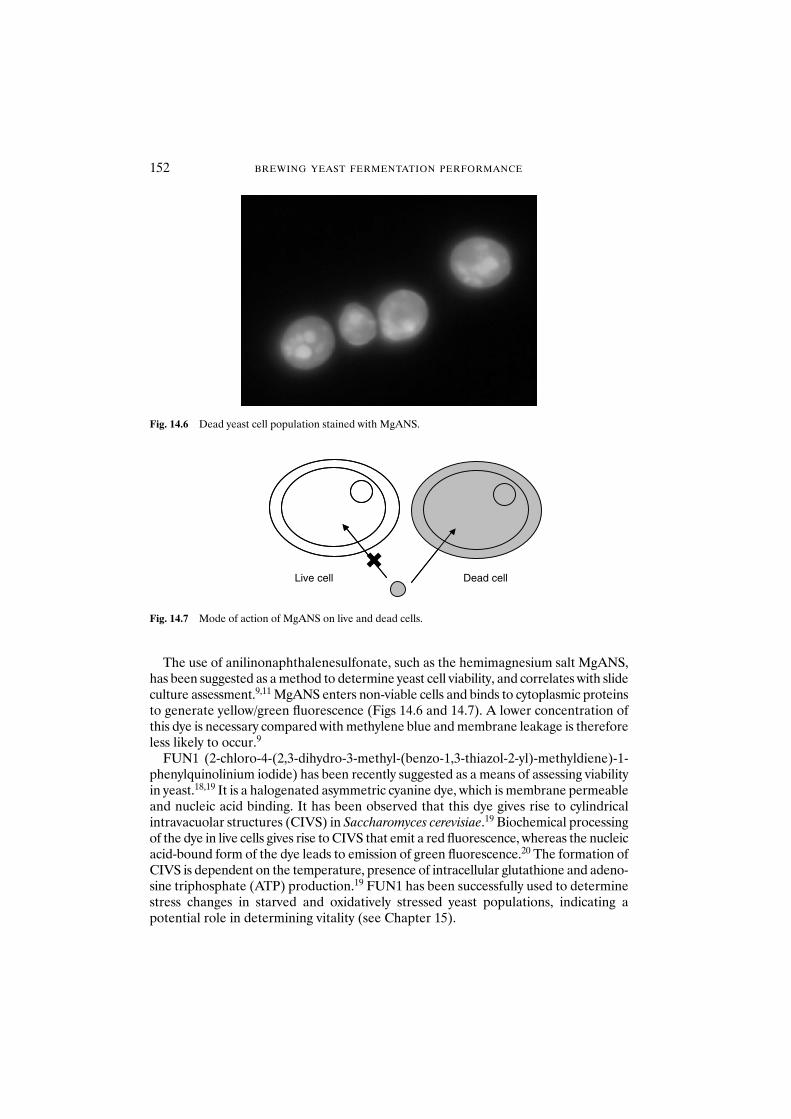
The use of anilinonaphthalenesulfonate, such as the hemimagnesium salt MgANS,has been suggested as a method to determine yeast cell viability, and correlates with slideculture assessment.9,11 MgANS enters non-viable cells and binds to cytoplasmic proteinsto generate yellow/green fluorescence (Figs 14.6 and 14.7). A lower concentration ofthis dye is necessary compared with methylene blue and membrane leakage is thereforeless likely to occur.9
FUN1 (2-chloro-4-(2,3-dihydro-3-methyl-(benzo-1,3-thiazol-2-yl)-methyldiene)-1-phenylquinolinium iodide) has been recently suggested as a means of assessing viabilityin yeast.18,19 It is a halogenated asymmetric cyanine dye, which is membrane permeableand nucleic acid binding. It has been observed that this dye gives rise to cylindricalintravacuolar structures (CIVS) in Saccharomyces cerevisiae.19 Biochemical processingof the dye in live cells gives rise to CIVS that emit a red fluorescence, whereas the nucleicacid-bound form of the dye leads to emission of green fluorescence.20 The formation ofCIVS is dependent on the temperature, presence of intracellular glutathione and adeno-sine triphosphate (ATP) production.19 FUN1 has been successfully used to determinestress changes in starved and oxidatively stressed yeast populations, indicating apotential role in determining vitality (see Chapter 15).
152 BREWING YEAST FERMENTATION PERFORMANCE
Fig. 14.6 Dead yeast cell population stained with MgANS.
Dead cellLive cell
Fig. 14.7 Mode of action of MgANS on live and dead cells.
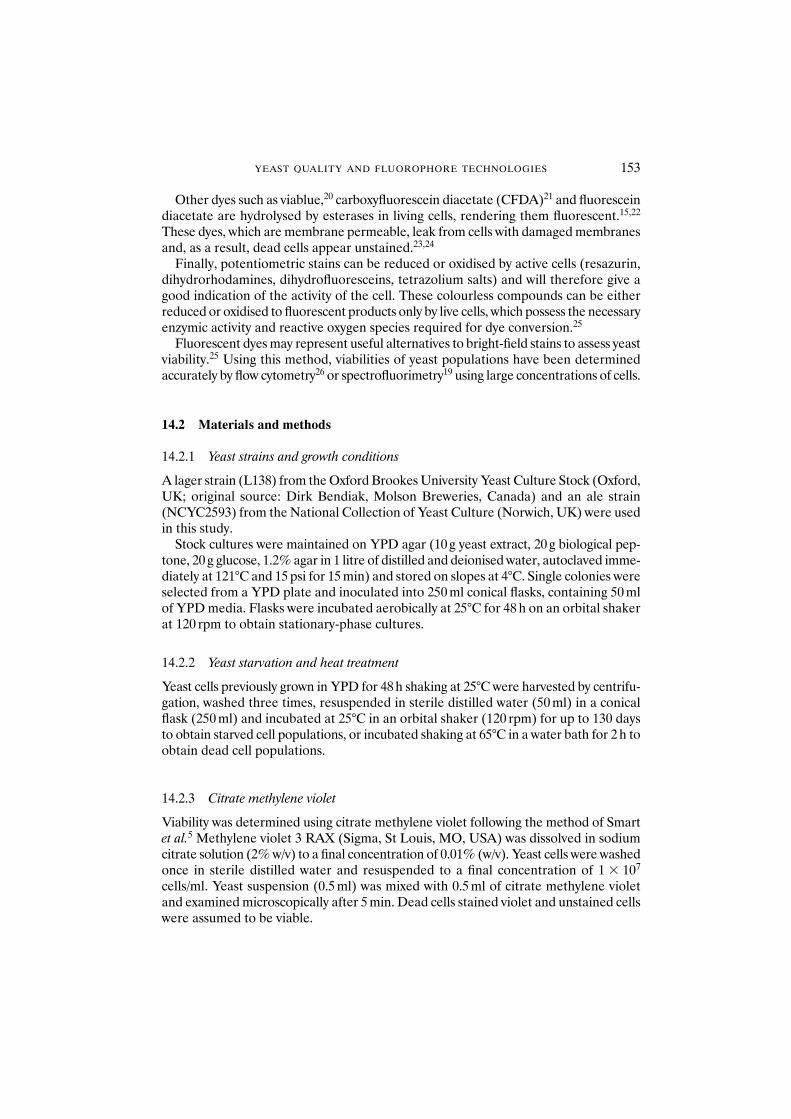
Other dyes such as viablue,20 carboxyfluorescein diacetate (CFDA)21 and fluoresceindiacetate are hydrolysed by esterases in living cells, rendering them fluorescent.15,22
These dyes, which are membrane permeable, leak from cells with damaged membranesand, as a result, dead cells appear unstained.23,24
Finally, potentiometric stains can be reduced or oxidised by active cells (resazurin,dihydrorhodamines, dihydrofluoresceins, tetrazolium salts) and will therefore give agood indication of the activity of the cell. These colourless compounds can be eitherreduced or oxidised to fluorescent products only by live cells, which possess the necessaryenzymic activity and reactive oxygen species required for dye conversion.25
Fluorescent dyes may represent useful alternatives to bright-field stains to assess yeastviability.25 Using this method, viabilities of yeast populations have been determinedaccurately by flow cytometry26 or spectrofluorimetry19 using large concentrations of cells.
14.2 Materials and methods
14.2.1 Yeast strains and growth conditions
A lager strain (L138) from the Oxford Brookes University Yeast Culture Stock (Oxford,UK; original source: Dirk Bendiak, Molson Breweries, Canada) and an ale strain(NCYC2593) from the National Collection of Yeast Culture (Norwich, UK) were usedin this study.
Stock cultures were maintained on YPD agar (10 g yeast extract, 20 g biological pep-tone, 20 g glucose, 1.2% agar in 1 litre of distilled and deionised water, autoclaved imme-diately at 121°C and 15 psi for 15 min) and stored on slopes at 4°C. Single colonies wereselected from a YPD plate and inoculated into 250 ml conical flasks, containing 50 mlof YPD media. Flasks were incubated aerobically at 25°C for 48 h on an orbital shakerat 120 rpm to obtain stationary-phase cultures.
14.2.2 Yeast starvation and heat treatment
Yeast cells previously grown in YPD for 48 h shaking at 25°C were harvested by centrifu-gation, washed three times, resuspended in sterile distilled water (50 ml) in a conicalflask (250 ml) and incubated at 25°C in an orbital shaker (120 rpm) for up to 130 daysto obtain starved cell populations, or incubated shaking at 65°C in a water bath for 2 h toobtain dead cell populations.
14.2.3 Citrate methylene violet
Viability was determined using citrate methylene violet following the method of Smartet al.5 Methylene violet 3 RAX (Sigma, St Louis, MO, USA) was dissolved in sodiumcitrate solution (2% w/v) to a final concentration of 0.01% (w/v). Yeast cells were washedonce in sterile distilled water and resuspended to a final concentration of 1 � 107
cells/ml. Yeast suspension (0.5 ml) was mixed with 0.5 ml of citrate methylene violetand examined microscopically after 5 min. Dead cells stained violet and unstained cellswere assumed to be viable.
YEAST QUALITY AND FLUOROPHORE TECHNOLOGIES 153
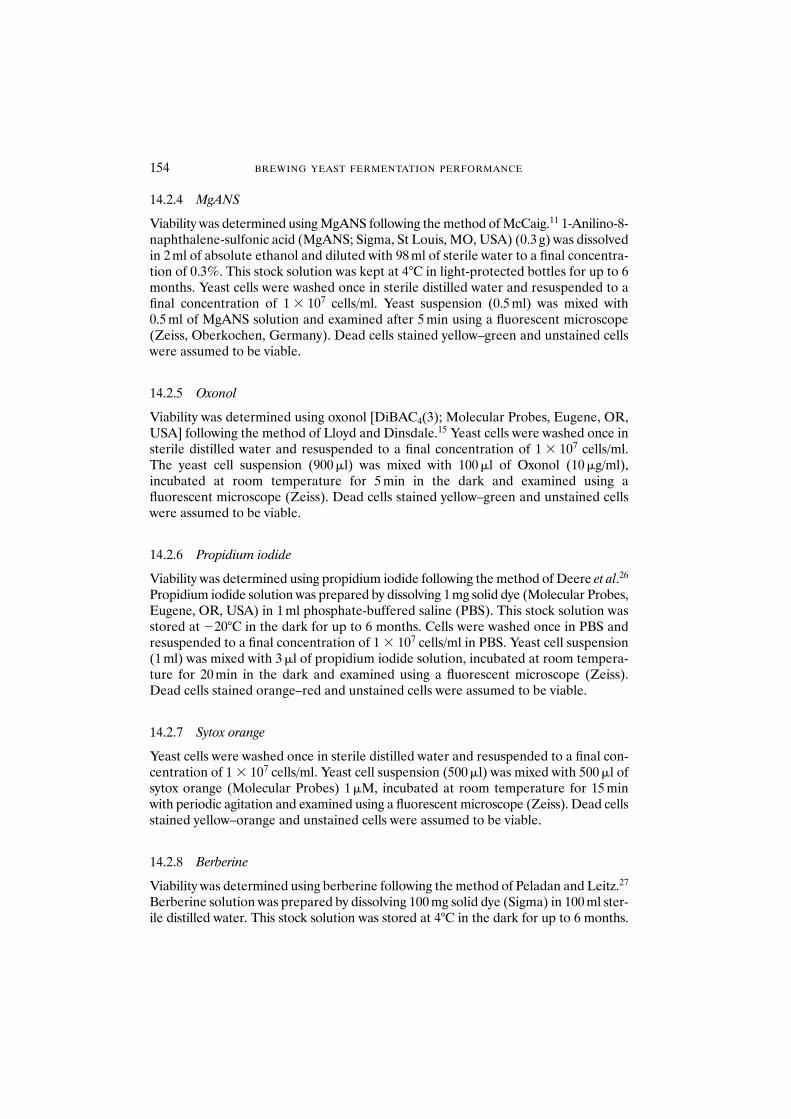
14.2.4 MgANS
Viability was determined using MgANS following the method of McCaig.11 1-Anilino-8-naphthalene-sulfonic acid (MgANS; Sigma, St Louis, MO, USA) (0.3 g) was dissolvedin 2 ml of absolute ethanol and diluted with 98 ml of sterile water to a final concentra-tion of 0.3%. This stock solution was kept at 4°C in light-protected bottles for up to 6months. Yeast cells were washed once in sterile distilled water and resuspended to afinal concentration of 1 � 107 cells/ml. Yeast suspension (0.5 ml) was mixed with0.5 ml of MgANS solution and examined after 5 min using a fluorescent microscope(Zeiss, Oberkochen, Germany). Dead cells stained yellow–green and unstained cellswere assumed to be viable.
14.2.5 Oxonol
Viability was determined using oxonol [DiBAC4(3); Molecular Probes, Eugene, OR,USA] following the method of Lloyd and Dinsdale.15 Yeast cells were washed once insterile distilled water and resuspended to a final concentration of 1 � 107 cells/ml.The yeast cell suspension (900 �l) was mixed with 100 �l of Oxonol (10 �g/ml),incubated at room temperature for 5 min in the dark and examined using afluorescent microscope (Zeiss). Dead cells stained yellow–green and unstained cellswere assumed to be viable.
14.2.6 Propidium iodide
Viability was determined using propidium iodide following the method of Deere et al.26
Propidium iodide solution was prepared by dissolving 1 mg solid dye (Molecular Probes,Eugene, OR, USA) in 1 ml phosphate-buffered saline (PBS). This stock solution wasstored at �20°C in the dark for up to 6 months. Cells were washed once in PBS andresuspended to a final concentration of 1 � 107 cells/ml in PBS. Yeast cell suspension(1 ml) was mixed with 3 �l of propidium iodide solution, incubated at room tempera-ture for 20 min in the dark and examined using a fluorescent microscope (Zeiss).Dead cells stained orange–red and unstained cells were assumed to be viable.
14.2.7 Sytox orange
Yeast cells were washed once in sterile distilled water and resuspended to a final con-centration of 1 � 107 cells/ml. Yeast cell suspension (500 �l) was mixed with 500 �l ofsytox orange (Molecular Probes) 1 �M, incubated at room temperature for 15 minwith periodic agitation and examined using a fluorescent microscope (Zeiss). Dead cellsstained yellow–orange and unstained cells were assumed to be viable.
14.2.8 Berberine
Viability was determined using berberine following the method of Peladan and Leitz.27
Berberine solution was prepared by dissolving 100 mg solid dye (Sigma) in 100 ml ster-ile distilled water. This stock solution was stored at 4°C in the dark for up to 6 months.
154 BREWING YEAST FERMENTATION PERFORMANCE
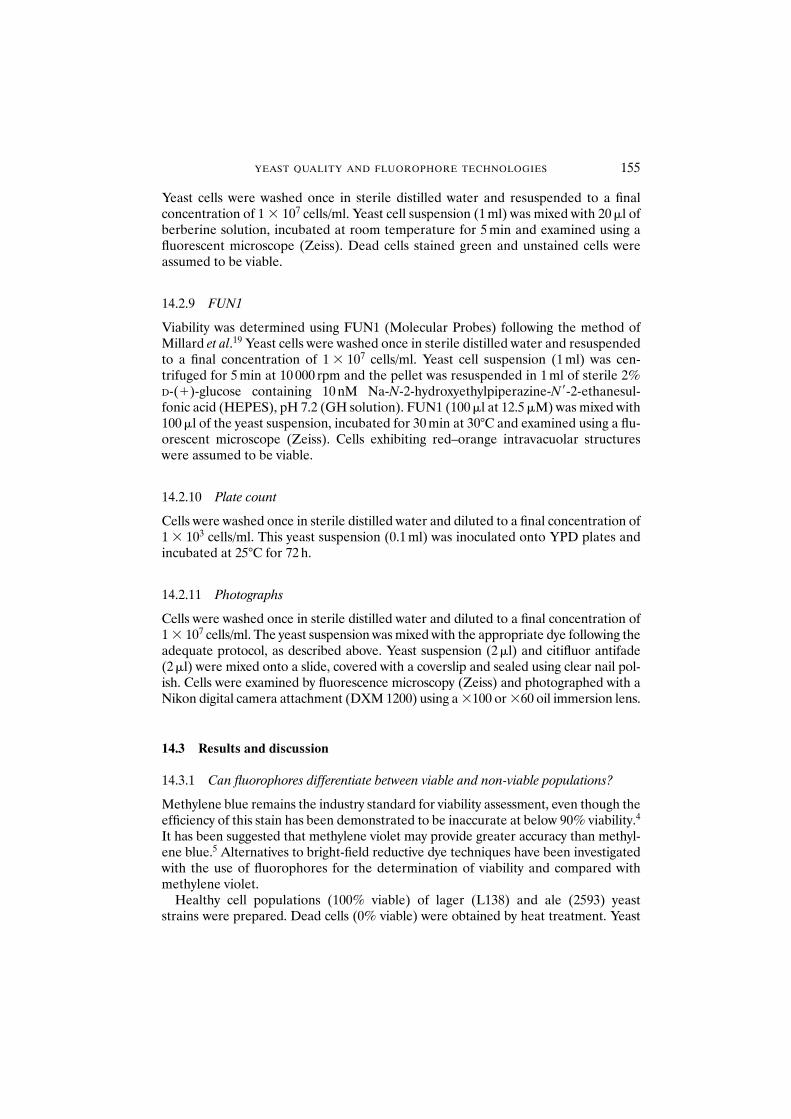
Yeast cells were washed once in sterile distilled water and resuspended to a final concentration of 1 � 107 cells/ml. Yeast cell suspension (1 ml) was mixed with 20 �l ofberberine solution, incubated at room temperature for 5 min and examined using afluorescent microscope (Zeiss). Dead cells stained green and unstained cells wereassumed to be viable.
14.2.9 FUN1
Viability was determined using FUN1 (Molecular Probes) following the method ofMillard et al.19 Yeast cells were washed once in sterile distilled water and resuspendedto a final concentration of 1 � 107 cells/ml. Yeast cell suspension (1 ml) was cen-trifuged for 5 min at 10 000 rpm and the pellet was resuspended in 1 ml of sterile 2%D-(�)-glucose containing 10 nM Na-N-2-hydroxyethylpiperazine-N�-2-ethanesul-fonic acid (HEPES), pH 7.2 (GH solution). FUN1 (100 �l at 12.5 �M) was mixed with100 �l of the yeast suspension, incubated for 30 min at 30°C and examined using a flu-orescent microscope (Zeiss). Cells exhibiting red–orange intravacuolar structureswere assumed to be viable.
14.2.10 Plate count
Cells were washed once in sterile distilled water and diluted to a final concentration of1 � 103 cells/ml. This yeast suspension (0.1 ml) was inoculated onto YPD plates andincubated at 25°C for 72 h.
14.2.11 Photographs
Cells were washed once in sterile distilled water and diluted to a final concentration of1 � 107 cells/ml. The yeast suspension was mixed with the appropriate dye following theadequate protocol, as described above. Yeast suspension (2 �l) and citifluor antifade(2 �l) were mixed onto a slide, covered with a coverslip and sealed using clear nail pol-ish. Cells were examined by fluorescence microscopy (Zeiss) and photographed with aNikon digital camera attachment (DXM 1200) using a �100 or �60 oil immersion lens.
14.3 Results and discussion
14.3.1 Can fluorophores differentiate between viable and non-viable populations?
Methylene blue remains the industry standard for viability assessment, even though theefficiency of this stain has been demonstrated to be inaccurate at below 90% viability.4
It has been suggested that methylene violet may provide greater accuracy than methyl-ene blue.5 Alternatives to bright-field reductive dye techniques have been investigatedwith the use of fluorophores for the determination of viability and compared withmethylene violet.
Healthy cell populations (100% viable) of lager (L138) and ale (2593) yeast strains were prepared. Dead cells (0% viable) were obtained by heat treatment. Yeast
YEAST QUALITY AND FLUOROPHORE TECHNOLOGIES 155
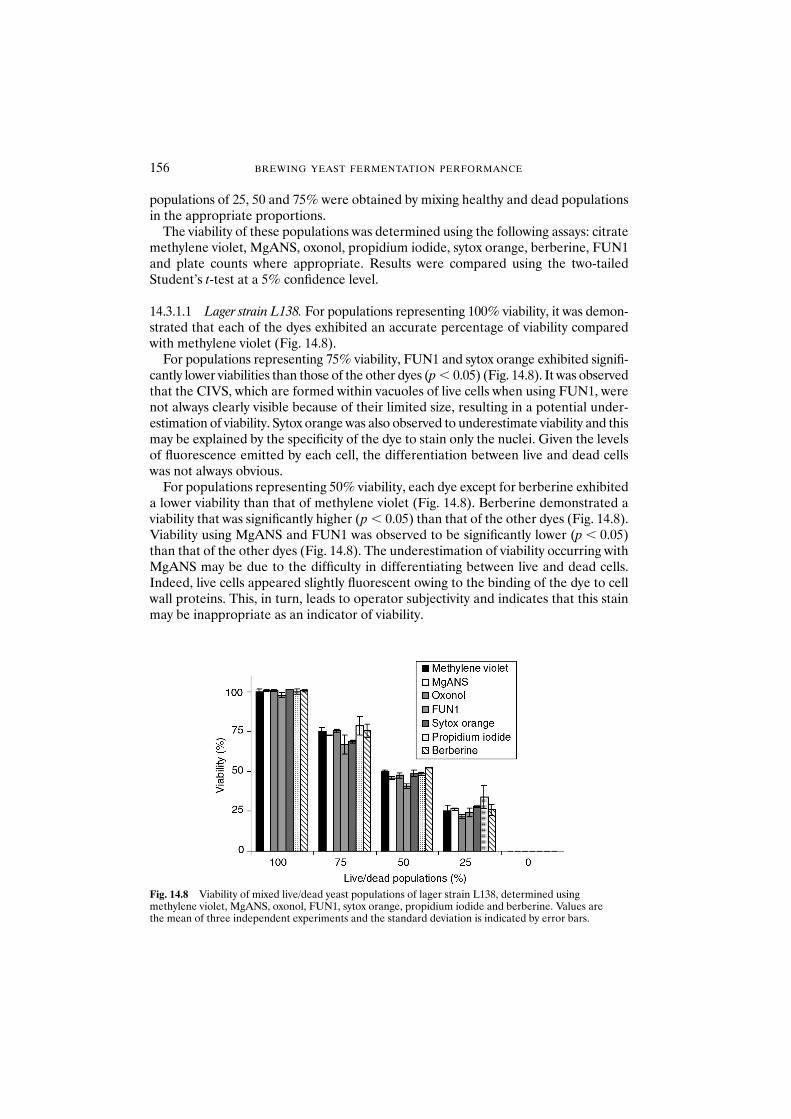
populations of 25, 50 and 75% were obtained by mixing healthy and dead populationsin the appropriate proportions.
The viability of these populations was determined using the following assays: citratemethylene violet, MgANS, oxonol, propidium iodide, sytox orange, berberine, FUN1and plate counts where appropriate. Results were compared using the two-tailedStudent’s t-test at a 5% confidence level.
14.3.1.1 Lager strain L138. For populations representing 100% viability, it was demon-strated that each of the dyes exhibited an accurate percentage of viability comparedwith methylene violet (Fig. 14.8).
For populations representing 75% viability, FUN1 and sytox orange exhibited signifi-cantly lower viabilities than those of the other dyes (p � 0.05) (Fig. 14.8). It was observedthat the CIVS, which are formed within vacuoles of live cells when using FUN1, werenot always clearly visible because of their limited size, resulting in a potential under-estimation of viability. Sytox orange was also observed to underestimate viability and thismay be explained by the specificity of the dye to stain only the nuclei. Given the levelsof fluorescence emitted by each cell, the differentiation between live and dead cellswas not always obvious.
For populations representing 50% viability, each dye except for berberine exhibiteda lower viability than that of methylene violet (Fig. 14.8). Berberine demonstrated aviability that was significantly higher (p � 0.05) than that of the other dyes (Fig. 14.8).Viability using MgANS and FUN1 was observed to be significantly lower (p � 0.05)than that of the other dyes (Fig. 14.8). The underestimation of viability occurring withMgANS may be due to the difficulty in differentiating between live and dead cells.Indeed, live cells appeared slightly fluorescent owing to the binding of the dye to cellwall proteins. This, in turn, leads to operator subjectivity and indicates that this stainmay be inappropriate as an indicator of viability.
156 BREWING YEAST FERMENTATION PERFORMANCE
Fig. 14.8 Viability of mixed live/dead yeast populations of lager strain L138, determined using methylene violet, MgANS, oxonol, FUN1, sytox orange, propidium iodide and berberine. Values are the mean of three independent experiments and the standard deviation is indicated by error bars.
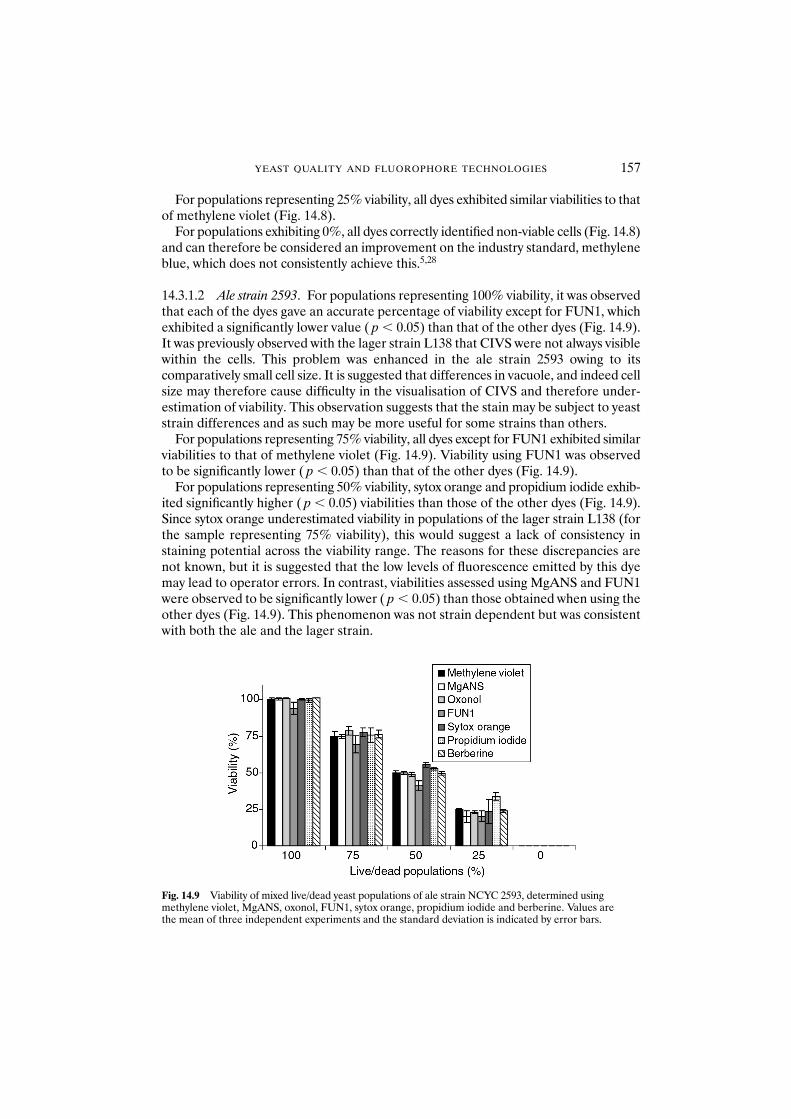
For populations representing 25% viability, all dyes exhibited similar viabilities to thatof methylene violet (Fig. 14.8).
For populations exhibiting 0%, all dyes correctly identified non-viable cells (Fig. 14.8)and can therefore be considered an improvement on the industry standard, methyleneblue, which does not consistently achieve this.5,28
14.3.1.2 Ale strain 2593. For populations representing 100% viability, it was observedthat each of the dyes gave an accurate percentage of viability except for FUN1, whichexhibited a significantly lower value ( p � 0.05) than that of the other dyes (Fig. 14.9).It was previously observed with the lager strain L138 that CIVS were not always visiblewithin the cells. This problem was enhanced in the ale strain 2593 owing to its comparatively small cell size. It is suggested that differences in vacuole, and indeed cellsize may therefore cause difficulty in the visualisation of CIVS and therefore under-estimation of viability. This observation suggests that the stain may be subject to yeaststrain differences and as such may be more useful for some strains than others.
For populations representing 75% viability, all dyes except for FUN1 exhibited similarviabilities to that of methylene violet (Fig. 14.9). Viability using FUN1 was observedto be significantly lower ( p � 0.05) than that of the other dyes (Fig. 14.9).
For populations representing 50% viability, sytox orange and propidium iodide exhib-ited significantly higher ( p � 0.05) viabilities than those of the other dyes (Fig. 14.9).Since sytox orange underestimated viability in populations of the lager strain L138 (forthe sample representing 75% viability), this would suggest a lack of consistency instaining potential across the viability range. The reasons for these discrepancies arenot known, but it is suggested that the low levels of fluorescence emitted by this dyemay lead to operator errors. In contrast, viabilities assessed using MgANS and FUN1were observed to be significantly lower ( p � 0.05) than those obtained when using theother dyes (Fig. 14.9). This phenomenon was not strain dependent but was consistentwith both the ale and the lager strain.
YEAST QUALITY AND FLUOROPHORE TECHNOLOGIES 157
Fig. 14.9 Viability of mixed live/dead yeast populations of ale strain NCYC 2593, determined using methylene violet, MgANS, oxonol, FUN1, sytox orange, propidium iodide and berberine. Values are the mean of three independent experiments and the standard deviation is indicated by error bars.
For populations representing 25% viability, propidium iodide significantly (p � 0.05)overestimated the viability compared with the other dyes (Fig. 14.9). These resultswere surprising, given that propidium iodide has been reported to underestimate viability15,29 owing to its non-specific binding to yeast.16 However, this stain has not been previously compared with the range of fluorescence stains applied in thisstudy. Previous comparisons may have been conducted with dyes that consistentlyoverestimated viability, such as methylene blue.
As for L138, all dyes accurately identified 100% non-viable cell cultures (Fig. 14.9).
14.3.2 Determination of yeast cell viability of starved populations
Starvation occurs during yeast storage and causes utilisation of intracellular carbohy-drate reserves (mainly glycogen), which in turn may affect subsequent fermentationperformance.30–32 Viability and vitality are negatively affected by storage conditionsregardless of the preservation method,33 and it is important to be able to assess thesetwo parameters accurately to ensure adequate fermentation performance.
During starvation, the metabolic activity of cells is greatly reduced; however, cellsurvival can occur for prolonged periods.34 Among the fluorescent dyes, FUN1 relies onthe metabolic activity of the cell to produce CIVS,19 which indicate that a cell isviable. It is postulated that starvation may have a negative effect on CIVS formation.Therefore, the impact of starvation on the ability of the fluorescent dyes to assess viabil-ity, compared with methylene violet, was determined.
Populations of lager (L138) and ale (2593) yeast were subjected to starvation. Healthyyeast populations grown in YPD for 48 h were used as a control. The viability of starvedand healthy populations was determined using the following assays: methylene violet,MgANS, oxonol, sytox orange, propidium iodide, berberine, FUN1 and plate counts.
For populations exposed to 3 days of starvation, the viability of lager strain L138 usingFUN1 was observed to be significantly ( p � 0.05) lower than that of the other dyes forlager strain L138 (Fig. 14.10). For the ale strain 2593, all dyes and plate counts exhib-ited similar viabilities to that of methylene violet (Fig. 14.11).
For populations starved for 7 days, oxonol, FUN1, sytox orange and propidiumiodide were observed to indicate significantly ( p � 0.05) lower viabilities than those ofthe other dyes for lager strain L138 (Fig. 14.10) and ale strain 2593 (Fig. 14.11). In con-trast, plate counts, MgANS and berberine yielded similar viabilities to that of methyleneviolet (Figs 14.10 and 14.11).
Cells stained using FUN1 exhibited a low viability after 3 and 7 days of starvation. Thisresult is not surprising given that the metabolic activity of the yeast is reduced, directlyinfluencing CIVS production. Cells stained using sytox orange and propidium iodideexhibited lower viabilities after 7 days of starvation, suggesting that starvation is likelyto affect the permeability of the membrane, resulting in live cells being wrongly iden-tified as dead. Oxonol also indicated a low viability, owing to the diminution of thetransmembrane potential. It is postulated that the intensity of fluorescence emitted bycells stained with oxonol may reflect their physiological condition. This hypothesisremains the subject of further investigation.
For populations starved for 150 days, all dyes and plate counts, except for propidiumiodide and sytox orange, demonstrated a viability of 0%, indicating that both replicationcapacity and metabolic functions had ceased (Figs 14.10 and 14.11). As previously
158 BREWING YEAST FERMENTATION PERFORMANCE
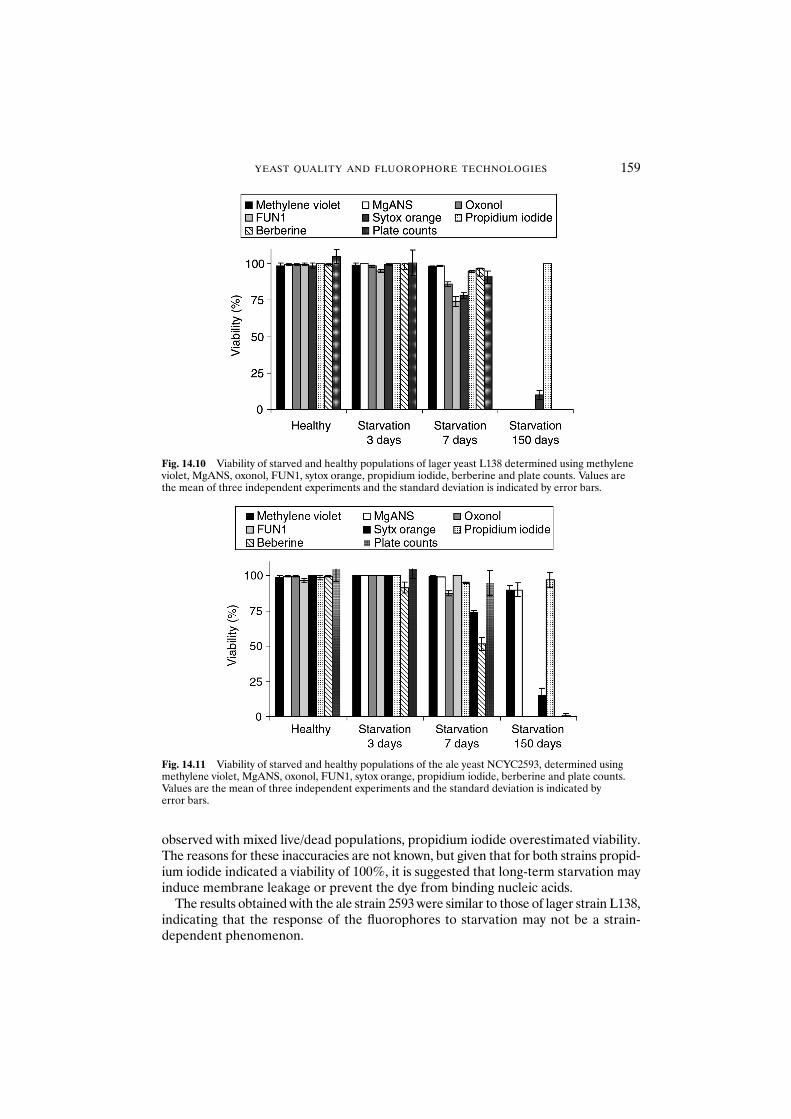
observed with mixed live/dead populations, propidium iodide overestimated viability.The reasons for these inaccuracies are not known, but given that for both strains propid-ium iodide indicated a viability of 100%, it is suggested that long-term starvation mayinduce membrane leakage or prevent the dye from binding nucleic acids.
The results obtained with the ale strain 2593 were similar to those of lager strain L138,indicating that the response of the fluorophores to starvation may not be a strain-dependent phenomenon.
YEAST QUALITY AND FLUOROPHORE TECHNOLOGIES 159
Fig. 14.10 Viability of starved and healthy populations of lager yeast L138 determined using methyleneviolet, MgANS, oxonol, FUN1, sytox orange, propidium iodide, berberine and plate counts. Values arethe mean of three independent experiments and the standard deviation is indicated by error bars.
Fig. 14.11 Viability of starved and healthy populations of the ale yeast NCYC2593, determined usingmethylene violet, MgANS, oxonol, FUN1, sytox orange, propidium iodide, berberine and plate counts.Values are the mean of three independent experiments and the standard deviation is indicated by error bars.
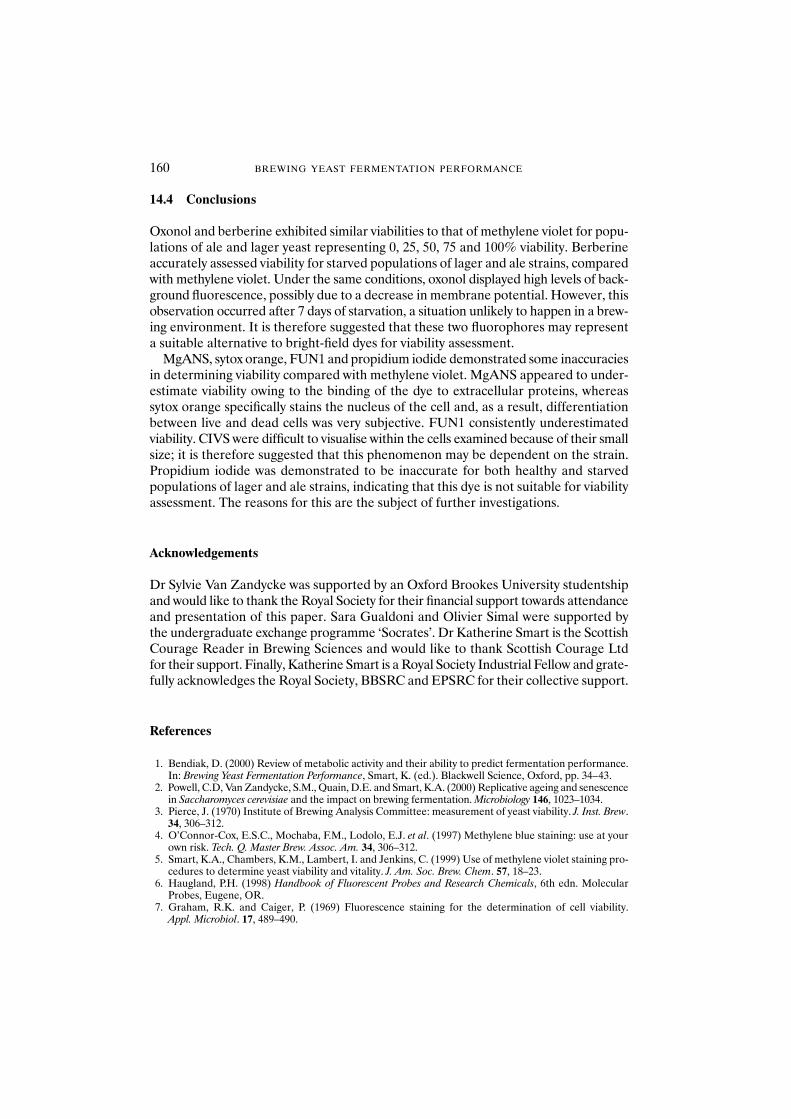
14.4 Conclusions
Oxonol and berberine exhibited similar viabilities to that of methylene violet for popu-lations of ale and lager yeast representing 0, 25, 50, 75 and 100% viability. Berberineaccurately assessed viability for starved populations of lager and ale strains, comparedwith methylene violet. Under the same conditions, oxonol displayed high levels of back-ground fluorescence, possibly due to a decrease in membrane potential. However, thisobservation occurred after 7 days of starvation, a situation unlikely to happen in a brew-ing environment. It is therefore suggested that these two fluorophores may representa suitable alternative to bright-field dyes for viability assessment.
MgANS, sytox orange, FUN1 and propidium iodide demonstrated some inaccuraciesin determining viability compared with methylene violet. MgANS appeared to under-estimate viability owing to the binding of the dye to extracellular proteins, whereassytox orange specifically stains the nucleus of the cell and, as a result, differentiationbetween live and dead cells was very subjective. FUN1 consistently underestimatedviability. CIVS were difficult to visualise within the cells examined because of their smallsize; it is therefore suggested that this phenomenon may be dependent on the strain.Propidium iodide was demonstrated to be inaccurate for both healthy and starvedpopulations of lager and ale strains, indicating that this dye is not suitable for viabilityassessment. The reasons for this are the subject of further investigations.
Acknowledgements
Dr Sylvie Van Zandycke was supported by an Oxford Brookes University studentshipand would like to thank the Royal Society for their financial support towards attendanceand presentation of this paper. Sara Gualdoni and Olivier Simal were supported bythe undergraduate exchange programme ‘Socrates’. Dr Katherine Smart is the ScottishCourage Reader in Brewing Sciences and would like to thank Scottish Courage Ltdfor their support. Finally, Katherine Smart is a Royal Society Industrial Fellow and grate-fully acknowledges the Royal Society, BBSRC and EPSRC for their collective support.
References
1. Bendiak, D. (2000) Review of metabolic activity and their ability to predict fermentation performance.In: Brewing Yeast Fermentation Performance, Smart, K. (ed.). Blackwell Science, Oxford, pp. 34–43.
2. Powell, C.D, Van Zandycke, S.M., Quain, D.E. and Smart, K.A. (2000) Replicative ageing and senescencein Saccharomyces cerevisiae and the impact on brewing fermentation. Microbiology 146, 1023–1034.
3. Pierce, J. (1970) Institute of Brewing Analysis Committee: measurement of yeast viability. J. Inst. Brew.34, 306–312.
4. O’Connor-Cox, E.S.C., Mochaba, F.M., Lodolo, E.J. et al. (1997) Methylene blue staining: use at yourown risk. Tech. Q. Master Brew. Assoc. Am. 34, 306–312.
5. Smart, K.A., Chambers, K.M., Lambert, I. and Jenkins, C. (1999) Use of methylene violet staining pro-cedures to determine yeast viability and vitality. J. Am. Soc. Brew. Chem. 57, 18–23.
6. Haugland, P.H. (1998) Handbook of Fluorescent Probes and Research Chemicals, 6th edn. MolecularProbes, Eugene, OR.
7. Graham, R.K. and Caiger, P. (1969) Fluorescence staining for the determination of cell viability. Appl. Microbiol. 17, 489–490.
160 BREWING YEAST FERMENTATION PERFORMANCE
8. Millard, P.J., Roth, B.L. and Kim, C.H. (1997) Fluorescence based methods for microbial characterisationand viability assessment. Biotechnol. Int. 1, 291.
9. King, L.M., Schisler, D.O. and Ruocco, J.J. (1981) Epifluorescent method for the detection of non-viable yeast. J. Am. Soc. Brew. Chem. 39, 52–55.
10. Trevors, J.T., Merrick, R.L., Russell, I. and Stewart, G.G. (1983) A comparison of methods for assess-ing yeast viability. Biotechnol. Lett. 5, 131–134.
11. McCaig, R. (1990) Evaluation of the fluorescent dye 1-anilino-8-naphthalene sulphonic acid for yeastviability determination. J. Am. Soc. Brew. Chem. 48, 22–25.
12. Wilson, H.A. and Chused, T.M. (1985) Lymphocyte membrane potential and Ca��-sensitive potassiumchannels described by oxonol dye fluorescent measurements. J. Cell. Physiol. 125, 72–81.
13. Epps, D.E., Wolfe, M.L. and Groppi, V. (1994) Characterization of the steady-state and dynamic fluor-escence properties of the potential-sensitive dye bis-(1,3-dibutylbarbituric acid) trimethine oxonol(Dibac4(3)) in model systems and cells. Chem. Phys. Lipids 69, 137–150.
14. Dinsdale, M.G., Lloyd, D., McIntyre, P. and Jarvis, B. (1999). Yeast viability during cider fermentation:assessment by energy metabolism. Yeast 15, 285–293.
15. Lloyd, D. and Dinsdale, G. (2000) From bright field to fluorescence and confocal microscopy. In:Brewing Yeast Fermentation Performance, Smart, K. (ed.). Blackwell Science, Oxford, pp. 3–9.
16. Boyd, A., Attfield, P. and Veal, D. (2000) Evaluation of light scattering and autofluorescent propertiesof brewer’s wort for flow cytometric analysis of yeast viability. J. Inst. Brew. 106, 319–324.
17. Boulton, C.A., Box, W.G., Carvell, J. and Turner, K. (2001) A novel and rapid method for the automaticand simultaneous determination of total and viable cell concentration in pitching yeast slurries. Proc.Eur. Brew. Conv. Cong. 28, 78.
18. Combs, N. and Hatzis, C. (1996) Development of an epi-fluorescence assay for monitoring yeast viabilityand pre-treatment hydrolysate toxicity in the presence of lignocellulosic solids. Appl. Biochem. Biotechnol.57/58, 649–657.
19. Millard, P.J., Roth, B.L., Truong Thi, H. et al. (1997) Development of the FUN-1 family of fluorescentprobes for vacuole labelling and viability testing of yeasts. Appl. Environ. Microbiol. 63, 2897–2905.
20. Hutcheson, T.C., McKay, T., Farr, L. and Seddon, B. (1988) Evaluation of the stain Viablue for therapid estimation of viable yeast cells. Lett. Appl. Microbiol. 6, 85–88.
21. Breeuwer, P., Drocourt, J.L., Rombouts, F.M. and Abee, T. (1994) Energy dependent, carrier-mediatedextrusion of carboxyfluorescein from yeast Saccharomyces cerevisiae allows rapid assessment of cell via-bility by flow cytometry. Appl. Environ. Microbiol. 60, 1467–1472.
22. Chilver, M.K., Harrison, J. and Webb, T.J.B. (1978) Use of immunofluorescence and viability stains inquality control. J. Am. Soc. Brew. Chem. 36, 13–18.
23. Rotman, O. and Papermaster, B.W. (1966) Membrane properties of living mammalian cells as studiedby enzymatic hydrolysis of fluorogenic esters. Proc. Natl. Acad. Sci. USA 55, 143–141.
24. Betts, R.P., Bankes, P. and Banks, J.G. (1989) Rapid enumeration of viable micro-organisms by stainingand direct microscopy. Lett. Appl. Microbiol. 9, 199–202.
25. Lentini, A. (1993) A review of the various methods available for monitoring the physiological status ofyeast: yeast viability and vitality. Fermentation 6, 321–327.
26. Deere, D., Shen, J., Vesey, G. et al. (1998) Flow cytometry and cell sorting for yeast viability assessmentand cell selection. Yeast 14, 147–160.
27. Peladan, F. and Leitz, R. (1991) New method for the differential staining of dead and living cells ofyeasts and bacteria. Proc. Eur. Brew. Conv. Cong., Lisbon, pp. 481–487.
28. Smart, K.A. (2001) Yeast quality: live and let dye. Brew. Guardian 130, 24–26.29. Willets, J.C., Seward, R., Dinsdale, M.G. et al. (1997) Vitality of cider yeast grown micro-aerobically
with added ethanol, butan-1-ol or isobutanol. J. Inst. Brew. 103, 79–84.30. Murray, C.R., Barich, T. and Taylor, D. (1984) The effect of yeast storage conditions on subsequent fer-
mentations. Tech. Q. Master Brew. Assoc. Am. 21, 189–194.31. McCaig, R. and Bendiak, D.S. (1985) Yeast handling studies. I. Agitation of stored pitching yeast. II
Temperature of storage of pitching yeast. J. Am. Soc. Brew. Chem. 43, 114–118, 119–123.32. Pickerell, A.T.W., Hwang, A. and Axcell, B.C. (1991) Impact of yeast-handling procedures on beer flavor
development during fermentation. J. Am. Soc. Brew. Chem. 49, 87–92.33. Martens, F.B., Egberts, G.T.C., Kempers, J. et al. (1986) Yeast storage methods and their effects on
fermentation. Monograph XII. Eur. Brew. Conv., Symp. Brewer’s Yeast, Vuoranta (Helsinki), Finland,pp. 95–107.
34. Werner-Washburne, M., Braun, E., Johnston, G.C. and Singer, R.A. (1993) Stationary phase in the yeastSaccharomyces cerevisiae. Microbiol. Rev. 57, 383–401.
YEAST QUALITY AND FLUOROPHORE TECHNOLOGIES 161
15 Vitality Assessment Using the Fluorescent Stain FUN1
S.M. VAN ZANDYCKE, O. SIMAL andK.A. SMART
Abstract The production of high-quality beer is dependent on the condition of the pitch-ing yeast. In many breweries, the only routine test performed to assess this parameter is aviability measurement using methylene blue. However, the physiological state or vitality ofthe yeast represents a more suitable indicator of fermentation performance. There aremany methods available to assess vitality, most of which involve measurement of yeastintracellular compounds (adenosine triphosphate, glycogen, trehalose, sterols), intracellu-lar pH (ICP), extracellular pH (acidification power test) and released products from thecells (magnesium release test, adenylate kinase activity). However, most of these methodslack the reproducibility and sensitivity necessary to measure subtle changes in yeast physio-logical condition, and none of them allows the examination of individual cells within a heterogeneous population.
FUN1 is a fluorophore dye, which has been demonstrated to differentiate between liveand dead yeast cells. This dye is membrane permeable and stains live and dead cells green.In live cells, the formation of bright red cylindrical intravacuolar structures (CIVS) occursin response to metabolic activity, which has not been clearly defined. Dead cells remainbright green. Preliminary experiments revealed that CIVS formation was reduced in stressedcells. It was also observed that FUN1 underestimated viability compared with other fluor-escent and bright-field dyes. It is therefore suggested that FUN1 is inaccurate in deter-mining viability, but may represent a potential indicator of vitality. The vitality of starvedand oxidatively stressed cells was evaluated using FUN1. The levels of red fluorescence wereassessed quantitatively using a fluorimeter with a microplate reader attachment. Vitalitywas also determined by the acidification power test and measuring levels of intracellularcarbohydrate reserves. The intensity of red fluorescence decreased in starved cells andcorrelated with intracellular levels of glycogen. The response of oxidatively stressed cellsappeared to be a strain-dependent phenomenon and correlated with the levels of glucose-induced proton efflux.
Further experiments involving yeast populations subjected to other physiologicalstresses and an investigation of the metabolic activity responsible for CIVS formation willreveal whether FUN1 is suitable to assess vitality and potentially to predict fermentationperformance.
15.1 Introduction
The physiological status of yeast slurry can affect final beer quality. Recycling of brew-ing yeast induces repeated exposure to stress from fermentation and storage conditions.This results in a progressive deterioration of the physiological status of the slurry. It istherefore important to be able to assess the viability and vitality of pitching or croppingyeast before fermentation. Viability corresponds to the percentage of live cells in asample, whereas vitality represents the physiological state of the yeast that is viable.
Brewing Yeast Fermentation Performance: Second edition
Edited by: KATHERINE SMART Copyright 0 Blackwell Science 2003
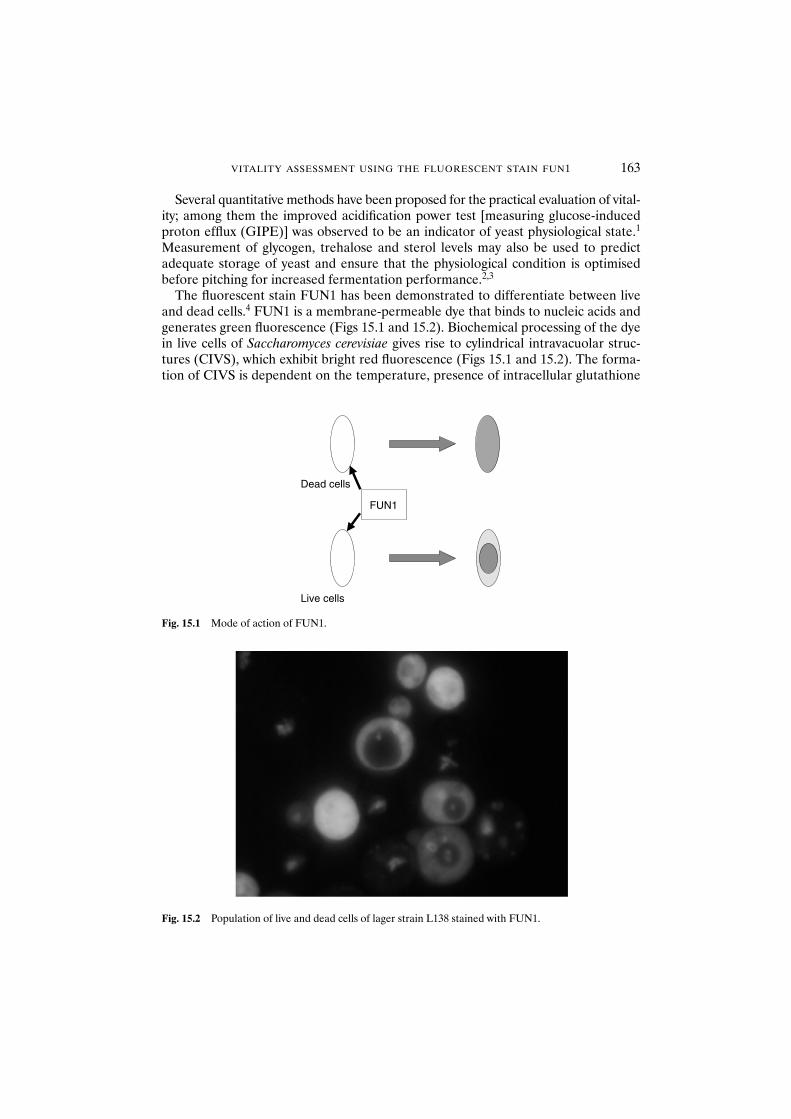
VITALITY ASSESSMENT USING THE FLUORESCENT STAIN FUN1 163
Several quantitative methods have been proposed for the practical evaluation of vital-ity; among them the improved acidification power test [measuring glucose-inducedproton efflux (GIPE)] was observed to be an indicator of yeast physiological state.1
Measurement of glycogen, trehalose and sterol levels may also be used to predictadequate storage of yeast and ensure that the physiological condition is optimisedbefore pitching for increased fermentation performance.2,3
The fluorescent stain FUN1 has been demonstrated to differentiate between liveand dead cells.4 FUN1 is a membrane-permeable dye that binds to nucleic acids andgenerates green fluorescence (Figs 15.1 and 15.2). Biochemical processing of the dyein live cells of Saccharomyces cerevisiae gives rise to cylindrical intravacuolar struc-tures (CIVS), which exhibit bright red fluorescence (Figs 15.1 and 15.2). The forma-tion of CIVS is dependent on the temperature, presence of intracellular glutathione
Live cells
Dead cells
FUN1
Fig. 15.1 Mode of action of FUN1.
Fig. 15.2 Population of live and dead cells of lager strain L138 stained with FUN1.
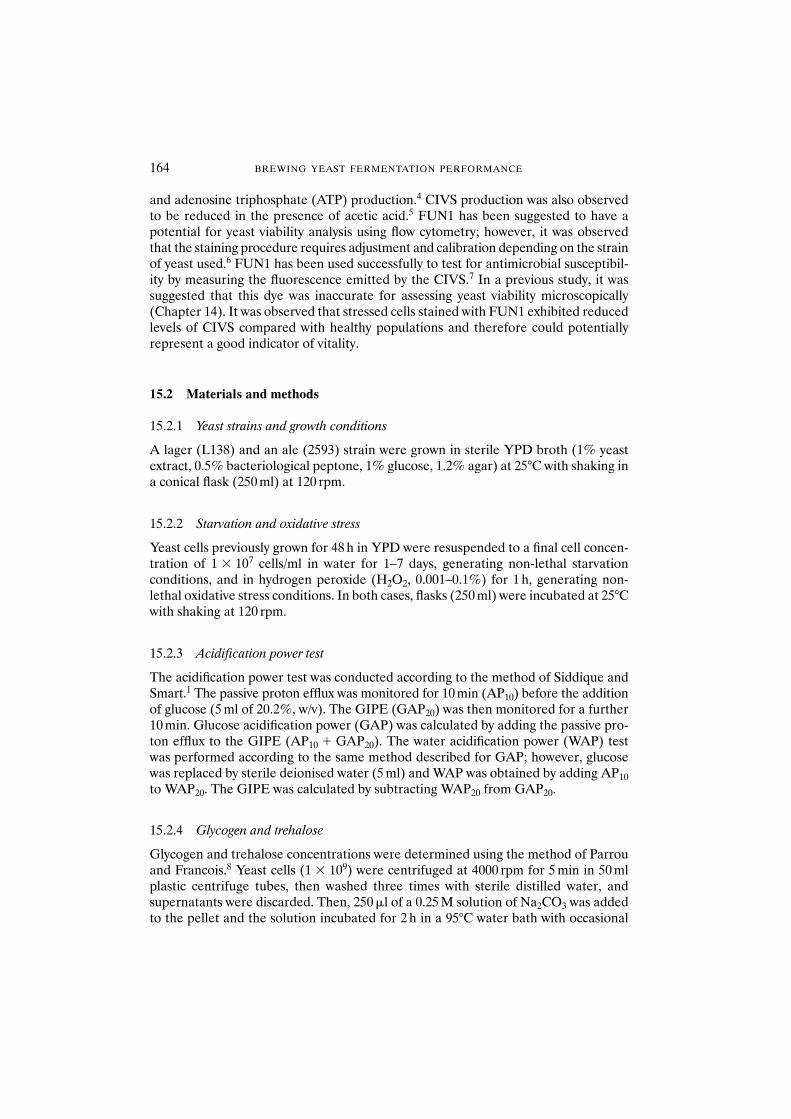
and adenosine triphosphate (ATP) production.4 CIVS production was also observedto be reduced in the presence of acetic acid.5 FUN1 has been suggested to have apotential for yeast viability analysis using flow cytometry; however, it was observedthat the staining procedure requires adjustment and calibration depending on the strainof yeast used.6 FUN1 has been used successfully to test for antimicrobial susceptibil-ity by measuring the fluorescence emitted by the CIVS.7 In a previous study, it wassuggested that this dye was inaccurate for assessing yeast viability microscopically(Chapter 14). It was observed that stressed cells stained with FUN1 exhibited reducedlevels of CIVS compared with healthy populations and therefore could potentiallyrepresent a good indicator of vitality.
15.2 Materials and methods
15.2.1 Yeast strains and growth conditions
A lager (L138) and an ale (2593) strain were grown in sterile YPD broth (1% yeastextract, 0.5% bacteriological peptone, 1% glucose, 1.2% agar) at 25°C with shaking ina conical flask (250 ml) at 120 rpm.
15.2.2 Starvation and oxidative stress
Yeast cells previously grown for 48 h in YPD were resuspended to a final cell concen-tration of 1 � 107 cells/ml in water for 1–7 days, generating non-lethal starvationconditions, and in hydrogen peroxide (H2O2, 0.001–0.1%) for 1 h, generating non-lethal oxidative stress conditions. In both cases, flasks (250 ml) were incubated at 25°Cwith shaking at 120 rpm.
15.2.3 Acidification power test
The acidification power test was conducted according to the method of Siddique andSmart.1 The passive proton efflux was monitored for 10 min (AP10) before the additionof glucose (5 ml of 20.2%, w/v). The GIPE (GAP20) was then monitored for a further10 min. Glucose acidification power (GAP) was calculated by adding the passive pro-ton efflux to the GIPE (AP10 � GAP20). The water acidification power (WAP) testwas performed according to the same method described for GAP; however, glucosewas replaced by sterile deionised water (5 ml) and WAP was obtained by adding AP10to WAP20. The GIPE was calculated by subtracting WAP20 from GAP20.
15.2.4 Glycogen and trehalose
Glycogen and trehalose concentrations were determined using the method of Parrouand Francois.8 Yeast cells (1 � 109) were centrifuged at 4000 rpm for 5 min in 50 mlplastic centrifuge tubes, then washed three times with sterile distilled water, andsupernatants were discarded. Then, 250 �l of a 0.25 M solution of Na2CO3 was addedto the pellet and the solution incubated for 2 h in a 95°C water bath with occasional
164 BREWING YEAST FERMENTATION PERFORMANCE
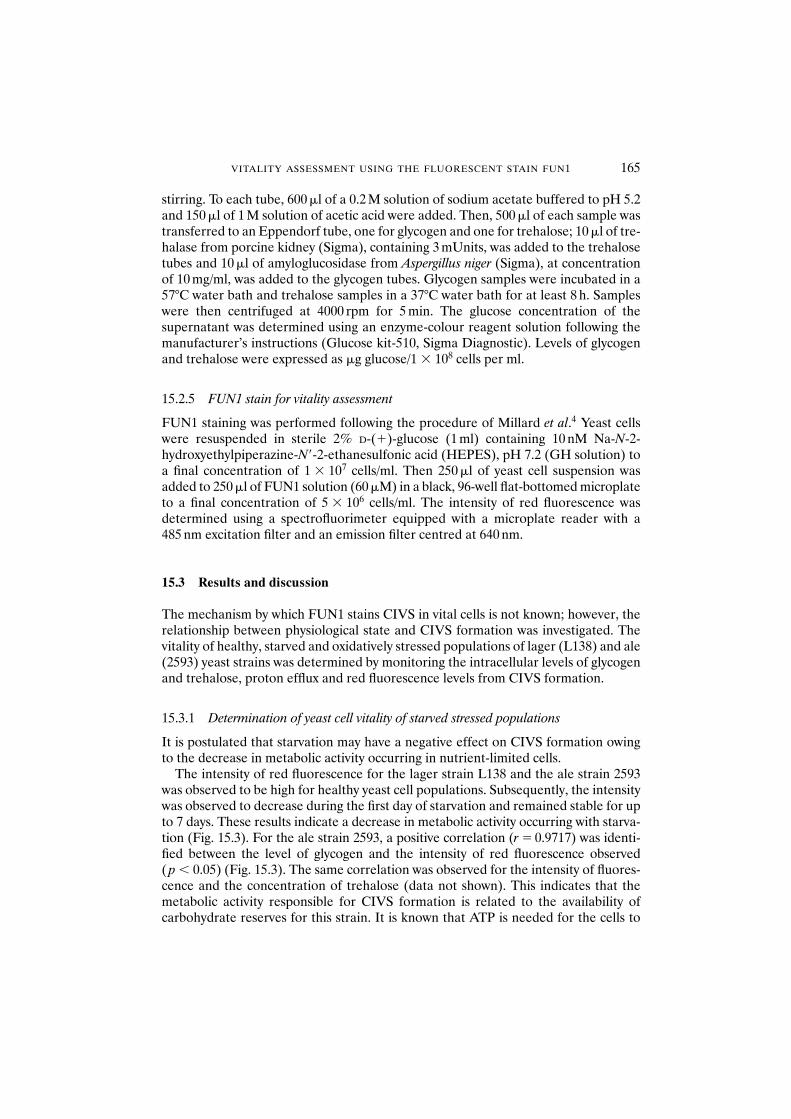
VITALITY ASSESSMENT USING THE FLUORESCENT STAIN FUN1 165
stirring. To each tube, 600 �l of a 0.2 M solution of sodium acetate buffered to pH 5.2and 150 �l of 1 M solution of acetic acid were added. Then, 500 �l of each sample wastransferred to an Eppendorf tube, one for glycogen and one for trehalose; 10 �l of tre-halase from porcine kidney (Sigma), containing 3 mUnits, was added to the trehalosetubes and 10 �l of amyloglucosidase from Aspergillus niger (Sigma), at concentrationof 10 mg/ml, was added to the glycogen tubes. Glycogen samples were incubated in a57°C water bath and trehalose samples in a 37°C water bath for at least 8 h. Sampleswere then centrifuged at 4000 rpm for 5 min. The glucose concentration of thesupernatant was determined using an enzyme-colour reagent solution following themanufacturer’s instructions (Glucose kit-510, Sigma Diagnostic). Levels of glycogenand trehalose were expressed as �g glucose/1 � 108 cells per ml.
15.2.5 FUN1 stain for vitality assessment
FUN1 staining was performed following the procedure of Millard et al.4 Yeast cellswere resuspended in sterile 2% D-(�)-glucose (1 ml) containing 10 nM Na-N-2-hydroxyethylpiperazine-N�-2-ethanesulfonic acid (HEPES), pH 7.2 (GH solution) toa final concentration of 1 � 107 cells/ml. Then 250 �l of yeast cell suspension wasadded to 250 �l of FUN1 solution (60 �M) in a black, 96-well flat-bottomed microplateto a final concentration of 5 � 106 cells/ml. The intensity of red fluorescence wasdetermined using a spectrofluorimeter equipped with a microplate reader with a485 nm excitation filter and an emission filter centred at 640 nm.
15.3 Results and discussion
The mechanism by which FUN1 stains CIVS in vital cells is not known; however, therelationship between physiological state and CIVS formation was investigated. Thevitality of healthy, starved and oxidatively stressed populations of lager (L138) and ale(2593) yeast strains was determined by monitoring the intracellular levels of glycogenand trehalose, proton efflux and red fluorescence levels from CIVS formation.
15.3.1 Determination of yeast cell vitality of starved stressed populations
It is postulated that starvation may have a negative effect on CIVS formation owingto the decrease in metabolic activity occurring in nutrient-limited cells.
The intensity of red fluorescence for the lager strain L138 and the ale strain 2593was observed to be high for healthy yeast cell populations. Subsequently, the intensitywas observed to decrease during the first day of starvation and remained stable for upto 7 days. These results indicate a decrease in metabolic activity occurring with starva-tion (Fig. 15.3). For the ale strain 2593, a positive correlation (r � 0.9717) was identi-fied between the level of glycogen and the intensity of red fluorescence observed( p � 0.05) (Fig. 15.3). The same correlation was observed for the intensity of fluores-cence and the concentration of trehalose (data not shown). This indicates that themetabolic activity responsible for CIVS formation is related to the availability ofcarbohydrate reserves for this strain. It is known that ATP is needed for the cells to
166 BREWING YEAST FERMENTATION PERFORMANCE
produce CIVS.4 Therefore, it is postulated that when levels of glycogen and trehaloseare low less ATP is produced, resulting in reduced CIVS formation.
However, for the lager strain L138 no correlation (r � 0.5512) could be establishedbetween the levels of glycogen and the intensity of red fluorescence (Fig. 15.3). Thereasons for this observation are not known and merit further investigation.
15.3.2 Determination of yeast cell vitality of oxidatively stressed populations
Oxidative stress occurs during the brewing process when the yeast is in contact withoxygen, mainly during propagation and pitching. Reactive oxygen species are pro-duced during normal cellular metabolism and can cause damage to cell membranes,DNA and proteins.9 Tolerance to oxidative stress is a strain-dependent phenomenonin brewing strains.10 The correct amount of oxygen should be supplied to the yeast forsterol formation, without causing any excessive oxidative damage. Given the decreasein metabolic activity observed with starved cells using FUN1, it was postulated thatthis dye may also be able to detect changes in the metabolic activity of oxidativelystressed cells. To verify this hypothesis, the occurrence of CIVS formation wasfollowed in oxidatively stressed cells, resuspended in H2O2.
For the lager strain, levels of red fluorescence were observed to be lower for healthypopulations than for oxidatively stressed cells (Fig. 15.4). Red fluorescence increasedwith greater H2O2 concentration. In contrast, for the ale strain, levels of red fluores-cence were observed to be higher for healthy populations than for oxidatively stressedcells (Fig. 15.4).
Glycogen levels
Lager strain L138 Ale strain 2593
Duration of starvation (days) Duration of starvation (days)
Intensity of red fluorescence
10 2 3 4 5 6 7 10 2 3 4 5 6 7
Fig. 15.3 Comparison between the intensity of red fluorescence and the level of glycogen for starvedcells of lager (L138) and ale (2593) strains.
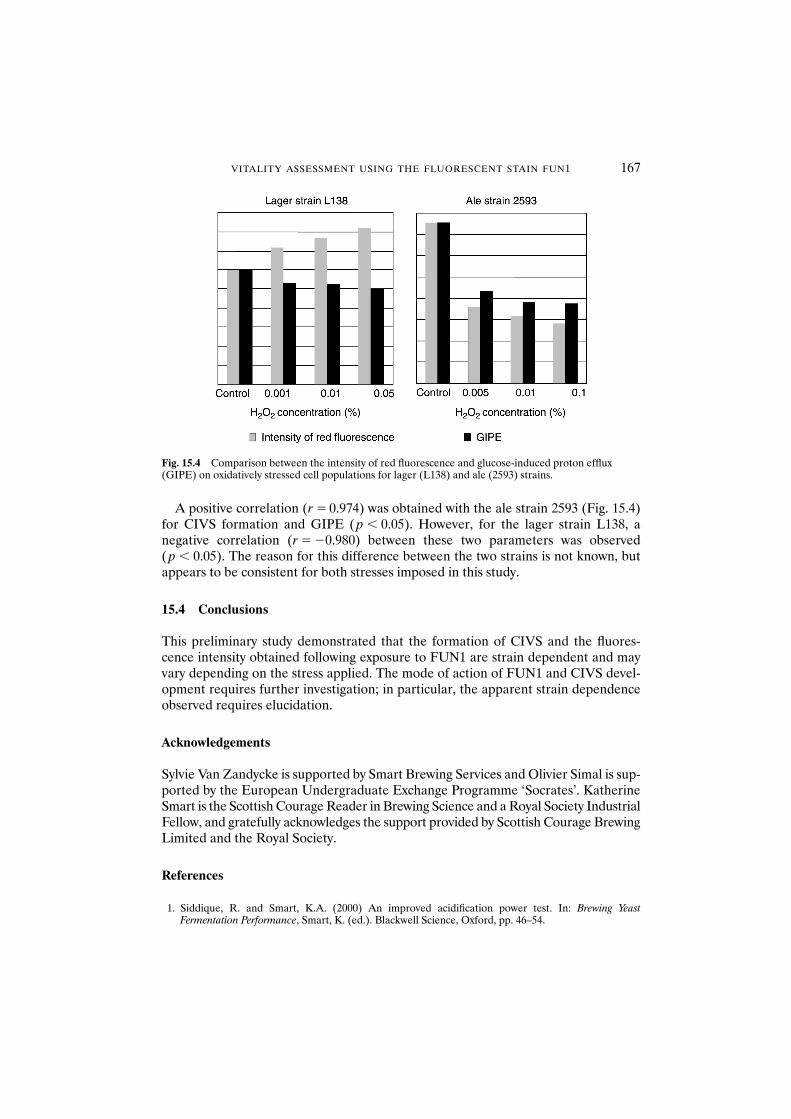
VITALITY ASSESSMENT USING THE FLUORESCENT STAIN FUN1 167
A positive correlation (r � 0.974) was obtained with the ale strain 2593 (Fig. 15.4)for CIVS formation and GIPE ( p � 0.05). However, for the lager strain L138, a negative correlation (r � �0.980) between these two parameters was observed( p � 0.05). The reason for this difference between the two strains is not known, butappears to be consistent for both stresses imposed in this study.
15.4 Conclusions
This preliminary study demonstrated that the formation of CIVS and the fluores-cence intensity obtained following exposure to FUN1 are strain dependent and mayvary depending on the stress applied. The mode of action of FUN1 and CIVS devel-opment requires further investigation; in particular, the apparent strain dependenceobserved requires elucidation.
Acknowledgements
Sylvie Van Zandycke is supported by Smart Brewing Services and Olivier Simal is sup-ported by the European Undergraduate Exchange Programme ‘Socrates’. KatherineSmart is the Scottish Courage Reader in Brewing Science and a Royal Society IndustrialFellow, and gratefully acknowledges the support provided by Scottish Courage BrewingLimited and the Royal Society.
References
1. Siddique, R. and Smart, K.A. (2000) An improved acidification power test. In: Brewing YeastFermentation Performance, Smart, K. (ed.). Blackwell Science, Oxford, pp. 46–54.
Fig. 15.4 Comparison between the intensity of red fluorescence and glucose-induced proton efflux(GIPE) on oxidatively stressed cell populations for lager (L138) and ale (2593) strains.
2. Quain, D.E. and Tubb, R.S. (1982) The importance of glycogen in brewing yeast. Tech. Q. Master Brew.Assoc. Am. 19, 29–33.
3. Boulton, C.A., Clutterbuck, V.J. and Durnin, S. (2000) Yeast oxygenation and storage. In: Brewing YeastFermentation Performance, Smart, K. (ed.). Blackwell Science, Oxford, pp. 10–18.
4. Millard, P.J., Roth, B.L., Truong Thi, H. et al. (1997) Development of the FUN-1 family of fluorescentprobes for vacuole labelling and viability testing of yeasts. Appl. Environ. Microbiol. 63, 2897–2905.
5. Prudencio, C., Sansonetty, F. and Corte-Real, M. (1998) Flow cytometric assessment of cell structuraland functional changes induced by acetic acid in the yeasts Zygosaccharomyces bailii and Saccha-romyces cerevisiae. Cytometry 31, 307–313.
6. Deere, D., Shen, J., Vesey, G. et al. (1998) Flow cytometry and cell sorting for yeast viability assessmentand cell selection. Yeast 14, 147–160.
7. Wenisch, C., Floris Linnau, K., Parschalk, B. et al. (1997) Rapid susceptibility testing of fungi by flowcytometry using vital staining. J. Clin. Microbiol. 35, 5–10.
8. Parrou, J.L. and Francois, J. (1997) A simplified procedure for a rapid and reliable assay of both glycogenand trehalose in whole yeast cells. Anal. Biochem. 248, 186–188.
9. Jamieson, D.J. (1998) Oxidative stress responses of the yeast Saccharomyces cerevisiae. Yeast 14,1511–1527.
10. Martin, V., Quain, D.E. and Smart, K.A. (2000) The oxidative stress of ale and lager yeast strains. In: Brewing Yeast Fermentation Performance, Smart, K. (ed.). Blackwell Science, Oxford, pp. 97–104.
168 BREWING YEAST FERMENTATION PERFORMANCE
16 Flow Cytometry: A New Tool in Brewing Technology
K.J. HUTTER and C. LANGE
Abstract As a result of the proliferation of individual yeast cells during the fermentationprocess, the growth conditions in the culture are changing continuously. Current processcontrol (i.e. temperature, pH, CO2, extract decomposition, ethanol content, etc.) is orien-tated towards the behaviour of the overall population and not towards individual cells.However, it is the individual cell that is affected by changes in nutrient substrate andgrowth parameters in a static culture. The empirical assumption that the inoculated yeastcells pass through serial repitching with the same vitality, activity and productivity is basic-ally wrong. Each cell has its own individual cell cycle, dependent on the particular growthconditions. It is therefore necessary to analyse fermentation process continuously, bymeasuring the direct influence of chemical and physical process variables on yeast at everypoint during growth.
The objective of this study was to use flow cytometry for direct process evaluation.Several flow-cytometric (and image analytical) parameters have been developed to exam-ine industrial yeast strains in the process.
Using modern fluorescence optical techniques the biological condition of yeast cells canbe evaluated directly, thus allowing immediate intervention in controlling and modellingthe fermentation process. Current flow-cytometric (and image analytical) process controlis demonstrated with selected examples in this chapter.
16.1 Introduction
As a result of the proliferation of individual yeast cells during the fermentation process,growth conditions are never constant, and change with every repitching. Currentprocess control (i.e. temperature, pH, CO2, extract decomposition, ethanol content,etc.) is orientated towards the behaviour of the overall population and not towards indi-vidual cells. It is the individual cell, however, that is either stimulated or retarded bychanges in nutrient substrate and growth parameters of a static culture. The assump-tion, based on empirical studies, that inoculated yeast cells pass through serial repitch-ing with unchanged vitality, activity and productivity is basically wrong. Each cell has itsown individual cell cycle, depending on its particular growth conditions. Therefore, it isnecessary to analyse the fermentation process continuously, i.e. to measure the directinfluence of chemical and physical process variables on yeast at any time during growth.
The objective of this presentation was to use flow cytometry for direct process evalu-ation. Many staining procedures have been developed over several decades to moni-tor flow-cytometric (and image analytical) parameters to determine industrial yeaststrains in the fermentation process (Table 16.1).
Using modern fluorescence optical techniques the biological condition of yeastcells can be evaluated directly. Therefore, immediate intervention in controlling andmodelling the fermentation process is possible. Current flow-cytometric (and imageanalytical) process control is presented by means of cell-cycle analysis and glycogencontent determination. The detection of contaminants is also shown.
Brewing Yeast Fermentation Performance: Second edition
Edited by: KATHERINE SMART Copyright 0 Blackwell Science 2003
16.2 Materials and methods
16.2.1 Glycogen content
After fixation for at least 24 h in 70% ethanol at 4°C the yeast pellet was incubated in1 ml 1 N HCl for 50 min. HCl was removed by centrifugation and the pellet wasstained with acriflavine solution for 1 h (excitation: 488 nm). Further details aredescribed elsewhere.7
16.2.2 DNA content
Fixed yeast cells were incubated in 0.1% RNase for 1 h exactly at 37°C. After removalof the enzyme solution, the pellet was resuspended in 1 ml phosphate-buffered saline(PBS), and 100 �l of a propidium iodide staining solution was added. After 1 h ofincubation cells were measured by flow-cytometric analysis (excitation: 488 nm).3
16.2.3 Detection of beer spoilage contaminants
Beer samples (each 50 ml) were filtered through a membrane filter (Nuclepore). Thefilter was placed on a glass slide. The filtration area was then stained with 10 �l of astaining solution (kit containing fluorescein diacetate and propidium iodide). Afterthis procedure and excitation at 488 nm, viable cells fluoresce green while dead cellsfluoresce red. This spectral differentiation can be detected directly using a fluores-cence microscope (equipped with a steerable slide table)5 or an image analysis system.
16.2.4 Flow cytometry
Flow-cytometric analysis was carried out with an EPICS II (Coulter, Krefeld, Germany),equipped with an argon ion laser at 488 nm and/or a PAS from Partec (Münster,Germany). The flow device from Partec was fitted with a mercury high-pressure lamp,HBO 100, and an argon ion laser at 488 nm.
170 BREWING YEAST FERMENTATION PERFORMANCE
Table 16.1 Biomonitoring of the fermentation process
No. Flow cytometric application Ref.
1 Ageing of yeast cells Count of fluorescing bud scars 12 Apoptosis of yeast cells Detection of micronuclei in yeast cells 23 Cell cycle analysis Characterisation of the cell cycle 3
phase of yeast cells during the process4 Cell volume/cell count Scatter signal corresponds to cell volume 45 Contaminants Detection of beer spoilage microorganisms 56 Flocculation Affinity for special residual sugars on the 6
yeast membrane by lectins7 Glycogen content Intracellular reserve compounds of yeast cells 78 3�-Hydroxysterols Information on sparking and bulk 8
membrane functions9 Intracellular pH value Viability test 9
10 Mitochondrial fluorescence Viability test 911 Neutral lipid content Reserve compounds of yeast cells 812 Viability testing Esterase activity of yeast cells 10
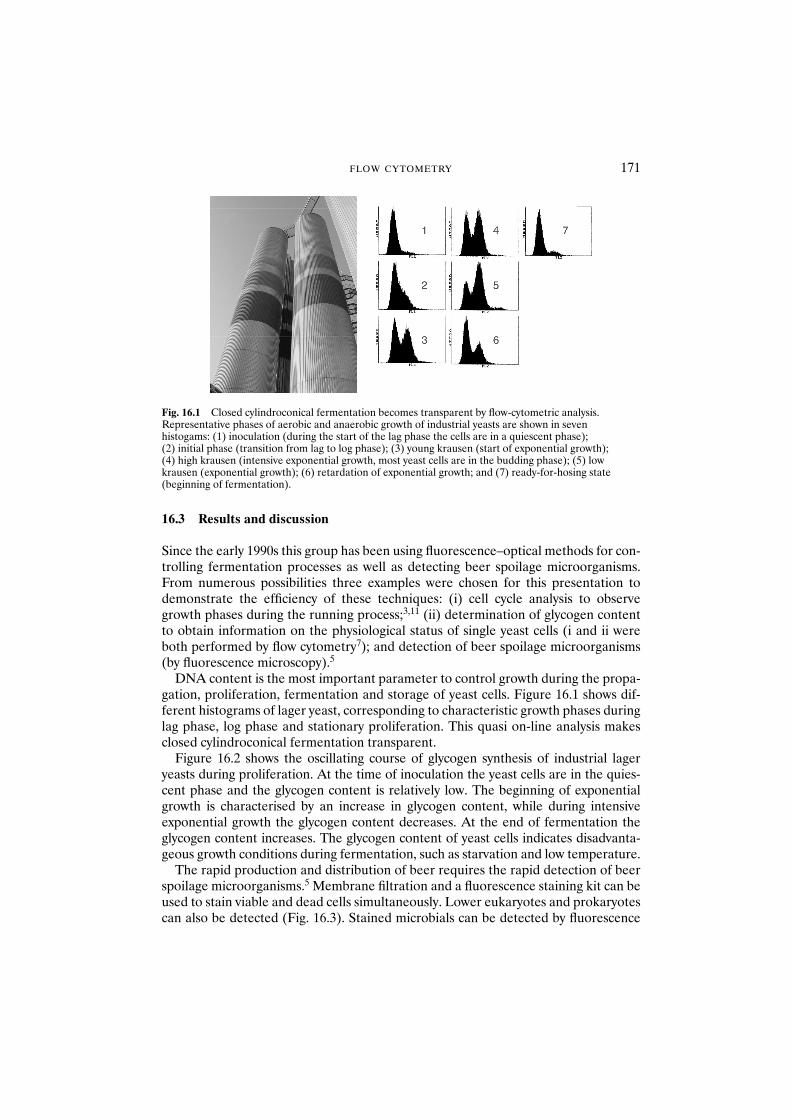
16.3 Results and discussion
Since the early 1990s this group has been using fluorescence–optical methods for con-trolling fermentation processes as well as detecting beer spoilage microorganisms.From numerous possibilities three examples were chosen for this presentation todemonstrate the efficiency of these techniques: (i) cell cycle analysis to observegrowth phases during the running process;3,11 (ii) determination of glycogen contentto obtain information on the physiological status of single yeast cells (i and ii wereboth performed by flow cytometry7); and detection of beer spoilage microorganisms(by fluorescence microscopy).5
DNA content is the most important parameter to control growth during the propa-gation, proliferation, fermentation and storage of yeast cells. Figure 16.1 shows dif-ferent histograms of lager yeast, corresponding to characteristic growth phases duringlag phase, log phase and stationary proliferation. This quasi on-line analysis makesclosed cylindroconical fermentation transparent.
Figure 16.2 shows the oscillating course of glycogen synthesis of industrial lageryeasts during proliferation. At the time of inoculation the yeast cells are in the quies-cent phase and the glycogen content is relatively low. The beginning of exponentialgrowth is characterised by an increase in glycogen content, while during intensiveexponential growth the glycogen content decreases. At the end of fermentation theglycogen content increases. The glycogen content of yeast cells indicates disadvanta-geous growth conditions during fermentation, such as starvation and low temperature.
The rapid production and distribution of beer requires the rapid detection of beerspoilage microorganisms.5 Membrane filtration and a fluorescence staining kit can beused to stain viable and dead cells simultaneously. Lower eukaryotes and prokaryotescan also be detected (Fig. 16.3). Stained microbials can be detected by fluorescence
FLOW CYTOMETRY 171
Fig. 16.1 Closed cylindroconical fermentation becomes transparent by flow-cytometric analysis.Representative phases of aerobic and anaerobic growth of industrial yeasts are shown in seven histogams: (1) inoculation (during the start of the lag phase the cells are in a quiescent phase); (2) initial phase (transition from lag to log phase); (3) young krausen (start of exponential growth); (4) high krausen (intensive exponential growth, most yeast cells are in the budding phase); (5) lowkrausen (exponential growth); (6) retardation of exponential growth; and (7) ready-for-hosing state(beginning of fermentation).
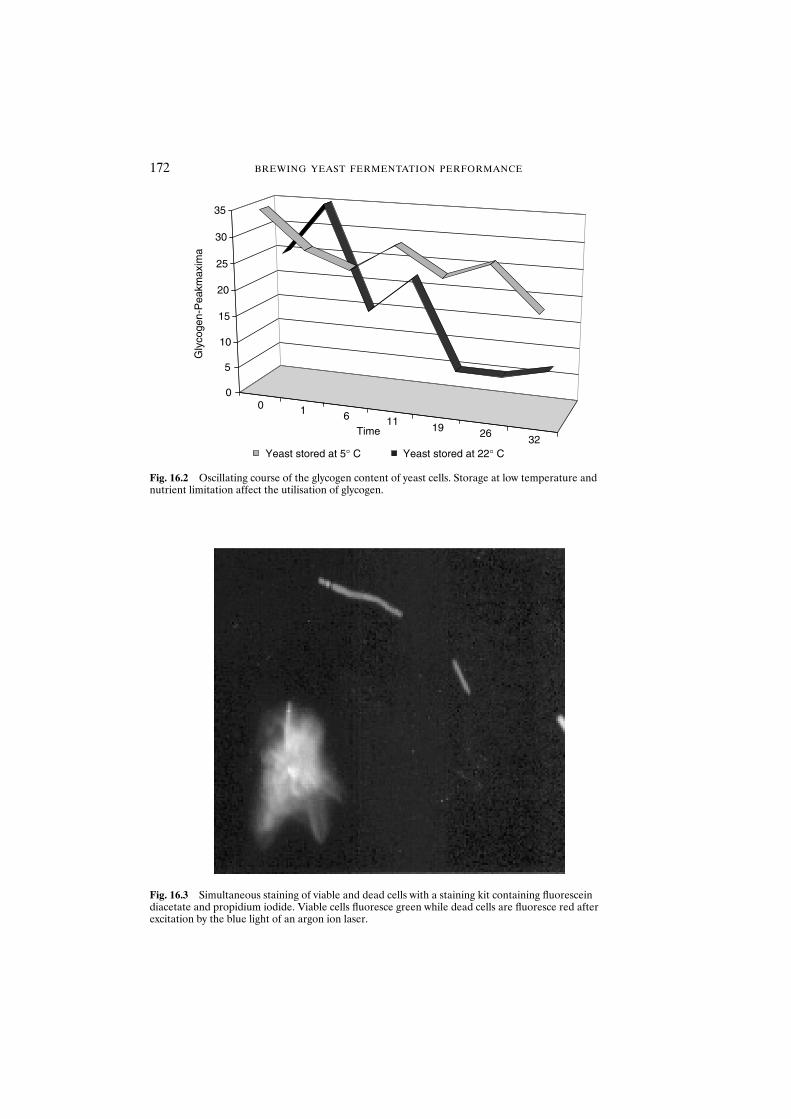
172 BREWING YEAST FERMENTATION PERFORMANCE
0 1 6 1119 26
32
0
5
10
15
20
25
30
35
Time
Yeast stored at 5° C Yeast stored at 22° C
Gly
coge
n-P
eakm
axim
a
Fig. 16.2 Oscillating course of the glycogen content of yeast cells. Storage at low temperature and nutrient limitation affect the utilisation of glycogen.
Fig. 16.3 Simultaneous staining of viable and dead cells with a staining kit containing fluorescein diacetate and propidium iodide. Viable cells fluoresce green while dead cells are fluoresce red after excitation by the blue light of an argon ion laser.
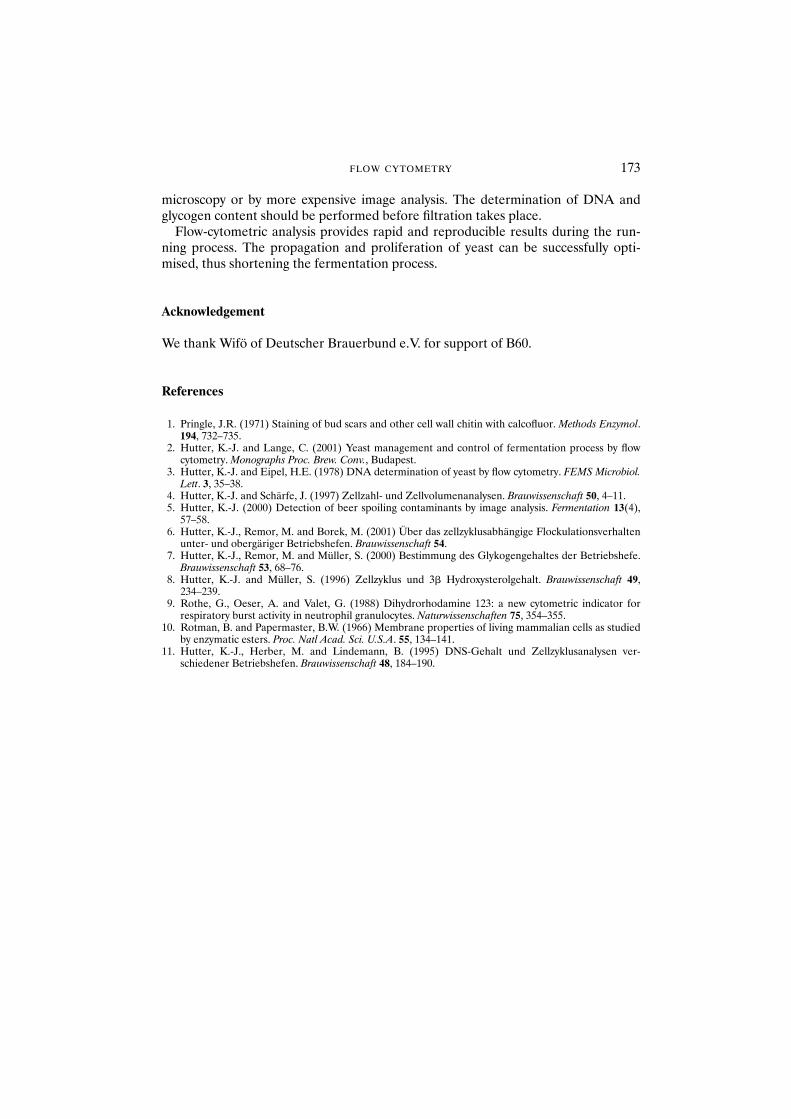
microscopy or by more expensive image analysis. The determination of DNA andglycogen content should be performed before filtration takes place.
Flow-cytometric analysis provides rapid and reproducible results during the run-ning process. The propagation and proliferation of yeast can be successfully opti-mised, thus shortening the fermentation process.
Acknowledgement
We thank Wifö of Deutscher Brauerbund e.V. for support of B60.
References
1. Pringle, J.R. (1971) Staining of bud scars and other cell wall chitin with calcofluor. Methods Enzymol.194, 732–735.
2. Hutter, K.-J. and Lange, C. (2001) Yeast management and control of fermentation process by flowcytometry. Monographs Proc. Brew. Conv., Budapest.
3. Hutter, K.-J. and Eipel, H.E. (1978) DNA determination of yeast by flow cytometry. FEMS Microbiol.Lett. 3, 35–38.
4. Hutter, K.-J. and Schärfe, J. (1997) Zellzahl- und Zellvolumenanalysen. Brauwissenschaft 50, 4–11.5. Hutter, K.-J. (2000) Detection of beer spoiling contaminants by image analysis. Fermentation 13(4),
57–58.6. Hutter, K.-J., Remor, M. and Borek, M. (2001) Über das zellzyklusabhängige Flockulationsverhalten
unter- und obergäriger Betriebshefen. Brauwissenschaft 54.7. Hutter, K.-J., Remor, M. and Müller, S. (2000) Bestimmung des Glykogengehaltes der Betriebshefe.
Brauwissenschaft 53, 68–76.8. Hutter, K.-J. and Müller, S. (1996) Zellzyklus und 3� Hydroxysterolgehalt. Brauwissenschaft 49,
234–239.9. Rothe, G., Oeser, A. and Valet, G. (1988) Dihydrorhodamine 123: a new cytometric indicator for
respiratory burst activity in neutrophil granulocytes. Naturwissenschaften 75, 354–355.10. Rotman, B. and Papermaster, B.W. (1966) Membrane properties of living mammalian cells as studied
by enzymatic esters. Proc. Natl Acad. Sci. U.S.A. 55, 134–141.11. Hutter, K.-J., Herber, M. and Lindemann, B. (1995) DNS-Gehalt und Zellzyklusanalysen ver-
schiedener Betriebshefen. Brauwissenschaft 48, 184–190.
FLOW CYTOMETRY 173
17 Comparison of the Methylene Blue Assay with a New Flow-cytometric Method for Determining Yeast Viability in a Brewery
A. BOYD, T. GUNASEKERA, P. ATTFIELD, K. SIMIC, S. VINCENT and D. VEAL
Abstract The accurate measurement of yeast viability is a key parameter for quality con-trol of brewery fermentations. The most widely used assay for measuring viability involvesstaining cells with methylene blue and visualising with microscopy. However, this assay isknown to overestimate viability, and analysis is subjective and thus subject to operatorerror. Furthermore, the relatively low number of cells that are analysed using this method(�1000) may not be representative of the entire yeast population.
A viability assay was developed that involves staining cells with a fluorescent dye,oxonol, which provides an accurate measure of yeast viability. Subsequent analysis of cellsby flow cytometry offers a number of advantages. Analysis is automatic, and the cytometercan analyse individual cells at rates of thousands per second. Therefore, viability data fora statistically significant number of cells can be determined rapidly. Flow cytometry cansuccessfully analyse oxonol-stained brewing yeast samples, without interference frombackground noise (wort particles).
The assay was optimised for brewery conditions and then trialled at a brewery for 6 months. Yeast samples (n � 179) were analysed using the methylene blue method, and by flow cytometry, and the results compared. The flow-cytometric assay provided highlyreproducible viability results (�1% variation) compared with methylene blue (6%).Operator error when using methylene blue (5%) was also substantially reduced by flowcytometry (�1%).
The flow-cytometric assay described enables the analysis of a significant number of cells (typically 50 000), within approximately 1 min. The results indicate that the assay haspotential applications in process and quality control in breweries.
17.1 Introduction
The brewing industry requires a rapid and reliable yeast viability assay. Current methods are either slow or unreliable. Results from plate counts, for example, takemany days, and cells that have lost replicative ability may still possess fermentativeactivity.1 The methylene blue assay is comparatively rapid. However, it is inconsistent,with many reports of this dye significantly overestimating numbers of live cells1,2 andothers finding the opposite.3 Further, analysis is subjective, and it is questionablewhether the relatively low number of cells able to be analysed is representative of theentire yeast population.
This paper describes a method that involves staining cells with the fluorescent dyeoxonol.4–6 Flow-cytometric (FCM) analysis of oxonol-stained cells is objective and alarge number of cells can be analysed individually within a short space of time.7
Background noise (i.e. wort particles) can be ignored by the software.8
Brewing Yeast Fermentation Performance: Second edition
Edited by: KATHERINE SMART Copyright 0 Blackwell Science 2003
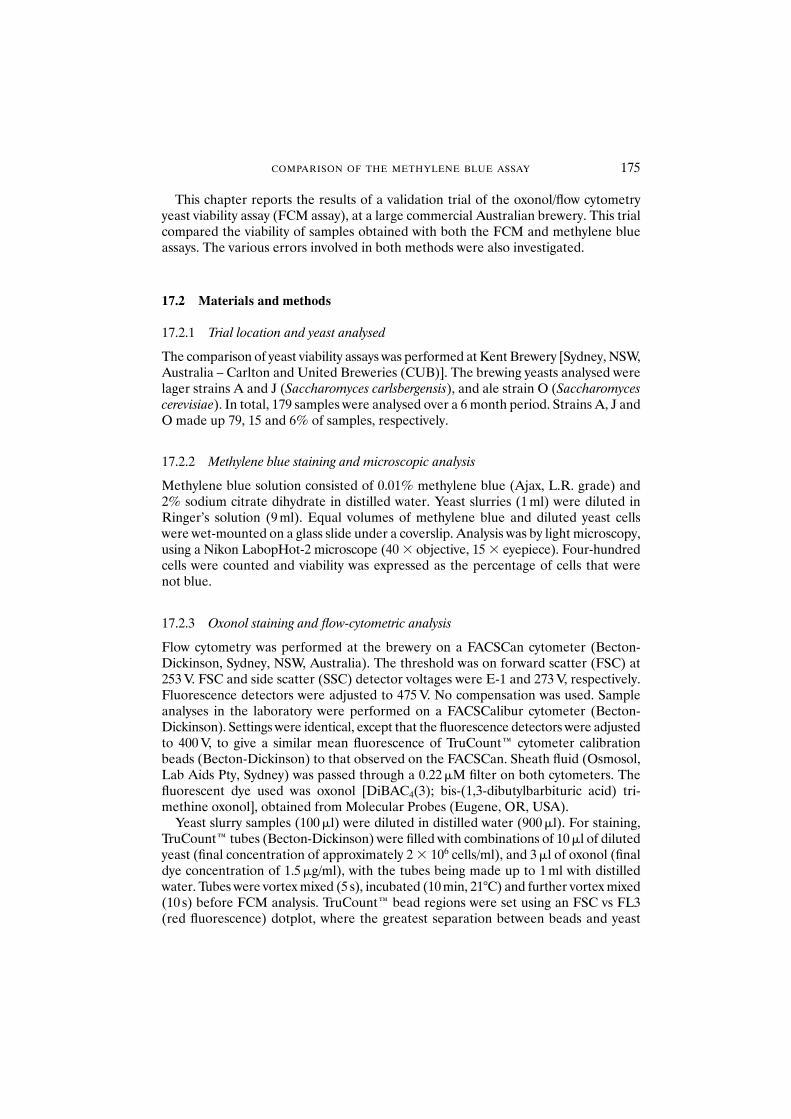
This chapter reports the results of a validation trial of the oxonol/flow cytometryyeast viability assay (FCM assay), at a large commercial Australian brewery. This trialcompared the viability of samples obtained with both the FCM and methylene blueassays. The various errors involved in both methods were also investigated.
17.2 Materials and methods
17.2.1 Trial location and yeast analysed
The comparison of yeast viability assays was performed at Kent Brewery [Sydney, NSW,Australia – Carlton and United Breweries (CUB)]. The brewing yeasts analysed werelager strains A and J (Saccharomyces carlsbergensis), and ale strain O (Saccharomycescerevisiae). In total, 179 samples were analysed over a 6 month period. Strains A, J andO made up 79, 15 and 6% of samples, respectively.
17.2.2 Methylene blue staining and microscopic analysis
Methylene blue solution consisted of 0.01% methylene blue (Ajax, L.R. grade) and2% sodium citrate dihydrate in distilled water. Yeast slurries (1 ml) were diluted inRinger’s solution (9 ml). Equal volumes of methylene blue and diluted yeast cellswere wet-mounted on a glass slide under a coverslip. Analysis was by light microscopy,using a Nikon LabopHot-2 microscope (40 � objective, 15 � eyepiece). Four-hundredcells were counted and viability was expressed as the percentage of cells that were not blue.
17.2.3 Oxonol staining and flow-cytometric analysis
Flow cytometry was performed at the brewery on a FACSCan cytometer (Becton-Dickinson, Sydney, NSW, Australia). The threshold was on forward scatter (FSC) at253 V. FSC and side scatter (SSC) detector voltages were E-1 and 273 V, respectively.Fluorescence detectors were adjusted to 475 V. No compensation was used. Sampleanalyses in the laboratory were performed on a FACSCalibur cytometer (Becton-Dickinson). Settings were identical, except that the fluorescence detectors were adjustedto 400 V, to give a similar mean fluorescence of TruCount™ cytometer calibrationbeads (Becton-Dickinson) to that observed on the FACSCan. Sheath fluid (Osmosol,Lab Aids Pty, Sydney) was passed through a 0.22 �M filter on both cytometers. Thefluorescent dye used was oxonol [DiBAC4(3); bis-(1,3-dibutylbarbituric acid) tri-methine oxonol], obtained from Molecular Probes (Eugene, OR, USA).
Yeast slurry samples (100 �l) were diluted in distilled water (900 �l). For staining,TruCount™ tubes (Becton-Dickinson) were filled with combinations of 10 �l of dilutedyeast (final concentration of approximately 2 � 106 cells/ml), and 3 �l of oxonol (finaldye concentration of 1.5 �g/ml), with the tubes being made up to 1 ml with distilledwater. Tubes were vortex mixed (5 s), incubated (10 min, 21°C) and further vortex mixed(10 s) before FCM analysis. TruCount™ bead regions were set using an FSC vs FL3(red fluorescence) dotplot, where the greatest separation between beads and yeast
COMPARISON OF THE METHYLENE BLUE ASSAY 175
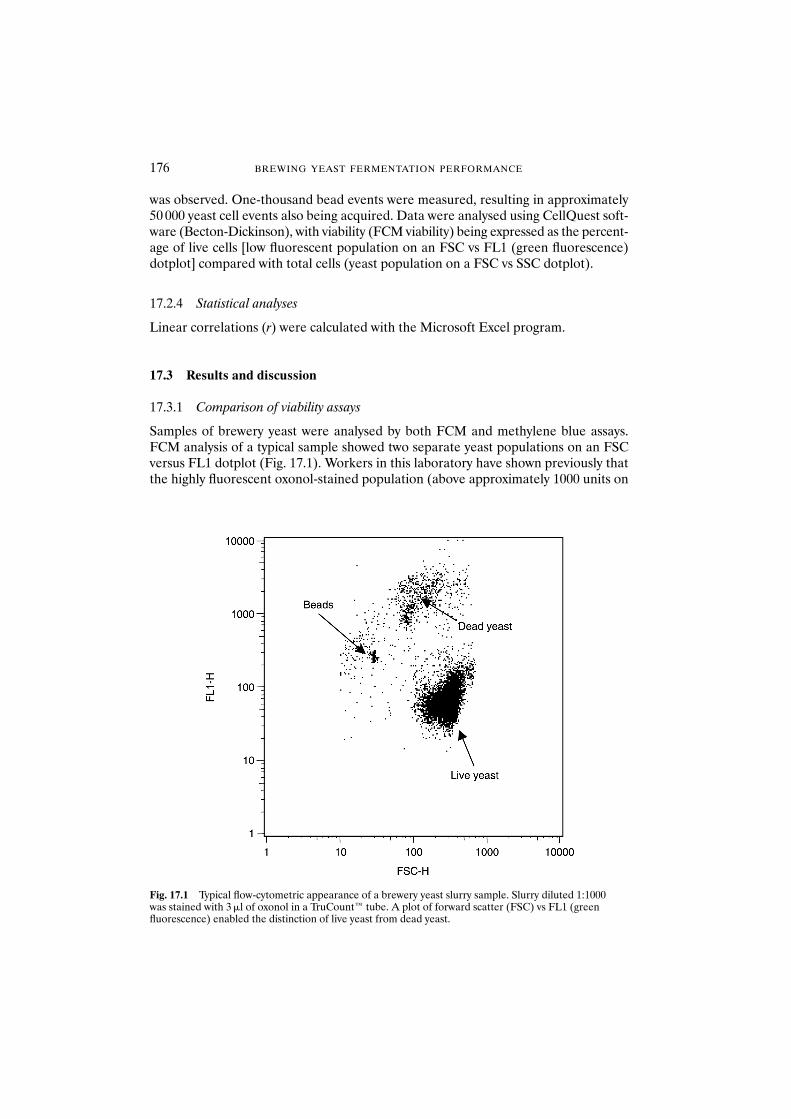
176 BREWING YEAST FERMENTATION PERFORMANCE
was observed. One-thousand bead events were measured, resulting in approximately50 000 yeast cell events also being acquired. Data were analysed using CellQuest soft-ware (Becton-Dickinson), with viability (FCM viability) being expressed as the percent-age of live cells [low fluorescent population on an FSC vs FL1 (green fluorescence)dotplot] compared with total cells (yeast population on a FSC vs SSC dotplot).
17.2.4 Statistical analyses
Linear correlations (r) were calculated with the Microsoft Excel program.
17.3 Results and discussion
17.3.1 Comparison of viability assays
Samples of brewery yeast were analysed by both FCM and methylene blue assays.FCM analysis of a typical sample showed two separate yeast populations on an FSCversus FL1 dotplot (Fig. 17.1). Workers in this laboratory have shown previously thatthe highly fluorescent oxonol-stained population (above approximately 1000 units on
Fig. 17.1 Typical flow-cytometric appearance of a brewery yeast slurry sample. Slurry diluted 1:1000 was stained with 3 �l of oxonol in a TruCount™ tube. A plot of forward scatter (FSC) vs FL1 (green fluorescence) enabled the distinction of live yeast from dead yeast.
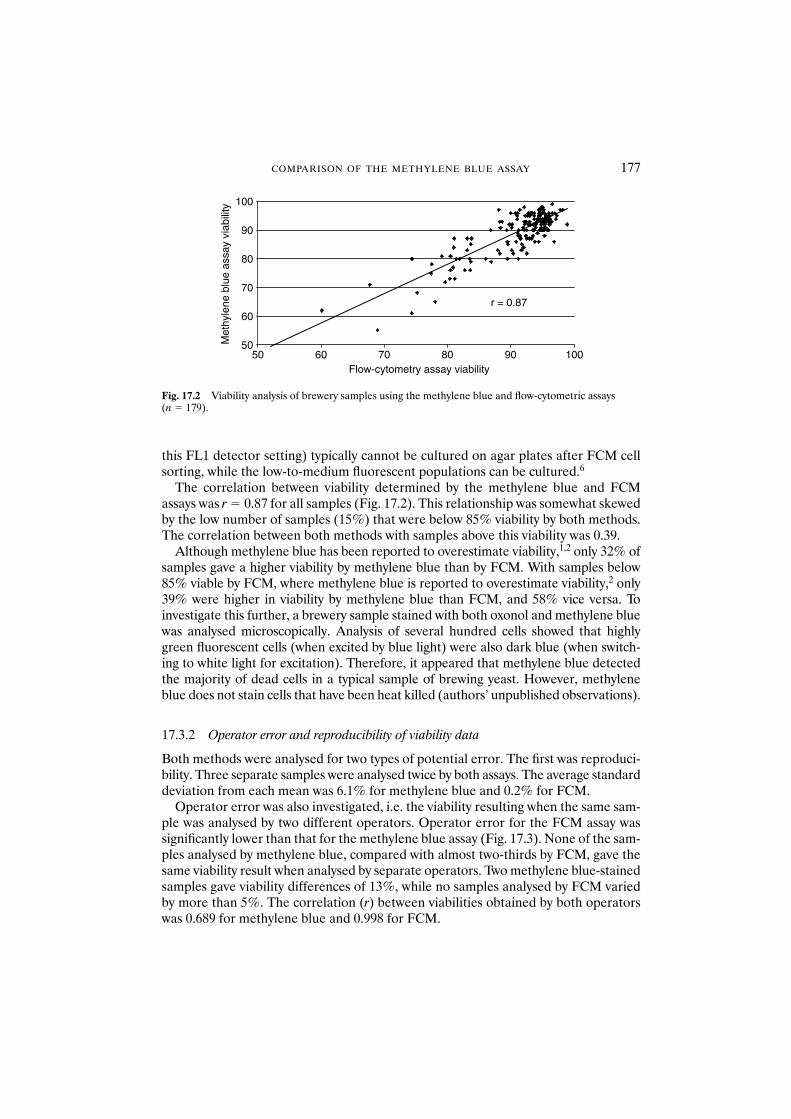
COMPARISON OF THE METHYLENE BLUE ASSAY 177
this FL1 detector setting) typically cannot be cultured on agar plates after FCM cellsorting, while the low-to-medium fluorescent populations can be cultured.6
The correlation between viability determined by the methylene blue and FCMassays was r � 0.87 for all samples (Fig. 17.2). This relationship was somewhat skewedby the low number of samples (15%) that were below 85% viability by both methods.The correlation between both methods with samples above this viability was 0.39.
Although methylene blue has been reported to overestimate viability,1,2 only 32% ofsamples gave a higher viability by methylene blue than by FCM. With samples below85% viable by FCM, where methylene blue is reported to overestimate viability,2 only39% were higher in viability by methylene blue than FCM, and 58% vice versa. Toinvestigate this further, a brewery sample stained with both oxonol and methylene bluewas analysed microscopically. Analysis of several hundred cells showed that highlygreen fluorescent cells (when excited by blue light) were also dark blue (when switch-ing to white light for excitation). Therefore, it appeared that methylene blue detectedthe majority of dead cells in a typical sample of brewing yeast. However, methyleneblue does not stain cells that have been heat killed (authors’ unpublished observations).
17.3.2 Operator error and reproducibility of viability data
Both methods were analysed for two types of potential error. The first was reproduci-bility. Three separate samples were analysed twice by both assays. The average standarddeviation from each mean was 6.1% for methylene blue and 0.2% for FCM.
Operator error was also investigated, i.e. the viability resulting when the same sam-ple was analysed by two different operators. Operator error for the FCM assay wassignificantly lower than that for the methylene blue assay (Fig. 17.3). None of the sam-ples analysed by methylene blue, compared with almost two-thirds by FCM, gave thesame viability result when analysed by separate operators. Two methylene blue-stainedsamples gave viability differences of 13%, while no samples analysed by FCM variedby more than 5%. The correlation (r) between viabilities obtained by both operatorswas 0.689 for methylene blue and 0.998 for FCM.
r = 0.87
50
60
70
80
90
100
50 60 70 80 90 100Flow-cytometry assay viability
Met
hyle
ne b
lue
assa
y vi
abili
ty
Fig. 17.2 Viability analysis of brewery samples using the methylene blue and flow-cytometric assays(n � 179).
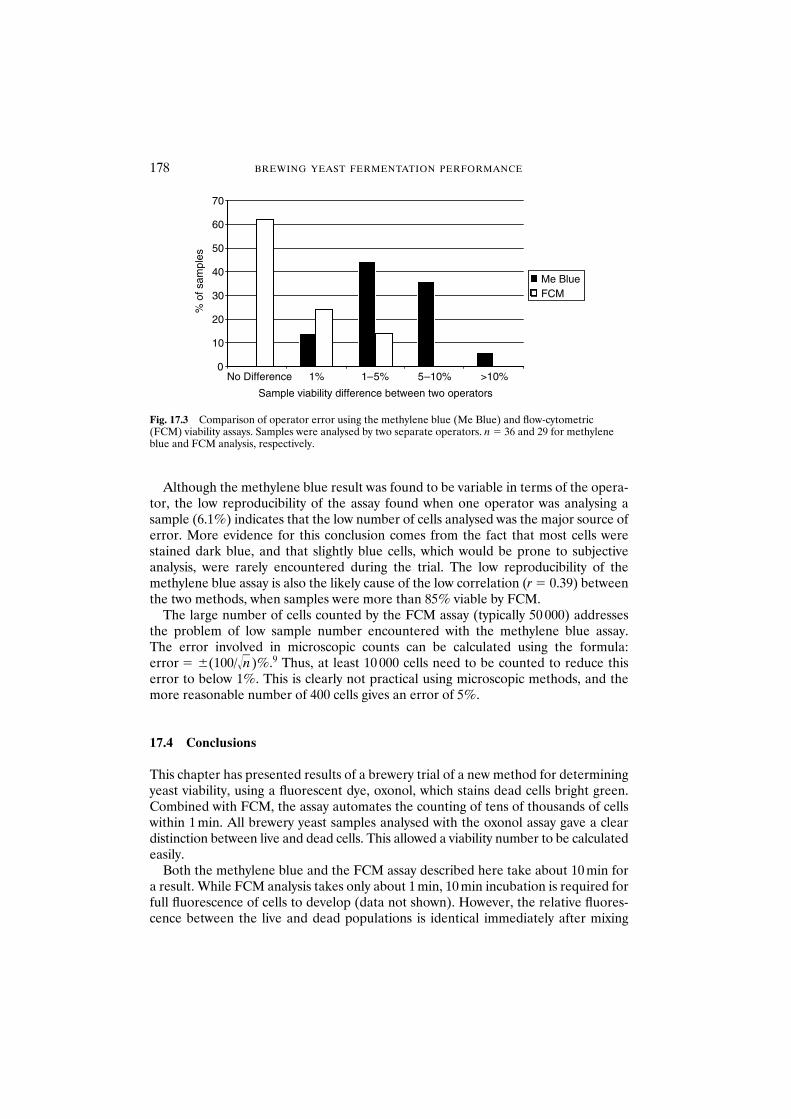
178 BREWING YEAST FERMENTATION PERFORMANCE
Although the methylene blue result was found to be variable in terms of the opera-tor, the low reproducibility of the assay found when one operator was analysing asample (6.1%) indicates that the low number of cells analysed was the major source oferror. More evidence for this conclusion comes from the fact that most cells werestained dark blue, and that slightly blue cells, which would be prone to subjectiveanalysis, were rarely encountered during the trial. The low reproducibility of themethylene blue assay is also the likely cause of the low correlation (r � 0.39) betweenthe two methods, when samples were more than 85% viable by FCM.
The large number of cells counted by the FCM assay (typically 50 000) addressesthe problem of low sample number encountered with the methylene blue assay. The error involved in microscopic counts can be calculated using the formula: error � �(100/��n)%.9 Thus, at least 10 000 cells need to be counted to reduce thiserror to below 1%. This is clearly not practical using microscopic methods, and themore reasonable number of 400 cells gives an error of 5%.
17.4 Conclusions
This chapter has presented results of a brewery trial of a new method for determiningyeast viability, using a fluorescent dye, oxonol, which stains dead cells bright green.Combined with FCM, the assay automates the counting of tens of thousands of cellswithin 1 min. All brewery yeast samples analysed with the oxonol assay gave a cleardistinction between live and dead cells. This allowed a viability number to be calculatedeasily.
Both the methylene blue and the FCM assay described here take about 10 min fora result. While FCM analysis takes only about 1 min, 10 min incubation is required forfull fluorescence of cells to develop (data not shown). However, the relative fluores-cence between the live and dead populations is identical immediately after mixing
0
10
20
30
40
50
60
70
No Difference
Sample viability difference between two operators
1%
% o
f sam
ples
1–5% 5–10% >10%
Me BlueFCM
Fig. 17.3 Comparison of operator error using the methylene blue (Me Blue) and flow-cytometric(FCM) viability assays. Samples were analysed by two separate operators. n � 36 and 29 for methyleneblue and FCM analysis, respectively.
COMPARISON OF THE METHYLENE BLUE ASSAY 179
cells and staining. Therefore, an experienced operator would potentially be able todetermine sample viability, using the FCM assay, with minimal incubation time.
Flow cytometers also have an important advantage in that they are not restricted toone particular assay. For example, the brewing industry is also interested in the devel-opment of a rapid assay for yeast fermentation performance, or vitality.10 As mostcytometers possess at least three fluorescence detectors,7 one could theoretically staina cell concurrently with a viability dye that fluoresces green and a vitality dye that fluoresces orange or red. Flow cytometers can also be used to detect contaminating
microorganisms in the brewing process.11 It is envisaged that flow cytometry will be usedincreasingly in breweries in the coming years as their many advantages are realised.
Acknowledgements
We thank BrewTech Pty Ltd, Melbourne, Australia, and the Australian ResearchCouncil, for funding assistance. We are also grateful for assistance provided by mem-bers of the microbiology team at Kent Brewery.
References
1. Jones, R.P. (1987) Measures of yeast death and deactivation and their meaning: Part II. Process Biochem.8, 118–128.
2. Pierce, J.S. (1970) Institute of brewing: analysis committee. Measurement of yeast viability. J. Inst. Brew.76, 442–443.
3. Willetts, J.C., Seward, R., Dinsdale, M.G. et al. (1997) Vitality of cider yeast grown micro-aerobicallywith added ethanol, butan-1-ol or iso-butanol. J. Inst. Brew. 103, 79–84.
4. Lloyd, D. and Hayes, A.J. (1995) Vigour, vitality and viability of microorganisms (Review). FEMSMicrobiol. Lett. 133, 1–7.
5. Lloyd, D., Moran, C.A., Suller, M.T.E. et al. (1996) Flow cytometric monitoring of rhodamine 123 anda cyanine dye uptake by yeast during cider fermentation. J. Inst. Brew. 102, 251–259.
6. Deere, D., Shen, J., Vesey, G. et al. (1998) Flow cytometry and cell sorting for yeast viability assessmentand cell selection. Yeast 14, 147–160.
7. Shapiro, H.M. (1988) A Practical Guide to Flow Cytometry. Alan R. Liss, New York.8. Boyd, A.R., Attfield, P., Vincent, S.F. and Veal, D.A. (2000) Evaluation of light scattering and auto-
fluorescent properties of brewer’s worts for flow cytometric analysis of yeast viability. J. Inst. Brew. 106,319–324.
9. Chang, W.L., Van der Heyde, H.C. and Klein, B.S. (1998) Flow cytometric quantitation of yeast a noveltechnique for use in animal model work and in vitro immunologic assays. J. Immunol. Methods 211,51–63.
10. Lentini, A. (1993) A review of the various methods for monitoring the physiological status of yeast:yeast viability and vitality. Fermentation 6, 321–327.
11. Jespersen, L., Lassen, S. and Jakobsen, M. (1993) Flow cytometric detection of wild yeast in lagerbreweries. Int. J. Food Microbiol. 17, 321–328.

Part 5 The Role of Brewing Yeast in Beer FlavourDevelopment
18 Formation and Disappearance of Diacetyl DuringLager Fermentation
C. BOULTON and W. BOX
Abstract The results are presented of a survey of patterns of vicinal diketone (VDK) formation and disappearance in production- and pilot plant-scale lager fermentations. Theinfluence of major fermentation variables is discussed. Evidence is presented that bothwort composition and yeast physiological condition are important parameters. Results aregiven which confirm that during most of fermentation the concentration of free diacetyl ismuch lower than that of �-acetolactate. This supports the contention that spontaneousdecarboxylation of the latter is rate determining, at least, during most of fermentation.
In laboratory studies, it has been demonstrated that brewing yeast is capable of rapidreduction of exogenous diacetyl, but this ability decreases during the course of fermenta-tion. Furthermore, reduction proceeds slowly at low initial concentrations of diacetyl. Ithas been proposed that the deceleration in the rate of decline of total VDK concentration,commonly observed at the end of fermentation, may be due to sedimentation of yeast.Thus, few cells are available in the body of the beer for diacetyl reduction. The evidencepresented here contradicts this supposition and suggests that the decrease in rate may bea function of the physiological state of yeast at the end of fermentation. It is proposed thatin the latter stages of fermentation, the uptake and/or reduction of free diacetyl by yeastmay be rate determining. This suggests that the physiological condition of yeast at the end offermentation and the conditions pertaining do not promote the efficient removal of diacetyl.This is supportive of those strategies for diacetyl removal that are performed on greenbeer removed from the fermenter immediately after the achievement of racking gravity.
18.1 Introduction
The vicinal diketone (VDK) diacetyl (2,3-butanedione) has a strong aroma and tasteof butterscotch or toffee. In lager beers it has a flavour threshold of approximately0.05 ppm and its presence is considered undesirable. It is generally accepted that it is produced as a result of yeast metabolism during fermentation.1 It derives frompyruvate via the intermediary of �-acetolactate, a precursor of valine biosynthesis. �-Acetolactate is excreted into wort, where it spontaneously oxidatively decarboxylatesto form diacetyl. During the warm phase of conditioning, the latter is assimilated by yeast and reduced to less flavour-active metabolites, acetoin and 2,3-butanediol. It is considered that the spontaneous decarboxylation of �-acetolactate is the rate-determining step in the pathway. For many lager fermentations, total vessel residencetime is governed by the time taken for the diacetyl concentration (measured as the sumof �-acetolactate and diacetyl, or total VDK) to achieve a minimum specified value.Only then can the beer be chilled, the yeast cropped and the vessel racked.
Current regimens of fermentation control aim to produce consistent and minimalvessel residence times. Control is exerted by rigorous regulation of the conditions at thestart of fermentation. The tacit assumption of this approach is that wort composition
Brewing Yeast Fermentation Performance: Second edition
Edited by: KATHERINE SMART Copyright 0 Blackwell Science 2003
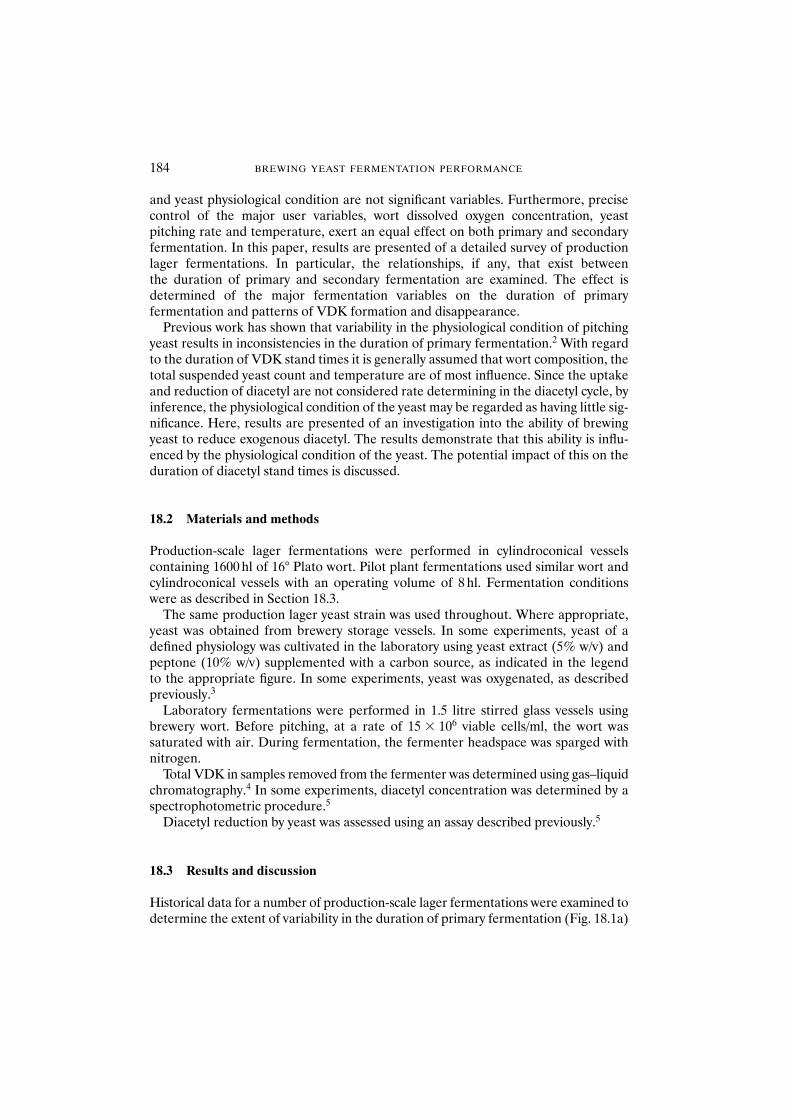
and yeast physiological condition are not significant variables. Furthermore, precisecontrol of the major user variables, wort dissolved oxygen concentration, yeast pitching rate and temperature, exert an equal effect on both primary and secondaryfermentation. In this paper, results are presented of a detailed survey of productionlager fermentations. In particular, the relationships, if any, that exist between the duration of primary and secondary fermentation are examined. The effect isdetermined of the major fermentation variables on the duration of primaryfermentation and patterns of VDK formation and disappearance.
Previous work has shown that variability in the physiological condition of pitchingyeast results in inconsistencies in the duration of primary fermentation.2 With regardto the duration of VDK stand times it is generally assumed that wort composition, thetotal suspended yeast count and temperature are of most influence. Since the uptakeand reduction of diacetyl are not considered rate determining in the diacetyl cycle, byinference, the physiological condition of the yeast may be regarded as having little sig-nificance. Here, results are presented of an investigation into the ability of brewingyeast to reduce exogenous diacetyl. The results demonstrate that this ability is influ-enced by the physiological condition of the yeast. The potential impact of this on theduration of diacetyl stand times is discussed.
18.2 Materials and methods
Production-scale lager fermentations were performed in cylindroconical vesselscontaining 1600 hl of 16° Plato wort. Pilot plant fermentations used similar wort andcylindroconical vessels with an operating volume of 8 hl. Fermentation conditionswere as described in Section 18.3.
The same production lager yeast strain was used throughout. Where appropriate,yeast was obtained from brewery storage vessels. In some experiments, yeast of adefined physiology was cultivated in the laboratory using yeast extract (5% w/v) andpeptone (10% w/v) supplemented with a carbon source, as indicated in the legend to the appropriate figure. In some experiments, yeast was oxygenated, as describedpreviously.3
Laboratory fermentations were performed in 1.5 litre stirred glass vessels usingbrewery wort. Before pitching, at a rate of 15 � 106 viable cells/ml, the wort was saturated with air. During fermentation, the fermenter headspace was sparged withnitrogen.
Total VDK in samples removed from the fermenter was determined using gas–liquidchromatography.4 In some experiments, diacetyl concentration was determined by aspectrophotometric procedure.5
Diacetyl reduction by yeast was assessed using an assay described previously.5
18.3 Results and discussion
Historical data for a number of production-scale lager fermentations were examined todetermine the extent of variability in the duration of primary fermentation (Fig. 18.1a)
184 BREWING YEAST FERMENTATION PERFORMANCE
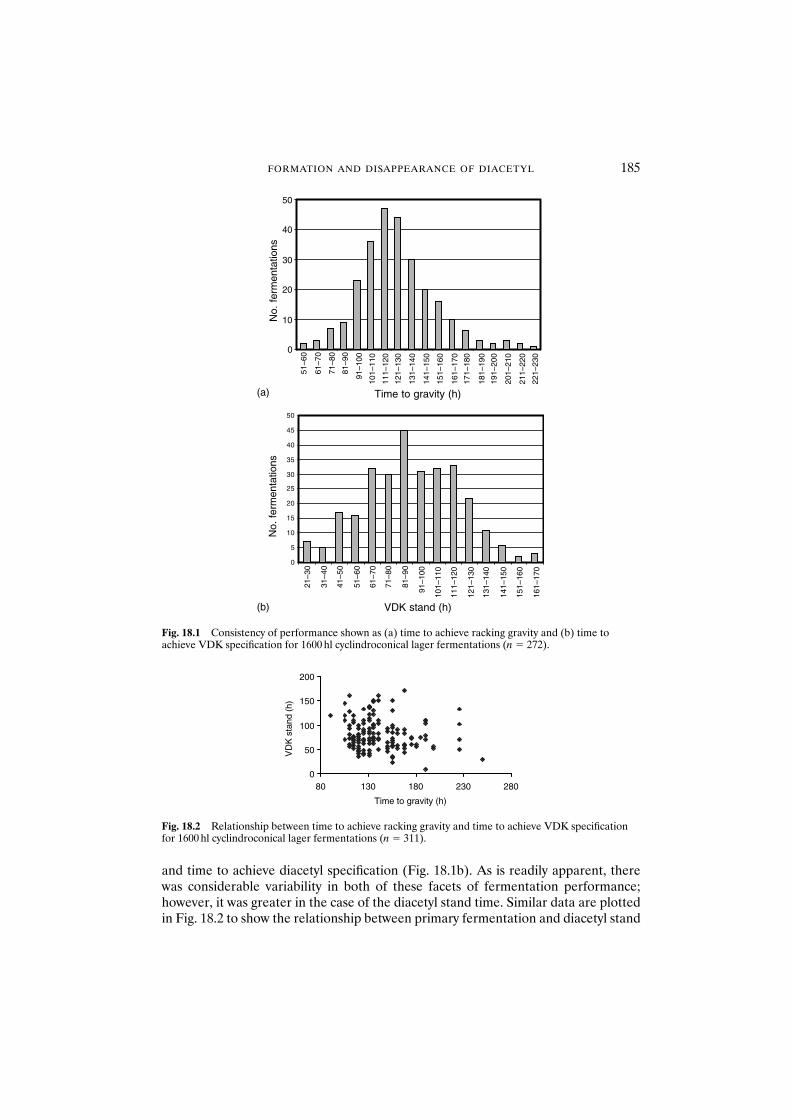
and time to achieve diacetyl specification (Fig. 18.1b). As is readily apparent, therewas considerable variability in both of these facets of fermentation performance;however, it was greater in the case of the diacetyl stand time. Similar data are plottedin Fig. 18.2 to show the relationship between primary fermentation and diacetyl stand
FORMATION AND DISAPPEARANCE OF DIACETYL 185
0
10
51–6
021
–30
41–5
0
51–6
0
71–8
0
71–8
0
61–7
031
–40
61–7
0
81–9
0
81–9
0
91–1
00
91–1
00
101–
110
101–
110
111–
120
111–
120
121–
130
121–
130
131–
140
131–
140
141–
150
141–
150
151–
160
151–
160
161–
170
161–
170
171–
180
181–
190
191–
200
201–
210
211–
220
221–
230
20
30
40
50
Time to gravity (h)
No.
fer
men
tatio
ns
0
5
10
15
20
25
30
35
40
45
50
VDK stand (h)
No.
fer
men
tatio
ns
(a)
(b)
Fig. 18.1 Consistency of performance shown as (a) time to achieve racking gravity and (b) time toachieve VDK specification for 1600 hl cyclindroconical lager fermentations (n � 272).
0
50
100
150
200
80 130 180 230 280
Time to gravity (h)
VD
K s
tand
(h)
Fig. 18.2 Relationship between time to achieve racking gravity and time to achieve VDK specificationfor 1600 hl cyclindroconical lager fermentations (n � 311).
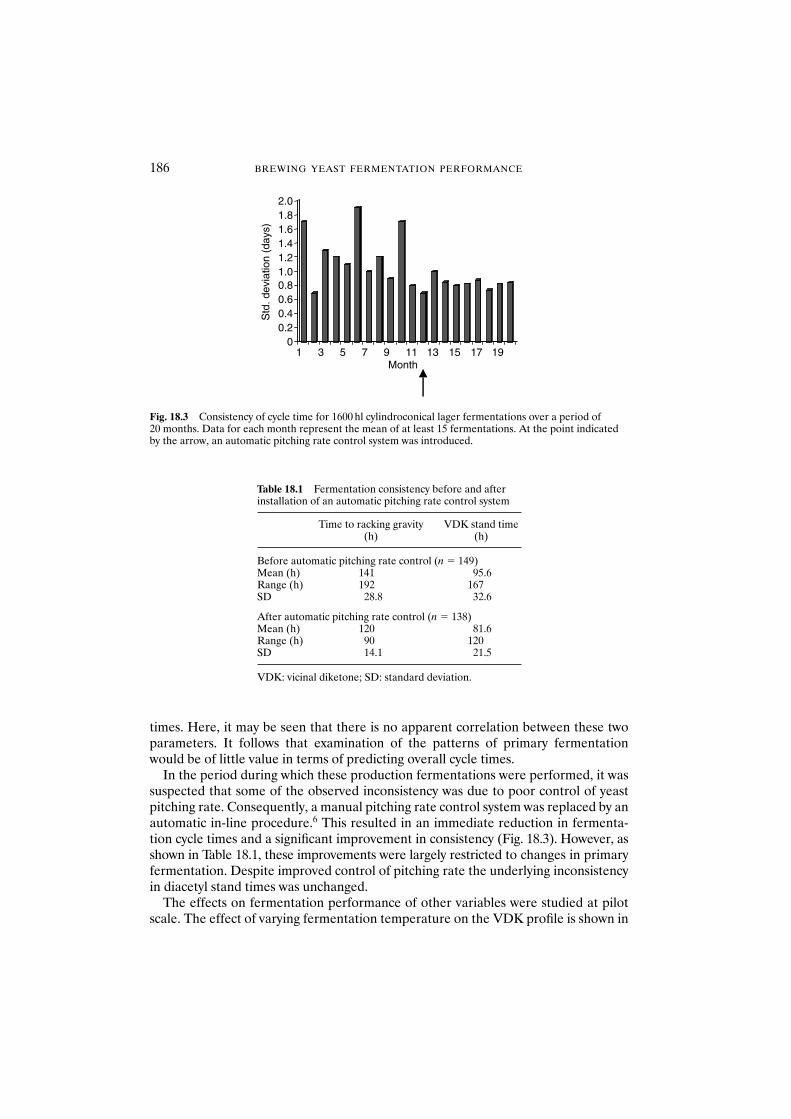
times. Here, it may be seen that there is no apparent correlation between these twoparameters. It follows that examination of the patterns of primary fermentationwould be of little value in terms of predicting overall cycle times.
In the period during which these production fermentations were performed, it wassuspected that some of the observed inconsistency was due to poor control of yeastpitching rate. Consequently, a manual pitching rate control system was replaced by anautomatic in-line procedure.6 This resulted in an immediate reduction in fermenta-tion cycle times and a significant improvement in consistency (Fig. 18.3). However, asshown in Table 18.1, these improvements were largely restricted to changes in primaryfermentation. Despite improved control of pitching rate the underlying inconsistencyin diacetyl stand times was unchanged.
The effects on fermentation performance of other variables were studied at pilotscale. The effect of varying fermentation temperature on the VDK profile is shown in
186 BREWING YEAST FERMENTATION PERFORMANCE
00.20.40.60.81.01.21.41.61.82.0
Std
. dev
iatio
n (d
ays)
1 3 5 7 9 11 13 15 17 19Month
Fig. 18.3 Consistency of cycle time for 1600 hl cylindroconical lager fermentations over a period of 20 months. Data for each month represent the mean of at least 15 fermentations. At the point indicatedby the arrow, an automatic pitching rate control system was introduced.
Table 18.1 Fermentation consistency before and afterinstallation of an automatic pitching rate control system
Time to racking gravity VDK stand time(h) (h)
Before automatic pitching rate control (n � 149)Mean (h) 141 95.6Range (h) 192 167SD 28.8 32.6
After automatic pitching rate control (n � 138)Mean (h) 120 81.6Range (h) 90 120SD 14.1 21.5
VDK: vicinal diketone; SD: standard deviation.
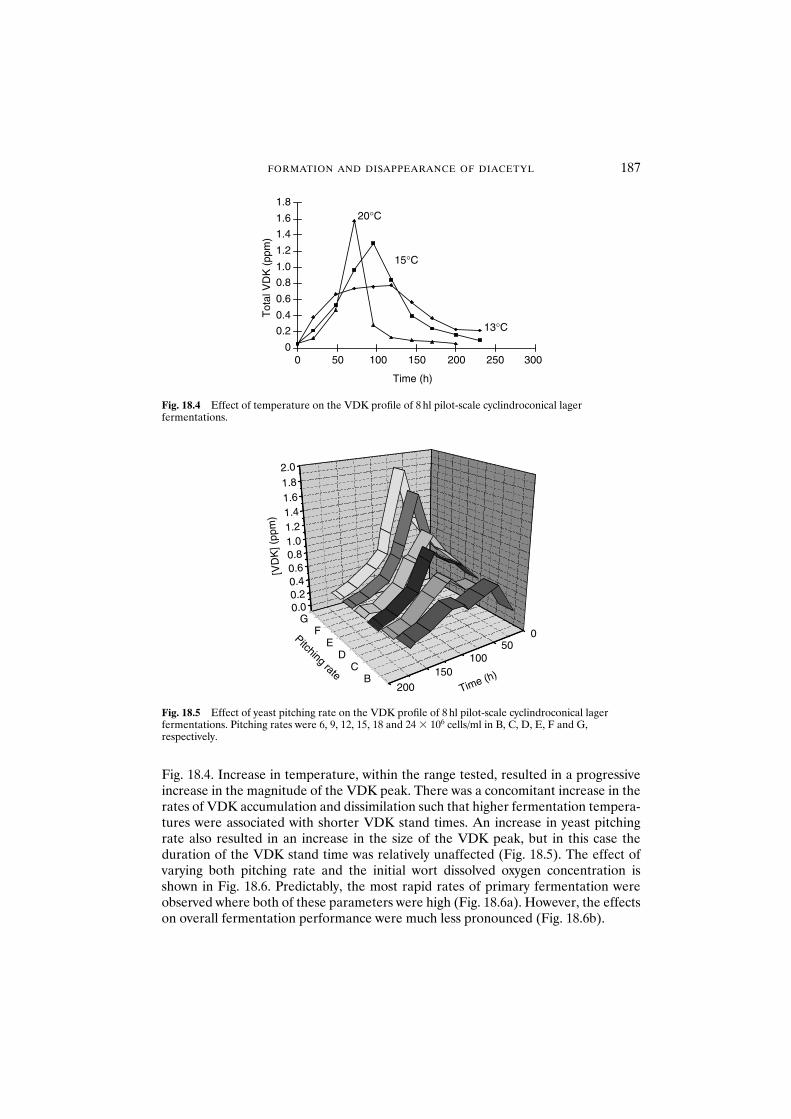
Fig. 18.4. Increase in temperature, within the range tested, resulted in a progressiveincrease in the magnitude of the VDK peak. There was a concomitant increase in therates of VDK accumulation and dissimilation such that higher fermentation tempera-tures were associated with shorter VDK stand times. An increase in yeast pitchingrate also resulted in an increase in the size of the VDK peak, but in this case theduration of the VDK stand time was relatively unaffected (Fig. 18.5). The effect ofvarying both pitching rate and the initial wort dissolved oxygen concentration isshown in Fig. 18.6. Predictably, the most rapid rates of primary fermentation wereobserved where both of these parameters were high (Fig. 18.6a). However, the effectson overall fermentation performance were much less pronounced (Fig. 18.6b).
FORMATION AND DISAPPEARANCE OF DIACETYL 187
0
0.2
0.4
0.6
0.8
1.0
1.2
1.4
1.6
1.8
0 50 100 150 200 250 300
Time (h)
Tot
al V
DK
(pp
m)
13°C
15°C
20°C
Fig. 18.4 Effect of temperature on the VDK profile of 8 hl pilot-scale cyclindroconical lagerfermentations.
050
100150
200
0.00.20.40.60.81.01.21.41.61.82.0
BC
DE
FG
Pitching rate
[VD
K] (
ppm
)
Time (h)
Fig. 18.5 Effect of yeast pitching rate on the VDK profile of 8 hl pilot-scale cyclindroconical lagerfermentations. Pitching rates were 6, 9, 12, 15, 18 and 24 � 106 cells/ml in B, C, D, E, F and G,respectively.
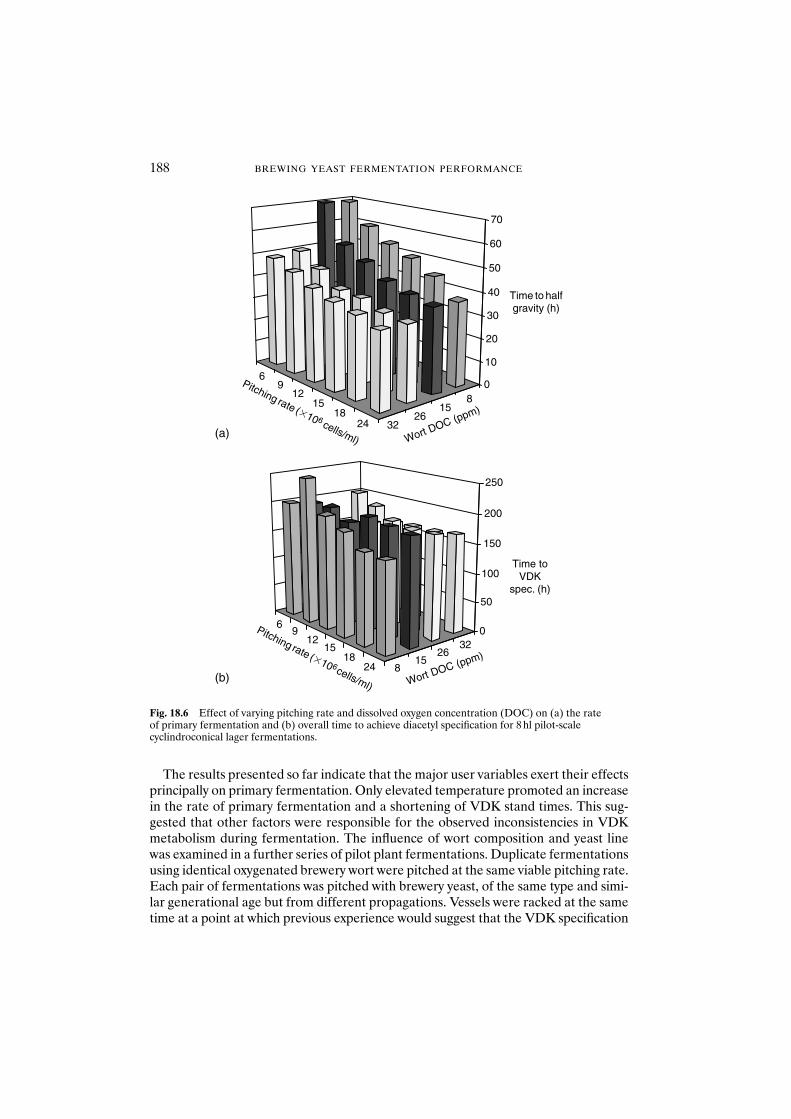
The results presented so far indicate that the major user variables exert their effectsprincipally on primary fermentation. Only elevated temperature promoted an increasein the rate of primary fermentation and a shortening of VDK stand times. This sug-gested that other factors were responsible for the observed inconsistencies in VDKmetabolism during fermentation. The influence of wort composition and yeast linewas examined in a further series of pilot plant fermentations. Duplicate fermentationsusing identical oxygenated brewery wort were pitched at the same viable pitching rate.Each pair of fermentations was pitched with brewery yeast, of the same type and simi-lar generational age but from different propagations. Vessels were racked at the sametime at a point at which previous experience would suggest that the VDK specification
188 BREWING YEAST FERMENTATION PERFORMANCE
69
1215
1824 8
1526
320
50
100
150
200
250
Time toVDK
spec. (h)
2418
1512
96
815
2632
0
10
20
30
40
50
60
70
Time to halfgravity (h)
Pitching rate (�106 cells/ml) Wort DOC (ppm)
Pitching rate (�106 cells/ml) Wort DOC (ppm)
(a)
(b)
Fig. 18.6 Effect of varying pitching rate and dissolved oxygen concentration (DOC) on (a) the rate of primary fermentation and (b) overall time to achieve diacetyl specification for 8 hl pilot-scale cyclindroconical lager fermentations.
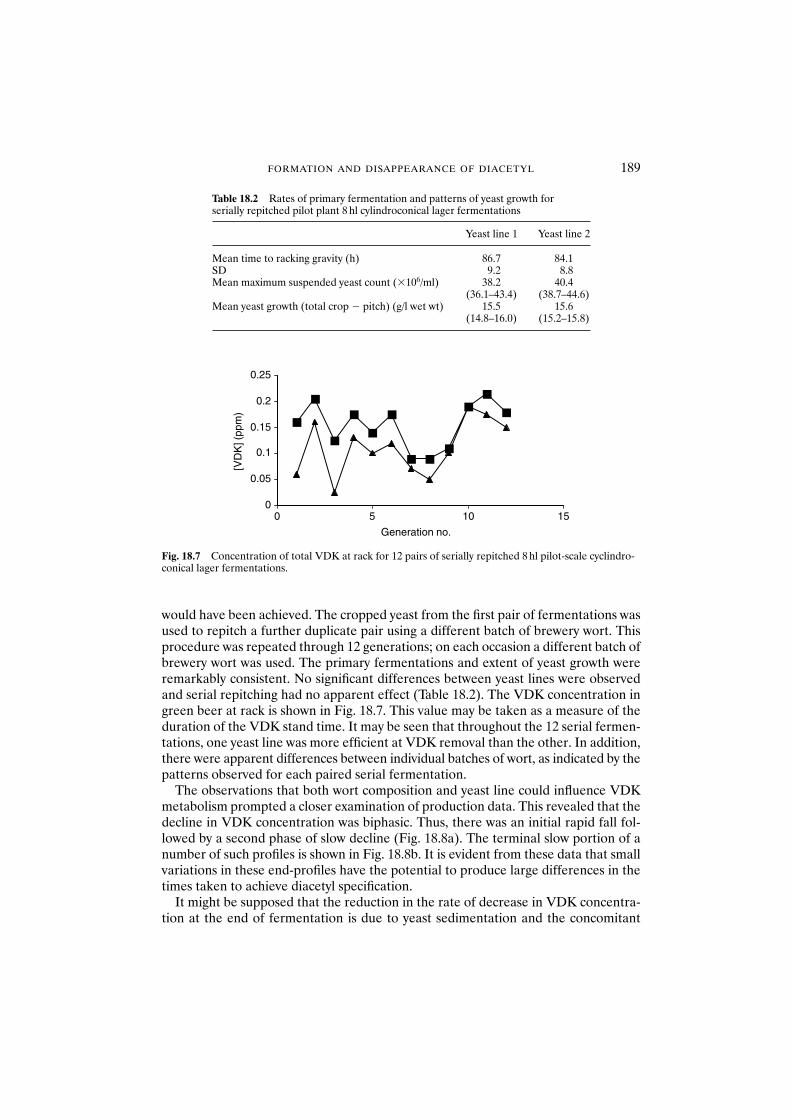
would have been achieved. The cropped yeast from the first pair of fermentations wasused to repitch a further duplicate pair using a different batch of brewery wort. Thisprocedure was repeated through 12 generations; on each occasion a different batch ofbrewery wort was used. The primary fermentations and extent of yeast growth wereremarkably consistent. No significant differences between yeast lines were observedand serial repitching had no apparent effect (Table 18.2). The VDK concentration ingreen beer at rack is shown in Fig. 18.7. This value may be taken as a measure of theduration of the VDK stand time. It may be seen that throughout the 12 serial fermen-tations, one yeast line was more efficient at VDK removal than the other. In addition,there were apparent differences between individual batches of wort, as indicated by thepatterns observed for each paired serial fermentation.
The observations that both wort composition and yeast line could influence VDKmetabolism prompted a closer examination of production data. This revealed that thedecline in VDK concentration was biphasic. Thus, there was an initial rapid fall fol-lowed by a second phase of slow decline (Fig. 18.8a). The terminal slow portion of anumber of such profiles is shown in Fig. 18.8b. It is evident from these data that smallvariations in these end-profiles have the potential to produce large differences in thetimes taken to achieve diacetyl specification.
It might be supposed that the reduction in the rate of decrease in VDK concentra-tion at the end of fermentation is due to yeast sedimentation and the concomitant
FORMATION AND DISAPPEARANCE OF DIACETYL 189
Table 18.2 Rates of primary fermentation and patterns of yeast growth for serially repitched pilot plant 8 hl cylindroconical lager fermentations
Yeast line 1 Yeast line 2
Mean time to racking gravity (h) 86.7 84.1SD 9.2 8.8Mean maximum suspended yeast count (�106/ml) 38.2 40.4
(36.1–43.4) (38.7–44.6)Mean yeast growth (total crop � pitch) (g/l wet wt) 15.5 15.6
(14.8–16.0) (15.2–15.8)
0
0.05
0.1
0.15
0.2
0.25
0 5 10 15
Generation no.
[VD
K] (
ppm
)
Fig. 18.7 Concentration of total VDK at rack for 12 pairs of serially repitched 8 hl pilot-scale cyclindro-conical lager fermentations.
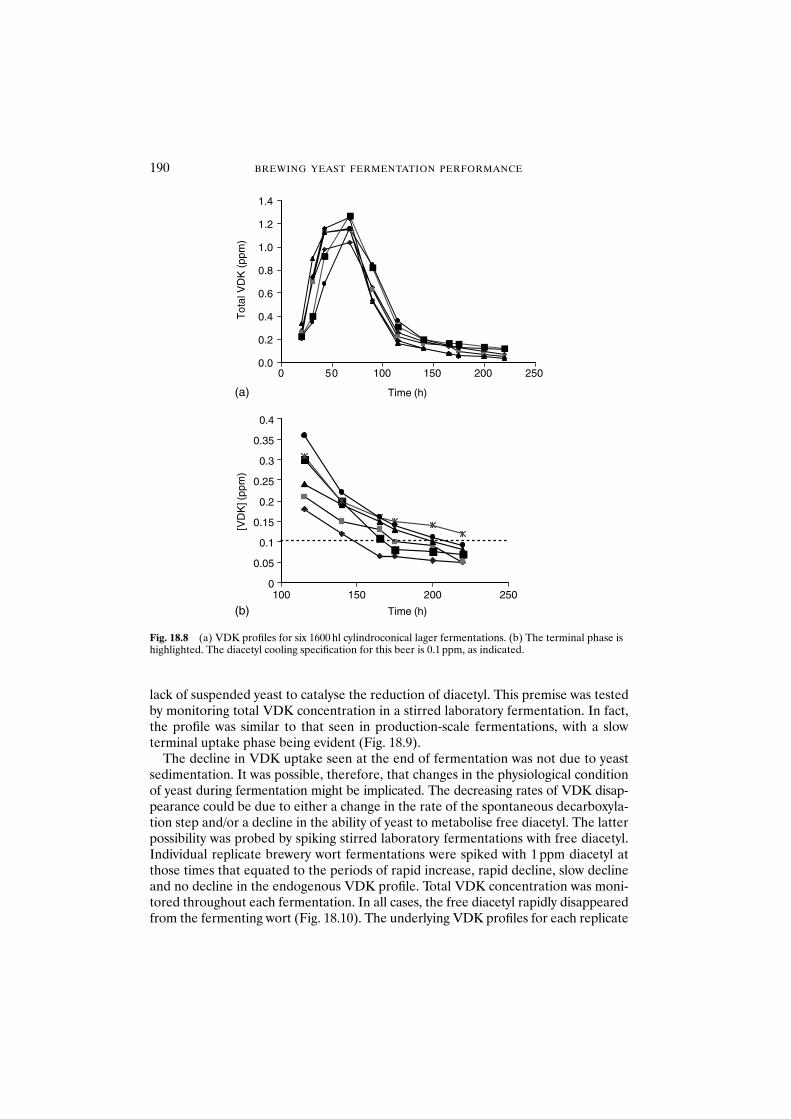
lack of suspended yeast to catalyse the reduction of diacetyl. This premise was testedby monitoring total VDK concentration in a stirred laboratory fermentation. In fact,the profile was similar to that seen in production-scale fermentations, with a slowterminal uptake phase being evident (Fig. 18.9).
The decline in VDK uptake seen at the end of fermentation was not due to yeastsedimentation. It was possible, therefore, that changes in the physiological conditionof yeast during fermentation might be implicated. The decreasing rates of VDK disap-pearance could be due to either a change in the rate of the spontaneous decarboxyla-tion step and/or a decline in the ability of yeast to metabolise free diacetyl. The latterpossibility was probed by spiking stirred laboratory fermentations with free diacetyl.Individual replicate brewery wort fermentations were spiked with 1 ppm diacetyl atthose times that equated to the periods of rapid increase, rapid decline, slow declineand no decline in the endogenous VDK profile. Total VDK concentration was moni-tored throughout each fermentation. In all cases, the free diacetyl rapidly disappearedfrom the fermenting wort (Fig. 18.10). The underlying VDK profiles for each replicate
190 BREWING YEAST FERMENTATION PERFORMANCE
0.0
0.2
0.4
0.6
0.8
1.0
1.2
1.4
0
(a)
(b)
50 100 150 200 250
Time (h)
Time (h)
Tot
al V
DK
(pp
m)
0
0.05
0.1
0.15
0.2
0.25
0.3
0.35
0.4
100 150 200 250
[VD
K] (
ppm
)
Fig. 18.8 (a) VDK profiles for six 1600 hl cylindroconical lager fermentations. (b) The terminal phase ishighlighted. The diacetyl cooling specification for this beer is 0.1 ppm, as indicated.
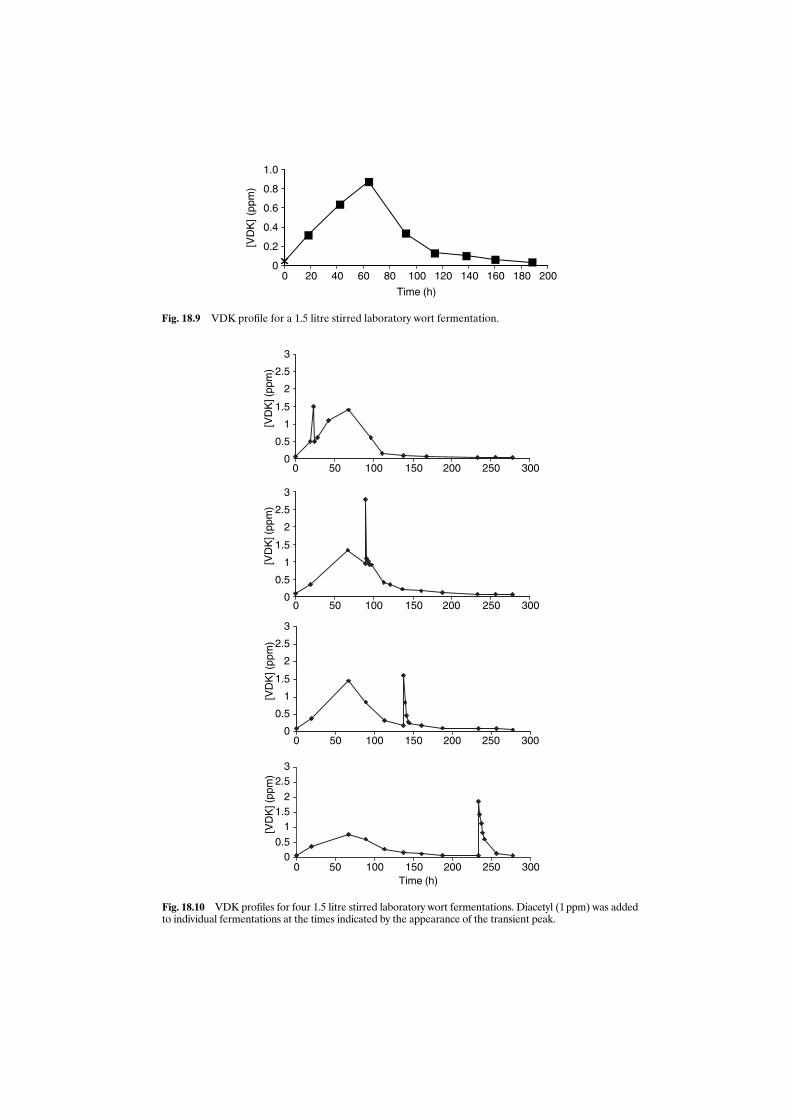
0
0.2
0.4
0.6
0.8
1.0
0 20 40 60 80 100 120 140 160 180 200
[VD
K]
(ppm
)
Time (h)
Fig. 18.9 VDK profile for a 1.5 litre stirred laboratory wort fermentation.
0
0.5
1
1.5
2
2.5
3
0 50 100 150 200 250 300
[VD
K] (
ppm
)
0
0.5
1
1.5
2
2.5
3
0 50 100 150 200 250 300
[VD
K] (
ppm
)
0
0.5
1
1.5
2
2.5
3
0 50 100 150 200 250
250
300
[VD
K] (
ppm
)
00.5
11.5
2
2.53
0 50 100 150 200 300Time (h)
[VD
K] (
ppm
)
Fig. 18.10 VDK profiles for four 1.5 litre stirred laboratory wort fermentations. Diacetyl (1 ppm) was addedto individual fermentations at the times indicated by the appearance of the transient peak.
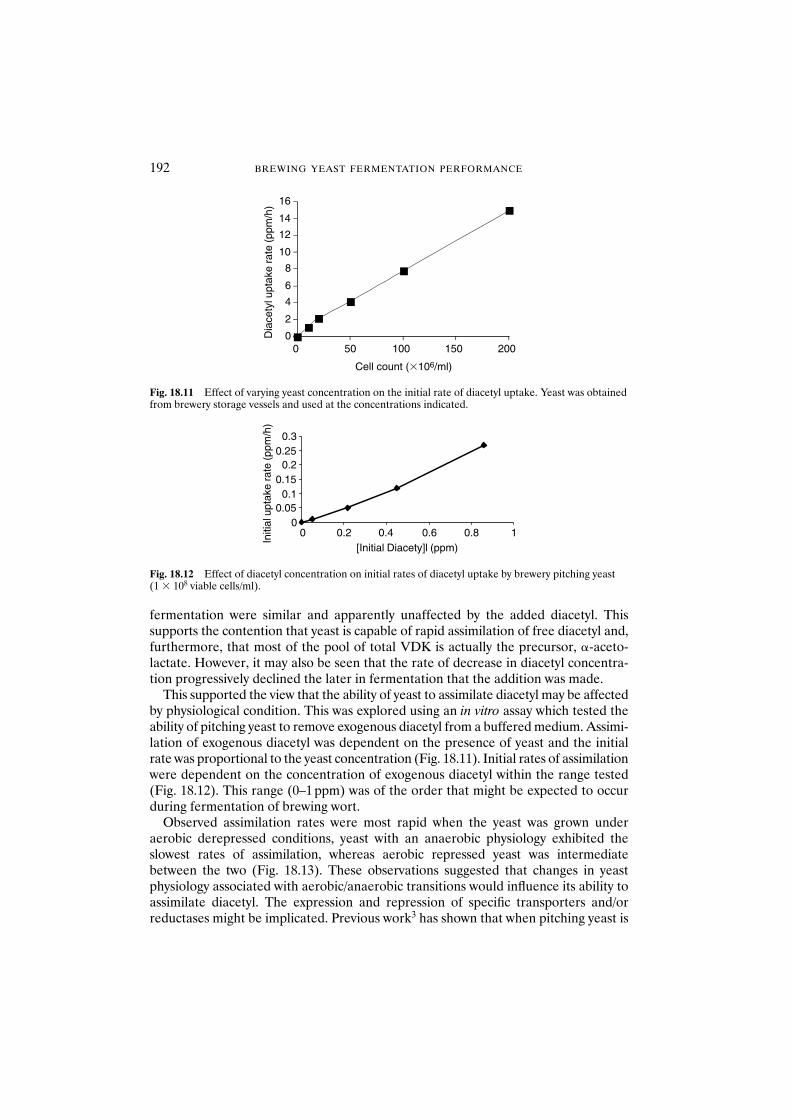
fermentation were similar and apparently unaffected by the added diacetyl. Thissupports the contention that yeast is capable of rapid assimilation of free diacetyl and,furthermore, that most of the pool of total VDK is actually the precursor, �-aceto-lactate. However, it may also be seen that the rate of decrease in diacetyl concentra-tion progressively declined the later in fermentation that the addition was made.
This supported the view that the ability of yeast to assimilate diacetyl may be affectedby physiological condition. This was explored using an in vitro assay which tested theability of pitching yeast to remove exogenous diacetyl from a buffered medium. Assimi-lation of exogenous diacetyl was dependent on the presence of yeast and the initialrate was proportional to the yeast concentration (Fig. 18.11). Initial rates of assimilationwere dependent on the concentration of exogenous diacetyl within the range tested(Fig. 18.12). This range (0–1 ppm) was of the order that might be expected to occurduring fermentation of brewing wort.
Observed assimilation rates were most rapid when the yeast was grown underaerobic derepressed conditions, yeast with an anaerobic physiology exhibited theslowest rates of assimilation, whereas aerobic repressed yeast was intermediatebetween the two (Fig. 18.13). These observations suggested that changes in yeastphysiology associated with aerobic/anaerobic transitions would influence its ability toassimilate diacetyl. The expression and repression of specific transporters and/orreductases might be implicated. Previous work3 has shown that when pitching yeast is
192 BREWING YEAST FERMENTATION PERFORMANCE
0
2
4
6
8
10
12
14
16
0 50 100 150 200
Cell count (�106/ml)
Dia
cety
l upt
ake
rate
(ppm
/h)
Fig. 18.11 Effect of varying yeast concentration on the initial rate of diacetyl uptake. Yeast was obtainedfrom brewery storage vessels and used at the concentrations indicated.
00.05
0.10.15
0.20.25
0.3
0 0.2 0.4 0.6 0.8 1[Initial Diacety]l (ppm)
Initi
al u
ptak
e ra
te (p
pm/h
)
Fig. 18.12 Effect of diacetyl concentration on initial rates of diacetyl uptake by brewery pitching yeast(1 � 108 viable cells/ml).
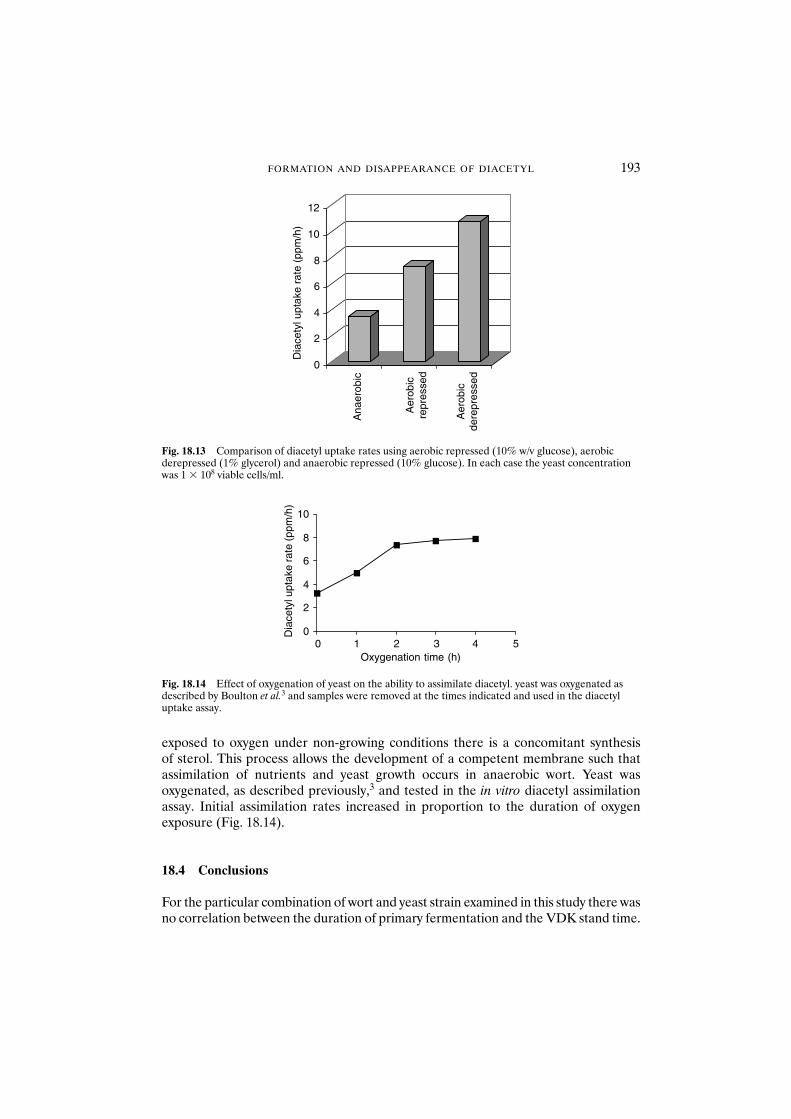
exposed to oxygen under non-growing conditions there is a concomitant synthesis of sterol. This process allows the development of a competent membrane such thatassimilation of nutrients and yeast growth occurs in anaerobic wort. Yeast wasoxygenated, as described previously,3 and tested in the in vitro diacetyl assimilationassay. Initial assimilation rates increased in proportion to the duration of oxygenexposure (Fig. 18.14).
18.4 Conclusions
For the particular combination of wort and yeast strain examined in this study there wasno correlation between the duration of primary fermentation and the VDK stand time.
FORMATION AND DISAPPEARANCE OF DIACETYL 193
0
2
4
6
8
10
12
Dia
cety
l upt
ake
rate
(pp
m/h
)
Ana
erob
ic
Aer
obic
repr
esse
d
Aer
obic
dere
pres
sed
Fig. 18.13 Comparison of diacetyl uptake rates using aerobic repressed (10% w/v glucose), aerobic derepressed (1% glycerol) and anaerobic repressed (10% glucose). In each case the yeast concentrationwas 1 � 108 viable cells/ml.
00 1 2 3 4 5
2
4
6
8
10
Oxygenation time (h)
Dia
cety
l upt
ake
rate
(pp
m/h
)
Fig. 18.14 Effect of oxygenation of yeast on the ability to assimilate diacetyl. yeast was oxygenated asdescribed by Boulton et al.3 and samples were removed at the times indicated and used in the diacetyluptake assay.
With the exception of temperature, fermentation control parameters such as pitchingrate and wort dissolved oxygen exert their effects on primary fermentation. The durationof the VDK stand appears to be influenced by temperature and wort composition. Inaddition, some yeast lines (derived from a particular propagation) appear to have an inherently greater ability than others to produce fermentations with shorter VDKstand times. A rapid and simple in vitro test is described which would allow this abil-ity to be screened.
Much of the variability in the length of VDK stand times is associated with incon-sistencies during a slow terminal phase of VDK assimilation. Using laboratory stirredfermentations it was shown that the deceleration in VDK assimilation was not due toyeast sedimentation. For this yeast and wort combination, the characteristic pattern ofVDK formation and disappearance appears to be of physiological significance. Furtherweight was added to this assertion by the observation that the rate of disappearanceof free diacetyl added to a laboratory wort fermentation also declined throughout fermentation.
Using the in vitro assay, it was shown that this particular pitching yeast had a poorintrinsic ability to assimilate free diacetyl, especially at the low concentrations thatwould be expected to occur in a wort fermentation. Manipulation of yeast physiologyto promote membrane competence, either by growing under aerobic conditions or byexposure to oxygen under conditions of non-growth, stimulated the assimilation ofexogenous diacetyl.
These results suggest that the low rates of VDK removal associated with the latter stages of fermentation may be a reflection of the reduced ability of the yeast toassimilate free diacetyl. The correlation with membrane competence suggests that atransport phenomenon could be implicated, although induction and repression ofdiacetyl reductases cannot be ruled out. Thus, in late fermentation it may be thatdiacetyl assimilation by yeast is the rate-determining step in the VDK cycle. Yeastsedimentation, especially of flocculent strains, in tall cyclindroconical vessels wouldprobably exacerbate the effect.
Manipulation of fermentation conditions to ensure that yeast growth was not limitedby sterol depletion might be beneficial in delaying the onset of the slow phase of VDKdecline, but this could have counterproductive implications in terms of fermentationefficiency. Alternatively, the evidence presented here suggests that the fermentingvessel is a most unsuitable environment for the removal of VDK and the explorationof alternative strategies is a worthwhile goal.
Acknowledgements
The authors thank the Directors of Bass Brewers Ltd for permission to publish thispaper.
References
1. Wainwright, T. (1973) Diacetyl – a review. J. Inst. Brew. 79, 451–470.2. Boulton, C.A. and Quain, D.E. (1987) Yeast, oxygen and the control of brewery fermentation. Proc. 21st
Cong. Eur. Brew. Conv., Madrid, pp. 401–408.
194 BREWING YEAST FERMENTATION PERFORMANCE

3. Boulton, C.A., Jones, A.R. and Hinchliffe, E. (1991) Yeast physiological condition and fermentationperformance. Proc. 23rd Cong. Eur. Brew. Conv., Lisbon, pp. 385–392.
4. European Brewery Convention (1987) Diacetyl and other vicinal diketones in beer. In: Analytica, 4th ed.Brauerei und Getranke-Rundschau, Zürich, 9.11, E187–E190.
5. Boulton, C.A., Box, W.G., Quain, D.E. and Molzahn, S.W. (1999) Vicinal diketone reduction as a measure of yeast vitality. Proc. 27th Cong. Eur. Brew. Conv., Cannes, pp. 687–694.
FORMATION AND DISAPPEARANCE OF DIACETYL 195
19 The Formation of Higher Alcohols
J.R. DICKINSON
Abstract In addition to ethanol, yeast produces long-chain and complex alcohols. Theseare important flavour and aroma compounds in all yeast-fermented products and haveinteresting organoleptic properties in their own right, many of which are both concentrationand context dependent. Esters derived from these alcohols are also important compoundsgiving ‘fruity’ flavours and aromas. The genes and enzymes involved in the formation oflong-chain and complex alcohols in yeast have been sought. In all cases, the generalsequence of biochemical reactions is similar, but for the formation of the individual alco-hols there is a complex profile of both specificity and overlapping gene functions in thefive-membered family of decarboxylases encoded by PDC1, PDC5, PDC6, YDL080C andYDR380W. In the leucine degradation pathway the major decarboxylase is encoded byYDL080c and the YDR380w gene product accounts for less than 6% of the degradation.Consequently, YDL080c is referred to as KID1, for keto isocaproate decarboxylase 1. Invaline degradation any one of the three isoenzymes of pyruvate decarboxylase encoded byPDC1, PDC5 and PDC6 will decarboxylate �-ketoisovalerate. In isoleucine catabolism anyone of the five possible decarboxylases encoded by PDC1, PDC5, PDC6, YDL080c orYDR380w is sufficient for the catabolism of isoleucine to ‘active’ amyl alcohol. For phenyl-alanine and tryptophan breakdown a pdc1, pdc5, pdc6, ydr380w quadruple mutant makeszero 2-phenylethanol and tryptophol, respectively. In other words, YDL080c (KID1) isirrelevant: it is not needed in these two pathways. The roles were also examined of thealcohol dehydrogenases encoded by ADH1, ADH2, ADH3, ADH4, ADH5, SFA1, AAD3,AAD4, AAD6, AAD10, AAD14, AAD15 and AAD16 in the final stage of higher alcohol for-mation in both laboratory and brewing strains. Any one of the first six of these alcoholdehydrogenases will do the job as long as it is operating under the physiological conditionsin use.
19.1 Introduction
It is common knowledge that yeast converts sugars to ethanol using the glycolyticpathway. In addition, it produces a number of long-chain and complex alcohols suchas isoamyl alcohol, ‘active’ amyl alcohol, isobutanol, 2-phenyl ethanol and tryptothol.These are important flavour and aroma compounds in all yeast-fermented productsand have interesting organoleptic properties in their own right, many of which areboth concentration and context dependent. For example, concentrated isoamyl alco-hol has a most unpleasant smell, but at concentrations below about 0.1% it has apleasant ‘refreshing’ or ‘clean’ note which may account for its use at low concentra-tions in many deodorants. 2-Phenyl ethanol, when concentrated, smells of rose petals,but when more dilute is described as smelling like ‘Band-aid’. The properties of thesecompounds are also context dependent, that is, the concentrations required are dif-ferent in different products. For example, full-bodied ales require higher concentra-tions of these alcohols than do lagers. Indeed, if the same concentrations were presentin a lager as in an ale, then the lager would definitely taste ‘off’. A batch of lager would
Brewing Yeast Fermentation Performance: Second edition
Edited by: KATHERINE SMART Copyright 0 Blackwell Science 2003
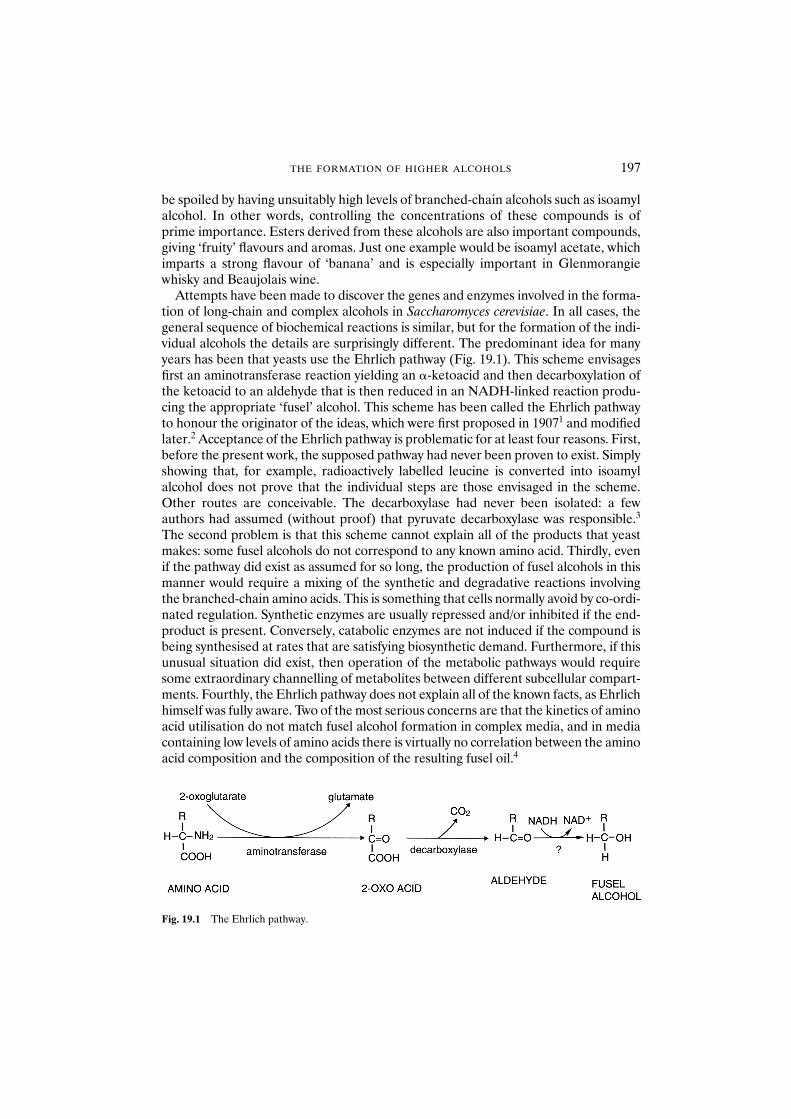
THE FORMATION OF HIGHER ALCOHOLS 197
be spoiled by having unsuitably high levels of branched-chain alcohols such as isoamylalcohol. In other words, controlling the concentrations of these compounds is ofprime importance. Esters derived from these alcohols are also important compounds,giving ‘fruity’ flavours and aromas. Just one example would be isoamyl acetate, whichimparts a strong flavour of ‘banana’ and is especially important in Glenmorangiewhisky and Beaujolais wine.
Attempts have been made to discover the genes and enzymes involved in the forma-tion of long-chain and complex alcohols in Saccharomyces cerevisiae. In all cases, thegeneral sequence of biochemical reactions is similar, but for the formation of the indi-vidual alcohols the details are surprisingly different. The predominant idea for manyyears has been that yeasts use the Ehrlich pathway (Fig. 19.1). This scheme envisagesfirst an aminotransferase reaction yielding an �-ketoacid and then decarboxylation ofthe ketoacid to an aldehyde that is then reduced in an NADH-linked reaction produ-cing the appropriate ‘fusel’ alcohol. This scheme has been called the Ehrlich pathwayto honour the originator of the ideas, which were first proposed in 19071 and modifiedlater.2 Acceptance of the Ehrlich pathway is problematic for at least four reasons. First,before the present work, the supposed pathway had never been proven to exist. Simplyshowing that, for example, radioactively labelled leucine is converted into isoamylalcohol does not prove that the individual steps are those envisaged in the scheme.Other routes are conceivable. The decarboxylase had never been isolated: a fewauthors had assumed (without proof) that pyruvate decarboxylase was responsible.3
The second problem is that this scheme cannot explain all of the products that yeastmakes: some fusel alcohols do not correspond to any known amino acid. Thirdly, evenif the pathway did exist as assumed for so long, the production of fusel alcohols in thismanner would require a mixing of the synthetic and degradative reactions involvingthe branched-chain amino acids. This is something that cells normally avoid by co-ordi-nated regulation. Synthetic enzymes are usually repressed and/or inhibited if the end-product is present. Conversely, catabolic enzymes are not induced if the compound isbeing synthesised at rates that are satisfying biosynthetic demand. Furthermore, if thisunusual situation did exist, then operation of the metabolic pathways would requiresome extraordinary channelling of metabolites between different subcellular compart-ments. Fourthly, the Ehrlich pathway does not explain all of the known facts, as Ehrlichhimself was fully aware. Two of the most serious concerns are that the kinetics of aminoacid utilisation do not match fusel alcohol formation in complex media, and in mediacontaining low levels of amino acids there is virtually no correlation between the aminoacid composition and the composition of the resulting fusel oil.4
Fig. 19.1 The Ehrlich pathway.
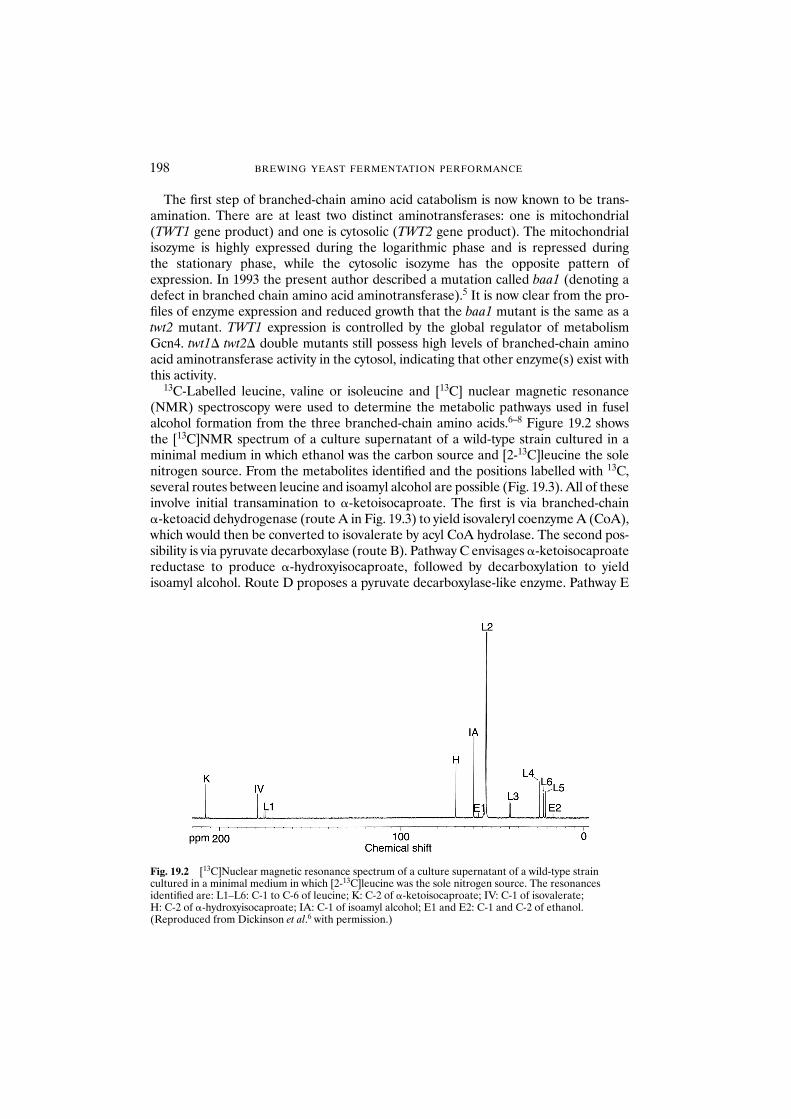
198 BREWING YEAST FERMENTATION PERFORMANCE
The first step of branched-chain amino acid catabolism is now known to be trans-amination. There are at least two distinct aminotransferases: one is mitochondrial(TWT1 gene product) and one is cytosolic (TWT2 gene product). The mitochondrialisozyme is highly expressed during the logarithmic phase and is repressed during the stationary phase, while the cytosolic isozyme has the opposite pattern of expression. In 1993 the present author described a mutation called baa1 (denoting adefect in branched chain amino acid aminotransferase).5 It is now clear from the pro-files of enzyme expression and reduced growth that the baa1 mutant is the same as atwt2 mutant. TWT1 expression is controlled by the global regulator of metabolismGcn4. twt1� twt2� double mutants still possess high levels of branched-chain aminoacid aminotransferase activity in the cytosol, indicating that other enzyme(s) exist withthis activity.
13C-Labelled leucine, valine or isoleucine and [13C] nuclear magnetic resonance(NMR) spectroscopy were used to determine the metabolic pathways used in fuselalcohol formation from the three branched-chain amino acids.6–8 Figure 19.2 showsthe [13C]NMR spectrum of a culture supernatant of a wild-type strain cultured in aminimal medium in which ethanol was the carbon source and [2-13C]leucine the solenitrogen source. From the metabolites identified and the positions labelled with 13C,several routes between leucine and isoamyl alcohol are possible (Fig. 19.3). All of theseinvolve initial transamination to �-ketoisocaproate. The first is via branched-chain �-ketoacid dehydrogenase (route A in Fig. 19.3) to yield isovaleryl coenzyme A (CoA),which would then be converted to isovalerate by acyl CoA hydrolase. The second pos-sibility is via pyruvate decarboxylase (route B). Pathway C envisages �-ketoisocaproatereductase to produce �-hydroxyisocaproate, followed by decarboxylation to yieldisoamyl alcohol. Route D proposes a pyruvate decarboxylase-like enzyme. Pathway E
Fig. 19.2 [13C]Nuclear magnetic resonance spectrum of a culture supernatant of a wild-type straincultured in a minimal medium in which [2-13C]leucine was the sole nitrogen source. The resonancesidentified are: L1–L6: C-1 to C-6 of leucine; K: C-2 of �-ketoisocaproate; IV: C-1 of isovalerate; H: C-2 of �-hydroxyisocaproate; IA: C-1 of isoamyl alcohol; E1 and E2: C-1 and C-2 of ethanol.(Reproduced from Dickinson et al.6 with permission.)
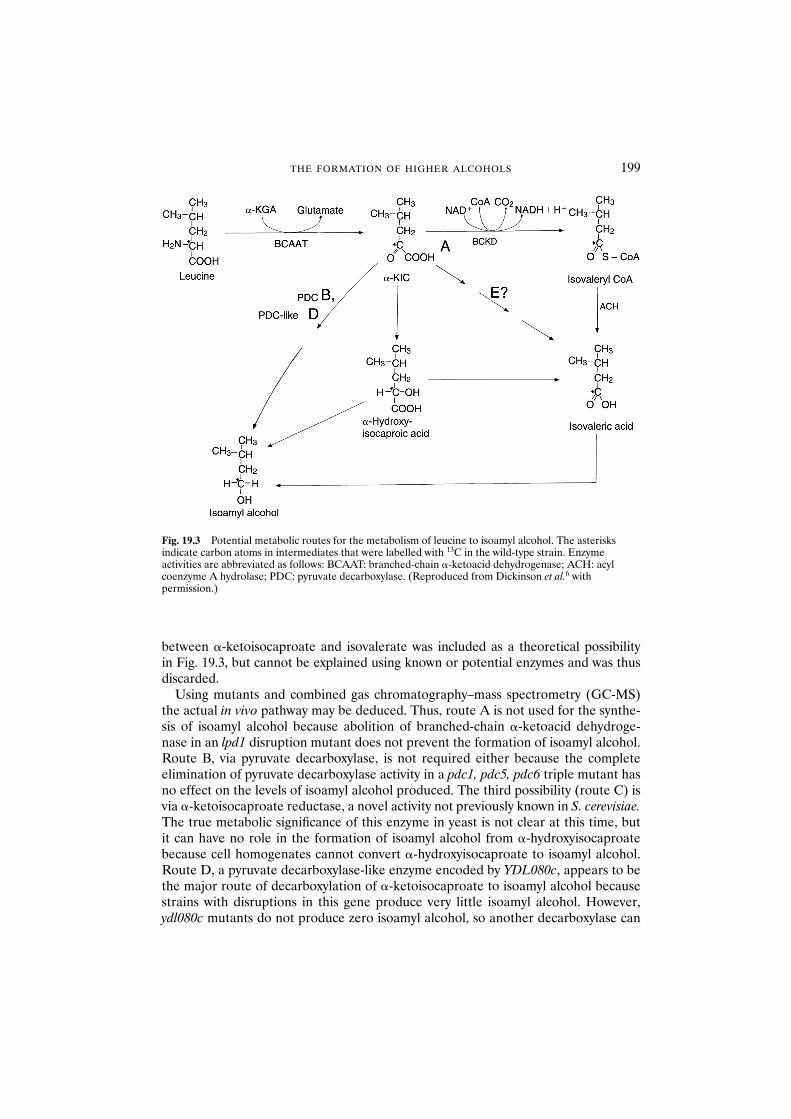
THE FORMATION OF HIGHER ALCOHOLS 199
between �-ketoisocaproate and isovalerate was included as a theoretical possibility in Fig. 19.3, but cannot be explained using known or potential enzymes and was thusdiscarded.
Using mutants and combined gas chromatography–mass spectrometry (GC-MS)the actual in vivo pathway may be deduced. Thus, route A is not used for the synthe-sis of isoamyl alcohol because abolition of branched-chain �-ketoacid dehydroge-nase in an lpd1 disruption mutant does not prevent the formation of isoamyl alcohol.Route B, via pyruvate decarboxylase, is not required either because the completeelimination of pyruvate decarboxylase activity in a pdc1, pdc5, pdc6 triple mutant hasno effect on the levels of isoamyl alcohol produced. The third possibility (route C) isvia �-ketoisocaproate reductase, a novel activity not previously known in S. cerevisiae.The true metabolic significance of this enzyme in yeast is not clear at this time, but it can have no role in the formation of isoamyl alcohol from �-hydroxyisocaproatebecause cell homogenates cannot convert �-hydroxyisocaproate to isoamyl alcohol.Route D, a pyruvate decarboxylase-like enzyme encoded by YDL080c, appears to bethe major route of decarboxylation of �-ketoisocaproate to isoamyl alcohol becausestrains with disruptions in this gene produce very little isoamyl alcohol. However,ydl080c mutants do not produce zero isoamyl alcohol, so another decarboxylase can
Fig. 19.3 Potential metabolic routes for the metabolism of leucine to isoamyl alcohol. The asterisksindicate carbon atoms in intermediates that were labelled with 13C in the wild-type strain. Enzymeactivities are abbreviated as follows: BCAAT: branched-chain �-ketoacid dehydrogenase; ACH: acylcoenzyme A hydrolase; PDC: pyruvate decarboxylase. (Reproduced from Dickinson et al.6 withpermission.)
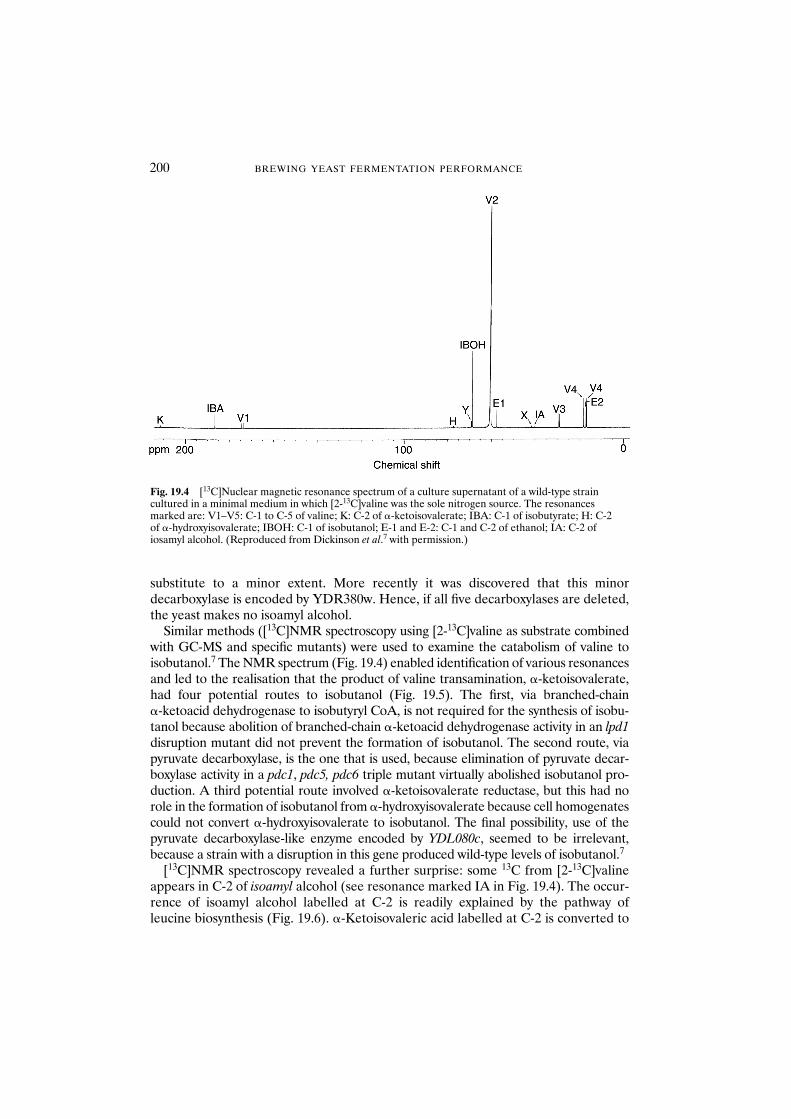
200 BREWING YEAST FERMENTATION PERFORMANCE
substitute to a minor extent. More recently it was discovered that this minordecarboxylase is encoded by YDR380w. Hence, if all five decarboxylases are deleted,the yeast makes no isoamyl alcohol.
Similar methods ([13C]NMR spectroscopy using [2-13C]valine as substrate combinedwith GC-MS and specific mutants) were used to examine the catabolism of valine toisobutanol.7 The NMR spectrum (Fig. 19.4) enabled identification of various resonancesand led to the realisation that the product of valine transamination, �-ketoisovalerate,had four potential routes to isobutanol (Fig. 19.5). The first, via branched-chain �-ketoacid dehydrogenase to isobutyryl CoA, is not required for the synthesis of isobu-tanol because abolition of branched-chain �-ketoacid dehydrogenase activity in an lpd1disruption mutant did not prevent the formation of isobutanol. The second route, viapyruvate decarboxylase, is the one that is used, because elimination of pyruvate decar-boxylase activity in a pdc1, pdc5, pdc6 triple mutant virtually abolished isobutanol pro-duction. A third potential route involved �-ketoisovalerate reductase, but this had norole in the formation of isobutanol from �-hydroxyisovalerate because cell homogenatescould not convert �-hydroxyisovalerate to isobutanol. The final possibility, use of thepyruvate decarboxylase-like enzyme encoded by YDL080c, seemed to be irrelevant,because a strain with a disruption in this gene produced wild-type levels of isobutanol.7
[13C]NMR spectroscopy revealed a further surprise: some 13C from [2-13C]valineappears in C-2 of isoamyl alcohol (see resonance marked IA in Fig. 19.4). The occur-rence of isoamyl alcohol labelled at C-2 is readily explained by the pathway of leucine biosynthesis (Fig. 19.6). �-Ketoisovaleric acid labelled at C-2 is converted to
Fig. 19.4 [13C]Nuclear magnetic resonance spectrum of a culture supernatant of a wild-type straincultured in a minimal medium in which [2-13C]valine was the sole nitrogen source. The resonancesmarked are: V1–V5: C-1 to C-5 of valine; K: C-2 of �-ketoisovalerate; IBA: C-1 of isobutyrate; H: C-2 of �-hydroxyisovalerate; IBOH: C-1 of isobutanol; E-1 and E-2: C-1 and C-2 of ethanol; IA: C-2 ofiosamyl alcohol. (Reproduced from Dickinson et al.7 with permission.)
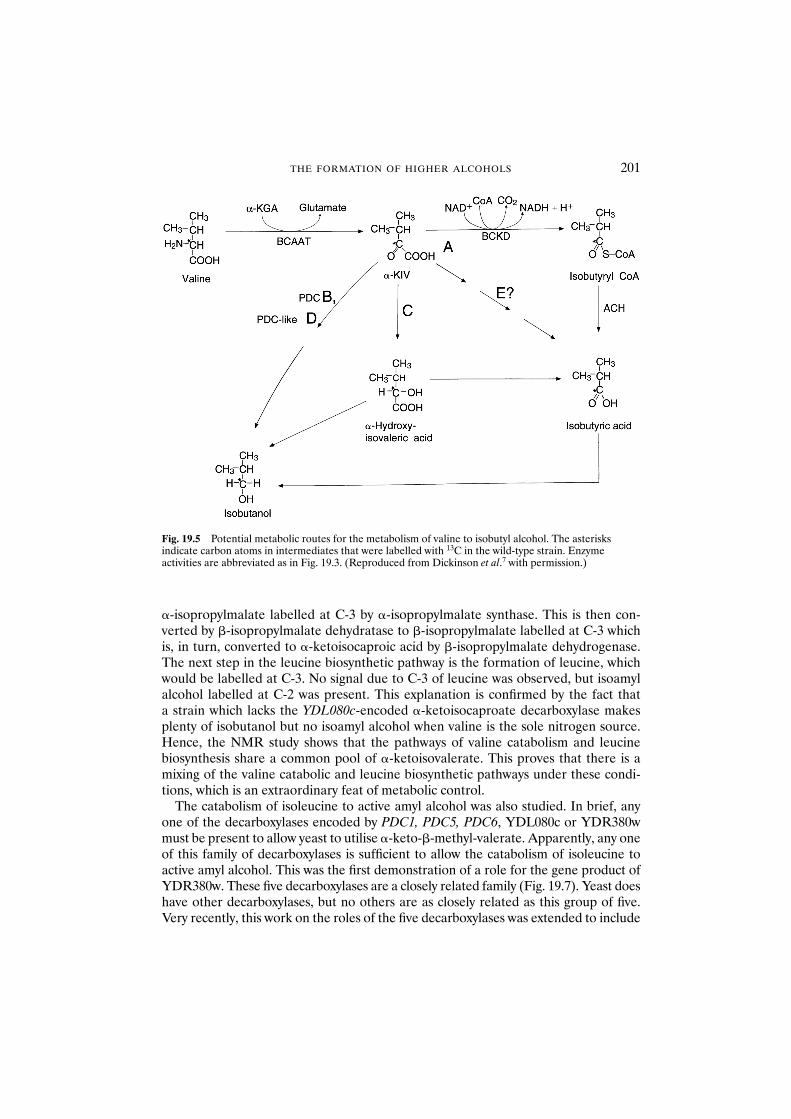
THE FORMATION OF HIGHER ALCOHOLS 201
�-isopropylmalate labelled at C-3 by �-isopropylmalate synthase. This is then con-verted by �-isopropylmalate dehydratase to �-isopropylmalate labelled at C-3 whichis, in turn, converted to �-ketoisocaproic acid by �-isopropylmalate dehydrogenase.The next step in the leucine biosynthetic pathway is the formation of leucine, whichwould be labelled at C-3. No signal due to C-3 of leucine was observed, but isoamylalcohol labelled at C-2 was present. This explanation is confirmed by the fact that a strain which lacks the YDL080c-encoded �-ketoisocaproate decarboxylase makesplenty of isobutanol but no isoamyl alcohol when valine is the sole nitrogen source.Hence, the NMR study shows that the pathways of valine catabolism and leucinebiosynthesis share a common pool of �-ketoisovalerate. This proves that there is amixing of the valine catabolic and leucine biosynthetic pathways under these condi-tions, which is an extraordinary feat of metabolic control.
The catabolism of isoleucine to active amyl alcohol was also studied. In brief, anyone of the decarboxylases encoded by PDC1, PDC5, PDC6, YDL080c or YDR380wmust be present to allow yeast to utilise �-keto-�-methyl-valerate. Apparently, any oneof this family of decarboxylases is sufficient to allow the catabolism of isoleucine toactive amyl alcohol. This was the first demonstration of a role for the gene product ofYDR380w. These five decarboxylases are a closely related family (Fig. 19.7). Yeast doeshave other decarboxylases, but no others are as closely related as this group of five.Very recently, this work on the roles of the five decarboxylases was extended to include
Fig. 19.5 Potential metabolic routes for the metabolism of valine to isobutyl alcohol. The asterisksindicate carbon atoms in intermediates that were labelled with 13C in the wild-type strain. Enzymeactivities are abbreviated as in Fig. 19.3. (Reproduced from Dickinson et al.7 with permission.)
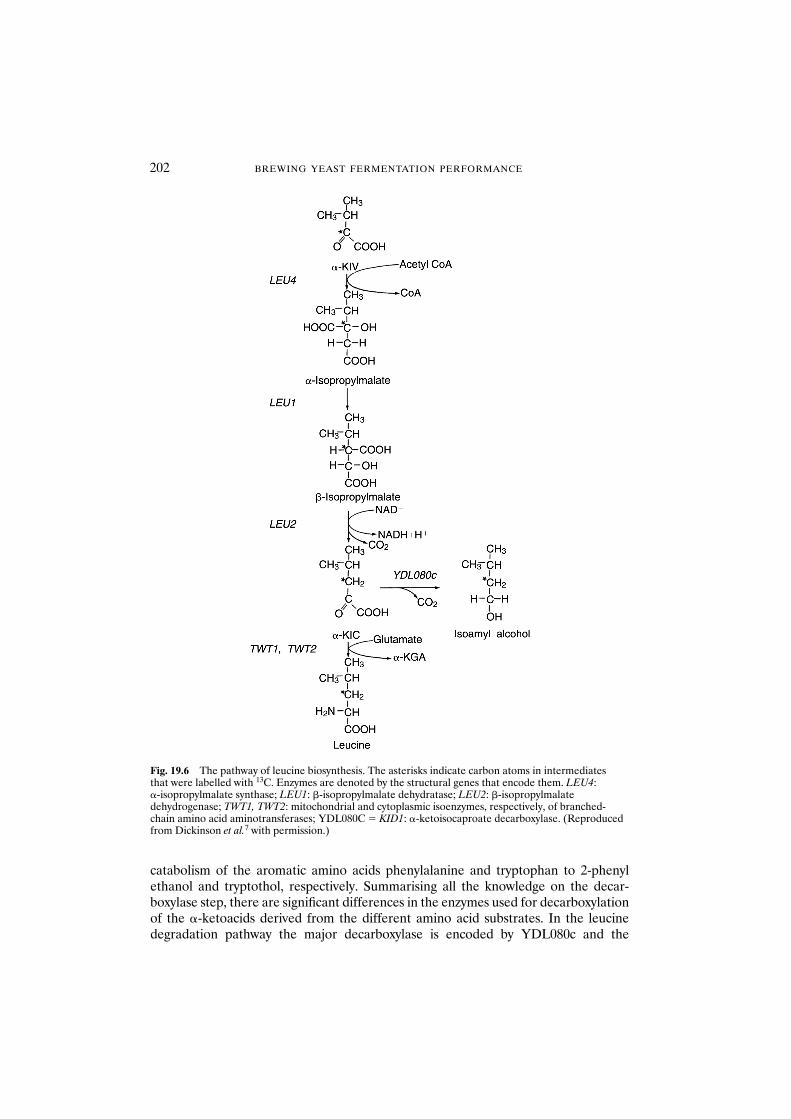
202 BREWING YEAST FERMENTATION PERFORMANCE
catabolism of the aromatic amino acids phenylalanine and tryptophan to 2-phenylethanol and tryptothol, respectively. Summarising all the knowledge on the decar-boxylase step, there are significant differences in the enzymes used for decarboxylationof the �-ketoacids derived from the different amino acid substrates. In the leucinedegradation pathway the major decarboxylase is encoded by YDL080c and the
Fig. 19.6 The pathway of leucine biosynthesis. The asterisks indicate carbon atoms in intermediates that were labelled with 13C. Enzymes are denoted by the structural genes that encode them. LEU4: �-isopropylmalate synthase; LEU1: �-isopropylmalate dehydratase; LEU2: �-isopropylmalatedehydrogenase; TWT1, TWT2: mitochondrial and cytoplasmic isoenzymes, respectively, of branched-chain amino acid aminotransferases; YDL080C � KID1: �-ketoisocaproate decarboxylase. (Reproducedfrom Dickinson et al.7 with permission.)
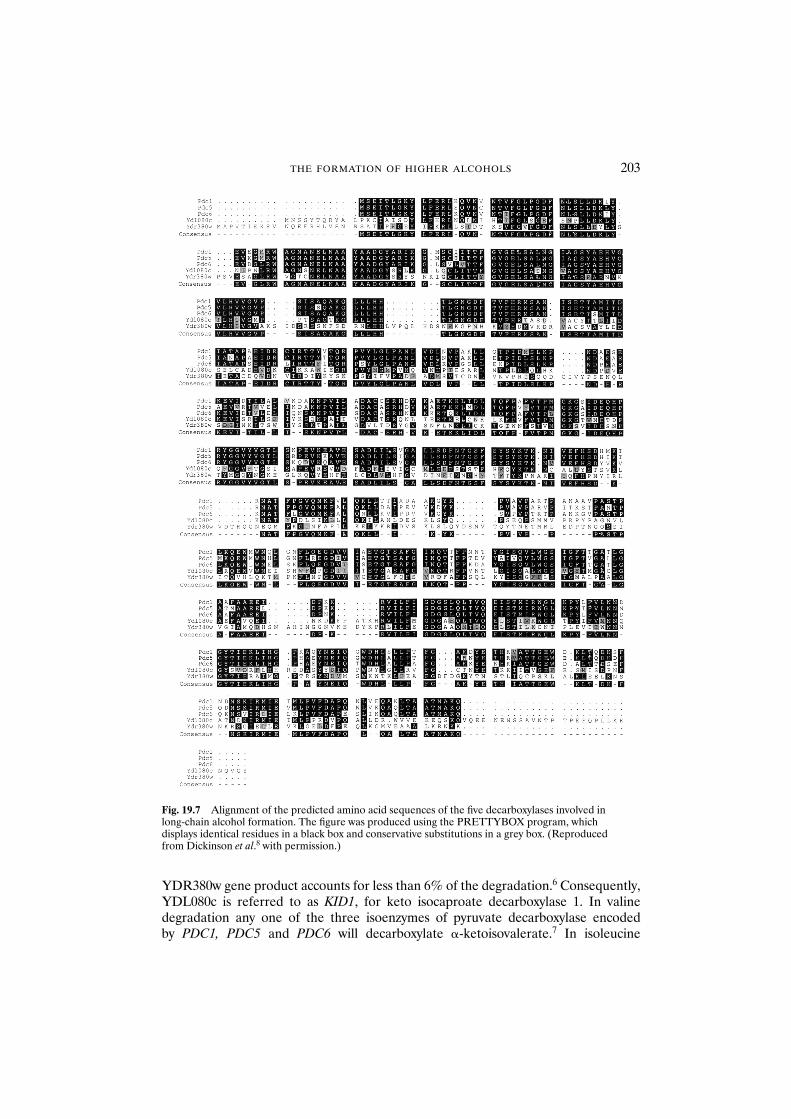
THE FORMATION OF HIGHER ALCOHOLS 203
YDR380w gene product accounts for less than 6% of the degradation.6 Consequently,YDL080c is referred to as KID1, for keto isocaproate decarboxylase 1. In valine degradation any one of the three isoenzymes of pyruvate decarboxylase encoded by PDC1, PDC5 and PDC6 will decarboxylate �-ketoisovalerate.7 In isoleucine
Fig. 19.7 Alignment of the predicted amino acid sequences of the five decarboxylases involved in long-chain alcohol formation. The figure was produced using the PRETTYBOX program, which displays identical residues in a black box and conservative substitutions in a grey box. (Reproduced from Dickinson et al.8 with permission.)
204 BREWING YEAST FERMENTATION PERFORMANCE
catabolism any one of these five possible decarboxylases encoded by PDC1, PDC5,PDC6, YDL080c or YDR380w is sufficient for the catabolism of isoleucine to ‘active’amyl alcohol.8 For phenylalanine and tryptophan breakdown a pdc1, pdc5, pdc6,ydr380w quadruple mutant makes zero 2-phenylethanol and tryptophol, respectively.In other words, YDL080c (KID1) is irrelevant: it is not needed in these two pathways.
Finally, what is presumed to be an alcohol dehydrogenase step in the pathways oflong-chain alcohol formation was considered. There are a great many potentialcandidates for this role. An exciting break through came in 1999, when Delneri andOliver identified a seven-membered family of putative aryl alcohol dehydrogenasegenes, a gene family for which there were no known functions among the members.9,10
Their functions look set to remain unknown for a while longer because a mutant strainin which all seven AAD genes had been knocked out was still capable of convertingleucine to isoamyl alcohol.
Saccharomyces cerevisiae has 13 other alcohol dehydrogenases. Some of these can beeliminated; for example, BDH1 (YAL060W) has recently been shown to be involved inthe formation of 2,3-butanediol.11 On the basis of similarity it seems safe to assume thatYAL061W could be called ‘BDH2’ and that it has a similar activity. SOR1 (YJR159W),‘SOR2’ (YDL246C) and XDH1 (YLR070C) are sugar alcohol dehydrogenases, while‘CDH1’ (YCR105W) and ‘CDH2’ (YMR318C) are NADP-dependent cinnamyl alcoholdehydrogenases. This leaves six other alcohol dehydrogenases, of which perhaps thefirst four (Adh1–Adh4) are the best known. Adh1 is the main cytosolic enzyme involvedin the formation of ethanol during glycolysis. Adh2, which is also cytosolic, is the glucose-repressed enzyme that is needed for growth on ethanol. Adh3 is mitochondrial, it isinduced on glucose and its role is not really understood. Adh4 is present at only very lowlevels in most laboratory strains, but is plentiful in brewing strains.12 Adh5 was dis-covered by genome sequencing and is a complete mystery. Sfa1 is part of a bifunctionalenzyme that has glutathione-dependent formaldehyde dehydrogenase activity (thegene name comes from sensitive to formaldehyde, which is the phenotype of mutantsaffected in this gene); it is also described as being capable of catalysing the destructionof long-chain alcohols.13 Each has at least one feature that may lead one to expect thatit could be responsible for the synthesis of long-chain alcohols. For example, Adh1,Adh2 and Adh3 all require zinc, and brewers have known for years that the concentra-tion of zinc in the wort affects the concentration of long-chain alcohols that are formed.Alternatively since it has been shown that Sfa1 can degrade long-chain alcohols in vitro,its true role in vivo may be the formation of these compounds. Unfortunately, this is allsurmise because mutants knocked out in any one of these genes can all produce thelong-chain alcohols. Furthermore, having produced combinations of quintuple knock-out mutants (e.g. adh1, adh2, adh3, adh4, adh5) it looks as though any one of these alco-hol dehydrogenases will fulfil the role as long as it is operating under the physiologicalconditions in use; for example, Adh2 would not work in high glucose conditions.
19.2 Conclusions
One important conclusion that can be drawn is that the specificity seems to beachieved at the decarboxylation step because the degradation of each amino acid uses
a different decarboxylase or group of decarboxylases. The current research is aimedat trying to define how this is achieved in each case. In minimal media this is essentiallythe Ehrlich pathway as proposed nearly 100 years ago, but it is much more complexthan Ehrlich ever imagined because yeast uses at least two aminotransferases, fivedecarboxylases and six alcohol dehydrogenases. The precise combination of enzymesused at a particular time depends on the amino acid, the carbon source and the stageof growth of the culture. In complex media yeast uses branched-chain �-ketoaciddehydrogenase. This explains the last of Ehrlich’s conundrums. Ehrlich could not explainwhy in complex media there was no correlation between the kinetics of amino acidutilisation and fusel alcohol formation. In complex media yeast uses �-ketoacid dehydrogenase and fusel alcohols are not formed. The high Michaelis constant of �-ketoacid dehydrogenase14 also ensures that metabolic flux will only occur via thisenzyme when the �-ketoacids are present at extremely high levels.
References
1. Ehrlich, F. (1907) Über die bedingungen der fuselölbildung und uber ihren zusammenhang mit demeiweissaufbau der hefe. Berichte Dtsch. Chem. Gesellsch. 40, 1027–1047.
2. Neubauer, O. and Fromherz, K. (1911) Über den abbau der aminosären bei der hefegärung. Hoppe-Seylers Z. Physiol. Chem. 70, 326–350.
3. Derrick, S. and Large, P.J. (1993) Activities of the enzymes of the Ehrlich pathway and formation ofbranched-chain alcohols in Saccharomyces cerevisiae and Candida utilis grown in continuous culture onvaline or ammonium as sole nitrogen source. J. Gen. Microbiol. 139, 2783–2792.
4. Webb, A.D. and Ingraham, J.L. (1965) Fusel oil. Adv. Appl. Microbiol. 5, 317–353.5. Dickinson, J.R. and Norte, V. (1993) A study of branched-chain amino acid aminotransferase and isol-
ation of mutations affecting the catabolism of branched-chain amino acids in Saccharomyces cerevisiae.FEBS Lett. 326, 29–32.
6. Dickinson, J.R., Lanterman, M.M., Danner, D.J. et al. (1997) A 13C nuclear magnetic resonance inves-tigation of the metabolism of leucine to isoamyl alcohol in Saccharomyces cerevisiae. J. Biol. Chem. 272,26871–26878.
7. Dickinson, J.R., Harrison, S.J. and Hewlins, M.J.E. (1998) An investigation of the metabolism of valineto isobutyl alcohol in Saccharomyces cerevisiae. J. Biol. Chem. 273, 25751–25756.
8. Dickinson, J.R., Harrison, S.J., Dickinson, J.A. and Hewlins, M.J.E. (2000) An investigation of the metab-olism of isoleucine to active amyl alcohol in Saccharomyces cerevisiae. J. Biol. Chem. 275, 10937–10942.
9. Delneri, D., Gardner, D.C.J. and Oliver, S.G. (1999) Analysis of the seven-member AAD gene setdemonstrates that genetic redundancy in yeast may be more apparent than real. Genetics 153, 1591–1600.
10. Delneri, D., Gardner, D.C.J., Bruschi, C.V. and Oliver, S.G. (1999) Disruption of seven hypotheticalaryl alcohol dehydrogenase genes from Saccharomyces cerevisiae and construction of a multiple knock-out strain. Yeast 15, 1681–1689.
11. González, E., Fernández, M.R., Larroy, C. et al. (2000) Characterization of a (2R,3R)-2,3-butanedioldehydrogenase as the Saccharomyces cerevisiae YAL060W gene product. J. Biol. Chem. 275, 35876–35885.
12. Dickinson, J.R. (1999) Carbon metabolism. In: The Metabolism and Molecular Physiology of Saccharomycescerevisiae, Dickinson, J.R. and Schweizer, M. (eds). Taylor and Francis, London, pp. 23–55.
13. Wehner, E.P., Rao, E. and Brendel, M. (1993) Molecular structure and genetic regulation of SFA, agene responsible for resistance to formaldehyde in Saccharomyces cerevisiae, and characterization of itsprotein product. Mol. Gen. Genet. 237, 351–358.
14. Sinclair, D.A., Dawes, I.W. and Dickinson, J.R. (1993) Purification and characterization of the branchedchain �-ketoacid dehydrogenase complex from Saccharomyces cerevisiae. Biochem. Mol. Biol. Int. 31,911–922.
THE FORMATION OF HIGHER ALCOHOLS 205
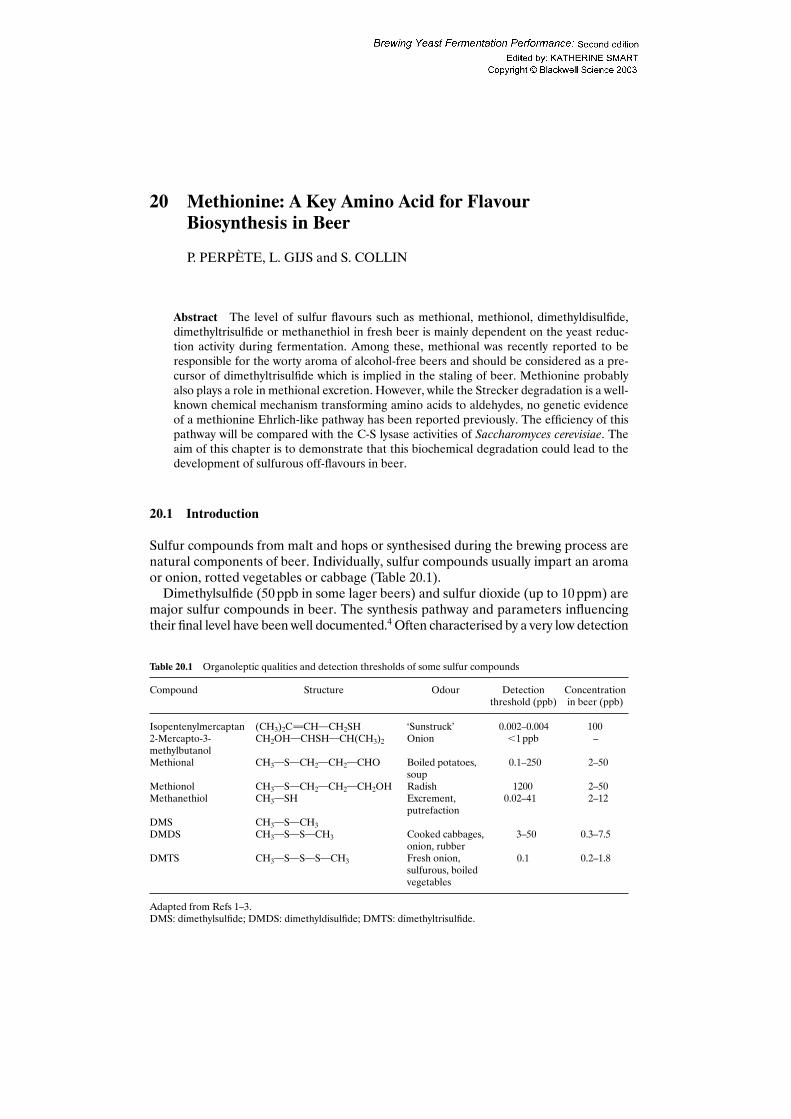
20 Methionine: A Key Amino Acid for FlavourBiosynthesis in Beer
P. PERPÈTE, L. GIJS and S. COLLIN
Abstract The level of sulfur flavours such as methional, methionol, dimethyldisulfide,dimethyltrisulfide or methanethiol in fresh beer is mainly dependent on the yeast reduc-tion activity during fermentation. Among these, methional was recently reported to beresponsible for the worty aroma of alcohol-free beers and should be considered as a pre-cursor of dimethyltrisulfide which is implied in the staling of beer. Methionine probablyalso plays a role in methional excretion. However, while the Strecker degradation is a well-known chemical mechanism transforming amino acids to aldehydes, no genetic evidenceof a methionine Ehrlich-like pathway has been reported previously. The efficiency of thispathway will be compared with the C-S lysase activities of Saccharomyces cerevisiae. Theaim of this chapter is to demonstrate that this biochemical degradation could lead to thedevelopment of sulfurous off-flavours in beer.
20.1 Introduction
Sulfur compounds from malt and hops or synthesised during the brewing process arenatural components of beer. Individually, sulfur compounds usually impart an aromaor onion, rotted vegetables or cabbage (Table 20.1).
Dimethylsulfide (50 ppb in some lager beers) and sulfur dioxide (up to 10 ppm) aremajor sulfur compounds in beer. The synthesis pathway and parameters influencingtheir final level have been well documented.4 Often characterised by a very low detection
Table 20.1 Organoleptic qualities and detection thresholds of some sulfur compounds
Compound Structure Odour Detection Concentration threshold (ppb) in beer (ppb)
Isopentenylmercaptan (CH3)2C¨CHˆCH2SH ‘Sunstruck’ 0.002–0.004 1002-Mercapto-3- CH2OHˆCHSHˆCH(CH3)2 Onion �1 ppb –methylbutanolMethional CH3ˆSˆCH2ˆCH2ˆCHO Boiled potatoes, 0.1–250 2–50
soupMethionol CH3ˆSˆCH2ˆCH2ˆCH2OH Radish 1200 2–50Methanethiol CH3ˆSH Excrement, 0.02–41 2–12
putrefactionDMS CH3ˆSˆCH3DMDS CH3ˆSˆSˆCH3 Cooked cabbages, 3–50 0.3–7.5
onion, rubberDMTS CH3ˆSˆSˆSˆCH3 Fresh onion, 0.1 0.2–1.8
sulfurous, boiled vegetables
Adapted from Refs 1–3.DMS: dimethylsulfide; DMDS: dimethyldisulfide; DMTS: dimethyltrisulfide.
Brewing Yeast Fermentation Performance: Second edition
Edited by: KATHERINE SMART Copyright 0 Blackwell Science 2003
threshold, minor sulfur compounds such as thioesters, polysulfides or thiols mostprobably also modify the overall organoleptic quality of beer.
Thioesters (S-methylthioacetate, S-methylthioisovalerate), which originate mainlyfrom hops,5 give rise to rotted vegetable aromas6 in lager beers.
With a flavour threshold of 0.1 ppb, dimethyltrisulfide is known to be responsible forthe onion off-flavour of aged beers. Recent data show that S-methylcysteine sulfoxide,methional and methionol are its main precursor in beer.7,8
Although thiols are hard to analyse because of their very high reactivity and verylow concentration/detection threshold, they are also very relevant compounds for brew-ers. Among them, isopentenylmercaptan imparts the well-known ‘sunstruck’ flavour9
and methanethiol (detection threshold: 0.1 ppb) is usually characterised with ‘excre-ment’ or ‘putrefaction’ descriptors. In aged beers, as in wines,10 polyfunctional thiolsare probably also responsible for delicate flavours.8
Methional or 3-methylthiopropionaldehyde imparts a boiled potato aroma at highconcentrations,2 but can be described as ‘soup’ or ‘hot wort’ at lower concentrations.11
This aldehyde was initially detected in Cheddar cheese,12 corn tortillas13 and boiledtrout,14 and has been measured in beer and alcohol-free beers, where it contributes tothe worty aroma along with 2-methylbutanal and 3-methylbutanal.11 More recently,methional was also proposed as an additional key compound in aged beers.15 As 2-methylbutanal and 3-methylbutanal can be synthesised by Strecker degradation ofamino acids, wort methional may derive from methionine. During wort fermentation,Saccharomyces cerevisiae produces NADPH-dependent enzymes allowing methionalreduction.11,16 However, because of the low temperature applied and interaction withpolyphenols, this enzymic reduction is incomplete in alcohol-free beer productions,leading to a strong worty flavour in the final product.
Methionol is the reduction product of methional. Although not really pleasant,with its cauliflower or radish-like aroma, methionol is not considered an off-flavour inbeer (detection threshold close to 1200 ppb).
Most of the sulfur compounds described above should be derivable from methio-nine, so it is very surprising that so little is known about the methionine-degradingpathway in yeast. The aim of this work was to find evidence for a catabolic pathwayleading to methanethiol, either with or without a methional intermediate.
20.2 Materials and methods
20.2.1 Reagents
Methional (95%) and methionol (98%) were purchased from Acros Chemika(Brussels, Belgium). Methanethiol (99.5%) was from Aldrich (Brussels, Belgium).
20.2.2 Strains
Saccharomyces cerevisiae BRAS291 (bottom fermentation) and BRAS212 (top fer-mentation) were provided by the BRAS collection of the Unité de Brasserie et desIndustries Alimentaires (Louvain-la-Neuve, Belgium).
A KEY AMINO ACID FOR FLAVOUR BIOSYNTHESIS IN BEER 207
20.2.3 Culture media and sampling
Precultures were grown in YPS medium (1% yeast extract, 0.5% peptone and 10%sucrose) at 28°C on a rotary shaker and collected in the exponential phase. After col-lection and washing, the yeast was pitched at 106 cells/ml in model media. Two mediawere used during these experiments: a glucose-methionine medium (citrate-bufferedmedium containing 3% glucose and 10 mM methionine) and a glucose-ammoniummedium (citrate-buffered medium containing 3% glucose and 10 mM ammonium sul-fate). Cultures were grown at 28°C on a rotary shaker. At a given time, samples werecollected and centrifuged, and supernatants were immediately frozen in liquid nitro-gen for methanethiol quantification.
20.2.4 Methanethiol quantification
Methanethiol was quantified by dynamic headspace gas chromatography. A Hewlett-Packard model 5890 gas chromatograph equipped with a Chrompack Purge and TrapInjector, a flame ionisation detector and a Shimadzu CR3A integrator was used.Samples were injected into the chromatographic column in the following three steps.
1. Precooling of the trap (CPSil 8 CB capillary column, 0.53 mm internal diameter;film thickness 5 �m): the trap was cooled at �95°C for 2 min in a stream of liquidnitrogen;
2. Purging of the sample: the temperature of the purge vessel was set at 50°C. Thesample was purged with helium gas (12 ml/min) for 15 min. The gas stream waspassed through a condenser kept at �15°C by means of a cryostat (Colora WK 15)to remove water vapour and then through an oven at 200°C. The volatiles werefinally concentrated in the cold trap maintained at �95°C (liquid nitrogen);
3. Desorption of the volatiles: cooling was stopped, and the surrounding metal capil-lary was immediately heated to 220°C for 5 min. The carrier gas swept the trappedcompounds into the analytical column. Analysis of samples was carried out on a50 m � 0.32 mm, wall-coated, open tubular (WCOT) CP-Sil5 CB capillary column(Chrompack, Antwerp, Belgium) (film thickness 1.2 �m). Oven temperature,initially kept at 36°C for 15 min, was programmed to rise from 36 to 120°C at2°C/min then to 200°C at 10°C/min, remaining at the maximum temperature for10 min thereafter. Helium carrier gas was used at a flow rate of 1.0 ml/min. Injectionand detection temperatures were 200 and 220°C, respectively.
All analyses were done in duplicate. The assessment of the reproducibility of thistechnique has been described previously (coefficients of variation under 10% for fiveanalyses of the same standard mixture).17
20.3 Results and discussion
During mashing, methionine can be transformed to methional by Strecker degrad-ation (Fig. 20.1) and further oxidation can lead to methanethiol.18,19 Because of itshigh volatility, this thiol is easily stripped out of the wort in the boiling kettle.
208 BREWING YEAST FERMENTATION PERFORMANCE
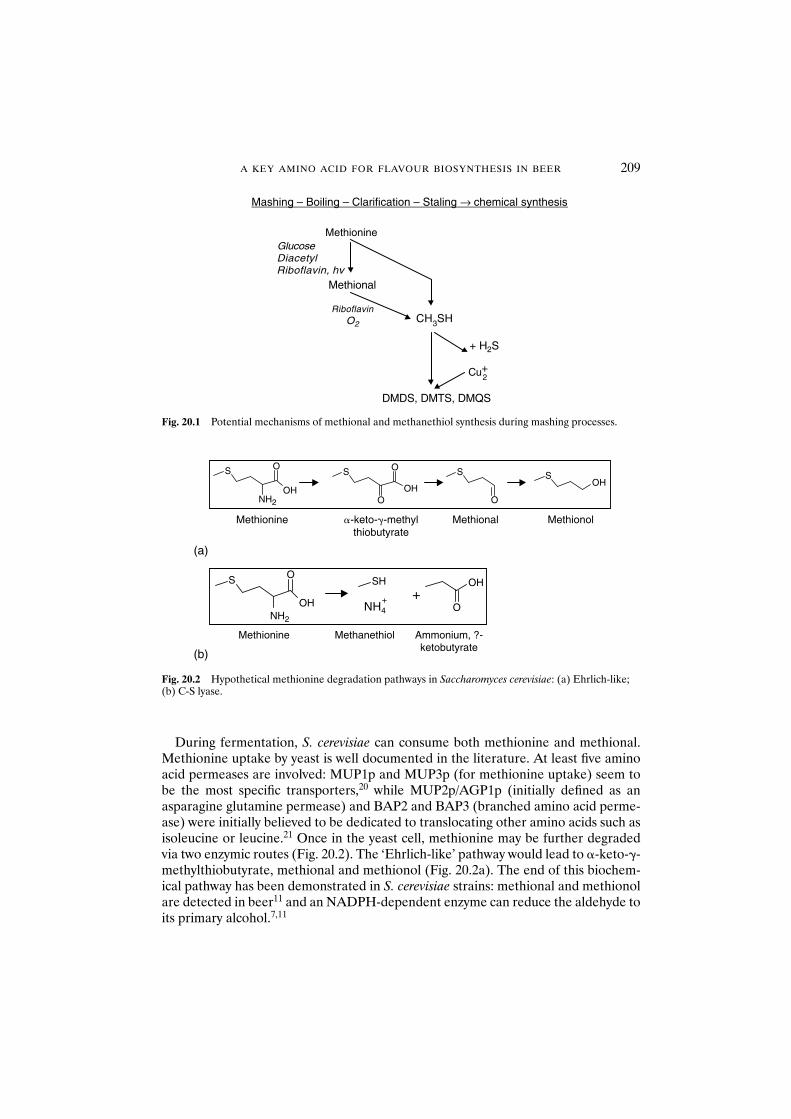
A KEY AMINO ACID FOR FLAVOUR BIOSYNTHESIS IN BEER 209
During fermentation, S. cerevisiae can consume both methionine and methional.Methionine uptake by yeast is well documented in the literature. At least five aminoacid permeases are involved: MUP1p and MUP3p (for methionine uptake) seem tobe the most specific transporters,20 while MUP2p/AGP1p (initially defined as anasparagine glutamine permease) and BAP2 and BAP3 (branched amino acid perme-ase) were initially believed to be dedicated to translocating other amino acids such asisoleucine or leucine.21 Once in the yeast cell, methionine may be further degradedvia two enzymic routes (Fig. 20.2). The ‘Ehrlich-like’ pathway would lead to �-keto--methylthiobutyrate, methional and methionol (Fig. 20.2a). The end of this biochem-ical pathway has been demonstrated in S. cerevisiae strains: methional and methionolare detected in beer11 and an NADPH-dependent enzyme can reduce the aldehyde toits primary alcohol.7,11
Mashing – Boiling – Clarification – Staling → chemical synthesis
Methionine
Methional
CH3SH
+ H2S
DMDS, DMTS, DMQS
GlucoseDiacetylRiboflavin, hv
RiboflavinO2
Cu+2
Fig. 20.1 Potential mechanisms of methional and methanethiol synthesis during mashing processes.
Methionine �-keto-�-methylthiobutyrate
Methional
Methionine Methanethiol
NH2
NH2
OS
OHO
OS
OHO
S SOH
OS
OH O
OHSH+
NH4+
(a)
(b)
Methionol
Ammonium, ?-ketobutyrate
Fig. 20.2 Hypothetical methionine degradation pathways in Saccharomyces cerevisiae: (a) Ehrlich-like;(b) C-S lyase.
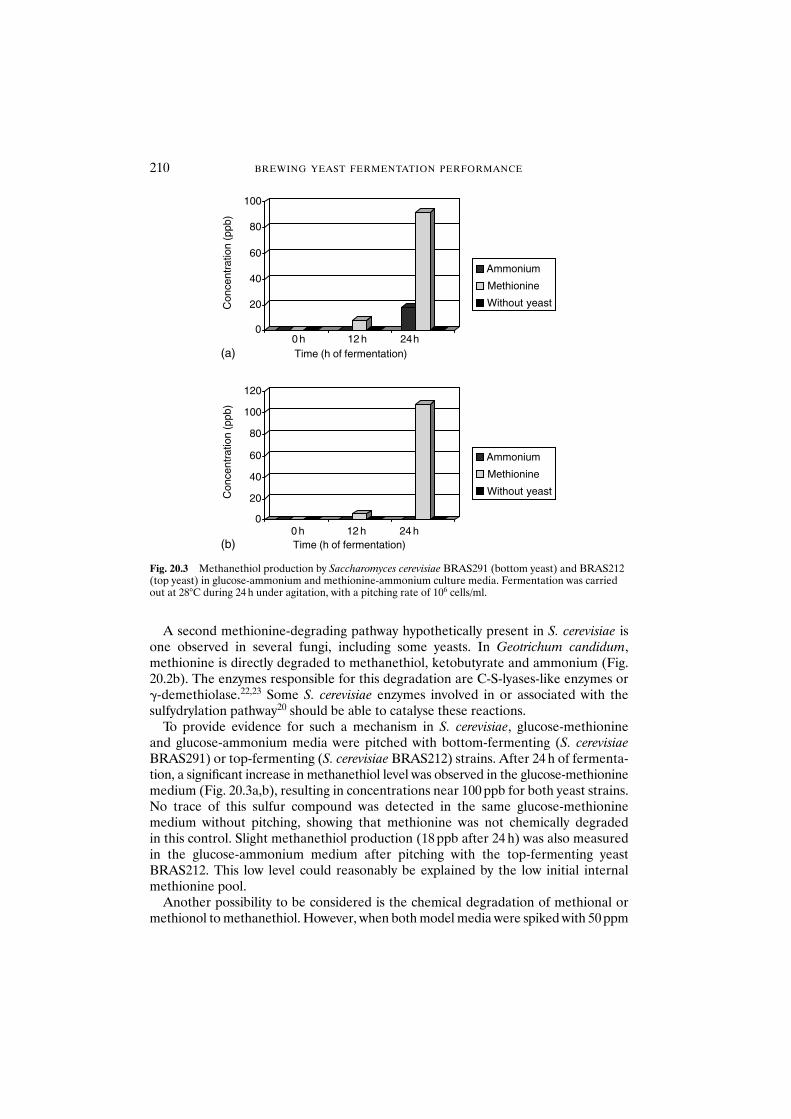
210 BREWING YEAST FERMENTATION PERFORMANCE
A second methionine-degrading pathway hypothetically present in S. cerevisiae isone observed in several fungi, including some yeasts. In Geotrichum candidum,methionine is directly degraded to methanethiol, ketobutyrate and ammonium (Fig.20.2b). The enzymes responsible for this degradation are C-S-lyases-like enzymes or-demethiolase.22,23 Some S. cerevisiae enzymes involved in or associated with thesulfydrylation pathway20 should be able to catalyse these reactions.
To provide evidence for such a mechanism in S. cerevisiae, glucose-methionine and glucose-ammonium media were pitched with bottom-fermenting (S. cerevisiaeBRAS291) or top-fermenting (S. cerevisiae BRAS212) strains. After 24 h of fermenta-tion, a significant increase in methanethiol level was observed in the glucose-methioninemedium (Fig. 20.3a,b), resulting in concentrations near 100 ppb for both yeast strains.No trace of this sulfur compound was detected in the same glucose-methioninemedium without pitching, showing that methionine was not chemically degraded in this control. Slight methanethiol production (18 ppb after 24 h) was also measuredin the glucose-ammonium medium after pitching with the top-fermenting yeastBRAS212. This low level could reasonably be explained by the low initial internalmethionine pool.
Another possibility to be considered is the chemical degradation of methional ormethionol to methanethiol. However, when both model media were spiked with 50 ppm
0
20
40
60
80
100
Con
cent
ratio
n (p
pb)
0 h 12 h 24hTime (h of fermentation)
Ammonium
Methionine
Without yeast
Ammonium
Methionine
Without yeast
0
20
40
60
80
100
120
Con
cent
ratio
n (p
pb)
0 h 12 h 24 hTime (h of fermentation)
(a)
(b)
Fig. 20.3 Methanethiol production by Saccharomyces cerevisiae BRAS291 (bottom yeast) and BRAS212(top yeast) in glucose-ammonium and methionine-ammonium culture media. Fermentation was carriedout at 28°C during 24 h under agitation, with a pitching rate of 106 cells/ml.
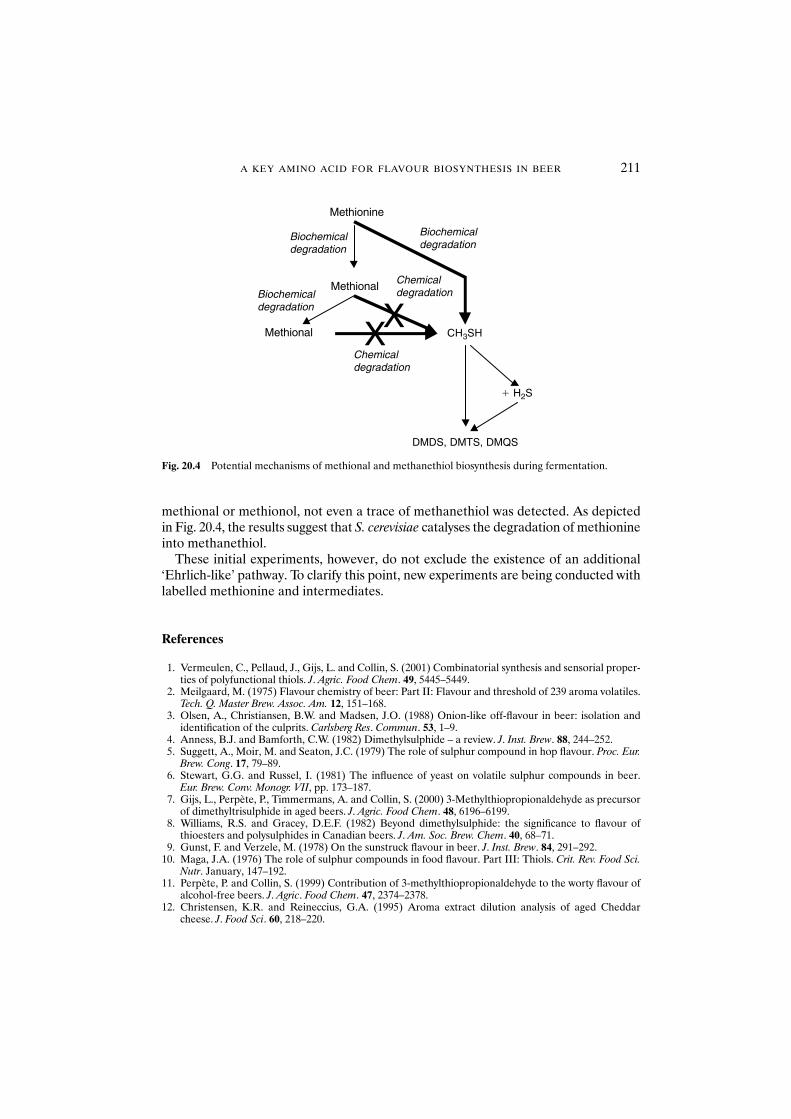
A KEY AMINO ACID FOR FLAVOUR BIOSYNTHESIS IN BEER 211
methional or methionol, not even a trace of methanethiol was detected. As depictedin Fig. 20.4, the results suggest that S. cerevisiae catalyses the degradation of methionineinto methanethiol.
These initial experiments, however, do not exclude the existence of an additional‘Ehrlich-like’ pathway. To clarify this point, new experiments are being conducted withlabelled methionine and intermediates.
References
1. Vermeulen, C., Pellaud, J., Gijs, L. and Collin, S. (2001) Combinatorial synthesis and sensorial proper-ties of polyfunctional thiols. J. Agric. Food Chem. 49, 5445–5449.
2. Meilgaard, M. (1975) Flavour chemistry of beer: Part II: Flavour and threshold of 239 aroma volatiles.Tech. Q. Master Brew. Assoc. Am. 12, 151–168.
3. Olsen, A., Christiansen, B.W. and Madsen, J.O. (1988) Onion-like off-flavour in beer: isolation andidentification of the culprits. Carlsberg Res. Commun. 53, 1–9.
4. Anness, B.J. and Bamforth, C.W. (1982) Dimethylsulphide – a review. J. Inst. Brew. 88, 244–252.5. Suggett, A., Moir, M. and Seaton, J.C. (1979) The role of sulphur compound in hop flavour. Proc. Eur.
Brew. Cong. 17, 79–89.6. Stewart, G.G. and Russel, I. (1981) The influence of yeast on volatile sulphur compounds in beer.
Eur. Brew. Conv. Monogr. VII, pp. 173–187.7. Gijs, L., Perpète, P., Timmermans, A. and Collin, S. (2000) 3-Methylthiopropionaldehyde as precursor
of dimethyltrisulphide in aged beers. J. Agric. Food Chem. 48, 6196–6199.8. Williams, R.S. and Gracey, D.E.F. (1982) Beyond dimethylsulphide: the significance to flavour of
thioesters and polysulphides in Canadian beers. J. Am. Soc. Brew. Chem. 40, 68–71.9. Gunst, F. and Verzele, M. (1978) On the sunstruck flavour in beer. J. Inst. Brew. 84, 291–292.
10. Maga, J.A. (1976) The role of sulphur compounds in food flavour. Part III: Thiols. Crit. Rev. Food Sci.Nutr. January, 147–192.
11. Perpète, P. and Collin, S. (1999) Contribution of 3-methylthiopropionaldehyde to the worty flavour ofalcohol-free beers. J. Agric. Food Chem. 47, 2374–2378.
12. Christensen, K.R. and Reineccius, G.A. (1995) Aroma extract dilution analysis of aged Cheddarcheese. J. Food Sci. 60, 218–220.
Methionine
Methional
Methional
CH3SH
� H2S
DMDS, DMTS, DMQS
XX
Biochemicaldegradation
Chemicaldegradation
Chemicaldegradation
Biochemicaldegradation
Biochemicaldegradation
Fig. 20.4 Potential mechanisms of methional and methanethiol biosynthesis during fermentation.
13. Buttery, R.G. and Ling, L.C. (1995) Volatile flavour components of corn tortillas and related products.J. Agric. Food Chem. 43, 1878–1882.
14. Milo, C. and Grosch, W. (1993) Changes in the odorants of boiled trout as affected by the storage ofthe raw material. J. Agric. Food Chem. 41, 2076–2081.
15. Chevance, F., Gijs, L., Jerkovic, V. et al. (2001) Influence of pH on beer flavour stability during storage.4th Pangborn Sensory Sci. Symp., 22–26 July, Dijon, France.
16. Laurent, M., Geldorf, B., Van Nedervelde, L. et al. (1995) Characterisation of the aldoketoreductaseyeast enzymatic systems involved in the removal of wort carbonyls during fermentation. Proc. Eur.Brew. Conv. 25, 337–344.
17. Collin, S., Osman, M., Delcambre, S. et al. (1993) Investigation of volatile flavour compounds in freshand ripened Domiati cheeses. J. Agric. Food Chem. 41, 1659–1663.
18. Balance, P.E. (1961) Production of volatile compounds related to the flavour of foods from the Streckerdegradation of DL-methionine. J. Sci. Food Agric. 12, 532–536.
19. Yu, T.H. and Ho, C.T. (1995) Volatile compounds generated from thermal reaction of methionine andmethionine sulphoxide with or without glucose. J. Agric. Food Chem. 43, 1641–1646.
20. Thomas, D. and Surdin-Kerjan, Y. (1997) Metabolism of sulphur amino acids in Saccharomyces cerevisiae. Microbiol. Mol. Biol. Rev. 61, 503–532.
21. Regenberg, B., During-Olsen, L., Kielland-Brandt, M. and Holmberg, S. (1999) Substrate specificityand gene expression of the amino acid permeases in Saccharomyces cerevisiae. Curr. Genet. 36, 317–328.
22. Helinck, S., Spinnler, H.E., Parayre, S. et al. (2000) Enzymatic versus spontaneous S-methyl thioestersynthesis in Geotrichum candidum. FEMS Microbiol. Lett. 193, 237–241.
23. Spinnler, H.E., Berger, C., Lapadatescu, C. and Bonnarme, P. (2001) Production of sulfur compoundsby several yeast of technological interest for cheese ripening. Int. Dairy J. 11, 245–252.
212 BREWING YEAST FERMENTATION PERFORMANCE
21 Control of Ester Synthesis During BreweryFermentation
J.-P. DUFOUR, Ph. MALCORPS and P. SILCOCK
Abstract The synthesis of volatile aliphatic esters by yeast has attracted considerable inter-est because of their potential contribution to aroma and flavour. In beer, the major estersare ethyl acetate, isobutyl acetate, isoamyl acetate, phenylethyl acetate and the C6–C10medium-chain fatty acid ethyl esters. The need to understand and control ester synthesisis driven by problems encountered in brewing procedures, such as the production of dis-proportionate amounts of ethyl acetate and isoamyl acetate during high-gravity brewing,the reduction of ester levels when using large-scale cylindroconical fermenters and thelack of flavour compounds of reduced alcohol beers. Technological parameters that affectthe production of esters can be divided into three categories: those related to yeast char-acteristics (strain, physiological state), those related to wort composition (aeration, lipids,zinc, free amino nitrogen, extract) and those related to fermentation conditions (temperature,pressure, fermenter design, fermentation method).
Ester synthesis during fermentation depends mainly on yeast ester synthesis potential,i.e. the amount of available acetyl-coenzyme A/acyl-coenzyme A (an essential buildingblock for yeast cellular components) and the level of ester synthase activities (the enzymesbeing synthesised during the growth phase).
Biochemical evidence suggests that at least five enzymes are involved in the synthesis ofesters within yeast. Ester-hydrolysing activities (esterases) may play a determining role inthe final beer ester levels of products such as membrane-filtered beer and bottle-refer-mented beer.
Recently, scientists have taken advantage of the completed Saccharomyces cerevisiaegenome sequence database and the powerful tools of molecular biology to identify the cor-responding genes and investigate the physiological role of ester synthesis. Recent rapidprogress has provided insights not only into the regulation of cellular ester synthesis, but alsointo some general mechanisms of gene regulation. Three distinct alcohol acetyltransferasegenes (ATF1, LgATF1 and ATF2), responsible for the production of acetate esters, have beencloned from different yeast backgrounds. A fourth gene, EHT1, described as an ethanolhexanoyltransferase, is involved in the synthesis of the medium-chain fatty acid esters.
21.1 Introduction
The synthesis of volatile aliphatic esters by yeast is of major industrial interest becausethe presence of these compounds determines the fruity aroma of fermented beverages.1
Esters represent the largest group of flavour compounds in alcoholic beverages. Inbeer, the major esters are ethyl acetate, isobutyl acetate, isoamyl acetate, phenylethylacetate and the C6–C10 medium-chain fatty acid (MCFA) ethyl esters (Table 21.1).
Because of the difference in ester flavour thresholds, it is more important to look atindividual beer ester levels than at the total beer ester level. Among these esters, onlyisoamyl acetate concentrations are above the threshold level in most lager beers(Table 21.1; see average level of isoamyl acetate). Isoamyl acetate is therefore considereda major contributor to beer fruitiness.
Brewing Yeast Fermentation Performance: Second edition
Edited by: KATHERINE SMART Copyright 0 Blackwell Science 2003
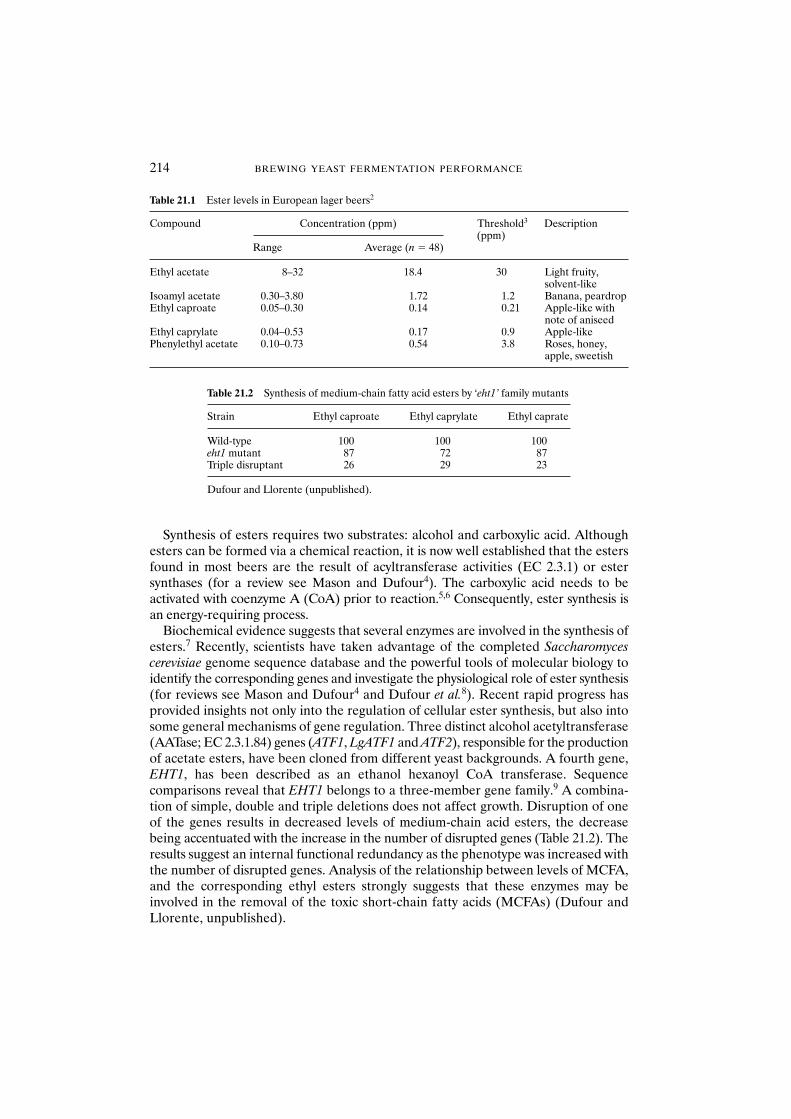
Synthesis of esters requires two substrates: alcohol and carboxylic acid. Althoughesters can be formed via a chemical reaction, it is now well established that the estersfound in most beers are the result of acyltransferase activities (EC 2.3.1) or estersynthases (for a review see Mason and Dufour4). The carboxylic acid needs to beactivated with coenzyme A (CoA) prior to reaction.5,6 Consequently, ester synthesis isan energy-requiring process.
Biochemical evidence suggests that several enzymes are involved in the synthesis ofesters.7 Recently, scientists have taken advantage of the completed Saccharomycescerevisiae genome sequence database and the powerful tools of molecular biology toidentify the corresponding genes and investigate the physiological role of ester synthesis(for reviews see Mason and Dufour4 and Dufour et al.8). Recent rapid progress hasprovided insights not only into the regulation of cellular ester synthesis, but also intosome general mechanisms of gene regulation. Three distinct alcohol acetyltransferase(AATase; EC 2.3.1.84) genes (ATF1, LgATF1 and ATF2), responsible for the productionof acetate esters, have been cloned from different yeast backgrounds. A fourth gene,EHT1, has been described as an ethanol hexanoyl CoA transferase. Sequencecomparisons reveal that EHT1 belongs to a three-member gene family.9 A combina-tion of simple, double and triple deletions does not affect growth. Disruption of oneof the genes results in decreased levels of medium-chain acid esters, the decreasebeing accentuated with the increase in the number of disrupted genes (Table 21.2). Theresults suggest an internal functional redundancy as the phenotype was increased withthe number of disrupted genes. Analysis of the relationship between levels of MCFA,and the corresponding ethyl esters strongly suggests that these enzymes may beinvolved in the removal of the toxic short-chain fatty acids (MCFAs) (Dufour andLlorente, unpublished).
214 BREWING YEAST FERMENTATION PERFORMANCE
Table 21.1 Ester levels in European lager beers2
Compound Concentration (ppm) Threshold3 Description
Range Average (n � 48)(ppm)
Ethyl acetate 8–32 18.4 30 Light fruity,solvent-like
Isoamyl acetate 0.30–3.80 1.72 1.2 Banana, peardropEthyl caproate 0.05–0.30 0.14 0.21 Apple-like with
note of aniseedEthyl caprylate 0.04–0.53 0.17 0.9 Apple-likePhenylethyl acetate 0.10–0.73 0.54 3.8 Roses, honey,
apple, sweetish
Table 21.2 Synthesis of medium-chain fatty acid esters by ‘eht1’ family mutants
Strain Ethyl caproate Ethyl caprylate Ethyl caprate
Wild-type 100 100 100eht1 mutant 87 72 87Triple disruptant 26 29 23
Dufour and Llorente (unpublished).
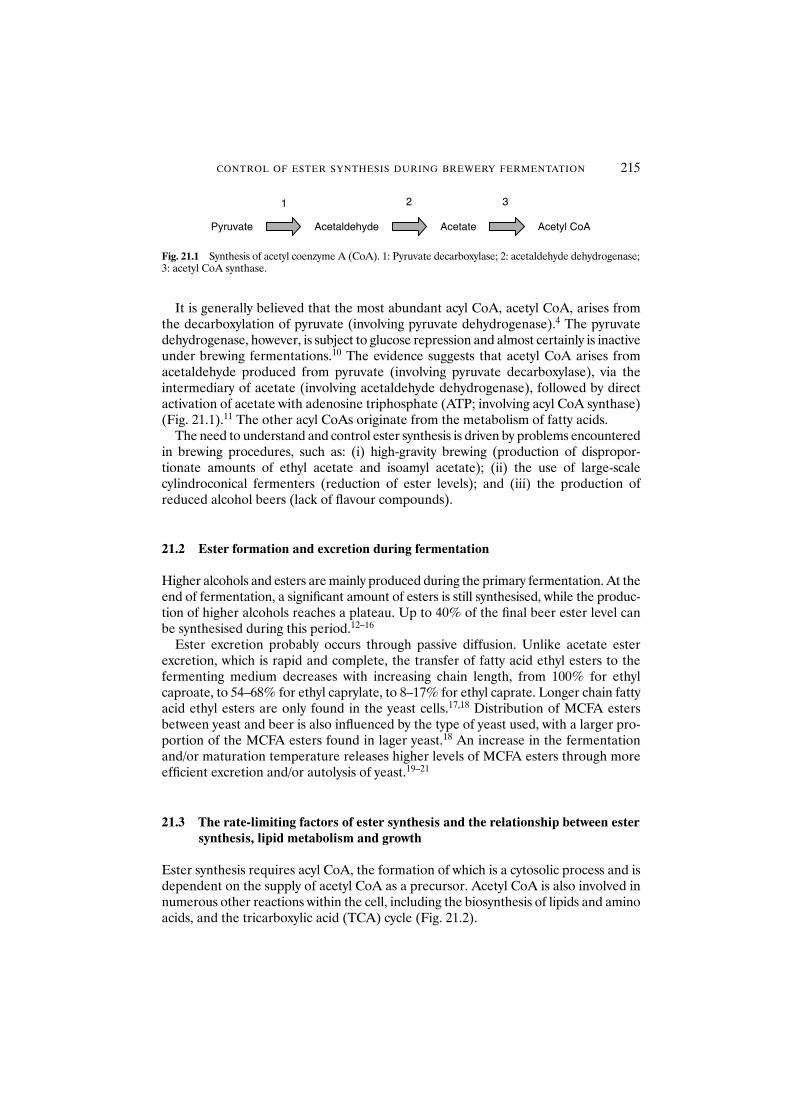
It is generally believed that the most abundant acyl CoA, acetyl CoA, arises fromthe decarboxylation of pyruvate (involving pyruvate dehydrogenase).4 The pyruvatedehydrogenase, however, is subject to glucose repression and almost certainly is inactiveunder brewing fermentations.10 The evidence suggests that acetyl CoA arises fromacetaldehyde produced from pyruvate (involving pyruvate decarboxylase), via theintermediary of acetate (involving acetaldehyde dehydrogenase), followed by directactivation of acetate with adenosine triphosphate (ATP; involving acyl CoA synthase)(Fig. 21.1).11 The other acyl CoAs originate from the metabolism of fatty acids.
The need to understand and control ester synthesis is driven by problems encounteredin brewing procedures, such as: (i) high-gravity brewing (production of dispropor-tionate amounts of ethyl acetate and isoamyl acetate); (ii) the use of large-scalecylindroconical fermenters (reduction of ester levels); and (iii) the production ofreduced alcohol beers (lack of flavour compounds).
21.2 Ester formation and excretion during fermentation
Higher alcohols and esters are mainly produced during the primary fermentation. At theend of fermentation, a significant amount of esters is still synthesised, while the produc-tion of higher alcohols reaches a plateau. Up to 40% of the final beer ester level canbe synthesised during this period.12–16
Ester excretion probably occurs through passive diffusion. Unlike acetate esterexcretion, which is rapid and complete, the transfer of fatty acid ethyl esters to thefermenting medium decreases with increasing chain length, from 100% for ethylcaproate, to 54–68% for ethyl caprylate, to 8–17% for ethyl caprate. Longer chain fattyacid ethyl esters are only found in the yeast cells.17,18 Distribution of MCFA estersbetween yeast and beer is also influenced by the type of yeast used, with a larger pro-portion of the MCFA esters found in lager yeast.18 An increase in the fermentationand/or maturation temperature releases higher levels of MCFA esters through moreefficient excretion and/or autolysis of yeast.19–21
21.3 The rate-limiting factors of ester synthesis and the relationship between estersynthesis, lipid metabolism and growth
Ester synthesis requires acyl CoA, the formation of which is a cytosolic process and isdependent on the supply of acetyl CoA as a precursor. Acetyl CoA is also involved innumerous other reactions within the cell, including the biosynthesis of lipids and aminoacids, and the tricarboxylic acid (TCA) cycle (Fig. 21.2).
CONTROL OF ESTER SYNTHESIS DURING BREWERY FERMENTATION 215
Acetaldehyde Acetate Acetyl CoA
1 2 3
Pyruvate
Fig. 21.1 Synthesis of acetyl coenzyme A (CoA). 1: Pyruvate decarboxylase; 2: acetaldehyde dehydrogenase;3: acetyl CoA synthase.
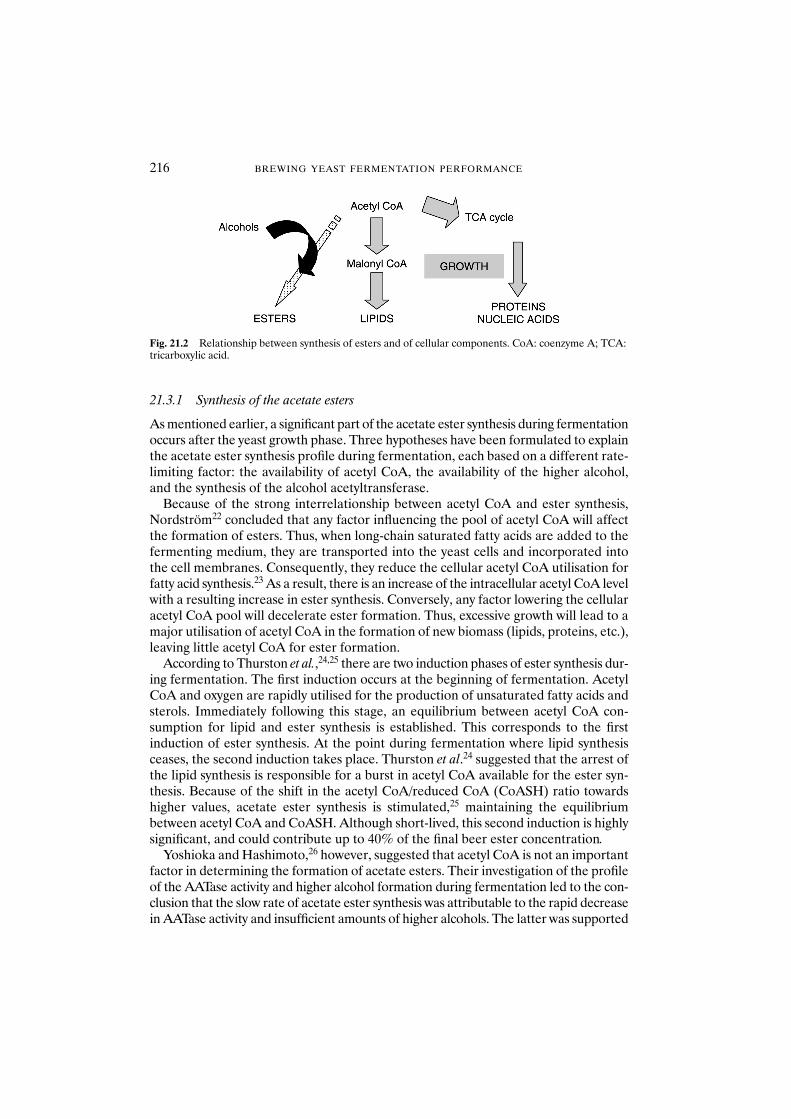
21.3.1 Synthesis of the acetate esters
As mentioned earlier, a significant part of the acetate ester synthesis during fermentationoccurs after the yeast growth phase. Three hypotheses have been formulated to explainthe acetate ester synthesis profile during fermentation, each based on a different rate-limiting factor: the availability of acetyl CoA, the availability of the higher alcohol,and the synthesis of the alcohol acetyltransferase.
Because of the strong interrelationship between acetyl CoA and ester synthesis,Nordström22 concluded that any factor influencing the pool of acetyl CoA will affectthe formation of esters. Thus, when long-chain saturated fatty acids are added to thefermenting medium, they are transported into the yeast cells and incorporated intothe cell membranes. Consequently, they reduce the cellular acetyl CoA utilisation forfatty acid synthesis.23 As a result, there is an increase of the intracellular acetyl CoA levelwith a resulting increase in ester synthesis. Conversely, any factor lowering the cellularacetyl CoA pool will decelerate ester formation. Thus, excessive growth will lead to amajor utilisation of acetyl CoA in the formation of new biomass (lipids, proteins, etc.),leaving little acetyl CoA for ester formation.
According to Thurston et al.,24,25 there are two induction phases of ester synthesis dur-ing fermentation. The first induction occurs at the beginning of fermentation. AcetylCoA and oxygen are rapidly utilised for the production of unsaturated fatty acids andsterols. Immediately following this stage, an equilibrium between acetyl CoA con-sumption for lipid and ester synthesis is established. This corresponds to the firstinduction of ester synthesis. At the point during fermentation where lipid synthesisceases, the second induction takes place. Thurston et al.24 suggested that the arrest ofthe lipid synthesis is responsible for a burst in acetyl CoA available for the ester syn-thesis. Because of the shift in the acetyl CoA/reduced CoA (CoASH) ratio towardshigher values, acetate ester synthesis is stimulated,25 maintaining the equilibriumbetween acetyl CoA and CoASH. Although short-lived, this second induction is highlysignificant, and could contribute up to 40% of the final beer ester concentration.
Yoshioka and Hashimoto,26 however, suggested that acetyl CoA is not an importantfactor in determining the formation of acetate esters. Their investigation of the profileof the AATase activity and higher alcohol formation during fermentation led to the con-clusion that the slow rate of acetate ester synthesis was attributable to the rapid decreasein AATase activity and insufficient amounts of higher alcohols. The latter was supported
216 BREWING YEAST FERMENTATION PERFORMANCE
Fig. 21.2 Relationship between synthesis of esters and of cellular components. CoA: coenzyme A; TCA:tricarboxylic acid.
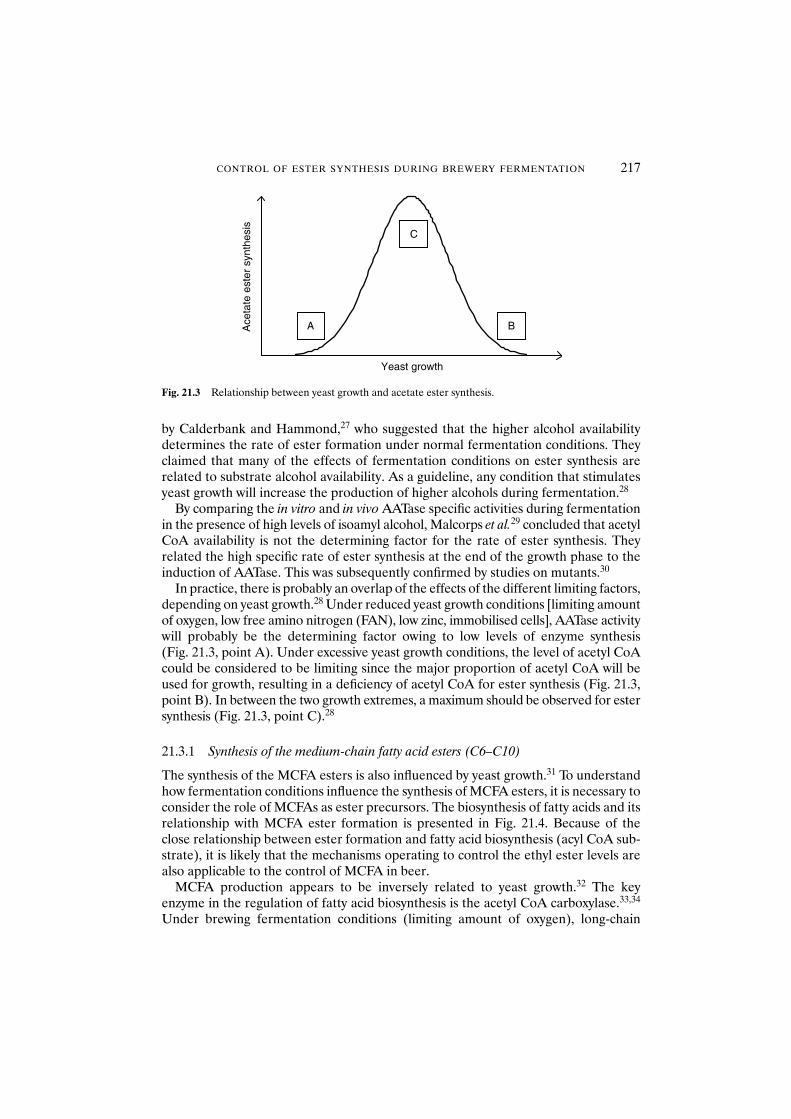
by Calderbank and Hammond,27 who suggested that the higher alcohol availabilitydetermines the rate of ester formation under normal fermentation conditions. Theyclaimed that many of the effects of fermentation conditions on ester synthesis arerelated to substrate alcohol availability. As a guideline, any condition that stimulatesyeast growth will increase the production of higher alcohols during fermentation.28
By comparing the in vitro and in vivo AATase specific activities during fermentationin the presence of high levels of isoamyl alcohol, Malcorps et al.29 concluded that acetylCoA availability is not the determining factor for the rate of ester synthesis. Theyrelated the high specific rate of ester synthesis at the end of the growth phase to theinduction of AATase. This was subsequently confirmed by studies on mutants.30
In practice, there is probably an overlap of the effects of the different limiting factors,depending on yeast growth.28 Under reduced yeast growth conditions [limiting amountof oxygen, low free amino nitrogen (FAN), low zinc, immobilised cells], AATase activitywill probably be the determining factor owing to low levels of enzyme synthesis (Fig. 21.3, point A). Under excessive yeast growth conditions, the level of acetyl CoAcould be considered to be limiting since the major proportion of acetyl CoA will beused for growth, resulting in a deficiency of acetyl CoA for ester synthesis (Fig. 21.3,point B). In between the two growth extremes, a maximum should be observed for estersynthesis (Fig. 21.3, point C).28
21.3.1 Synthesis of the medium-chain fatty acid esters (C6–C10)
The synthesis of the MCFA esters is also influenced by yeast growth.31 To understandhow fermentation conditions influence the synthesis of MCFA esters, it is necessary toconsider the role of MCFAs as ester precursors. The biosynthesis of fatty acids and itsrelationship with MCFA ester formation is presented in Fig. 21.4. Because of theclose relationship between ester formation and fatty acid biosynthesis (acyl CoA sub-strate), it is likely that the mechanisms operating to control the ethyl ester levels arealso applicable to the control of MCFA in beer.
MCFA production appears to be inversely related to yeast growth.32 The keyenzyme in the regulation of fatty acid biosynthesis is the acetyl CoA carboxylase.33,34
Under brewing fermentation conditions (limiting amount of oxygen), long-chain
CONTROL OF ESTER SYNTHESIS DURING BREWERY FERMENTATION 217
Yeast growth
Ace
tate
est
er s
ynth
esis
A
C
B
Fig. 21.3 Relationship between yeast growth and acetate ester synthesis.
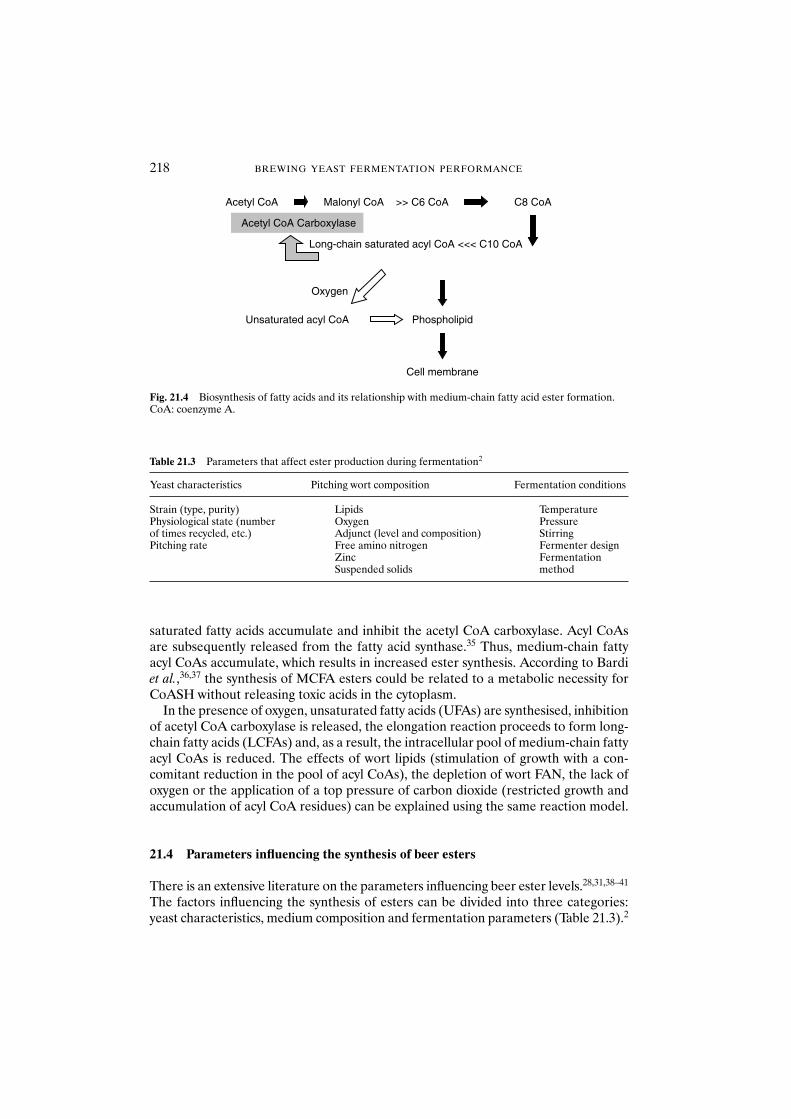
saturated fatty acids accumulate and inhibit the acetyl CoA carboxylase. Acyl CoAsare subsequently released from the fatty acid synthase.35 Thus, medium-chain fattyacyl CoAs accumulate, which results in increased ester synthesis. According to Bardi et al.,36,37 the synthesis of MCFA esters could be related to a metabolic necessity forCoASH without releasing toxic acids in the cytoplasm.
In the presence of oxygen, unsaturated fatty acids (UFAs) are synthesised, inhibitionof acetyl CoA carboxylase is released, the elongation reaction proceeds to form long-chain fatty acids (LCFAs) and, as a result, the intracellular pool of medium-chain fattyacyl CoAs is reduced. The effects of wort lipids (stimulation of growth with a con-comitant reduction in the pool of acyl CoAs), the depletion of wort FAN, the lack ofoxygen or the application of a top pressure of carbon dioxide (restricted growth andaccumulation of acyl CoA residues) can be explained using the same reaction model.
21.4 Parameters influencing the synthesis of beer esters
There is an extensive literature on the parameters influencing beer ester levels.28,31,38–41
The factors influencing the synthesis of esters can be divided into three categories:yeast characteristics, medium composition and fermentation parameters (Table 21.3).2
218 BREWING YEAST FERMENTATION PERFORMANCE
Acetyl CoA Malonyl CoA >> C6 CoA C8 CoA
Long-chain saturated acyl CoA <<< C10 CoA
Acetyl CoA Carboxylase
Phospholipid
Cell membrane
Unsaturated acyl CoA
Oxygen
Fig. 21.4 Biosynthesis of fatty acids and its relationship with medium-chain fatty acid ester formation.CoA: coenzyme A.
Table 21.3 Parameters that affect ester production during fermentation2
Yeast characteristics Pitching wort composition Fermentation conditions
Strain (type, purity) Lipids TemperaturePhysiological state (number Oxygen Pressureof times recycled, etc.) Adjunct (level and composition) StirringPitching rate Free amino nitrogen Fermenter design
Zinc FermentationSuspended solids method
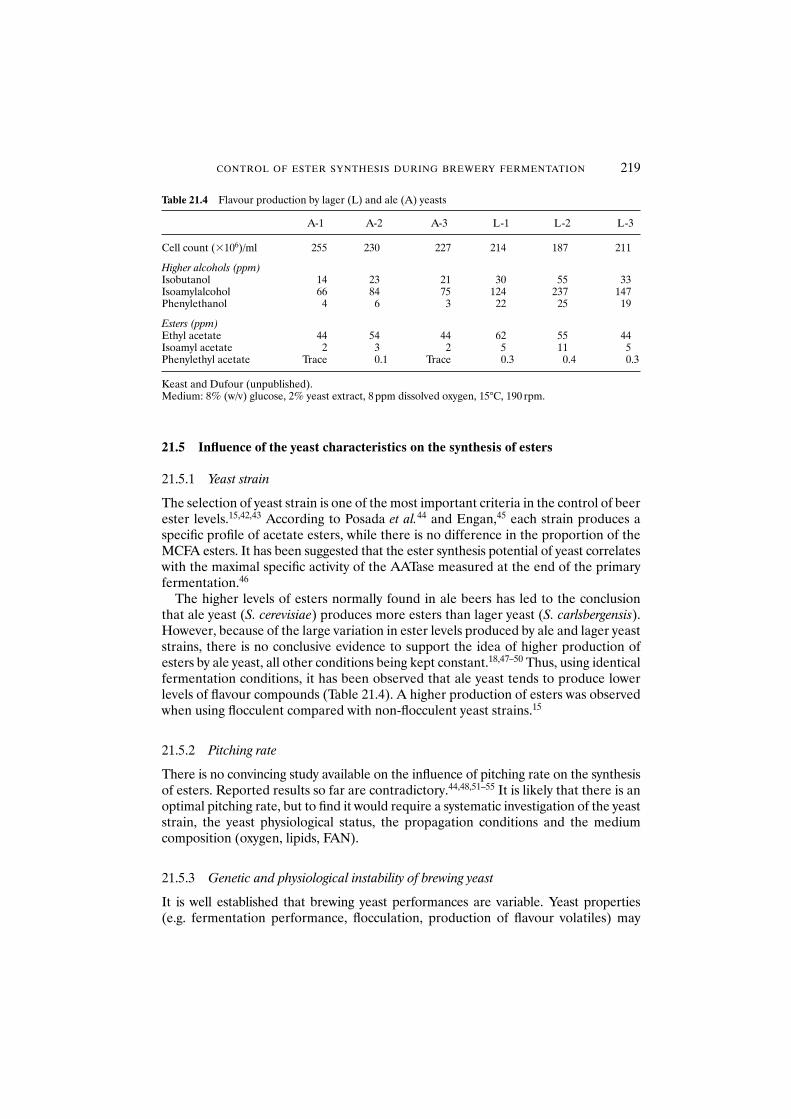
21.5 Influence of the yeast characteristics on the synthesis of esters
21.5.1 Yeast strain
The selection of yeast strain is one of the most important criteria in the control of beerester levels.15,42,43 According to Posada et al.44 and Engan,45 each strain produces aspecific profile of acetate esters, while there is no difference in the proportion of theMCFA esters. It has been suggested that the ester synthesis potential of yeast correlateswith the maximal specific activity of the AATase measured at the end of the primaryfermentation.46
The higher levels of esters normally found in ale beers has led to the conclusionthat ale yeast (S. cerevisiae) produces more esters than lager yeast (S. carlsbergensis).However, because of the large variation in ester levels produced by ale and lager yeaststrains, there is no conclusive evidence to support the idea of higher production ofesters by ale yeast, all other conditions being kept constant.18,47–50 Thus, using identicalfermentation conditions, it has been observed that ale yeast tends to produce lowerlevels of flavour compounds (Table 21.4). A higher production of esters was observedwhen using flocculent compared with non-flocculent yeast strains.15
21.5.2 Pitching rate
There is no convincing study available on the influence of pitching rate on the synthesisof esters. Reported results so far are contradictory.44,48,51–55 It is likely that there is anoptimal pitching rate, but to find it would require a systematic investigation of the yeaststrain, the yeast physiological status, the propagation conditions and the mediumcomposition (oxygen, lipids, FAN).
21.5.3 Genetic and physiological instability of brewing yeast
It is well established that brewing yeast performances are variable. Yeast properties (e.g. fermentation performance, flocculation, production of flavour volatiles) may
CONTROL OF ESTER SYNTHESIS DURING BREWERY FERMENTATION 219
Table 21.4 Flavour production by lager (L) and ale (A) yeasts
A-1 A-2 A-3 L-1 L-2 L-3
Cell count (�106)/ml 255 230 227 214 187 211
Higher alcohols (ppm)Isobutanol 14 23 21 30 55 33Isoamylalcohol 66 84 75 124 237 147Phenylethanol 4 6 3 22 25 19
Esters (ppm)Ethyl acetate 44 54 44 62 55 44Isoamyl acetate 2 3 2 5 11 5Phenylethyl acetate Trace 0.1 Trace 0.3 0.4 0.3
Keast and Dufour (unpublished).Medium: 8% (w/v) glucose, 2% yeast extract, 8 ppm dissolved oxygen, 15°C, 190 rpm.
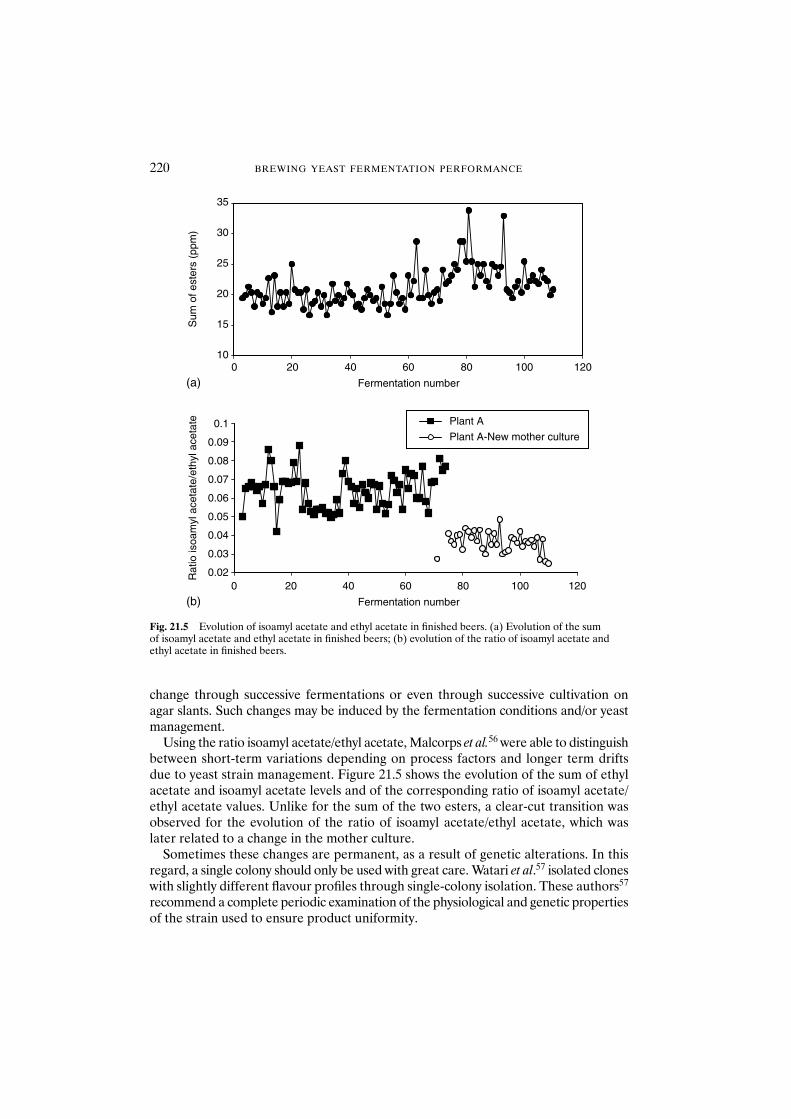
change through successive fermentations or even through successive cultivation onagar slants. Such changes may be induced by the fermentation conditions and/or yeastmanagement.
Using the ratio isoamyl acetate/ethyl acetate, Malcorps et al.56 were able to distinguishbetween short-term variations depending on process factors and longer term driftsdue to yeast strain management. Figure 21.5 shows the evolution of the sum of ethylacetate and isoamyl acetate levels and of the corresponding ratio of isoamyl acetate/ethyl acetate values. Unlike for the sum of the two esters, a clear-cut transition wasobserved for the evolution of the ratio of isoamyl acetate/ethyl acetate, which waslater related to a change in the mother culture.
Sometimes these changes are permanent, as a result of genetic alterations. In thisregard, a single colony should only be used with great care. Watari et al.57 isolated cloneswith slightly different flavour profiles through single-colony isolation. These authors57
recommend a complete periodic examination of the physiological and genetic propertiesof the strain used to ensure product uniformity.
220 BREWING YEAST FERMENTATION PERFORMANCE
10
15
20
25
30
35
0 60 804020 100 120
Fermentation number
0 60 804020 100 120
Fermentation number
Sum
of e
ster
s (p
pm)
0.02
0.03
0.04
0.05
0.06
0.07
0.08
0.09
0.1 Plant A
Plant A-New mother culture
Rat
io is
oam
yl a
ceta
te/e
thyl
ace
tate
(a)
(b)
Fig. 21.5 Evolution of isoamyl acetate and ethyl acetate in finished beers. (a) Evolution of the sum of isoamyl acetate and ethyl acetate in finished beers; (b) evolution of the ratio of isoamyl acetate andethyl acetate in finished beers.
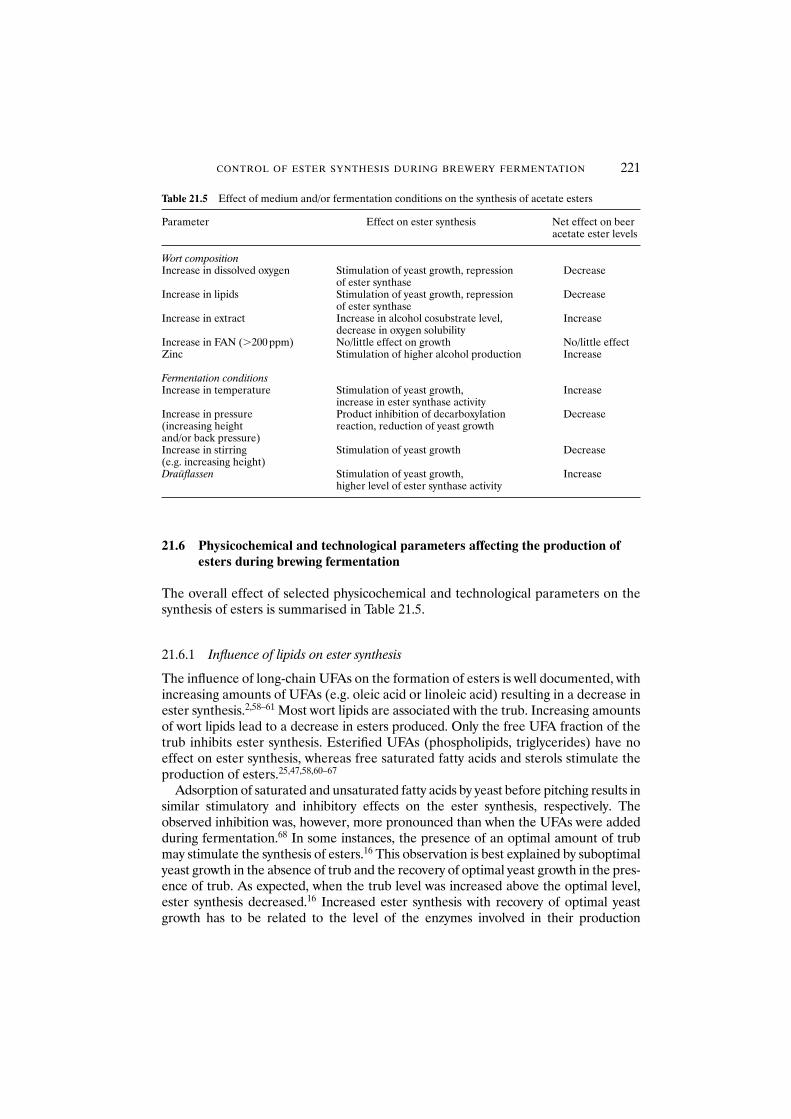
21.6 Physicochemical and technological parameters affecting the production ofesters during brewing fermentation
The overall effect of selected physicochemical and technological parameters on thesynthesis of esters is summarised in Table 21.5.
21.6.1 Influence of lipids on ester synthesis
The influence of long-chain UFAs on the formation of esters is well documented, withincreasing amounts of UFAs (e.g. oleic acid or linoleic acid) resulting in a decrease inester synthesis.2,58–61 Most wort lipids are associated with the trub. Increasing amountsof wort lipids lead to a decrease in esters produced. Only the free UFA fraction of thetrub inhibits ester synthesis. Esterified UFAs (phospholipids, triglycerides) have noeffect on ester synthesis, whereas free saturated fatty acids and sterols stimulate theproduction of esters.25,47,58,60–67
Adsorption of saturated and unsaturated fatty acids by yeast before pitching results insimilar stimulatory and inhibitory effects on the ester synthesis, respectively. Theobserved inhibition was, however, more pronounced than when the UFAs were addedduring fermentation.68 In some instances, the presence of an optimal amount of trubmay stimulate the synthesis of esters.16 This observation is best explained by suboptimalyeast growth in the absence of trub and the recovery of optimal yeast growth in the pres-ence of trub. As expected, when the trub level was increased above the optimal level,ester synthesis decreased.16 Increased ester synthesis with recovery of optimal yeastgrowth has to be related to the level of the enzymes involved in their production
CONTROL OF ESTER SYNTHESIS DURING BREWERY FERMENTATION 221
Table 21.5 Effect of medium and/or fermentation conditions on the synthesis of acetate esters
Parameter Effect on ester synthesis Net effect on beer acetate ester levels
Wort compositionIncrease in dissolved oxygen Stimulation of yeast growth, repression Decrease
of ester synthaseIncrease in lipids Stimulation of yeast growth, repression Decrease
of ester synthaseIncrease in extract Increase in alcohol cosubstrate level, Increase
decrease in oxygen solubilityIncrease in FAN (�200 ppm) No/little effect on growth No/little effectZinc Stimulation of higher alcohol production Increase
Fermentation conditionsIncrease in temperature Stimulation of yeast growth, Increase
increase in ester synthase activityIncrease in pressure Product inhibition of decarboxylation Decrease(increasing height reaction, reduction of yeast growthand/or back pressure)Increase in stirring Stimulation of yeast growth Decrease(e.g. increasing height)Draüflassen Stimulation of yeast growth, Increase
higher level of ester synthase activity
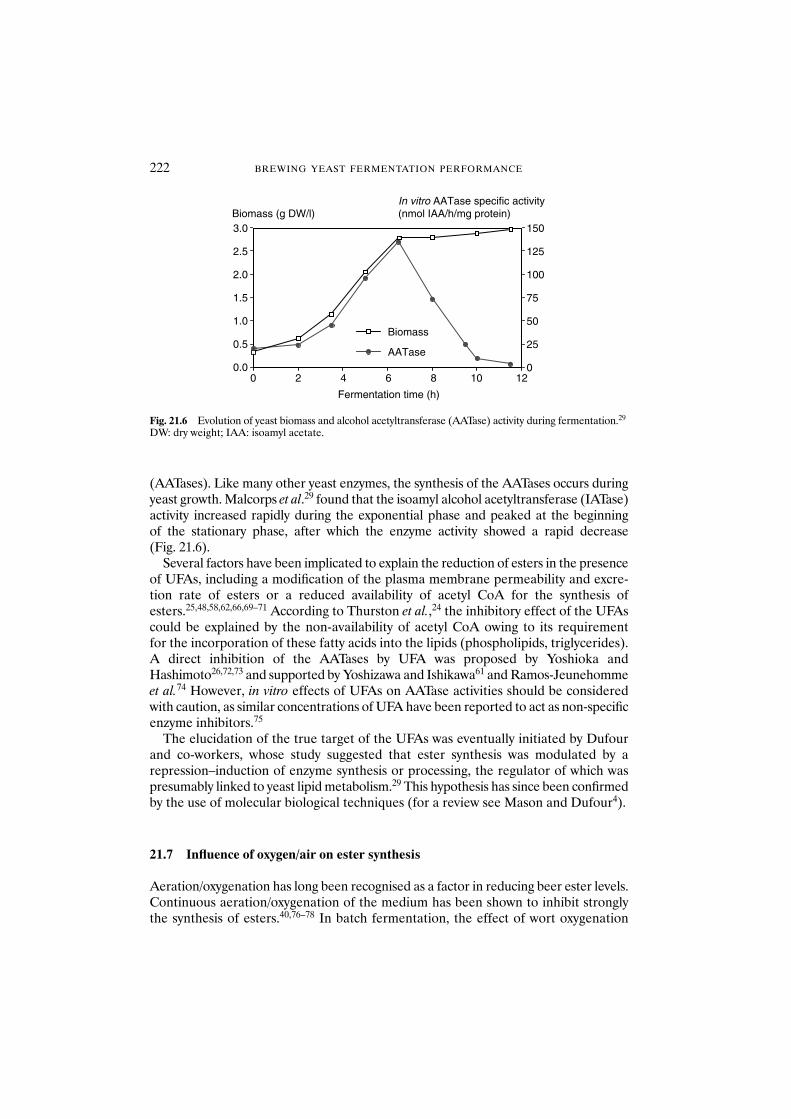
(AATases). Like many other yeast enzymes, the synthesis of the AATases occurs duringyeast growth. Malcorps et al.29 found that the isoamyl alcohol acetyltransferase (IATase)activity increased rapidly during the exponential phase and peaked at the beginning of the stationary phase, after which the enzyme activity showed a rapid decrease (Fig. 21.6).
Several factors have been implicated to explain the reduction of esters in the presenceof UFAs, including a modification of the plasma membrane permeability and excre-tion rate of esters or a reduced availability of acetyl CoA for the synthesis ofesters.25,48,58,62,66,69–71 According to Thurston et al.,24 the inhibitory effect of the UFAscould be explained by the non-availability of acetyl CoA owing to its requirement for the incorporation of these fatty acids into the lipids (phospholipids, triglycerides).A direct inhibition of the AATases by UFA was proposed by Yoshioka andHashimoto26,72,73 and supported by Yoshizawa and Ishikawa61 and Ramos-Jeunehommeet al.74 However, in vitro effects of UFAs on AATase activities should be consideredwith caution, as similar concentrations of UFA have been reported to act as non-specificenzyme inhibitors.75
The elucidation of the true target of the UFAs was eventually initiated by Dufourand co-workers, whose study suggested that ester synthesis was modulated by arepression–induction of enzyme synthesis or processing, the regulator of which waspresumably linked to yeast lipid metabolism.29 This hypothesis has since been confirmedby the use of molecular biological techniques (for a review see Mason and Dufour4).
21.7 Influence of oxygen/air on ester synthesis
Aeration/oxygenation has long been recognised as a factor in reducing beer ester levels.Continuous aeration/oxygenation of the medium has been shown to inhibit stronglythe synthesis of esters.40,76–78 In batch fermentation, the effect of wort oxygenation
222 BREWING YEAST FERMENTATION PERFORMANCE
0
25
50
75
100
125
150
In vitro AATase specific activity(nmol IAA/h/mg protein)
0.0
0.5
1.0
1.5
2.0
2.5
3.0Biomass (g DW/l)
0 2 4 6 8 10 12
Fermentation time (h)
AATase
Biomass
Fig. 21.6 Evolution of yeast biomass and alcohol acetyltransferase (AATase) activity during fermentation.29
DW: dry weight; IAA: isoamyl acetate.
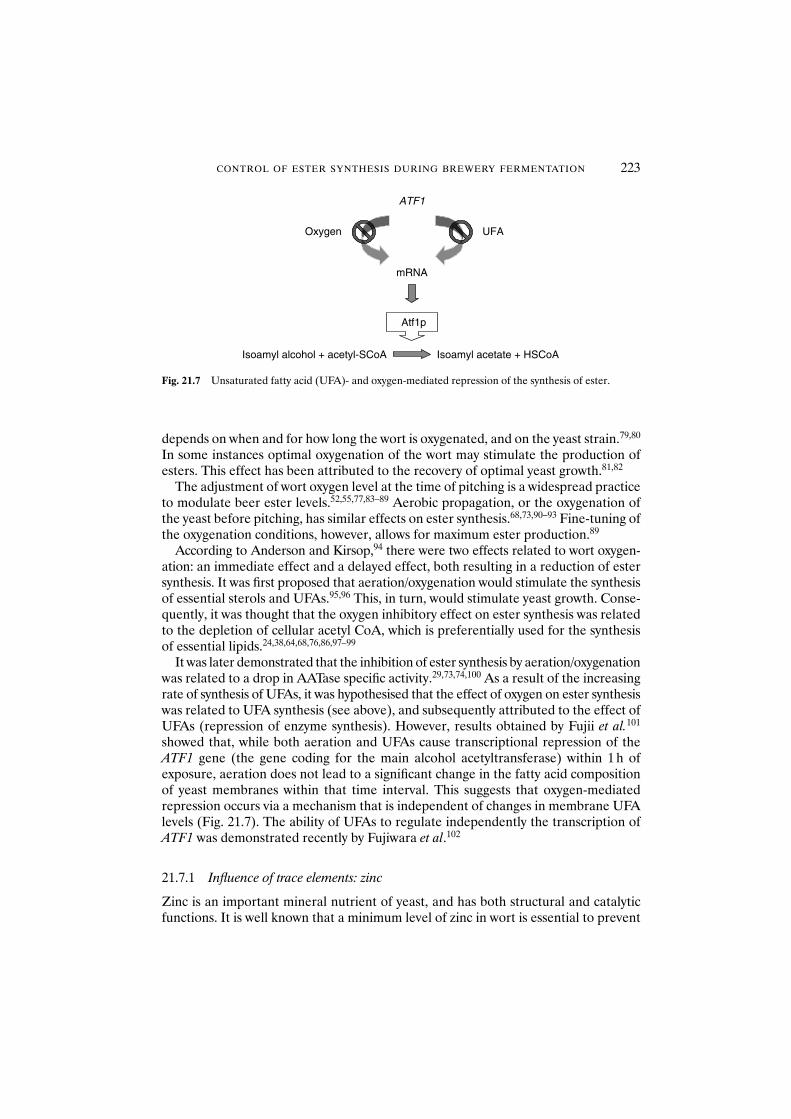
depends on when and for how long the wort is oxygenated, and on the yeast strain.79,80
In some instances optimal oxygenation of the wort may stimulate the production ofesters. This effect has been attributed to the recovery of optimal yeast growth.81,82
The adjustment of wort oxygen level at the time of pitching is a widespread practiceto modulate beer ester levels.52,55,77,83–89 Aerobic propagation, or the oxygenation ofthe yeast before pitching, has similar effects on ester synthesis.68,73,90–93 Fine-tuning ofthe oxygenation conditions, however, allows for maximum ester production.89
According to Anderson and Kirsop,94 there were two effects related to wort oxygen-ation: an immediate effect and a delayed effect, both resulting in a reduction of estersynthesis. It was first proposed that aeration/oxygenation would stimulate the synthesisof essential sterols and UFAs.95,96 This, in turn, would stimulate yeast growth. Conse-quently, it was thought that the oxygen inhibitory effect on ester synthesis was relatedto the depletion of cellular acetyl CoA, which is preferentially used for the synthesisof essential lipids.24,38,64,68,76,86,97–99
It was later demonstrated that the inhibition of ester synthesis by aeration/oxygenationwas related to a drop in AATase specific activity.29,73,74,100 As a result of the increasingrate of synthesis of UFAs, it was hypothesised that the effect of oxygen on ester synthesiswas related to UFA synthesis (see above), and subsequently attributed to the effect ofUFAs (repression of enzyme synthesis). However, results obtained by Fujii et al.101
showed that, while both aeration and UFAs cause transcriptional repression of theATF1 gene (the gene coding for the main alcohol acetyltransferase) within 1 h ofexposure, aeration does not lead to a significant change in the fatty acid compositionof yeast membranes within that time interval. This suggests that oxygen-mediatedrepression occurs via a mechanism that is independent of changes in membrane UFAlevels (Fig. 21.7). The ability of UFAs to regulate independently the transcription ofATF1 was demonstrated recently by Fujiwara et al.102
21.7.1 Influence of trace elements: zinc
Zinc is an important mineral nutrient of yeast, and has both structural and catalyticfunctions. It is well known that a minimum level of zinc in wort is essential to prevent
CONTROL OF ESTER SYNTHESIS DURING BREWERY FERMENTATION 223
Oxygen UFA
Isoamyl alcohol + acetyl-SCoA Isoamyl acetate + HSCoA
Atf1p
mRNA
ATF1
Fig. 21.7 Unsaturated fatty acid (UFA)- and oxygen-mediated repression of the synthesis of ester.
sluggish fermentations. Zinc also stimulates the production of higher alcohols and theircorresponding esters.39,103 Seaton et al.39 showed that the main mechanism by whichzinc enhances the synthesis of the higher alcohols and related esters is by stimulatingthe breakdown of �-keto acids to their corresponding higher alcohols.
21.8 Influence of fermentation conditions
21.8.1 Stirring
Stirring of the medium stimulates yeast growth as it increases access to nutrients anddecreases the supsaturation of carbon dioxide. Because of the stimulation of yeastgrowth, the synthesis of higher alcohols is stimulated, whereas the opposite is observedfor the synthesis of esters. Consequently, the beer has a less fruity aroma.62,104,105
According to Anderson et al.,79 stirring of normal-gravity wort and high-gravity wortdecreased and increased the beer ester levels, respectively. It is of note that thesestudies were performed on a laboratory scale. It can be expected that the impact of stir-ring in laboratory-scale and industrial fermenters will be quite different. In laboratory-and pilot-scale fermenters, the dimensions of the fermenters favour the dissolution of the oxygen present in the headspace into the medium.29,51,52,63 This is most likelythe reason for higher ester production during static fermentation in a tubular EBCfermenter.58
21.8.2 Effect of carbon dioxide pressure
The increase in the hydrostatic pressure in the fermenter inhibits yeast growth andreduces the synthesis of esters, following an increase of dissolved carbon dioxide in thefermenting medium.52,106–112 The observed effects can be explained by feedback inhib-ition of the enzymic decarboxylation of pyruvate (acetyl CoA precursor) and the dropin intracellular pH. The increase in carbon dioxide pressure will thus give beer of lessfruity character.106,109,110,113 Increasing carbon dioxide pressure in the early stage ofthe stationary phase of growth inhibits ester synthesis, but has little effect on the syn-thesis of higher alcohols.114 This is in agreement with the observation that most of thehigher alcohols are produced during the exponential phase of growth. Renger et al.110
showed that the synthesis of esters was reduced more than the synthesis of higheralcohols when increasing the pressure of carbon dioxide. Such a result is to be expected,as the synthesis of esters is doubly affected by a reduction in both acetyl CoA andhigher alcohols. Unlike the synthesis of acetate esters, the synthesis of MCFA esters isstimulated under conditions of high carbon dioxide pressure.19,40 This can be explainedby the accumulation of medium-chain acyl CoA intermediates, the precursors of MCFAesters (see above).
21.8.3 Fermentation in cylindroconical fermenters
The shape and size of the fermenters have a great impact on the synthesis of higheralcohols and esters. Large cylindroconical tanks can reach 25 m in height, compared
224 BREWING YEAST FERMENTATION PERFORMANCE
with less than 3 m for traditional fermentation vessels. Vrieling115 showed that therewas a decreasing linear relationship between the beer ester level and the logarithm ofthe liquid height in the fermenter. Factors responsible for this observation include theincrease of dissolved carbon dioxide with increasing hydrostatic pressure and theincreased stirring favoured by the design of this fermentation vessel.44,52,115,116 Large-capacity fermenters have been successfully used to reduce the excess production ofesters during fermentation of high-gravity wort.86 For the production of a typical lagerbeer, a ratio of height to diameter of 2 is recommended to minimise the negativeeffect of the cylindroconical tank on beer ester levels.117,118 The duration and methodof filling of large fermenters influence the rate of fermentation and the synthesis of volatiles.89,119–121 For example, successive additions of wort during the course offermentation (Draüflassen), can have a positive effect on the production of esters,especially if the added wort is not or only minimally aerated.29,42,45,53,64 Data fromMalcorps et al.29 suggest that such practice extends the duration of the yeast growthphase and contributes to a higher AATase activity and consequently higher productionof esters.
21.8.4 Continuous fermentation and maturation
Continuous fermentation in closed or open homogeneous systems produces an excessiveamount of esters owing to the high cell density and the high level of higher alcohols inthe medium.83,122 The use of heterogeneous systems prevents the build-up of excessesters by establishing a fermentation gradient which allows the yeast to be in a physio-logical state very similar to that of the batch fermentation system.123–129 The use ofimmobilised yeast reactors for primary fermentation gives variable amounts of esters,depending on the type of systems used and the operating conditions. Ethyl acetateand isoamyl acetate levels ranged from 7.5 to 33.3 ppm and from 0.02 to 2.8 ppm,respectively.40,130–137 The immobilisation procedure, the oxygenation of the wort andthe conditioning of the yeast before its immobilisation are the main factors to con-sider for the optimisation of the synthesis of esters.29,40,76–78,138,139
A two-stage bioreactor system, made of a continuously stirred tank and a packedbed reactor, for rapid main fermentation has been trialled to achieve a similar flavourbalance to a conventional beer.136 Although the beer flavour was similar to that pro-duced using a conventional system, the operational stability could not be maintainedover a 6 month period. Similarly, a two-stage packed bed system, used for primaryfermentation by Kronlöf et al.,137 gave a balanced flavour over a period of severalweeks.
Hydrolysis of the esters has been observed during maturation using an immobilisedyeast reactor. Isoamyl acetate was found to be more susceptible than ethyl acetate to hydrolysis.132,140–142 Evidence suggests that yeast esterase activity was probablyresponsible for the observed hydrolysis.143 A better understanding of the role of oper-ational parameters has apparently solved the problem. Lager beer maturation usingan immobilised yeast fermenter system has now been applied successfully on an indus-trial scale for over 10 years.144,145 Comparison of beer flavour profiles has not revealedany significant difference between batch and continuous maturation using immobil-ised yeast.
CONTROL OF ESTER SYNTHESIS DURING BREWERY FERMENTATION 225
Immobilised systems are also in use for the production of alcohol-free beer. So far,the reduction of the unpleasant worty aroma is the main improvement to the flavour.The formation of pleasant aromas such as esters remains very limited.146,147
21.8.5 Temperature
The fermentation temperature will affect the amount and profile of the esters, withmost esters increasing in concentration at higher temperatures.19,42,52,55,113,148,149
Engan and Aubert149 showed that acetate esters increased with temperature butMCFA esters were not affected. It is likely that the increase in acetate ester levels isrelated to the stimulation of synthesis of higher alcohols (stimulation of yeast growth)as well as stimulation of the AATases. Stimulation of yeast growth at higher temperatureswill prevent any accumulation of acyl CoA and thus will not result in any increase ofthe MCFA esters. Increasing the temperature at the end of fermentation can be expectedto give a more fruity beer. Unlike higher alcohols, a significant proportion of theesters is still synthesised during that period and any stimulation of the AATase activitieswill further increase their production.
21.9 Contribution of esterase activities to beer ester levels
Although considerable research has been carried out on the synthesis of esters, littlework has been reported on the hydrolysis of esters. In recent years, there has beengrowing interest in the esterase activities of yeast with the introduction of membranebeer filtration. The increased popularity of high-gravity brewing has also stimulatedinterest in techniques suitable for reducing the overproduction of esters associatedwith these beers. The appropriate breakdown of the excess esters catalysed by a con-trolled esterase reaction could be an attractive method.
The presence of esterase activity (carboxylic acid hydrolase EC 3.1.1.1) in yeast iswell established,150 although the physiological role of these enzymes is still unknown.Different yeasts contain varying numbers of esterase isoenzymes, the enzyme activitiesbeing distributed between the inside and outside of the cell membrane.151 Wohrmannand Lang152 identified the four loci (EST1–4) in which the genes coding for theesterase isoenzymes in wine yeast are located. Laboratory strains of S. cerevisiae haveonly two esterase loci, EST1 and EST2.152 EST1 and EST2 were also detected in sakeyeast using native polyacrylamide gel eletrophoresis and the diazo-staining method.153,154
Using est2 mutants, Fukuda et al.155,156 demonstrated that the EST2 (renamed IAH-1)gene product played a crucial role in the hydrolysis of isoamyl acetate in sake mash.Their study on the amount of isoamyl acetate in the sake as a function of the ratio ofAATase/Iah1p esterase activity led to the conclusion that the balance of these twoenzyme activities was important for isoamyl acetate accumulation in the sake mash.157
As mentioned earlier, evidence suggested that yeast esterase activity was probablyresponsible for the observed hydrolysis of acetate esters during the maturation usingan immobilised yeast reactor.143 Ester hydrolysis was also noticed for beer from thebottom of maturation tank.158 The contribution of brewing yeast esterase enzymes to thefinal beer ester levels of top-fermented beers was investigated by Neven.159,160 During
226 BREWING YEAST FERMENTATION PERFORMANCE
fermentation and lagering, ester-hydrolysing enzyme activities are released into thebeer and remain active in the finished, non-pasteurised product. Although the beerpH is well below the optimum pH (7.5) for the esterase activities, the residual activitysignificantly affects the levels of isoamyl acetate and ethyl caproate during the storageof beer. Evidence also suggested that yeast autolysis was not a prerequisite for therelease of esterases into the beer.159,160 Under identical culture conditions, the totalesterase level was found to be similar between ale and lager yeast strains. There were,however, significant differences in esterase activities between yeast strains within eachgroup (ale or lager yeast strains).161 In the light of these observations, further studiesmust be conducted to clarify the role of the esterase activities on beer ester levels, espe-cially when considering the use of a membrane for beer filtration.
Some yeasts can synthesise esters using the reverse reaction of esterase in the absenceof acetyl CoA.21 In Hansenula yeasts, potent producers of esters, esterases have beenreported to play a crucial role in the synthesis of isoamyl acetate.162 Investigation ofthe expression patterns of esterases in H. mrakii revealed the existence of one esterasein log-phase cells but several esterases when the cells entered the stationary phase,with a concomitant increase in the isoamyl acetate-hydrolysing activity.163 They sug-gested that in the yeast Hansenula, both synthesising and hydrolysing esterase activitiescould coexist, their expressions varying depending on the growth phase and the tem-perature.
Yeasts of the genus Brettanomyces also show esterase activity towards a large numberof esters. Such activities have been identified in the production of esters (ethyl acetateand ethyl lactate) of special beers (Lambic, Geuze) and the hydrolysis of isoamyl acetateby Spaeten and Verachtert.164
Schermers et al.165 found a positive correlation between the reverse esterase activityof brewing yeasts and the beer ester level, suggesting a role for esterase in the formationof esters by brewing yeast. The role of reverse esterase activity during brewery fermenta-tion, however, has still to be demonstrated.
21.10 Conclusions
The final levels of esters in beer are primarily determined during the fermentation. Themain limiting factors are the level of higher alcohols and the ester-synthesising potentialof the yeast. The latter is strongly influenced by the yeast strain and the fermentationconditions. It is easier to limit the production of esters than to increase the formationof esters without affecting the other flavour compounds too much. The fermentation ofhigh-gravity wort, the use of higher fermentation temperatures and the Draüflassentechnique are very efficient ways to stimulate the production of esters. The aerationof wort and/or the use of turbid wort inhibit the production of esters. A proper balancebetween the aeration of yeast before pitching and the supply of oxygen to the wort couldbe an attractive alternative to fulfil the yeast requirement for oxygen while providingmeans to control the beer flavour more effectively. The synthesis of esters is also inhib-ited when using a large cylindroconical tank. The application of a carbon dioxide over-pressure inhibits the formation of acetate esters, whereas it has little effect on orslightly stimulates the production of the MCFA ethyl esters. Evidence also suggests
CONTROL OF ESTER SYNTHESIS DURING BREWERY FERMENTATION 227
that the esterase activity of yeast could play a significant role in determining the finalester level of products such as membrane-filtered beer and bottle-refermented beer.
References
1. Nykänen, I., and Suomalainen, H. (1983) Aroma of Beer, Wine and Distilled Alcoholic Beverages. Reidel,Dordrecht.
2. Dufour, J.P. and Malcorps, P. (1995) Ester synthesis during fermentation: enzymes characterizationand modulation mechanism. In: Proc. 4th Aviemore Conference on Malting, Brewing and Distilling,Campbell, I. and Priest, F.G. (eds). Institute of Brewing, London, pp. 137–151.
3. Meilgaard, M.C. (1975) Flavor chemistry of beer, Part II: Flavor and threshold of 239 aroma volatiles.Tech. Q. Master Brew. Assoc. Am. 12, 151–168.
4. Mason, B. and Dufour, J.P. (2000) Alcohol acetyltransferases and the significance of ester synthesis inyeast. Yeast 16, 1287–1298.
5. Nordström, K. (1962) Formation of ethyl acetate in fermentation with brewer’s yeast. III. Participationof coenzyme A. J. Inst. Brew. 68, 398–407.
6. Howard, D. and Anderson, R.G. (1976) Cell-free synthesis of ethyl acetate by extracts fromSaccharomyces cerevisiae. J. Inst. Brew. 82, 70–71.
7. Malcorps, P. and Dufour, J.P. (1992) Short and medium chain aliphatic esters synthesis in Saccharomycescerevisiae. Eur. J. Biochem. 210, 1015–1022.
8. Dufour, J.P., Weaver, A. and Mason, B. (2000) Towards our understanding of the physiological role ofester synthesis. In: Yeast Physiology – A New Era of Opportunity. Eur. Brew. Conv., Monograph 28.Fachverlag Hans Carl, Nürnberg, pp. 83–91.
9. Llorente, B. (2001) Redondance génique et redondance génétique chez les levures hémiascomycètes.PhD Thesis, Université Paris 6.
10. Roy, D.J. and Dawes, I.W. (1987) Cloning and characterisation of the gene encoding lipoamide dehydro-genase in Saccharomyces cerevisiae. J. Gen. Microbiol. 133, 925–933.
11. Boulton, C.A. and Quain, D.E. (2001) Brewing Yeast and Fermentation. Blackwell Science, Oxford.12. Nordström, K. (1961) Formation of ethyl acetate in fermentation with brewer’s yeast. J. Inst. Brew. 67,
173–181.13. Hashimoto, N. and Kuroiwa, Y. (1966) Gas chromatographic studies on volatiles alcohols and esters of
beer. J. Inst. Brew. 72, 151–162.14. Maule, D.R., Pinnegar, M.A., Portno, A.D. and Whitear, A.L. (1969) Simultaneous assessment of changes
occurring during batch fermentation. J. Inst. Brew. 72, 488–494.15. Piendl, A. and Geiger, E. (1980) Technological factors in the formation of esters during fermentation.
Brew. Digest 55, 26, 28, 30–35.16. Sa Almeida, A.M., Bustorff Guerra, M.M., Machado Cruz, J.M. et al. (1989) Influencia do ‘trub’ e da
estippe de levedura na evoluçao de compostos aromaticos. XVI Encontro de tecnicos cervejeiros, Portugal,pp. 1–24.
17. Nordström, K. (1964) Studies on the formation of volatile esters in fermentation with brewer’s yeast.Svensk Kemisk Tidskrift 76, 510–543.
18. Nykänen, L., Nykänen, I. and Suomalainen, H. (1977) Distribution of esters produced during sugar fer-mentation between the yeast cell and the medium. J. Inst. Brew. 83, 32–34.
19. Miedaner, H. (1978) Optimization of fermentation and the conditioning at the production of lager.Proc. Conv. Inst. Brew. 5, 110–133.
20. Wackerbauer, K. and Balzer, U. (1991) Practical experience with the high gravity surplus yeast recoveryprocess. Brauwelt Int. 1, 37–46.
21. Suomalainen, H. (1981) Yeast esterases and aroma esters in alcoholic beverages. J. Inst. Brew. 87, 296–300.22. Nordström, K. (1963) Formation of esters from acids by brewer’s yeast. I. Kinetic theory and basic
experiments. J. Inst. Brew. 69, 310–322.23. Nordström, K. (1964) Formation of esters from acids by brewer’s yeast. II. Formation from lower fatty
acids. J. Inst. Brew. 70, 42–55.24. Thurston, P.A., Quain, D.E. and Tubb, R.S. (1981) The control of volatile ester biosynthesis in
Saccharomyces cerevisiae. Proc. Cong. Eur. Brew. Conv. 18, 197–206.25. Thurston, P.A., Quain, D.E. and Tubb, R.S. (1982) Lipid metabolism and the regulation of volatile
ester synthesis in Saccharomyces cerevisiae. J. Inst. Brew. 88, 90–94.26. Yoshioka, K. and Hashimoto, N. (1984) Ester formation by brewers’ yeast during sugar fermentation.
Agric. Biol. Chem. 48, 333–340.
228 BREWING YEAST FERMENTATION PERFORMANCE
27. Calderbank, J. and Hammond, J.R.M. (1994) Influence of higher alcohol availability on ester formationby yeast. J. Am. Soc. Brew. Chem. 52, 84–90.
28. Dufour, J.P. (1994) Higher alcohols, organic acids and esters production by yeast during fermentation.6th J. Declerck Chair, ARAEBUL, Louvain, 40 pp.
29. Malcorps, P., Cheval, J.M., Jamil, S. and Dufour, J.P. (1991) A new model for the regulation of estersynthesis by alcohol acetyltransferase in Saccharomyces cerevisiae during fermentation. J. Am. Soc.Brew. Chem. 49, 47–53.
30. Fujii, T., Nagasawa, N., Iwamatsu, A. et al. (1994) Molecular cloning, sequence analysis, and expressionof the yeast alcohol acetyltransferase gene. Appl. Environ. Microbiol. 60, 2786–2792.
31. MacDonald, J., Reeve, P.T.V., Ruddlesden, J.D. and White, F.H. (1984) Current approaches to breweryfermentations. In: Progress in Industrial Microbiology, Vol. 19, Modern Applications of TraditionalBiotechnology. pp. 47–198.
32. Taylor, G.T. and Kirsop, B.H. (1977) The origin of the medium-chain length fatty acids present in beer.J. Inst. Brew. 83, 241–243.
33. Sumper, M. (1974) Control of fatty acid biosynthesis by long chain acyl-CoAs and by lipid membranes.Eur. J. Biochem. 49, 469–475.
34. Wakil, S.J., Stoops, J.K. and Joshi, V. (1983) Fatty acid synthesis and its regulation. Annu. Rev. Biochem.52, 537–579.
35. Hammond, J.R.M. (1993) Brewer’s yeasts. In: The Yeasts, Vol. V, Rose, A.H. and Harrison, J.S. (eds).Academic Press, London. pp. 8–67.
36. Bardi, L., Crivelli, C. and Marzona, M. (1998) Esterase activity and release of ethyl esters of medium-chainfatty acids by Saccharomyces cerevisiae during anaerobic growth. Can. J. Microbiol. 44, 1171–1176.
37. Bardi, L., Cocito, C. and Marzona, M. (1999) Saccharomyces cerevisiae cell fatty acid composition andrelease during fermentation without aeration and in absence of exogenous lipids. Int. J. Food Microbiol.47, 133–140.
38. Peddie, H.A.B. (1990) Ester formation in brewery fermentation. J. Inst. Brew. 96, 327–331.39. Seaton, J.C., Hodgson, J.A. and Moir, M. (1990) The control of beer ester content. Proc. Conv. Inst.
Brew. 21, 126–130.40. Masschelein, C.A. (1986) Yeast metabolism and beer flavour. Proc. Eur. Brew. Conv. Monograph 12,
2–22.41. Engan, S. (1981) Beer composition: volatile substances. In: Brewing Science, Vol. 2, Pollock, J.R.A.
(ed.). Academic Press, London, pp. 108–121.42. Engan, S. and Aubert, O. (1973) Relations between wort treatment and flavour components in beer.
Proc. Cong. Eur. Brew. Conv. 14, 209–216.43. Narziss, L., Miedaner, H. and Gresser, A. (1983) Yeast strain and beer quality. The formation of esters
during fermentation. Brauwelt 123, 2024–2034.44. Posada, J., Candela, J., Calero, G. et al. (1977) Fermentation condition and yeast performance. Proc. Cong.
Eur. Brew. Conv. 16, 533–544.45. Engan, S. (1978) Formation of volatile flavour compounds: alcohols, esters, carbonyls, acids. Proc. Conv.
Inst. Brew. 5, 28–39.46. Ramos-Jeunehomme, C., Laub, R. and Masschelein, C.A. (1991) Why is ester formation in brewery
fermentations yeast strain dependent? Proc. Cong. Eur. Brew. Conv. 23, 257–264.47. Nordström, K. (1964) Formation of esters from acids by brewer’s yeast. IV. Effect of higher fatty acids
and toxicity of lower fatty acids. J. Inst. Brew. 70, 233–242.48. Pollock, J.R.A. and Weir, M.J. (1976) Adjunct fermentation: volatile substances formed during the fer-
mentation of individual sugars. J. Am. Soc. Brew. Chem. 34, 70–75.49. Nykänen, L., and Nykänen, I. (1977) Production of esters by different yeast strains in sugar fermentations.
J. Inst. Brew. 83, 30–31.50. Stewart, G.G., Goring, T.E. and Russel, I. (1977) Can a genetically manipulated yeast strain produce
palatable beer? J. Am. Soc. Brew. Chem. 4, 168–178.51. Maule, D.R. (1967) Rapid gas chromatographic examination of beer flavour. J. Inst. Brew. 73, 351–360.52. Norstedt, C., Bengtsson, A., Bennet, P. et al. (1975) Technological measures to control the formation of
esters during beer fermentation. Proc. Cong. Eur. Brew. Conv. 15, 581–600.53. Wackerbauer, K., Kramer, P. and Toussaint, H.J. (1980) Technologische parameter der esterbildung.
Mschr. Brauerei. 3, 91–99.54. Lie, S. and Haukeli, D. (1981) Production of volatiles during yeast fermentation. Proc. Conv. Inst. Brew.
7, 285–296.55. Barker, R.L., Irwin, A.J. and Murray, C.R. (1992) The relationship between fermentation variables and
flavor volatiles by direct gas chromatographic injection of beer. Tech. Q. Master Brew. Assoc. Am. 29, 11–17.56. Malcorps, P., Van de Spiegle, K. and Dupire, S. (1999) Esters profile control in industrial fermentations.
EBC Flavour and Flavour Stability Subgroup Meeting.
CONTROL OF ESTER SYNTHESIS DURING BREWERY FERMENTATION 229
57. Watari, J., Sato, M., Ogawa, M. and Shinotsuka, K. (2000) Genetic and physiological instability ofbrewing yeast. In: Yeast Physiology – A New Era of Opportunity. Eur. Brew. Conv. Monograph 28.Fachverlag Hans Carl, Nürnberg, pp. 148–158.
58. Äyräpää, T. and Lindström, I. (1973) Influence of long-chain fatty acids on the formation of esters bybrewer’s yeast. Proc. Cong. Eur. Brew. Conv. 14, 271–283.
59. Äyräpää, T. and Lindström, I. (1977) Aspects of the influence of exogenous fatty acids on the fatty acidmetabolism of yeast. Proc. Cong. Eur. Brew. Conv. 16, 507–517.
60. Yoshioka, K. and Hashimoto, N. (1983) Cellular fatty acid an ester formation by brewers’ yeast. Agric.Biol. Chem. 47, 2287–2294.
61. Yoshizawa, K. and Ishikawa, T. (1985) Changes of lipids during saké brewing and their contribution toester formation by yeasts. Hakkokogaku 63, 161–173.
62. Anderson, R.G. and Kirsop, B.H. (1974) The control of volatile ester synthesis during the fermentationof wort of high specific gravity. J. Inst. Brew. 80, 48–55.
63. Palmer, A.K. and Rennie, H. (1974) Ester control in high gravity brewing. J. Inst. Brew. 80, 447–454.64. White, F.H. and Portno, A.D. (1979) The influence of wort composition on beer ester levels. Proc.
Cong. Eur. Brew. Conv. 17, 447–460.65. Taylor, G.T., Thurston, P.A. and Kirsop, B.H. (1979) The influence of lipids derived from malt spent
grains on yeast metabolism and fermentation. J. Inst. Brew. 85, 219–227.66. Thurston, P.A., Taylor, R. and Ahvenainen, J. (1981) Effects of linoleic acid supplements on the synthesis
by yeast of lipids and acetate esters. J. Inst. Brew. 87, 92–95.67. Schisler, D.O., Ruocco, J.J. and Mabee, M.S. (1982) Wort trub content and its effects on fermentation
and beer flavor. J. Am. Soc. Brew. Chem. 40, 57–61.68. Ahvenainen, J. (1982) Lipid composition of aerobic and anaerobically propagated brewer’s bottom
yeast. J. Inst. Brew. 88, 367–370.69. Pfisterer, E. and Stewart, G. (1975) Some aspects on the fermentation of high gravity worts. Proc. Cong.
Eur. Brew. Conv. 15, 255–266.70. Pfisterer, E., Hancock, I. and Garrison, I. (1976) Effects of fermentation environment on yeast lipid
synthesis. J. Am. Soc. Brew. Chem. 35, 49–54.71. Rosi, I. and Bertuccioli, M. (1992) Influences of lipid addition on fatty acid composition of Saccharomyces
cerevisiae and aroma characteristics of experimental wines. J. Inst. Brew. 98, 305–314.72. Yoshioka, K. and Hashimoto, N. (1982) Ester formation by alcohol acetyltransferase from brewer’s
yeast. II. Properties of alcohol acetyltransferase. Rep. Res. Lab. Kirin Brew. Co. 27, 7–12.73. Yoshioka, K. and Hashimoto, N. (1984) Ester formation by alcohol acetyltransferase from brewer’s
yeast. IV. Cellular fatty acid and ester formation by brewer’s yeast. Rep. Res. Lab. Kirin Brew. Co. 27,23–30.
74. Ramos-Jeunehomme, C., Laub, R. and Masschelein, C.A. (1989) The relationship of subcellular local-ization/ester synthesizing activity of alcohol acetyltransferase in brewery fermentations. Proc. Cong. Eur.Brew. Conv. 22, 513–519.
75. Pande, S.V. and Mead, J.F. (1968) Inhibition of enzyme activities by free fatty acids. J. Biol. Chem. 243,6180–6185.
76. Cowland, T.W. and Maule, D.R. (1966) Some effects of aeration on the growth and metabolism ofSaccharomyces cerevisiae in continuous culture. J. Inst. Brew. 72, 480–488.
77. Cowland, T.W. (1967) Some effects of aeration on the continuous fermentation of hopped wort. J. Inst.Brew. 73, 542–551.
78. Berry, D.R. and Chamberlain, H. (1986) Formation of organoleptic compounds by yeast grown in con-tinuous culture on a defined medium. J. Am. Soc. Brew. Chem. 44, 52–56.
79. Anderson, R.G., Kirsop, B.H., Rennie, H. and Wilson, R.J.H. (1973) The practical use of oxygenationduring fermentation for the control of volatile acetate ester concentration in beer. Proc. Cong. Eur.Brew. Conv. 14, 243–253.
80. Anderson, R.G. and Kirsop, B.H. (1975) Oxygen as a regulator of ester accumulation during the fermen-tation of wort of high specific gravity. J. Inst. Brew. 81, 111–115.
81. Boulton, C.A. and Quain, D.E. (1987) Yeast, oxygen and the control of brewery fermentations. Proc.Cong. Eur. Brew. Conv., Madrid, 21, 401–408.
82. Boulton, C.A., Jones, A.R. and Hinchliff, E. (1991) Yeast physiological condition and fermentationperformance. Proc. Cong. Eur. Brew. Conv., Lisbon, 23, 385–392.
83. Nordström, K. (1965) Possible control of volatile ester formation in brewing. Proc. Cong. Eur. Brew. Conv.10, 195–208.
84. Casey, G.P., Chen, E.C.H. and Ingledew, W.M. (1985) High-gravity brewing: production of high levels ofethanol without excessive concentrations of esters and fusel alcohols. J. Am. Soc. Brew. Chem. 43, 179–182.
85. Witt, P.R. and Blythe, P. (1975) Considerations – the fermentation of high-gravity wort. J. Am. Soc.Brew. Chem. 34, 76–79.
230 BREWING YEAST FERMENTATION PERFORMANCE
86. Whithworth, C. (1978) Technological advances in high gravity fermentation. Proc. Conv. Inst. Brew. 5,155–164.
87. Pearlstein, K.M. (1988) Pilot-scale studies on extended aeration at fermentor fill. J. Am. Soc. Brew.Chem. 46, 108–111.
88. Hodgson, J.A. (1991) Flavour control in top fermented beers. Fermentation 12, 109–111.89. Mitsui, S., Shimazu, T., Abe, I. and Kishi, S. (1991) Stimulation and optimization of aeration in beer
fermentation. Tech. Q. Master Brew. Assoc. Am. 28, 119–122.90. Ahvenainen, J. and Makinen, V. (1981) The effect of pitching yeast aeration on fermentation and beer
flavour. Proc. Cong. Eur. Brew. Conv. 18, 185–291.91. Yoshioka, K. and Hashimoto, N. (1984) Ester formation by alcohol acetyltransferase from brewer’s
yeast. III. Acetyl-CoA of brewer’s yeast and formation of acetate esters. Rep. Res. Lab. Kirin Brew. Co.27, 17–22.
92. Hawthorne, D.B., Moulder, P.J., Davine, D.F. et al. (1982) Brewhouse procedures: the effects on somebeer volatiles. Proc. Conv. Inst. Brew., Aust. N.Z. Sect. 17, 125–131.
93. Jakobsen, M. (1982) The effect of yeast handling procedures on yeast oxygen requirement and fer-mentation. Proc. Conv. Inst. Brew., Aust. N.Z. Sect. 17, 132–137.
94. Anderson, R.G. and Kirsop, B.H. (1975) Quantitative aspects of the control by oxygenation of acetateester concentration in beer obtained from high-gravity wort. J. Inst. Brew. 81, 296–301.
95. David, M.H. and Kirsop, B.H. (1973) Yeast growth in relation to the dissolved oxygen and sterol con-tent of wort. J. Inst. Brew. 79, 20–25.
96. Aries, V. and Kirsop, B.H. (1977) Sterol synthesis in relation to growth and fermentation by brewingyeast inoculated at different concentrations. J. Inst. Brew. 83, 220–223.
97. Nordström, K. (1964) Formation of esters from alcohols by brewer’s yeast. J. Inst. Brew. 70, 328–336.98. Engan, S. (1981) The role of esters in beer flavour. Proc. Conv. Inst. Brew. 7, 123–134.99. Quain, D.E. (1988) Studies on yeast physiology – impact on fermentation performance and product
quality. J. Inst. Brew. 95, 315–323.100. Devuyst, R., Dyon, D., Ramos-Jeunehomme, C. and Masschelein, C.A. (1991) Oxygen transfer effi-
ciency with a view to the improvement of lager yeast performance and beer quality. Proc. Cong. Eur.Brew. Conv. 23, 377–384.
101. Fujii, T., Yoshimoto, H. and Tamai, Y. (1996) Acetate ester production by Saccharomyces cerevisiaelacking the ATF1 gene encoding the alcohol acetyltransferase. J. Ferment. Bioeng. 81, 538–542.
102. Fujiwara, D.U., Yoshimoto, H., Sone, H. et al. (1998) Transcriptional co-regulation of Saccharomycescerevisiae alcohol acetyltransferase gene, ATF1 and delta-9 fatty acid desaturase gene, OLE1 byunsaturated fatty acids. Yeast 14, 711–721.
103. Lie, S. and Jacobsen, T. (1983) The absorption of zinc by brewer’s yeast. Proc. Cong. Eur. Brew. Conv.19, 145–151.
104. Haboucha, J., Masschelein, C.A. and Devreux, A. (1967) Fermentation discontinue accélérée et soninfluence sur le métabolisme de la levure. Proc. Cong. Eur. Brew. Conv. 11, 197–211.
105. Pollock, J.R.A. and Weir, M.J. (1973) Chemical aspects of the adjunct fermentation process. Proc.Am. Soc. Brew. Chem. 31, 1–6.
106. Rice, J.F., Chicoye, E. and Helbert, J.R. (1977) Inhibition of beer volatiles formation by carbon diox-ide pressure. J. Am. Soc. Brew. Chem. 35, 35–40.
107. Nielsen, H., Hoybye-Hansen, I., Ibaek, D. et al. (1987) Pressure fermentation and wort carbonation.Tech. Q. Master Brew. Assoc. Am. 24, 90–94.
108. Knatchbull, F.B. and Slaughter, J.C. (1987) The effect of low CO2 pressures on the absorption ofamino acids and production of flavour-active volatiles by yeast. J. Inst. Brew. 93, 420–424.
109. Kruger, L., Pickerell, A.T.W. and Axcell, B. (1992) The sensitivity of different brewing yeast strains tocarbon dioxide inhibition: fermentation and production of flavour-active volatile compounds. J. Inst.Brew. 98, 133–138.
110. Renger, R.S., van Hateren, S.H. and Luyben, K.C.A.M. (1992) The formation of esters and higheralcohols during brewery fermentations; the effect of carbon dioxide pressure. J. Inst. Brew. 98,509–513.
111. Landaud, S., Latrille, E. and Corrieu, G. (2001) Top pressure and fermentation control of the fuselalcohol/ester ratio through yeast growth in beer fermentation. J. Inst. Brew. 107, 107–117.
112. Shantha Kumara, H.M.C., Fukui, N., Kojima, K. and Nakatani, K. (1995) Regulation mechanism ofester formation by dissolved carbon dioxide during beer fermentation. Tech. Q. Master Brew. Assoc.Am. 32, 159–162.
113. Kumada, J., Nakajima, T. and Narziss, L. (1975) Einfluss von Druck und Temperatur bei der Garungauf den Stoffwechsel der Hefe und Bierqualitat. Proc. Cong. Eur. Brew. Conv. 15, 615–623.
114. Nakatani, K., Fukui, N., Nagami, K. and Nishigaki, M. (1991) Kinetic analysis of ester formation duringbeer fermentation. J. Am. Soc. Brew. Chem. 49, 152–157.
CONTROL OF ESTER SYNTHESIS DURING BREWERY FERMENTATION 231
232 BREWING YEAST FERMENTATION PERFORMANCE
115. Vrieling, A.M. (1978) Agitated fermentation in high fermenters. Proc. Conv. Inst. Brew. 5, 135–144.116. Masschelein, C.A. (1990) Novel fermentation systems: their influence on yeast metabolism and beer
flavour. Proc. 3rd Aviemore Conf. Brewing and Distilling, Aviemore, pp. 103–116.117. Masschelein, C.A. (1987) New fermentation methods. Proc. Cong. Eur. Brew. Conv., Madrid, 21, 209–220.118. Narziss, L. (1990) Rapid fermentation and/or maturation in German lager beers. Fermentation 11,
54–62.119. Narziss, L. (1979) Vor- und Nachteile der Garung in Grossbehaltern. Brauwelt 33, 1165–1171.120. Drost, B.W. (1977) Fermentation and storage. Proc. Cong. Eur. Brew. Conv. 16, 519–532.121. Lewis, M.J. (1968) Recent research on diacetyl. Brew. Digest 43, 74, 76, 78, 80, 81, 129.122. Klopper, W.J., Roberts, R.H., Royson, M.G. and Ault, R.G. (1967) Continuous fermentation in a tower
fermenter. Proc. Cong. Eur. Brew. Conv. 11, 242–259.123. Ault, R.G., Hampton, A.N., Newton, R. and Roberts, R.H. (1969) Biological and biochemical aspects
of tower fermentation. J. Inst. Brew. 75, 260–265.124. Portno, A.D. (1967) New systems of continuous fermentation by yeast. J. Inst. Brew. 73, 43–51.125. Portno, A.D. (1967) The influence of dissolved oxygen on fermentation in a selected continuous system.
J. Inst. Brew. 73, 473–477.126. Portno, A.D. (1968) Continuous fermentation of brewer’s wort. J. Inst. Brew. 74, 55–63.127. Portno, A.D. (1968) Continuous fermentation in relation to yeast metabolism. J. Inst. Brew. 74,
448–456.128. Portno, A.D. (1969) Fermentation in a progressive continuous system. J. Inst. Brew. 75, 468–471.129. Portno, A.D. (1978) Continuous fermentation in the brewing industry – the future outlook. Proc.
Conv. Inst. Brew. 5, 145–154.130. White, F.H. and Portno, A.D. (1978) Continuous fermentation by immobilized brewers yeast. J. Inst.
Brew. 84, 228–230.131. Curin, J., Pardanova, B., Polednikova, M. et al. (1987) Beer production with immobilized yeast. Proc.
Cong. Eur. Brew. Conv. 21, 433–440.132. Inoue, T. (1988) Immobilized cell biotechnology – a new possibility for brewing? J. Am. Soc. Brew.
Chem. 46, 64–66.133. Kronlöf, J., Harkonen, T., Hartwall, P. et al. (1989) Main fermentation with immobilized yeast. Proc.
Cong. Eur. Brew. Conv. 22, 335–362.134. Masschelein, C.A. (1989) Potential immobilized cell technology for application in the brewing
process. Progress in alcohol and alcoholic beverage production with yeasts. 13th Int. SpecializedSymposium on Yeast, Vol. 1, Leuven, Belgium, pp. 9–12.
135. Linko, M. and Kronlöf, J. (1991) Main fermentation with immobilized yeast. Proc. Cong. Eur. Brew.Conv. 22, 353–360.
136. Yamauchi, Y. and Kashihara, T. (1996) Kirin immobilized system. In: Immobilised Yeast Applicationsin the Brewing Industry. Eur. Brew. Conv. Monograph 24. Verlag Hans Carl Getränke-Fachverlag,Nürnberg, pp. 99–117.
137. Kronlöf, J., Linko, M. and Pajunen, E. (1996) Primary fermentation with a two-stage packed bed system-pilot scale experience. In: Immobilised Yeast Applications in the Brewing Industry. Eur. Brew. Conv.Monograph 24. Verlag Hans Carl Getränke-Fachverlag, Nürnberg, pp. 118–124.
138. Masschelein, C.A., Carlier, A., Ramos-Jeunehomme, C. and Abe, I. (1985) The effect of immobilizationon yeast physiology and beer quality in continuous and discontinuous systems. Proc. Cong. Eur. Brew.Conv. 20, 339–346.
139. Ryder, D.S. and Masschelein, C.A. (1991) Immobilized yeast in brewing – a current perspective. Proc.Cong. Eur. Brew. Conv. 23, 345–352.
140. Pajunen, E., Makinen, V. and Gisler, R. (1987) Secondary fermentation with immobilized yeast. Proc.Cong. Eur. Brew. Conv. 21, 441–448.
141. Pajunen, E., Gronqvist, A. and Lommi, H. (1989) Continuous secondary fermentation and maturationof beer in an immobilized yeast reactor. Tech. Q. Master Brew. Assoc. Am. 26, 147–151.
142. Grönqvist, A., Pajunen, E. and Ranta, B. (1989) Secondary fermentation with immobilized yeast –Industrial scale. Proc. Cong. Eur. Brew. Conv. 22, 339–346.
143. Kronlöf, J. and Haikara, A. (1989) Contamination of immobilized yeast bioreactors. Progress in alco-hol and alcoholic beverage production with yeasts. 13th Int. Specialized Symposium on Yeast, Leuven,Belgium, pp. 1–2.
144. Pajunen, E. (1996) Immobilized yeast lager beer maturation: DEAE-cellulose at Sinebrychoff. In:Immobilised Yeast Applications in the Brewing Industry. Eur. Brew. Conv. Monograph 24. Verlag HansCarl Getränke-Fachverlag, Nürnberg, pp. 24–40.
145. Nothaft, A. (1996) The start-up of an immobilized yeast system for secondary fermentation atBrahma. In: Immobilised Yeast Applications in the Brewing Industry. Eur. Brew. Conv. Monograph 24.Verlag Hans Carl Getränke-Fachverlag, Nürnberg, pp. 41–54.
CONTROL OF ESTER SYNTHESIS DURING BREWERY FERMENTATION 233
146. van Dieren, B. (1996) Yeast metabolism and the production of alcohol-free beer. In: ImmobilisedYeast Applications in the Brewing Industry. Eur. Brew. Conv. Monograph 24. Verlag Hans CarlGetränke-Fachverlag, Nürnberg, pp. 66–76.
147. Breitenbücher, K. and Mistler, M. (1996) Fluidized bed fermenters for the continuous production ofnon-alcoholic beer with open-pore sintered glass carriers. In: Immobilised Yeast Applications in theBrewing Industry. Eur. Brew. Conv. Monograph 24. Verlag Hans Carl Getränke-Fachverlag,Nürnberg, pp. 77–88.
148. Gaeng, F.E. (1976) Einfluss der Gargedingungen auf die Bildung der fluchtigen Substanzen desBieres. Brauwissenschaft 29, 337–344.
149. Engan, S. and Aubert, O. (1977) Relations between fermentation temperature and the formation ofsome flavour components. Proc. Cong. Eur. Brew. Conv. 16, 591–607.
150. Matile, P. and Weimken, A. (1967) The vacuole as the lysosyme of the yeast cell. Arch. Mikrobiol. 56,148–155.
151. Parkkinen, E., Oura, E. and Suomalainen, H. (1978) The esterases of baker’s yeast. I. Activity andlocalization in the yeast cell. J. Inst. Brew. 84, 5–8.
152. Wohrmann, K. and Lange, P. (1980) The polymorphism of esterase in yeast. J. Inst. Brew. 86, 174.153. Yanagiuchi, T., Kiyokawa, Y. and Wakai, Y. (1989) Isoamyl acetate accumulation in sake mash and
isoamyl acetate hydrolysis activity of sake yeast strains. Hakkokogaku 67, 419–425.154. Wakai, Y., Yanagiuchi, T. and Kiyokawa, Y. (1990) Properties of an isoamyl acetate hydrolytic enzyme
from sake yeast strain. Hakkokogaku 68, 101–105.155. Fukuda, K., Kuwahata, O., Kiyokawa, Y. et al. (1996) Molecular cloning and nucleotide sequence of
the isoamyl acetate-hydrolysing esterase gene (EST2) from Saccharomyces cerevisiae. J. Ferment.Bioeng. 82, 8–15.
156. Fukuda, K., Yamamoto, N., Kiyokawa, Y. et al. (1998) Brewing properties of sake yeast whose EST2gene encoding isoamyl acetate-hydrolysing esterase was disrupted. J. Ferment. Bioeng. 85, 101–106.
157. Fukuda, K., Yamamoto, N., Kiyokawa, Y. et al. (1998) Balance of activities of alcohol acetyltrans-ferase and esterase in Saccharomyces cerevisiae is important for production of isoamyl acetate. Appl.Environ. Microbiol. 64, 4076–4078.
158. Masschelein, C.A., Jeunehomme-Ramos, C., Jenard, H. and Devreux, A. (1971) La maturationrapide de la bière – Étude des facteurs limitants. Proc. Cong. Eur. Brew. Conv. 13, 211–225.
159. Neven, H. (1997) Acyl- and acetate esters in top-fermented beers. PhD Dissertationes de Agricultura,Katholieke Universiteit Leuven.
160. Neven, H., Delvaux, F. and Derdelinckx, G. (1997) Flavor evolution of top fermented beers. Tech. Q. Master Brew. Assoc. Am. 34, 115–118.
161. Dufour, J.P. and Bing, Y. (2001) Influence of yeast strain and fermentation conditions on yeastesterase activities. Brew. Digest 76, 44.
162. Inoue, Y., Fukuda, K., Wakai, Y. et al. (1994) Ester formation by a yeast Hansenula mrakii IFO 0895:contribution of esterase for isoamyl acetate production in sake brewing. Lebensm.-Wiss. u.-Technol.27, 189–193.
163. Inoue, Y., Trevanichi, S., Fukuda, K. et al. (1997) Roles of esterases and alcohol acetyltransferase onproduction of isoamyl acetate in Hansenula mrakii. J. Agric. Food Chem. 45, 644–649.
164. Spaepen, M. and Verachtert, H. (1982) Esterase activity in the genus Brettanomyces. J. Inst. Brew. 88,11–17.
165. Schermers, F.H., Duffus, J.H. and MacLeod, A.M. (1976) Studies on yeast esterase. J. Inst. Brew. 82,170–174.
22 Genetic Regulation of Ester Synthesis in Yeast: New Facts, Insights and Implications for the Brewer
K.J. VERSTREPEN, N. MOONJAI, F.F. BAUER, G. DERDELINCKX,J.-P. DUFOUR, J. WINDERICKX, J.M. THEVELEIN,I.S. PRETORIUS and F.R. DELVAUX
Abstract As they are responsible for the fruity character of fermented beverages, volatileesters constitute an important group of aromatic compounds in beer. In modern high-gravity fermentations, performed in tall cylindroconical vessels, the beer’s ester balance isoften suboptimal, resulting in a clear decrease in beer quality. It is therefore essential toinvestigate further the physiological mechanisms behind ester synthesis in order to controlester formation during industrial brewing processes.
Fermenting yeast cells form esters in an enzymic reaction between a fusel alcohol andacyl coenzyme A. Several different enzymes catalyse the formation of the whole range ofesters in beer. The best known ester synthesis enzymes are the alcohol acetyl transferasesAATaseI and AATaseII, encoded by the genes ATF1 and ATF2, respectively. These twoenzymes are responsible for the formation of ethylacetate and isoamylacetate, two of themost important aromatic compounds in beer. In this study, the relative importance ofATF1 and ATF2 gene activity for aromatic ester production was investigated.
During industrial wort fermentations ATF1 and ATF2 are expressed very weakly, with arelative peak in activity between 12 and 36 h of fermentation. These low expression levelsand thus the small production of the corresponding AATases, suggest that expression ofATF1 and ATF2 may be a limiting factor for ester synthesis in industrial fermentations.Indeed, genetically modified strains of brewing yeast overexpressing ATF1 or ATF2 pro-duce significantly more acetate esters than do the wild-type cells. Sensory analysis of thebeers obtained with these ATF-overexpressing strains confirms the increase in fruityaromas, indicating that ATF gene activity is an important factor for beer quality.Consequently, every factor that affects the expression level of these genes may have a hugeeffect on the ester balance of the fermentation product. In this way, the fine-tuning of esterconcentrations in beer is possible by carefully adapting wort aeration and wort compos-ition. In particular, the wort concentrations of glucose, dissolved oxygen and unsaturatedfatty acids have a profound effect on ATF gene activity and thus offer possibilities to con-trol ester production. Alternatively, genetic modification of brewing yeast in order tochange the ATF gene expression patterns allows tailoring of the yeast aromatic character-istics to fit the modern brewer’s needs.
22.1 Introduction
Although volatile esters are only trace compounds in fermented beverages such asbeer and wine, they are extremely important for the flavour profile of these drinks. Twoof the most important flavour-active esters in beer are ethyl acetate (solvent-likearoma) and isoamyl acetate (fruity, banana aroma). Esters are formed by fermentingyeast cells. They are the product of an enzyme-catalysed condensation reactionbetween acyl coenzyme A (CoA) and a higher alcohol.1,2 Several different enzymes are
Brewing Yeast Fermentation Performance: Second edition
Edited by: KATHERINE SMART Copyright 0 Blackwell Science 2003
GENETIC REGULATION OF ESTER SYNTHESIS IN YEAST 235
known to be involved in the formation of esters,3 the best characterised ones being thealcohol acetyl transferases I and II (AATase I and II, E.C. 2.3.1.84), encoded by thegenes ATF1 and ATF2, respectively.3–5 The enzymes Atf1p and Atf2p are at least par-tially responsible for isoamyl acetate and ethyl acetate production.5,6 Other enzymesinvolved in ester production are Lg-Atf1p, an AATase found in lager yeast homologousto the Atf1p, and Eht1p (ethanol hexanoyl transferase), an enzyme believed to catalysethe formation of ethyl hexanoate.7,8 Furthermore, it has been shown that the balancebetween ester-synthesising enzymes and esterases such as Iah1p, which hydrolyseesters, is important for the net rate of ester accumulation.9
Many different parameters that affect the ester levels have already been identified.Fermentation characteristics such as the yeast strain,10,11 pitching rate,12,13 fermenta-tion temperature12,14 and top pressure15,16 are all known to influence ester synthesisprofoundly. Furthermore, wort concentrations of nitrogen compounds,14,17 carboncompounds,18–21 dissolved oxygen14,22–24 and fatty acids25,26 also have an effect on theproduced ester concentrations.
Many studies have attempted to explain the effect of these parameters on ester pro-duction. Basically, two factors are important for the rate of ester formation: the con-centration of the two substrates, acyl CoA and fusel alcohol, and the total activity ofthe enzymes involved in the formation and breakdown of the respective ester. Hence,all parameters that affect the substrate concentrations or enzyme activity will influencethe ester concentration. The first models for the ester synthesis rate during breweryfermentations focused on the availability of the cosubstrate acetyl CoA as the mainlimiting factor. Parameters such as temperature, fatty acid addition, nitrogen and oxy-gen levels would exert their influence on ester synthesis by changing the levels of acetylCoA. In brief, every factor that raises acetyl CoA levels would also raise ester produc-tion. Oxygen, wort solids and wort lipids promote yeast growth and thus the usage ofacetyl CoA, leaving less acetyl CoA available for ester production.26 However, thismodel fails to explain satisfactorily the influence of glucose or nitrogen addition andthe lowering of top pressure, three factors that raise both growth and ester production.Furthermore, Yoshioka and Hashimoto found that the levels of acetyl CoA werehardly affected by modification of the fermentation conditions.27 Other studies showed that the availability of the other cosubstrate, higher alcohols, may be the mainlimiting factor for ester synthesis. It was found that supplementations of 3-methylbutanol to both normal- and high-gravity worts increased the production of the cor-responding acetate ester, isoamyl acetate.21,28 However, it is clear that the effects thatsome parameters have on ester synthesis rates cannot be explained through higheralcohol availability alone. For example, high oxygen and unsaturated fatty acid levelsare known to increase fusel alcohol production, but to decrease ester levels.17,29,30
A new model that places the AATase enzyme in a central role was developed byMalcorps et al.31 It was shown that AATase activity follows a pattern very similar to thatof ester production, and that the enzymic activity is repressed by both oxygen and sup-plementation of linoleic acid to the medium.31 After the cloning of the AAT genesATF1 and ATF2, it was shown that ATF1 gene transcription is directly repressed byunsaturated fatty acids32 and oxygen.33 Furthermore, it was shown that ATF1 activity isalso regulated through the protein kinase Sch9p.33 Sch9p plays a central role in the tran-scriptional regulation of several genes in response to changes in the carbon source,
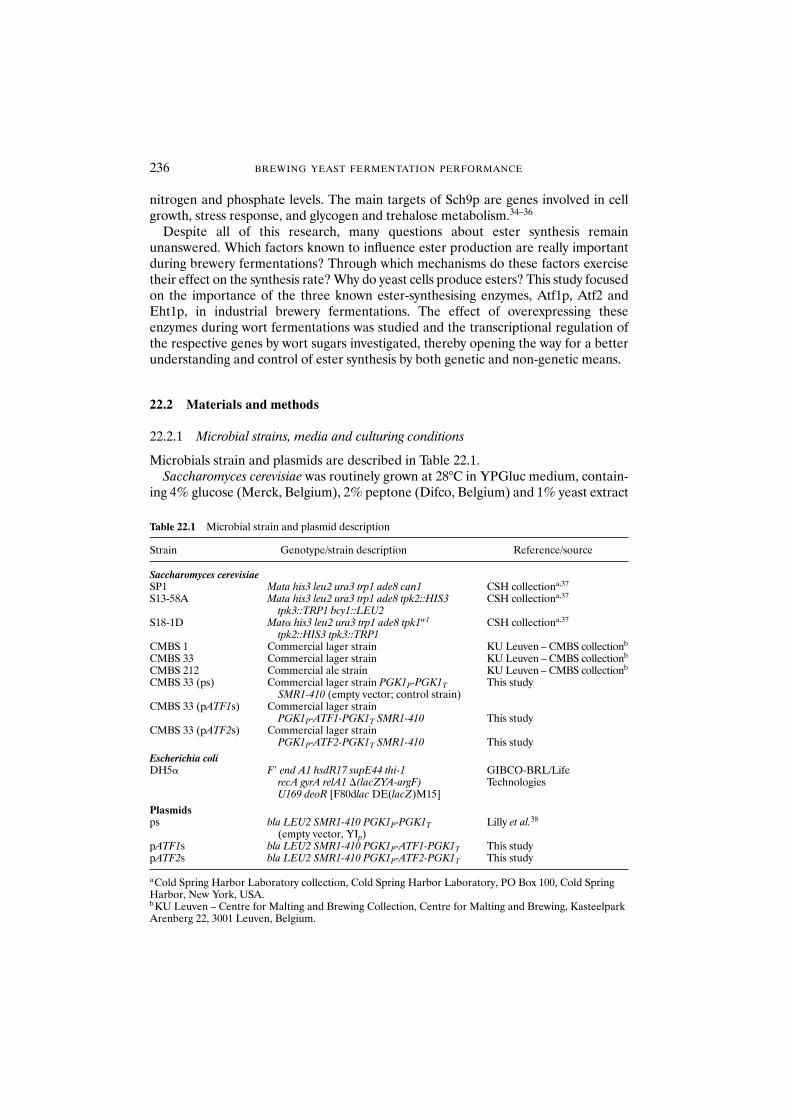
236 BREWING YEAST FERMENTATION PERFORMANCE
nitrogen and phosphate levels. The main targets of Sch9p are genes involved in cellgrowth, stress response, and glycogen and trehalose metabolism.34–36
Despite all of this research, many questions about ester synthesis remainunanswered. Which factors known to influence ester production are really importantduring brewery fermentations? Through which mechanisms do these factors exercisetheir effect on the synthesis rate? Why do yeast cells produce esters? This study focusedon the importance of the three known ester-synthesising enzymes, Atf1p, Atf2 andEht1p, in industrial brewery fermentations. The effect of overexpressing theseenzymes during wort fermentations was studied and the transcriptional regulation ofthe respective genes by wort sugars investigated, thereby opening the way for a betterunderstanding and control of ester synthesis by both genetic and non-genetic means.
22.2 Materials and methods
22.2.1 Microbial strains, media and culturing conditions
Microbials strain and plasmids are described in Table 22.1.Saccharomyces cerevisiae was routinely grown at 28°C in YPGluc medium, contain-
ing 4% glucose (Merck, Belgium), 2% peptone (Difco, Belgium) and 1% yeast extract
Table 22.1 Microbial strain and plasmid description
Strain Genotype/strain description Reference/source
Saccharomyces cerevisiaeSP1 Mata his3 leu2 ura3 trp1 ade8 can1 CSH collectiona,37
S13-58A Mata his3 leu2 ura3 trp1 ade8 tpk2::HIS3 CSH collectiona,37
tpk3::TRP1 bcy1::LEU2S18-1D Mat� his3 leu2 ura3 trp1 ade8 tpk1w1 CSH collectiona,37
tpk2::HIS3 tpk3::TRP1CMBS 1 Commercial lager strain KU Leuven – CMBS collectionb
CMBS 33 Commercial lager strain KU Leuven – CMBS collectionb
CMBS 212 Commercial ale strain KU Leuven – CMBS collectionb
CMBS 33 (ps) Commercial lager strain PGK1P-PGK1T This studySMR1-410 (empty vector; control strain)
CMBS 33 (pATF1s) Commercial lager strainPGK1P-ATF1-PGK1T SMR1-410 This study
CMBS 33 (pATF2s) Commercial lager strainPGK1P-ATF2-PGK1T SMR1-410 This study
Escherichia coliDH5� F� end A1 hsdR17 supE44 thi-1 GIBCO-BRL/Life
recA gyrA relA1 �(lacZYA-argF) TechnologiesU169 deoR [F80dlac DE(lacZ)M15]
Plasmidsps bla LEU2 SMR1-410 PGK1P-PGK1T Lilly et al.38
(empty vector, YIp)pATF1s bla LEU2 SMR1-410 PGK1P-ATF1-PGK1T This studypATF2s bla LEU2 SMR1-410 PGK1P-ATF2-PGK1T This study
aCold Spring Harbor Laboratory collection, Cold Spring Harbor Laboratory, PO Box 100, Cold SpringHarbor, New York, USA.bKU Leuven – Centre for Malting and Brewing Collection, Centre for Malting and Brewing, KasteelparkArenberg 22, 3001 Leuven, Belgium.
(Difco).39 YPMal medium contained 4% maltose (Sigma Chemical Co., Belgium),2% peptone (Difco) and 1% yeast extract (Difco).39 For carbon starvation, YEPmedium was used, containing 2% peptone (Difco) and 1% yeast extract (Difco).Cultures were shaken using an orbital shaker at 50 rpm for test-tubes or a horizontalshaker at 200 rpm for Erlenmeyer flasks. For the selection of yeast transformants min-imal synthetic defined (SD) medium containing 0.67% yeast nitrogen base withoutamino acids (Difco) and 2% glucose (Merck), supplemented with 60 mg/l SMM(Sulfo Meturon Methyl, Du Pont de Nemours), was used.39,40 Escherichia coli wasgrown in Luria-Bertani medium, containing 1% bacto tryptone (Difco), 1% NaCl and0.5% yeast extract (Difco).
22.2.2 DNA manipulations
Standard procedures for isolation and manipulation of DNA were used.41 Restrictionenzymes, T4 DNA ligase and Expand High-Fidelity DNA polymerase (BoehringerMannheim) were used for enzymic DNA manipulations as recommended by the sup-plier. The following primers were used for the amplification of DNA fragments by polymerase chain reaction (PCR): for the ATF1 open reading frame (ORF): XhoI-ATF1-ORF-F: TTGCCTCGAGATGAATGAAATCGATGAGAAAAATC (XhoIrestriction site is underlined) and XhoI-ATF1-ORF-R: TTGCCTCGAGCTAAGG-GCCTAAAAGGAGAGC (XhoI restriction site is underlined). For ATF2 ORF: BglIISalI-ATF2-ORF-F: CCCAGATCTGAGTCGACATGGAAGATATAGAAGGATACG(BglII restriction site is underlined; SalI restriction site is in italic) and BglII SalI-ATF2-ORF-R: CCCAGATCTGACTCGAGTTAAAGCGACGCAAATTCGCCG (BglII siteis underlined, SalI restriction site is in italic). For EHT1 ORF: XhoI-EHT1-ORF-F:TTGCCTCGAGATGTTCAGAAGTTTCCAAATGGCC (XhoI restriction site isunder-lined) and XhoI-EHT1-ORF-R: TTGCCTCGAGTCATACGACTAATTCAT-CAAAC (XhoI restriction site is underlined). For ACT1: ACT1-ORF-F: GCTGCT-TTGGTTATTGATAACG and ACT1-ORF-R: GATAGTGGACCACTTTCGTCG. For HSP12: HSP12-ORF-F: TAGGACGGTGAATTGCGTTC and HSP12-ORF-R:CTGAACTAGAGTATATGCGT. The plasmids pATF1s and pATF2s were constructedby integrating the respective ORFs (ATF1 ORF cut with XhoI; ATF2 ORF cut with SalI)into the XhoI restriction site of the PGK-overexpression cassette of the ps vector. Beforetransformation, the vectors were linearized in the LEU2 gene with EcoRV. Yeast trans-formation was carried out using the LiAc method.42 After transformation, the cells wereplated on SD medium containing 60 mg/l SMM (Dupont de Nemours).40 SMM-resistantcolonies were further analysed by PCR and subsequent restriction analysis to confirmthe integration of the respective PGK overexpression constructs. Northern analysis con-firmed that the respective genes were indeed overexpressed.
22.2.3 Fermentation experiments
For fermentation trials, standard 14°P wort (100% barley malt, no hops added) wasboiled (100°C) for 1.5 h, cooled and subsequently oxygenated to obtain 12 ppm of dis-solved oxygen. Then, 2.5 litre wort was transferred to 3.8 litre tall fermentation tubes(diameter 8 cm, height 75 cm). Yeast precultures were grown aerobically in Erlenmeyer
GENETIC REGULATION OF ESTER SYNTHESIS IN YEAST 237
flasks containing 150 ml YPGluc. Cells were counted using a coulter chamber andharvested by centrifugation at 3000 g. The pitching rate was 13 � 106 cells/ml unlessstated otherwise. The incubation temperature was set at 18°C. Samples were taken10 cm above the fermenter bottom and immediately incubated on ice in airtight tubes.Wort density was measured using an A. Paar DSA-48 density and sound analyser withan SP-1 autosampler.
22.2.4 Sensory analysis
In a double-blind test, beer samples were presented in black tasting glasses to atrained 10-person degustation panel. Each member of the panel received the samplesin a different, random order and was asked to quote the product’s apple, banana,pineapple and solvent-like aromas, and to give an overall appreciation of the fruiti-ness. All quotations were on a scale ranging from 0 to 10.
22.2.5 Headspace analysis for the measurement of acetaldehyde, ethyl acetate, n-propanol, isobutanol, isoamyl alcohol, isoamyl acetate and ethyl caproate
Samples of 5 ml were collected in 15 ml precooled glass tubes, which were immedi-ately closed and cooled on ice. Samples were then analysed using a calibrated Perkin-Elmer Headspace Sampler HS40 Autosystem XL equipped with a Chrompack-Wax52 CB column (length 50 m, internal diameter 0.32 mm, layer thickness 1.2 �m). Theinjection block and FID detector temperatures were kept constant at 180 and 250°C,respectively, and helium was used as carrier gas. Results were analysed using Perkin-Elmer Turbochrom Navigator software.
22.2.6 Liquid chromatography for the measurement of wort sugars
Samples were collected in airtight tubes, cooled on ice and diluted with water toobtain sugar concentrations between 10 and 150 ppm. Samples were analysed using aDionex LC30 high-performance anion-exchange chromatography device with pulsedamperometric detection (Dionex ED40) and a Dionex AS40 automated sampler. Thecolumn was a Carbopac PA100 and the eluation fluid was a mixture of 100 mM NaOHand increasing concentrations of NaAc. The results were analysed with DionexPeaknet 4.10 software. The device was calibrated before every analysis.
22.2.7 Carbon starvation
Yeast precultures were grown on YPGluc medium until mid-exponential phase(adsorbance of 1 at � � 600 nm). After harvesting by centrifugation, the cells werewashed twice with sterile water at room temperature and pitched into 150 ml fresh YPmedium. The cultures were shaken at 28°C in 500 ml Erlenmeyer flasks, sealed with acap. To establish anaerobic conditions, nitrogen gas was flushed continuously throughthe medium. After 4 h of anaerobic carbon starvation, glucose (Merck) or maltose(Sigma) was added from a 40% stock solution to reach a final concentration of 4%.An equal volume of water was added to those cultures where no carbon source was
238 BREWING YEAST FERMENTATION PERFORMANCE
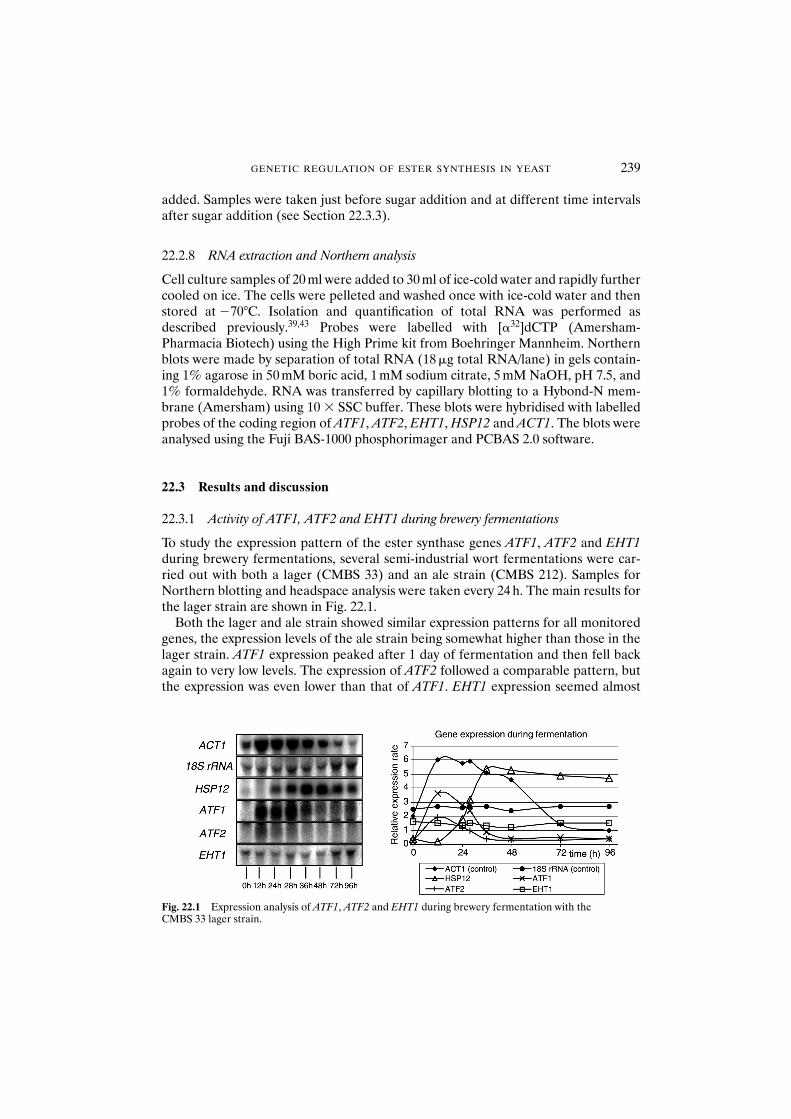
GENETIC REGULATION OF ESTER SYNTHESIS IN YEAST 239
added. Samples were taken just before sugar addition and at different time intervalsafter sugar addition (see Section 22.3.3).
22.2.8 RNA extraction and Northern analysis
Cell culture samples of 20 ml were added to 30 ml of ice-cold water and rapidly furthercooled on ice. The cells were pelleted and washed once with ice-cold water and thenstored at �70°C. Isolation and quantification of total RNA was performed asdescribed previously.39,43 Probes were labelled with [�32]dCTP (Amersham-Pharmacia Biotech) using the High Prime kit from Boehringer Mannheim. Northernblots were made by separation of total RNA (18 �g total RNA/lane) in gels contain-ing 1% agarose in 50 mM boric acid, 1 mM sodium citrate, 5 mM NaOH, pH 7.5, and1% formaldehyde. RNA was transferred by capillary blotting to a Hybond-N mem-brane (Amersham) using 10 � SSC buffer. These blots were hybridised with labelledprobes of the coding region of ATF1, ATF2, EHT1, HSP12 and ACT1. The blots wereanalysed using the Fuji BAS-1000 phosphorimager and PCBAS 2.0 software.
22.3 Results and discussion
22.3.1 Activity of ATF1, ATF2 and EHT1 during brewery fermentations
To study the expression pattern of the ester synthase genes ATF1, ATF2 and EHT1during brewery fermentations, several semi-industrial wort fermentations were car-ried out with both a lager (CMBS 33) and an ale strain (CMBS 212). Samples forNorthern blotting and headspace analysis were taken every 24 h. The main results forthe lager strain are shown in Fig. 22.1.
Both the lager and ale strain showed similar expression patterns for all monitoredgenes, the expression levels of the ale strain being somewhat higher than those in thelager strain. ATF1 expression peaked after 1 day of fermentation and then fell backagain to very low levels. The expression of ATF2 followed a comparable pattern, butthe expression was even lower than that of ATF1. EHT1 expression seemed almost
Fig. 22.1 Expression analysis of ATF1, ATF2 and EHT1 during brewery fermentation with the CMBS 33 lager strain.
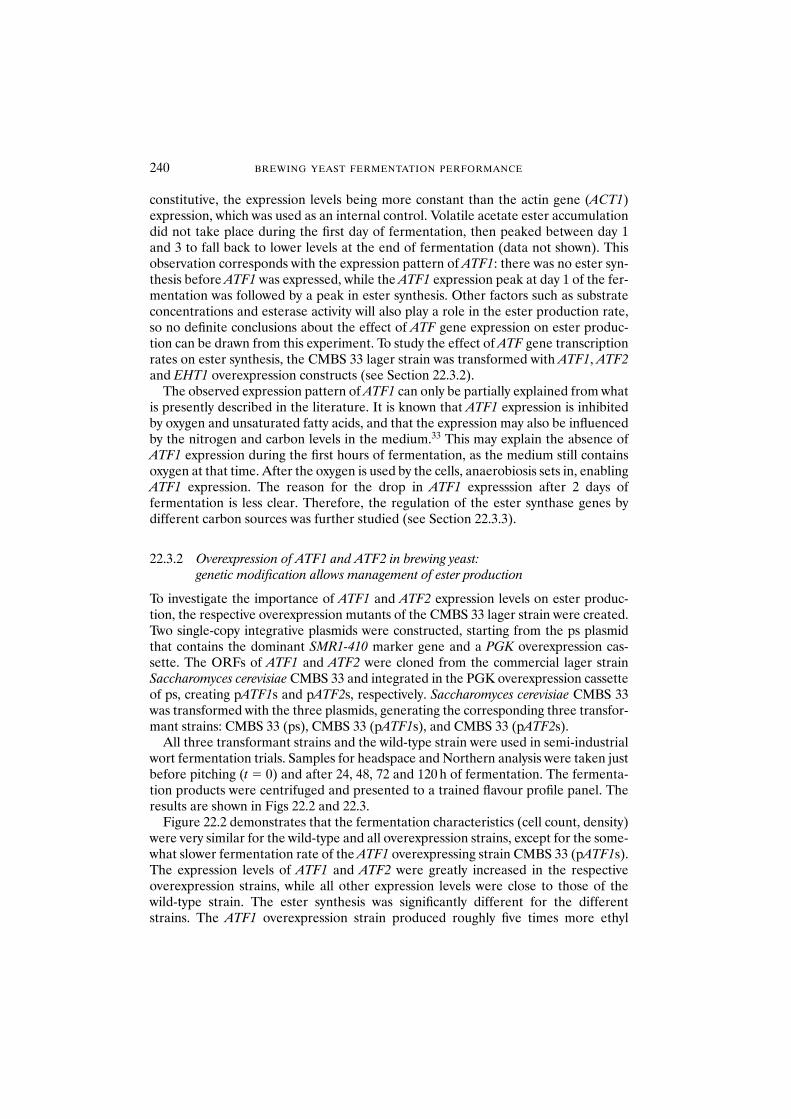
constitutive, the expression levels being more constant than the actin gene (ACT1)expression, which was used as an internal control. Volatile acetate ester accumulationdid not take place during the first day of fermentation, then peaked between day 1and 3 to fall back to lower levels at the end of fermentation (data not shown). Thisobservation corresponds with the expression pattern of ATF1: there was no ester syn-thesis before ATF1 was expressed, while the ATF1 expression peak at day 1 of the fer-mentation was followed by a peak in ester synthesis. Other factors such as substrateconcentrations and esterase activity will also play a role in the ester production rate,so no definite conclusions about the effect of ATF gene expression on ester produc-tion can be drawn from this experiment. To study the effect of ATF gene transcriptionrates on ester synthesis, the CMBS 33 lager strain was transformed with ATF1, ATF2and EHT1 overexpression constructs (see Section 22.3.2).
The observed expression pattern of ATF1 can only be partially explained from whatis presently described in the literature. It is known that ATF1 expression is inhibitedby oxygen and unsaturated fatty acids, and that the expression may also be influencedby the nitrogen and carbon levels in the medium.33 This may explain the absence ofATF1 expression during the first hours of fermentation, as the medium still containsoxygen at that time. After the oxygen is used by the cells, anaerobiosis sets in, enablingATF1 expression. The reason for the drop in ATF1 expresssion after 2 days of fermentation is less clear. Therefore, the regulation of the ester synthase genes by different carbon sources was further studied (see Section 22.3.3).
22.3.2 Overexpression of ATF1 and ATF2 in brewing yeast: genetic modification allows management of ester production
To investigate the importance of ATF1 and ATF2 expression levels on ester produc-tion, the respective overexpression mutants of the CMBS 33 lager strain were created.Two single-copy integrative plasmids were constructed, starting from the ps plasmidthat contains the dominant SMR1-410 marker gene and a PGK overexpression cas-sette. The ORFs of ATF1 and ATF2 were cloned from the commercial lager strainSaccharomyces cerevisiae CMBS 33 and integrated in the PGK overexpression cassetteof ps, creating pATF1s and pATF2s, respectively. Saccharomyces cerevisiae CMBS 33was transformed with the three plasmids, generating the corresponding three transfor-mant strains: CMBS 33 (ps), CMBS 33 (pATF1s), and CMBS 33 (pATF2s).
All three transformant strains and the wild-type strain were used in semi-industrialwort fermentation trials. Samples for headspace and Northern analysis were taken justbefore pitching (t � 0) and after 24, 48, 72 and 120 h of fermentation. The fermenta-tion products were centrifuged and presented to a trained flavour profile panel. Theresults are shown in Figs 22.2 and 22.3.
Figure 22.2 demonstrates that the fermentation characteristics (cell count, density)were very similar for the wild-type and all overexpression strains, except for the some-what slower fermentation rate of the ATF1 overexpressing strain CMBS 33 (pATF1s).The expression levels of ATF1 and ATF2 were greatly increased in the respectiveoverexpression strains, while all other expression levels were close to those of thewild-type strain. The ester synthesis was significantly different for the differentstrains. The ATF1 overexpression strain produced roughly five times more ethyl
240 BREWING YEAST FERMENTATION PERFORMANCE
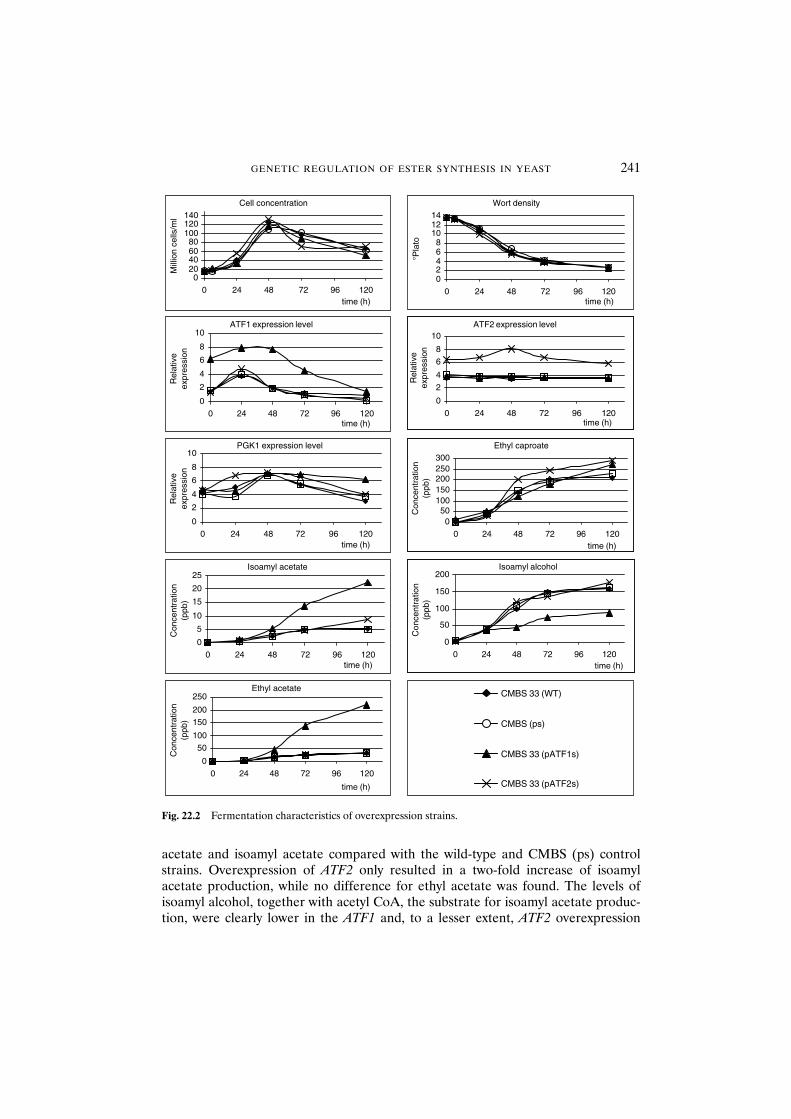
GENETIC REGULATION OF ESTER SYNTHESIS IN YEAST 241
acetate and isoamyl acetate compared with the wild-type and CMBS (ps) controlstrains. Overexpression of ATF2 only resulted in a two-fold increase of isoamylacetate production, while no difference for ethyl acetate was found. The levels ofisoamyl alcohol, together with acetyl CoA, the substrate for isoamyl acetate produc-tion, were clearly lower in the ATF1 and, to a lesser extent, ATF2 overexpression
CMBS 33 (WT)
CMBS (ps)
CMBS 33 (pATF1s)
CMBS 33 (pATF2s)
Cell concentration
020406080
100120140
0 24 48 72 96 120
Mill
ion
cells
/ml
time (h)
Wort density
02468
101214
0 24 48 72 96 120
°Pla
to
time (h)
ATF2 expression level
0
2
4
6
8
10
0 24 48 72 96 120R
elat
ive
expr
essi
ontime (h)
ATF1 expression level
0
2
4
6
8
10
0 24 48 72 96 120
Rel
ativ
eex
pres
sion
time (h)
PGK1 expression level
0
2
4
6
8
10
0 24 48 72 96 120time (h)
Rel
ativ
eex
pres
sion
Ethyl caproate
050
100150200250300
0 24 48 72 96 120time (h)
Con
cent
ratio
n(p
pb)
Isoamyl alcohol
0
50
100
150
200
0 24 48 72 96 120time (h)
Con
cent
ratio
n(p
pb)
Isoamyl acetate
0
5
10
15
20
25
0 24 48 72 96 120time (h)
Con
cent
ratio
n(p
pb)
Ethyl acetate
0
50
100
150
200
250
0 24 48 72 96 120
time (h)
Con
cent
ratio
n(p
pb)
Fig. 22.2 Fermentation characteristics of overexpression strains.
242 BREWING YEAST FERMENTATION PERFORMANCE
strains. The beer produced with the ATF1 overexpression strain contained only80 ppm isoamyl alcohol, as opposed to about 160 ppm for the wild-type strain. The dif-ference of 80 ppm is not fully explained by the extra production of 25 ppm isoamylacetate. This may indicate that the ATF1 overexpression strain produced about80 ppm isoamyl acetate more than the wild-type and that 55 ppm of this extra produc-tion was lost during the fermentation by evaporation.
The results of the flavour profiling of the beers produced with the different strains(Fig. 22.3) demonstrate the clear organoleptic differences between the different fer-mentation products. As expected, the ATF1 and ATF2 overexpression strains pro-duced beers with greatly increased fruitiness. The banana, pineapple and solvent-likeflavours were particularly strong in these beers. It can be noted that the results of theflavour profile almost perfectly match the quantitative headspace analysis.
22.3.3 ATF1 is regulated by glucose through the cyclic AMP/protein kinase A signalling pathway
Apart from their metabolic functions, nutrients also exercise several hormone-likeregulatory effects in brewing yeast. Several distinct nutrient signalling pathways areknown:35,44 one of the best known is the cyclic adenosine monophosphate/proteinkinase A (cAMP/PKA) pathway (Fig. 22.4).
It has been shown that the expression of ATF1 is higher in rich medium than in syn-thetic medium and that Sch9p may be involved in the transcriptional regulation ofATF1.32,33 In a first experiment, the effect of glucose and maltose on the expression ofATF1, ATF2 and EHT1 in laboratory and industrial strains was examined. The cellswere grown aerobically in rich YPGluc medium until mid-exponential phase. Then thecells were washed and resuspended in fresh YP medium without any carbon source.Meanwhile, nitrogen gas was flushed through the cultures in order to achieve theanaerobic conditions necessary for ATF gene expression. After 4 h of anaerobic carbonstarvation, water (control), glucose or maltose was added to the cells to a final concen-tration of 4%. The cells were further anaerobically cultivated while samples for
Fig. 22.3 Flavour profile results of beers produced with overexpression strains. Four different beers were presented to the flavour profile panel: (1) beer produced with the wild-type strain (WT); (2) beer produced with the ATF1 overexpression strain; (3) a mixture of 50% beer 1 and 50% beer 2; and (4) beer produced with the ATF2 overexpression strain.
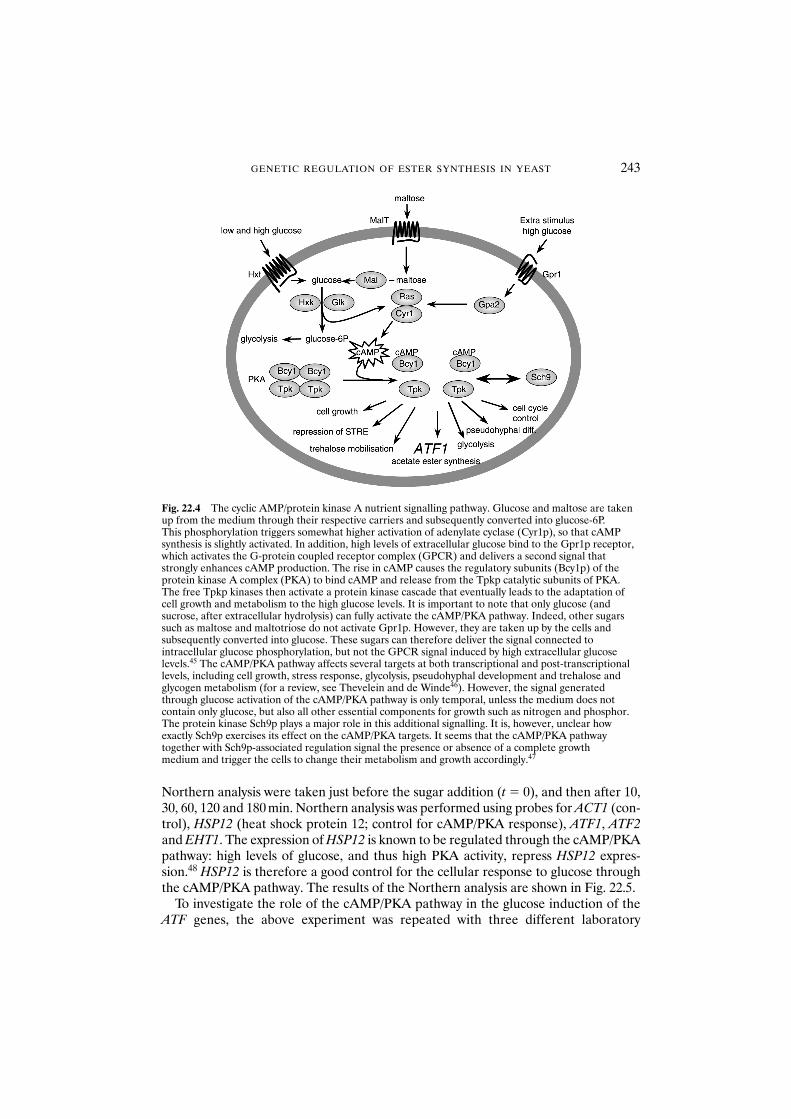
GENETIC REGULATION OF ESTER SYNTHESIS IN YEAST 243
Northern analysis were taken just before the sugar addition (t � 0), and then after 10,30, 60, 120 and 180 min. Northern analysis was performed using probes for ACT1 (con-trol), HSP12 (heat shock protein 12; control for cAMP/PKA response), ATF1, ATF2and EHT1. The expression of HSP12 is known to be regulated through the cAMP/PKApathway: high levels of glucose, and thus high PKA activity, repress HSP12 expres-sion.48 HSP12 is therefore a good control for the cellular response to glucose throughthe cAMP/PKA pathway. The results of the Northern analysis are shown in Fig. 22.5.
To investigate the role of the cAMP/PKA pathway in the glucose induction of theATF genes, the above experiment was repeated with three different laboratory
Fig. 22.4 The cyclic AMP/protein kinase A nutrient signalling pathway. Glucose and maltose are takenup from the medium through their respective carriers and subsequently converted into glucose-6P. This phosphorylation triggers somewhat higher activation of adenylate cyclase (Cyr1p), so that cAMPsynthesis is slightly activated. In addition, high levels of extracellular glucose bind to the Gpr1p receptor,which activates the G-protein coupled receptor complex (GPCR) and delivers a second signal thatstrongly enhances cAMP production. The rise in cAMP causes the regulatory subunits (Bcy1p) of theprotein kinase A complex (PKA) to bind cAMP and release from the Tpkp catalytic subunits of PKA.The free Tpkp kinases then activate a protein kinase cascade that eventually leads to the adaptation ofcell growth and metabolism to the high glucose levels. It is important to note that only glucose (andsucrose, after extracellular hydrolysis) can fully activate the cAMP/PKA pathway. Indeed, other sugarssuch as maltose and maltotriose do not activate Gpr1p. However, they are taken up by the cells and subsequently converted into glucose. These sugars can therefore deliver the signal connected to intracellular glucose phosphorylation, but not the GPCR signal induced by high extracellular glucose levels.45 The cAMP/PKA pathway affects several targets at both transcriptional and post-transcriptionallevels, including cell growth, stress response, glycolysis, pseudohyphal development and trehalose andglycogen metabolism (for a review, see Thevelein and de Winde46). However, the signal generatedthrough glucose activation of the cAMP/PKA pathway is only temporal, unless the medium does not contain only glucose, but also all other essential components for growth such as nitrogen and phosphor.The protein kinase Sch9p plays a major role in this additional signalling. It is, however, unclear howexactly Sch9p exercises its effect on the cAMP/PKA targets. It seems that the cAMP/PKA pathwaytogether with Sch9p-associated regulation signal the presence or absence of a complete growth medium and trigger the cells to change their metabolism and growth accordingly.47
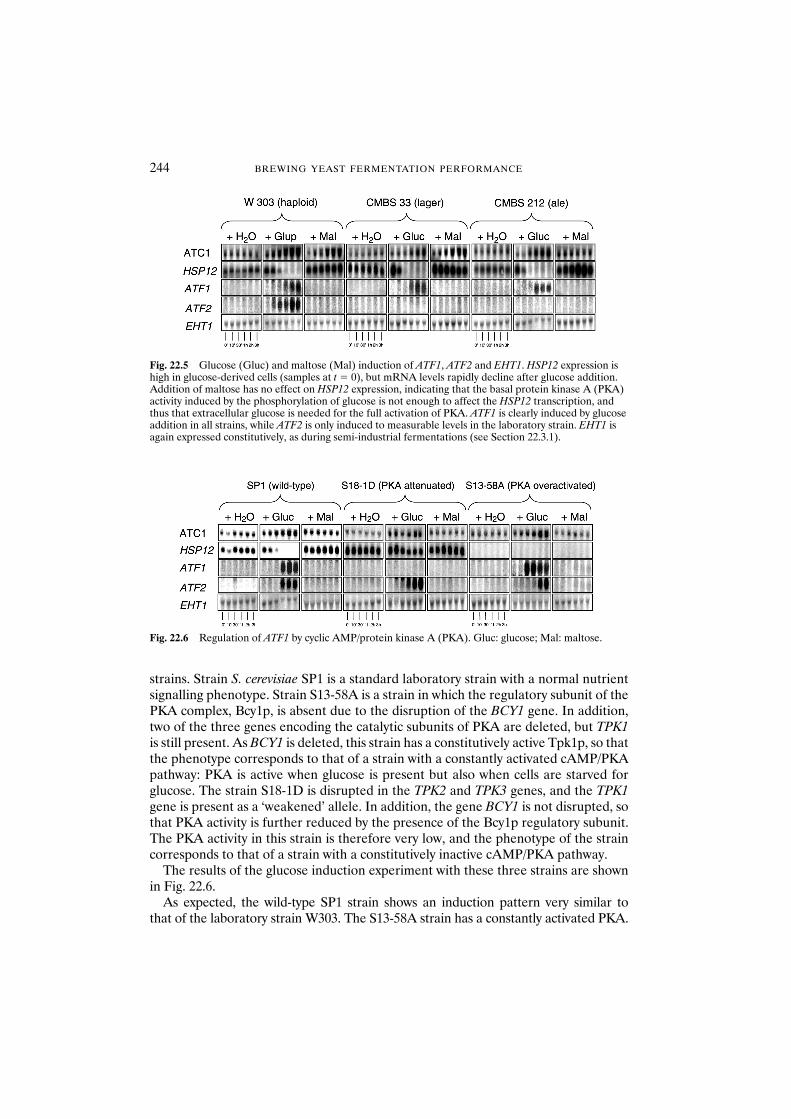
244 BREWING YEAST FERMENTATION PERFORMANCE
strains. Strain S. cerevisiae SP1 is a standard laboratory strain with a normal nutrientsignalling phenotype. Strain S13-58A is a strain in which the regulatory subunit of thePKA complex, Bcy1p, is absent due to the disruption of the BCY1 gene. In addition,two of the three genes encoding the catalytic subunits of PKA are deleted, but TPK1is still present. As BCY1 is deleted, this strain has a constitutively active Tpk1p, so thatthe phenotype corresponds to that of a strain with a constantly activated cAMP/PKApathway: PKA is active when glucose is present but also when cells are starved forglucose. The strain S18-1D is disrupted in the TPK2 and TPK3 genes, and the TPK1gene is present as a ‘weakened’ allele. In addition, the gene BCY1 is not disrupted, sothat PKA activity is further reduced by the presence of the Bcy1p regulatory subunit.The PKA activity in this strain is therefore very low, and the phenotype of the straincorresponds to that of a strain with a constitutively inactive cAMP/PKA pathway.
The results of the glucose induction experiment with these three strains are shownin Fig. 22.6.
As expected, the wild-type SP1 strain shows an induction pattern very similar to that of the laboratory strain W303. The S13-58A strain has a constantly activated PKA.
Fig. 22.5 Glucose (Gluc) and maltose (Mal) induction of ATF1, ATF2 and EHT1. HSP12 expression ishigh in glucose-derived cells (samples at t � 0), but mRNA levels rapidly decline after glucose addition.Addition of maltose has no effect on HSP12 expression, indicating that the basal protein kinase A (PKA)activity induced by the phosphorylation of glucose is not enough to affect the HSP12 transcription, andthus that extracellular glucose is needed for the full activation of PKA. ATF1 is clearly induced by glucoseaddition in all strains, while ATF2 is only induced to measurable levels in the laboratory strain. EHT1 isagain expressed constitutively, as during semi-industrial fermentations (see Section 22.3.1).
Fig. 22.6 Regulation of ATF1 by cyclic AMP/protein kinase A (PKA). Gluc: glucose; Mal: maltose.
GENETIC REGULATION OF ESTER SYNTHESIS IN YEAST 245
This is reflected in the absence of HSP12 expression in all samples: even when the cells arestarved for carbon, PKA is active and constitutively represses HSP12 expression. Theinduction of ATF1 and ATF2 is comparable to that of the wild-type strain, the only dif-ference being the faster induction in the S13-58A strain. Because of its constitutively lowPKA activity, the S18-1D strain cannot adapt the expression levels of the cAMP/PKAtarget genes as a response to glucose. As a consequence, HSP12 is expressed continu-ously, even after the addition of glucose. ATF1 is not expressed in this strain, while theexpression of ATF2 is delayed. The expression of EHT1 is again almost constitutive,although the S18-1D strain shows a slight reduction in EHT1 expression levels.
These results confirm that both ATF1 and ATF2 are glucose induced, while EHT1seems to be expressed almost constitutively. The glucose induction of ATF1 is clearlyestablished through the cAMP/PKA pathway, since ATF1 expression is enhanced inthe PKA-overactivated strain S13-58A and abolished in the PKA attenuated S18-1Dstrain. Hence, ATF1 is a new target of the cAMP/PKA pathway. The induction ofATF2 is at least partially independent of cAMP/PKA activity, as there is still an induc-tion present in the S18-1D strain.
22.4 Conclusions
The AATase-encoding genes ATF1 and ATF2 are weakly expressed during breweryfermentations, with a peak in expression between 12 and 36 h of fermentation. Thisstudy shows that overexpression of the yeast AATase encoding genes ATF1 and ATF2strongly raises the volatile acetate ester production during industrial wort fermenta-tions. Overexpression of ATF1 leads to a severe increase in both ethyl acetate andisoamyl acetate, while ATF2 overexpression only raises the isoamyl acetate levels.These overexpression studies prove that the transcription rate of ATF1 and ATF2, andthus the total enzymic AATaseI and AATaseII activity, is a limiting factor in acetateester production during brewery fermentations. Furthermore, as the ester productionwas raised with factors ranging from 2 to 5, the substrate concentrations duringfermentation were apparently high enough to enable such high ester production rates. This indicates that although substrate concentrations certainly influence ester production, the main limiting factor may be enzyme activity. Also, it is shown that genetic modification of brewing yeast can be used to obtain yeast strainsproducing more or less isoamyl acetate and/or ethyl acetate. The use of specific
sequences for overexpression should allow the creation of a yeast strain that produces exactly the amount of acetate esters desired by the brewer. At present, however, negative public perception and a sceptical industry remain obstacles to theexploitation of the staggering opportunities offered by genetic modification.
This study also opens opportunities to control yeast ester production without usinggenetically modified yeast. Since the gene transcription rate of ATF1 and ATF2significantly affects ester production, any fermentation factor that changes the transcription rate of either gene is bound to have an effect on ester production. Manyof these factors are already known. Dissolved oxygen and unsaturated fatty acids inthe wort affect ester production, probably through repression of ATF1 expression.This study demonstrates that glucose induces ATF1 and ATF2 expression.
There are several implications of the finding that the cAMP/PKA pathway controlsATF1 expression. It is clear that ATF1 is only maximally expressed when glucose ispresent in the medium. Moreover, as there is a connection between the cAMP/PKApathway and Sch9p, which responds not only to glucose, but also to nitrogen andphosphor levels in the medium, it can be expected that these components will alsoaffect ATF1 expression. This supports the suggestion that nitrogen may play a role inATF1 regulation through Sch9p.33 The cAMP/PKA/Sch9p regulation of ATF1 mayoffer an explanation for the previous observation that wort composition affects esterproduction. Indeed, it is well known that fermentation of high-glucose and high-nitrogenworts results in an increased ester concentration, while low-nitrogen and high-maltoseworts give lower ester concentrations. These observations could be the result ofchanges in the ATF1 expression level, which is expected to be higher in nitrogen-richglucose medium than in low-nitrogen maltose medium. In fact, the cAMP/PKAregulation of ATF1 gene expression may also explain the drop in ATF1 transcriptionafter 36 h of fermentation, when glucose and nitrogen become more limited in thefermenting medium. However, the precise importance and influence of nitrogen andother medium components on ATF1 expression levels under industrial fermentationconditions remain to be established.
It is becoming more and more clear that ester synthesis in brewing yeast is a complexprocess that is mainly controlled through the multiple regulation of the ATF genes.Further research in this field may therefore open up new possibilities for a bettercontrol of aromatic ester synthesis during brewery fermentations.
Acknowledgements
The authors wish to thank Ir. B. Janssens and Ir. M. Kelgtermans for their theoreticaland practical assistance with the chromatographic analysis. We are also grateful toIr. V. Vanvoorden and Ir. D. Roekaerts for their excellent help. K.J. Verstrepen wishesto thank the Fund for Scientific Research–Flanders for the research fellowship.
References
1. Nordström, K. (1964) Formation of esters from alcohols by brewer’s yeast. J. Inst. Brew. 70, 328–336.2. Meilgaard, M.C. (1975) Flavor Chemistry of Beer. Flavor and threshold of 239 aroma volatiles. Tech.
Q. Masters Brew. Assoc. Am. 12, 151–168.3. Malcorps, P. and Dufour, J.-P. (1992) Short-chain and medium chain aliphatic ester synthesis in
Saccharomyces cerevisiae. Eur. J. Biochem. 210, 1015–1022.4. Fujii, T., Nagasawa, N., Iwamatsu, A. et al. (1994) Molecular cloning, sequence analysis and expression
of the yeast alcohol acetyltransferase gene. Appl. Environ. Microbiol. 60, 2786–2792.5. Nagasawa, N., Bogaki, T., Iwamatsu, A. et al. (1998) Cloning and nucleotide sequence of the alcohol
acetyltransferase II gene (ATF2) from Saccharomyces cerevisiae Kyokai No. 7. Biosci. Biotechnol.Biochem. 62, 1852–1857.
6. Fujii, T., Yoshimoto, H. and Tamai, T. (1996) Acetate ester production by Saccharomyces cerevisiaelacking the ATF1 gene encoding the alcohol acetyltransferase. J. Ferment. Bioeng. 81, 538–542.
7. Fujii, T., Yoshimoto, H., Nagasawa, N. et al. (1996) Nucleotide sequence of alcohol acetyltransferasegenes from lager brewing yeast, Saccharomyces carlsbergensis. Yeast 12, 593–598.
8. Mason, B. and Dufour, J.-P. (2000) Alcohol acetyltransferases and the significance of ester synthesis inyeast. Yeast 16, 1287–1298.
246 BREWING YEAST FERMENTATION PERFORMANCE
9. Fukuda, K., Yamamoto, N., Kiyokawa, Y. et al. (1998) Balance of activities of alcohol acetyltransferaseand esterase in Saccharomyces cerevisiae is important for production of isoamyl acetate. Appl. Environ.Microbiol. 64, 4076–4078.
10. Peddie, H.A.B. (1990) Ester formation in brewery fermentations. J. Inst. Brew. 96, 327–331.11. Nykänen, L. and Nykänen, I. (1977) Production of esters by different yeast strains in sugar fermenta-
tions. J. Inst. Brew. 83, 30–31.12. Engan, S. (1974) Esters in beer. Brew. Digest 49, 40–48.13. Maule, D.R.J. (1967) Rapid gas chromatographic examination of beer flavour. J. Inst. Brew. 73,
351–361.14. Sablayrolles, J.M. and Ball, C.B. (1995) Fermentation kinetics and the production of volatiles during
alcoholic fermentation. J. Am. Soc. Brew. Chem. 53, 72–78.15. Renger, R.S., Van Hateren, S.H. and Luyben, K.C.A.M. (1992) The formation of esters and higher
alcohols during brewery fermentation – the effect of carbon dioxide pressure. J. Inst. Brew. 98, 509–513.16. Landaud, S., Latrille, E. and Corrieu, G. (2001) Top pressure and fermentation control the fusel alco-
hol/ester ratio through yeast growth in beer fermentation. J. Inst. Brew. 107, 107–117.17. Hammond, J.R.M. (1993) Brewer’s yeast. In: The Yeasts, Vol. 5, Rose, H.A. and Harrison, J.S. (eds).
Academic Press, London, pp. 7–67.18. Pfisterer, E. and Stewart, G.G. (1975) Some aspects on the fermentation of high gravity worts. Proc.
Cong. Eur. Brew. Conv. 15, 255–267.19. White, F.H. and Portno, A.D. (1979) The influence of wort composition on beer ester levels. Proc.
Cong. Eur. Brew. Conv. 17, 447–460.20. Younis, O.S. and Stewart, G.G. (1998) Sugar uptake and subsequent ester and higher alcohol produc-
tion production by Saccharomyces cerevisiae. J. Inst. Brew. 104, 255–264.21. Younis, O.S. and Stewart, G.G. (2000) The effect of wort maltose content on volatile production and
fermentation performance in brewing yeast. In: Brewing Yeast Fermentation Performance, Smart K.(ed.). Blackwell Science, Oxford, pp. 170–176.
22. Anderson, R.G. and Kirsop, B.H. (1975) Oxygen as a regulator of ester accumulation during the fermentation of wort of high specific gravity. J. Inst. Brew. 81, 111–115.
23. Anderson, R.G. and Kirsop, B.H. (1975) Quantitative aspects of the control by oxygenation of acetateester concentration in beer obtained from high-gravity wort. J. Inst. Brew. 81, 296–301.
24. Avhenainen, J. and Mäkinen, V. (1989) The effect of pitching yeast aeration on fermentation and beerflavor. Proc. Cong. Eur. Brew. Conv. 22, 517–519.
25. Thurston, P.A., Taylor, R. and Ahvenainen, J. (1981) Effects of linoleic acids supplements on the synthesis by yeasts of lipids and acetate esters. J. Inst. Brew. 87, 92–95.
26. Thurston, P.A., Quain, D.E. and Tubb, R.S. (1982) Lipid metabolism and the regulation of volatile synthesis in Saccharomyces cerevisiae. J. Inst. Brew. 88, 90–94.
27. Yoshioka, K. and Hashimoto, N. (1984) Acetyl-CoA of brewer’s yeast and formation of acetate esters.Agric. Biol. Chem. 48, 207–209.
28. Calderbank, J. and Hammond, J.R.M. (1994) Influence of higher alcohol availability on ester forma-tion by yeast. J. Am. Soc. Brew. Chem. 52, 84–90.
29. Quain , D.E. and Duffield, M.L. (1985) A metabolic function for higher alcohol production in yeast.Proc. Eur. Brew. Cong. 20, 307–314.
30. Taylor, G.T., Thurston, P.A. and Kirsop, B.H. (1979) Influence of lipids derived from malt spent grainson yeast metabolism and fermentation. J. Inst. Brew. 85, 219–227.
31. Malcorps, P., Cheval, J.M., Jamil, S. and Dufour, J.-P. (1991) A new model for the regulation of estersynthesis by alcohol acetyltransferase in Saccharomyces cerevisiae. J. Am. Soc. Brew. Chem. 49, 47–53.
32. Fujiwara, D., Yoshimoto, H., Sone, H. et al. (1998) Transcriptional co-regulation of Saccharomycescerevisiae alcohol acetyltransferase gene ATF1 and D-9 fatty acid desaturase gene, OLE1 by unsatu-rated fatty acids. Yeast 14, 711–721.
33. Fujiwara, D., Kobayashi, O., Yoshimoto, H. et al. (1999) Molecular mechanisms of the multiple regu-lation of the Saccharomyces cerevisiae ATF1 gene encoding alcohol acetyltransferase. Yeast 15,1183–1197.
34. Thevelein, J.M. and Beulens, M. (1985) Cyclic AMP and the stimulation of threhalase activity in theyeast Saccharomyces cerevisiae by carbon sources, nitrogen and inhibitors of protein synthesis. J. Gen.Microbiol. 131, 3199–3209.
35. Thevelein, J.M. (1994) Signal transduction in yeast. Yeast 10, 1753–1790.36. Crauwels, M., Donaton, M.C.V., Pernambuco, M.B. et al. (1997) The Sch9 protein kinase in the yeast
Saccharomyces cerevisiae controls cAPK activity and is required for activation of the fermentable-growth-medium-induced (FGM) pathway. Microbiology 143, 2627–2637.
37. Cameron, S., Levin, L., Zoller, M. and Wigler, M. (1988) cAMP-independent control of sporulation,glycogen metabolism and heat-shock resistance in S. cerevisiae. Cell 53, 555–566.
GENETIC REGULATION OF ESTER SYNTHESIS IN YEAST 247
248 BREWING YEAST FERMENTATION PERFORMANCE
38. Lilly, M., Lambrechts, M.G. and Pretorius, I.S. (2000) Effect of increased yeast alcohol acetyltrans-ferase activity on flavor profiles of wine and distillates. Appl. Environ. Microbiol. 66, 744–753.
39. Sherman, F., Fink, G.R. and Hicks, J. (1991) Methods in Yeast Genetics. Cold Spring Harbor LaboratoryPress, Cold Spring Harbor, NY, 263 pp.
40. Casey, G.P., Xiao, W. and Rank, G.H. (1988) A convenient dominant selection marker for gene trans-fer in industrial strains of Saccharomyces cerevisiae: SMR1 encoded resistance to the herbicidesulfometuron methyl. J. Inst. Brew. 94, 93–97.
41. Aussubel, F.M.R., Brent, R., Kingston, R.E. et al. (1994) Current Protocols in Molecular Biology. JohnWiley and Sons, New York.
42. Gietz, R.D. and Schiestl, R.H. (1995) Transforming yeast with DNA. Methods Mol. Cell. Biol. 5,255–269.
43. Pernambuco, M.B., Winderickx, J., Crauwels, M. et al. (1996) Differential requirement for sugar phos-phorylation in cells of the yeast Saccharomyces cerevisiae grown on glucose or grown on non-fermentable carbon sources for glucose-triggered signalling phenomena. Microbiology 142, 1775–1882.
44. Rolland, F., Winderickx, J. and Thevelein, J.M. (2001) Glucose-sensing mechanisms in eukaryotic cells.Trends Biochem. Sci. 26, 310–317.
45. Rolland, F., Wanke, V., Cauwenberg, L. et al. (2001) The role of hexose transport and phosphorylationin cAMP signalling in the yeast Saccharomyces cerevisiae. FEMS Yeast Res. 1403, 1–13.
46. Thevelein, J.M. and De Winde, J. (1999) Novel sensing mechanisms and targets for the cAMP-proteinkinase A pathway in the yeast Saccharomyces cerevisiae. Mol. Microbiol. 33, 904–918.
47. Thevelein, J.M., Cauwenberg, L., Colombo, S. et al. (2000) Nutrient-induced signalling transductionthrough the protein kinase A pathway and its role in the control of metabolism, stress resistance andgrowth in yeast. Enzyme Microb. Tech. 26, 819–825.
48. Varela, J.C.S., Praekelt, U.M., Meacock, P.A. et al. (1995) The Saccharomyces cerevisiae HSP12 gene isactivated by the high-osmolarity glycerol pathway and negatively regulated by protein kinase A. Mol.Cell. Biol. 15, 6232–6245.

Part 6 Yeast Handling: Objectives, Obstacles andOpportunities
23 Yeast Propagation
G.A. HULSE
Abstract Of the users of yeast, brewers are atypical in that they collect yeast from onefermentation and reuse it in subsequent fermentations. It is perhaps pertinent then to askwhy brewers propagate yeast. Brewers typically scrap yeast after a predetermined numberof reuses and replace with freshly propagated yeast. This is often a balance between con-tamination risk and atypical fermentation performance on the one hand and economicalissues of beer loss on the other.
The first yeast propagation plant (for brewing purposes) has been attributed to Hansenand Kuhle and was based on the principles of batch propagation. Since those times manyvariations ranging from batch systems to continuous systems have been tried for yeastpropagation. These have been designed on principles obtained from both tradition andscientific observation.
The objective of current-day yeast propagation is to obtain sufficient yeast in the short-est possible time to pitch a zero-generation fermentation. The plant and philosophy chosenshould deliver yeast that is fit to ferment and should produce yeast that is consistent in per-formance from batch to batch. As such, conventional yeast propagation plants operatedaccording to traditional methods do not meet present-day requirements. The focus of this paper is to review yeast propagation and in so doing to cover historical and presentmethods and to open discussion on where the future of yeast propagation may lie.
23.1 Introduction
The purpose of this paper is to offer a brief review of the history of yeast propagationfor the purpose of brewing beer. By reviewing the literature of historical practices andcurrent practices, themes and trends will be discussed. An attempt will be made todispel some of the myths that exist in yeast propagation practices and to offer someideas for the way forward. The concluding remarks will pose the question of how far one should optimise yeast propagation, since brewing is a compromise of manyunit operations and, as such, overoptimisation of one aspect of the process may bedetrimental to subsequent unit operations.
Brewing history originated with spontaneous natural fermentations. It was not until the work of Emil Hansen, as described by Jones,1 that the benefits of using purecultures were understood. To be able to adopt the practice of using pure culturesbrewers were required to know and understand three key technologies:
• strain purification• strain maintenance within a culture collection• propagation of the selected yeast strain from a few cells to produce sufficient yeast
for a full-scale fermentation.
It is perhaps relevant to understand some of the reasons why brewers propagateyeast, since at the end of each fermentation cycle brewers harvest the yeast for reuse
Brewing Yeast Fermentation Performance: Second edition
Edited by: KATHERINE SMART Copyright 0 Blackwell Science 2003
in subsequent fermentations. Typically, the reasons brewers give for propagating yeastare covered in the following points:
• to permit the use of pure cultures• to accommodate changes in behaviour as a result of cropping practices• to prevent deterioration in yeast fermentation performance in subsequent
fermentations• to eliminate the presence of contaminants• to reduce the risk of mutations• tradition.
The first three points address the requirements for consistent fermentation per-formance (brewers requirement) and resultant consistent product (consumer’srequirement). The next two points address the safety requirement for the continuationof yeast propagation, and the last point is a powerful one in that it has become trad-itional to propagate yeast. Since brewers propagate yeast it is desirable to understandthe ideal objectives of yeast propagation, most of which are found as answers as to whybrewers propagate yeast. The principal objective of yeast propagation is to producesufficient yeast for a full-scale production fermenter. The yeast should be produced inthe shortest possible time, ensuring stress-free growth while meeting plant constraints(such as wort availability and brewhouse cycle times). At the end of propagation thepropagated yeast should have the desired physiological condition to deliver the desiredfermentation performance. This should be consistent from propagation to propaga-tion. The propagated yeast should be free from variants and contaminants.
23.2 Historical perspective
Historically, yeast propagation was characterised by small-scale fermentations grad-ually increasing in size until sufficient yeast was produced to pitch a full-scale produc-tion fermenter. Typically, dilution steps were kept to less than 10-fold increases,aeration was minimal and temperatures were matched to those of fermentation. Thecell productivity of such systems was low (in the order of 70 million cells/ml).
Thus, the shortcomings of the historical practices can be summarised as follows.
• The cycle required a lot of time.• The conversion of nutrients into biomass was inefficient.• The resultant yeast produced was of low vitality owing to low oxygen supply.
23.3 Current perspective
The changes from historical practices to current practices could not have occurred hadthere not been certain drivers in the industry. As beer production increased so did thesize of the fermenters, resulting in more stressful fermentations due to increased fer-menter volumes, resulting in greater wort depths with resultant increased hydrostaticpressures. This, in turn, resulted in increased carbon dioxide concentrations, leading toincreased toxicity effects. The practice of high-gravity fermentation compounded these
252 BREWING YEAST FERMENTATION PERFORMANCE
issues. At the same time, consumers were becoming more discerning in their taste,and thus product and fermentation had to become more consistent. Together, thesedrivers demanded a more vital and healthy yeast capable of dealing with the increasedfermentaion pressures in a manner that delivered a consistent product to the con-sumer. Brewers were also facing cost pressures, so it was essential that their fermen-tations were consistent to maximise plant utilisation while lowering operating costs.One route to achieving the above was to improve yeast propagation, to address thelong yeast propagation cycle time and low yeast vitality.
Through the efforts of O’Connor Cox et al.,2 Lodolo3 and others an understandingof the requirements of brewing yeast for oxygen has been developed. In parallel, otherusers of yeast, such as the producers of active dried yeast, had understood the bene-fits of aerobic yeast propagation in terms of both efficient conversion of carbohydrateto biomass and improved vitality of the propagated yeast. Aerobic yeast propagationsare becoming increasingly common in today’s brewing industry.4–8 Indeed, the prem-ise in the early days of believing that the best way in which to propagate yeast was bybatch fermentations of increasing volume appears to be flawed. It was only with therealisation that the objective of yeast propagation is to grow yeast and the objective offermentation is to ferment with little yeast growth that real progress was made in theunderstanding of yeast propagation. Propagation is about generating biomass and fermentation about generating alcohol and flavour compounds.
As stated earlier, current yeast propagation practices are becoming more aerobic innature. Yeast growth follows the standard growth curve characterised by a lag phaseimmediately after inoculation into fresh medium, followed by exponential growth orthe logarithmic growth phase, and at the exhaustion of a limiting nutrient the station-ary phase is entered. Logarithmic growth is characterised by rapid, unstressed growththat fits an exponential curve; during this stage the yeast is growing as rapidly as pos-sible. The stationary phase is characterised by a slow growth rate with little increase inbiomass, owing to a nutrient (or nutrients) falling below a limiting concentration.Biomass productivity per unit time is highest during the logarithmic phase of growthand lowest during the stationary phase. Work by Hulse et al.9 confirmed that the opti-mum time to transfer yeast from one stage of propagation to the next is in the late loga-rithmic stage of growth, before the onset of stationary phase. This offers timeadvantages in that the subsequent lag phase of growth is minimised and the propa-gated yeast is not subjected to any nutrient stress. It is essential that this transfer doesnot take place too early in the logarithmic phase of growth, to ensure that the fullcomplement of sugar uptake and transport genes has been switched on. Hulse et al.demonstrated that large dilution steps in the order of 400-fold are not detrimental to the subsequent stage of propagation. In addition, current practices are charac-terised by a gradual stepping-down in temperature until the specified fermentationtemperature is reached. This is done to take advantage of the higher growth ratesobtainable at higher temperatures, thus improving the time efficiency of the completepropagation cycle.
Research into yeast propagation over the past few years has concentrated onincreasing the biomass productivity of the systems by focusing on the role of nutrientsand improving aeration, with some work into alternative systems such as fed-batchand continuous systems. In the author’s laboratory it has been demonstrated that
YEAST PROPAGATION 253
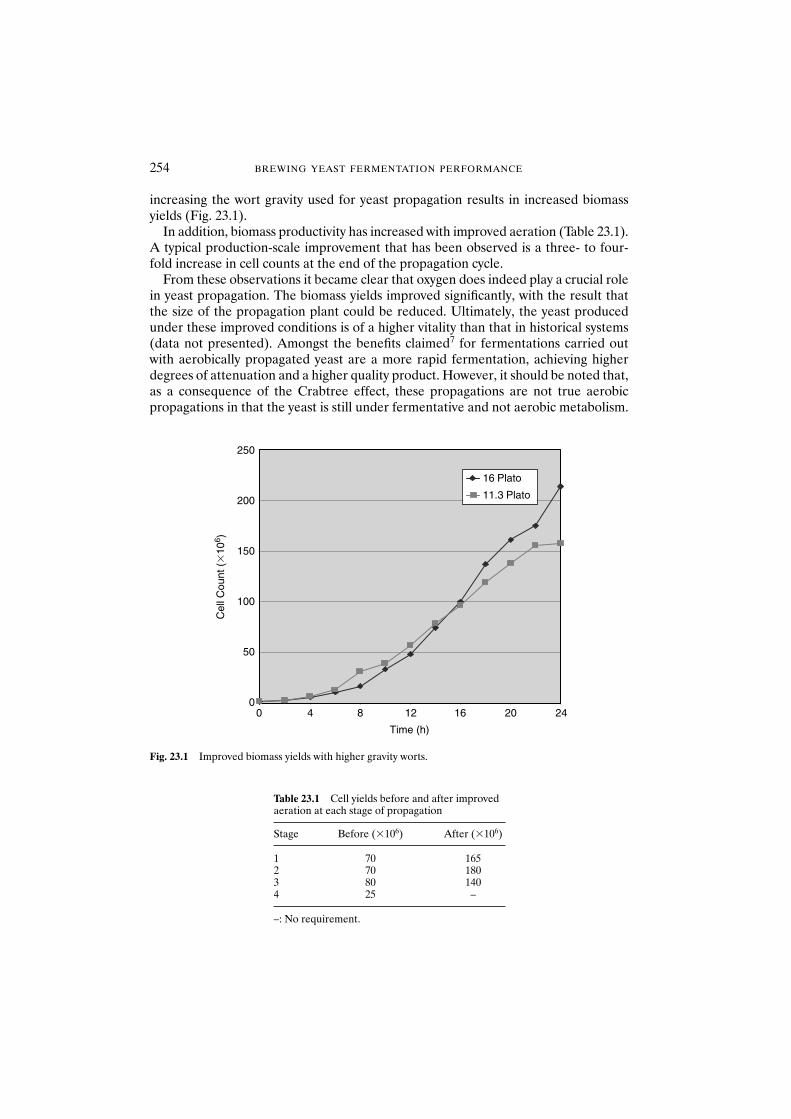
increasing the wort gravity used for yeast propagation results in increased biomassyields (Fig. 23.1).
In addition, biomass productivity has increased with improved aeration (Table 23.1).A typical production-scale improvement that has been observed is a three- to four-fold increase in cell counts at the end of the propagation cycle.
From these observations it became clear that oxygen does indeed play a crucial rolein yeast propagation. The biomass yields improved significantly, with the result thatthe size of the propagation plant could be reduced. Ultimately, the yeast producedunder these improved conditions is of a higher vitality than that in historical systems(data not presented). Amongst the benefits claimed7 for fermentations carried outwith aerobically propagated yeast are a more rapid fermentation, achieving higherdegrees of attenuation and a higher quality product. However, it should be noted that,as a consequence of the Crabtree effect, these propagations are not true aerobicpropagations in that the yeast is still under fermentative and not aerobic metabolism.
254 BREWING YEAST FERMENTATION PERFORMANCE
00 4 8 12 16 20 24
50
100
150
200
250
Cel
l Cou
nt (
�10
6 )
Time (h)
16 Plato
11.3 Plato
Fig. 23.1 Improved biomass yields with higher gravity worts.
Table 23.1 Cell yields before and after improvedaeration at each stage of propagation
Stage Before (�106) After (�106)
1 70 1652 70 1803 80 1404 25 –
–: No requirement.
These claims would allow for the use of decreased pitching rates and/or reduced fer-mentation temperatures while still retaining the same process time. Von Nida7 furtherclaimed that the yeast crop produced by means of an aerobic propagation process hasa lower tendency to autolysis. This will have obvious product benefits in terms of tasteand head. A prime drawback of highly aerobic propagation systems is the vastamounts of foam formed. Thus, vessels have to have considerable freeboard, makingthem inefficient in terms of space utilisation. The foam produced may also result in aloss of desired foam-positive proteins. Thus, it becomes important to understand howmuch oxygen is required and to design a means whereby only that amount is deliveredto the propagation vessel. The delivery of oxygen to the vessel should be carried outin a manner that produces as little foam as possible.
To summarise current practices compared with historical practices: current prac-tices are more aerobic in nature, the dilution steps are much larger, requiring fewerstages, and typically the temperatures used are higher. Thus, the current style of yeastpropagation is more efficient in terms of time and vessel requirements.
23.4 Future perspectives
In terms of the future directions of yeast propagation, it is possibly time to extend thework on maximising substrate to biomass conversion by ensuring that the conditions aresuch that true aerobic growth occurs with no production of ethanol. Such propagationsystems have been the standard for producers of dried yeast for some time, and know-ledge of how yeast ferments after true aerobic growth should be acquired. This couldlead to the adoption of fed-batch or semi-continuous systems with or without the use ofnovel substrates. However, several questions about such practices need to be answered.
• Does true aerobically grown yeast retain and display the desired brewing characteristics?
• Can existing beers be flavour-matched with beers produced from true aerobicallypropagated yeast?
• Should the mode and extent of aeration be continuous or intermittent, and to whatdissolved oxygen concentration?
• What are the nutrient and supplementation requirements?• What is the optimal temperature to develop the best compromise between growth
rate, cold shock and the ability to ferment wort to the desired specification?• Should all fermentations be pitched with freshly propagated yeast?
By providing answers to the above questions the future direction of yeast propagationwill be mapped out.
23.5 Conclusions
It is relevant to return to the original question, which asked whether further develop-ments in yeast propagation will be optimising that stage of the process to the detri-ment of subsequent stages. Indeed, Zepf et al.10 stated that the overriding principle to
YEAST PROPAGATION 255
be used in the design of yeast propagation plants should be that of producing an opti-mal yeast crop that best meets the subsequent fermentation requirements, and notone based on achieving the highest possible yeast counts in the shortest possible time.Further optimisation of yeast propagation cannot be done in isolation from the sub-sequent unit operations resulting in the production of high-quality beer. However, itdoes appear that future yeast propagations will be aerobic in nature and that novelmeans of delivering the required amount of oxygen at the correct time will be developed.It is less clear whether wort will remain the medium of choice for yeast propagation,but it is likely that wort with certain nutrient supplementation will be used for theforeseeable future. Process control aspects for temperature, aeration and gas transferwill require a great deal of research for the future.
References
1. Jones, H.L. (1997) Yeast propagation – past present and future. Brew. Guardian October, 24–27.2. O’Connor-Cox, E.S.C., Lodolo, E.J. and Axcell, B.C. (1993) Role of oxygen in high gravity fermenta-
tions in the absence of unsaturated lipid biosynthesis. J. Am. Soc. Brew. Chem. 51, 97–107.3. Lodolo, E.J. (1999) The effect of oxygen on the fermentation ability of Saccharomyces cerevisiae during
high gravity wort fermentations. PhD Thesis, University of Stellenbosch.4. Geiger, E. (1993) Continuous yeast propagation. Brauwelt Int. V, 430–434.5. Voigt, J.C. and Walla, G. (1995) A novel yeast propagation system. Inst. Brew. Proc. 5th Central South
African Sect., Victoria Falls, pp. 173–178.6. Annemuller, G. (2001) Aeration in fresh yeast propagation – too much of a good thing! Brauwelt Int.
II, 106–110.7. Von Nida, L. (1997) Aerobic yeast propagation. Brauwelt Int. II, 147–151.8. Boulton, C.A. and Quain, D.E. (1999) A novel system for propagation of brewing yeast. Eur. Brew.
Conv. Cong., Cannes, 647–654.9. Hulse, G.A., Bihl, G., Morakile, G. and Axcell, B.C. (2000) Optimisation of storage and propagation
for consistent lager fermentations. In: Brewing Yeast Fermentation Performance, Smart, K. (ed.).Blackwell Science, Oxford, pp. 161–169.
10. Zepf, M., Geiger, E. and Nieten, I. (2001) Brauwelt Int. II, 128–132.
256 BREWING YEAST FERMENTATION PERFORMANCE
24 Serial Repitching Fermentation Performance andFunctional Biomarkers
C.L. JENKINS, A.I. KENNEDY, P. THURSTON, J.A. HODGSON and K.A. SMART
Abstract Relatively few studies concerning the impact of serial repitching on lager yeastcell physiology have been conducted, primarily because of batch-to-batch variations in wortcomposition. Where this phenomenon has been studied, it was observed that extensiveserial repitching resulted in a progressive modification in flocculation capacity and highlyvariable viability. The reasons for these modifications are not known, although it wouldappear that extended serial repitching results in a form of ‘repetitive stress injury’ duringwhich the yeast population is repeatedly transferred from the cell cycle, to the stationaryphase to stress conditions and back to the cell cycle. During this time the cell may becomeirreversibly damaged and begin to exhibit a modified physiological condition. Pitching (or inoculating) a yeast slurry of variable physiology may result in aberrant fermentations,ultimately compromising beer flavour.
Serial repitching modified both the fermentation performance and physiology of thecells; however, yeast quality was not significantly compromised. A progressive increase inflocculation and cell-surface charge was observed, indicating modifications in cell-wall phy-siology. Serial repitching also resulted in a modification in plasma membrane integrity.The propensity to form respiratory-deficient mutants increased as a function of generationnumber. It is suggested that repeated exposure to stress encountered during yeast handlingleads to an increased frequency of DNA damage, resulting in the formation of variants. Itis likely that the extent of these effects is a strain-dependent phenomenon, which may beexacerbated by high-gravity brewing and poor yeast handling.
24.1 Introduction
During serial repitching the yeast cell is transferred through several physiologicalstates, from periods of active growth and division during propagation and the earlystages of fermentation, to the stationary phase while it is held in the cone at the endof fermentation, in the storage tank and during acid washing.1 The number of gener-ations for which a brewing yeast slurry may be serially repitched depends on theapparent robustness of the strain, microbial stability and company policy.2–4
It is believed that the performance of brewing production strains following serialrepitching begins to degenerate after 10 generations.2,3 The number of serial repitch-ings used, however, may exceed this number owing to production demands.2,3
Very few studies have concerned the elucidation of the impact of serial repitchingon yeast physiological state, fermentation performance and therefore final productquality. However, there are several stresses to which the yeast can be exposed duringthe brewing process (Table 24.1) that can result in a progressive deterioration in physio-logical state. It has been suggested in reviews by Smart4,5 that during serial repitchingthe yeast cell is repeatedly transferred from the cell cycle to stationary phase to stress
Brewing Yeast Fermentation Performance: Second edition
Edited by: KATHERINE SMART Copyright 0 Blackwell Science 2003
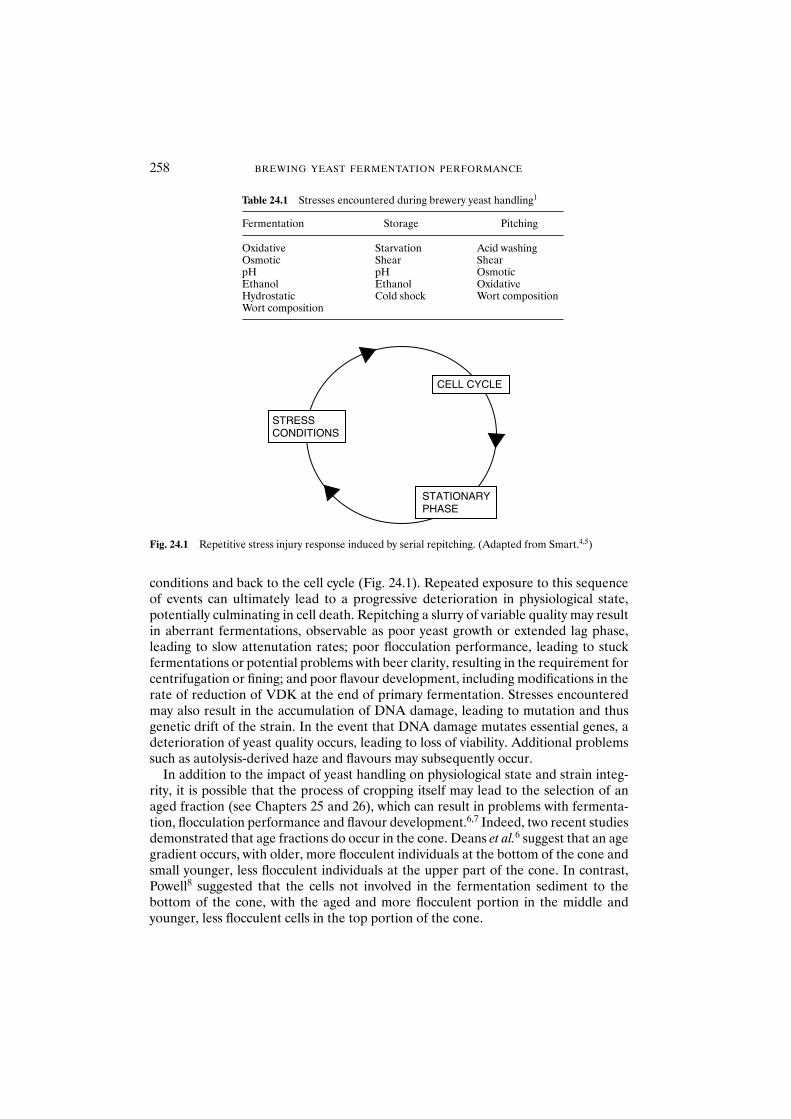
conditions and back to the cell cycle (Fig. 24.1). Repeated exposure to this sequenceof events can ultimately lead to a progressive deterioration in physiological state,potentially culminating in cell death. Repitching a slurry of variable quality may resultin aberrant fermentations, observable as poor yeast growth or extended lag phase,leading to slow attenutation rates; poor flocculation performance, leading to stuckfermentations or potential problems with beer clarity, resulting in the requirement forcentrifugation or fining; and poor flavour development, including modifications in therate of reduction of VDK at the end of primary fermentation. Stresses encounteredmay also result in the accumulation of DNA damage, leading to mutation and thusgenetic drift of the strain. In the event that DNA damage mutates essential genes, adeterioration of yeast quality occurs, leading to loss of viability. Additional problemssuch as autolysis-derived haze and flavours may subsequently occur.
In addition to the impact of yeast handling on physiological state and strain integ-rity, it is possible that the process of cropping itself may lead to the selection of anaged fraction (see Chapters 25 and 26), which can result in problems with fermenta-tion, flocculation performance and flavour development.6,7 Indeed, two recent studiesdemonstrated that age fractions do occur in the cone. Deans et al.6 suggest that an agegradient occurs, with older, more flocculent individuals at the bottom of the cone andsmall younger, less flocculent individuals at the upper part of the cone. In contrast,Powell8 suggested that the cells not involved in the fermentation sediment to thebottom of the cone, with the aged and more flocculent portion in the middle andyounger, less flocculent cells in the top portion of the cone.
258 BREWING YEAST FERMENTATION PERFORMANCE
Table 24.1 Stresses encountered during brewery yeast handling1
Fermentation Storage Pitching
Oxidative Starvation Acid washingOsmotic Shear ShearpH pH OsmoticEthanol Ethanol OxidativeHydrostatic Cold shock Wort compositionWort composition
STATIONARYPHASE
CELL CYCLE
STRESSCONDITIONS
Fig. 24.1 Repetitive stress injury response induced by serial repitching. (Adapted from Smart.4,5)
Given the various physiological states that are represented by yeast populationsduring slurry handling, identification of cells exhibiting a compromised state is essentialin the determination of pitching rates. Overpitching may result in limited nutrientsbeing made available for the yeast cells to replicate, and the resulting crop is likely tocontain a higher proportion of older larger cells demonstrating a reduced vitality,9 orloss of viability leading to the formation of undesirable autolysis products.10 Conversely,underpitching may result in slow or hung fermentations owing to a reduced capacityfor sterol synthesis.11
Yeast quality can be defined as the purity, stability and physiological condition ofpitching yeast.12 In contrast, fermentation performance may be defined as the ability ofthe brewing yeast consistently to exhibit cell proliferation, utilise fermentable carbohy-drates, resulting in the production of ethanol (attenuation), aggregate and sediment uponcompletion of fermentation (flocculation), and contribute to flavour development.12
However, assessing the physiological status of the yeast cell poses problems for thebrewer owing to difficulties in quantifying and defining physiological states12 and, inany case, yeast quality may not necessarily reflect fermentation potential.1 Despite this,it is usual for the brewer to monitor the viability of yeast slurry using bright-fieldstains,4,13–16 which determine the intracellular reducing power of the cell.
The impact of serially repitching a lager brewing production strain into six suc-cessive fermentations on the performance of the slurry was investigated, to identifyfunctional biomarkers that may be monitored by the brewer to provide an indicationof when yeast cell deterioration commences and replacement with newly propagatedyeast is required. This study demonstrates the impact of serial repitching of lager pro-duction brewing strains on yeast quality and the four key attributes that representfermentation performance: replicative capacity, attenuation, flavour developmentand flocculation potential.
24.2 Materials and methods
24.2.1 Yeast strains and growth conditions
The production lager brewing yeast strain designated SCB3 was obtained fromScottish Courage Brewing Ltd (Edinburgh, UK). Stock cultures were maintained onstandard agar slopes consisting of 1% yeast extract, 0.5% neutralised bacteriologicalpeptone and 1% glucose solidified with 1.5% agar (w/v). All media were autoclaved at121°C and 15 psi for 15 min immediately after preparation.
Brewery production samples were obtained from Scottish Courage Brewing Ltd,Berkshire Brewery (Reading, UK). Samples were harvested during cropping of the cyclin-droconical fermentation vessel and from storage tanks. Cooling and agitation regimenswere consistent and followed Scottish Courage Brewing best practice recommendations.
24.2.2 Citrate methylene violet
The viability of the sample was expressed as a percentage and represented the meanof three replicates, according to the method of Smart et al.17. A minimum of 100 cellswas enumerated for each of the three replicates analysed.
SERIAL REPITCHING FERMENTATION PERFORMANCE 259
24.2.3 MgANS
The viability determined using magnesium 1-anilinonaphthalene-8-sulfonic acid(MgANS) was expressed as a percentage and represented the mean of three replicates,according to the method of McCaig.18 A minimum of 100 cells was enumerated for eachof the three replicates analysed.
24.2.4 Viability plate counts
Yeast suspensions were diluted to obtain 1 � 103 cells/ml and 0.1 ml of this suspensionwas inoculated on YPD (1% w/v yeast extract, 2% w/v bacteriological peptone and 2%w/v D-glucose) agar plates. Colonies were enumerated and the viability of the samplewas expressed as a percentage.
24.2.5 Intracellular glycogen and trehalose determination
Cells were harvested, washed twice in sterile deionised water and centrifuged at3000 rpm and 4°C. The final cell concentration for laboratory grown cultures was1.0 � 109 cells/ml. For brewery propagation and cropped samples the cell concentra-tion was 5.0 � 108 cells/ml. Sodium carbonate (250 �l, 0.25 M) was added to 1 ml ofsample and incubated at 95°C for 2 h in a heated water bath (Mickle LaboratoryEngineering Co.). After this time the samples were placed on ice and 600 �l of sodiumacetate (0.2 M) and 150 �l of acetic acid (1 M) were added. The mixture was then vor-texed for 30 s, separated into equal quantities and placed into two 15 ml centrifugetubes (G and T). To tube G, 10 �l of �-amyloglucosidase (Sigma Chemical Co., UK)was added and it was incubated in a shaking heated water bath (Mickle LaboratoryEngineering Co.) overnight at 57°C. Tube T contained 10 �l of trehalase (SigmaChemical Co.) and was incubated at 37°C for 16 h. Once the incubation period wascomplete, samples were centrifuged (IEC Centra – EC 4R; International EquipmentCo.) at 3000 rpm for 4 min. The supernatants were then mixed with 5 ml of reactionmixture from Sigma glucose standard kit (510-A). The optical density was then meas-ured between 425 and 475 nm and the amount of glucose calculated against a stan-dard glucose solution.
24.2.6 Determination of frequency of petite mutation
Two millilitres of 2,3,5-triphenyltetrazolium chloride [TTC, 5% (w/v) solution, sterilefiltered] was mixed with 100 ml phosphate-buffered agar [double-strength phosphatebuffer 0.134 mol/l, pH 7.0; 12.6 g (w/v) sodium dihydrogen phosphate, 11.6 g (w/v) dis-odium hydrogen phosphate, 30 g (w/v) technical agar]. YPD agar plates with 50–100colonies were covered with 20 ml of the TTC and phosphate-buffered agar mixture andincubated at ambient temperature for 3 h. Respiratory-deficient mutants were white, andwild-type red or pink in colour. Triplicate samples were analysed.
24.2.7 Propensity to form petites
Petite formation was induced using a modified method of Rickwood et al.19 Cells wereinoculated in NO media (2% glucose, 1% yeast extract, 1% bacteriological peptone,
260 BREWING YEAST FERMENTATION PERFORMANCE
buffered with 50 mM phosphate buffer, pH 6.24) to give a final concentration of 1 � 105
cells/ml. Cultures were exposed to 100, 20, 10, 1, 0.1, 0.01 and 0 �g concentrations ofethidium bromide for 24 h at 25°C on an orbital shaker at 120 rpm.
24.2.8 Budding index
Yeast cells were inoculated into wort [original gravity (OG) 1065.0] at a final concen-tration of 1.7 � 106 cells/ml. Cells were incubated at 15°C with constant shaking (MickleLaboratory Engineering Co., Gomshall, Surrey, UK) for 6 h and the number ofbudding cells was enumerated according to the method of Bendiak.13
24.2.9 Percentage of yeast solids
To determine the percentage yeast solids a 100 ml sample of yeast slurry was mixed toensure homogeneity. The mixture was split into two 50 ml centrifuge tubes, A and B.Two millilitres of a 30% (w/v) NaOH solution was added to tube B, which was thenshaken vigorously. The two tubes were centrifuged at 2000 rpm for 10 min. Tube Arepresents the total solids (yeast and trub), while tube B represents two or three sec-tions: top (dark brown, protein matter and trub), middle (cream-coloured yeast) andbottom (green, granular hop trub). The percentage yeast solids was then calculatedaccording to the method of Palmer.20
24.2.10 Flocculation
Flocculation capacity was assessed by the modified Helm’s test.21 The final cell con-centration of 1 � 108 cells/ml was achieved using deionised water. Then, 10 ml ofsample was placed into two tubes labelled A and B. Tube A: cells were washed indeionised water and resuspended in 1 ml of ethylenediaminetetra-acetate (EDTA,0.5 M, pH 7.0) and 9 ml of deionised water. The mixture was homogenised by vortex-ing (Rotamixer) for 15 s. A 10-fold dilution was undertaken using deionised water andthe absorbance was read spectrophotometrically (Shimadzu, Japan) at 600 nm. TubeB: the pellet was resuspended in 9 ml of ‘washing solution’ comprising calcium sulfate(0.51 g/l). The mixture was homogenised by vortexing (Rotamixer) for 15 s and thencentrifuged (IEC Centra – EC 4R; International Equipment Co.) and the supernatantdiscarded. The pellet was then resuspended in 9 ml aqueous ‘suspension solution’comprising calcium sulfate (0.51 g/l), sodium acetate (6.8 g/l), glacial acetic acid (4.05 g/l)and ethanol (4% v/v) at pH 4.5. The sample was vortexed for 15 s, then inverted fivetimes in 15 s and left to stand for 10 min. A 10-fold dilution was undertaken usingdeionised water, taking care not to disturb the sedimented yeast and the absorbancewas read spectrophotometrically (Shimadzu, Japan) at 600 nm. Samples were analysedin triplicate and the percentage flocculation was calculated according to the methodof D’Hautcourt and Smart,21 using the equation:
A B
A 100 % Flocculation
�� �
SERIAL REPITCHING FERMENTATION PERFORMANCE 261
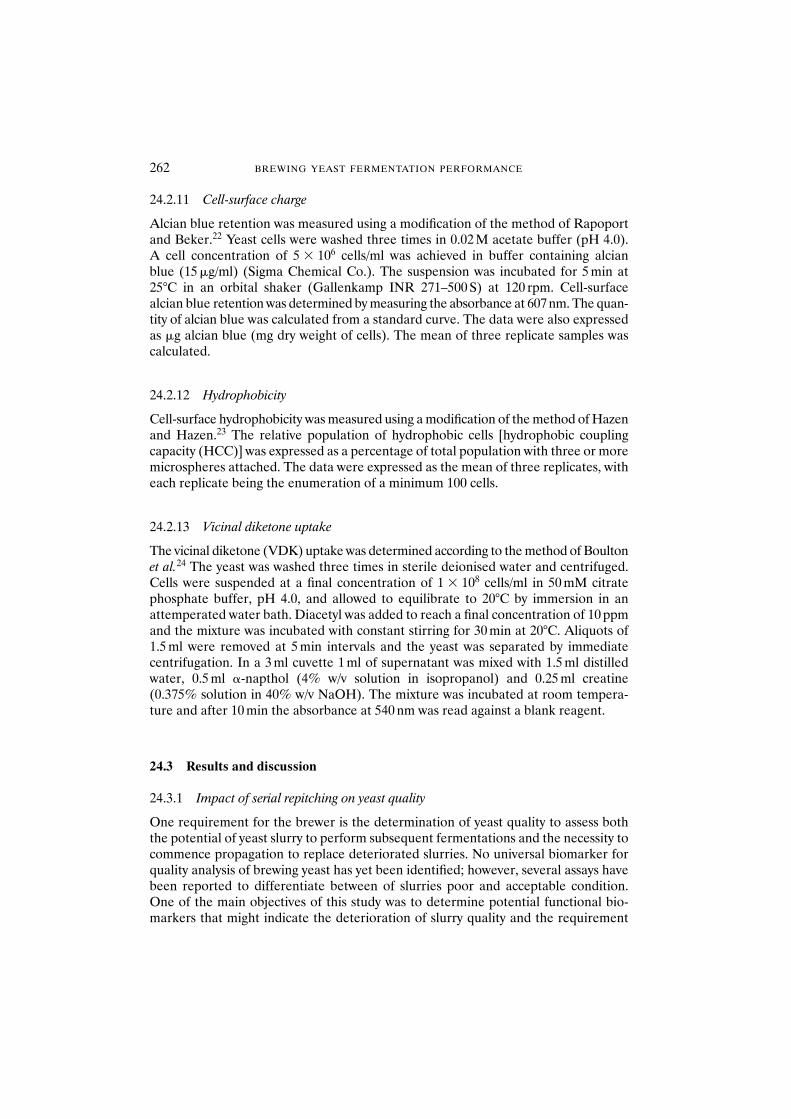
24.2.11 Cell-surface charge
Alcian blue retention was measured using a modification of the method of Rapoportand Beker.22 Yeast cells were washed three times in 0.02 M acetate buffer (pH 4.0). A cell concentration of 5 � 106 cells/ml was achieved in buffer containing alcian blue (15 �g/ml) (Sigma Chemical Co.). The suspension was incubated for 5 min at25°C in an orbital shaker (Gallenkamp INR 271–500 S) at 120 rpm. Cell-surfacealcian blue retention was determined by measuring the absorbance at 607 nm. The quan-tity of alcian blue was calculated from a standard curve. The data were also expressedas �g alcian blue (mg dry weight of cells). The mean of three replicate samples wascalculated.
24.2.12 Hydrophobicity
Cell-surface hydrophobicity was measured using a modification of the method of Hazenand Hazen.23 The relative population of hydrophobic cells [hydrophobic couplingcapacity (HCC)] was expressed as a percentage of total population with three or moremicrospheres attached. The data were expressed as the mean of three replicates, witheach replicate being the enumeration of a minimum 100 cells.
24.2.13 Vicinal diketone uptake
The vicinal diketone (VDK) uptake was determined according to the method of Boultonet al.24 The yeast was washed three times in sterile deionised water and centrifuged.Cells were suspended at a final concentration of 1 � 108 cells/ml in 50 mM citratephosphate buffer, pH 4.0, and allowed to equilibrate to 20°C by immersion in anattemperated water bath. Diacetyl was added to reach a final concentration of 10 ppmand the mixture was incubated with constant stirring for 30 min at 20°C. Aliquots of1.5 ml were removed at 5 min intervals and the yeast was separated by immediatecentrifugation. In a 3 ml cuvette 1 ml of supernatant was mixed with 1.5 ml distilledwater, 0.5 ml �-napthol (4% w/v solution in isopropanol) and 0.25 ml creatine(0.375% solution in 40% w/v NaOH). The mixture was incubated at room tempera-ture and after 10 min the absorbance at 540 nm was read against a blank reagent.
24.3 Results and discussion
24.3.1 Impact of serial repitching on yeast quality
One requirement for the brewer is the determination of yeast quality to assess boththe potential of yeast slurry to perform subsequent fermentations and the necessity tocommence propagation to replace deteriorated slurries. No universal biomarker forquality analysis of brewing yeast has yet been identified; however, several assays havebeen reported to differentiate between of slurries poor and acceptable condition.One of the main objectives of this study was to determine potential functional bio-markers that might indicate the deterioration of slurry quality and the requirement
262 BREWING YEAST FERMENTATION PERFORMANCE
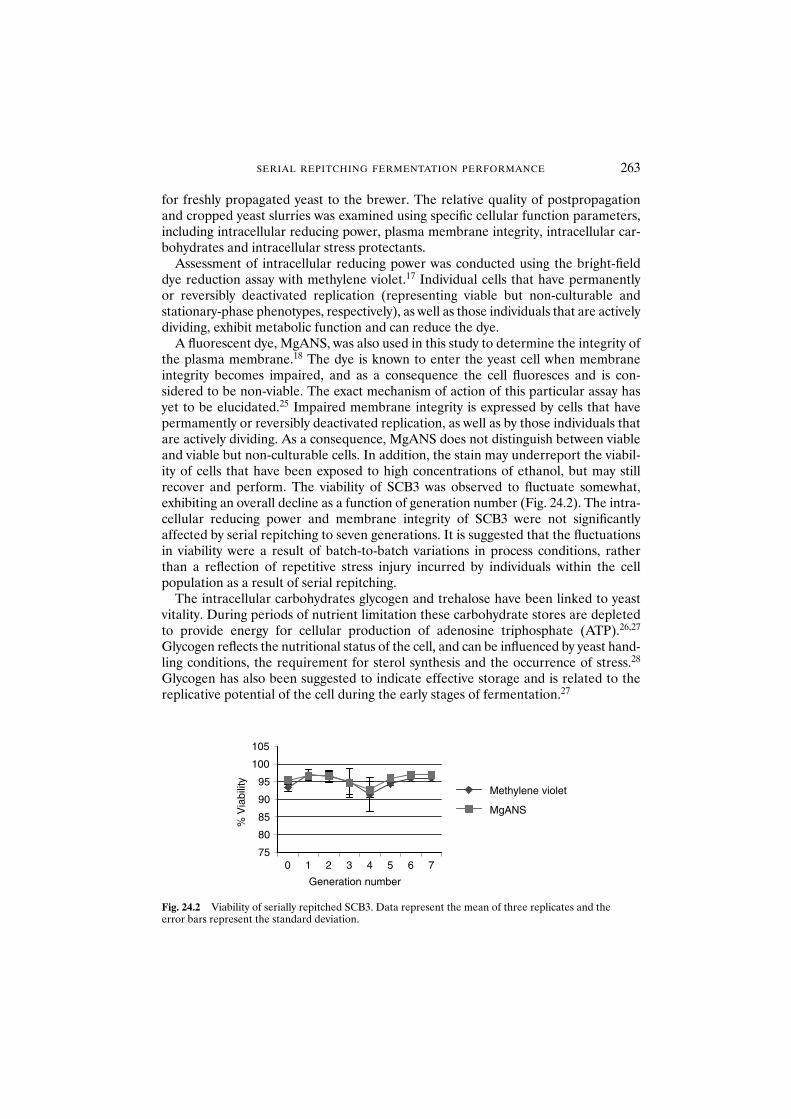
for freshly propagated yeast to the brewer. The relative quality of postpropagationand cropped yeast slurries was examined using specific cellular function parameters,including intracellular reducing power, plasma membrane integrity, intracellular car-bohydrates and intracellular stress protectants.
Assessment of intracellular reducing power was conducted using the bright-fielddye reduction assay with methylene violet.17 Individual cells that have permanently or reversibly deactivated replication (representing viable but non-culturable andstationary-phase phenotypes, respectively), as well as those individuals that are activelydividing, exhibit metabolic function and can reduce the dye.
A fluorescent dye, MgANS, was also used in this study to determine the integrity ofthe plasma membrane.18 The dye is known to enter the yeast cell when membraneintegrity becomes impaired, and as a consequence the cell fluoresces and is con-sidered to be non-viable. The exact mechanism of action of this particular assay hasyet to be elucidated.25 Impaired membrane integrity is expressed by cells that havepermamently or reversibly deactivated replication, as well as by those individuals thatare actively dividing. As a consequence, MgANS does not distinguish between viableand viable but non-culturable cells. In addition, the stain may underreport the viabil-ity of cells that have been exposed to high concentrations of ethanol, but may stillrecover and perform. The viability of SCB3 was observed to fluctuate somewhat,exhibiting an overall decline as a function of generation number (Fig. 24.2). The intra-cellular reducing power and membrane integrity of SCB3 were not significantlyaffected by serial repitching to seven generations. It is suggested that the fluctuationsin viability were a result of batch-to-batch variations in process conditions, rather than a reflection of repetitive stress injury incurred by individuals within the cell population as a result of serial repitching.
The intracellular carbohydrates glycogen and trehalose have been linked to yeastvitality. During periods of nutrient limitation these carbohydrate stores are depletedto provide energy for cellular production of adenosine triphosphate (ATP).26,27
Glycogen reflects the nutritional status of the cell, and can be influenced by yeast hand-ling conditions, the requirement for sterol synthesis and the occurrence of stress.28
Glycogen has also been suggested to indicate effective storage and is related to thereplicative potential of the cell during the early stages of fermentation.27
SERIAL REPITCHING FERMENTATION PERFORMANCE 263
750 1 2 3 4 5 6 7
80
85
90
95
100
105
% V
iabi
lity
Generation number
Methylene violet
MgANS
Fig. 24.2 Viability of serially repitched SCB3. Data represent the mean of three replicates and the error bars represent the standard deviation.
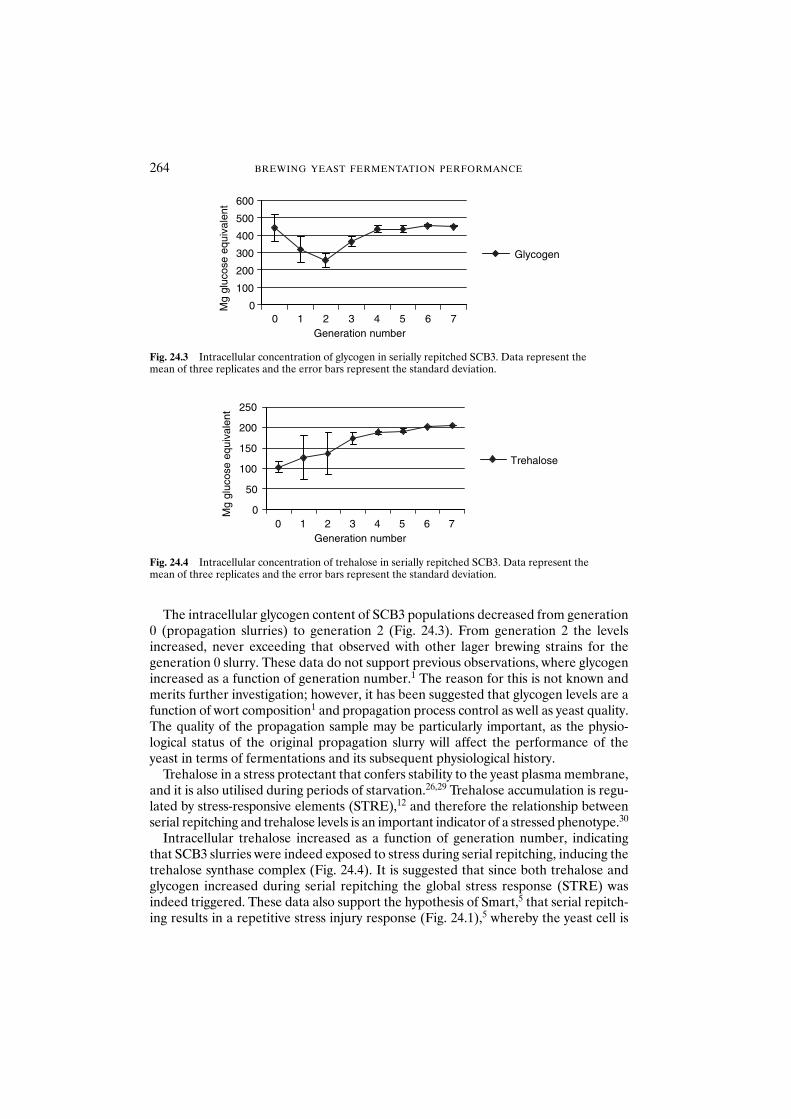
The intracellular glycogen content of SCB3 populations decreased from generation0 (propagation slurries) to generation 2 (Fig. 24.3). From generation 2 the levelsincreased, never exceeding that observed with other lager brewing strains for thegeneration 0 slurry. These data do not support previous observations, where glycogenincreased as a function of generation number.1 The reason for this is not known andmerits further investigation; however, it has been suggested that glycogen levels are afunction of wort composition1 and propagation process control as well as yeast quality.The quality of the propagation sample may be particularly important, as the physio-logical status of the original propagation slurry will affect the performance of theyeast in terms of fermentations and its subsequent physiological history.
Trehalose in a stress protectant that confers stability to the yeast plasma membrane,and it is also utilised during periods of starvation.26,29 Trehalose accumulation is regu-lated by stress-responsive elements (STRE),12 and therefore the relationship betweenserial repitching and trehalose levels is an important indicator of a stressed phenotype.30
Intracellular trehalose increased as a function of generation number, indicatingthat SCB3 slurries were indeed exposed to stress during serial repitching, inducing thetrehalose synthase complex (Fig. 24.4). It is suggested that since both trehalose andglycogen increased during serial repitching the global stress response (STRE) wasindeed triggered. These data also support the hypothesis of Smart,5 that serial repitch-ing results in a repetitive stress injury response (Fig. 24.1),5 whereby the yeast cell is
264 BREWING YEAST FERMENTATION PERFORMANCE
0
100
200
300
400
500
600
0 1 2 3 4 5 6 7Generation number
Mg
gluc
ose
equi
vale
nt
Glycogen
Fig. 24.3 Intracellular concentration of glycogen in serially repitched SCB3. Data represent the mean of three replicates and the error bars represent the standard deviation.
0
50
100
150
200
250
Mg
gluc
ose
equi
vale
nt
Trehalose
0 1 2 3 4 5 6 7Generation number
Fig. 24.4 Intracellular concentration of trehalose in serially repitched SCB3. Data represent the mean of three replicates and the error bars represent the standard deviation.
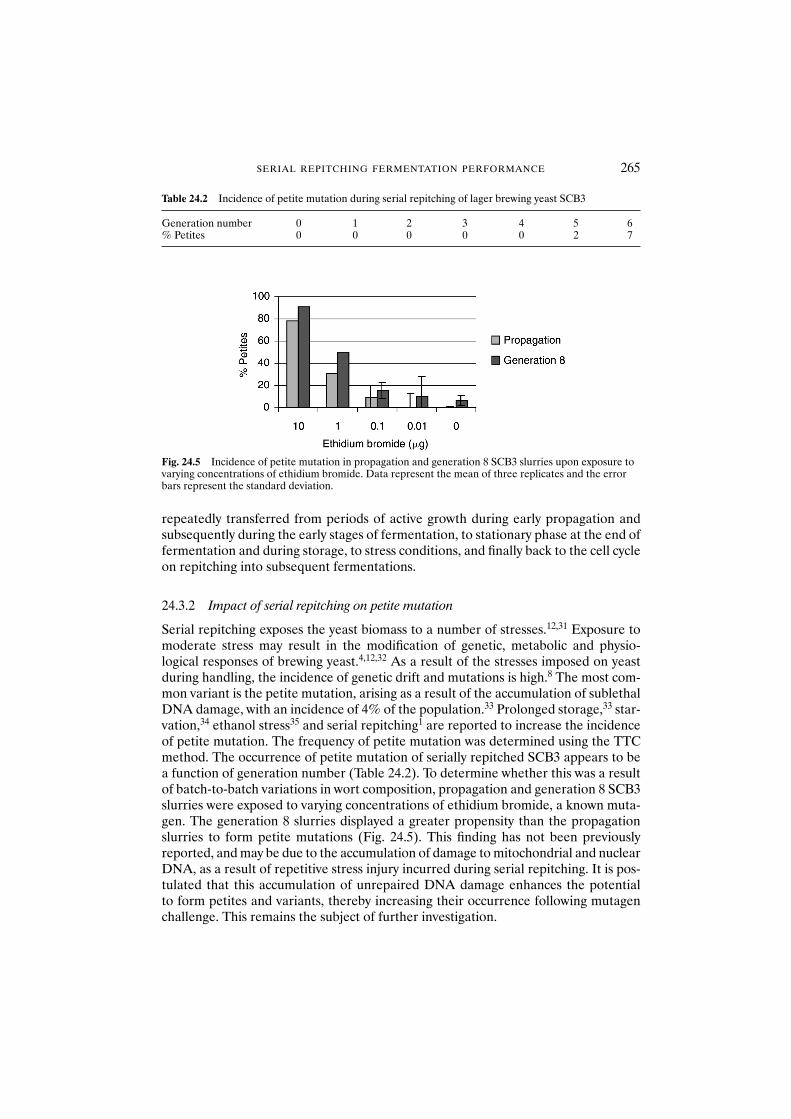
repeatedly transferred from periods of active growth during early propagation andsubsequently during the early stages of fermentation, to stationary phase at the end offermentation and during storage, to stress conditions, and finally back to the cell cycleon repitching into subsequent fermentations.
24.3.2 Impact of serial repitching on petite mutation
Serial repitching exposes the yeast biomass to a number of stresses.12,31 Exposure tomoderate stress may result in the modification of genetic, metabolic and physio-logical responses of brewing yeast.4,12,32 As a result of the stresses imposed on yeastduring handling, the incidence of genetic drift and mutations is high.8 The most com-mon variant is the petite mutation, arising as a result of the accumulation of sublethalDNA damage, with an incidence of 4% of the population.33 Prolonged storage,33 star-vation,34 ethanol stress35 and serial repitching1 are reported to increase the incidenceof petite mutation. The frequency of petite mutation was determined using the TTCmethod. The occurrence of petite mutation of serially repitched SCB3 appears to bea function of generation number (Table 24.2). To determine whether this was a resultof batch-to-batch variations in wort composition, propagation and generation 8 SCB3slurries were exposed to varying concentrations of ethidium bromide, a known muta-gen. The generation 8 slurries displayed a greater propensity than the propagationslurries to form petite mutations (Fig. 24.5). This finding has not been previouslyreported, and may be due to the accumulation of damage to mitochondrial and nuclearDNA, as a result of repetitive stress injury incurred during serial repitching. It is pos-tulated that this accumulation of unrepaired DNA damage enhances the potential to form petites and variants, thereby increasing their occurrence following mutagenchallenge. This remains the subject of further investigation.
SERIAL REPITCHING FERMENTATION PERFORMANCE 265
Table 24.2 Incidence of petite mutation during serial repitching of lager brewing yeast SCB3
Generation number 0 1 2 3 4 5 6% Petites 0 0 0 0 0 2 7
Fig. 24.5 Incidence of petite mutation in propagation and generation 8 SCB3 slurries upon exposure tovarying concentrations of ethidium bromide. Data represent the mean of three replicates and the errorbars represent the standard deviation.
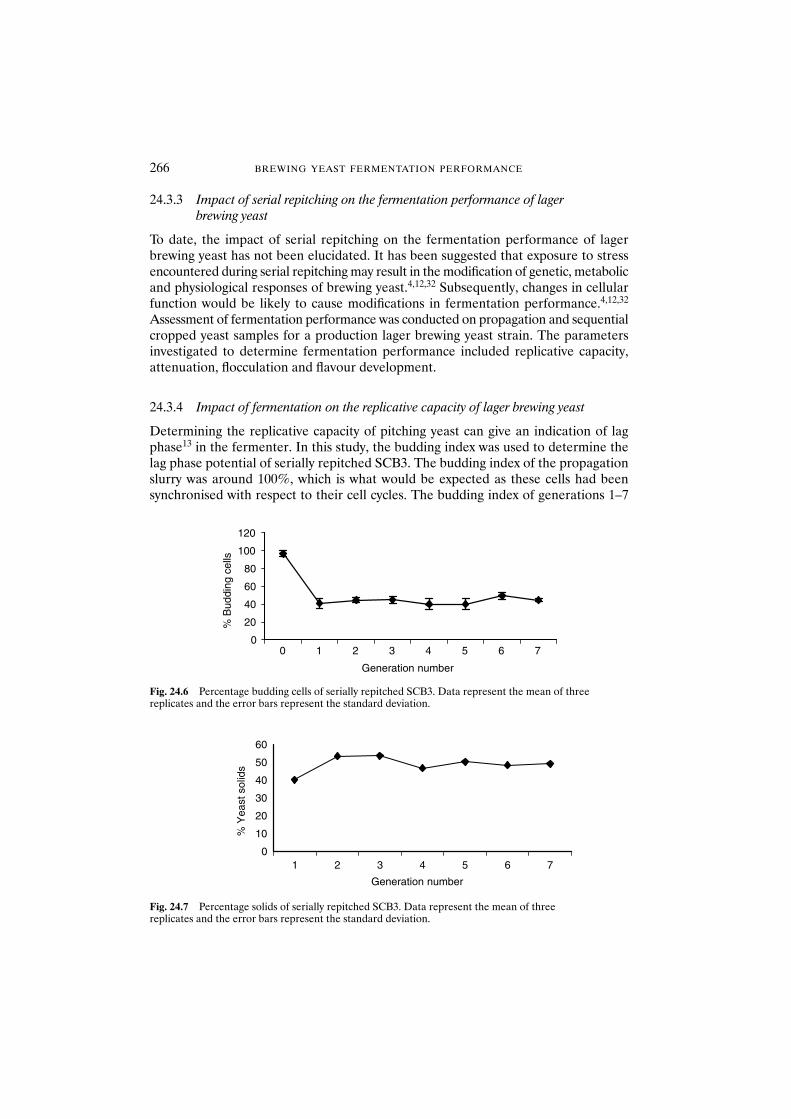
24.3.3 Impact of serial repitching on the fermentation performance of lager brewing yeast
To date, the impact of serial repitching on the fermentation performance of lagerbrewing yeast has not been elucidated. It has been suggested that exposure to stressencountered during serial repitching may result in the modification of genetic, metabolicand physiological responses of brewing yeast.4,12,32 Subsequently, changes in cellularfunction would be likely to cause modifications in fermentation performance.4,12,32
Assessment of fermentation performance was conducted on propagation and sequentialcropped yeast samples for a production lager brewing yeast strain. The parametersinvestigated to determine fermentation performance included replicative capacity,attenuation, flocculation and flavour development.
24.3.4 Impact of fermentation on the replicative capacity of lager brewing yeast
Determining the replicative capacity of pitching yeast can give an indication of lagphase13 in the fermenter. In this study, the budding index was used to determine thelag phase potential of serially repitched SCB3. The budding index of the propagationslurry was around 100%, which is what would be expected as these cells had beensynchronised with respect to their cell cycles. The budding index of generations 1–7
266 BREWING YEAST FERMENTATION PERFORMANCE
00 1 2 3 4 5 6 7
20
40
60
80
100
120
Generation number
% B
uddi
ng c
ells
Fig. 24.6 Percentage budding cells of serially repitched SCB3. Data represent the mean of three replicates and the error bars represent the standard deviation.
0
10
20
30
40
50
60
654321 7
Generation number
% Y
east
sol
ids
Fig. 24.7 Percentage solids of serially repitched SCB3. Data represent the mean of three replicates and the error bars represent the standard deviation.
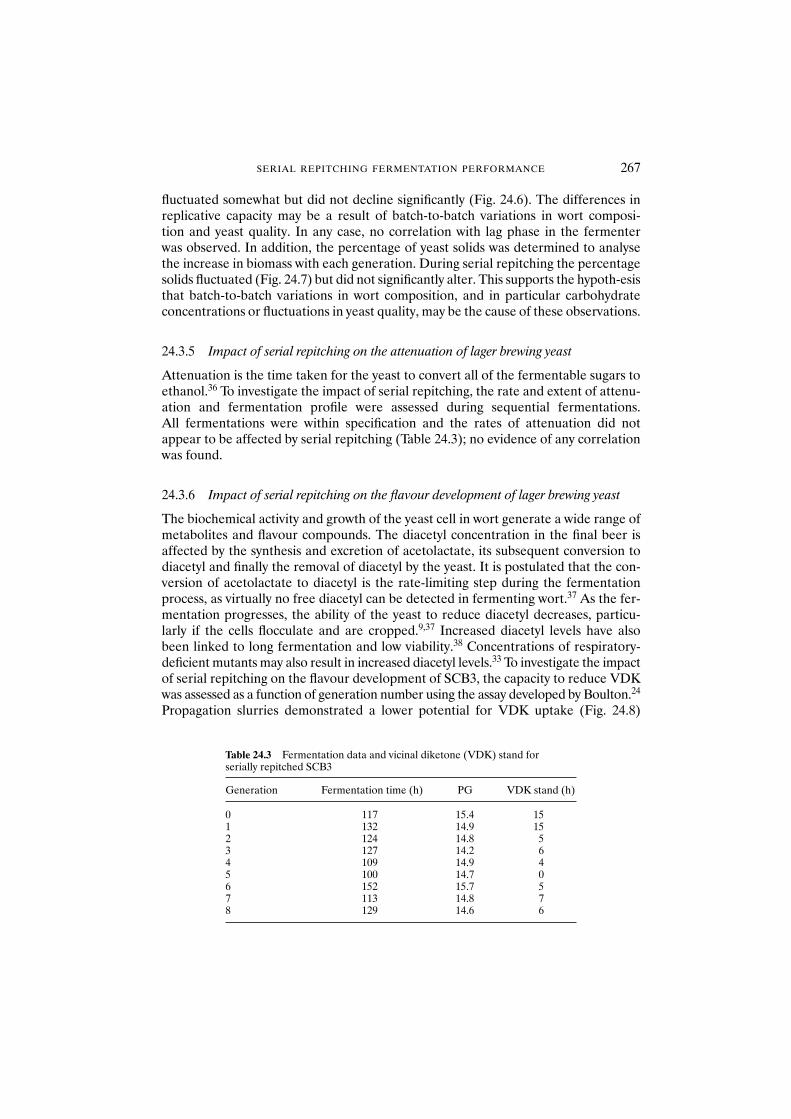
fluctuated somewhat but did not decline significantly (Fig. 24.6). The differences inreplicative capacity may be a result of batch-to-batch variations in wort composi-tion and yeast quality. In any case, no correlation with lag phase in the fermenter was observed. In addition, the percentage of yeast solids was determined to analyse the increase in biomass with each generation. During serial repitching the percentagesolids fluctuated (Fig. 24.7) but did not significantly alter. This supports the hypoth-esisthat batch-to-batch variations in wort composition, and in particular carbohydrateconcentrations or fluctuations in yeast quality, may be the cause of these observations.
24.3.5 Impact of serial repitching on the attenuation of lager brewing yeast
Attenuation is the time taken for the yeast to convert all of the fermentable sugars toethanol.36 To investigate the impact of serial repitching, the rate and extent of attenu-ation and fermentation profile were assessed during sequential fermentations. All fermentations were within specification and the rates of attenuation did notappear to be affected by serial repitching (Table 24.3); no evidence of any correlationwas found.
24.3.6 Impact of serial repitching on the flavour development of lager brewing yeast
The biochemical activity and growth of the yeast cell in wort generate a wide range ofmetabolites and flavour compounds. The diacetyl concentration in the final beer isaffected by the synthesis and excretion of acetolactate, its subsequent conversion todiacetyl and finally the removal of diacetyl by the yeast. It is postulated that the con-version of acetolactate to diacetyl is the rate-limiting step during the fermentationprocess, as virtually no free diacetyl can be detected in fermenting wort.37 As the fer-mentation progresses, the ability of the yeast to reduce diacetyl decreases, particu-larly if the cells flocculate and are cropped.9,37 Increased diacetyl levels have also been linked to long fermentation and low viability.38 Concentrations of respiratory-deficient mutants may also result in increased diacetyl levels.33 To investigate the impactof serial repitching on the flavour development of SCB3, the capacity to reduce VDKwas assessed as a function of generation number using the assay developed by Boulton.24
Propagation slurries demonstrated a lower potential for VDK uptake (Fig. 24.8)
SERIAL REPITCHING FERMENTATION PERFORMANCE 267
Table 24.3 Fermentation data and vicinal diketone (VDK) stand for serially repitched SCB3
Generation Fermentation time (h) PG VDK stand (h)
0 117 15.4 151 132 14.9 152 124 14.8 53 127 14.2 64 109 14.9 45 100 14.7 06 152 15.7 57 113 14.8 78 129 14.6 6
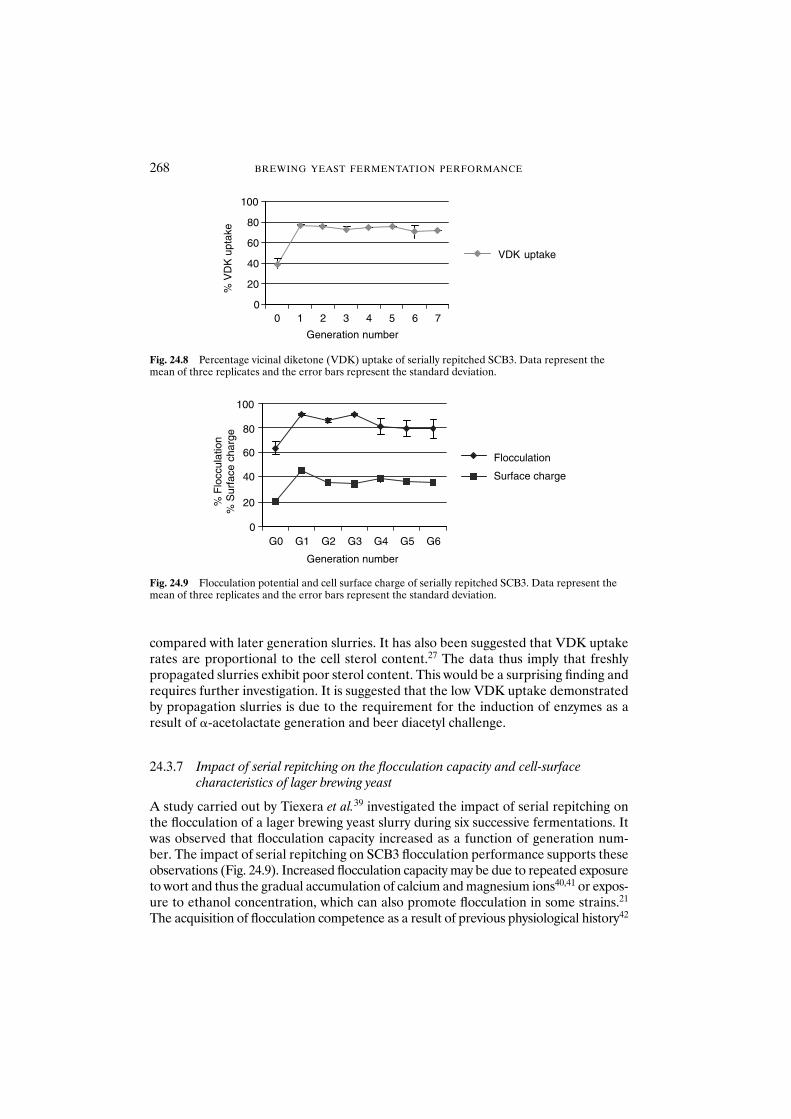
compared with later generation slurries. It has also been suggested that VDK uptakerates are proportional to the cell sterol content.27 The data thus imply that freshlypropagated slurries exhibit poor sterol content. This would be a surprising finding andrequires further investigation. It is suggested that the low VDK uptake demonstratedby propagation slurries is due to the requirement for the induction of enzymes as aresult of �-acetolactate generation and beer diacetyl challenge.
24.3.7 Impact of serial repitching on the flocculation capacity and cell-surface characteristics of lager brewing yeast
A study carried out by Tiexera et al.39 investigated the impact of serial repitching onthe flocculation of a lager brewing yeast slurry during six successive fermentations. Itwas observed that flocculation capacity increased as a function of generation num-ber. The impact of serial repitching on SCB3 flocculation performance supports theseobservations (Fig. 24.9). Increased flocculation capacity may be due to repeated exposureto wort and thus the gradual accumulation of calcium and magnesium ions40,41 or expos-ure to ethanol concentration, which can also promote flocculation in some strains.21
The acquisition of flocculation competence as a result of previous physiological history42
268 BREWING YEAST FERMENTATION PERFORMANCE
00 1 2 3 4 5 6 7
20
40
60
80
100
Generation number
% V
DK
upt
ake
VDK uptake
Fig. 24.8 Percentage vicinal diketone (VDK) uptake of serially repitched SCB3. Data represent themean of three replicates and the error bars represent the standard deviation.
0
20
40
60
80
100
G0 G1 G2 G3 G4 G5 G6
Flocculation
Surface charge
% F
locc
ulat
ion
% S
urfa
ce c
harg
e
Generation number
Fig. 24.9 Flocculation potential and cell surface charge of serially repitched SCB3. Data represent themean of three replicates and the error bars represent the standard deviation.
or the selection of more flocculent cells owing to the cropping regimens applied17,43
may also account for the increase.Cell-surface charge also increased as a function of generation number and posi-
tively correlated with flocculation potential. A study conducted by Smart and Whisker32
investigated the impact of serial repitching on an ale production yeast. A negative cor-relation was found between flocculation and cell-surface charge. The apparent dif-ferences in the relationship between cell-surface charge and flocculation may be dueto the chemical species that govern cell-surface charge in these two forms of brewingyeast. Carboxylates and phosphates are responsible for cell-surface charge in ale andlager brewing yeast, respectively.12 Hydrophobicity has also been suggested to play arole in flocculation capacity. However, the hydrophobicity of SCB3 remained unchangedduring serial repitching (data not shown), suggesting that it would not represent anadequate functional biomarker of SCB3 flocculation potential.
24.4 Conclusions
During serial repitching the yeast biomass is repeatedly exposed to intense periods ofstress, eliciting a repetitive stress injury response that can ultimately lead to the pro-gressive modification of the yeast’s physiological state and therefore variable yeastquality. Accumulation of cellular damage and modified physiology as a function of gen-eration number can also occur. It is suggested that these modifications result from theactivation of the global stress response (STRE) genes. The extent of this repetitivestress injury and corresponding global stress response is strain dependent.
Acknowledgements
Cheryl Jenkins and Katherine Smart gratefully acknowledge the support of ScottishCourage Brewing Ltd. Cheryl Jenkins is the current Scottish Courage Brewing Scholarand Katherine Smart is the Scottish Courage Reader in Brewing Science. KatherineSmart also gratefully acknowledges the support of the Royal Society, BBSRC andEPSRC for the award of Royal Society Industrial Fellow. The authors would like tothank Susan Glazzard and the Microbiology Staff at Berkshire Brewery for assistancein the collection of brewery samples and are grateful to the Directors of Scottish CourageBrewing Ltd for permission to publish this work.
References
1. Jenkins, C.L., Kennedy, A.I., Thurston, P.A. et al. (in press). Impact of serial repitching on yeast quality.J. Am. Soc. Brew. Chem.
2. Boulton, C. (1991) Yeast management and the control of brewery fermentations. Brew. Guardian 4,25–29.
3. Boulton, C. (1991) Applications of yeast physiology for improvements in the brewing process. J. Chem.Tech. Biochem. 50, 135–137.
4. Smart, K.A. (1999) Ageing in brewing yeast. Brew. Guardian, 128 (2), 19–24.
SERIAL REPITCHING FERMENTATION PERFORMANCE 269
5. Smart, K.A. (2000) The death of the yeast cell. In: Brewing Yeast Fermentation Performance, Smart, K.(ed.) Blackwell Science, Oxford, pp. 105–113.
6. Deans, K., Pinder, A., Catley, B. and Hodgson, J.A. (1997) Effects of cone cropping serial repitchingon the distribution of cell age in brewery yeast. Proc. Eur. Brew. Conv. 26, 469–476.
7. Hodgson, J.A.J., Pinder, A., Catley, B.J. and Deans, K. (1999) Effect of cone cropping and serial re-pitch on the distribution of cell ages in brewery yeast. Tech. Q. Master Brew. Assoc. Am. 36, 175–177.
8. Powell, C.D. (2001) The impact of yeast cell age on brewery fermentation and product quality. Thesis,Oxford Brookes University, Oxford.
9. O’Connor-Cox, E (1998) Improving yeast handling in the brewery. Part 3. Yeast pitching and measurementof yeast quality. Brew. Guardian 3, 20–26.
10. Quain, D.E. (1988) Studies on yeast physiology – impact on fermentation performance and productquality. J. Inst. Brew. 95, 315–323.
11. Ryder, D.S., Woods, D.R., Murray, J.P. and Masschelein, C.A. (1983) Some practical implications ofyeast growth and yeast performance. Tech. Q. Master Brew. Assoc. Am. 20, 9–21.
12. Smart, K.A. (in preparation) Cambridge Prize Lecture.13. Bendiak, D. (2000) Review of metabolic activity tests and their ability to predict fermentation
performance. In: Brewing Yeast Fermentation Performance, Smart, K. (ed.). Blackwell Science, Oxford,pp. 34–44.
14. Lentini, A. (1993) A review of the various methods available for monitoring the physiological status ofthe yeast: yeast viability and vitality. Fermentation 6, 321–327.
15. Pierce, J. (1970) Institute of Brewing analysis committee: measurement of yeast viability. J. Inst. Brew.76, 442–443.
16. Sami, M., Ikeda, M. and Yabuuchi, S. (1994) Evaluation of the alkaline blue staining method for yeastactivity determination. J. Ferment. Bioeng. 78, 212–216.
17. Smart, K.A., Chamber, K.M., Lambert, I. et al. (1999) The use of methylene violet staining proceduresto determine yeast viability and vitality. J. Am. Soc. Brew. Chem. 57, 18–23.
18. McCaig, R. (1990) Evaluation of the fluorescent dye 1-anilino-8-napthalene sulphonic acid for yeastviability determination. J. Am. Soc. Brew. Chem. 43, 114–118.
19. Rickwood, R., Dujon, B. and Darley-Usmar, M. (1991) Yeast mitochondria. In: Yeast: A PracticalApproach, Campbell, I. and Duffus, J.H. (eds). IRL Press, Oxford.
20. Palmer, F. (1969) The determination of pitching yeast concentration. Tech. Q. Master Brew. Assoc. Am.36, 69–71.
21. D’Hautcourt, O. and Smart, K.A. (1999) Measurement of brewing yeast flocculation. J. Am. Soc. Brew.Chem. 57, 123–128.
22. Rapoport, A. and Beker, M. (1985) Changes in the surface charge of yeast cells during their dehydrationand rehydration. Mikrobiologiya 52, 259–261
23. Hazen, K.C. and Hazen, B.W. (1987) A polystyrene microsphere assay for detecting surface hydropho-bicity variations within Candida albicans populations. J. Microbiol. Methods 6, 289–299.
24. Boulton, C.A., Box, W.G., Quain, D.E. and Molzahn, S.W. (1999) Vicinal diketone reduction as a measureof yeast vitality. Proc. Eur. Brew. Cong., Cannes, pp. 697–694.
25. Smart, K.A. (2001) Biomarkers of yeast condition – predicting fitness to ferment. Institute and Guild ofBrewing Africa Section, Proceedings of the 8th Convention, Sun City, South Africa, 8, 138–149.
26. Lillie, S.H. and Pringle, J.H. (1980) Reserve carbohydrate metabolism in Saccharomyces cerevisiae:responses to nutrient limitation. J. Bacteriol. 143, 1384–1394.
27. Boulton, C. (2000) Trehalose, glycogen and sterol. In: Brewing Yeast and Fermentation Performance,Smart, K. (ed.). Blackwell Science, Oxford, pp. 10–19.
28. Callaerts, G., Iserentant, D. and Verachtert, H. (1993) Relationship between trehalose and sterol accu-mulation during oxygenation of cropped yeast. J. Am. Soc. Brew. Chem. 51, 75–77.
29. Eleutheiro, E.C.A., Araujo, P.S. and Panek, A.D. (1993) Role of trehalose carrier in dehydration resistanceof Saccharomyces cerevisiae. J. Gen. Microbiol. 137, 637–644.
30. Majara, M., O’Connor-Cox, E. and Axcell, B. (1996) Trehelose – a stress protectant and stress indicatorcompound for yeast exposed to adverse conditions. J. Am. Soc. Brew. Chem. 4, 221–227.
31. Monch, D., Krger, E. and Stahl, U. (1995) Effect of stress on brewery yeast. Monatschr. Brauwiss. 48,288–299.
32. Smart, K.A. and Whisker, S.W. (1996) Effect of serial repitching on fermentation properties and con-dition of brewing yeast. J. Am. Soc. Brew. Chem. 54, 41–44.
33. Morrison, K.B. and Suggett, A. (1986) Yeast handling, petite mutants and lager flavour. J. Inst. Brew.89, 141–142.
34. Heidenreich, E. and Wintersberger, U. (1998) Replication-dependent and selection-induced muta-tions in respiratory competent and respiratory deficient strains of Saccharomyces cerevisiae. Mol. Gen.Genet. 260, 395–400.
270 BREWING YEAST FERMENTATION PERFORMANCE
35. Bandas, E.L. and Zakharov, I.E. (1980) Induction of rho� mutations in yeast Saccharomyces cerevisiaeby ethanol. Mutat. Res. 71, 193–199.
36. O’Connor-Cox, E (1998) Improving yeast handling in the brewery. Part 2. Yeast collection. Brew.Guardian 2, 22–33.
37. Haukeli, A.D. and Lie, S. (1972) Production of diacetyl, 2-acetolactate and acetoin by yeasts duringfermentation. J. Inst. Brew. 78, 229–232.
38. Pickerell, A. (1991) Impact of yeast handling procedures on beer flavour development during fermen-tation. J. Am. Soc. Brew. Chem. 49, 87–92.
39. Tiexera, J.M., Tiexera, J.A., Mota, M. et al. (1991) The influence of cell wall composition of a brewer’sflocculent lager yeast on sedimentation during successive industrial fermentations. Proc. Eur. Brew.Conv. 23, 241–248.
40. Stewart, G.C. and Russell, I. (1987) The relevance of the flocculation properties of yeast in today’sbrewing industry. Proc. Eur. Brew. Conv. Monograph XII, pp. 53–68.
41. Straver, M.H., Kijne, J.W. and Smit, G. (1993) Cause and control of flocculation in yeast. TrendsBiotechnol. 11, 228–232.
42. Smart, K.A., Boulton, C.A., Hinchcliffe, E. and Molzahn, S. (1995) Effect of physiological stress on thesurface properties of brewing yeast. J. Am. Soc. Brew. Chem. 53, 33–38.
43. Powell, C.D., Quain, D.E. and Smart, K.A. (2000) Replicative ageing and senescence in Saccharomycescerevisiae and the impact on brewing fermentations. Microbiology 146, 1023–1034.
SERIAL REPITCHING FERMENTATION PERFORMANCE 271
25 The Impact of Yeast Cell Age on Fermentation,Attenuation and Flocculation
C.D. POWELL, D.E. QUAIN and K.A. SMART
Abstract The physiological condition of yeast is known to influence fermentation per-formance, but until recently cell age has not been considered to be a brewing yeast stressfactor. To ascertain the effect of cell age on fermentation performance, age-synchronisedpopulations of a lager strain were prepared using sedimentation through sucrose gradients.Each age fraction was analysed for the ability to utilise fermentable sugars and the capacityto flocculate. The surface charge and hydrophobicity of cells within each age fraction werealso determined. Aged cells were observed to ferment more efficiently and at a higher ratethan mixed or virgin cell cultures. In addition, the flocculation potential of cells was observedto increase in conjunction with cell age. The hydrophobic properties of the cell wall closelyreflected the observed variations in flocculation.
25.1 Introduction
The yeast Saccharomyces cerevisiae possesses a finite replicative lifespan. Each cellwithin a population is only capable of a limited number of divisions before senescenceand death. Studies of the ageing phenotype in haploid and polyploid strains have indi-cated that as a consequence of senescence yeast cells are subject to morphological,metabolic and genetic modifications.1 Such modifications include an increase in size2
and alterations in the shape and surface appearance of the cell.3 In addition, generationtime is altered,3 and gene expression4 and protein synthesis5 are modified.
Beer quality is strongly influenced by the biochemical performance of yeast duringfermentation. Many intrinsic and extrinsic factors may affect the rate and quality offermentation and the character of the final product; however, until recently replica-tive ageing has not been considered to be important to the process.6 Towards the endof fermentation, yeast begins to flocculate and sediment into the fermenter cone. Therate at which each cell sediments is believed to vary according to its replicative age.7
Consequently, sedimentation results in the formation of zones enriched with cells ofa particular age. Deans et al.7 demonstrated that older cells accumulate at the bottom ofthe fermentation vessel; however, results within the present authors’ laboratory suggestthat the precise location of aged cells within the cone may vary according to the char-acteristics of the yeast strain used and the dimensions of the fermentation vessel.8
At the end of fermentation a portion of the yeast is removed (cropped) from the fer-mentation vessel and reused (serially repitched). This is traditionally the centre–topportion of the yeast crop, theoretically consisting of middle-aged and virgin cells.6,7
However, removing yeast via a ‘warm’ or an ‘early’ cropping regimen may facilitateremoval of the lower portion of the crop, comprising a greater proportion of aged cells.6
Harvesting yeast may therefore select for a population with an imbalance of young or aged individuals, depending on the cropping mechanism used. Here, evidence is
Brewing Yeast Fermentation Performance: Second edition
Edited by: KATHERINE SMART Copyright 0 Blackwell Science 2003
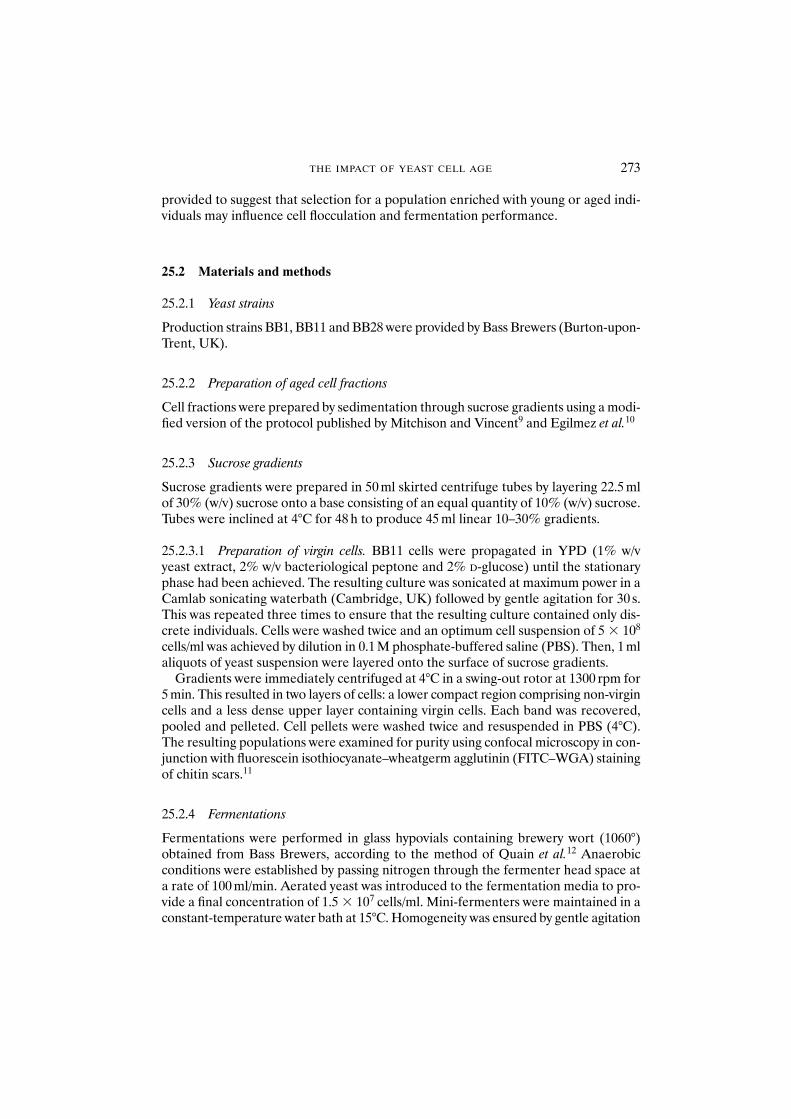
provided to suggest that selection for a population enriched with young or aged indi-viduals may influence cell flocculation and fermentation performance.
25.2 Materials and methods
25.2.1 Yeast strains
Production strains BB1, BB11 and BB28 were provided by Bass Brewers (Burton-upon-Trent, UK).
25.2.2 Preparation of aged cell fractions
Cell fractions were prepared by sedimentation through sucrose gradients using a modi-fied version of the protocol published by Mitchison and Vincent9 and Egilmez et al.10
25.2.3 Sucrose gradients
Sucrose gradients were prepared in 50 ml skirted centrifuge tubes by layering 22.5 mlof 30% (w/v) sucrose onto a base consisting of an equal quantity of 10% (w/v) sucrose.Tubes were inclined at 4°C for 48 h to produce 45 ml linear 10–30% gradients.
25.2.3.1 Preparation of virgin cells. BB11 cells were propagated in YPD (1% w/vyeast extract, 2% w/v bacteriological peptone and 2% D-glucose) until the stationaryphase had been achieved. The resulting culture was sonicated at maximum power in aCamlab sonicating waterbath (Cambridge, UK) followed by gentle agitation for 30 s.This was repeated three times to ensure that the resulting culture contained only dis-crete individuals. Cells were washed twice and an optimum cell suspension of 5 � 108
cells/ml was achieved by dilution in 0.1 M phosphate-buffered saline (PBS). Then, 1 mlaliquots of yeast suspension were layered onto the surface of sucrose gradients.
Gradients were immediately centrifuged at 4°C in a swing-out rotor at 1300 rpm for5 min. This resulted in two layers of cells: a lower compact region comprising non-virgincells and a less dense upper layer containing virgin cells. Each band was recovered,pooled and pelleted. Cell pellets were washed twice and resuspended in PBS (4°C).The resulting populations were examined for purity using confocal microscopy in con-junction with fluorescein isothiocyanate–wheatgerm agglutinin (FITC–WGA) stainingof chitin scars.11
25.2.4 Fermentations
Fermentations were performed in glass hypovials containing brewery wort (1060°)obtained from Bass Brewers, according to the method of Quain et al.12 Anaerobicconditions were established by passing nitrogen through the fermenter head space ata rate of 100 ml/min. Aerated yeast was introduced to the fermentation media to pro-vide a final concentration of 1.5 � 107 cells/ml. Mini-fermenters were maintained in aconstant-temperature water bath at 15°C. Homogeneity was ensured by gentle agitation
THE IMPACT OF YEAST CELL AGE 273
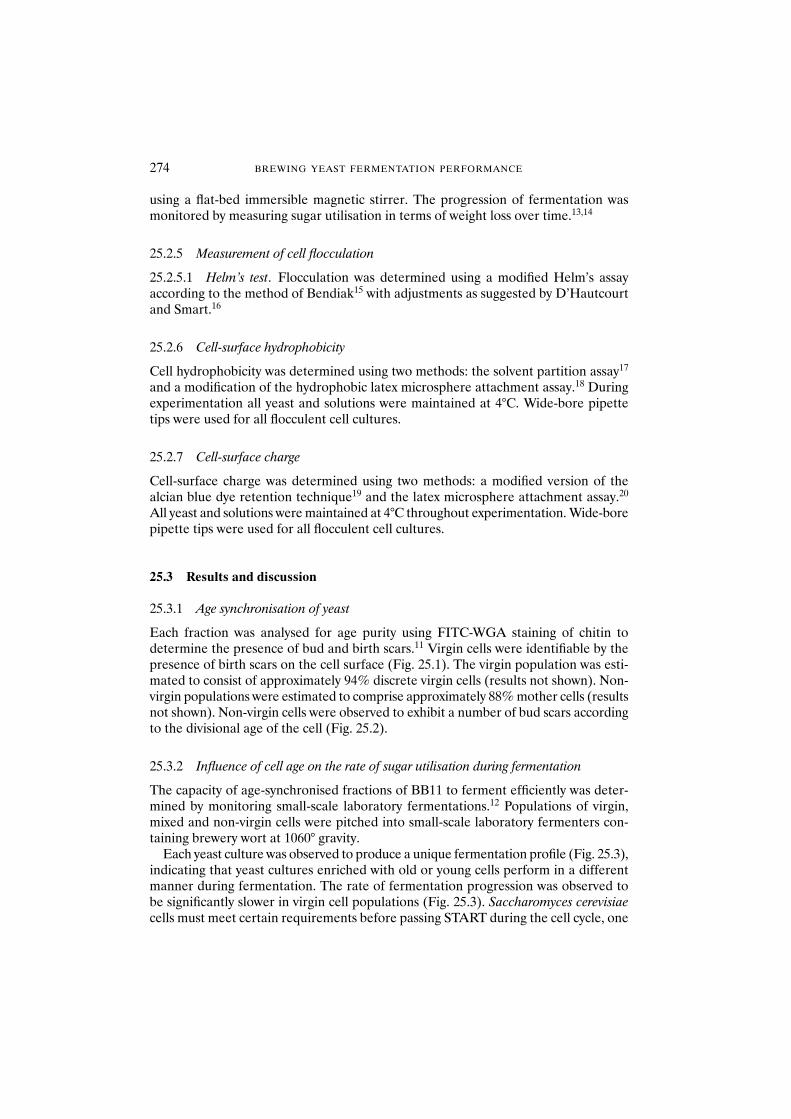
274 BREWING YEAST FERMENTATION PERFORMANCE
using a flat-bed immersible magnetic stirrer. The progression of fermentation wasmonitored by measuring sugar utilisation in terms of weight loss over time.13,14
25.2.5 Measurement of cell flocculation
25.2.5.1 Helm’s test. Flocculation was determined using a modified Helm’s assayaccording to the method of Bendiak15 with adjustments as suggested by D’Hautcourtand Smart.16
25.2.6 Cell-surface hydrophobicity
Cell hydrophobicity was determined using two methods: the solvent partition assay17
and a modification of the hydrophobic latex microsphere attachment assay.18 Duringexperimentation all yeast and solutions were maintained at 4°C. Wide-bore pipettetips were used for all flocculent cell cultures.
25.2.7 Cell-surface charge
Cell-surface charge was determined using two methods: a modified version of thealcian blue dye retention technique19 and the latex microsphere attachment assay.20
All yeast and solutions were maintained at 4°C throughout experimentation. Wide-borepipette tips were used for all flocculent cell cultures.
25.3 Results and discussion
25.3.1 Age synchronisation of yeast
Each fraction was analysed for age purity using FITC-WGA staining of chitin todetermine the presence of bud and birth scars.11 Virgin cells were identifiable by thepresence of birth scars on the cell surface (Fig. 25.1). The virgin population was esti-mated to consist of approximately 94% discrete virgin cells (results not shown). Non-virgin populations were estimated to comprise approximately 88% mother cells (resultsnot shown). Non-virgin cells were observed to exhibit a number of bud scars accordingto the divisional age of the cell (Fig. 25.2).
25.3.2 Influence of cell age on the rate of sugar utilisation during fermentation
The capacity of age-synchronised fractions of BB11 to ferment efficiently was deter-mined by monitoring small-scale laboratory fermentations.12 Populations of virgin,mixed and non-virgin cells were pitched into small-scale laboratory fermenters con-taining brewery wort at 1060° gravity.
Each yeast culture was observed to produce a unique fermentation profile (Fig. 25.3),indicating that yeast cultures enriched with old or young cells perform in a differentmanner during fermentation. The rate of fermentation progression was observed tobe significantly slower in virgin cell populations (Fig. 25.3). Saccharomyces cerevisiaecells must meet certain requirements before passing START during the cell cycle, one
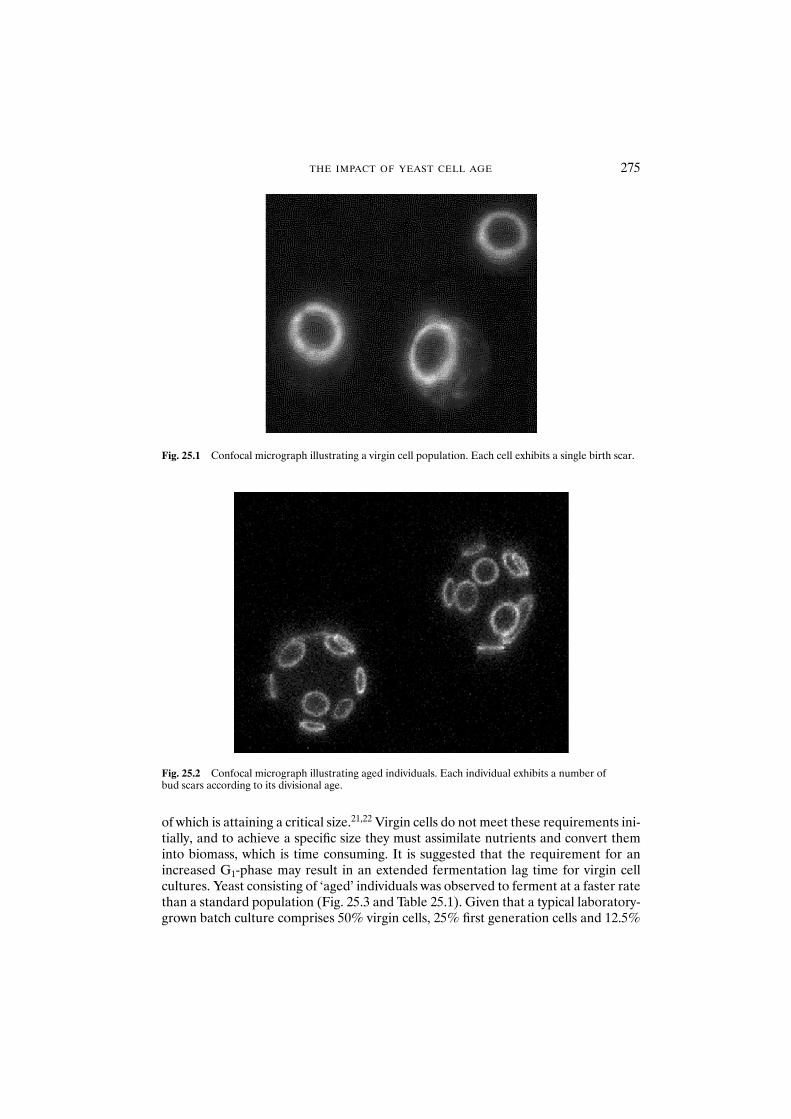
THE IMPACT OF YEAST CELL AGE 275
of which is attaining a critical size.21,22 Virgin cells do not meet these requirements ini-tially, and to achieve a specific size they must assimilate nutrients and convert theminto biomass, which is time consuming. It is suggested that the requirement for anincreased G1-phase may result in an extended fermentation lag time for virgin cellcultures. Yeast consisting of ‘aged’ individuals was observed to ferment at a faster ratethan a standard population (Fig. 25.3 and Table 25.1). Given that a typical laboratory-grown batch culture comprises 50% virgin cells, 25% first generation cells and 12.5%
Fig. 25.1 Confocal micrograph illustrating a virgin cell population. Each cell exhibits a single birth scar.
Fig. 25.2 Confocal micrograph illustrating aged individuals. Each individual exhibits a number of bud scars according to its divisional age.
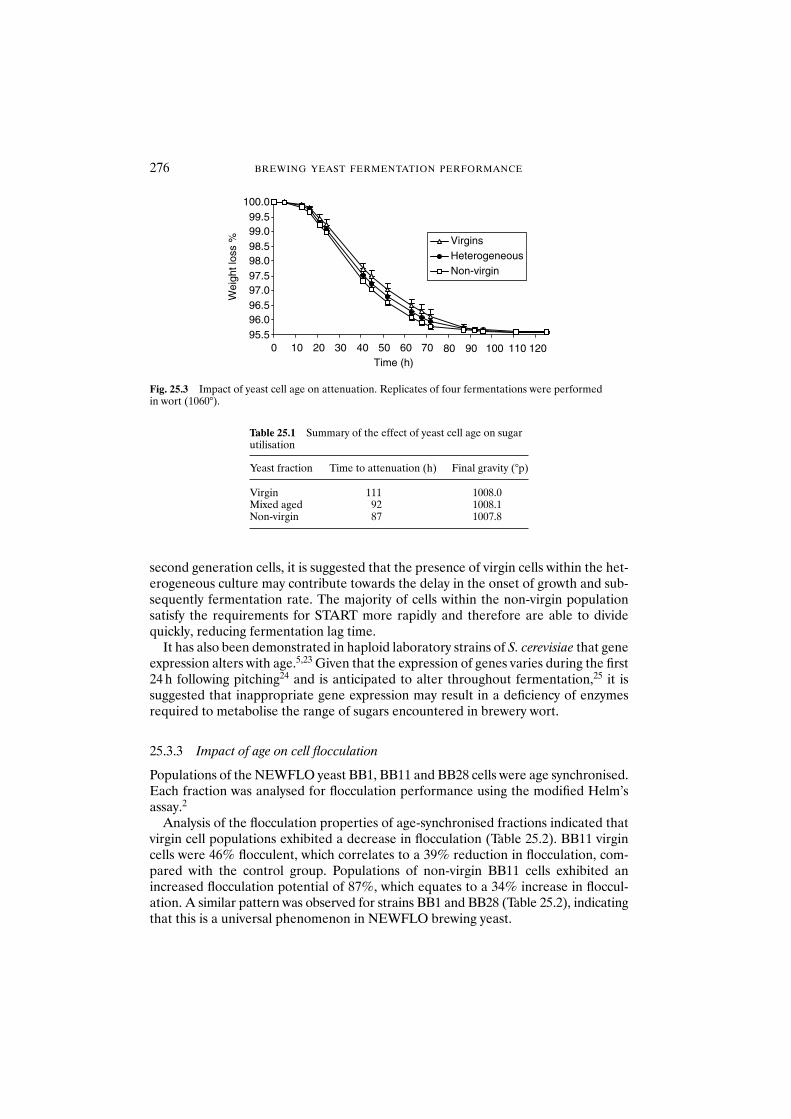
276 BREWING YEAST FERMENTATION PERFORMANCE
second generation cells, it is suggested that the presence of virgin cells within the het-erogeneous culture may contribute towards the delay in the onset of growth and sub-sequently fermentation rate. The majority of cells within the non-virgin populationsatisfy the requirements for START more rapidly and therefore are able to dividequickly, reducing fermentation lag time.
It has also been demonstrated in haploid laboratory strains of S. cerevisiae that geneexpression alters with age.5,23 Given that the expression of genes varies during the first24 h following pitching24 and is anticipated to alter throughout fermentation,25 it issuggested that inappropriate gene expression may result in a deficiency of enzymesrequired to metabolise the range of sugars encountered in brewery wort.
25.3.3 Impact of age on cell flocculation
Populations of the NEWFLO yeast BB1, BB11 and BB28 cells were age synchronised.Each fraction was analysed for flocculation performance using the modified Helm’sassay.2
Analysis of the flocculation properties of age-synchronised fractions indicated thatvirgin cell populations exhibited a decrease in flocculation (Table 25.2). BB11 virgincells were 46% flocculent, which correlates to a 39% reduction in flocculation, com-pared with the control group. Populations of non-virgin BB11 cells exhibited anincreased flocculation potential of 87%, which equates to a 34% increase in floccul-ation. A similar pattern was observed for strains BB1 and BB28 (Table 25.2), indicatingthat this is a universal phenomenon in NEWFLO brewing yeast.
95.596.096.597.097.598.098.599.099.5
100.0
120110100706050403020100 80 90Time (h)
Wei
ght l
oss
%
VirginsHeterogeneousNon-virgin
Fig. 25.3 Impact of yeast cell age on attenuation. Replicates of four fermentations were performed in wort (1060°).
Table 25.1 Summary of the effect of yeast cell age on sugarutilisation
Yeast fraction Time to attenuation (h) Final gravity (°p)
Virgin 111 1008.0Mixed aged 92 1008.1Non-virgin 87 1007.8
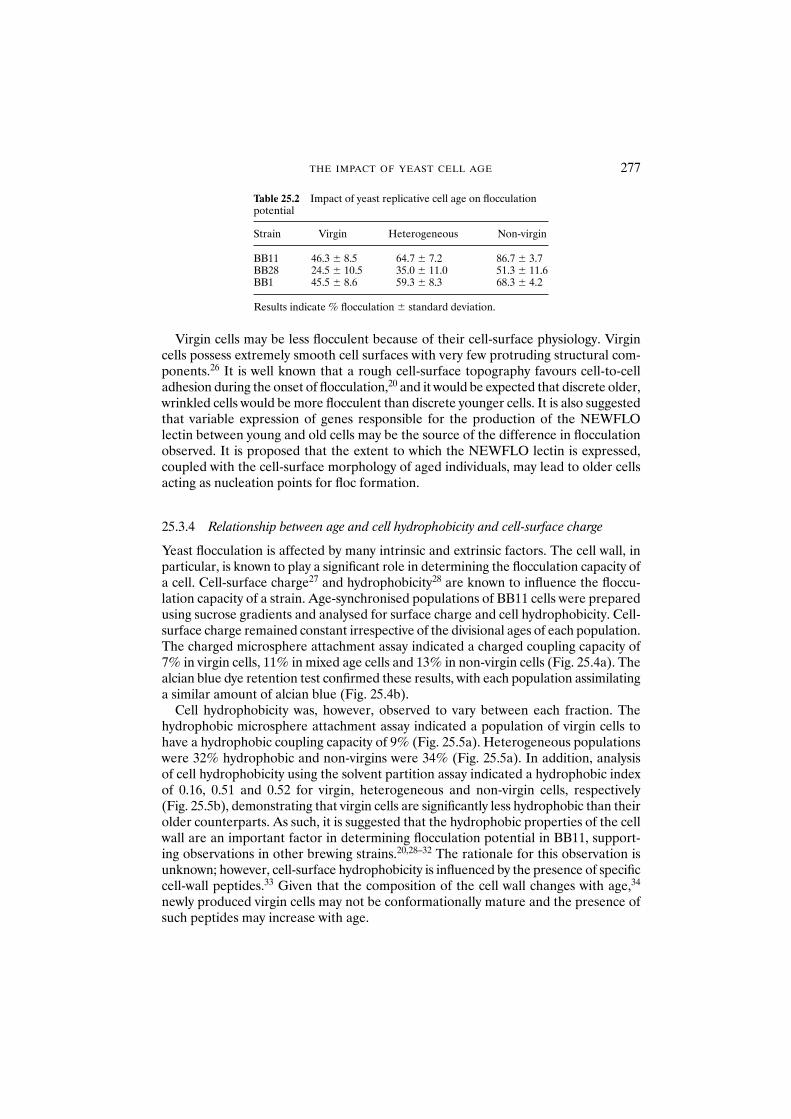
THE IMPACT OF YEAST CELL AGE 277
Virgin cells may be less flocculent because of their cell-surface physiology. Virgincells possess extremely smooth cell surfaces with very few protruding structural com-ponents.26 It is well known that a rough cell-surface topography favours cell-to-celladhesion during the onset of flocculation,20 and it would be expected that discrete older,wrinkled cells would be more flocculent than discrete younger cells. It is also suggestedthat variable expression of genes responsible for the production of the NEWFLOlectin between young and old cells may be the source of the difference in flocculationobserved. It is proposed that the extent to which the NEWFLO lectin is expressed,coupled with the cell-surface morphology of aged individuals, may lead to older cellsacting as nucleation points for floc formation.
25.3.4 Relationship between age and cell hydrophobicity and cell-surface charge
Yeast flocculation is affected by many intrinsic and extrinsic factors. The cell wall, inparticular, is known to play a significant role in determining the flocculation capacity ofa cell. Cell-surface charge27 and hydrophobicity28 are known to influence the floccu-lation capacity of a strain. Age-synchronised populations of BB11 cells were preparedusing sucrose gradients and analysed for surface charge and cell hydrophobicity. Cell-surface charge remained constant irrespective of the divisional ages of each population.The charged microsphere attachment assay indicated a charged coupling capacity of7% in virgin cells, 11% in mixed age cells and 13% in non-virgin cells (Fig. 25.4a). Thealcian blue dye retention test confirmed these results, with each population assimilatinga similar amount of alcian blue (Fig. 25.4b).
Cell hydrophobicity was, however, observed to vary between each fraction. Thehydrophobic microsphere attachment assay indicated a population of virgin cells tohave a hydrophobic coupling capacity of 9% (Fig. 25.5a). Heterogeneous populationswere 32% hydrophobic and non-virgins were 34% (Fig. 25.5a). In addition, analysis of cell hydrophobicity using the solvent partition assay indicated a hydrophobic indexof 0.16, 0.51 and 0.52 for virgin, heterogeneous and non-virgin cells, respectively (Fig. 25.5b), demonstrating that virgin cells are significantly less hydrophobic than theirolder counterparts. As such, it is suggested that the hydrophobic properties of the cellwall are an important factor in determining flocculation potential in BB11, support-ing observations in other brewing strains.20,28–32 The rationale for this observation isunknown; however, cell-surface hydrophobicity is influenced by the presence of specificcell-wall peptides.33 Given that the composition of the cell wall changes with age,34
newly produced virgin cells may not be conformationally mature and the presence ofsuch peptides may increase with age.
Table 25.2 Impact of yeast replicative cell age on flocculationpotential
Strain Virgin Heterogeneous Non-virgin
BB11 46.3 � 8.5 64.7 � 7.2 86.7 � 3.7BB28 24.5 � 10.5 35.0 � 11.0 51.3 � 11.6BB1 45.5 � 8.6 59.3 � 8.3 68.3 � 4.2
Results indicate % flocculation � standard deviation.
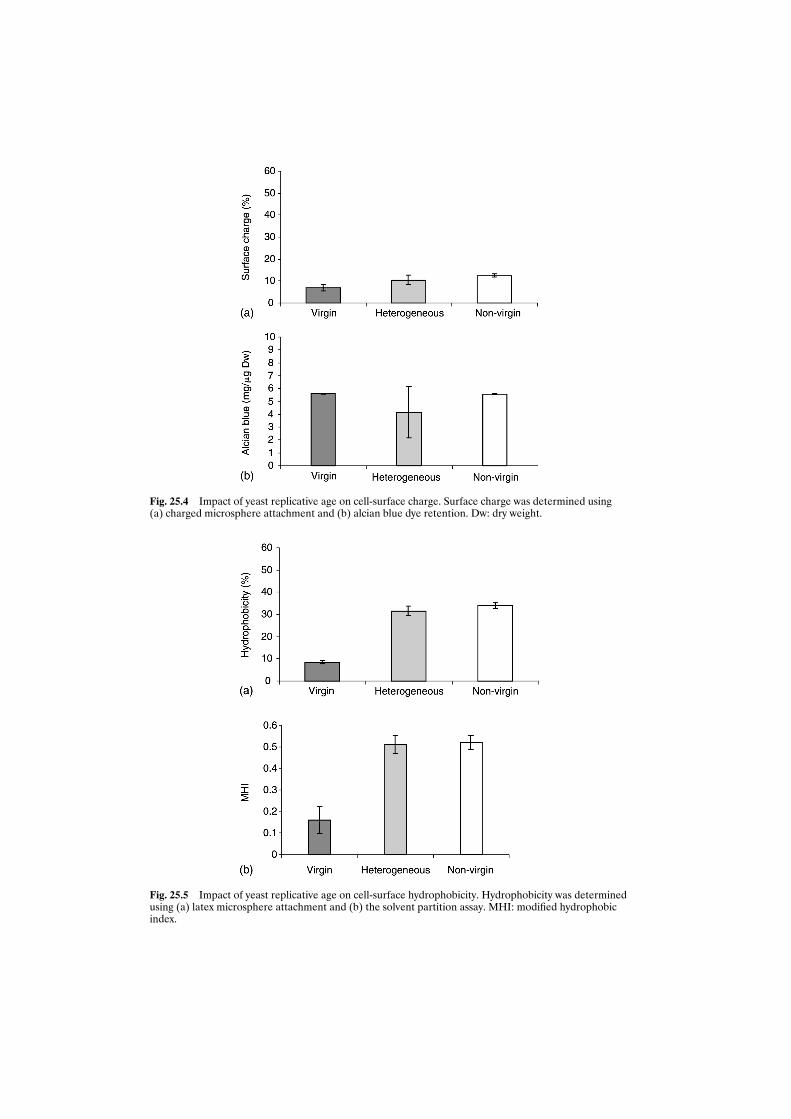
Fig. 25.4 Impact of yeast replicative age on cell-surface charge. Surface charge was determined using (a) charged microsphere attachment and (b) alcian blue dye retention. Dw: dry weight.
Fig. 25.5 Impact of yeast replicative age on cell-surface hydrophobicity. Hydrophobicity was determinedusing (a) latex microsphere attachment and (b) the solvent partition assay. MHI: modified hydrophobicindex.
THE IMPACT OF YEAST CELL AGE 279
25.4 Conclusions
Fermentation performance is strongly influenced by the condition of the yeast cultureused. In particular, the ability to utilise fermentable wort sugars efficiently and theability to separate from the beer at the required stage of the process are of principalimportance. To determine the impact of yeast cell age on attenuation and floccula-tion, age-synchronised fractions of the lager yeast strain BB11 were investigated.
Virgin cell cultures were less competent at utilising sugars than were mixed age ornon-virgin cell cultures, mainly because of an elongated lag phase at the start of fer-mentation. However, the final gravity of the beer produced was not observed to besignificantly different. This indicates that each population of BB11 cells was equallycapable of utilising fermentable wort sugars, suggesting that uptake rate is purely anartefact of cell age rather than a vitality-induced defect. Continual artificial selectionfor a population with an imbalance of young or aged individuals may significantly affectfuture fermentation performance.
Analysis of the flocculation characteristics of age-synchronised yeast fractions indi-cated that aged individuals were more efficient at flocculating than their youngercounterparts. In conjunction with an increase in flocculation, cell hydrophobicity wasobserved to increase, although surface charge remained constant. Within a full-scalefermentation vessel, aged individuals displaying an enhanced flocculation potentialmay sediment early, causing cell numbers in suspension to decrease, and potentiallyleading to a reduction in efficiency during the final stages of fermentation in terms ofspeed and attenuation. Alternatively, continual selection for a population comprisinga large proportion of younger cells may result in slow beer clarification, yeasty off-flavours and filtration issues as a result of weak flocculation.
Acknowledgements
This work was funded by a BBSRC case studentship. Chris Powell held the RainbowResearch Scholarship and gratefully acknowledges Bass Brewers for their support.Katherine Smart is a Royal Society Industrial Fellow and the Scottish Courage Readerin Brewing Sciences, and gratefully acknowledges the support of the Royal Society andScottish Courage Brewing Ltd. We thank the Directors of Bass Brewers for permissionto publish this work.
References
1. Jazwinski, S.M. (1990) An experimental system for the molecular analysis of the aging process: thebudding yeast Saccharomyces cerevisiae. J. Gerontol. 45, B68–B74.
2. Bartholomew, J.W. and Mittwer, T. (1953) Demonstration of yeast bud scars with the electron micro-scope. J. Bacteriol. 65, 272–275.
3. Mortimer, R.K. and Johnston, J.R. (1959) Life span of individual yeast cells. Nature 183, 1751–1752.4. Egilmez, N.K., Chen, J.B. and Jazwinski, S.M. (1989) Specific alterations in transcript prevalence dur-
ing the yeast life-span. J. Biol. Chem. 264, 14312–14317.5. Motizuki, M. and Tsurugi, K. (1992) The effect of aging on protein synthesis in the yeast Saccharomyces
cerevisiae. Mech. Age. Dev. 64, 235–245.
280 BREWING YEAST FERMENTATION PERFORMANCE
6. Powell, C.D., Van Zandycke, S.M., Quain, D.E. and Smart, K.A. (2000) Replicative ageing and senes-cence in Saccharomyces cerevisiae and the impact on brewing fermentations. Microbiology 146,1023–1034.
7. Deans, K., Pinder, A., Catley, B.J. and Hodgson, J.A. (1997) Effects of cone cropping and serial repitchon the distribution of cell ages in brewery yeast. Proc. Eur. Brew. Conv. Cong. pp. 469–476.
8. Powell, C.D. (2001) The impact of yeast cell age on brewing fermentation performance. PhD Thesis,Oxford Brookes University, Oxford.
9. Mitchison, J.M. and Vincent, W.S. (1965) Separation of synchronous cell cultures by sedimentation.Nature 205, 987–989.
10. Egilmez, N.K., Chen, J.B. and Jazwinski, S.M. (1990) Preparation and partial characterisation of oldyeast cells. J. Gerontol. 45, B9–B17.
11. Powell, C.D., Quain, D.E. and Smart, K.A. (submitted) Chitin scar breaks in aged Saccharomyces cerevisiae.
12. Quain, D.E., Box, W.G. and Walton, E.F. (1985) An inexpensive and simple small-scale laboratory fer-menter. Lab. Pract. 34, 84.
13. Ayrapaa, T. (1973) Monitoring of fermentation by weighing of the vessel. J. Inst. Brew. 79, 274.14. Jacobsen, T., Hage, T. and Lie, S. (1982) A fermentation assay for wort element availability. J. Inst.
Brew. 88, 387–389.15. Bendiak, D.S. (1995) Quantification of the Helm’s flocculation test. J. Am. Soc. Brew. Chem. 52,
120–1222.16. D’Hautcourt, O. and Smart, K.A. (1999) The measurement of brewing yeast flocculation. J. Am. Soc.
Brew. Chem. 57, 123–128.17. Hinchcliffe, E., Box, W.G., Walton, E.F. and Appleby, M. (1985) The influences of cell wall hydro-
phobicity on the top fermenting properties of brewing yeast. Proc. 20th Eur. Brew. Conv. Brew. Cong.,pp. 323–330.
18. Hazen, K.C. and Hazen, B.W. (1987) A polystyrene micosphere assay for detecting surface hydropho-bicity variations within Candida albicans populations. J. Microbiol. Meth. 6, 289–299.
19. Rapoport, A. and Becker, M. (1985) Changes in the surface charge of yeast cells during their dehydra-tion and rehydration. Mikrobiologiya 54, 450–453.
20. Rhymes, M.R. and Smart, K.A. (2000) The relationship between flocculation and cell surface physicalproperties in a FLO1 ale yeast. In: Brewing Yeast Fermentation Performance, Smart, K. (ed.). BlackwellScience, Oxford, pp. 152–159.
21. Lorincz, A. and Carter, B.L.A. (1979) Control of cell size at bud initiation in Saccharomyces cerevisiae.J. Gen. Microbiol. 113, 287–295.
22. Pringle, J.R. and Hartwell, L.H. (1981) The Saccharomyces cell cycle. In: The Molecular Biology of theYeast Saccharomyces, Strathern, J., Jones, E.W. and Broach, J.R. (eds). Cold Spring Harbor LaboratoryPress, Cold Spring Harbor, NY, pp. 97–142.
23. Laun, P. (2001) Personal communication, Nature Biotechnology Winter Symposium: Cell Death andAging, Miami, USA.
24. Lentini, A. Rogers, P., Higgins, V., Davies, I., Chandler, M., Stanley, G. and Chambers, P. The impactof ethanol stress on yeast physiology. In: Brewing Yeast Fermentation Performance, 2nd edn, Smart, K.A.(ed.). Blackwell Science, Oxford, pp. 25–38.
25. Pugh, T. (2001) Oral presentation, MBAA Symposium, Sierra Nevada, USA.26. Barker, M.G. and Smart, K.A. (1996) Morphological changes associated with the cellular ageing of
a brewing yeast strain. J. Am. Soc. Brew. Chem. 54, 121–126.27. Mestdagh, M., Rouxhet, P. and Dufour, J. (1990) Surface chemistry and flocculation of brewing yeast.
Fermentation 3, 31–37.28. Kamada, K. and Murata, M. (1984) On the mechanism of brewers yeast flocculation. Agric. Biol. Chem.
48, 2423–2433.29. Amory, D.E., Mozes, N., Hermesse, M.P. et al. Chemical analysis of the surface of micro-organisms by
X-ray photoelectron spectroscopy. FEMS Microbiol. Methods 49, 107–110.30. Jin, Y.-L. and Speers, R.A. (2001) Effect of cell surface hydrophobicity, charge and zymolectin density
on the flocculation of Saccharomyces cerevisiae. J. Am. Soc. Brew. Chem. 59, 1–9.31. Smit, G., Straver, M., Lugtenberg, B. and Kijne, J. (1992) Flocculence of S. cerevisiae cells is induced
by nutrient limitation, with cell surface hydrophobicity as a major determinant. Appl. Environ.Microbiol. 58, 3709–3714.
32. Straver, M.H., Kijne, J.W. and Smit, G. (1993) Cause and control of flocculation in yeast. TrendsBiotech. 11, 228–232.
33. Hazen, K.C. and Hazen, B.W. (1993) Surface hydrophobic and hydrophilic protein alterations inCandida albicans. FEMS Microbiol. Lett. 107, 83–88.
34. Lyons, T.P. and Hough, J.S. (1970) The role of yeast cell walls in brewing. Brew. Digest August, 52–60.
26 Chronological and Replicative Lifespan in Lager Brewing Yeast
D.L. MASKELL, A.I. KENNEDY, J.A. HODGSON andK.A. SMART
Abstract Saccharomyces cerevisiae can be considered to have two forms of lifespan: replica-tive and chronological. Replicative lifespan is defined as the number of divisions completedby a cell and is determined by genetic and environmental factors. In contrast, chronologicallifespan has been defined as the long-term survival of cells maintained in stationary phaseand has been postulated to represent a valuable tool for the monitoring of long-term macro-molecular damage and mortality. Cells that have passed through the replicative or chrono-logical lifespan will enter a viable but non-culturable phenotypic phase, sometimes referredto as senescence, which eventually leads to cell death.
These two forms of yeast lifespan may not be distinct, since prolonged retention of cellsin the stationary phase appears to be correlated with a reduction in replicative lifespan oncethe cells are returned to an environment favouring replication. However, preliminary studieswere conducted in laboratory haploid strains of S. cerevisiae and the relationship betweenstationary phase and replicative lifespan has not been reported in polyploid or aneuploidbrewing strains which may belong to either of two putative species, Saccharomyces cerevisiae(ale strains) or Saccharomyces pastiaranus (lager strains).
Brewing yeast’s replicative longevity has been demonstrated to be influenced byenvironmental conditions such as media composition; however, the potential impact ofphysiological stress on replicative lifespan has not been extensively investigated. In thisstudy the relationship between physiological stress and replicative ageing in lager brewingyeast is considered.
26.1 Introduction
It has recently been suggested that the yeast Saccharomyces cerevisiae could be consid-ered to have two distinct lifespans: replicative and chronological.1 Replicative lifespanis determined by the number of divisions completed by each individual cell, and isgenetically controlled but influenced by the environment.2–5 Once the cell has divideda predetermined number of times it enters the state of cellular senescence, perman-ently losing the capacity to replicate, and eventually dies.4 The number of divisionscompleted before entering senescence or yeast replicative lifespan is strain specific3,6–9
but usually conserved within the range of nine to 33 divisions.5
However, the progression from youth to old age is invariably accompanied by biomarkers, including increasing bud scar number,4,7,10–12 increasing cell size,4,7,11–13
granulation,4,7,10 wrinkling of cell surface4,7,14–16 and increased generation time.4,7,8
In contrast, chronological lifespan has been defined as the long-term survival of cellsmaintained in stationary phase and has been postulated to represent a valuable tool forthe monitoring of long-term macromolecular damage and mortality.1,17–21 Chronological
Brewing Yeast Fermentation Performance: Second edition
Edited by: KATHERINE SMART Copyright 0 Blackwell Science 2003
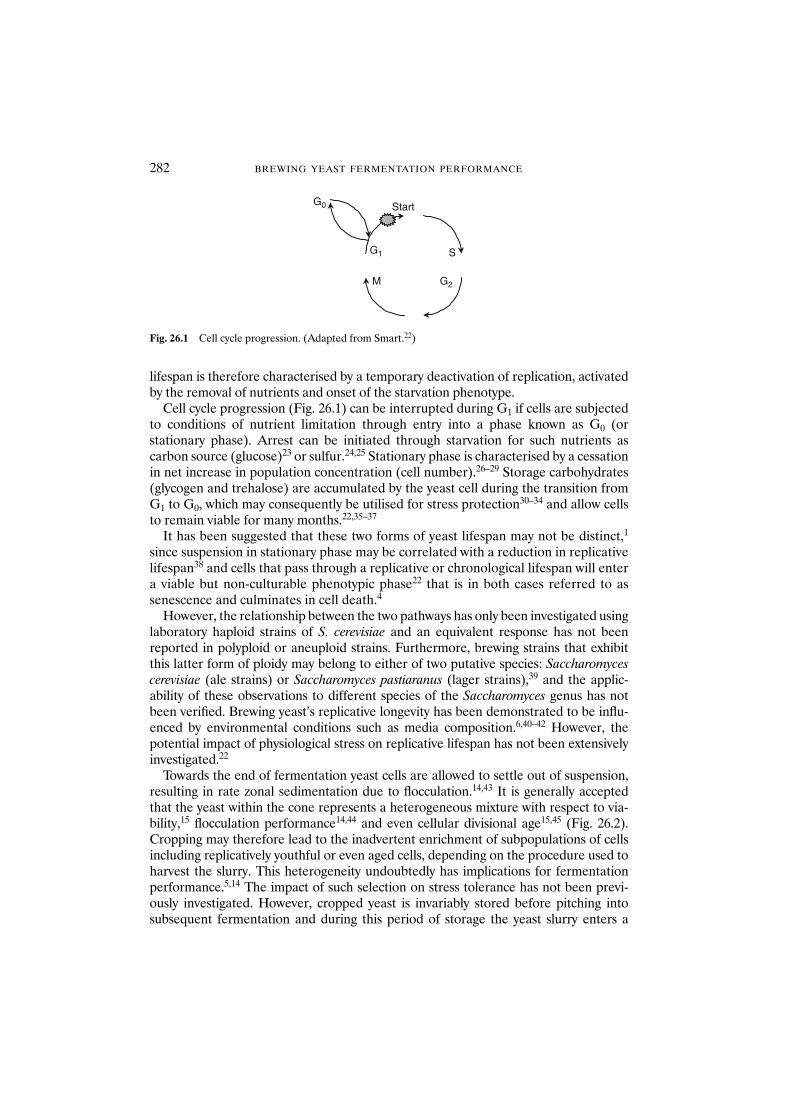
lifespan is therefore characterised by a temporary deactivation of replication, activatedby the removal of nutrients and onset of the starvation phenotype.
Cell cycle progression (Fig. 26.1) can be interrupted during G1 if cells are subjectedto conditions of nutrient limitation through entry into a phase known as G0 (or stationary phase). Arrest can be initiated through starvation for such nutrients as carbon source (glucose)23 or sulfur.24,25 Stationary phase is characterised by a cessationin net increase in population concentration (cell number).26–29 Storage carbohydrates(glycogen and trehalose) are accumulated by the yeast cell during the transition fromG1 to G0, which may consequently be utilised for stress protection30–34 and allow cellsto remain viable for many months.22,35–37
It has been suggested that these two forms of yeast lifespan may not be distinct,1
since suspension in stationary phase may be correlated with a reduction in replicativelifespan38 and cells that pass through a replicative or chronological lifespan will entera viable but non-culturable phenotypic phase22 that is in both cases referred to assenescence and culminates in cell death.4
However, the relationship between the two pathways has only been investigated usinglaboratory haploid strains of S. cerevisiae and an equivalent response has not beenreported in polyploid or aneuploid strains. Furthermore, brewing strains that exhibitthis latter form of ploidy may belong to either of two putative species: Saccharomycescerevisiae (ale strains) or Saccharomyces pastiaranus (lager strains),39 and the applic-ability of these observations to different species of the Saccharomyces genus has notbeen verified. Brewing yeast’s replicative longevity has been demonstrated to be influ-enced by environmental conditions such as media composition.6,40–42 However, thepotential impact of physiological stress on replicative lifespan has not been extensivelyinvestigated.22
Towards the end of fermentation yeast cells are allowed to settle out of suspension,resulting in rate zonal sedimentation due to flocculation.14,43 It is generally acceptedthat the yeast within the cone represents a heterogeneous mixture with respect to via-bility,15 flocculation performance14,44 and even cellular divisional age15,45 (Fig. 26.2).Cropping may therefore lead to the inadvertent enrichment of subpopulations of cellsincluding replicatively youthful or even aged cells, depending on the procedure used toharvest the slurry. This heterogeneity undoubtedly has implications for fermentationperformance.5,14 The impact of such selection on stress tolerance has not been previ-ously investigated. However, cropped yeast is invariably stored before pitching into subsequent fermentation and during this period of storage the yeast slurry enters a
282 BREWING YEAST FERMENTATION PERFORMANCE
G0
G1
G2M
Start
S
Fig. 26.1 Cell cycle progression. (Adapted from Smart.22)
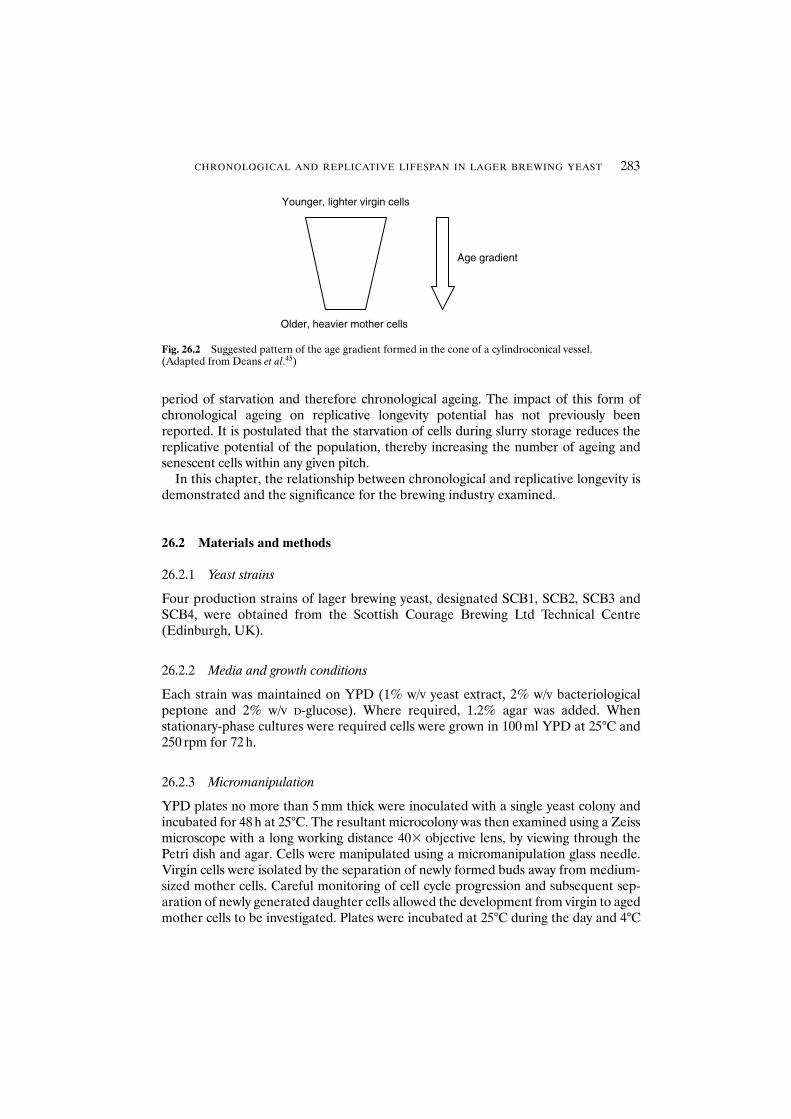
period of starvation and therefore chronological ageing. The impact of this form ofchronological ageing on replicative longevity potential has not previously beenreported. It is postulated that the starvation of cells during slurry storage reduces thereplicative potential of the population, thereby increasing the number of ageing andsenescent cells within any given pitch.
In this chapter, the relationship between chronological and replicative longevity isdemonstrated and the significance for the brewing industry examined.
26.2 Materials and methods
26.2.1 Yeast strains
Four production strains of lager brewing yeast, designated SCB1, SCB2, SCB3 andSCB4, were obtained from the Scottish Courage Brewing Ltd Technical Centre(Edinburgh, UK).
26.2.2 Media and growth conditions
Each strain was maintained on YPD (1% w/v yeast extract, 2% w/v bacteriologicalpeptone and 2% w/v D-glucose). Where required, 1.2% agar was added. When stationary-phase cultures were required cells were grown in 100 ml YPD at 25°C and250 rpm for 72 h.
26.2.3 Micromanipulation
YPD plates no more than 5 mm thick were inoculated with a single yeast colony andincubated for 48 h at 25°C. The resultant microcolony was then examined using a Zeissmicroscope with a long working distance 40� objective lens, by viewing through thePetri dish and agar. Cells were manipulated using a micromanipulation glass needle.Virgin cells were isolated by the separation of newly formed buds away from medium-sized mother cells. Careful monitoring of cell cycle progression and subsequent sep-aration of newly generated daughter cells allowed the development from virgin to agedmother cells to be investigated. Plates were incubated at 25°C during the day and 4°C
CHRONOLOGICAL AND REPLICATIVE LIFESPAN IN LAGER BREWING YEAST 283
Age gradient
Younger, lighter virgin cells
Older, heavier mother cells
Fig. 26.2 Suggested pattern of the age gradient formed in the cone of a cylindroconical vessel. (Adapted from Deans et al.45)
overnight to decrease growth rate and prevent excessive division. Where necessary, fil-ter paper soaked in sterile deionised water was placed in the lid of each Petri dish toprevent desiccation of the media. More than 65 cells were monitored for each strain.
26.2.3.1 Data analysis. The data obtained from the micromanipulation were expressedas the mean, maximum and maximum10% (mean Hayflick limit of the longest livedupper decile of the population), according to the method of Barker and Smart.4 Thestandard deviation for each sample group was also calculated.
Replicative and chronological mortality profiles were statistically analysed and sig-nificance was demonstrated using one-way analysis of variance (ANOVA) followed bythe Tukey–Kramer test for Gaussian populations. Where the populations were notGaussian (or a Gaussian approximation) non-parametric analysis was used (Kruskal–Wallis test), followed by Dunn’s multiple comparison test. Significance was demon-strated when the probability was less than 5%.
26.2.4 Extended stationary phase
Extended stationary-phase conditions were induced by the inoculation of washed stationary-phase cells into 100 ml sterile deionised water in 250 ml Erlenmeyer flasks toa final cell concentration of 1 � 106 cells/ml. The flasks were incubated in orbital shak-ers at 25°C and 250 rpm for 50 days, and sampled every 5 days for viability.
26.2.5 Production of sucrose gradients
Gradients were prepared in 50 ml skirted centrifuge tubes: 22.5 ml of 10% (w/v)sucrose was layered upon 22.5 ml of 30% (w/v) sucrose. These gradients were storedat 4°C for 48 h to produce 45 ml linear 10–30% sucrose gradients.
26.2.6 Production of virgin and non-virgin populations
Stationary-phase cells were sonicated and washed twice in 0.1 M phosphate-bufferedsaline (PBS). Cells were resuspended to an optimum cell concentration of 5 � 108
cells/ml in PBS. Aliquots of this suspension (1 ml) were layered onto the surface of thesucrose gradients. Following centrifugation at 1300 rpm and 4°C for 5 min bandingcould be observed within the gradient. The upper portion contained the virginpopulation, while the lower portion consisted of mother cells of varying ages. These portions were then washed twice and resuspended in PBS. The purity of thepopulation was determined by confocal microscopy using wheatgerm agglutinin toenumerate the bud scars present on the cell surface.
26.2.7 Viability assessment
26.2.7.1 Citrate methylene violet. Citrate methylene violet solution was preparedaccording to the method of Smart et al.46 Yeast suspension (0.5 ml) was mixed by vortexing with 0.5 ml of citrate methylene violet and examined microscopically after 5 min.
284 BREWING YEAST FERMENTATION PERFORMANCE
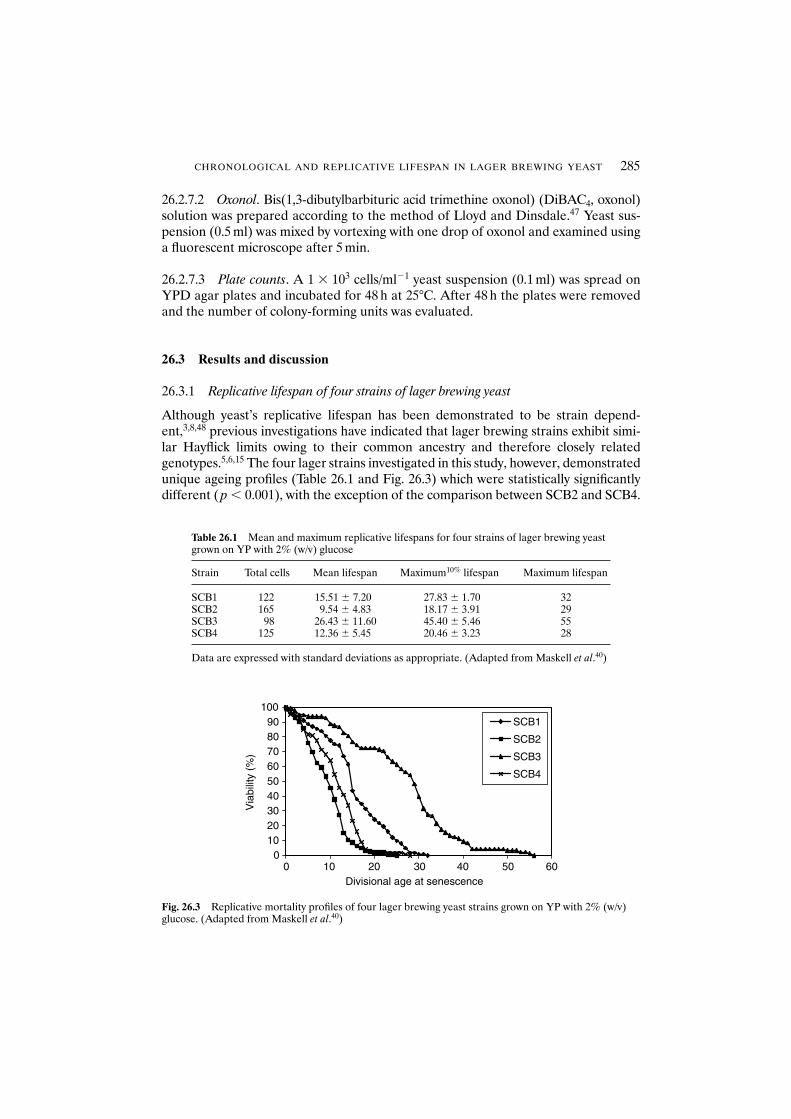
26.2.7.2 Oxonol. Bis(1,3-dibutylbarbituric acid trimethine oxonol) (DiBAC4, oxonol)solution was prepared according to the method of Lloyd and Dinsdale.47 Yeast sus-pension (0.5 ml) was mixed by vortexing with one drop of oxonol and examined usinga fluorescent microscope after 5 min.
26.2.7.3 Plate counts. A 1 � 103 cells/ml�1 yeast suspension (0.1 ml) was spread onYPD agar plates and incubated for 48 h at 25°C. After 48 h the plates were removedand the number of colony-forming units was evaluated.
26.3 Results and discussion
26.3.1 Replicative lifespan of four strains of lager brewing yeast
Although yeast’s replicative lifespan has been demonstrated to be strain depend-ent,3,8,48 previous investigations have indicated that lager brewing strains exhibit simi-lar Hayflick limits owing to their common ancestry and therefore closely relatedgenotypes.5,6,15 The four lager strains investigated in this study, however, demonstratedunique ageing profiles (Table 26.1 and Fig. 26.3) which were statistically significantlydifferent ( p � 0.001), with the exception of the comparison between SCB2 and SCB4.
CHRONOLOGICAL AND REPLICATIVE LIFESPAN IN LAGER BREWING YEAST 285
Table 26.1 Mean and maximum replicative lifespans for four strains of lager brewing yeastgrown on YP with 2% (w/v) glucose
Strain Total cells Mean lifespan Maximum10% lifespan Maximum lifespan
SCB1 122 15.51 � 7.20 27.83 � 1.70 32SCB2 165 9.54 � 4.83 18.17 � 3.91 29SCB3 98 26.43 � 11.60 45.40 � 5.46 55SCB4 125 12.36 � 5.45 20.46 � 3.23 28
Data are expressed with standard deviations as appropriate. (Adapted from Maskell et al.40)
00
10
10
20
20
30
30
40
40
50
50
60
60
708090
100
Divisional age at senescence
Via
bilit
y (%
)
SCB1
SCB2
SCB3
SCB4
Fig. 26.3 Replicative mortality profiles of four lager brewing yeast strains grown on YP with 2% (w/v)glucose. (Adapted from Maskell et al.40)
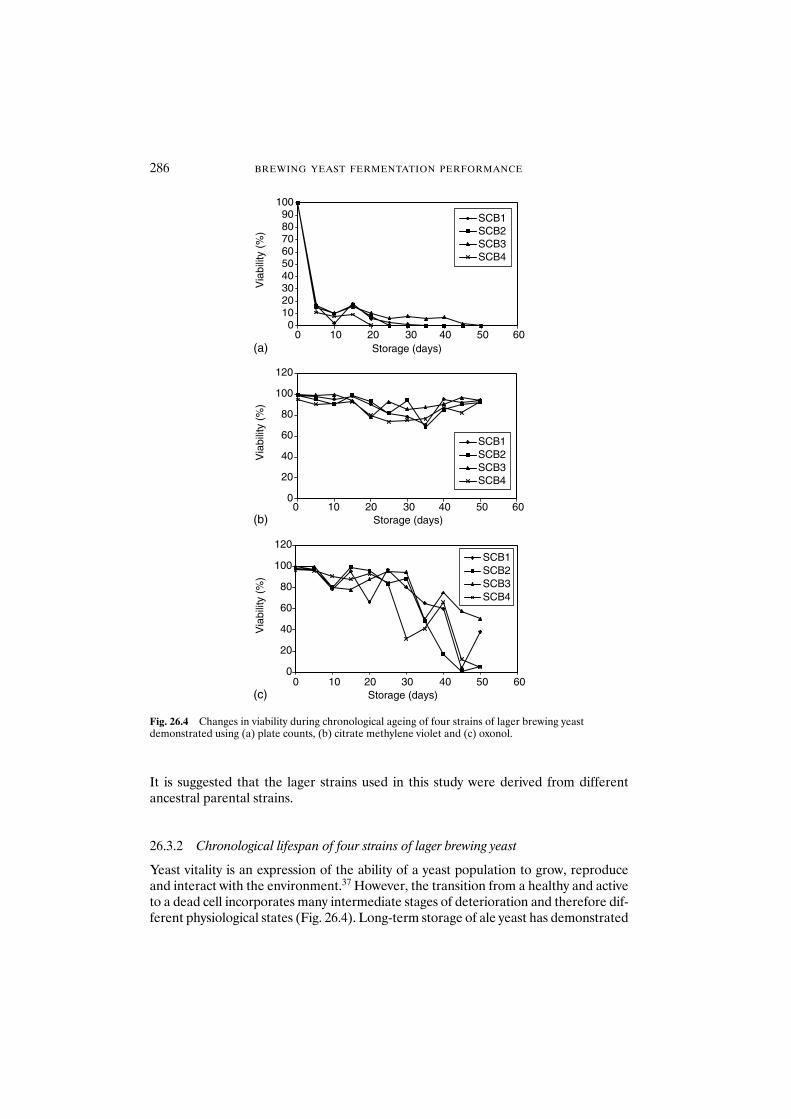
It is suggested that the lager strains used in this study were derived from differentancestral parental strains.
26.3.2 Chronological lifespan of four strains of lager brewing yeast
Yeast vitality is an expression of the ability of a yeast population to grow, reproduceand interact with the environment.37 However, the transition from a healthy and activeto a dead cell incorporates many intermediate stages of deterioration and therefore dif-ferent physiological states (Fig. 26.4). Long-term storage of ale yeast has demonstrated
286 BREWING YEAST FERMENTATION PERFORMANCE
00
10
10
20
20
30
30
40
40
50
50
60
60
0 10 20 30 40 50 60
708090
100
Storage (days)
Storage (days)
Via
bilit
y (%
)
SCB1SCB2SCB3SCB4
0
20
40
60
80
100
120
Via
bilit
y (%
)
SCB1SCB2SCB3SCB4
(a)
(b)
(c)
00
20
2010 30 40 50 60
40
60
80
100
120
Storage (days)
Via
bilit
y (%
)
SCB1SCB2SCB3SCB4
Fig. 26.4 Changes in viability during chronological ageing of four strains of lager brewing yeast demonstrated using (a) plate counts, (b) citrate methylene violet and (c) oxonol.
the transition through several distinct physiological states before cell death. Initiallyreversible physiological deterioration of the cell occurs, including the utilisation ofintracellular49 and cell-wall carbohydrates.22,50–52 Prolonged starvation results in irre-versible modifications to phenotype that may be lethal or result in the formation of apermanent phenotypic alteration in the cell population.51 In the event that no nutrientsare provided at this stage of deterioration, the cell enters a state known as ‘viable butnon-culturable’,22 from which it cannot re-enter the cell cycle even when supplied withnutrients. Viable but non-culturable phenotypes can only be identified by monitoringviability using both plate counts and intracellular dye reduction assays.53 Where a dis-crepancy between low plate counts and high viabilities using dye reduction stains isapparent, a permanent loss of replicative capacity but not cell activity can be con-firmed. In the brewing context, such cells would contribute little to biomass productionon pitching into wort, but would exhibit some form of metabolic activity. This state ofsenescence leads to cell death, as characterised by a loss of membrane integrity andintracellular dye reduction.
Previous chronological ageing studies using haploid strains used either platecounts1,17,19,20 or the LIVE/DEATH test (FUN1)21 (Molecular Probes, OR, USA)and have not considered the senescence states and their duration.
In this study, the occurrence of the chronological senescence state was consideredusing three determinants of life potential: the citrate methylene violet assay,46 whichdetermines viability through the reduction of the dye by metabolically active cells; theoxonol exclusion assay,47 which determines viability as a function of membraneintegrity; and plate counts which demonstrate the replicative capacity of cells within apopulation.
Independent of strain, replicative capacity was reduced by up to 90% during the first 5 days of chronological ageing. This reduced level of replicative capacity was maintained for between 10 and 35 days depending on the strain assessed, and thendeclined until no replicative capacity remained (Fig. 26.4a). However, cellularreduction capacity (Fig. 26.4b) and membrane integrity (Fig. 26.4c) did not initially cor-relate with replicative capacity (they were statistically significantly different, p � 0.05),indicating the generation of viable but non-culturable or senescent populations.
During the latter stages of the prolonged stationary phase, senescent populationsappeared to demonstrate a loss of membrane integrity before a loss of intracellularreducing power. This observation is consistent with the hypothesis that dying cellsexhibit residual reducing power owing to the retained activity of cellular enzymes. It isthus postulated that bright-field reductive stains overestimate viability.
26.3.3 Is there a correlation between replicative and chronological lifespan?
Chronological ageing has previously been suggested as a suitable alternative toreplicative ageing studies when studying macromolecular damage such as oxidativestress,1,17–21 yet no quantitative comparison between chronological and replicativelongevity has been previously reported.
The strains for which replicative and chronological lifespan data have been published(Table 26.2) were compared using Pearson’s correlation coefficient; however, no correlation was apparent (r � �0.36).
CHRONOLOGICAL AND REPLICATIVE LIFESPAN IN LAGER BREWING YEAST 287
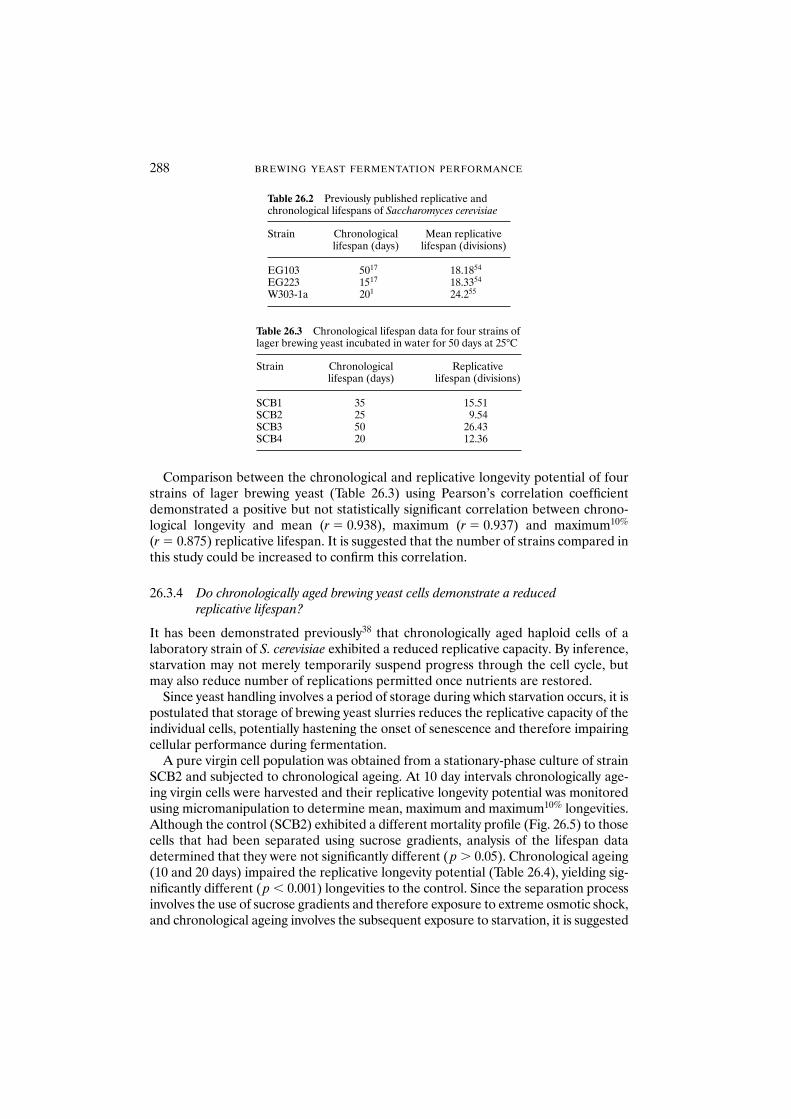
Comparison between the chronological and replicative longevity potential of fourstrains of lager brewing yeast (Table 26.3) using Pearson’s correlation coefficientdemonstrated a positive but not statistically significant correlation between chrono-logical longevity and mean (r � 0.938), maximum (r � 0.937) and maximum10%
(r � 0.875) replicative lifespan. It is suggested that the number of strains compared inthis study could be increased to confirm this correlation.
26.3.4 Do chronologically aged brewing yeast cells demonstrate a reduced replicative lifespan?
It has been demonstrated previously38 that chronologically aged haploid cells of a laboratory strain of S. cerevisiae exhibited a reduced replicative capacity. By inference,starvation may not merely temporarily suspend progress through the cell cycle, butmay also reduce number of replications permitted once nutrients are restored.
Since yeast handling involves a period of storage during which starvation occurs, it ispostulated that storage of brewing yeast slurries reduces the replicative capacity of theindividual cells, potentially hastening the onset of senescence and therefore impairingcellular performance during fermentation.
A pure virgin cell population was obtained from a stationary-phase culture of strainSCB2 and subjected to chronological ageing. At 10 day intervals chronologically age-ing virgin cells were harvested and their replicative longevity potential was monitoredusing micromanipulation to determine mean, maximum and maximum10% longevities.Although the control (SCB2) exhibited a different mortality profile (Fig. 26.5) to thosecells that had been separated using sucrose gradients, analysis of the lifespan datadetermined that they were not significantly different ( p � 0.05). Chronological ageing(10 and 20 days) impaired the replicative longevity potential (Table 26.4), yielding sig-nificantly different ( p � 0.001) longevities to the control. Since the separation processinvolves the use of sucrose gradients and therefore exposure to extreme osmotic shock,and chronological ageing involves the subsequent exposure to starvation, it is suggested
288 BREWING YEAST FERMENTATION PERFORMANCE
Table 26.2 Previously published replicative andchronological lifespans of Saccharomyces cerevisiae
Strain Chronological Mean replicative lifespan (days) lifespan (divisions)
EG103 5017 18.1854
EG223 1517 18.3354
W303-1a 201 24.255
Table 26.3 Chronological lifespan data for four strains oflager brewing yeast incubated in water for 50 days at 25°C
Strain Chronological Replicative lifespan (days) lifespan (divisions)
SCB1 35 15.51SCB2 25 9.54SCB3 50 26.43SCB4 20 12.36
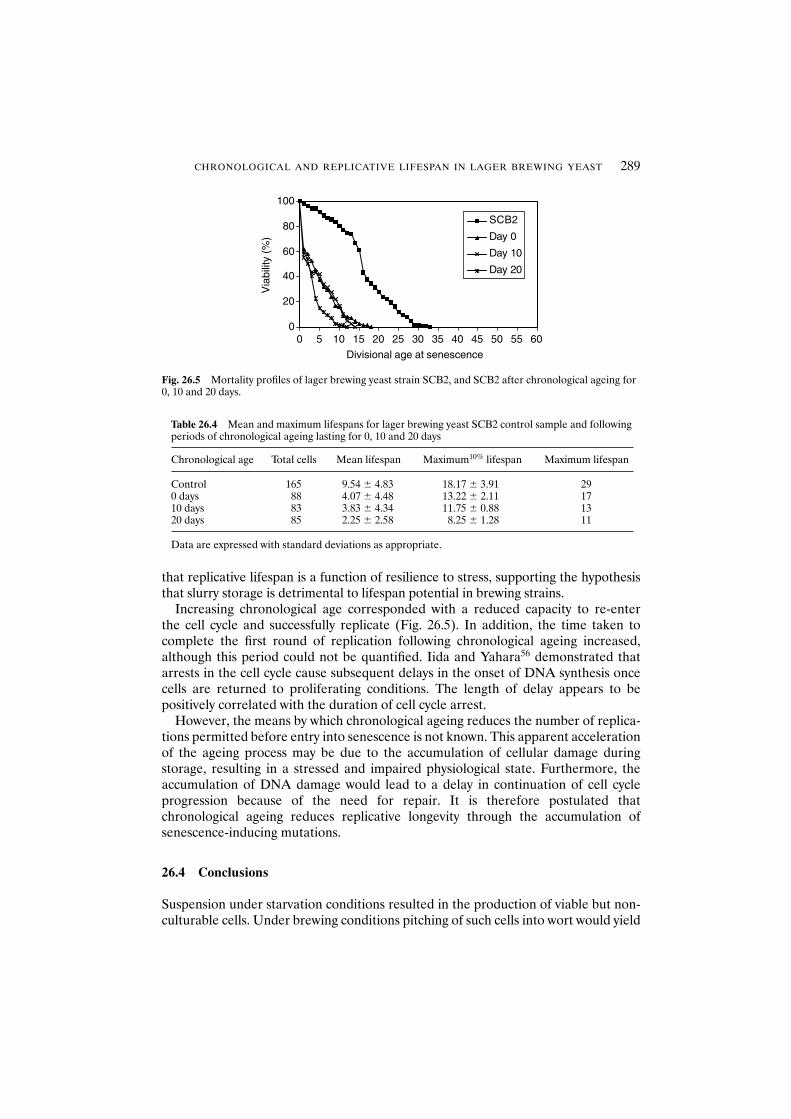
that replicative lifespan is a function of resilience to stress, supporting the hypothesisthat slurry storage is detrimental to lifespan potential in brewing strains.
Increasing chronological age corresponded with a reduced capacity to re-enter the cell cycle and successfully replicate (Fig. 26.5). In addition, the time taken to complete the first round of replication following chronological ageing increased,although this period could not be quantified. Iida and Yahara56 demonstrated thatarrests in the cell cycle cause subsequent delays in the onset of DNA synthesis oncecells are returned to proliferating conditions. The length of delay appears to bepositively correlated with the duration of cell cycle arrest.
However, the means by which chronological ageing reduces the number of replica-tions permitted before entry into senescence is not known. This apparent accelerationof the ageing process may be due to the accumulation of cellular damage duringstorage, resulting in a stressed and impaired physiological state. Furthermore, theaccumulation of DNA damage would lead to a delay in continuation of cell cycleprogression because of the need for repair. It is therefore postulated that chronological ageing reduces replicative longevity through the accumulation of senescence-inducing mutations.
26.4 Conclusions
Suspension under starvation conditions resulted in the production of viable but non-culturable cells. Under brewing conditions pitching of such cells into wort would yield
CHRONOLOGICAL AND REPLICATIVE LIFESPAN IN LAGER BREWING YEAST 289
0
20
40
60
80
100
0 5 10 15 20 25 30 35 40 45 50 55 60
Divisional age at senescence
Via
bilit
y (%
)
SCB2
Day 0
Day 10
Day 20
Fig. 26.5 Mortality profiles of lager brewing yeast strain SCB2, and SCB2 after chronological ageing for0, 10 and 20 days.
Table 26.4 Mean and maximum lifespans for lager brewing yeast SCB2 control sample and followingperiods of chronological ageing lasting for 0, 10 and 20 days
Chronological age Total cells Mean lifespan Maximum10% lifespan Maximum lifespan
Control 165 9.54 � 4.83 18.17 � 3.91 290 days 88 4.07 � 4.48 13.22 � 2.11 1710 days 83 3.83 � 4.34 11.75 � 0.88 1320 days 85 2.25 � 2.58 8.25 � 1.28 11
Data are expressed with standard deviations as appropriate.
little biomass, but would contribute some form of metabolic activity. Any subsequentfermentation may display aberrant fermentation and flavour profiles owing to perman-ent alterations in metabolic activity.14 It is suggested that it is this residual metaboliccapacity that causes populations to appear viable when their fitness to ferment may besignificantly impaired. This, in turn, may result in the overestimation of viability whenbright-field staining techniques are applied.
Starvation encountered during slurry storage may reduce the replicative potential ofthe slurry. If the population is already replicatively aged as a result of the croppingtechniques used,22,42 further ‘accelerated ageing’ initiated by passage through thestationary phase, as suggested by Ashrafi et al.38 and this study, may produce an agedpopulation of yeast for subsequent fermentations. Since replicatively aged populationshave previously been observed to exhibit aberrant fermentation profiles and finalflavour characteristics,41,42 the importance of this observation cannot be over-estimated. Slurries exhibiting replicative and chronological ageing may also lacktolerance to further stresses encountered during the brewing process, such as acidwashing and high-gravity brewing. The impact of such stressful environments on agedcells remains the subject of further investigation.
Acknowledgements
Dawn Maskell is funded by the J&J Morison Scholarship and the authors would like tothank Mrs Pamela Morison-Inches for her support. Katherine Smart is the ScottishCourage Reader in Brewing Science and gratefully acknowledges the support ofScottish Courage Brewing Ltd. Katherine Smart is a Royal Society Industrial Fellowand is grateful to the Royal Society for supporting her fellowship. The authors are alsograteful to the Directors of Scottish Courage Brewing Ltd for permission to publishthis work.
References
1. Maclean, M., Harris, N. and Piper, P. (2001) Chronological lifespan of stationary phase yeast cells; amodel for investigating the factors that might influence the ageing of post mitotic tissues in higherorganisms. Yeast 18, 499–509.
2. Jazwinski, S.M. (1990) Ageing and senescence of the budding yeast Saccharomyces cerevisiae. Mol.Microbiol. 4, 337–343.
3. Austriaco, N.R. (1996) Review: to bud until death: the genetics of ageing in the yeast Saccharomyces.Yeast 12, 623–630.
4. Barker, M.G. and Smart, K.A. (1996) Morphological changes associated with the cellular ageing of abrewing yeast strain. J. Am. Soc. Brew. Chem. 54, 121–126.
5. Powell, C.D., Van Zandyke, S.M., Quain, D.E. and Smart, K.A. (2000) Replicative ageing and senes-cence in Saccharomyces cerevisiae and the impact on brewing fermentations. Microbiology 146,1023–1034.
6. Powell, C.D., Quain, D.E. and Smart, K.A. (2000) The impact of media composition and petite muta-tion on the longevity of a polyploid brewing yeast strain. Lett. Appl. Microbiol. 31, 46–51.
7. Mortimer, R.K. and Johnston, J.R. (1959) Lifespan of individual yeast cells. Nature 183, 1757–1759.8. Egilmez, N.K. and Jazwinski, S.M. (1989) Evidence for the involvement of a cytoplasmic factor in the
aging of the yeast Saccharomyces cerevisiae. J. Bacteriol. 171, 37–42.9. Barker, M.G., Brimmage, L.J.E. and Smart, K.A. (1999) Effect of Cu,Zn superoxide dismutase disrup-
tion mutation on ageing in Saccharomyces cerevisiae. FEMS Lett. 177, 199–204.
290 BREWING YEAST FERMENTATION PERFORMANCE
10. Barton, A.A. (1950) Some aspects of cell division in Saccharomyces cerevisiae. J. Gen. Microbiol. 4, 84–86.11. Bartholomew, J.W. and Mittwer, T. (1953) Demonstration of yeast bud scars with the electron micro-
scope. J. Bacteriol. 65, 272–275.12. Egilmez, N.K., Chen, J.B. and Jazwinski, S.M. (1990) Preparation and partial characterisation of old
yeast cells. J. Gerontol. 45, B9–B17.13. Johnson, B.F. and Lu, C. (1975) Morphometric analysis of yeast cells IV. Increase of the cylindrical
diameter of Schizzosaccharomyces pombe during the cell cycle. Exp. Cell Res. 95, 154–158.14. Smart, K.A. (1999) Ageing in brewing yeast. Brew. Guardian 132(2), 19–24.15. Powell, C.D. (2001) The impact of yeast cell age on brewing fermentation performance. Thesis, Oxford
Brookes University, Oxford.16. Muller, I. (1971) Experiments on ageing in single cells of Saccharomyces cerevisiae. Antonie Van
Leeuwenhoek 51, 1–10.17. Longo, V.D., Gralla, E.B. and Valentine, J.S. (1996) Superoxide dismutase activity is essential for
stationary phase survival in S. cerevisiae: mitochrondrial production of toxic oxygen species in vivo. J. Biol. Chem. 271, 12275–12280.
18. Longo, V.D., Ellerby, L.M., Bredesen, D.E. et al. (1997) Human Bcl-2 reverses survival defects in yeastlacking superoxide dismutase and delays death of wild-type yeast. J. Cell Biol. 137, 1581–1588.
19. Longo, V.D., Liou, L.L., Valentine, J.S. and Gralla, E.B. (1999) Mitochrondrial superoxide decreasesyeast survival in stationary phase. Arch. Biochem. 365, 131–142.
20. Longo, V.D. (1999) Mutations in signal transduction proteins increase stress resistance and longevityin yeast, nematodes, fruit flies, and mammalian neuronal cells. Neurobiol. Aging 20, 479–486.
21. Jakubowski, W., Bilinski, T. and Bartosz, G. (2000) Oxidative stress during aging of stationary phasecultures of the yeast Saccharomyces cerevisiae. Free Rad. Biol. Med. 28, 659–661.
22. Smart, K.A. (2001) Management of yeast stress. Proc. Cong. Eur. Brew. Conv., Budapest.23. de Winde, J.E., Thevelein, J.M. and Winderickx, J. (1997) From feast to famine: adaptation to nutrient
depletion in yeast. In: Yeast Stress Responses, Hohman, S. and Mager, W.H. (eds). R.G. Landes, Austin,TX, pp. 7–74.
24. Hartwell, L.H. (1974) Saccharomyces cell cycle. Bacteriol. Rev. 38, 164–198.25. Hartwell, L.H., Culotti, J., Pringle, J.R and Reid, B.J. (1974) Genetic control of the cell division cycle
in yeast. Science 183, 46–51.26. Werner-Washburne, M., Braun, E., Johnston, G.C. and Singer, R.A. (1993) Stationary phase in the
yeast Saccharomyces cerevisiae. Microbiol. Rev. 57, 383–401.27. Wie, W., Nurse, P. and Broek, D. (1993) Yeast cells can enter a quiescent state through G1, S, G2 or M
phase of the cell cycle. Cancer Res. 53, 1867–1870.28. Fosburg, S.L. (1994) Cell cycle – in and out of the cell cycle. Curr. Biol. 4, 828.29. Nurse, P. (1997) Cell reproduction. BMJ, 295, 1037–1038.30. Becker, J.U., Vohmann, H.J. and Eiler-Konig, C. (1979) Glycogen metabolism in resting and growing
cells of Saccharomyces cerevisiae. Arch. Microbiol. 123, 143–149.31. Pringle, J.R. and Hartwell, L.H. (1981) The Saccharomyces cerevisiae cell cycle. In: The Molecular
Biology of the Yeast Saccharomyces Cerevisiae, Life Cycle and Inheritance, Strathern, J.N., Jones, E.W.and Broach, J.R. (eds). Cold Spring Harbor Laboratory Press, Cold Spring Harbor, NY, pp. 91–142.
32. McCaig, R. and Bendiak, D.S. (1985) Yeast handling studies. 1. Agitation of stored pitching yeast. J. Am. Soc. Brew. Chem. 43, 114–118.
33. Wheals, A.E. (1987) Biology of the cell cycle in yeasts. In: The Yeasts, Vol. 1, 2nd edn. Rose, A.H. andHarrison, J.S. (eds). Academic Press, London.
34. Stewart, G.G. and Russell, I. (1993) Fermentation – ‘the black box’ of the brewing process. Tech. Q.Master Brew. Assoc. Am. 30, 159–168.
35. Fuge, E.K., Braun, E.L. and Werner-Washburne, M. (1994) Protein synthesis in long term stationaryphase cultures of Saccharomyces cerevisiae. J. Bacteriol. 176, 5802–5813.
36. Granot, D. and Snyder, M. (1993) Carbon source induces growth of stationary phase cells, independ-ent of carbon source metabolism. Yeast 9, 465–479.
37. Lillie, S.H. and Pringle, J.R. (1980) Reserve carbohydrate metabolism in Saccharomyces cerevisiae:responses to nutrient limitations. J. Bacteriol. 143, 1384–1394.
38. Ashrafi, K., Sinclair, D., Gordon, J.T. and Guarente, L. (1999) Passage through stationary phaseadvances replicative ageing in Saccharomyces cerevisiae. Proc. Natl Acad. Sci. U.S.A. 96, 9100–9105.
39. Vaughan Martini, A. and Martini, A. (1993) A taxonomic key for the genus Saccharomyces. System.Appl. Microbiol. 16, 113–119.
40. Maskell, D.L., Kennedy, A.I., Hodgson, J.A. and Smart, K.A. (2001) Impact of carbohydrate compos-ition of media on lager yeast replicative lifespan. J. Am. Soc. Brew. Chem. 59, 111–116.
41. Rodgers, D.L., Kennedy, A.I., Hodgson, J.A. and Smart, K.A. (1999) Lager brewing yeast ageing andstress tolerance. Proc. Cong. Eur. Brew. Conv. 27, 671–678.
CHRONOLOGICAL AND REPLICATIVE LIFESPAN IN LAGER BREWING YEAST 291
42. Rodgers, D.L., Kennedy, A.I., Hodgson, J.A. and Smart, K.A. (2000) The influence of media composi-tion on replicative lifespan in lager brewing yeast. In: Brewing Yeast Fermentation Performance, Smart, K.(ed.). Blackwell Science, Oxford, pp. 119–126.
43. Smart, K.A. and Whisker, S. (1996) Effect of serial repitching on the fermentation properties and con-dition of brewing yeast. J. Am. Soc. Brew. Chem. 54, 41–44.
44. Quain. D.E., Powell, C.D., Hamilton, A. et al. (2001) Proc. Cong. Eur. Brew. Conv., Budapest. 45. Deans, K., Pinder, A., Catley, B. and Hodgson, J.A. (1997) Effects of cone cropping and serial repitch
on the distribution of cell age on brewery yeast. Proc. Eur. Brew. Conv. Cong. 26, 469–476.46. Smart, K.A., Chambers, K.M., Lambert, I. et al. (1999) Use of methylene violet staining procedures to
determine yeast viability and vitality. J. Am. Soc. Brew. Chem. 57, 18–23.47. Lloyd, D. and Dinsdale, G. (2000) From brightfield to fluorescence and confocal microscopy.
In: Brewing Yeast Fermentation Performance, Smart, K.A. (ed.). Blackwell Science, Oxford, pp. 3–9.48. Muller, I., Zimmermann, M., Becker, D. and Flomer, M. (1980) Calendar lifespan versus budding life-
span of Saccharomyces cerevisiae. Mech. Age. Dev. 12, 47–52.49. Smart, K.A. (1996) Nutritional requirement and performance of brewing yeast. Eur. Brew. Conv.
Monograph XXIV, pp. 146–157.50. Smart, K.A., Boulton, C.A., Hinchcliffe, E. and Molzahn, S. (1995) Effect of physiological stress on the
surface properties of brewing yeasts. J. Am. Soc. Brew. Chem. 53, 33–38.51. Rhymes, M.R. and Smart, K.A. (1996) Effect of starvation on the flocculation of ale and lager brewing
yeast. J. Am. Soc. Brew. Chem. 54, 50–56.52. Rhymes, M.R. and Smart, K.A. (2001) Effect of storage conditions on the flocculation and cell wall
characteristics of an ale brewing yeast strain. J. Am. Soc. Brew. Chem. 59, 32–38.53. Smart, K.A. (2001) Biomarkers of yeast fermentation performance. Proc. Inst. Guild Brew., Africa Sect.54. Van Zandyke, S.M. (2001) The role of catalase and glutathione on replicative lifespan in Saccharomyces
cerevisiae. Thesis, Oxford Brookes University, Oxford.55. Sinclair D.A. and Guarente, L. (1997) Extrachromosomal rDNA circles – a cause of ageing in yeast.
Cell 91, 1033–1042.56. Iida, H. and Yahara, I. (1984). Specific early-G1 blocks accompanied with stringent response in
Saccharomyces cerevisiae lead to growth arrest in resting state similar to the G0 of higher eukaryotes. J. Cell Biol. 98, 1185–1193.
292 BREWING YEAST FERMENTATION PERFORMANCE
27 Continuous Primary Fermentation of Beer withImmobilised Yeast
K. TAPANI, P. SOININEN-TENGVALL, H. BERG, B. RANTA andE. PAJUNEN
Abstract Immobilised yeast technology has been successfully used in the brewingindustry for lager beer maturation and alcohol-free beer production. The processes ofbeer maturation and alcohol-free beer production, however, are quite simple comparedwith continuous primary fermentation of beer. In the 1960s and 1970s there was greatenthusiasm for continuous fermentation. Most of the systems failed one after another withmajor problems. A novel continuous beer fermentation process has been developed basedon yeast immobilisation on woodchips. The system includes a one-stage yeast reactor foranaerobic alcohol fermentation and a beer circulation loop. The process has been testedwith both stout and lager beer fermentation. The production time is 20–30 h. According tothe pilot-scale results, the system is technically and economically feasible. Carbon dioxideand temperature control is available. Good-quality beer and constant flavour formationwere achieved without a specific yeast growth phase.
27.1 Introduction
Although there are no industrial-scale applications using immobilised yeast for primaryfermentation, the immobilised technology has been successfully used industriallysince around 1990 for lager beer maturation1,2 and for alcohol-free beer production3
in several breweries. These processes are performed in a single stage and accom-plished within a couple of hours. Because of the limited yeast growth and fermentation,there are no problems with either flavour formation, carbon dioxide evolution or heatproduction. The basic aim of beer maturation is to reduce the diacetyl and diacetylprecursors present in green beer. In addition, fermenting alcohol-free beer, where themain object is to reduce aldehydes, generated by yeast enzymes and responsible forthe worty flavour, without producing alcohol, is technically simple and resembles mat-uration of beer. In these applications normal production yeast strain is used andimmobilised on a fixed bed of solid carrier material in a column reactor. Several typesof carrier material have been used. These are diethylaminoethyl (DEAE) cellulose,glass beads and woodchips.
Continuous primary fermentation, however, is more complicated than the matur-ation and alcohol-free beer processes, owing to the complication of fermentationitself. The major problems to be expected in continuous primary fermentation arethose associated with carbon dioxide evolution and heat formation, as well as flavourformation and flavour control. Carbon dioxide evolution and heat formation create amultiple problem leading to reduced fermentation activity and yeast viability, respect-ively.4 Several continuous beer fermentation systems5 were tested during the 1960sand 1970s. Most of the systems failed one after another, with major problems being
Brewing Yeast Fermentation Performance: Second edition
Edited by: KATHERINE SMART Copyright 0 Blackwell Science 2003
hygiene, yeast contamination, yeast mutations, failure to control flavour formationand inflexibility of the systems in terms of both volumes and product changes. Onlyone system has survived until today, the Coutts’ process, which is in operation atDominion Breweries Ltd in New Zealand.
A new novel continuous beer fermentation process has been developed based onyeast immobilisation on woodchips.6 The basic aim has been to reach a real steadystate in fermentation, imitating the phase which corresponds to the late stage in trad-itional primary fermentation. At this stage, the specific fermentation rate and flavourcompound formation are fairly constant. One of the major savings7 is related toreduced yeast growth, which improves raw material utilisation as well as giving lowerbeer loses and reducing yeast treatment. Further advantages are obtained through highvolumetric productivity, low cleaning costs and reduced equipment volume.
The process described above has been tested on a pilot scale. This article will focuson experiments on lager beer fermentation with different temperatures and wortcompositions.
27.2 Materials and methods
27.2.1 Yeast and wort
An industrial lager brewing strain and normal production high-gravity wort were usedin this study. One experiment was carried out with low malt wort, which was made bymixing brewing syrup with normal wort.
27.2.2 Carrier
Aspen chips (1 � 1 � 2 mm), a commercial, heat-treated product, were used as a carriermaterial for the yeast cells. Before yeast pitching the chips were washed with causticsoda and rinsed with water to remove the woody taste and wet the chips.
27.2.3 Pilot plant unit
The pilot plant comprised the following key units: immobilised yeast reactor, wort tanks,wort pasteuriser, wort filter, carbon dioxide-removal unit, beer buffer tank, plate heatexchanger, yeast propagator and cleaning in place (CIP) tank. The bed volume of theimmobilised reactor was 1000 litres, with feed and output of 50 hl/h. The pilot unit wasinstalled in a brewery environment to guarantee a steady supply of wort.
27.2.4 Start-up procedures
The reactor was pitched with yeast slurry from a brewery yeast storage tank. The yeastslurry was pumped through the reactor for proper immobilisation. The circulationloop was filled with oxygen-saturated wort and the initial circulation, without any newfeed, was started and continued until the gravity came close to the final attenuation.During the start-up all yeast was immobilised or trapped, the total number being
294 BREWING YEAST FERMENTATION PERFORMANCE
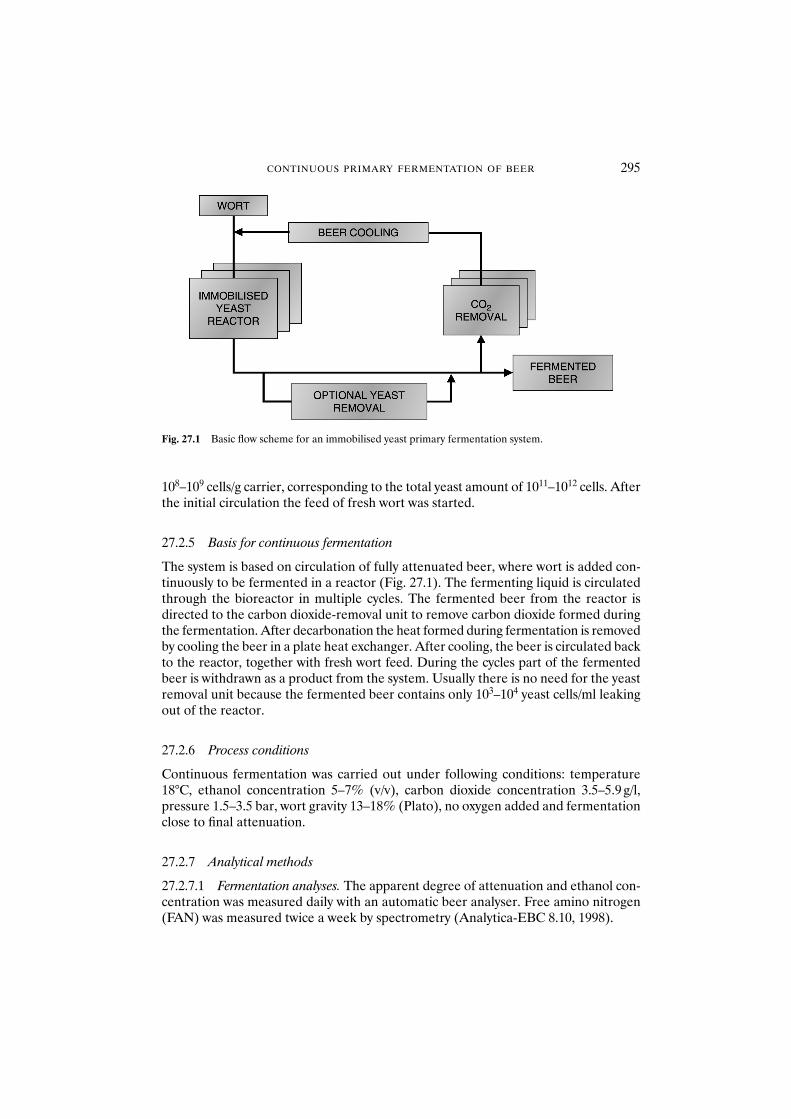
108–109 cells/g carrier, corresponding to the total yeast amount of 1011–1012 cells. Afterthe initial circulation the feed of fresh wort was started.
27.2.5 Basis for continuous fermentation
The system is based on circulation of fully attenuated beer, where wort is added con-tinuously to be fermented in a reactor (Fig. 27.1). The fermenting liquid is circulatedthrough the bioreactor in multiple cycles. The fermented beer from the reactor isdirected to the carbon dioxide-removal unit to remove carbon dioxide formed duringthe fermentation. After decarbonation the heat formed during fermentation is removedby cooling the beer in a plate heat exchanger. After cooling, the beer is circulated backto the reactor, together with fresh wort feed. During the cycles part of the fermentedbeer is withdrawn as a product from the system. Usually there is no need for the yeastremoval unit because the fermented beer contains only 103–104 yeast cells/ml leakingout of the reactor.
27.2.6 Process conditions
Continuous fermentation was carried out under following conditions: temperature18°C, ethanol concentration 5–7% (v/v), carbon dioxide concentration 3.5–5.9 g/l,pressure 1.5–3.5 bar, wort gravity 13–18% (Plato), no oxygen added and fermentationclose to final attenuation.
27.2.7 Analytical methods
27.2.7.1 Fermentation analyses. The apparent degree of attenuation and ethanol con-centration was measured daily with an automatic beer analyser. Free amino nitrogen(FAN) was measured twice a week by spectrometry (Analytica-EBC 8.10, 1998).
CONTINUOUS PRIMARY FERMENTATION OF BEER 295
Fig. 27.1 Basic flow scheme for an immobilised yeast primary fermentation system.
27.2.7.2 Flavour compounds and vicinal diketones. The flavour compounds (acetal-dehyde, dimethylsulfide, ethyl acetate, isobutyl acetate, propanol, 2-methyl propanol, 3-methyl butyl acetate, butanol, 3-methyl butyl alcohol, ethyl hexanoate, hexyl acetateand ethyl octanoate) and vicinal diketones (VDKs) in green beer were analysed twicea week by head space gas chromatography (HP 6890) with mass selective detection(HP 5973) and with �ECD detection, respectively.
27.2.7.3 Fermentable sugars. Fermentable sugars (glucose, fructose, maltose andmaltotriose) were measured twice a week by Dionex ion-exchange chromatography(ED40) with electrochemical detection.
27.2.7.4 Microbiological analysis. Microbiology was controlled on a weekly basis dur-ing the runs. Aerobic and anaerobic bacteria from outflowing beer were determined onUniversal Beer Agar (Difco) for 3–5 days at 27°C and 7 days at 30°C, respectively.Wild yeast was monitored with yeast and mould agar (Difco) for 3 days at 27°C. Thecell count (by haemocytometry or by Coulter counter) and viability (by methylene bluestaining) of yeast in the outflowing beer were measured weekly.
27.3 Results and discussion
27.3.1 Fermentation
In general, the fermentations proceeded well on a pilot scale. The average fermentationtime varied between 20 and 30 h depending on the fermentation conditions and yeaststrain.
The effects of temperature on fermentation activity were studied at 16, 18 and 20°C.An average extract consumption and alcohol formation in a single pass in the reactorwith different temperatures are shown in Fig. 27.2. For the lager yeast strain tested18°C seemed to be the optimum fermentation temperature under these conditions.The average extract consumption and alcohol formation in a single pass were 0.13%(Plato) and 0.07% (v/v) higher at 18 than at 16°C. In addition, increased carbon diox-ide formation was noticed when the temperature was increased from 16 to 18°C.There were no significant differences between 18 and 20°C.
Figure 27.3 shows that the fermentation was quite constant even over a 7 week runin given conditions. The average apparent extract and ethanol content in the reactoroutlet were 4.3% (Plato) and 6.9% (v/v), respectively. During the fermentation all ofthe fermentable carbohydrates were consumed, although there was a tendency toaccumulate maltose and maltotriose after the 5 week run, owing to the wort feed rateto the system being too high (Figs 27.3 and 27.4). When the wort feed rate was reduced,the consumption of maltose and maltotriose was increased.
27.3.2 Flavour formation
One of the most innovative features of the novel continuous beer fermentation withimmobilised yeast was to abandon the yeast growth phase, despite flavour formation
296 BREWING YEAST FERMENTATION PERFORMANCE
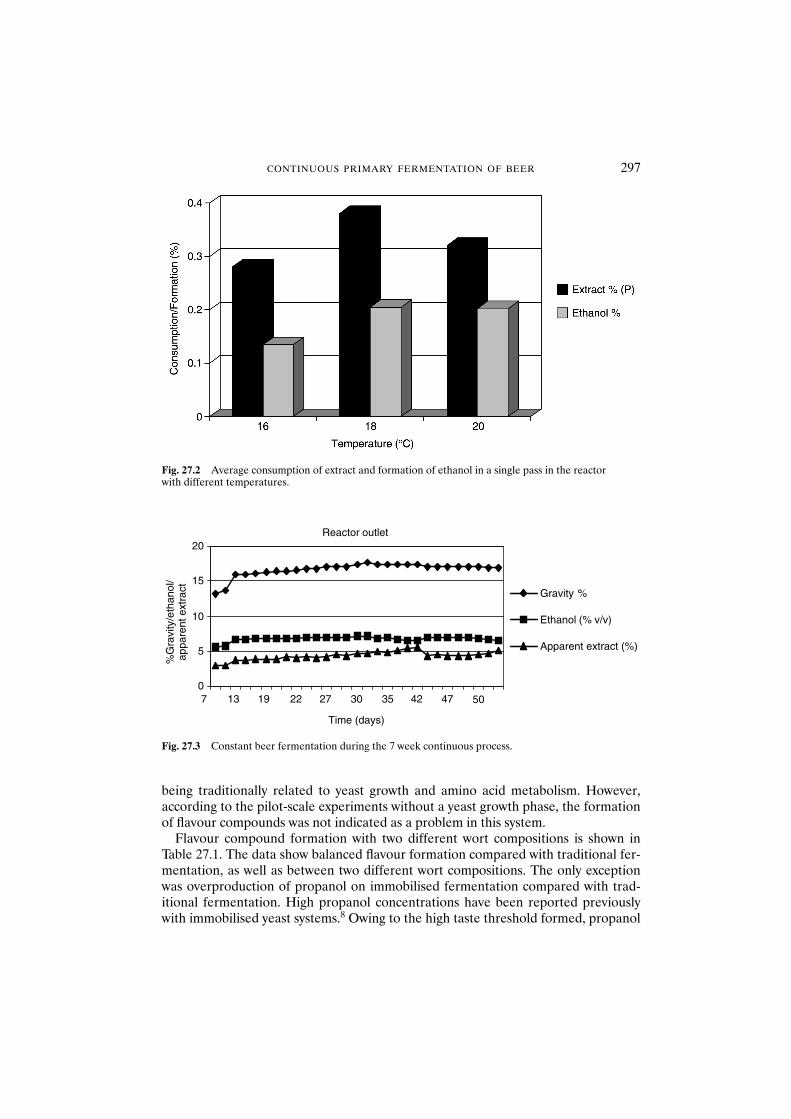
being traditionally related to yeast growth and amino acid metabolism. However,according to the pilot-scale experiments without a yeast growth phase, the formationof flavour compounds was not indicated as a problem in this system.
Flavour compound formation with two different wort compositions is shown inTable 27.1. The data show balanced flavour formation compared with traditional fer-mentation, as well as between two different wort compositions. The only exceptionwas overproduction of propanol on immobilised fermentation compared with trad-itional fermentation. High propanol concentrations have been reported previouslywith immobilised yeast systems.8 Owing to the high taste threshold formed, propanol
CONTINUOUS PRIMARY FERMENTATION OF BEER 297
Fig. 27.2 Average consumption of extract and formation of ethanol in a single pass in the reactor with different temperatures.
Reactor outlet
0
5
10
15
20
7 13 19 22 27 30 35 42 47 50
Time (days)
Gravity %
Ethanol (% v/v)
Apparent extract (%)
%G
ravi
ty/e
than
ol/
appa
rent
ext
ract
Fig. 27.3 Constant beer fermentation during the 7 week continuous process.
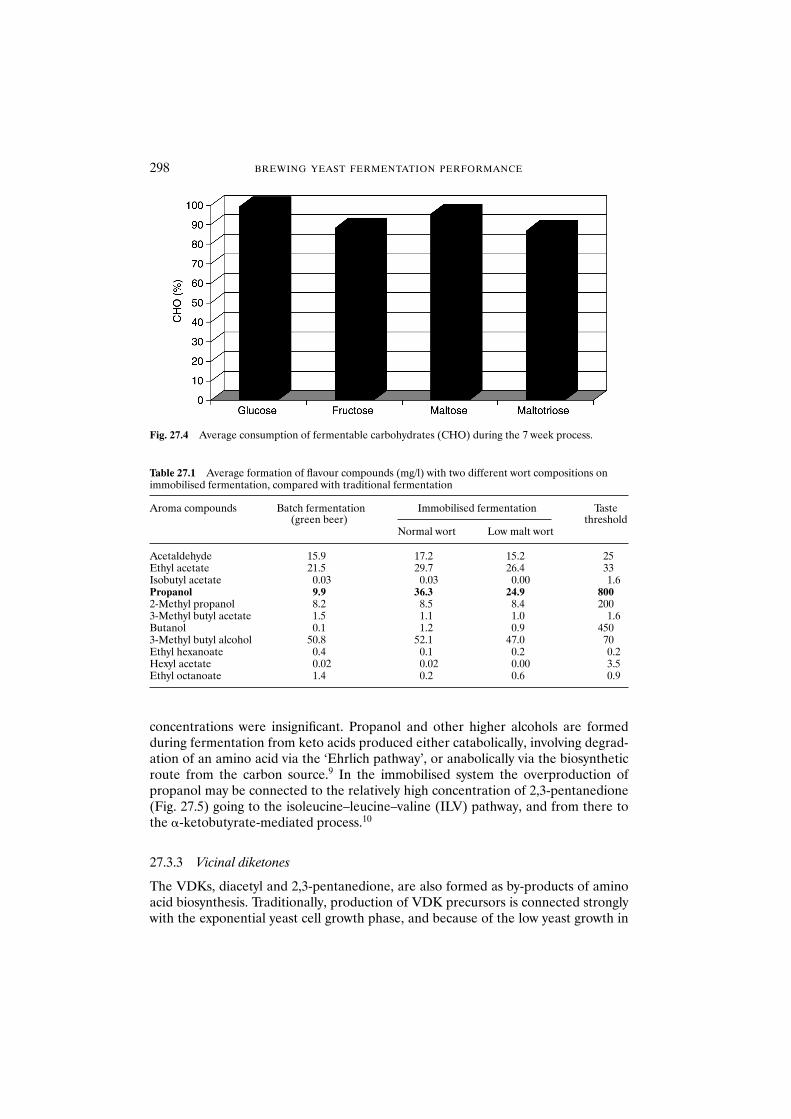
concentrations were insignificant. Propanol and other higher alcohols are formedduring fermentation from keto acids produced either catabolically, involving degrad-ation of an amino acid via the ‘Ehrlich pathway’, or anabolically via the biosyntheticroute from the carbon source.9 In the immobilised system the overproduction ofpropanol may be connected to the relatively high concentration of 2,3-pentanedione(Fig. 27.5) going to the isoleucine–leucine–valine (ILV) pathway, and from there tothe �-ketobutyrate-mediated process.10
27.3.3 Vicinal diketones
The VDKs, diacetyl and 2,3-pentanedione, are also formed as by-products of aminoacid biosynthesis. Traditionally, production of VDK precursors is connected stronglywith the exponential yeast cell growth phase, and because of the low yeast growth in
298 BREWING YEAST FERMENTATION PERFORMANCE
Fig. 27.4 Average consumption of fermentable carbohydrates (CHO) during the 7 week process.
Table 27.1 Average formation of flavour compounds (mg/l) with two different wort compositions onimmobilised fermentation, compared with traditional fermentation
Aroma compounds Batch fermentation Immobilised fermentation Taste (green beer)
Normal wort Low malt wortthreshold
Acetaldehyde 15.9 17.2 15.2 25Ethyl acetate 21.5 29.7 26.4 33Isobutyl acetate 0.03 0.03 0.00 1.6Propanol 9.9 36.3 24.9 8002-Methyl propanol 8.2 8.5 8.4 2003-Methyl butyl acetate 1.5 1.1 1.0 1.6Butanol 0.1 1.2 0.9 4503-Methyl butyl alcohol 50.8 52.1 47.0 70Ethyl hexanoate 0.4 0.1 0.2 0.2Hexyl acetate 0.02 0.02 0.00 3.5Ethyl octanoate 1.4 0.2 0.6 0.9
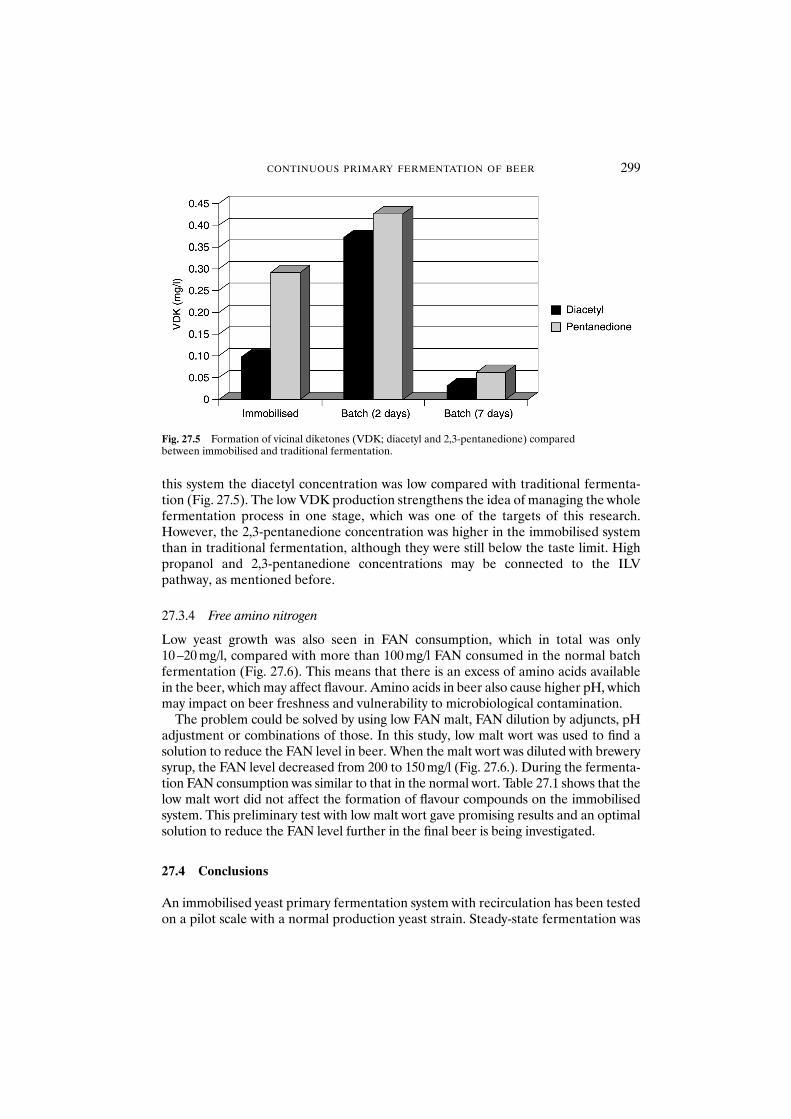
this system the diacetyl concentration was low compared with traditional fermenta-tion (Fig. 27.5). The low VDK production strengthens the idea of managing the wholefermentation process in one stage, which was one of the targets of this research. However, the 2,3-pentanedione concentration was higher in the immobilised systemthan in traditional fermentation, although they were still below the taste limit. Highpropanol and 2,3-pentanedione concentrations may be connected to the ILVpathway, as mentioned before.
27.3.4 Free amino nitrogen
Low yeast growth was also seen in FAN consumption, which in total was only10 –20 mg/l, compared with more than 100 mg/l FAN consumed in the normal batchfermentation (Fig. 27.6). This means that there is an excess of amino acids availablein the beer, which may affect flavour. Amino acids in beer also cause higher pH, whichmay impact on beer freshness and vulnerability to microbiological contamination.
The problem could be solved by using low FAN malt, FAN dilution by adjuncts, pHadjustment or combinations of those. In this study, low malt wort was used to find asolution to reduce the FAN level in beer. When the malt wort was diluted with brewerysyrup, the FAN level decreased from 200 to 150 mg/l (Fig. 27.6.). During the fermenta-tion FAN consumption was similar to that in the normal wort. Table 27.1 shows that thelow malt wort did not affect the formation of flavour compounds on the immobilisedsystem. This preliminary test with low malt wort gave promising results and an optimalsolution to reduce the FAN level further in the final beer is being investigated.
27.4 Conclusions
An immobilised yeast primary fermentation system with recirculation has been testedon a pilot scale with a normal production yeast strain. Steady-state fermentation was
CONTINUOUS PRIMARY FERMENTATION OF BEER 299
Fig. 27.5 Formation of vicinal diketones (VDK; diacetyl and 2,3-pentanedione) compared between immobilised and traditional fermentation.
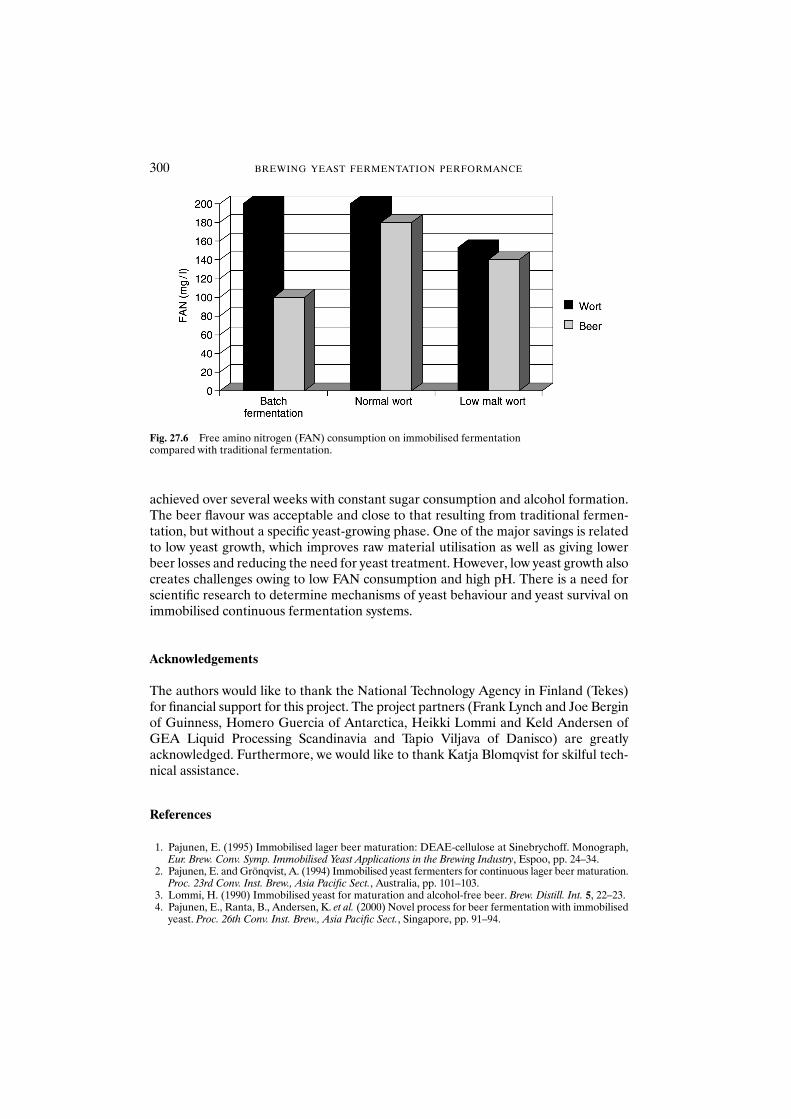
achieved over several weeks with constant sugar consumption and alcohol formation.The beer flavour was acceptable and close to that resulting from traditional fermen-tation, but without a specific yeast-growing phase. One of the major savings is relatedto low yeast growth, which improves raw material utilisation as well as giving lowerbeer losses and reducing the need for yeast treatment. However, low yeast growth alsocreates challenges owing to low FAN consumption and high pH. There is a need forscientific research to determine mechanisms of yeast behaviour and yeast survival onimmobilised continuous fermentation systems.
Acknowledgements
The authors would like to thank the National Technology Agency in Finland (Tekes)for financial support for this project. The project partners (Frank Lynch and Joe Berginof Guinness, Homero Guercia of Antarctica, Heikki Lommi and Keld Andersen ofGEA Liquid Processing Scandinavia and Tapio Viljava of Danisco) are greatlyacknowledged. Furthermore, we would like to thank Katja Blomqvist for skilful tech-nical assistance.
References
1. Pajunen, E. (1995) Immobilised lager beer maturation: DEAE-cellulose at Sinebrychoff. Monograph,Eur. Brew. Conv. Symp. Immobilised Yeast Applications in the Brewing Industry, Espoo, pp. 24–34.
2. Pajunen, E. and Grönqvist, A. (1994) Immobilised yeast fermenters for continuous lager beer maturation.Proc. 23rd Conv. Inst. Brew., Asia Pacific Sect., Australia, pp. 101–103.
3. Lommi, H. (1990) Immobilised yeast for maturation and alcohol-free beer. Brew. Distill. Int. 5, 22–23.4. Pajunen, E., Ranta, B., Andersen, K. et al. (2000) Novel process for beer fermentation with immobilised
yeast. Proc. 26th Conv. Inst. Brew., Asia Pacific Sect., Singapore, pp. 91–94.
300 BREWING YEAST FERMENTATION PERFORMANCE
Fig. 27.6 Free amino nitrogen (FAN) consumption on immobilised fermentation compared with traditional fermentation.

5. Virkajärvi, I. (2001) Feasibility of continuous main fermentation of beer using immobilised yeast. VTTPublications 430, Espoo, 87 pp. � App. 50 pp.
6. Andersen, K., Bergin, J., Ranta, B. and Viljava, T. (1999) New process for continuous fermentation ofbeer. Proc. Eur. Brew. Cong. 27, 771–778.
7. Pajunen, E., Lommi, H. and Viljava, T. (2000) Novel primary fermentation with immobilised yeast. MasterBrew. Assoc. Am. Tech. Q. 37, 483–488.
8. Virkajärvi, I., Lindborg, K., Kronlöf, J. and Pajunen, E. (1999) Effects of aeration on flavour compoundsin immobilised primary fermentation. Monatsschr. Brauwissen. 52, 9–12, 25–28.
9. Oshita, K., Kubota, M., Uchida, M. and Ono, M. (1995) Clarification of the relationship between fuselalcohol formation and amino acid assimilation by brewing yeast using 13C-labeled amino acid. Proc.Eur. Brew. Cong. 25, 387–394.
10. Hammond, J. (1986) The contribution of yeast to beer flavour. Brew. Guardian, September, 27–33.
CONTINUOUS PRIMARY FERMENTATION OF BEER 301
Acetaldehyde 238, 298Acetolactate
α 183–195Acetylcoenzyme A 213–248Acetylglucosamine 121–122Acidification power test 26, 31,
66, 98, 138, 140, 145, 163–164
Acid washing 62, 69, 257–258ADE4 6, 7Adenylate kinase 162ADH1 196ADH2 196ADH3 196ADH4 196ADH5 196Adhesion 133Adjunct 218Aerobiosis 69Ageing 170Alcohol dehydrogenase
196–205Amino acids 77, 83, 203
isoleucine 198leucine 198–202methionine 206–212valine 198–200
Anabinose 125Antimicrobial 121Antioxidants 61–73Apoptosis 170ATF1 213–214, 234–248ATF2 213–214, 234–248ATP 152, 162Attenuation 267, 272, 276Aureobascidium pullulans 55
Bacteria 13, 15Barley 83BDH1 204BDH2 204
Beer 25colour 78quality 77
Berberine 149Biotin 120Birth scars 275Budding index 261Bud Scars 275, 281Brettanomyces species 227Brewery 21, 77, 110, 1312,3-Butanedione 183–195
Calcineurin pathway 56Calcium 121–122CAMP signalling pathway 243Candida species 55Carboxyfluorescein diacetate 153Catalase 61–69CDCFDA 49CDH1 204CDH2 204Cell age 272–292Cell cycle 169, 171, 258, 282Cell size 42–43Cell volume 170, 281Cell wall 28–29, 10–121
attrition 40carboxyl groups 42–43charge 40, 122, 262, 268, 274hydrophobicity 120surface properties 34–36
Cereals 78CHEF 135Chromosome 3–9
V 6XIII 5–6, 9IX 6XI 6chimeric 3length polymophism 5rearrangements 3–4
Index
Brewing Yeast Fermentation Performance: Second edition
Edited by: KATHERINE SMART Copyright 0 Blackwell Science 2003
Chronological ageing 281–292CO2 26, 78, 224Colloidal stability 78Compatible solutes 46–53Contaminants 170–171Continuous culture 77COS3 9Corn steep liquor 87Cryopreservation 132CTT1 61, 63, 65CTA1 61, 63, 65Cyclindrical intracellular structures
(CIVS) 152, 162
Debaromyces hanseii 55Dextrose 124–126Diacetyl 32, 89, 183–195, 298–299Dimethyldisulfide (DMDS) 206–209Dimethylsulfide (DMS) 80, 206–209Dimethylsufoxide (DMSO) 78, 209Dimethyletrisulfide (DMTS)
206, 209DMC1 7DNA 3–11, 13
Damage 61, 67Microarrays 25
EBC tall tubes 79, 97, 120, 134Eddies 43EHT1 213–214, 239, 242ELISA 13Engineering 39Enrichment 18ERG6 5, 7Erlich pathway 82, 197, 298
like 206–212EST1 226–227EST2 226–227EST3 226–227EST4 226–227Esters 213–248
ethyl acetate 83, 117–118, 213–248, 298
ethyl caproate 82, 117–118, 213–248, 298
ethyl caprylate 214
ethyl hexanoate 298ethyl octonoate 298isoamyl acetate 82, 117–118, 213–248,
298isobutyl acetate 213, 2983-methyl butyl acetate 298phenyl ethyl acetate 213–214,
219Esterases 213–248Ethanol 25–26, 78, 297
Farnesol 100, 107Fatty acids 27–28, 67, 78, 86,
110–119, 213, 248Fermentable carbohydrates 86Fermentation 3, 25, 89, 96, 134,
140, 145–147, 183–195, 224, 237, 251–256, 266, 272
continuous 225, 293–301stuck 32temperature 226
Flavour 32, 77, 79, 110, 183–195, 267, 296
FLO1 122–123FLO1(lg) 11FLO5 123FLO11 4Flocculation 10, 40, 90, 120–128,
133, 261, 268, 272–292calcium bridging 121lectin like theory 121
Flocculin 122Flow cytometry 151, 169–179Fluorescence microscopy 171Fluorimetry 149–168Fluorophores 149–168
berberine 149–160carboxyfluorescein diacetate (CFDA)
149–160fluorescein diacetate 149–160FUN1 149–168, 287MgANS 149–160oxonol 149–160, 174–179propridium iodide 149–160,
172sytox orange 149–160
304 INDEX
Foam 36, 78Fructose 123–124, 298Fuctose 2,6-biphosphate 98, 106Fusel alcohols 197
Galactose 125Gene 3–5
array 27, 33expression 25up-regulation 25, 33–35
Genes 3–5Genome 3
analysis 25database 4
Geotrichum candidum 210GLK1 33Glucan 40, 78Glucose 101, 108, 110Glucose induced proton efflux (GIPE)
66, 163Glutathione 61–66Glycogen 40, 63, 68–69, 99, 105, 110,
112–114, 162–164, 170–172, 258,264
Glycerol 46, 48, 53–56, 98, 105Gravity 32, 53, 297Grist 83Gushing 78
H+ ATPase 102–103Hansenula species 227Haze 40, 44Heat shock proteins 33, 96Higher alcohols 81, 113, 118, 196–205
amyl alcohol 196butanol 298isoamyl alcohol 196, 199, 219, 238isobutanol 196, 199, 219, 238methylbutanol 206–212mercapto-3 methylbutanol 206methyl propanol 298
High gravity worts 46, 96, 213, 254–256
High osmolarity glycerol (HOG)Pathway 47, 50, 53, 54
Hops 77, 207
HSP12 239,243HSP26 33Hydrogen peroxide 61, 63Hypertonic 46Hypotonic 46
ILV2 7Immobilisation 225, 293–301Isopentanylmercatan 206–207Inorganic ions 77Insulin 96
mimic 96Intracellular pH 170Intracellular reducing power 46Invertase 40
Karyotype 3, 6KID1 196Kolmogorov turbulence scale 43
Lactobacillus– brevis 15, 18–20– casei 15– coryniformis ssp. Coryniformis 15– coryniformis ssp. Torqueris 15– lindneri 15–16, 20– parabuchneri (frigidus) 15– paracasei 15
Lambic beer 227Lectins 122Leucine 82Lightcycler 13Lipids 26, 66, 77, 81, 99Lipid transfer protein (LTP) 124–125Linoleic acid 110–115Lysotracker green 49
Magnesium release test 162Malt 120–123
adjuncts 77kilning 78roasting 78
Maltose 100, 108, 298Maltotriose 298Mannan 40, 122Mannose 125
INDEX 305
Mashing 78Megasphaera cerevisiae 15Melibiose 40Membrane 25–27, 49
fluidity 25potential 46
Metabolic activity 138Methanethiol 206–212Methional 206–212Methionine 206–212
sulphoxide 206–212Methionol 206–212Methyl butanol 206–212Methylene blue 26, 97, 113, 138–144,
149–160, 174–179Methylene violet 48, 50, 135,
138–144, 149, 153–160, 258, 263, 284
Minerals 86Mitochondrial
DNA 67fluorescence 170
Naso-olfactory apparatus 79NEWFLO 276–277NPR2 7
ORD1 6–7Osmolarity 46Osmolytes 46Osmotic 47Osmoticum 47Osmotolerance 51Oxolate 78Oxonol 149–160, 174–179, 284–286Oxygen 110, 120, 218, 222
uptake rate 26, 31–32
PAP1 7PDC1 196PDC5 196PDC6 196Pectinatus
cerevisiphilus 15, 18, 20damnosus 15–16frisingensis 15
inopinatus 15spec. DSM 20764 15
2, 3-Pentanedione 89, 298–299Performanace 25, 96Petites 134–135, 260, 2652-phenylethanol (2-PE) 80Phenyl ethyl acetate 213PHO84 6–7Pilot plant 183, 294Pitching 68, 70, 110–111, 219Plasmids 4Polymerase chain reaction 3–10, 13Polymorphism 3, 8Polyphenolics 78Polyploid 3, 52Polysaccharides 121Polysufides 207Propagation 61, 67, 70, 110–111, 131,
251–256Propanol 118, 297–298Propridium iodide 48, 50, 149, 172Protease 25–26, 30–31, 40Pulse field gel electrophoresis 3–6Pyruvate 103
Reactive oxygen species 61, 67Replicative lifespan 272–292Replicative potential 138Rhamnose 125Rhodotorula rubra 55
Saccharomyces bayanus 4–5Saccharomyces cerevisiae 3–8,
53–56, 97, 104, 111, 282
Saccharomyces pastiaranus 52, 56, 282
Selenomonas lacticifex 15Sensory analysis 238Serial repitching 25, 70, 257–272SFA1 196Shear agitation 39, 42, 44Shear centrifugation 39Shear convection 39Shear pumping 39Shear rate 41–42
306 INDEX
Shear thinning 41Silicate 78SIR1 6–7Slurry
alkalisation 39pH 26, 29, 40, 42, 69rheology 41viscosity 30, 41–42
SOD1 61SOD2 61SOR1 204Sorbitol 48Southern hybridization 3–6, 9Specific gravity 77Specific growth rate 82Spectrofluorimetry 153Spoilage 13Spun solids 41Standard plate count 139–140, 145Sterol 28, 67, 69, 86, 105, 110,
162–163Steven’s power law 79Stirring 224Storage 25–26, 30–32, 46, 69, 71, 257STRE 50, 68, 264Strecker degradation 206–207Stress 25–26, 257–271
cold shock 69, 258ethanol 25–29, 31, 33, 36, 46, 96, 107,
258hydrostatic 39, 258osmotic 28, 39, 46–60, 96, 107, 258oxidative 51, 61–71, 152, 162, 164,
166, 258pH 258protectant 29response 25, 34–35, 42, 257response genes 32, 34–35salt 53, 56shear 39–42, 258sorbitol 52, 108starvation 51, 152, 158, 164–165,
238–258temperature 27–32, 96tolerance 25, 33, 257
SUC2 6, 8, 9, 10
Sucrose 122Sugar 77Sulfur 206–212Sulfur dioxide 206Sunstruck 207Superoxide anions 61Superoxide dismutase 61Suspended solids 218, 261Syrups 83Sytox orange 149
Tannoids 78Telomeres 8–9Temperature 25Thioesters 207
S-methylthioacetate 207S-methylthioisovalerate 207
Thiols 207–208TOA2 7Trehalose 26, 28–29, 35–36, 40, 47,
63, 68–69, 112, 114, 162–164, 258, 264
Trub 81, 87Tullo Test 133Turbulence 43Ty elements 7–8
URA1 6–7
Vacuolar fragmentation 57Vacuoles 46–47, 56–57
lumen 49, 57pro- 57tonoplast 49, 57
Viability 26, 32, 40, 46, 51, 53, 69, 115,135, 138–148, 149–161, 174–179
Viable but non-culturable phenotypes287
Viablue 153Vicinal diketones 89, 183–195, 258,
296, 298–299Virgin cells 273–292Viscosity 41Vitality 25–26, 31–32, 120, 138–148,
149–161, 162, 168, 168–173Vitamins 61, 77, 86
INDEX 307
Volatiles 81
Wort 52, 75, 77, 88, 120, 258aeration 69, 110, 254artificial 82,batch to batch variation 86, 257boiling 78buffering capacity 87clarity 83composition 52, 75, 77, 88, 110,
120, 258pH 87reproducible 87substitutes 86, 90, 92supplements 110–119
Xylose 125
YAP1 71
Yeastale 46–60, 87, 149, 175autolysis 39bottom fermenting 3–5handling 39, 46laboratory 7lager 25, 46–61, 87, 97, 149,
175nitrogen base 87peptide complex (YPC) 96–109quality 11, 149, 262storage 131supply 131tank residence time 41, 43wine 7–8
Zinc 78, 86, 120, 218, 223Zinc sulfate 86Zymolectin 122
308 INDEX