Embed Size (px)
Citation preview
A Neurological Understanding of the Social Influence of Teen Passengers
Lisa Buckley Team: Anuj Pradhan, Ray Bingham, Xiaosu (Frank) Hu, Christopher Monk
Acknowledgements
This research is supported by the Center for Advancing Transportation Leadership and Safety (ATLAS-center.org). The ATLAS Center is sponsored by USDOT’s Research and Innovative Technology Administration (RITA) through Grant Number DTRT13-G-UTC54.
Outline Background
o Teen Drivers & Passengers o Driving Simulation o fNIRS
Current Study o Experimental Design o Protocol o Preliminary Results
Discussion/Questions
Background
Teen Drivers o Motor vehicle crashes are the leading cause of
mortality, and a major cause of injury for U.S. teenagers.
o This risk is higher for male than female teenage drivers.
Background
Passengers o Epidemiological studies indicate higher motor
vehicle fatal crash risks for teens in the presence of teen passengers
o Experimental studies (driving simulation) shows more risk taking in teen drivers in the presence of peer passengers
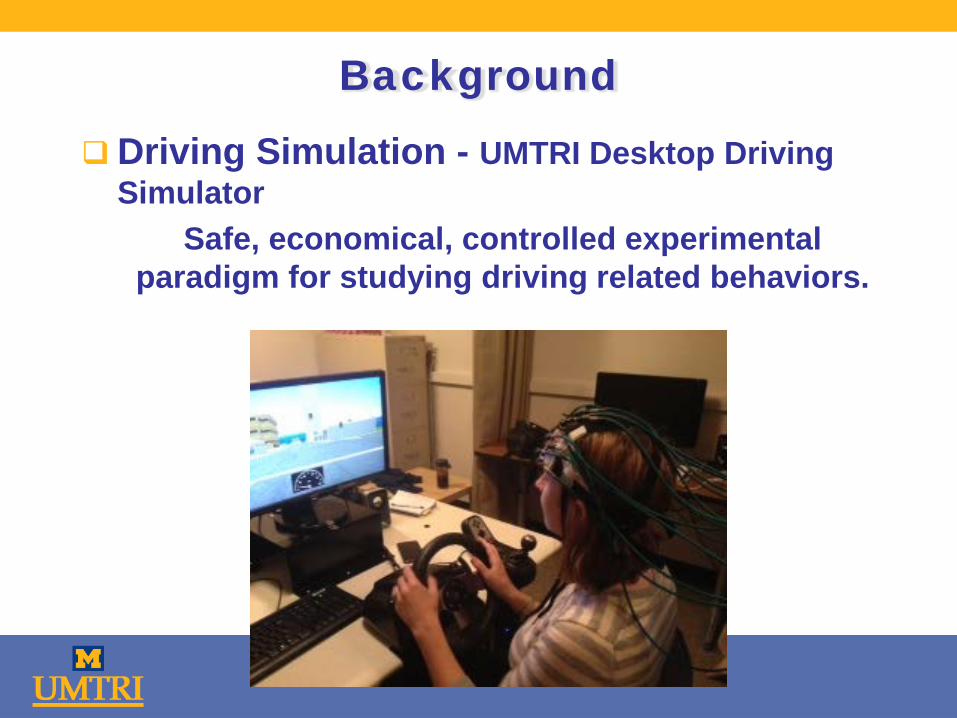
Background Driving Simulation - UMTRI Desktop Driving
Simulator Safe, economical, controlled experimental
paradigm for studying driving related behaviors.
Background
Neurological responses
o Adults and adolescents exhibit different neurological responses to risk and reward
o Incentive processing and cognitive control implicated in adolescent risk taking behaviors
Background
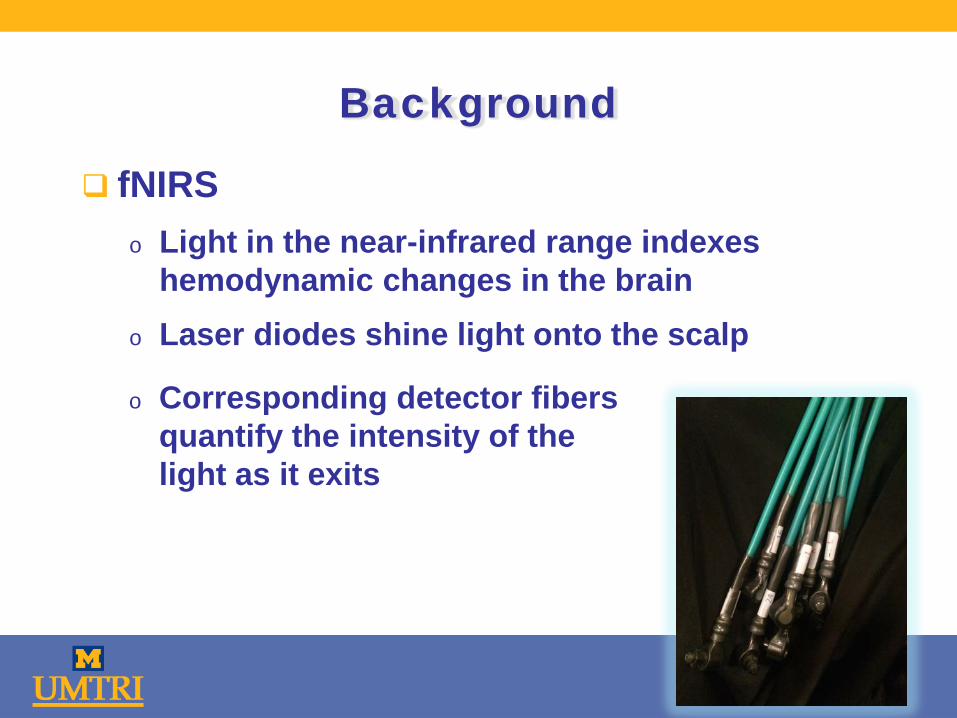
fNIRS o Light in the near-infrared range indexes
hemodynamic changes in the brain o Laser diodes shine light onto the scalp
o Corresponding detector fibers
quantify the intensity of the light as it exits
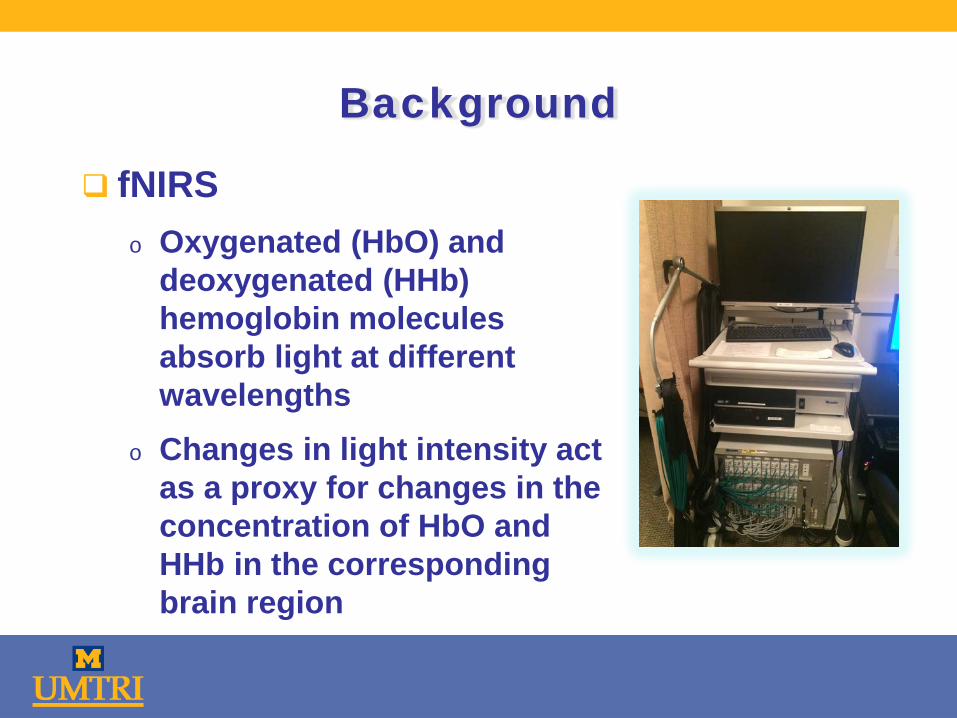
Background
fNIRS o Oxygenated (HbO) and
deoxygenated (HHb) hemoglobin molecules absorb light at different wavelengths
o Changes in light intensity act as a proxy for changes in the concentration of HbO and HHb in the corresponding brain region
Current Study
Feasibility of fNIRS to study drivers’ brain activation during simulated driving.
Cortical activity measured in drivers driving alone and in the presence of a passenger.
Experimental Design
2 driving conditions (counterbalanced): o Driving Alone vs Driving with a Peer passenger o Male peer-aged confederate
• Ruse: Another participant but only “watching” the drive • No interaction/talking during drive
o Objective risk-taking behaviors recorded by simulator
o Validated computerized measure of risk-taking (BART) also included
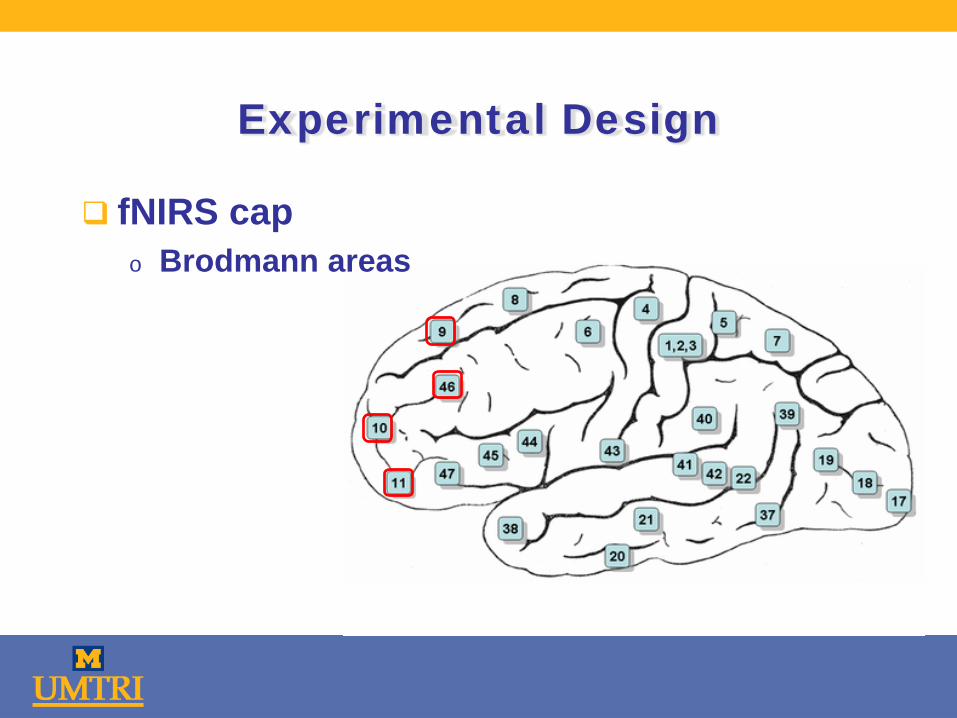
Experimental Design
fNIRS cap o Brodmann areas
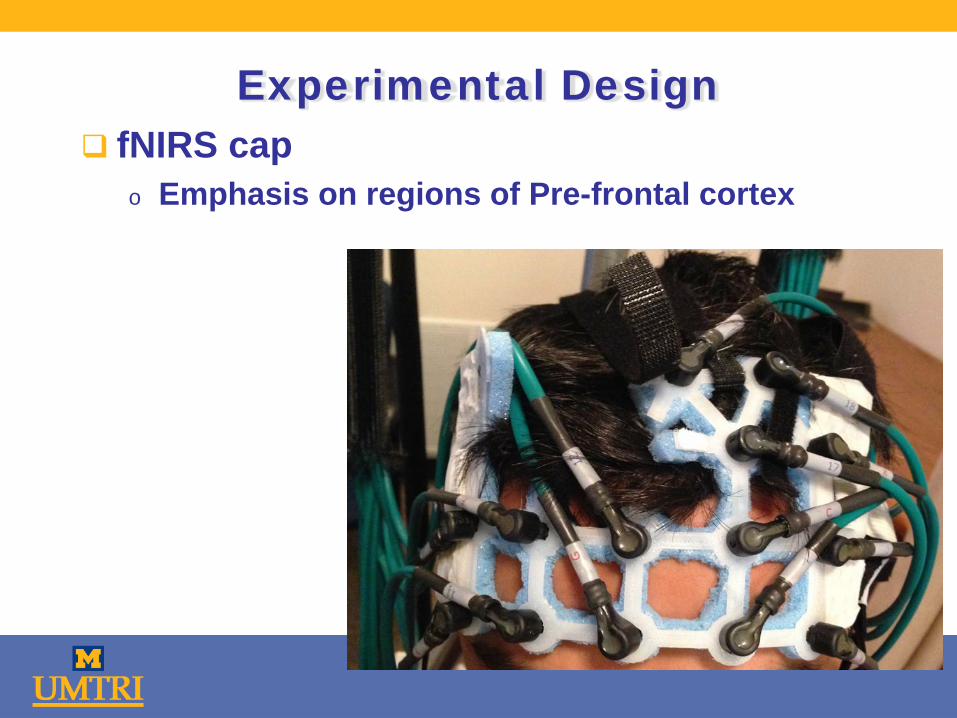
Experimental Design fNIRS cap
o Emphasis on regions of Pre-frontal cortex
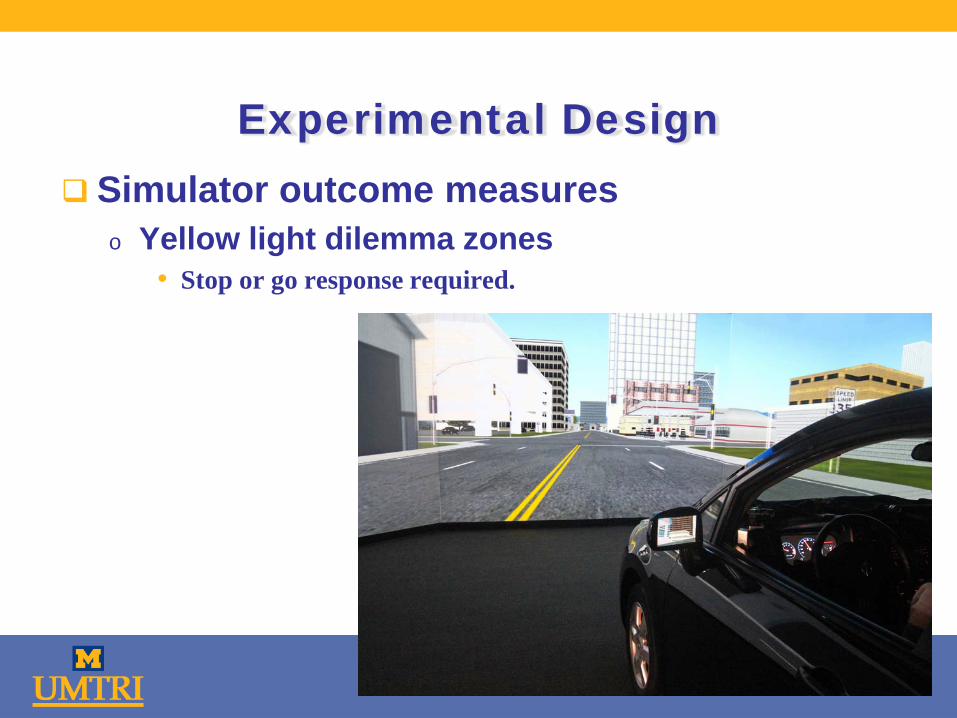
Experimental Design Simulator outcome measures
o Yellow light dilemma zones • Stop or go response required.
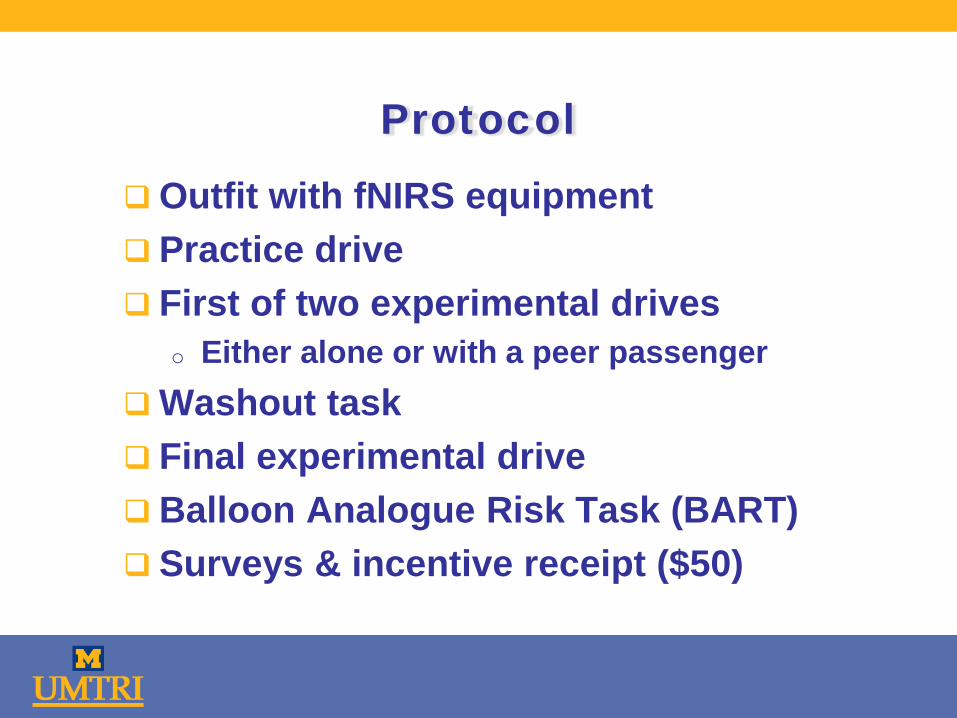
Protocol
Outfit with fNIRS equipment Practice drive First of two experimental drives
o Either alone or with a peer passenger Washout task Final experimental drive Balloon Analogue Risk Task (BART) Surveys & incentive receipt ($50)
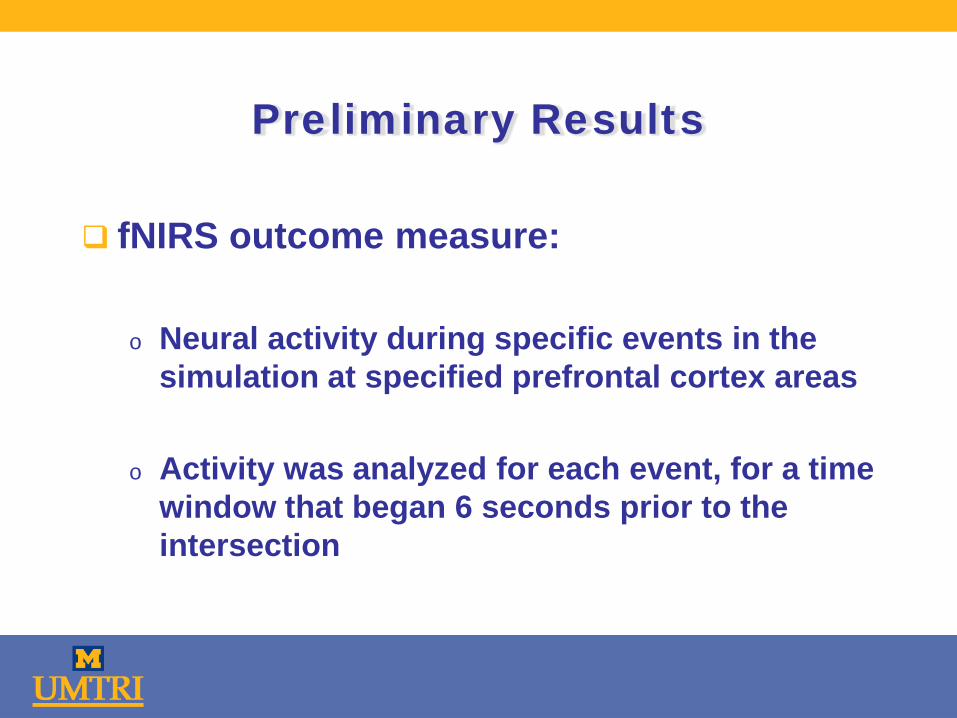
Preliminary Results
fNIRS outcome measure: o Neural activity during specific events in the
simulation at specified prefrontal cortex areas
o Activity was analyzed for each event, for a time window that began 6 seconds prior to the intersection
Preliminary Results
Imaging data were preprocessed using Homer2: o optical density change data conversion o Data de-trending o Filtering o Concentration change data conversion (Only
O2Hb values were analyzed)
Preliminary Results
Each participant’s Hb concentration data averaged: o from multiple events o using an event-averaging algorithm o based on stimulus markers programmed at each event.
Time range started 6-seconds before an intersection was reached (incorporated the onset of the yellow light)
Was 16 seconds long to allow for sufficient measurement in changes in blood flow.
The derived averaged time series from two driving sessions were compared using a two-tailed t-test (p < 0.05).
Preliminary Results
Statistically significant differences in brain activation levels in various ROI based. o Left middle frontal gyrus
• BA46, BA10, BA9
o Right • BA46
o Mid Orbitofrontal cortex • BA11 – Left and Right
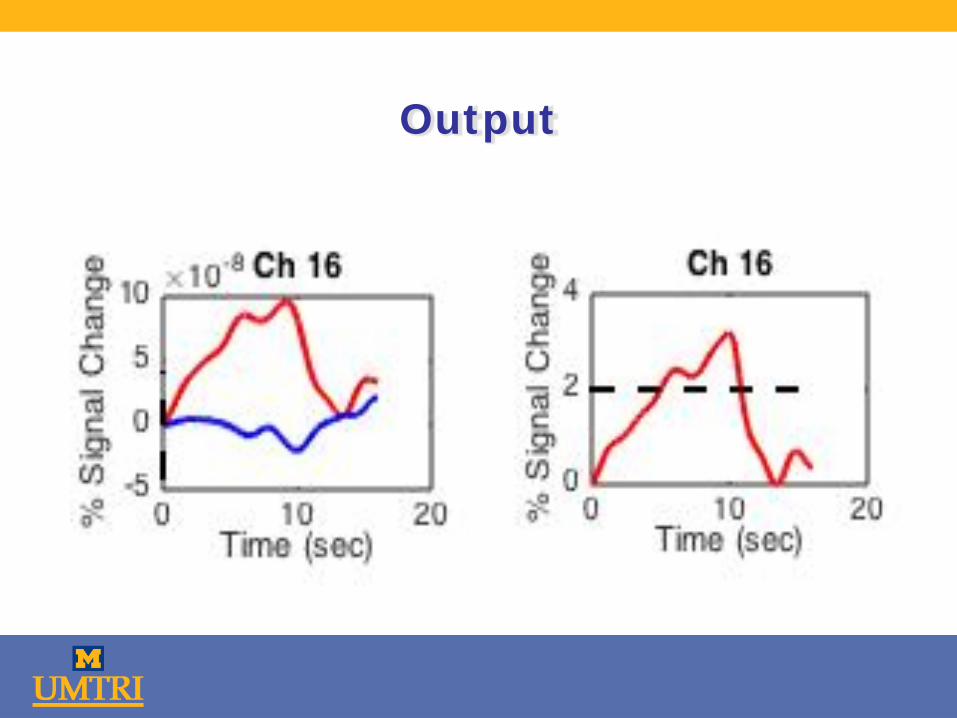
Output
Ongoing/Next steps
Findings appear consistent with those in fMRI research – orbitofrontal cortex and lateral prefrontal cortex. We will continue to examine fNIRS suitability to measure neurological processes while driving
Analyses of group differences by age Broader examination of behavioral activities,
including at temporal locations other than yellow light onset

Any Questions