Embed Size (px)
Citation preview
Building One Growth-Driven Company l 1Building One Growth-Driven Company l 1
Company Overview Presentation
November 2016
Building One Growth-Driven Company l 2
Forward-looking StatementsThis presentation contains statements which constitute forward-looking statements withinthe meaning of Section 27A of the Securities Act, as amended; Section 21E of the SecuritiesExchange Act of 1934; and the Private Securities Litigation Reform Act of 1995. The words“may”, “would”, “could”, “will”, “expect”, “estimate”, “anticipate”, “believe”, “intend”, “plan”,“goal”, and similar expressions and variations thereof are intended to specifically identifyforward-looking statements. All statements that are not statements of historical fact areforward-looking statements.
Investors and prospective investors are cautioned that any such forward-looking statementsare not guarantees of future performance and involve risks and uncertainties, and thatactual results may differ materially from those projected in the forward-looking statementsas a result of various factors. The risks that might cause such differences are identified inour filings with the Securities and Exchange Commission. We undertake no obligation topublicly update or revise the forward looking statements made in this presentation to reflectevents or circumstances after the date of this presentation or to reflect the occurrence ofunanticipated events.
Building One Growth-Driven Company l 3
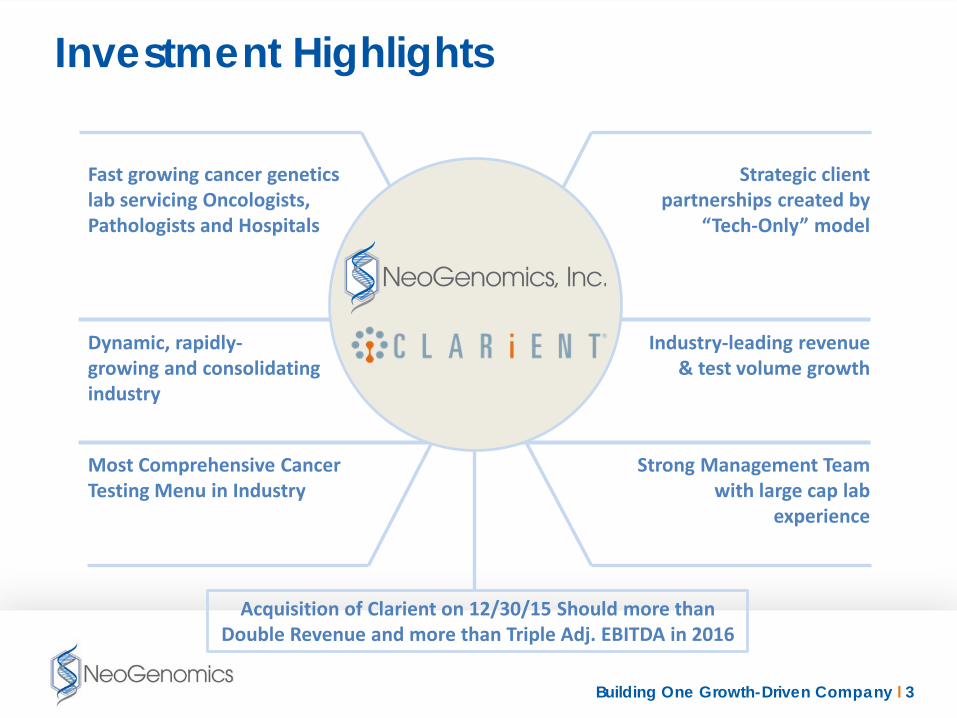
Investment Highlights
Fast growing cancer genetics lab servicing Oncologists, Pathologists and Hospitals
Strategic client partnerships created by
“Tech-Only” model
Dynamic, rapidly-growing and consolidating industry
Industry-leading revenue & test volume growth
Most Comprehensive Cancer Testing Menu in Industry
Strong Management Team with large cap lab
experience
Acquisition of Clarient on 12/30/15 Should more than Double Revenue and more than Triple Adj. EBITDA in 2016
Building One Growth-Driven Company l 4
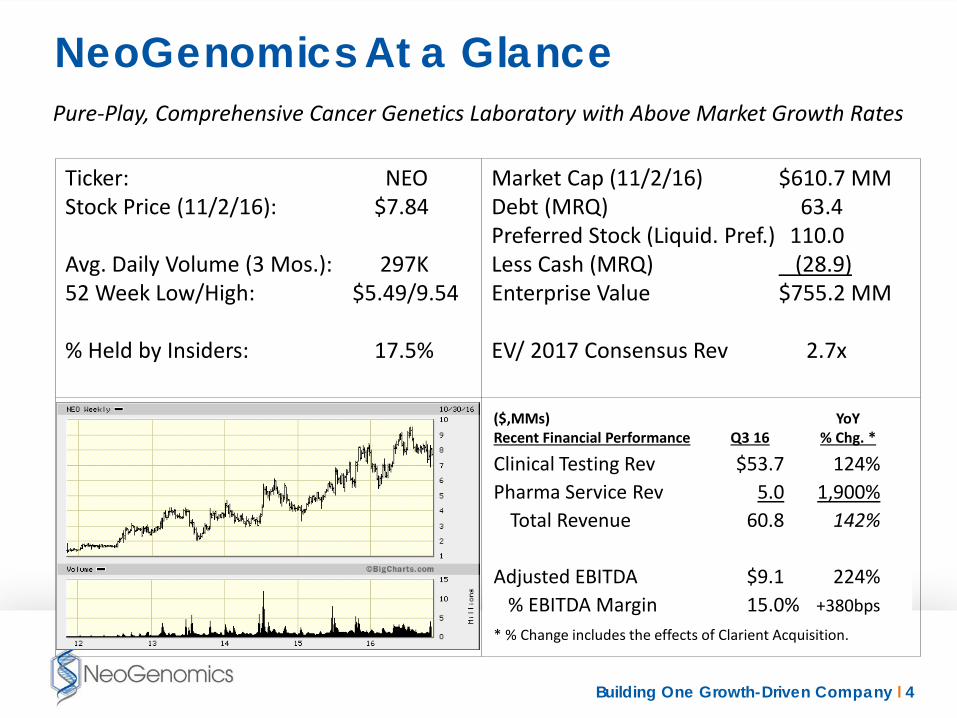
NeoGenomics At a GlancePure-Play, Comprehensive Cancer Genetics Laboratory with Above Market Growth Rates
Ticker: NEOStock Price (11/2/16): $7.84
Avg. Daily Volume (3 Mos.): 297K52 Week Low/High: $5.49/9.54
% Held by Insiders: 17.5%
Market Cap (11/2/16) $610.7 MMDebt (MRQ) 63.4 Preferred Stock (Liquid. Pref.) 110.0Less Cash (MRQ) (28.9)Enterprise Value $755.2 MM
EV/ 2017 Consensus Rev 2.7x
Recent Financial Performance
($,MMs)Recent Financial Performance Q3 16
YoY% Chg. *
Clinical Testing Rev $53.7 124%Pharma Service Rev 5.0 1,900%
Total Revenue 60.8 142%
Adjusted EBITDA $9.1 224%% EBITDA Margin 15.0% +380bps
* % Change includes the effects of Clarient Acquisition.

Building One Growth-Driven Company l 5
Experienced Management Team• Douglas VanOort, Chairman & CEO (7 yrs.)
Chief Operating Officer, Quest Diagnostics; Executive VP, Corning Life Sciences, Inc.
• Robert Shovlin, President - Clinical Services Division (2 yrs.)Chief Development Officer, Bostwick Laboratories; President & Chief Executive Officer, Aureon Biosciences
• Steven Brodie, President – Pharma Services Division (5 yrs.)Senior Director - Quest Diagnostics
• Steven Jones, Board Member, Executive VP & Chief Compliance Officer (14 yrs.)Chairman, Aspen Capital Group; Vice President, Merrill Lynch Investment Banking
• Maher Albitar, M.D., SVP & Chief Medical Officer & Director of R&D (5 yrs.)Med. Dir. for Hematopathology & Oncology and Chief of R&D, Quest Nichols Institute;
• George Cardoza, SVP & Chief Financial Officer (7 yrs.)CFO, Protocol Global Solutions; Controller, Central Region, Quest Diagnostics
• Jennifer Balliet, VP & Chief Culture Officer (8 yrs.)HR Specialist, Gevity HR
• Steven Ross, VP & Chief Information Officer (3 yrs.)Vice President Technology, Chico’s FAS, Inc.
• Denise Pedulla, General Counsel (1 yr.)Principal, Berkeley Research Group; SVP & Chief Compliance Officer, Orthofix International, NV
Building One Growth-Driven Company l 6
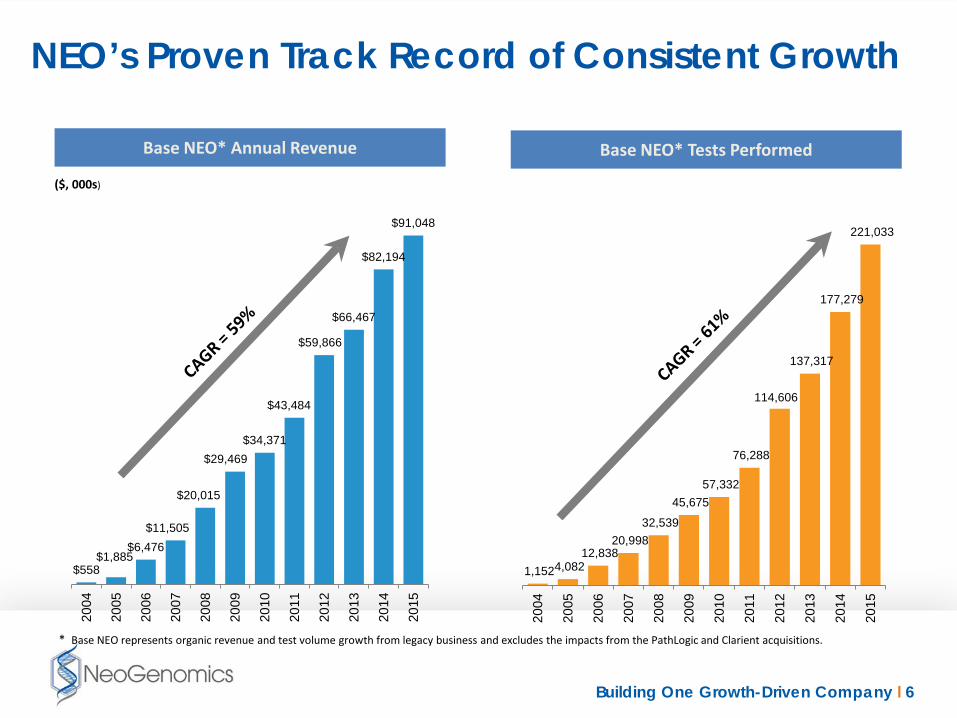
1,152 4,082 12,838
20,998 32,539
45,675 57,332
76,288
114,606
137,317
177,279
221,033
2004
2005
2006
2007
2008
2009
2010
2011
2012
2013
2014
2015
$558$1,885
$6,476$11,505
$20,015
$29,469$34,371
$43,484
$59,866
$66,467
$82,194
$91,048
2004
2005
2006
2007
2008
2009
2010
2011
2012
2013
2014
2015
NEO’s Proven Track Record of Consistent Growth
Base NEO* Annual Revenue Base NEO* Tests Performed
($, 000s)
* Base NEO represents organic revenue and test volume growth from legacy business and excludes the impacts from the PathLogic and Clarient acquisitions.
Building One Growth-Driven Company l 7
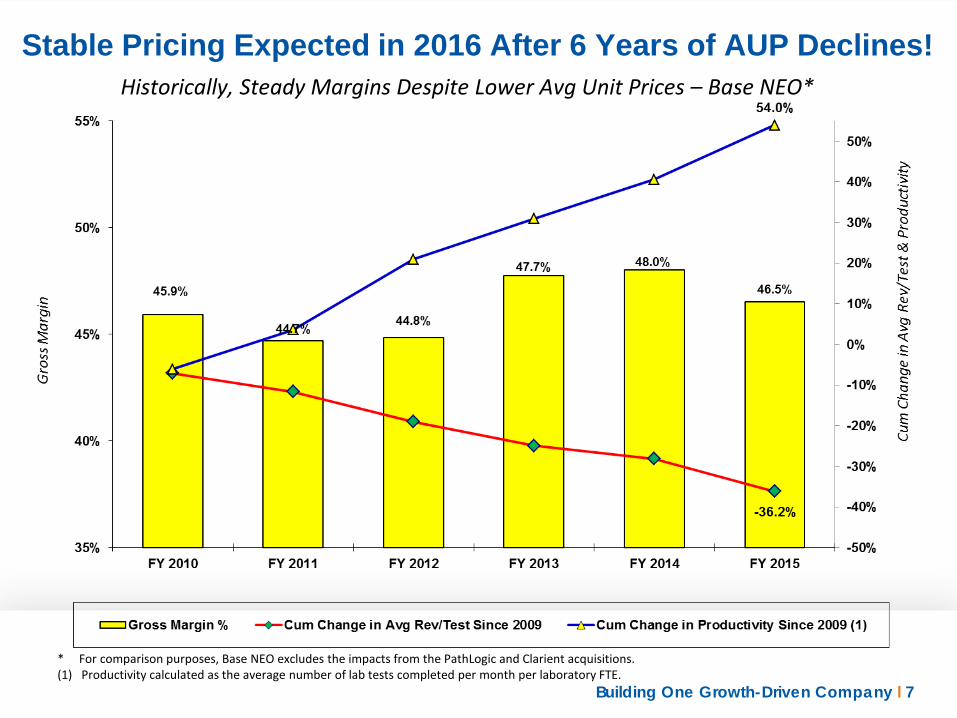
Stable Pricing Expected in 2016 After 6 Years of AUP Declines!
* For comparison purposes, Base NEO excludes the impacts from the PathLogic and Clarient acquisitions.(1) Productivity calculated as the average number of lab tests completed per month per laboratory FTE.
Historically, Steady Margins Despite Lower Avg Unit Prices – Base NEO*

Building One Growth-Driven Company l 8
Evolution of Payer Mix For Clinical TestingMedicare reimbursements have fallen to 16% of our payer mix from 52% in 2010.
(1) 2016 estimates are blended average of Base NEO and Clarient payer mixes.
(1)
52%44%
37%
27%21% 21%
16%
23%
26%34%
45%51%
59%
54%
23%29% 28% 28% 29%
20%
29%
0%
10%
20%
30%
40%
50%
60%
70%
80%
90%
100%
2010 2011 2012 2013 2014 2015 2016 E
Medicare (Incl. Medicaid) Client Bill (Hospitals) Commercial Insurance Other/Accruals/Pt. Pay
Building One Growth-Driven Company l 9
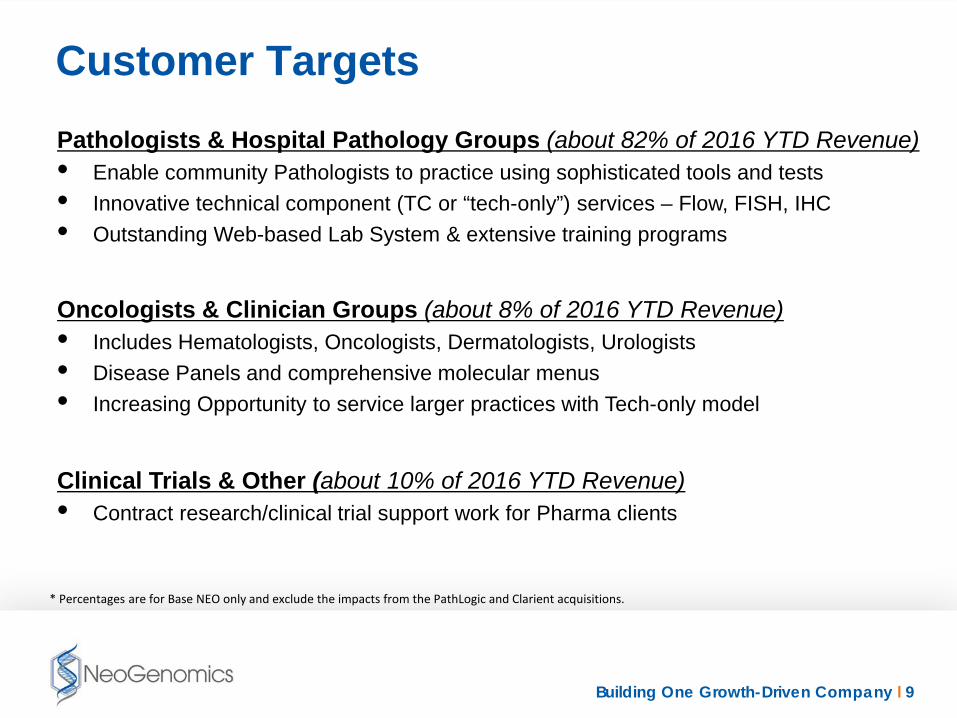
Customer TargetsPathologists & Hospital Pathology Groups (about 82% of 2016 YTD Revenue)• Enable community Pathologists to practice using sophisticated tools and tests• Innovative technical component (TC or “tech-only”) services – Flow, FISH, IHC• Outstanding Web-based Lab System & extensive training programs
Oncologists & Clinician Groups (about 8% of 2016 YTD Revenue)• Includes Hematologists, Oncologists, Dermatologists, Urologists• Disease Panels and comprehensive molecular menus• Increasing Opportunity to service larger practices with Tech-only model
Clinical Trials & Other (about 10% of 2016 YTD Revenue)• Contract research/clinical trial support work for Pharma clients
* Percentages are for Base NEO only and exclude the impacts from the PathLogic and Clarient acquisitions.
Building One Growth-Driven Company l 10
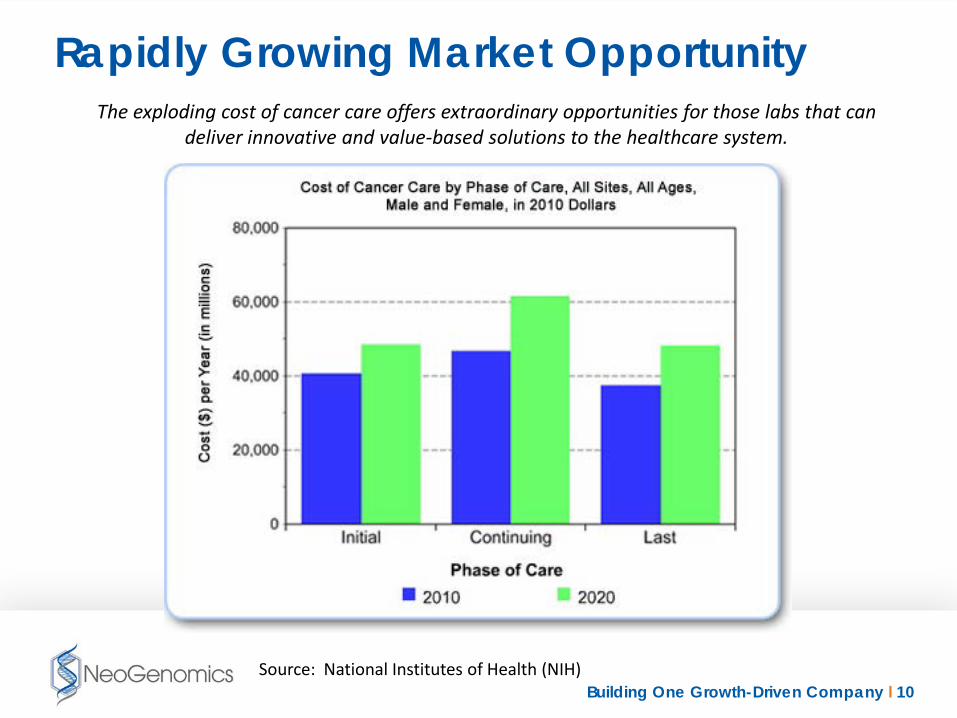
Rapidly Growing Market OpportunityThe exploding cost of cancer care offers extraordinary opportunities for those labs that can
deliver innovative and value-based solutions to the healthcare system.
Source: National Institutes of Health (NIH)
Building One Growth-Driven Company l 11
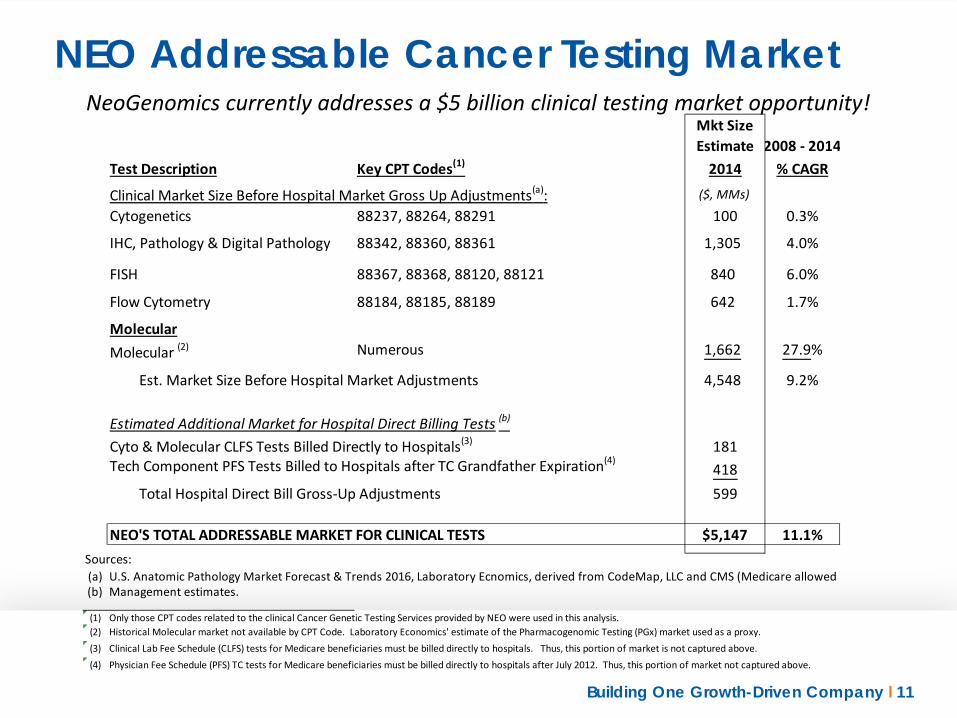
NEO Addressable Cancer Testing MarketNeoGenomics currently addresses a $5 billion clinical testing market opportunity!
Mkt SizeEstimate 2008 - 2014
Test Description Key CPT Codes(1) 2014 % CAGR
Clinical Market Size Before Hospital Market Gross Up Adjustments(a): ($, MMs)
Cytogenetics 88237, 88264, 88291 100 0.3%
IHC, Pathology & Digital Pathology 88342, 88360, 88361 1,305 4.0%
FISH 88367, 88368, 88120, 88121 840 6.0%
Flow Cytometry 88184, 88185, 88189 642 1.7%
MolecularMolecular (2) Numerous 1,662 27.9%
Est. Market Size Before Hospital Market Adjustments 4,548 9.2%
Estimated Additional Market for Hospital Direct Billing Tests (b)
Cyto & Molecular CLFS Tests Billed Directly to Hospitals(3) 181Tech Component PFS Tests Billed to Hospitals after TC Grandfather Expiration(4)
418Total Hospital Direct Bill Gross-Up Adjustments 599
NEO'S TOTAL ADDRESSABLE MARKET FOR CLINICAL TESTS $5,147 11.1%Sources:(a)(b) Management estimates.
(1)(2)(3)(4)
U.S. Anatomic Pathology Market Forecast & Trends 2016, Laboratory Ecnomics, derived from CodeMap, LLC and CMS (Medicare allowed c
Only those CPT codes related to the clinical Cancer Genetic Testing Services provided by NEO were used in this analysis. Historical Molecular market not available by CPT Code. Laboratory Economics' estimate of the Pharmacogenomic Testing (PGx) market used as a proxy. Clinical Lab Fee Schedule (CLFS) tests for Medicare beneficiaries must be billed directly to hospitals. Thus, this portion of market is not captured above.Physician Fee Schedule (PFS) TC tests for Medicare beneficiaries must be billed directly to hospitals after July 2012. Thus, this portion of market not captured above.
Building One Growth-Driven Company l 12
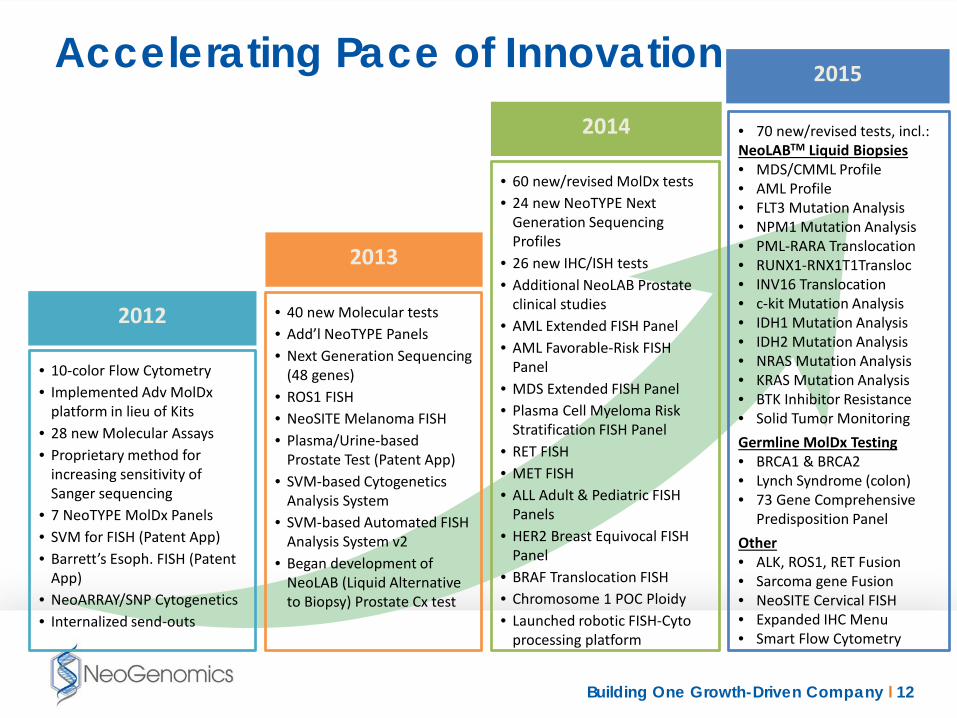
Accelerating Pace of Innovation• 70 new/revised tests, incl.: NeoLABTM Liquid Biopsies• MDS/CMML Profile• AML Profile • FLT3 Mutation Analysis• NPM1 Mutation Analysis• PML-RARA Translocation• RUNX1-RNX1T1Transloc• INV16 Translocation• c-kit Mutation Analysis• IDH1 Mutation Analysis• IDH2 Mutation Analysis• NRAS Mutation Analysis• KRAS Mutation Analysis• BTK Inhibitor Resistance• Solid Tumor MonitoringGermline MolDx Testing • BRCA1 & BRCA2• Lynch Syndrome (colon)• 73 Gene Comprehensive
Predisposition PanelOther • ALK, ROS1, RET Fusion• Sarcoma gene Fusion• NeoSITE Cervical FISH• Expanded IHC Menu• Smart Flow Cytometry
• 10-color Flow Cytometry • Implemented Adv MolDx
platform in lieu of Kits• 28 new Molecular Assays• Proprietary method for
increasing sensitivity of Sanger sequencing
• 7 NeoTYPE MolDx Panels• SVM for FISH (Patent App)• Barrett’s Esoph. FISH (Patent
App)• NeoARRAY/SNP Cytogenetics• Internalized send-outs
• 40 new Molecular tests• Add’l NeoTYPE Panels• Next Generation Sequencing
(48 genes)• ROS1 FISH• NeoSITE Melanoma FISH• Plasma/Urine-based
Prostate Test (Patent App)• SVM-based Cytogenetics
Analysis System• SVM-based Automated FISH
Analysis System v2• Began development of
NeoLAB (Liquid Alternative to Biopsy) Prostate Cx test
2015
2012
2013
• 60 new/revised MolDx tests• 24 new NeoTYPE Next
Generation Sequencing Profiles
• 26 new IHC/ISH tests• Additional NeoLAB Prostate
clinical studies• AML Extended FISH Panel• AML Favorable-Risk FISH
Panel• MDS Extended FISH Panel• Plasma Cell Myeloma Risk
Stratification FISH Panel• RET FISH• MET FISH• ALL Adult & Pediatric FISH
Panels• HER2 Breast Equivocal FISH
Panel• BRAF Translocation FISH• Chromosome 1 POC Ploidy• Launched robotic FISH-Cyto
processing platform
2014
Building One Growth-Driven Company l 13
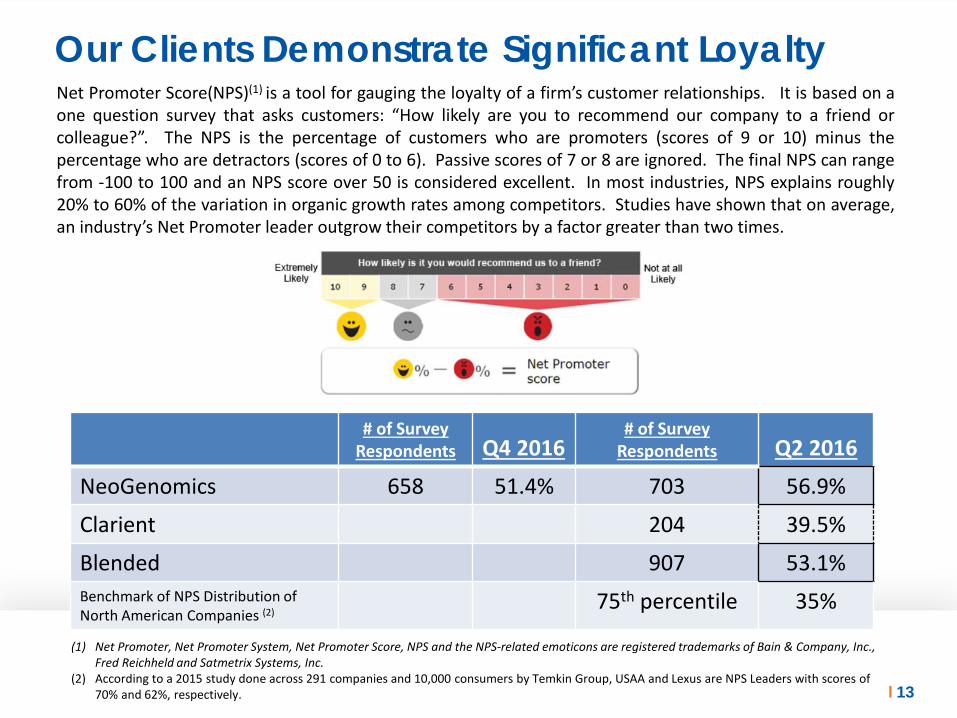
Our Clients Demonstrate Significant Loyalty
# of Survey Respondents Q4 2016
# of Survey Respondents Q2 2016
NeoGenomics 658 51.4% 703 56.9%
Clarient 204 39.5%
Blended 907 53.1%Benchmark of NPS Distribution of North American Companies (2)
75th percentile 35%
Net Promoter Score(NPS)(1) is a tool for gauging the loyalty of a firm’s customer relationships. It is based on aone question survey that asks customers: “How likely are you to recommend our company to a friend orcolleague?”. The NPS is the percentage of customers who are promoters (scores of 9 or 10) minus thepercentage who are detractors (scores of 0 to 6). Passive scores of 7 or 8 are ignored. The final NPS can rangefrom -100 to 100 and an NPS score over 50 is considered excellent. In most industries, NPS explains roughly20% to 60% of the variation in organic growth rates among competitors. Studies have shown that on average,an industry’s Net Promoter leader outgrow their competitors by a factor greater than two times.
(1) Net Promoter, Net Promoter System, Net Promoter Score, NPS and the NPS-related emoticons are registered trademarks of Bain & Company, Inc., Fred Reichheld and Satmetrix Systems, Inc.
(2) According to a 2015 study done across 291 companies and 10,000 consumers by Temkin Group, USAA and Lexus are NPS Leaders with scores of 70% and 62%, respectively.
Building One Growth-Driven Company l 14
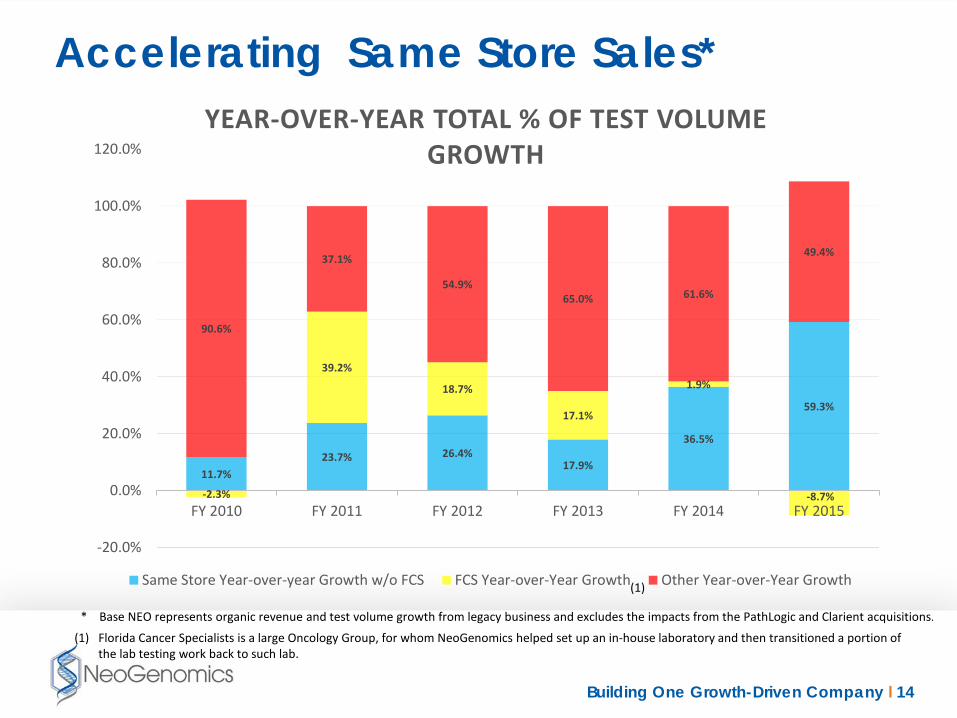
Accelerating Same Store Sales*
* Base NEO represents organic revenue and test volume growth from legacy business and excludes the impacts from the PathLogic and Clarient acquisitions.
11.7%23.7% 26.4%
17.9%
36.5%
59.3%
-2.3%
39.2%
18.7%
17.1%
1.9%
-8.7%
90.6%
37.1%
54.9%65.0% 61.6%
49.4%
-20.0%
0.0%
20.0%
40.0%
60.0%
80.0%
100.0%
120.0%
FY 2010 FY 2011 FY 2012 FY 2013 FY 2014 FY 2015
YEAR-OVER-YEAR TOTAL % OF TEST VOLUME GROWTH
Same Store Year-over-year Growth w/o FCS FCS Year-over-Year Growth Other Year-over-Year Growth(1)
(1) Florida Cancer Specialists is a large Oncology Group, for whom NeoGenomics helped set up an in-house laboratory and then transitioned a portion of the lab testing work back to such lab.
Building One Growth-Driven Company l 15
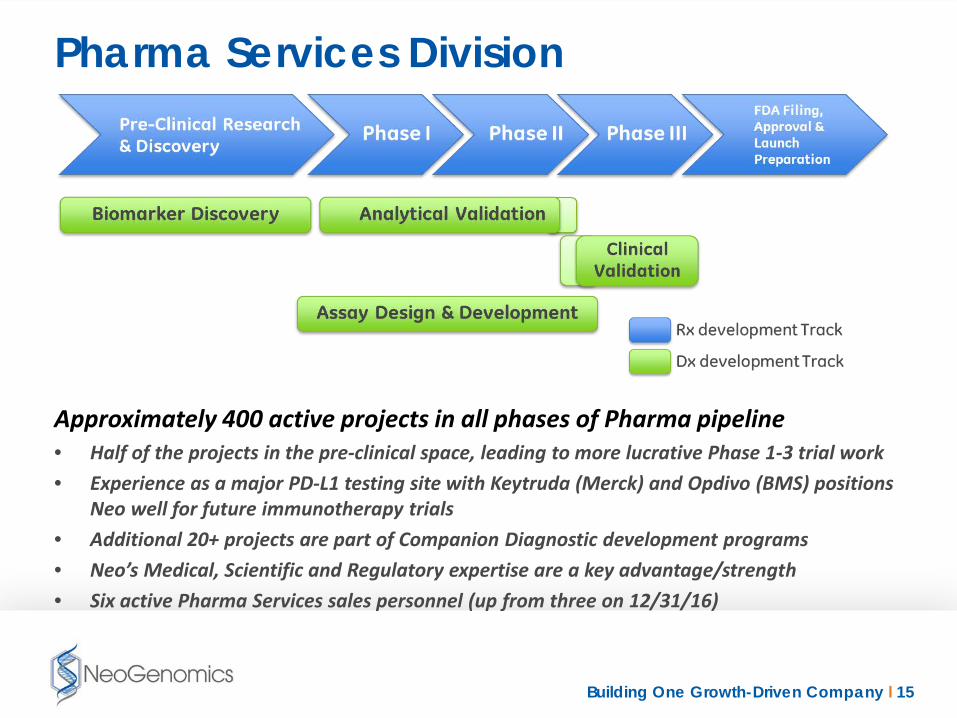
Pharma Services Division
Approximately 400 active projects in all phases of Pharma pipeline• Half of the projects in the pre-clinical space, leading to more lucrative Phase 1-3 trial work• Experience as a major PD-L1 testing site with Keytruda (Merck) and Opdivo (BMS) positions
Neo well for future immunotherapy trials • Additional 20+ projects are part of Companion Diagnostic development programs• Neo’s Medical, Scientific and Regulatory expertise are a key advantage/strength• Six active Pharma Services sales personnel (up from three on 12/31/16)
Building One Growth-Driven Company l 16
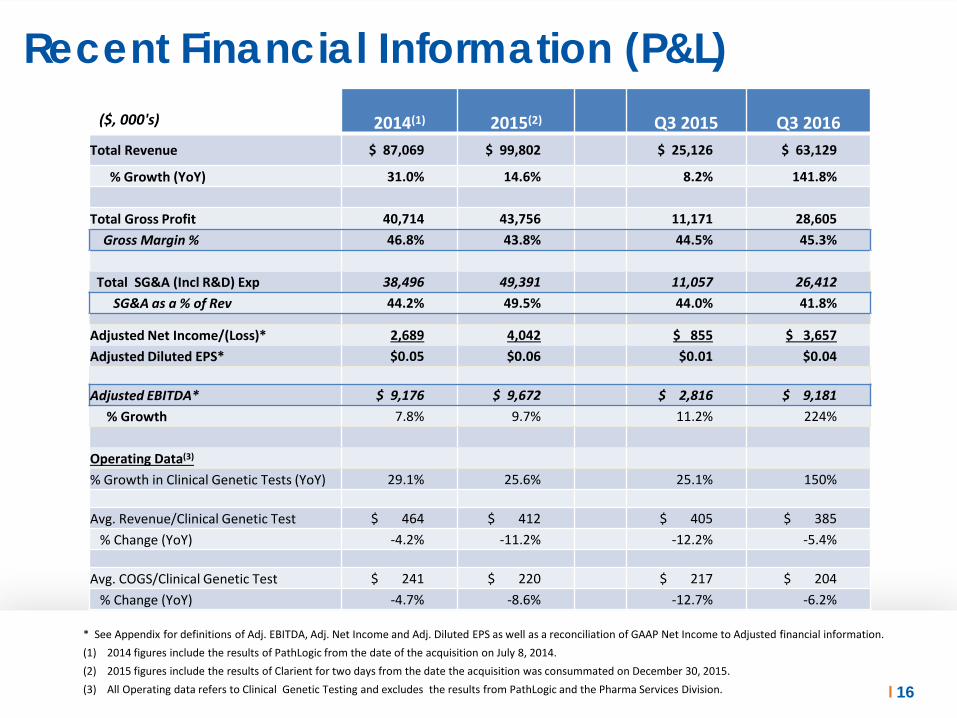
Recent Financial Information (P&L)($, 000's) 2014(1) 2015(2) Q3 2015 Q3 2016
Total Revenue $ 87,069 $ 99,802 $ 25,126 $ 63,129
% Growth (YoY) 31.0% 14.6% 8.2% 141.8%
Total Gross Profit 40,714 43,756 11,171 28,605Gross Margin % 46.8% 43.8% 44.5% 45.3%
Total SG&A (Incl R&D) Exp 38,496 49,391 11,057 26,412 SG&A as a % of Rev 44.2% 49.5% 44.0% 41.8%
Adjusted Net Income/(Loss)* 2,689 4,042 $ 855 $ 3,657Adjusted Diluted EPS* $0.05 $0.06 $0.01 $0.04
Adjusted EBITDA* $ 9,176 $ 9,672 $ 2,816 $ 9,181 % Growth 7.8% 9.7% 11.2% 224%
Operating Data(3)
% Growth in Clinical Genetic Tests (YoY) 29.1% 25.6% 25.1% 150%
Avg. Revenue/Clinical Genetic Test $ 464 $ 412 $ 405 $ 385 % Change (YoY) -4.2% -11.2% -12.2% -5.4%
Avg. COGS/Clinical Genetic Test $ 241 $ 220 $ 217 $ 204% Change (YoY) -4.7% -8.6% -12.7% -6.2%
* See Appendix for definitions of Adj. EBITDA, Adj. Net Income and Adj. Diluted EPS as well as a reconciliation of GAAP Net Income to Adjusted financial information.(1) 2014 figures include the results of PathLogic from the date of the acquisition on July 8, 2014. (2) 2015 figures include the results of Clarient for two days from the date the acquisition was consummated on December 30, 2015.(3) All Operating data refers to Clinical Genetic Testing and excludes the results from PathLogic and the Pharma Services Division.

Building One Growth-Driven Company l 17Confidential 17
NEO’s Acquisition Strategy
NEO Focus – Upper right hand quadrant
Synergistic Deals
High
HighLow Market Growth
Tech
nolo
gies
Clarient Attributes
Technology leader
High growth (clinical trials)
Revenue scale
Nationwide presence
Complementary footprint
Geographic proximity
Ongoing GE affiliation
NextGen SeqDigital
Companion DxPathology
OncologyFISH Clinical Trials
Flow
Cytogenetics
TraditionalAnatomic Path.
BioInformatics
Building One Growth-Driven Company l 18
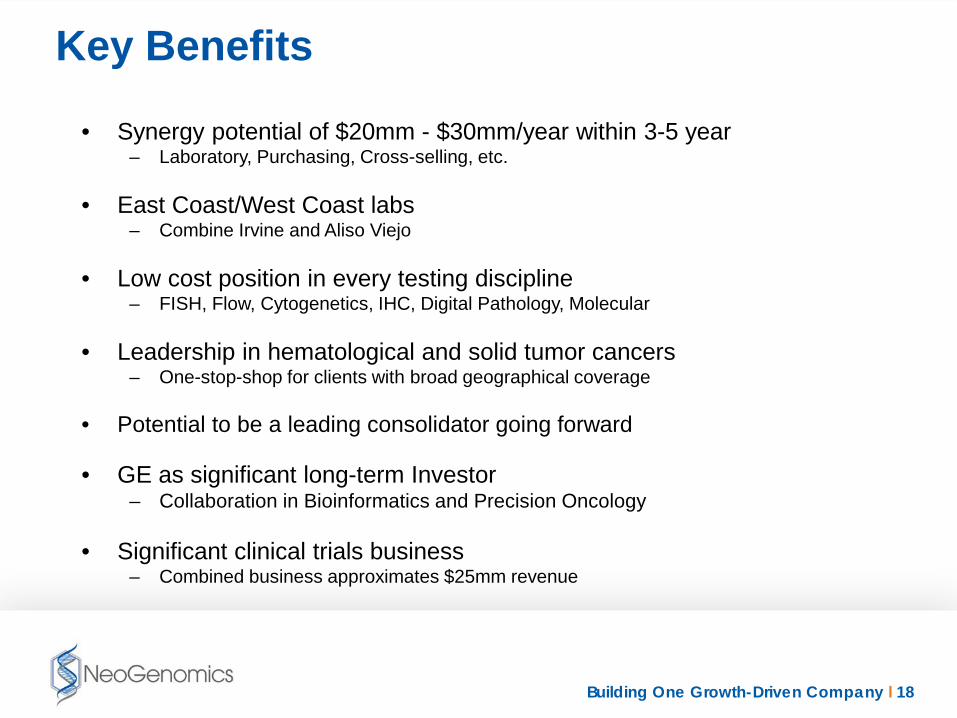
Key Benefits
• Synergy potential of $20mm - $30mm/year within 3-5 year– Laboratory, Purchasing, Cross-selling, etc.
• East Coast/West Coast labs– Combine Irvine and Aliso Viejo
• Low cost position in every testing discipline– FISH, Flow, Cytogenetics, IHC, Digital Pathology, Molecular
• Leadership in hematological and solid tumor cancers– One-stop-shop for clients with broad geographical coverage
• Potential to be a leading consolidator going forward
• GE as significant long-term Investor– Collaboration in Bioinformatics and Precision Oncology
• Significant clinical trials business– Combined business approximates $25mm revenue
Building One Growth-Driven Company l 19Confidential
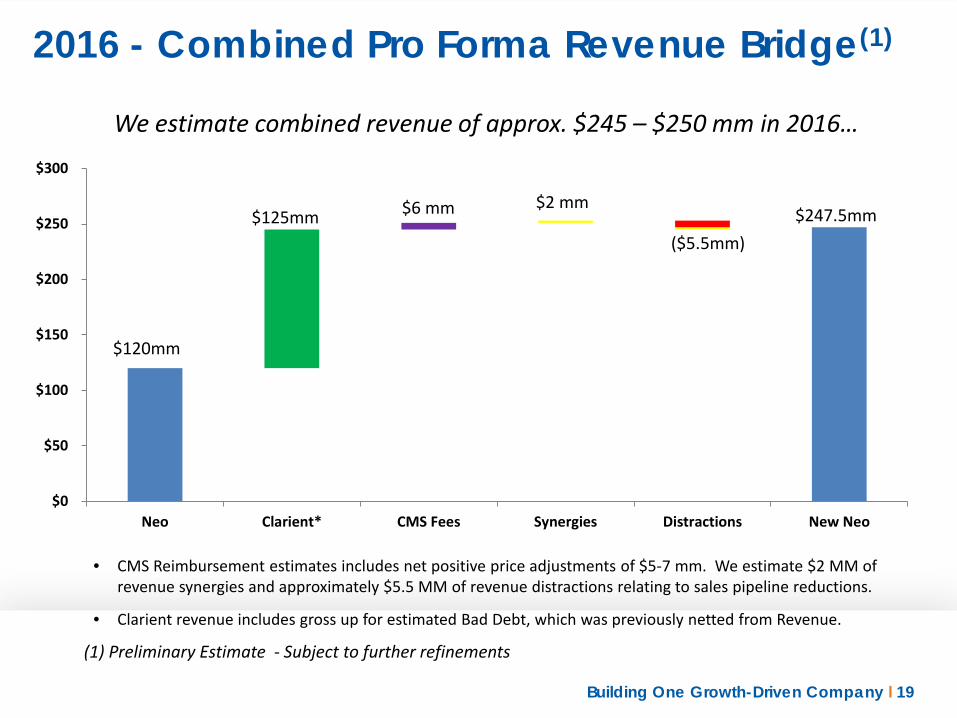
2016 - Combined Pro Forma Revenue Bridge(1)
(1) Preliminary Estimate - Subject to further refinements
We estimate combined revenue of approx. $245 – $250 mm in 2016…
• CMS Reimbursement estimates includes net positive price adjustments of $5-7 mm. We estimate $2 MM of revenue synergies and approximately $5.5 MM of revenue distractions relating to sales pipeline reductions.
• Clarient revenue includes gross up for estimated Bad Debt, which was previously netted from Revenue.
$0
$50
$100
$150
$200
$250
$300
Neo Clarient* CMS Fees Synergies Distractions New Neo
$120mm
$125mm $6 mm $2 mm
($5.5mm)$247.5mm

Building One Growth-Driven Company l 20Confidential 20
2016 Pro Forma Adjusted EBITDA Bridge (1)
• NEO expects to realize $20-30 MM of total synergies in the next 3 years with approximately 75% of such synergies being cost synergies as a result of efficiencies gained through the combination with Clarient.
• 2016 Adjusted EBITDA assumes $6 MM of Cost Synergies.
• 2016 Adjusted EBITDA estimates a $2.5mm reduction to Adjusted EBITDA as a result of revenue distractions (50% of revenue distractions) expected during the integration.
(1) Preliminary Estimate – Subject to further refinements
We estimate combined Adj. EBITDA of approx. $36 – $38 mm in 2016…
$0
$5
$10
$15
$20
$25
$30
$35
$40
$45
Neo Clarient CMS Fees Synergies Distraction New Neo
$18.5 mm
$9 mm
$6 mm
$6mm
($2.5mm)
$37 mm

Building One Growth-Driven Company l 21
Current 2016 Guidance*• Revenue: $245 - $250 MM
• Adjusted EBITDA* 36 - 38 MM
• Adjusted Net Income* 13 - 15 MM
• Adjusted Diluted EPS* $0.14 - $0.16* See Appendix for definitions of Adjusted EBITDA, Adjusted Net Income and Adjusted Diluted EPS as well as a reconciliation of GAAP Net Income to Adj. EBITDA, Adj. Net Income and Adj. Diluted EPS.
2016 net income available to common stockholders calculated in accordance with GAAP will be impacted by certain non-cash charges, including: (i) expenses related to variable stock-based compensation, (ii) approximately $7.3 million of expense related to the amortization of customers lists and other intangibles from the Path Logic and Clarient acquisitions, (iii) approximately $7.4 million of deemed preferred stock dividends, and (iv) approximately $14.9 million of related to the amortization of the beneficial conversion feature related to the preferred stock issued in connection with the Clarient acquisition. These non-cash charges have been included in GAAP net income (loss) available to common shareholders and GAAP net income (loss) per share; however, they have been removedfrom Adjusted Net Income and Adjusted Diluted Net Income per Share. As a result, the Company expects 2016 diluted net loss per share calculated in accordance with GAAP to be $0.42 - $0.44 per share lower than 2016 Adjusted Diluted Net Income per Share. NeoGenomics believes that Adjusted EBITDA, Adjusted Net Income and Adjusted Diluted EPS provide a more consistent measurement ofoperating performance and trends across reporting periods by excluding from income those cash and non-cash items of expense (income) not directly related to ongoing operations. Adjusted figures also assists investors in performing analysis that is consistent with financial models developed by research analysts. Investors should consider non-GAAP results together with GAAP results in analyzing NeoGenomics financial performance.
Building One Growth-Driven Company l 22
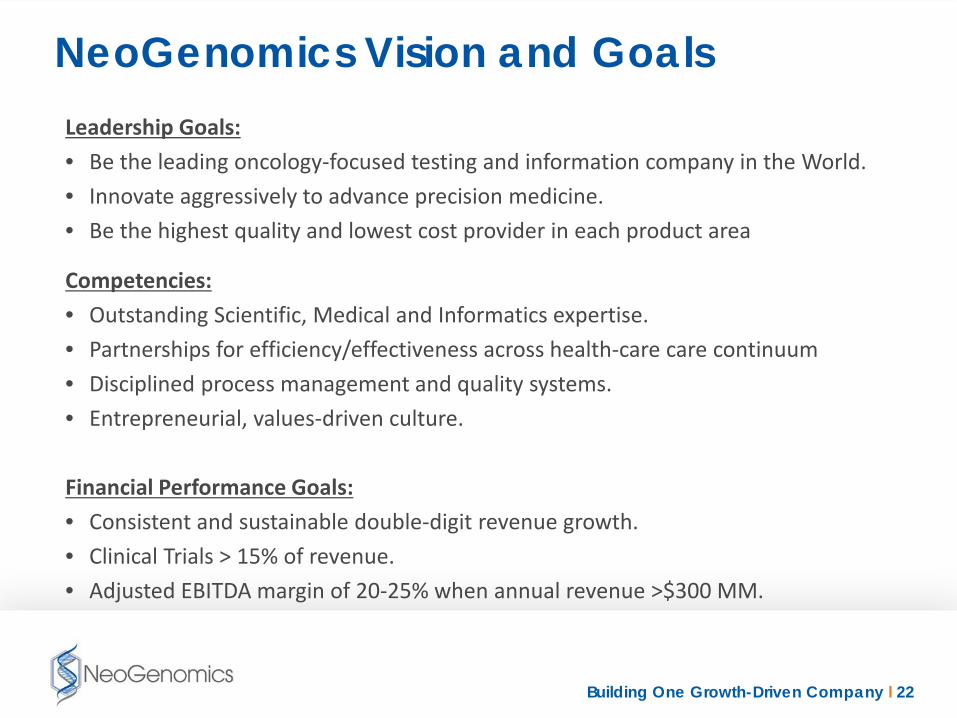
NeoGenomics Vision and GoalsLeadership Goals:• Be the leading oncology-focused testing and information company in the World.• Innovate aggressively to advance precision medicine.• Be the highest quality and lowest cost provider in each product area
Competencies:• Outstanding Scientific, Medical and Informatics expertise.• Partnerships for efficiency/effectiveness across health-care care continuum • Disciplined process management and quality systems.• Entrepreneurial, values-driven culture.
Financial Performance Goals:• Consistent and sustainable double-digit revenue growth.• Clinical Trials > 15% of revenue.• Adjusted EBITDA margin of 20-25% when annual revenue >$300 MM.
Building One Growth-Driven Company l 23
Appendix
Building One Growth-Driven Company l 24
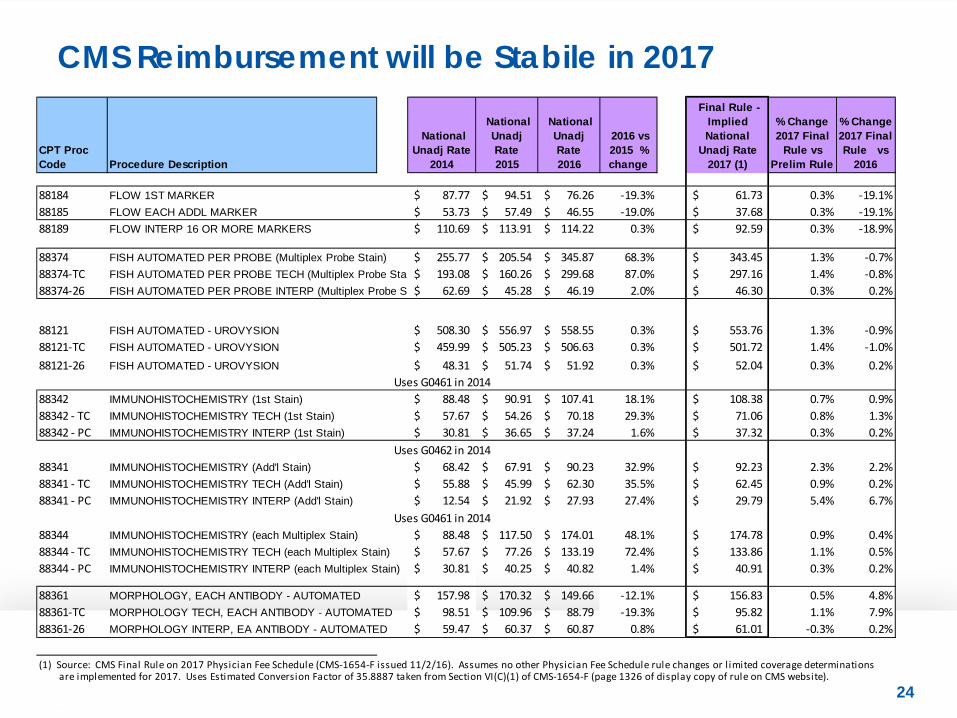
CMS Reimbursement will be Stabile in 2017
CPT Proc Code Procedure Description
National Unadj Rate
2014
National Unadj Rate 2015
National Unadj Rate 2016
2016 vs 2015 % change
Final Rule - Implied National
Unadj Rate 2017 (1)
% Change 2017 Final
Rule vs Prelim Rule
% Change 2017 Final Rule vs
2016
88184 FLOW 1ST MARKER 87.77$ 94.51$ 76.26$ -19.3% 61.73$ 0.3% -19.1%88185 FLOW EACH ADDL MARKER 53.73$ 57.49$ 46.55$ -19.0% 37.68$ 0.3% -19.1%88189 FLOW INTERP 16 OR MORE MARKERS 110.69$ 113.91$ 114.22$ 0.3% 92.59$ 0.3% -18.9%
88374 FISH AUTOMATED PER PROBE (Multiplex Probe Stain) 255.77$ 205.54$ 345.87$ 68.3% 343.45$ 1.3% -0.7%88374-TC FISH AUTOMATED PER PROBE TECH (Multiplex Probe Stai 193.08$ 160.26$ 299.68$ 87.0% 297.16$ 1.4% -0.8%88374-26 FISH AUTOMATED PER PROBE INTERP (Multiplex Probe St 62.69$ 45.28$ 46.19$ 2.0% 46.30$ 0.3% 0.2%
88121 FISH AUTOMATED - UROVYSION 508.30$ 556.97$ 558.55$ 0.3% 553.76$ 1.3% -0.9%88121-TC FISH AUTOMATED - UROVYSION 459.99$ 505.23$ 506.63$ 0.3% 501.72$ 1.4% -1.0%88121-26 FISH AUTOMATED - UROVYSION 48.31$ 51.74$ 51.92$ 0.3% 52.04$ 0.3% 0.2%
Uses G0461 in 201488342 IMMUNOHISTOCHEMISTRY (1st Stain) 88.48$ 90.91$ 107.41$ 18.1% 108.38$ 0.7% 0.9%88342 - TC IMMUNOHISTOCHEMISTRY TECH (1st Stain) 57.67$ 54.26$ 70.18$ 29.3% 71.06$ 0.8% 1.3%88342 - PC IMMUNOHISTOCHEMISTRY INTERP (1st Stain) 30.81$ 36.65$ 37.24$ 1.6% 37.32$ 0.3% 0.2%
Uses G0462 in 201488341 IMMUNOHISTOCHEMISTRY (Add'l Stain) 68.42$ 67.91$ 90.23$ 32.9% 92.23$ 2.3% 2.2%88341 - TC IMMUNOHISTOCHEMISTRY TECH (Add'l Stain) 55.88$ 45.99$ 62.30$ 35.5% 62.45$ 0.9% 0.2%88341 - PC IMMUNOHISTOCHEMISTRY INTERP (Add'l Stain) 12.54$ 21.92$ 27.93$ 27.4% 29.79$ 5.4% 6.7%
Uses G0461 in 201488344 IMMUNOHISTOCHEMISTRY (each Multiplex Stain) 88.48$ 117.50$ 174.01$ 48.1% 174.78$ 0.9% 0.4%88344 - TC IMMUNOHISTOCHEMISTRY TECH (each Multiplex Stain) 57.67$ 77.26$ 133.19$ 72.4% 133.86$ 1.1% 0.5%88344 - PC IMMUNOHISTOCHEMISTRY INTERP (each Multiplex Stain) 30.81$ 40.25$ 40.82$ 1.4% 40.91$ 0.3% 0.2%
88361 MORPHOLOGY, EACH ANTIBODY - AUTOMATED 157.98$ 170.32$ 149.66$ -12.1% 156.83$ 0.5% 4.8%88361-TC MORPHOLOGY TECH, EACH ANTIBODY - AUTOMATED 98.51$ 109.96$ 88.79$ -19.3% 95.82$ 1.1% 7.9%88361-26 MORPHOLOGY INTERP, EA ANTIBODY - AUTOMATED 59.47$ 60.37$ 60.87$ 0.8% 61.01$ -0.3% 0.2%
(1) Source: CMS Final Rule on 2017 Physician Fee Schedule (CMS-1654-F issued 11/2/16). Assumes no other Physician Fee Schedule rule changes or l imited coverage determinations are implemented for 2017. Uses Estimated Conversion Factor of 35.8887 taken from Section VI(C)(1) of CMS-1654-F (page 1326 of display copy of rule on CMS website).

Building One Growth-Driven Company l 25Confidential
Core business focused on IHC, Flow, FISH, Cytogenetics and Molecular tests
National reach with focus on both independent and hospital pathologists
Consistently strong growth - early development to late stage testing
~ 200 projects in process for >30 customers
Clarient Overview
25
IHC/Digital Pathology: Large and Industry leading capabilities
FISH/ISH: Similar Instrumentation and capabilities
FLOW: Similar instrumentation and capabilities
Molecular: Smaller menu
Cytogenetics: Similar capabilities
Facilities/Infrastructure Customer Mix
Product Lines (1)
78,000 sq. ft. Lab located in Aliso Viejo, CA
Available Capacity due to efficient workflow and processes.
Uses similar equipment and Instrumentation.
Uses similar IT Labs Systems and database structure
24,000 sq. ft. facility located in Houston, TX
IHC42%
FISH/ISH19%
FLOW14%
Molecular15%
Cyto5%
Other5%
(1) Clinical operations only. Percentage of tests Performed.
CLINICAL CUSTOMERS
BIOPHARMA CUSTOMERS and
Other

Building One Growth-Driven Company l 26Confidential
Clarient Test Volume and Average Unit Price
Revenue by Customer Type: Tests
2013 2014 2015 PF 2013 2014 2015Clinical $111.9 $106.5 $93.8 Clinical Revenue $111.9 $106.5 $93.8BioPharma 13.8 20.7 23.0 Tests 297.7 284.7 271.3Total Revenue 125.7 127.2 116.8 AUP(1) $376 $374 $346
Bad Debt Acctng Adj(2) 6.6 6.7 8.2 Bad Debt Acctng Adj(2) 19.8 19.7 26.1 Proforma Rev to NEO $132.3 $133.9 $125.0 Proforma AUP to NEO $396 $394 $372
(1) Average Unit Price is based on revenue from clinical testing (excluding BioPharm tests).(2) Historically, Clarient booked Bad Debt as a reduction to revenue, wheras NEO books it in GA.
$0.0
$20.0
$40.0
$60.0
$80.0
$100.0
$120.0
$140.0
2013 2014 2015 PF
BioPharma
Clinical
0.0
50.0
100.0
150.0
200.0
250.0
300.0
350.0
2013 2014 2015Est
Tests
Building One Growth-Driven Company l 27
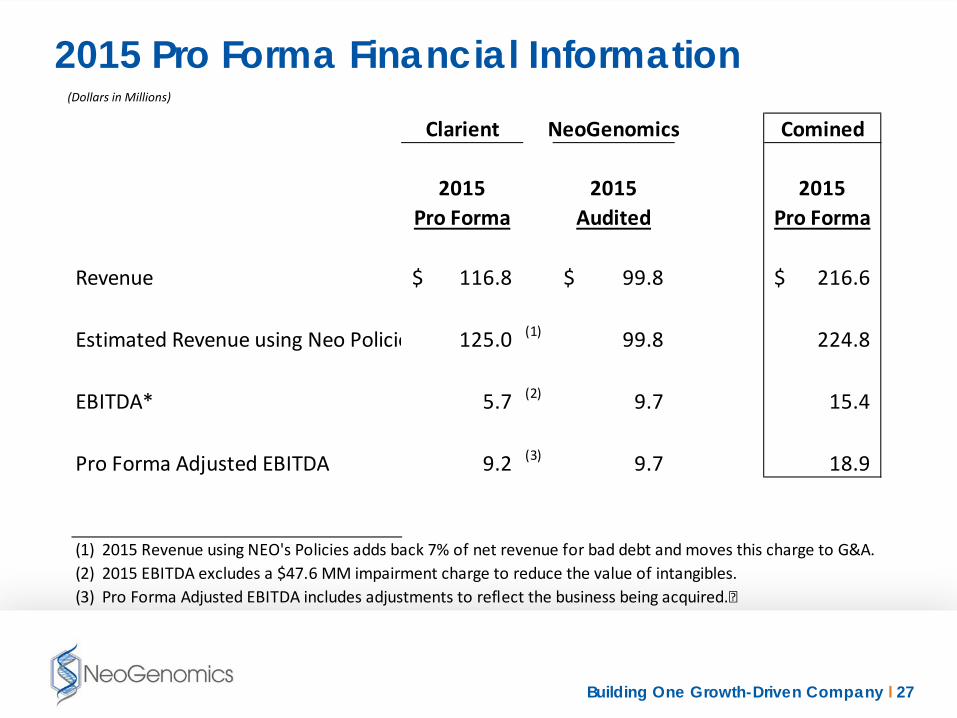
2015 Pro Forma Financial Information(Dollars in Millions)
Clarient NeoGenomics Comined
2015 2015 2015Pro Forma Audited Pro Forma
Revenue 116.8$ 99.8$ 216.6$
Estimated Revenue using Neo Policie 125.0 (1) 99.8 224.8
EBITDA* 5.7 (2) 9.7 15.4
Pro Forma Adjusted EBITDA 9.2 (3) 9.7 18.9
(1) 2015 Revenue using NEO's Policies adds back 7% of net revenue for bad debt and moves this charge to G&A.(2) 2015 EBITDA excludes a $47.6 MM impairment charge to reduce the value of intangibles.(3) Pro Forma Adjusted EBITDA includes adjustments to reflect the business being acquired.

Building One Growth-Driven Company l 28Confidential
Clarient Revenue and Payer Mix in 2014
Payor Mix - 2014 Clinical Only
2014 Payor MixClient 39.6%Insurance 34.4%Government 12.4%HMO 5.3%Patient/Other 8.3%Total 100.0%
Client
Insurance
Government
HMO
Patient/Other
Building One Growth-Driven Company l 29
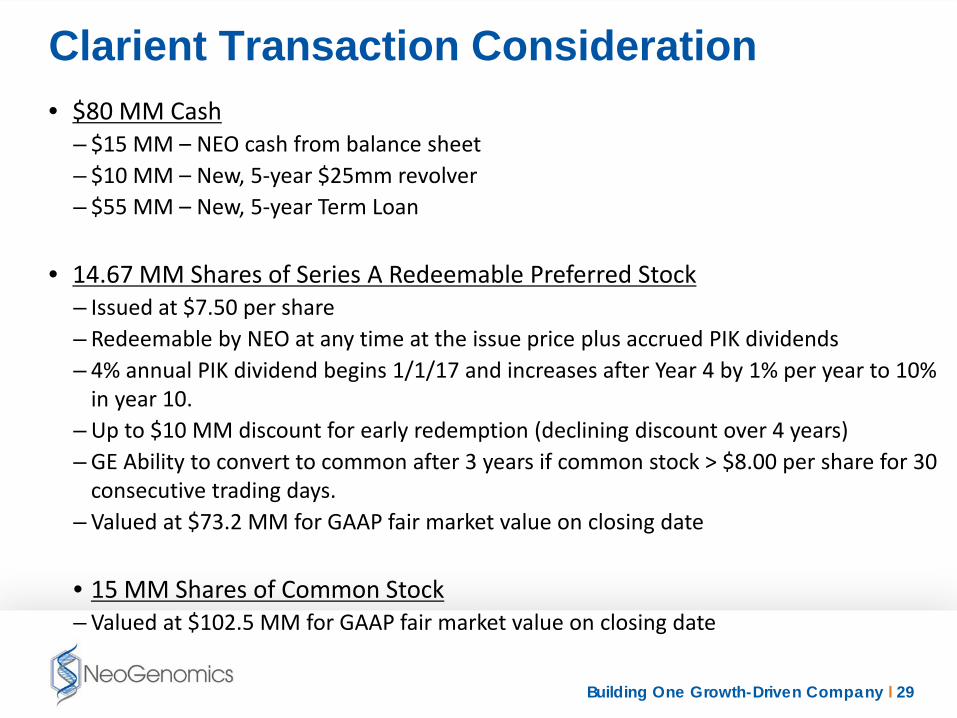
Clarient Transaction Consideration• $80 MM Cash
– $15 MM – NEO cash from balance sheet– $10 MM – New, 5-year $25mm revolver – $55 MM – New, 5-year Term Loan
• 14.67 MM Shares of Series A Redeemable Preferred Stock– Issued at $7.50 per share– Redeemable by NEO at any time at the issue price plus accrued PIK dividends– 4% annual PIK dividend begins 1/1/17 and increases after Year 4 by 1% per year to 10%
in year 10.– Up to $10 MM discount for early redemption (declining discount over 4 years) – GE Ability to convert to common after 3 years if common stock > $8.00 per share for 30
consecutive trading days. – Valued at $73.2 MM for GAAP fair market value on closing date
• 15 MM Shares of Common Stock – Valued at $102.5 MM for GAAP fair market value on closing date

Building One Growth-Driven Company l 30Confidential
Reconciliation of GAAP Net Income to Adjusted EBITDA
“Adjusted EBITDA” is defined by NeoGenomics as net income from continuing operations before: (i) interest expense, (ii) tax expense, (iii) depreciation and amortization expense, (iv) non-cash, stock-based compensation expense, and if applicable in a reporting period (v) acquisition related transaction expenses and other significant non-recurring or non-operating (income) or expenses.
Use of non-GAAP Financial Measures: NeoGenomics believes that using non-GAAP financial measures provides usefulsupplemental information to investors and facilitates the analysis of the company’s core operating results and the comparison ofcore operating results more consistently across reporting periods. Management also uses non-GAAP financial measures for financialand operational decision making, planning and forecasting purposes and to manage the company’s business. These non-GAAPfinancial measures enable investors to evaluate our operating results and future prospects in the same manner as management andresearch analysts. The non-GAAP financial measures do not replace the presentation of GAAP financial results and should only beused as a supplement to and not as a substitute for financial results presented in accordance with GAAP. There are limitationsinherent in non-GAAP financial measures because they exclude charges and credits that are required to be included in a GAAPpresentation, and do not therefore present the full measure of NeoGenomics recorded costs against its net revenue. In addition,non-GAAP financial measures as defined by NeoGenomics may differ from non-GAAP measures used by other companies.
Reconciliation of GAAP Net Income to Non-GAAP EBITDA and Adjusted EBITDA (Unaudited, in thousands)
For the three months ended
September 30, For the nine months ended
September 30, 2016 2015 2016 2015
Net Income (Loss) (per GAAP) $ (67 ) $ (125 ) $ 500 $ (1,062 ) Adjustments to Net Income (Loss):
Interest expense 1,468 239 4,509 623 Income tax expense (6 ) — 500 20 Amortization of intangibles 1,818 93 5,454 283 Depreciation 4,222 1,722 11,550 4,971
EBITDA 7,435 1,929 22,513 4,835 Further Adjustments to EBITDA:
Non-cash stock based compensation 1,686 887 4,024 1,907 Adjusted EBITDA (non-GAAP) $ 9,121 $ 2,816 $ 26,537 $ 6,742
Building One Growth-Driven Company l 31Confidential
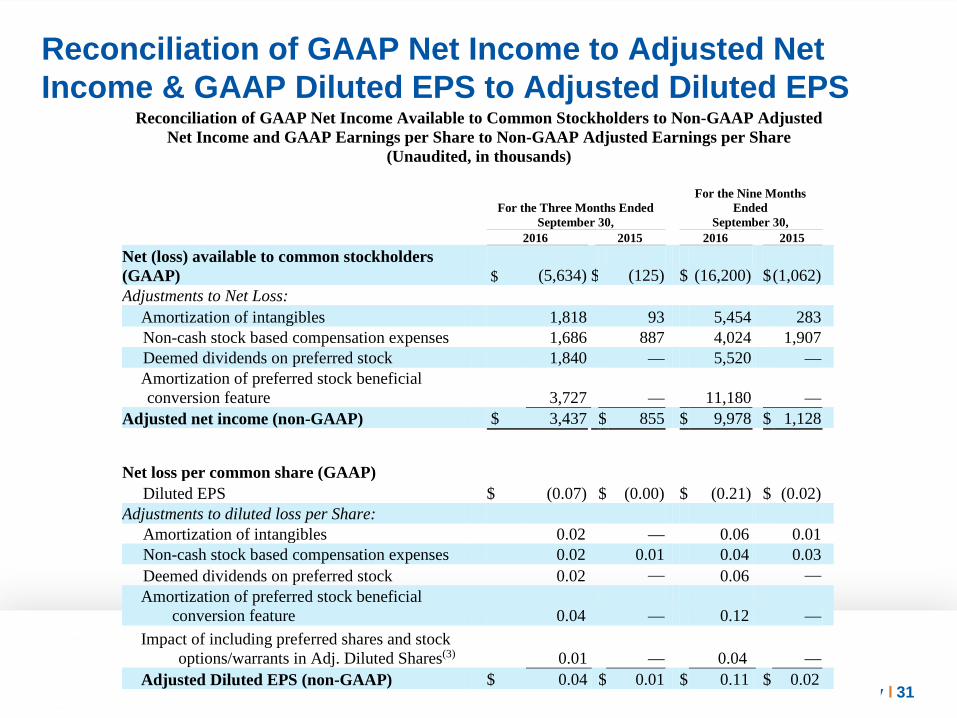
Reconciliation of GAAP Net Income to Adjusted Net Income & GAAP Diluted EPS to Adjusted Diluted EPS
Reconciliation of GAAP Net Income Available to Common Stockholders to Non-GAAP Adjusted Net Income and GAAP Earnings per Share to Non-GAAP Adjusted Earnings per Share
(Unaudited, in thousands)
For the Three Months Ended
September 30,
For the Nine Months Ended
September 30,
2016 2015 2016 2015
Net (loss) available to common stockholders (GAAP) $
(5,634)
$ (125)
$ (16,200) $
(1,062)
Adjustments to Net Loss: Amortization of intangibles 1,818 93 5,454 283
Non-cash stock based compensation expenses 1,686 887 4,024 1,907 Deemed dividends on preferred stock 1,840 — 5,520 —
Amortization of preferred stock beneficial conversion feature 3,727 — 11,180 —
Adjusted net income (non-GAAP) $ 3,437 $ 855 $ 9,978 $ 1,128
Net loss per common share (GAAP) Diluted EPS $ (0.07) $ (0.00) $ (0.21) $ (0.02) Adjustments to diluted loss per Share: Amortization of intangibles 0.02 — 0.06 0.01 Non-cash stock based compensation expenses 0.02 0.01 0.04 0.03 Deemed dividends on preferred stock 0.02 — 0.06 —
Amortization of preferred stock beneficial conversion feature 0.04 — 0.12 —
Impact of including preferred shares and stock options/warrants in Adj. Diluted Shares(3) 0.01 — 0.04 —
Adjusted Diluted EPS (non-GAAP) $ 0.04 $ 0.01 $ 0.11 $ 0.02

Building One Growth-Driven Company l 32Confidential
“Adjusted Net Income” is defined by NeoGenomics as net income available to common shareholders from continuing operations plus:(i) non-cash amortization of customer lists and other intangible assets, (ii) non-cash, stock-based compensation expense, (iii) non-cashdeemed dividends on preferred stock, (iv) non-cash amortization of preferred stock beneficial conversion feature, and if applicable in areporting period (v) acquisition related transaction expenses and other significant non-recurring or non-operating (income) orexpenses.
“Adjusted EPS” is calculated using Adjusted Basic Shares and Adjusted Diluted Shares outstanding. Adjusted Basic Shares and AdjustedDiluted Shares include the weighted average number of common shares that would be outstanding if the preferred stock wereconverted into common stock on the original issue date based on the number of days such common shares would have beenoutstanding in the reporting period. In addition, If GAAP Net Income is negative and Adjusted Net Income is positive, Adjusted DilutedShares will also include any options or warrants that would be outstanding as dilutive instruments using the treasury stock method.
Reconciliation of GAAP Net Income to Adjusted Figures
Weighted average shares used in computation of adjusted diluted earnings per share: Diluted Common Shares (GAAP) 78,145 60,537 77,224 60,4
Options and warrants not included in GAAP Diluted Shares (using treasury stock method) 2,052 3,344 1,685 2,80
Weighted Avg. Preferred Shares (as converted) 14,667 — 14,667 —
Adjusted Diluted Shares outstanding (non-GAAP) 94,864 63,881 93,576 63,2