Embed Size (px)
Citation preview

VTA Next Network:Your Transit Choices
Agenda Item #7.1

About Jarrett Walker + Assoc
• Stanford PhD, Caltrain Advocate in the 80s.
• 22 Years Experience in Transit Network Design.
• >50 metro areas in 9 countries.• Author Human Transit.• Long track record as transit
explainer. HumanTransit.org• Successful designs in many cities
including San Antonio, Auckland, Minneapolis, LA Suburbs
• Houston redesign implemented August 2015
2

Outline
• Where We Are Now
• What High Ridership Transit Looks Like
• The Ridership-Coverage Tradeoff
• Options for the Summer 2017 Network (BART opening)
3

Timeline
March 2016 Choices Report Released
April 7, 2016 Alternative Network Concepts Released
April 14, 2016 Report on Alternative Concepts
May‐Aug 2016 Outreach on Alternative Concepts
Aug‐Oct 2016 Board Direction on Alternative Concepts
Dec. 2016 Recommended Draft '17 Network Released
Jan‐Feb 2017 Outreach on Draft Plan
March 2017 Final Recommended Plan Prepared
April 2017 Board Adopts Final Plan
Summer 2017 Next Network Service Begins
Fall 2017 BART Service Begins
4

Where We Are Now
5
Falling Behind Population Growth
Figure 1: Sant a Clara Count y populat ion, VTA Ridership and Revenue Hours, cumulat ive change 2000 - 2013
6

Understanding Farebox RecoveryFarebox Recovery (Fare Revenue / Operating Cost) has three big elements
• From Cost to Service. (Operating Cost / Service Hour)– Labor contract, management, overhead
• From Service to Ridership (Riders / Service Hour)– Network Design, Customer Experience, Etc.
• From Ridership to Fare Revenue (Average Fare)– Fare policy, fare enforcement, etc.
Focus of this project.
7

Why Focus on Local Bus?
Bus (Non-Express) 63%
Bus (Express) 4%
Light Rail 23%
ADA Paratransit 5%
Caltrain 2%
Special Events 1% ACE
1% Other 1%
VTA Operating Expenses by Mode, FY15
8

The Ridership Recipe
IFyou want higher ridership, higher farebox return …
9

How Ridership Happens
• By “ridership” we always mean “productivity,” riders per unit of service cost. This tracks with farebox recovery.
• Transit outcomes arise from “three legged stool”:– Service– Land Use– Street Design
• VTA controls only one leg!
10

The Ridership Recipe
• High All-Day Frequency …• … following patterns of ...
– Density– Walkability– Linearity– Proximity
Why? Because this is how you bring the most useful destinations within reasonable travel time of the most people.
11

Why Frequency Matters
Speed and reliability matter too, but frequency is the most neglected element. Frequency is a “cubed” benefit:
• Go when you want to go. • Make connections easily, so that you can get to more
places.• Less risk of being stranded by a reliability problem.
For trips <5 mi or so, frequency is the dominant element of travel time.
12

Top performers are frequent …
Higher FREQUENCY
High
PRO
DUCT
IVITY (Riders / O
p. Cost)
13

Current All-day Frequency
14

Current Ridership
15

Why All-Day Matters• VTA ridership is not very peaked.• VTA service is more crowded midday than peak.• Lower income people, and people in dense urban centers,
rely mostly on all-day service.
‐‐‐1
0
0%
‐‐‐8
0
%
‐‐‐6
0
%
‐‐‐4
0
%
‐‐‐2
0
%
0%
20%
40%
60%
80%
100%
12:00 AM
1:00 AM
2:00 AM
3:00 AM
4:00 AM
5:00 AM
6:00 AM
7:00 AM
8:00 AM
9:00 AM
10:00 AM
11:00 AM
12:00 PM
1:00 PM
2:00 PM
3:00 PM
4:00 PM
5:00 PM
6:00 PM
7:00 PM
8:00 PM
9:00 PM
10:00 PM
11:00 PM
Hou
r com
pared t
o av
rage
of
al
l hor
s
Mismatch b
e
twe en se
r
vice qua
n
9t y
a n
d ridership b
y
ho ur of day
Ridership (Boardings)
Service Q
u
an9t y (Bus Tr ips )
16

Limits of VTA Peak-Only Service
• Adding service only during rush hour creates three added costs for VTA.– Cost to own/store/maintain fleet that is used rarely.– Cost of very short shifts, esp. without part time drivers.– Costs of one-way operation: all vehicles have to come back.
17

Land Use Drivers of Ridership
• Density• Walkability• Linearity• Proximity
18

Density How many people are going to and from the area around each stop?
High Ridership
Lower Ridership
19

Walkability Can the people around the stop walk to the stop?
High Ridership
Lower Ridership
20

Linearity
High Ridership
Lower Ridership
Can transit run in straight lines that are useful to through-riders?
21

Proximity
High Ridership
Lower Ridership
Does transit have to cross long low-ridership gaps?
22

But is Ridership What You Want?The Ridership-Coverage Tradeoff
23

The Ridership-Coverage Tradeoff
• Maximizing Ridership (and farebox return) requires thinking like a business.
• Businesses choose which markets to enter, based on where their product can succeed.
• This is not the same as meeting people’s needs or expectations.
24

How should a transit agency allocate its resources?
Fictional Urban Area
Dots = residents and jobs
You have 18 buses
25

Ridership Goal “Maximum Ridership”
Performance Measure: Productivity
Ridership relative to cost
RidershipNetwork
Think like a business, choosing which markets you will enter.
The straight lines offer density, walkability, and an efficient transit path, so you focus frequent, attractive service there.
Frequency’s payoff is “cubed”
26

Coverage Goal “Some service for everyone”
Performance Measure: Availability
% of population and jobs near some service
Coverage Network
Think like a government service. Try to serve everyone, even those in expensive-to-serve places.
The result is more routes covering everyone, but less frequency, more complexity, and lower ridership.
27

Both goals are important, … but they lead opposite directions!
Ridership Goal• “Think like a business.” • Focus where ridership
potential is highest.• Support dense and
walkable development.• Max. competition with cars• Maximum VMT reduction
Coverage Goal• “Think like a gov’t service.”• “Access for all”• Support suburban low-density
development.• Lifeline access for everyone.• Service to every member city
or electoral district.
28
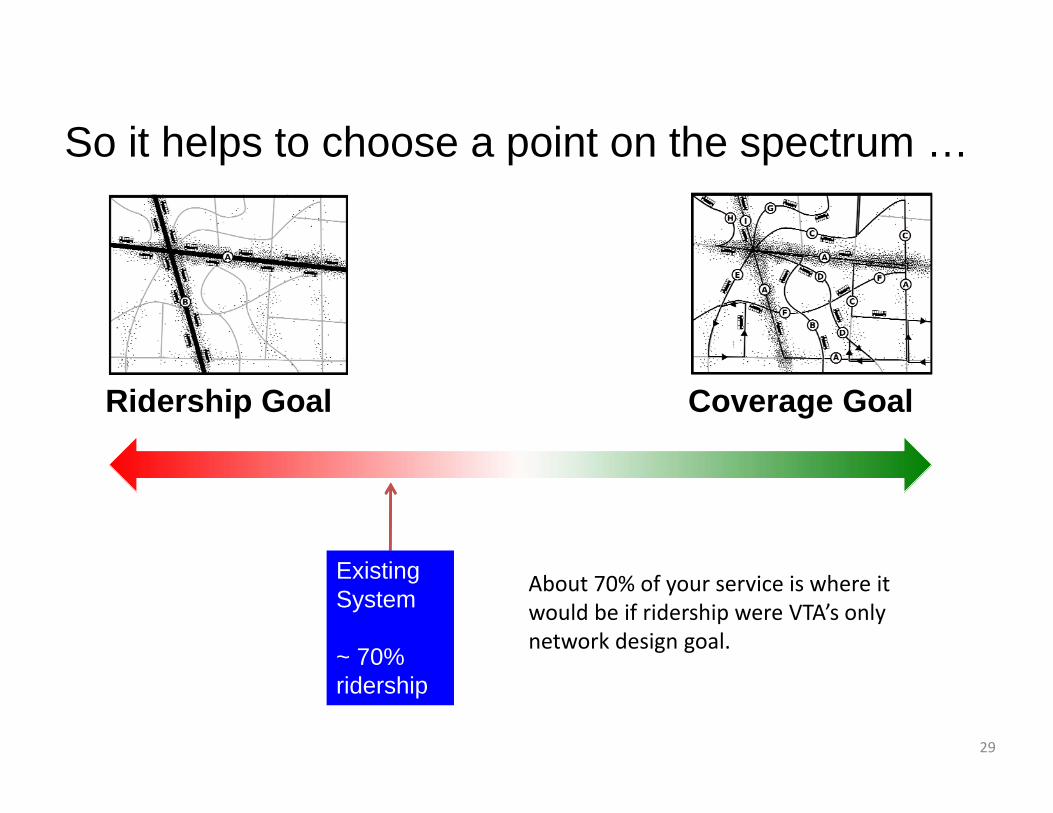
So it helps to choose a point on the spectrum …
Ridership Goal Coverage Goal
Existing System
~ 70% ridership
About 70% of your service is where it would be if ridership were VTA’s only network design goal.
29

3 Alternative Concepts for ‘1770% Ridership? 80%? 90%?
30

So it helps to choose a point on the spectrum …
Ridership Goal Coverage Goal
Con
cept
70
How much should VTA focus on ridership? 70%? 80% 90%?
Con
cept
80
Con
cept
90
31

All Concepts Integrate with BART• All Fremont express lines are replaced by local
connections to BART at Milpitas and Berryessa.• Direct service from BART to:
– Most of inner and eastside San Jose.– San Jose Mineta Airport– Tasman LRT corridor: Great America, Lockheed area, Mtn View– Montague / Scott / Arques corridor: Jobsites in Santa Clara,
Sunnyvale, and Mtn View.– North 1st LRT to northern San Jose jobsites.– Winchester corridor: Santa Clara, Santana Row, Campbell.– Stevens Creek corridor to Cupertino.
32

Not Shown but Still There
• VTA Express Network (100s) except lines to Fremont.• VTA Limited (300s) except where fully replaced by new
rapid-stop service. • Caltrain shuttles• ACE shuttles• FLEX service.
33

Please Learn 4 Colors
These will be used consistently throughout the project.
Rapid. Every 15 min or better and widely spaced stops.Every 15 minutes.
Every 30 minutes.
Every 60 minutes.
Frequent Network
34

Concept 70 (70% Ridership, 30% Coverage)
35

Concept 80 (80% Ridership, 20% Coverage)
36

Concept 90 (90% Ridership, 10% Coverage)
37
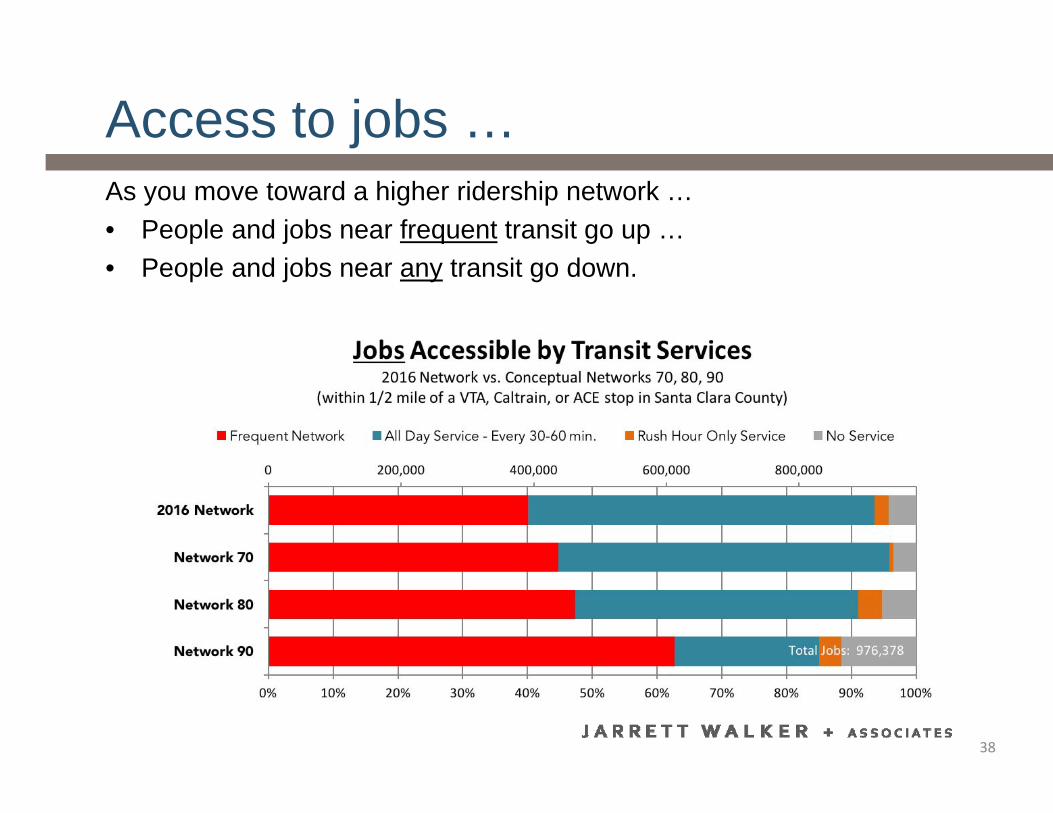
Access to jobs …As you move toward a higher ridership network …• People and jobs near frequent transit go up …• People and jobs near any transit go down.
38

Access by residents …As you move toward a higher ridership network …• People and jobs near frequent transit go up …• People and jobs near any transit go down.
39
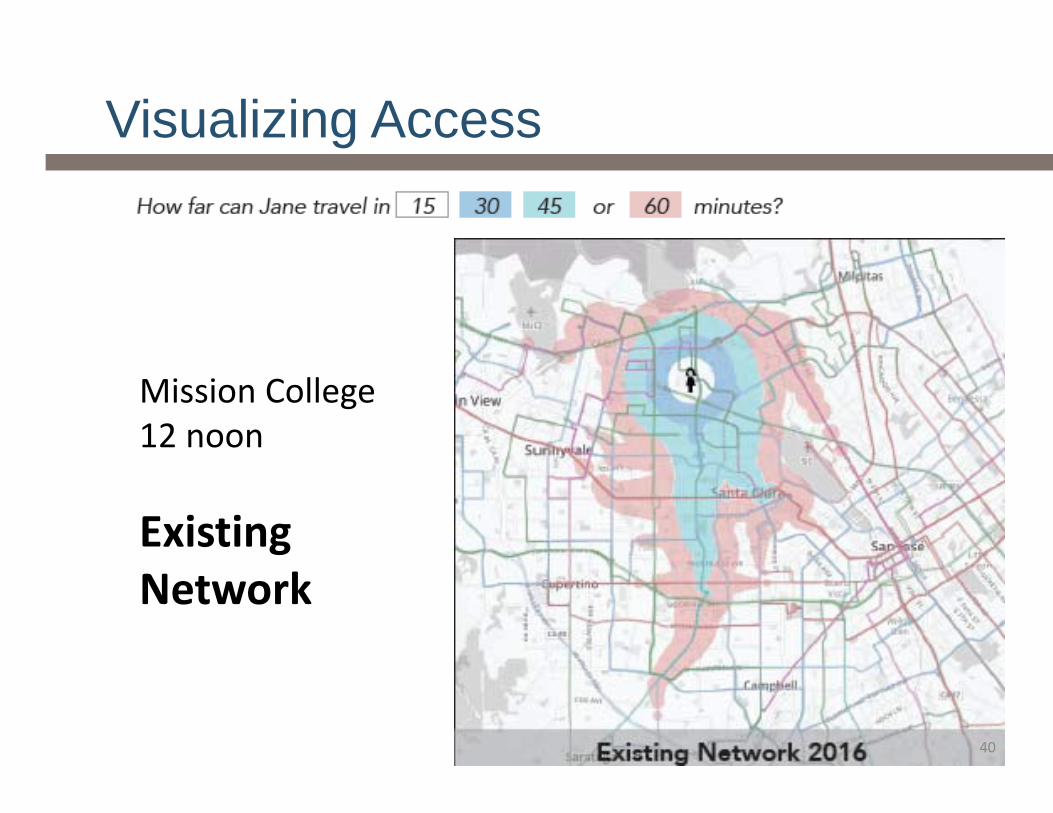
Visualizing Access
Mission College12 noon
Existing Network
40

Visualizing Access
Mission College12 noon
Concept 70
(70% ridership)
41

Visualizing Access
Mission College12 noon
Concept 80
(80% ridership)
42

Visualizing Access
Mission College12 noon
Concept 90
(90% ridership)
43

So How Many People Is That?
44
Cautions
• These are not proposals!• They are illustrations of a policy choice.• They are starting points for defining the final network.• View these at high altitude. Not all micro details are
meaningful yet.• Public reaction to these concepts will help you decide
where you want to be on the ridership-coverage spectrum.
45

Outreach
46

Timeline
March 2016 Choices Report Released
April 7, 2016 Alternative Network Concepts Released
April 14, 2016 Report on Alternative Concepts
May‐Aug 2016 Outreach on Alternative Concepts
Aug‐Oct 2016 Board Direction on Alternative Concepts
Dec. 2016 Recommended Draft '17 Network Released
Jan‐Feb 2017 Outreach on Draft Plan
March 2017 Final Recommended Plan Prepared
April 2017 Board Adopts Final Plan
Summer 2017 Next Network Service Begins
Fall 2017 BART Service Begins
47

Discussion
48